Burnsville, WV Map & Demographics
Burnsville Map
Burnsville Overview
$29,266
PER CAPITA INCOME
$86,083
AVG FAMILY INCOME
$71,250
AVG HOUSEHOLD INCOME
0.29
INEQUALITY / GINI INDEX
509
TOTAL POPULATION
296
MALE POPULATION
213
FEMALE POPULATION
138.97
MALES / 100 FEMALES
71.96
FEMALES / 100 MALES
35.7
MEDIAN AGE
2.9
AVG FAMILY SIZE
2.4
AVG HOUSEHOLD SIZE
219
LABOR FORCE [ PEOPLE ]
59.2%
PERCENT IN LABOR FORCE
11.0%
UNEMPLOYMENT RATE
Burnsville Zip Codes
Burnsville Area Codes
Income in Burnsville
Income Overview in Burnsville
Per Capita Income in Burnsville is $29,266, while median incomes of families and households are $86,083 and $71,250 respectively.
| Characteristic | Number | Measure |
| Per Capita Income | 509 | $29,266 |
| Median Family Income | 151 | $86,083 |
| Mean Family Income | 151 | $81,593 |
| Median Household Income | 214 | $71,250 |
| Mean Household Income | 214 | $70,372 |
| Income Deficit | 151 | $0 |
| Wage / Income Gap (%) | 509 | 0.00% |
| Wage / Income Gap ($) | 509 | 100.00¢ per $1 |
| Gini / Inequality Index | 509 | 0.29 |
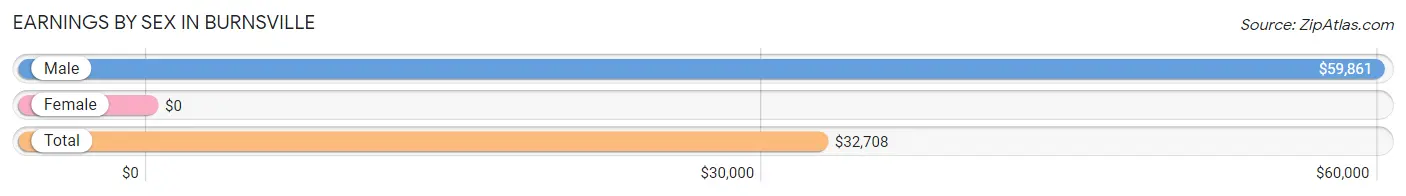
Earnings by Sex in Burnsville
| Sex | Number | Average Earnings |
| Male | 103 (48.8%) | $59,861 |
| Female | 108 (51.2%) | $0 |
| Total | 211 (100.0%) | $32,708 |
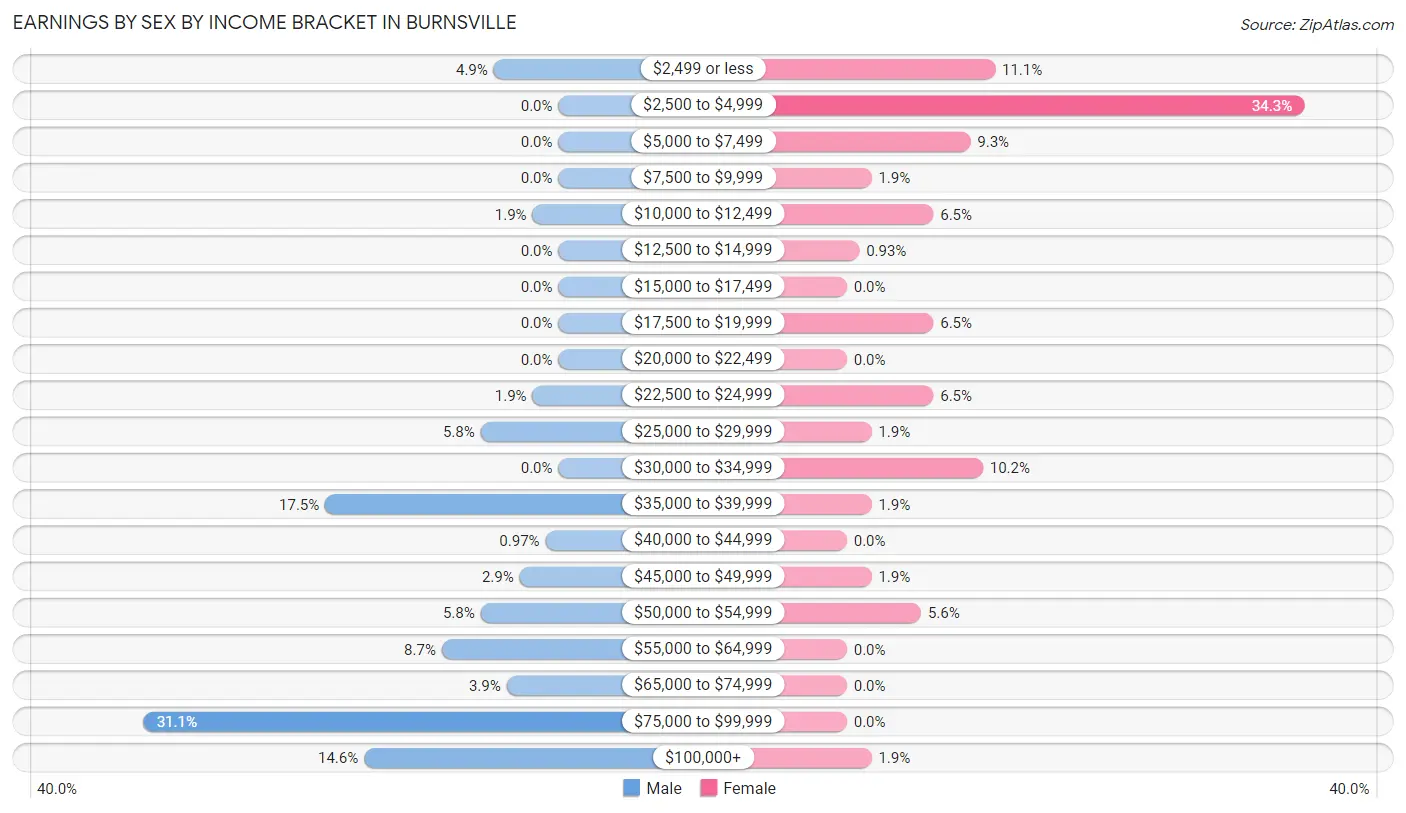
Earnings by Sex by Income Bracket in Burnsville
The most common earnings brackets in Burnsville are $75,000 to $99,999 for men (32 | 31.1%) and $2,500 to $4,999 for women (37 | 34.3%).
| Income | Male | Female |
| $2,499 or less | 5 (4.9%) | 12 (11.1%) |
| $2,500 to $4,999 | 0 (0.0%) | 37 (34.3%) |
| $5,000 to $7,499 | 0 (0.0%) | 10 (9.3%) |
| $7,500 to $9,999 | 0 (0.0%) | 2 (1.8%) |
| $10,000 to $12,499 | 2 (1.9%) | 7 (6.5%) |
| $12,500 to $14,999 | 0 (0.0%) | 1 (0.9%) |
| $15,000 to $17,499 | 0 (0.0%) | 0 (0.0%) |
| $17,500 to $19,999 | 0 (0.0%) | 7 (6.5%) |
| $20,000 to $22,499 | 0 (0.0%) | 0 (0.0%) |
| $22,500 to $24,999 | 2 (1.9%) | 7 (6.5%) |
| $25,000 to $29,999 | 6 (5.8%) | 2 (1.8%) |
| $30,000 to $34,999 | 0 (0.0%) | 11 (10.2%) |
| $35,000 to $39,999 | 18 (17.5%) | 2 (1.8%) |
| $40,000 to $44,999 | 1 (1.0%) | 0 (0.0%) |
| $45,000 to $49,999 | 3 (2.9%) | 2 (1.8%) |
| $50,000 to $54,999 | 6 (5.8%) | 6 (5.6%) |
| $55,000 to $64,999 | 9 (8.7%) | 0 (0.0%) |
| $65,000 to $74,999 | 4 (3.9%) | 0 (0.0%) |
| $75,000 to $99,999 | 32 (31.1%) | 0 (0.0%) |
| $100,000+ | 15 (14.6%) | 2 (1.8%) |
| Total | 103 (100.0%) | 108 (100.0%) |
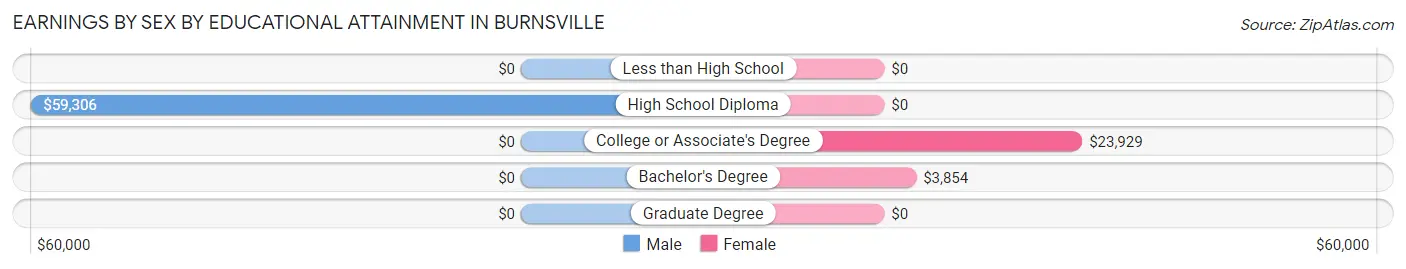
Earnings by Sex by Educational Attainment in Burnsville
| Educational Attainment | Male Income | Female Income |
| Less than High School | - | - |
| High School Diploma | $59,306 | $0 |
| College or Associate's Degree | - | - |
| Bachelor's Degree | - | - |
| Graduate Degree | - | - |
| Total | $68,125 | $0 |
Family Income in Burnsville
Family Income Brackets in Burnsville
According to the Burnsville family income data, there are 58 families falling into the $100,000 to $149,999 income range, which is the most common income bracket and makes up 38.4% of all families.
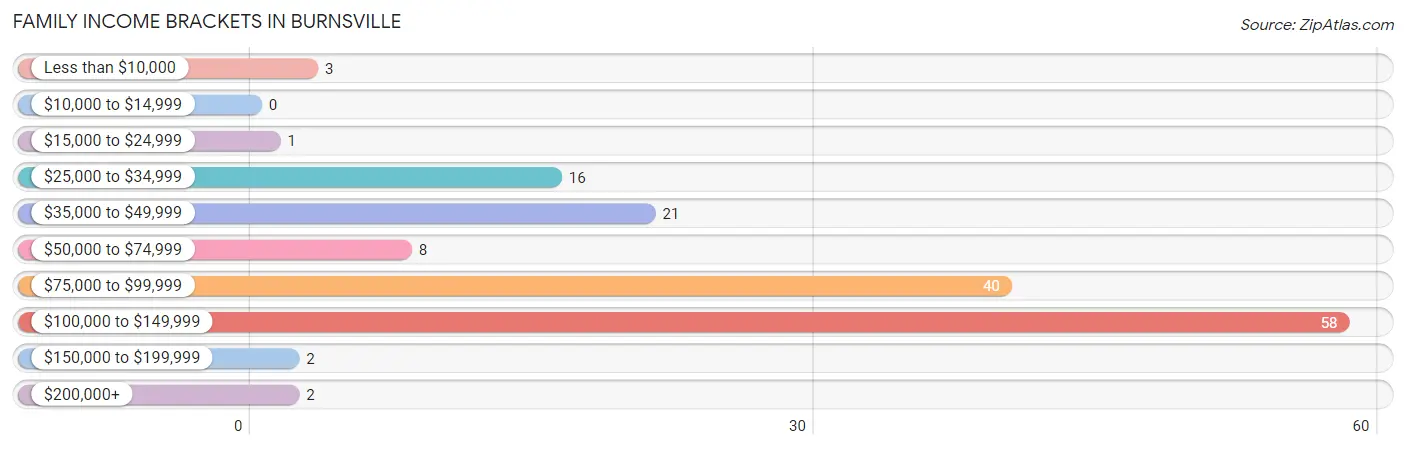
| Income Bracket | # Families | % Families |
| Less than $10,000 | 3 | 2.0% |
| $10,000 to $14,999 | 0 | 0.0% |
| $15,000 to $24,999 | 1 | 0.7% |
| $25,000 to $34,999 | 16 | 10.6% |
| $35,000 to $49,999 | 21 | 13.9% |
| $50,000 to $74,999 | 8 | 5.3% |
| $75,000 to $99,999 | 40 | 26.5% |
| $100,000 to $149,999 | 58 | 38.4% |
| $150,000 to $199,999 | 2 | 1.3% |
| $200,000+ | 2 | 1.3% |
Family Income by Famaliy Size in Burnsville
2-person families (66 | 43.7%) account for the highest median family income in Burnsville with $103,403 per family, while 2-person families (66 | 43.7%) have the highest median income of $51,702 per family member.
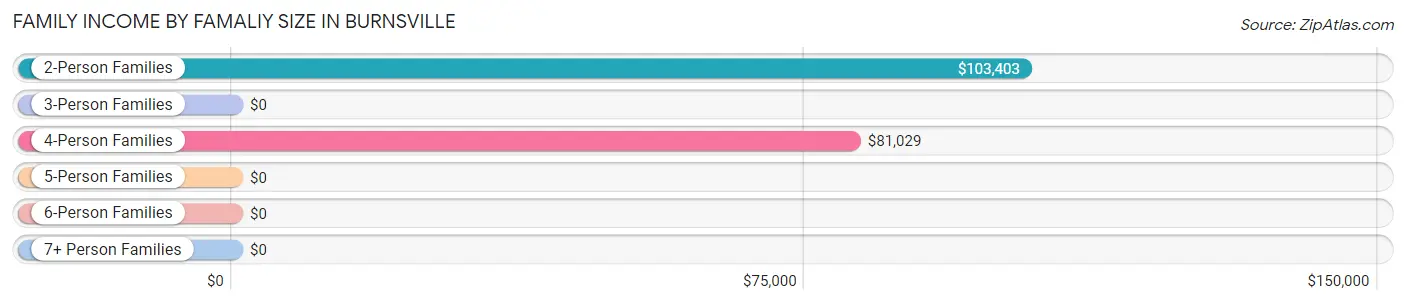
| Income Bracket | # Families | Median Income |
| 2-Person Families | 66 (43.7%) | $103,403 |
| 3-Person Families | 26 (17.2%) | $0 |
| 4-Person Families | 34 (22.5%) | $81,029 |
| 5-Person Families | 15 (9.9%) | $0 |
| 6-Person Families | 10 (6.6%) | $0 |
| 7+ Person Families | 0 (0.0%) | $0 |
| Total | 151 (100.0%) | $86,083 |
Family Income by Number of Earners in Burnsville
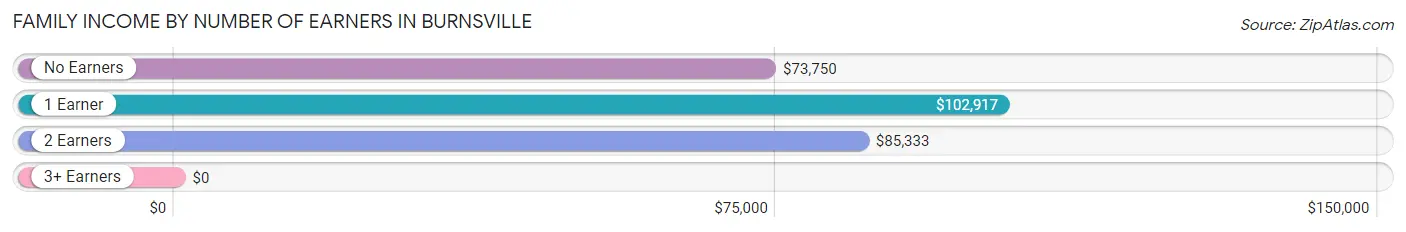
| Number of Earners | # Families | Median Income |
| No Earners | 10 (6.6%) | $73,750 |
| 1 Earner | 94 (62.3%) | $102,917 |
| 2 Earners | 44 (29.1%) | $85,333 |
| 3+ Earners | 3 (2.0%) | $0 |
| Total | 151 (100.0%) | $86,083 |
Household Income in Burnsville
Household Income Brackets in Burnsville
With 62 households falling in the category, the $100,000 to $149,999 income range is the most frequent in Burnsville, accounting for 29.0% of all households. In contrast, only 2 households (0.9%) fall into the $150,000 to $199,999 income bracket, making it the least populous group.
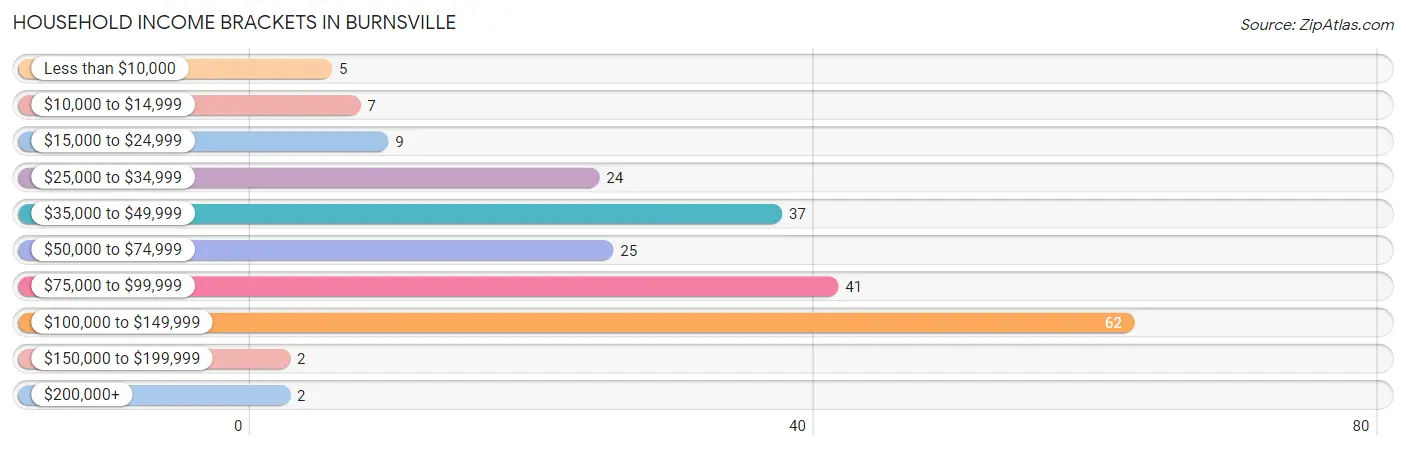
| Income Bracket | # Households | % Households |
| Less than $10,000 | 5 | 2.3% |
| $10,000 to $14,999 | 7 | 3.3% |
| $15,000 to $24,999 | 9 | 4.2% |
| $25,000 to $34,999 | 24 | 11.2% |
| $35,000 to $49,999 | 37 | 17.3% |
| $50,000 to $74,999 | 25 | 11.7% |
| $75,000 to $99,999 | 41 | 19.2% |
| $100,000 to $149,999 | 62 | 29.0% |
| $150,000 to $199,999 | 2 | 0.9% |
| $200,000+ | 2 | 0.9% |
Household Income by Householder Age in Burnsville
The median household income in Burnsville is $71,250, with the highest median household income of $96,250 found in the 65+ years age bracket for the primary householder. A total of 72 households (33.6%) fall into this category. Meanwhile, the 15 to 24 years age bracket for the primary householder has the lowest median household income of $47,083, with 5 households (2.3%) in this group.
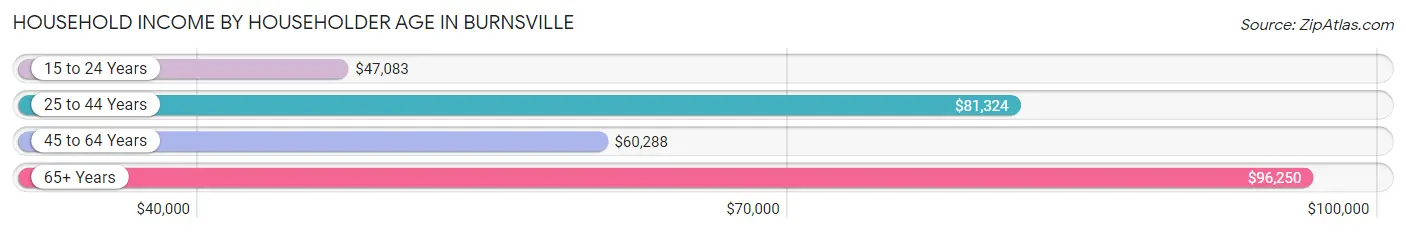
| Income Bracket | # Households | Median Income |
| 15 to 24 Years | 5 (2.3%) | $47,083 |
| 25 to 44 Years | 58 (27.1%) | $81,324 |
| 45 to 64 Years | 79 (36.9%) | $60,288 |
| 65+ Years | 72 (33.6%) | $96,250 |
| Total | 214 (100.0%) | $71,250 |
Poverty in Burnsville
Income Below Poverty by Sex and Age in Burnsville
With 7.4% poverty level for males and 14.5% for females among the residents of Burnsville, 16 and 17 year old males and 12 to 14 year old females are the most vulnerable to poverty, with 5 males (50.0%) and 1 females (100.0%) in their respective age groups living below the poverty level.
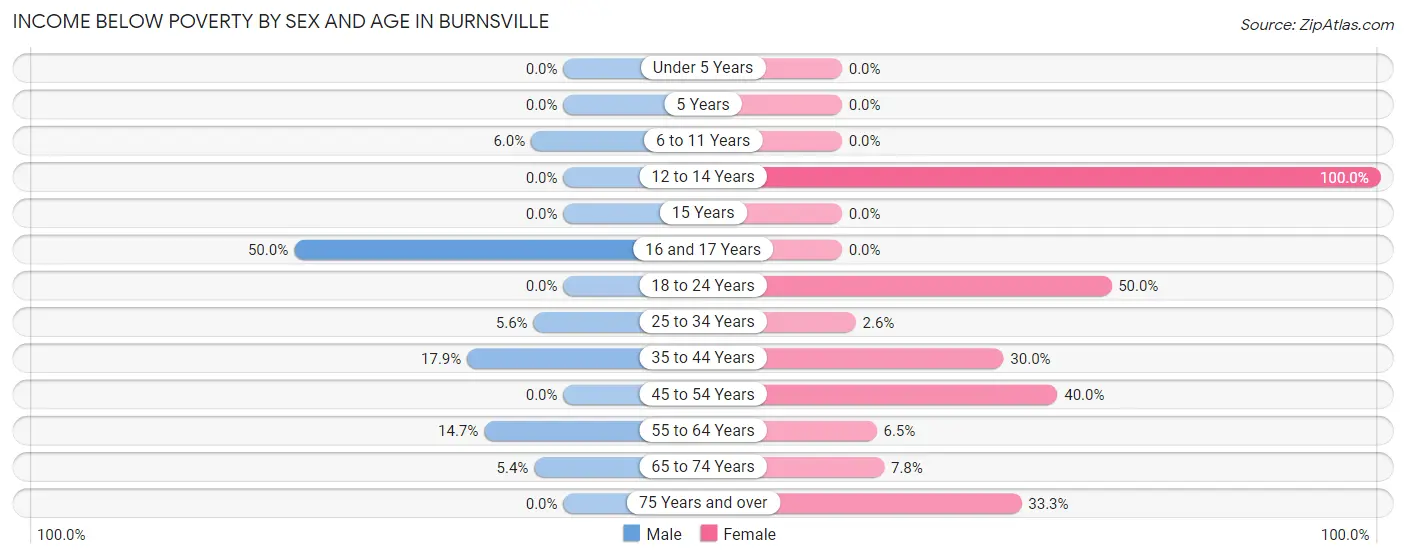
| Age Bracket | Male | Female |
| Under 5 Years | 0 (0.0%) | 0 (0.0%) |
| 5 Years | 0 (0.0%) | 0 (0.0%) |
| 6 to 11 Years | 3 (6.0%) | 0 (0.0%) |
| 12 to 14 Years | 0 (0.0%) | 1 (100.0%) |
| 15 Years | 0 (0.0%) | 0 (0.0%) |
| 16 and 17 Years | 5 (50.0%) | 0 (0.0%) |
| 18 to 24 Years | 0 (0.0%) | 5 (50.0%) |
| 25 to 34 Years | 2 (5.6%) | 1 (2.6%) |
| 35 to 44 Years | 5 (17.9%) | 3 (30.0%) |
| 45 to 54 Years | 0 (0.0%) | 8 (40.0%) |
| 55 to 64 Years | 5 (14.7%) | 2 (6.5%) |
| 65 to 74 Years | 2 (5.4%) | 4 (7.8%) |
| 75 Years and over | 0 (0.0%) | 7 (33.3%) |
| Total | 22 (7.4%) | 31 (14.5%) |
Income Above Poverty by Sex and Age in Burnsville
According to the poverty statistics in Burnsville, males aged 5 years and females aged under 5 years are the age groups that are most secure financially, with 100.0% of males and 100.0% of females in these age groups living above the poverty line.
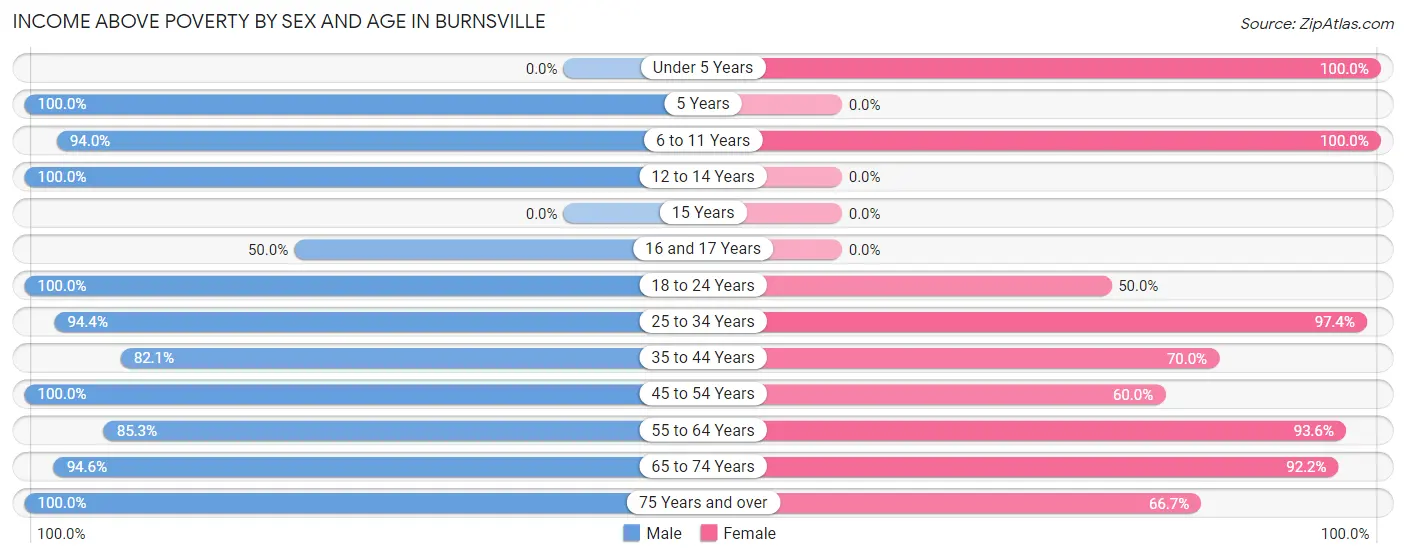
| Age Bracket | Male | Female |
| Under 5 Years | 0 (0.0%) | 1 (100.0%) |
| 5 Years | 5 (100.0%) | 0 (0.0%) |
| 6 to 11 Years | 47 (94.0%) | 29 (100.0%) |
| 12 to 14 Years | 53 (100.0%) | 0 (0.0%) |
| 15 Years | 0 (0.0%) | 0 (0.0%) |
| 16 and 17 Years | 5 (50.0%) | 0 (0.0%) |
| 18 to 24 Years | 11 (100.0%) | 5 (50.0%) |
| 25 to 34 Years | 34 (94.4%) | 38 (97.4%) |
| 35 to 44 Years | 23 (82.1%) | 7 (70.0%) |
| 45 to 54 Years | 27 (100.0%) | 12 (60.0%) |
| 55 to 64 Years | 29 (85.3%) | 29 (93.5%) |
| 65 to 74 Years | 35 (94.6%) | 47 (92.2%) |
| 75 Years and over | 5 (100.0%) | 14 (66.7%) |
| Total | 274 (92.6%) | 182 (85.5%) |
Income Below Poverty Among Married-Couple Families in Burnsville
The poverty statistics for married-couple families in Burnsville show that 2.9% or 4 of the total 137 families live below the poverty line. Families with no children have the highest poverty rate of 4.4%, comprising of 3 families. On the other hand, families with 3 or 4 children have the lowest poverty rate of 0.0%, which includes 0 families.
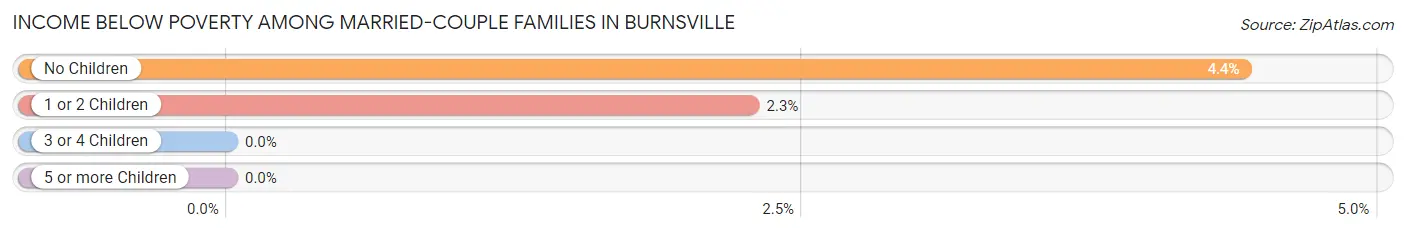
| Children | Above Poverty | Below Poverty |
| No Children | 65 (95.6%) | 3 (4.4%) |
| 1 or 2 Children | 43 (97.7%) | 1 (2.3%) |
| 3 or 4 Children | 25 (100.0%) | 0 (0.0%) |
| 5 or more Children | 0 (0.0%) | 0 (0.0%) |
| Total | 133 (97.1%) | 4 (2.9%) |
Income Below Poverty Among Single-Parent Households in Burnsville
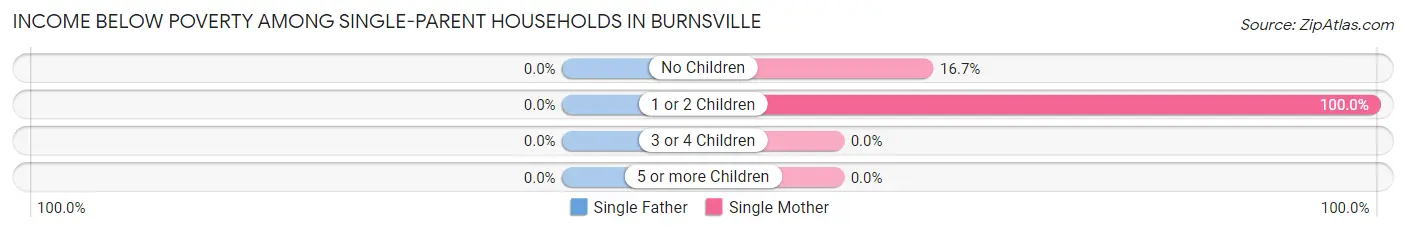
| Children | Single Father | Single Mother |
| No Children | 0 (0.0%) | 1 (16.7%) |
| 1 or 2 Children | 0 (0.0%) | 8 (100.0%) |
| 3 or 4 Children | 0 (0.0%) | 0 (0.0%) |
| 5 or more Children | 0 (0.0%) | 0 (0.0%) |
| Total | 0 (0.0%) | 9 (64.3%) |
Income Below Poverty Among Married-Couple vs Single-Parent Households in Burnsville
The poverty data for Burnsville shows that 4 of the married-couple family households (2.9%) and 9 of the single-parent households (64.3%) are living below the poverty level. Within the married-couple family households, those with no children have the highest poverty rate, with 3 households (4.4%) falling below the poverty line. Among the single-parent households, those with 1 or 2 children have the highest poverty rate, with 8 household (100.0%) living below poverty.
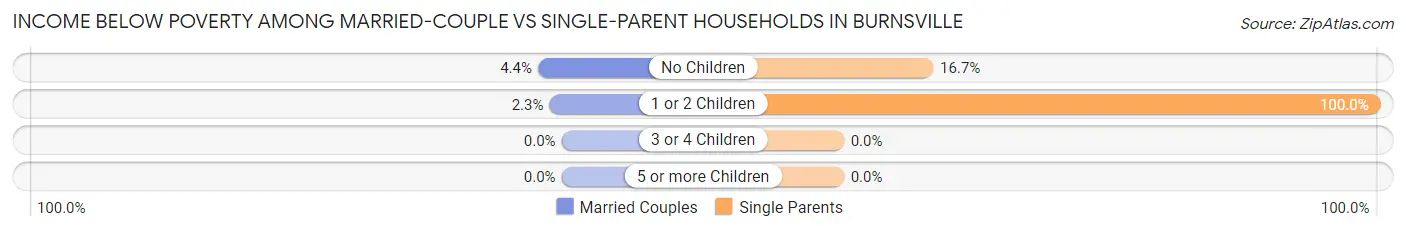
| Children | Married-Couple Families | Single-Parent Households |
| No Children | 3 (4.4%) | 1 (16.7%) |
| 1 or 2 Children | 1 (2.3%) | 8 (100.0%) |
| 3 or 4 Children | 0 (0.0%) | 0 (0.0%) |
| 5 or more Children | 0 (0.0%) | 0 (0.0%) |
| Total | 4 (2.9%) | 9 (64.3%) |
Race in Burnsville
The most populous races in Burnsville are White / Caucasian (498 | 97.8%), Two or more Races (11 | 2.2%), and Hispanic or Latino (6 | 1.2%).
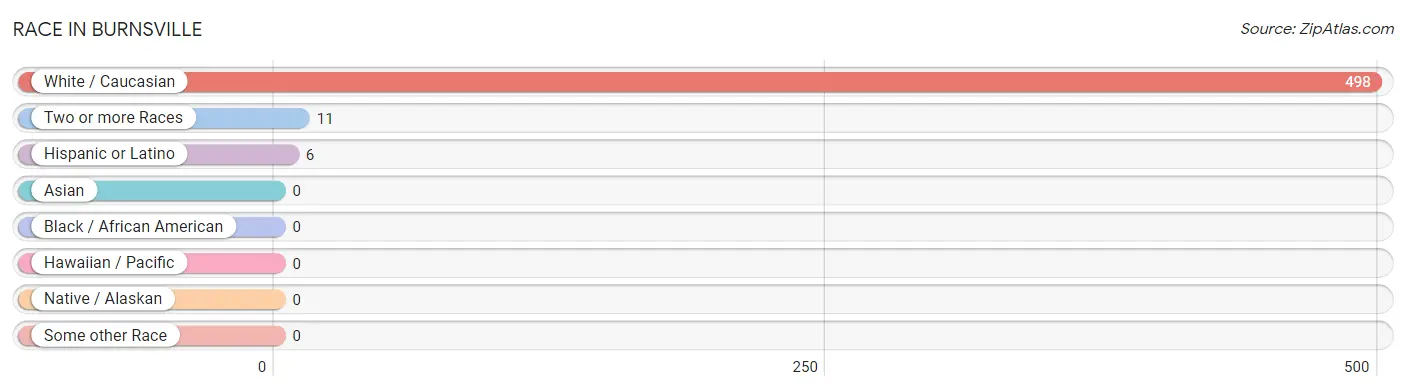
| Race | # Population | % Population |
| Asian | 0 | 0.0% |
| Black / African American | 0 | 0.0% |
| Hawaiian / Pacific | 0 | 0.0% |
| Hispanic or Latino | 6 | 1.2% |
| Native / Alaskan | 0 | 0.0% |
| White / Caucasian | 498 | 97.8% |
| Two or more Races | 11 | 2.2% |
| Some other Race | 0 | 0.0% |
| Total | 509 | 100.0% |
Ancestry in Burnsville
The most populous ancestries reported in Burnsville are German (132 | 25.9%), Irish (104 | 20.4%), English (70 | 13.8%), Italian (13 | 2.5%), and Polish (11 | 2.2%), together accounting for 64.8% of all Burnsville residents.
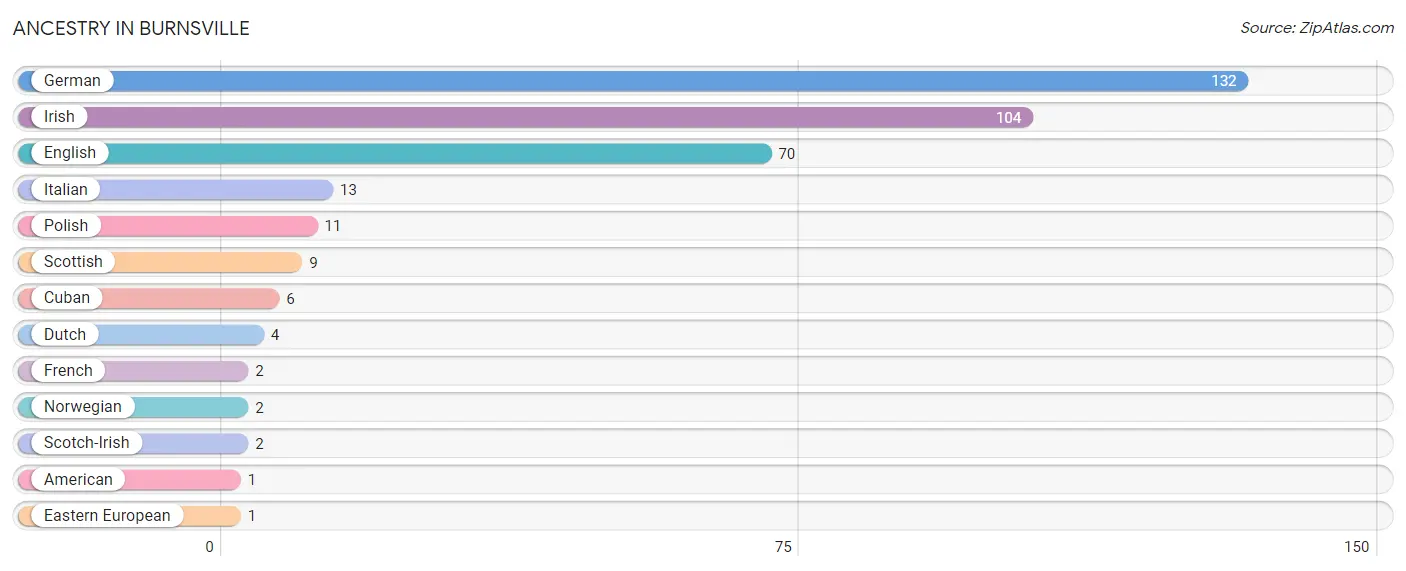
| Ancestry | # Population | % Population |
| American | 1 | 0.2% |
| Cuban | 6 | 1.2% |
| Dutch | 4 | 0.8% |
| Eastern European | 1 | 0.2% |
| English | 70 | 13.8% |
| French | 2 | 0.4% |
| German | 132 | 25.9% |
| Irish | 104 | 20.4% |
| Italian | 13 | 2.5% |
| Norwegian | 2 | 0.4% |
| Polish | 11 | 2.2% |
| Scotch-Irish | 2 | 0.4% |
| Scottish | 9 | 1.8% | View All 13 Rows |
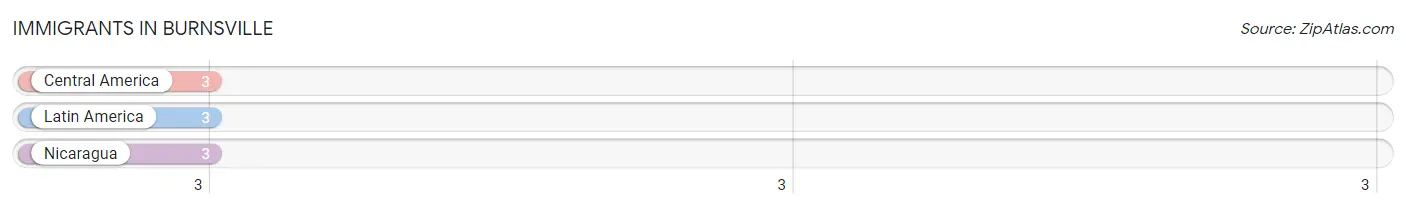
Immigrants in Burnsville
The most numerous immigrant groups reported in Burnsville came from Central America (3 | 0.6%), Latin America (3 | 0.6%), and Nicaragua (3 | 0.6%), together accounting for 1.8% of all Burnsville residents.
| Immigration Origin | # Population | % Population |
| Central America | 3 | 0.6% |
| Latin America | 3 | 0.6% |
| Nicaragua | 3 | 0.6% | View All 3 Rows |
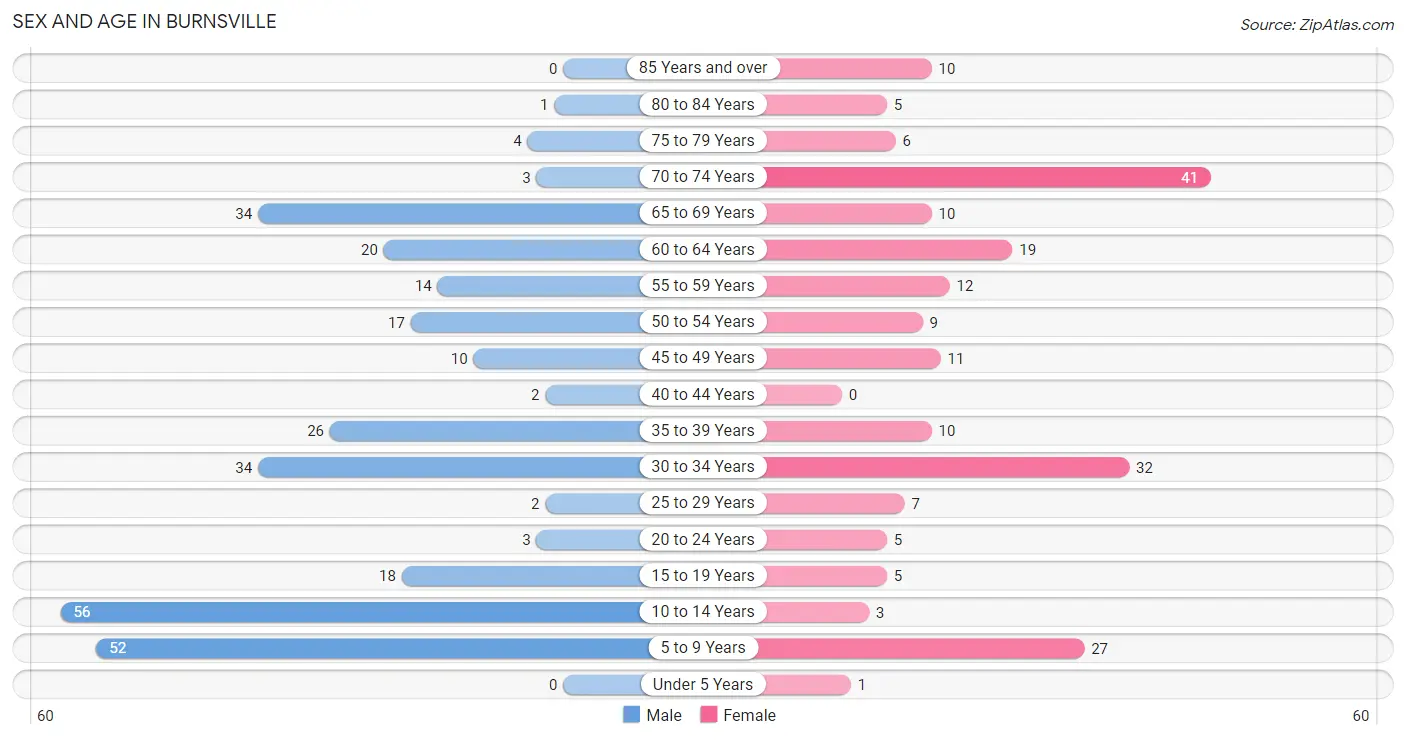
Sex and Age in Burnsville
Sex and Age in Burnsville
The most populous age groups in Burnsville are 10 to 14 Years (56 | 18.9%) for men and 70 to 74 Years (41 | 19.3%) for women.
| Age Bracket | Male | Female |
| Under 5 Years | 0 (0.0%) | 1 (0.5%) |
| 5 to 9 Years | 52 (17.6%) | 27 (12.7%) |
| 10 to 14 Years | 56 (18.9%) | 3 (1.4%) |
| 15 to 19 Years | 18 (6.1%) | 5 (2.4%) |
| 20 to 24 Years | 3 (1.0%) | 5 (2.4%) |
| 25 to 29 Years | 2 (0.7%) | 7 (3.3%) |
| 30 to 34 Years | 34 (11.5%) | 32 (15.0%) |
| 35 to 39 Years | 26 (8.8%) | 10 (4.7%) |
| 40 to 44 Years | 2 (0.7%) | 0 (0.0%) |
| 45 to 49 Years | 10 (3.4%) | 11 (5.2%) |
| 50 to 54 Years | 17 (5.7%) | 9 (4.2%) |
| 55 to 59 Years | 14 (4.7%) | 12 (5.6%) |
| 60 to 64 Years | 20 (6.8%) | 19 (8.9%) |
| 65 to 69 Years | 34 (11.5%) | 10 (4.7%) |
| 70 to 74 Years | 3 (1.0%) | 41 (19.3%) |
| 75 to 79 Years | 4 (1.3%) | 6 (2.8%) |
| 80 to 84 Years | 1 (0.3%) | 5 (2.4%) |
| 85 Years and over | 0 (0.0%) | 10 (4.7%) |
| Total | 296 (100.0%) | 213 (100.0%) |
Families and Households in Burnsville
Median Family Size in Burnsville
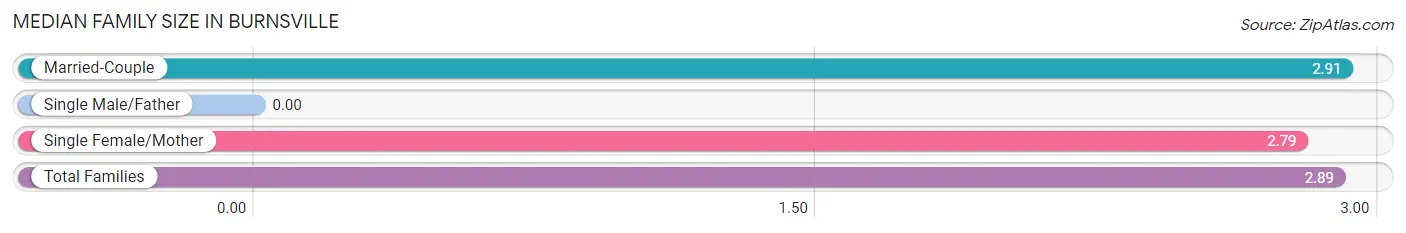
| Family Type | # Families | Family Size |
| Married-Couple | 137 (90.7%) | 2.91 |
| Single Male/Father | 0 (0.0%) | - |
| Single Female/Mother | 14 (9.3%) | 2.79 |
| Total Families | 151 (100.0%) | 2.89 |
Median Household Size in Burnsville
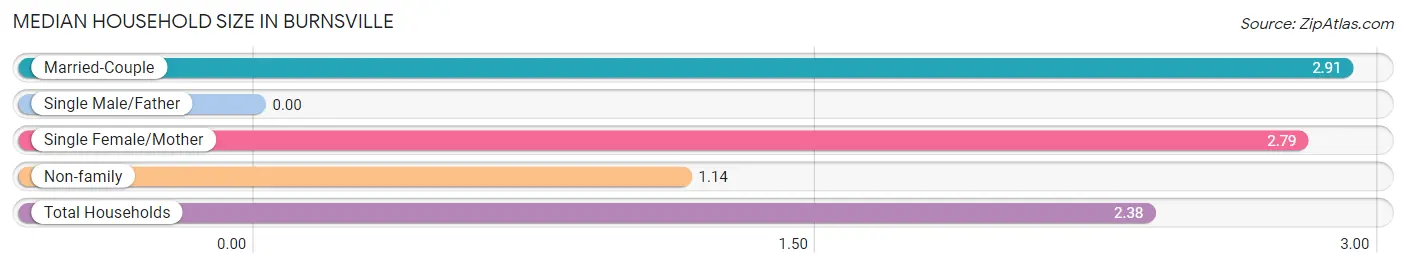
| Household Type | # Households | Household Size |
| Married-Couple | 137 (64.0%) | 2.91 |
| Single Male/Father | 0 (0.0%) | - |
| Single Female/Mother | 14 (6.5%) | 2.79 |
| Non-family | 63 (29.4%) | 1.14 |
| Total Households | 214 (100.0%) | 2.38 |
Household Size by Marriage Status in Burnsville
Out of a total of 214 households in Burnsville, 151 (70.6%) are family households, while 63 (29.4%) are nonfamily households. The most numerous type of family households are 2-person households, comprising 66, and the most common type of nonfamily households are 1-person households, comprising 57.
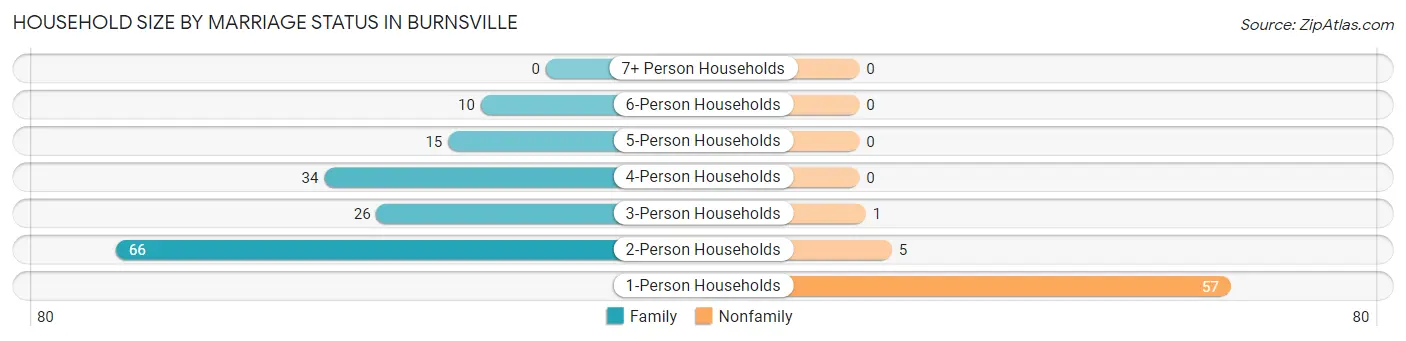
| Household Size | Family Households | Nonfamily Households |
| 1-Person Households | - | 57 (26.6%) |
| 2-Person Households | 66 (30.8%) | 5 (2.3%) |
| 3-Person Households | 26 (12.1%) | 1 (0.5%) |
| 4-Person Households | 34 (15.9%) | 0 (0.0%) |
| 5-Person Households | 15 (7.0%) | 0 (0.0%) |
| 6-Person Households | 10 (4.7%) | 0 (0.0%) |
| 7+ Person Households | 0 (0.0%) | 0 (0.0%) |
| Total | 151 (70.6%) | 63 (29.4%) |
Female Fertility in Burnsville
Fertility by Age in Burnsville
| Age Bracket | Women with Births | Births / 1,000 Women |
| 15 to 19 years | 0 (0.0%) | 0.0 |
| 20 to 34 years | 0 (0.0%) | 0.0 |
| 35 to 50 years | 0 (0.0%) | 0.0 |
| Total | 0 (0.0%) | 0.0 |
Fertility by Age by Marriage Status in Burnsville
| Age Bracket | Married | Unmarried |
| 15 to 19 years | 0 (0.0%) | 0 (0.0%) |
| 20 to 34 years | 0 (0.0%) | 0 (0.0%) |
| 35 to 50 years | 0 (0.0%) | 0 (0.0%) |
| Total | 0 (0.0%) | 0 (0.0%) |
Fertility by Education in Burnsville
| Educational Attainment | Women with Births | Births / 1,000 Women |
| Less than High School | 0 (0.0%) | 0.0 |
| High School Diploma | 0 (0.0%) | 0.0 |
| College or Associate's Degree | 0 (0.0%) | 0.0 |
| Bachelor's Degree | 0 (0.0%) | 0.0 |
| Graduate Degree | 0 (0.0%) | 0.0 |
| Total | 0 (0.0%) | 0.0 |
Fertility by Education by Marriage Status in Burnsville
| Educational Attainment | Married | Unmarried |
| Less than High School | 0 (0.0%) | 0 (0.0%) |
| High School Diploma | 0 (0.0%) | 0 (0.0%) |
| College or Associate's Degree | 0 (0.0%) | 0 (0.0%) |
| Bachelor's Degree | 0 (0.0%) | 0 (0.0%) |
| Graduate Degree | 0 (0.0%) | 0 (0.0%) |
| Total | 0 (0.0%) | 0 (0.0%) |
Employment Characteristics in Burnsville
Employment by Class of Employer in Burnsville
Among the 193 employed individuals in Burnsville, private company employees (129 | 66.8%), local government employees (38 | 19.7%), and state government employees (7 | 3.6%) make up the most common classes of employment.
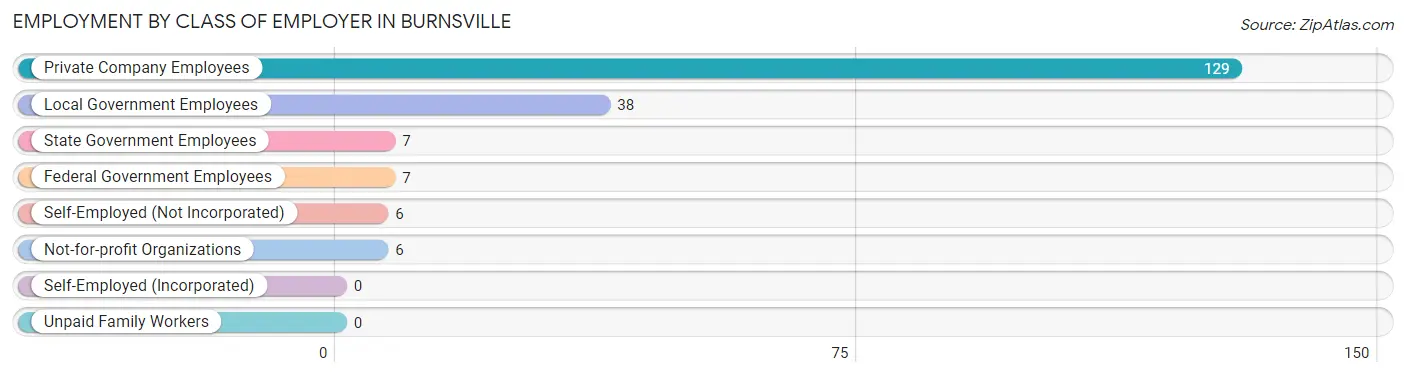
| Employer Class | # Employees | % Employees |
| Private Company Employees | 129 | 66.8% |
| Self-Employed (Incorporated) | 0 | 0.0% |
| Self-Employed (Not Incorporated) | 6 | 3.1% |
| Not-for-profit Organizations | 6 | 3.1% |
| Local Government Employees | 38 | 19.7% |
| State Government Employees | 7 | 3.6% |
| Federal Government Employees | 7 | 3.6% |
| Unpaid Family Workers | 0 | 0.0% |
| Total | 193 | 100.0% |
Employment Status by Age in Burnsville
According to the labor force statistics for Burnsville, out of the total population over 16 years of age (370), 59.2% or 219 individuals are in the labor force, with 11.0% or 24 of them unemployed. The age group with the highest labor force participation rate is 20 to 24 years, with 100.0% or 8 individuals in the labor force. Within the labor force, the 35 to 44 years age range has the highest percentage of unemployed individuals, with 35.3% or 12 of them being unemployed.
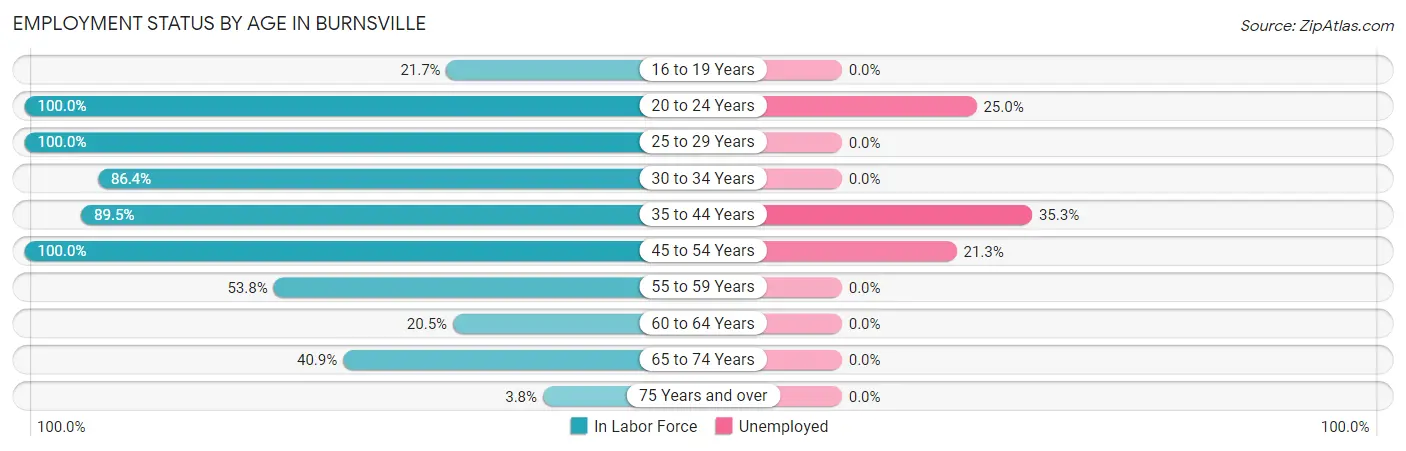
| Age Bracket | In Labor Force | Unemployed |
| 16 to 19 Years | 5 (21.7%) | 0 (0.0%) |
| 20 to 24 Years | 8 (100.0%) | 2 (25.0%) |
| 25 to 29 Years | 9 (100.0%) | 0 (0.0%) |
| 30 to 34 Years | 57 (86.4%) | 0 (0.0%) |
| 35 to 44 Years | 34 (89.5%) | 12 (35.3%) |
| 45 to 54 Years | 47 (100.0%) | 10 (21.3%) |
| 55 to 59 Years | 14 (53.8%) | 0 (0.0%) |
| 60 to 64 Years | 8 (20.5%) | 0 (0.0%) |
| 65 to 74 Years | 36 (40.9%) | 0 (0.0%) |
| 75 Years and over | 1 (3.8%) | 0 (0.0%) |
| Total | 219 (59.2%) | 24 (11.0%) |
Employment Status by Educational Attainment in Burnsville
According to labor force statistics for Burnsville, 75.1% of individuals (169) out of the total population between 25 and 64 years of age (225) are in the labor force, with 13.0% or 22 of them being unemployed. The group with the highest labor force participation rate are those with the educational attainment of college / associate degree, with 87.1% or 61 individuals in the labor force. Within the labor force, individuals with bachelor's degree or higher education have the highest percentage of unemployment, with 31.6% or 6 of them being unemployed.
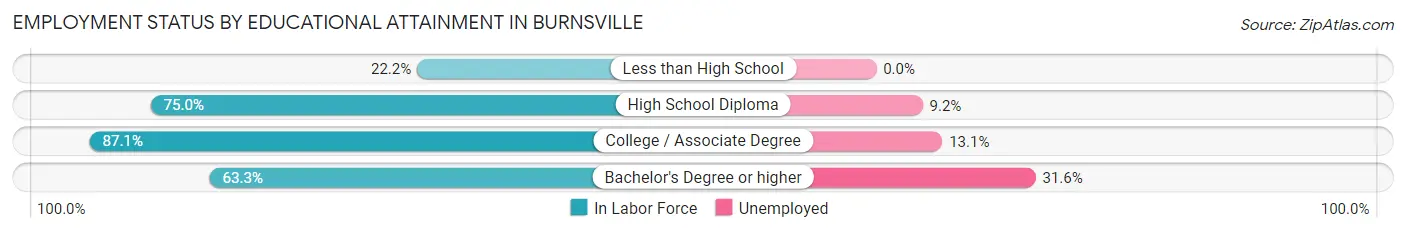
| Educational Attainment | In Labor Force | Unemployed |
| Less than High School | 2 (22.2%) | 0 (0.0%) |
| High School Diploma | 87 (75.0%) | 11 (9.2%) |
| College / Associate Degree | 61 (87.1%) | 9 (13.1%) |
| Bachelor's Degree or higher | 19 (63.3%) | 9 (31.6%) |
| Total | 169 (75.1%) | 29 (13.0%) |
Employment Occupations by Sex in Burnsville
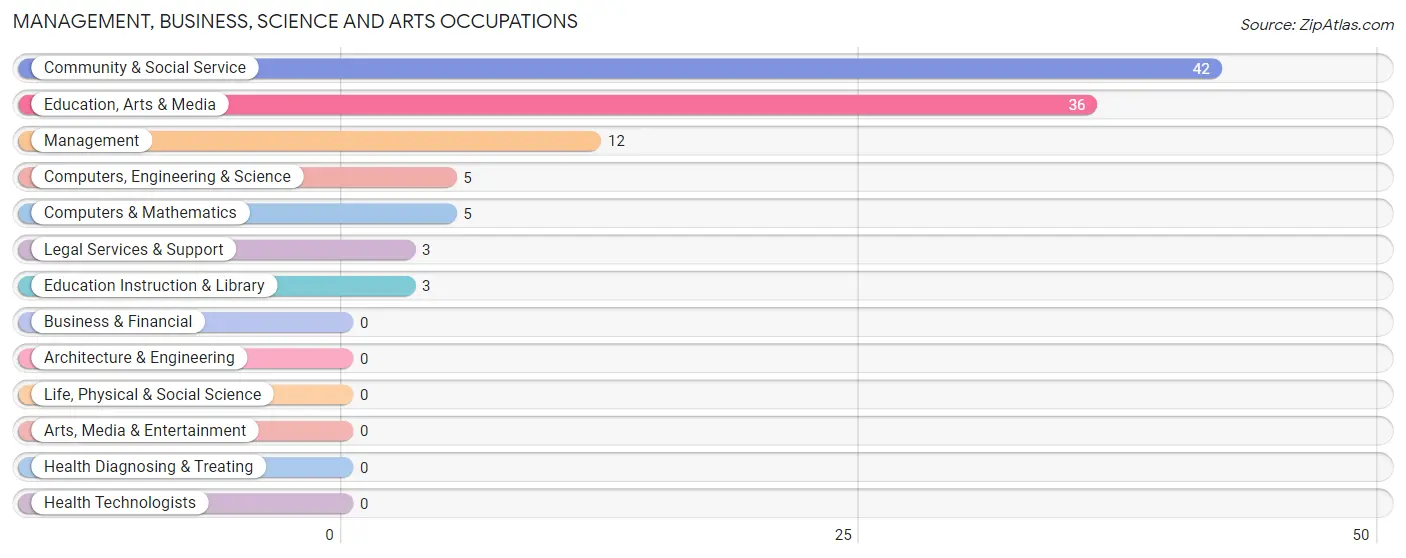
Management, Business, Science and Arts Occupations
The most common Management, Business, Science and Arts occupations in Burnsville are Community & Social Service (42 | 21.5%), Education, Arts & Media (36 | 18.5%), Management (12 | 6.1%), Computers, Engineering & Science (5 | 2.6%), and Computers & Mathematics (5 | 2.6%).
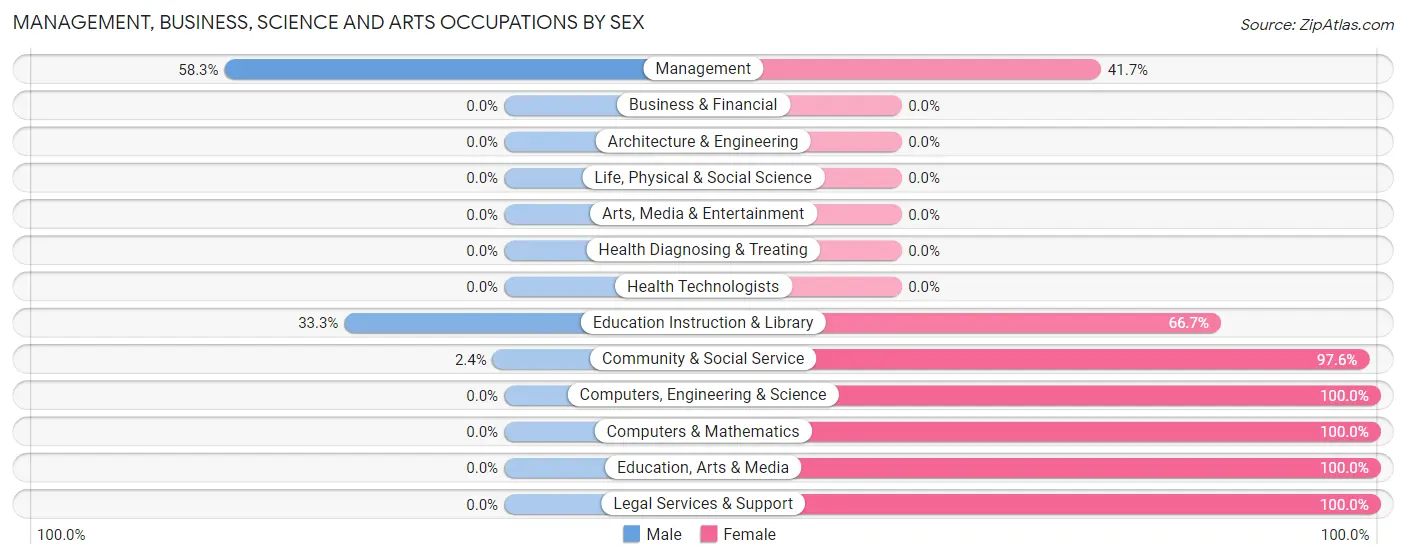
Management, Business, Science and Arts Occupations by Sex
Within the Management, Business, Science and Arts occupations in Burnsville, the most male-oriented occupations are Management (58.3%), Education Instruction & Library (33.3%), and Community & Social Service (2.4%), while the most female-oriented occupations are Computers, Engineering & Science (100.0%), Computers & Mathematics (100.0%), and Education, Arts & Media (100.0%).
| Occupation | Male | Female |
| Management | 7 (58.3%) | 5 (41.7%) |
| Business & Financial | 0 (0.0%) | 0 (0.0%) |
| Computers, Engineering & Science | 0 (0.0%) | 5 (100.0%) |
| Computers & Mathematics | 0 (0.0%) | 5 (100.0%) |
| Architecture & Engineering | 0 (0.0%) | 0 (0.0%) |
| Life, Physical & Social Science | 0 (0.0%) | 0 (0.0%) |
| Community & Social Service | 1 (2.4%) | 41 (97.6%) |
| Education, Arts & Media | 0 (0.0%) | 36 (100.0%) |
| Legal Services & Support | 0 (0.0%) | 3 (100.0%) |
| Education Instruction & Library | 1 (33.3%) | 2 (66.7%) |
| Arts, Media & Entertainment | 0 (0.0%) | 0 (0.0%) |
| Health Diagnosing & Treating | 0 (0.0%) | 0 (0.0%) |
| Health Technologists | 0 (0.0%) | 0 (0.0%) |
| Total (Category) | 8 (13.6%) | 51 (86.4%) |
| Total (Overall) | 93 (47.7%) | 102 (52.3%) |
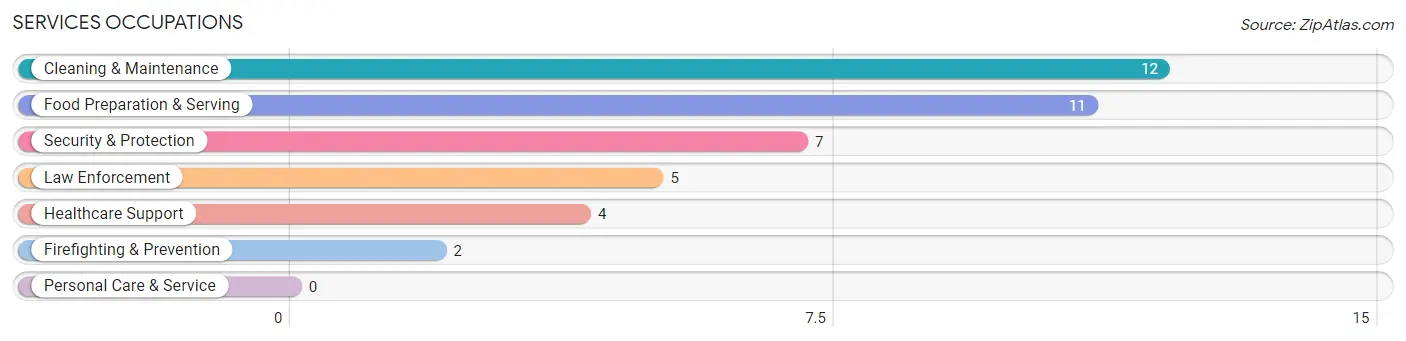
Services Occupations
The most common Services occupations in Burnsville are Cleaning & Maintenance (12 | 6.1%), Food Preparation & Serving (11 | 5.6%), Security & Protection (7 | 3.6%), Law Enforcement (5 | 2.6%), and Healthcare Support (4 | 2.1%).
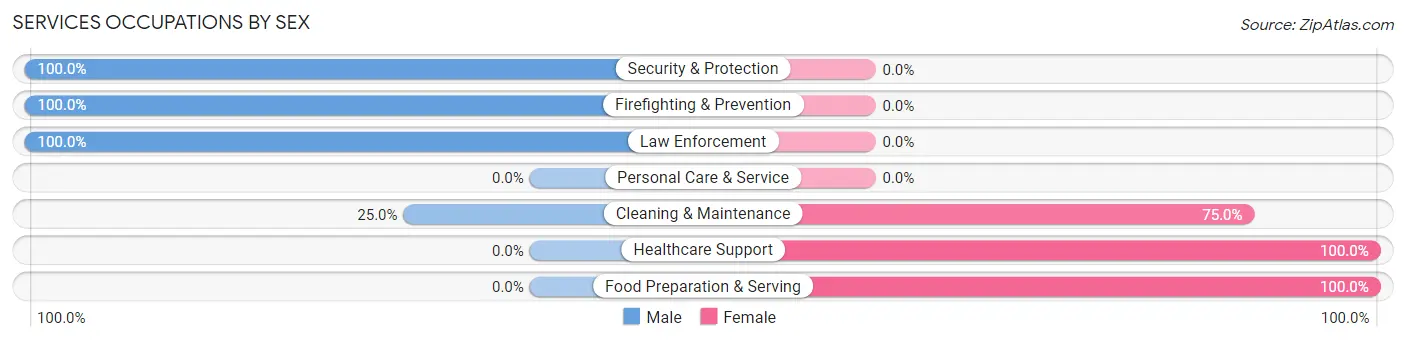
Services Occupations by Sex
Within the Services occupations in Burnsville, the most male-oriented occupations are Security & Protection (100.0%), Firefighting & Prevention (100.0%), and Law Enforcement (100.0%), while the most female-oriented occupations are Healthcare Support (100.0%), Food Preparation & Serving (100.0%), and Cleaning & Maintenance (75.0%).
| Occupation | Male | Female |
| Healthcare Support | 0 (0.0%) | 4 (100.0%) |
| Security & Protection | 7 (100.0%) | 0 (0.0%) |
| Firefighting & Prevention | 2 (100.0%) | 0 (0.0%) |
| Law Enforcement | 5 (100.0%) | 0 (0.0%) |
| Food Preparation & Serving | 0 (0.0%) | 11 (100.0%) |
| Cleaning & Maintenance | 3 (25.0%) | 9 (75.0%) |
| Personal Care & Service | 0 (0.0%) | 0 (0.0%) |
| Total (Category) | 10 (29.4%) | 24 (70.6%) |
| Total (Overall) | 93 (47.7%) | 102 (52.3%) |
Sales and Office Occupations
The most common Sales and Office occupations in Burnsville are Sales & Related (28 | 14.4%), and Office & Administration (15 | 7.7%).
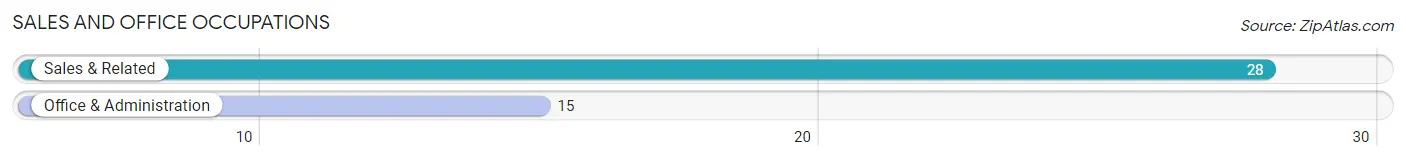
Sales and Office Occupations by Sex
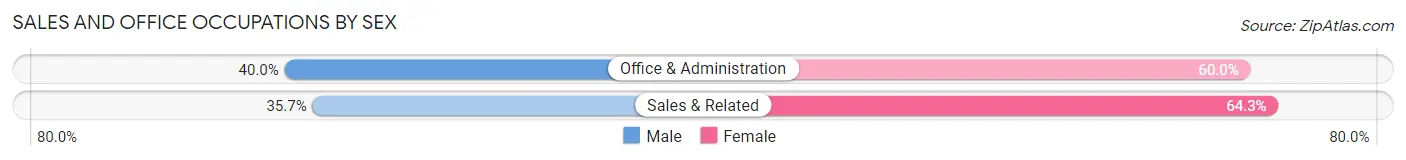
| Occupation | Male | Female |
| Sales & Related | 10 (35.7%) | 18 (64.3%) |
| Office & Administration | 6 (40.0%) | 9 (60.0%) |
| Total (Category) | 16 (37.2%) | 27 (62.8%) |
| Total (Overall) | 93 (47.7%) | 102 (52.3%) |
Natural Resources, Construction and Maintenance Occupations
The most common Natural Resources, Construction and Maintenance occupations in Burnsville are Installation, Maintenance & Repair (17 | 8.7%), and Construction & Extraction (5 | 2.6%).
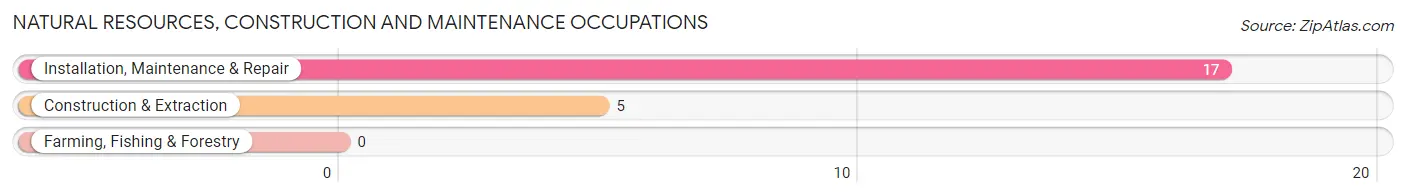
Natural Resources, Construction and Maintenance Occupations by Sex
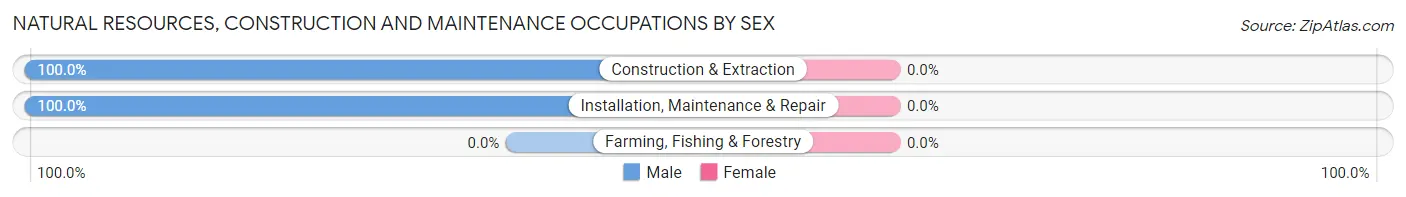
| Occupation | Male | Female |
| Farming, Fishing & Forestry | 0 (0.0%) | 0 (0.0%) |
| Construction & Extraction | 5 (100.0%) | 0 (0.0%) |
| Installation, Maintenance & Repair | 17 (100.0%) | 0 (0.0%) |
| Total (Category) | 22 (100.0%) | 0 (0.0%) |
| Total (Overall) | 93 (47.7%) | 102 (52.3%) |
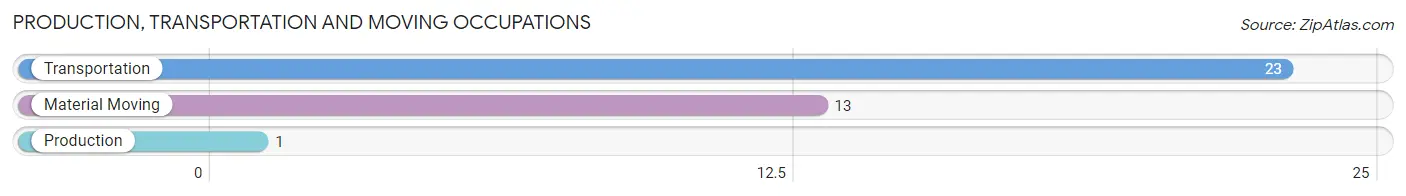
Production, Transportation and Moving Occupations
The most common Production, Transportation and Moving occupations in Burnsville are Transportation (23 | 11.8%), Material Moving (13 | 6.7%), and Production (1 | 0.5%).
Production, Transportation and Moving Occupations by Sex
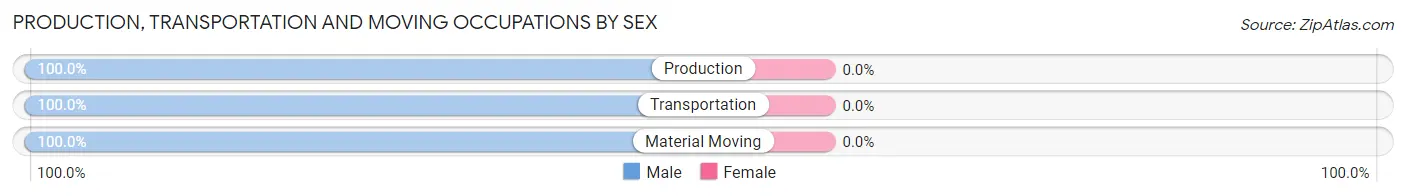
| Occupation | Male | Female |
| Production | 1 (100.0%) | 0 (0.0%) |
| Transportation | 23 (100.0%) | 0 (0.0%) |
| Material Moving | 13 (100.0%) | 0 (0.0%) |
| Total (Category) | 37 (100.0%) | 0 (0.0%) |
| Total (Overall) | 93 (47.7%) | 102 (52.3%) |
Employment Industries by Sex in Burnsville
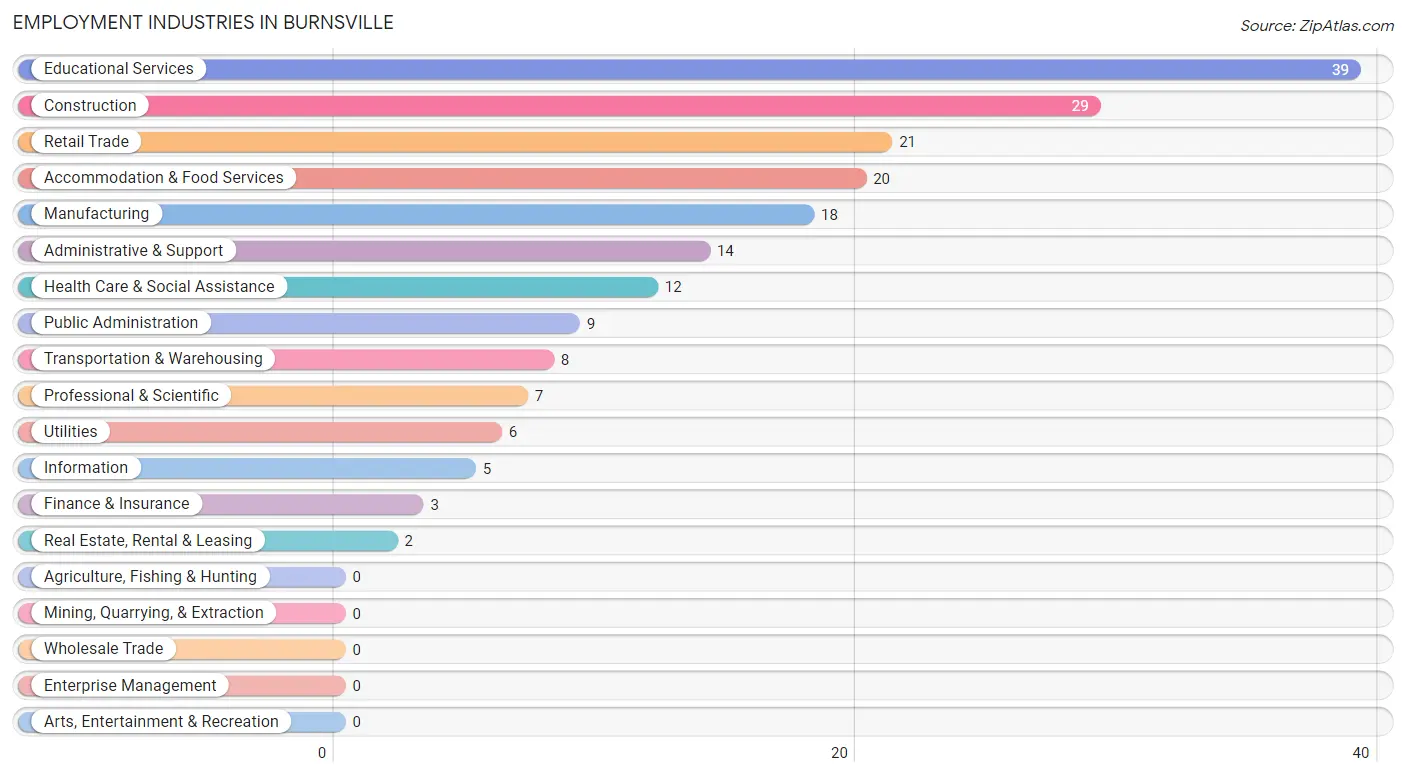
Employment Industries in Burnsville
The major employment industries in Burnsville include Educational Services (39 | 20.0%), Construction (29 | 14.9%), Retail Trade (21 | 10.8%), Accommodation & Food Services (20 | 10.3%), and Manufacturing (18 | 9.2%).
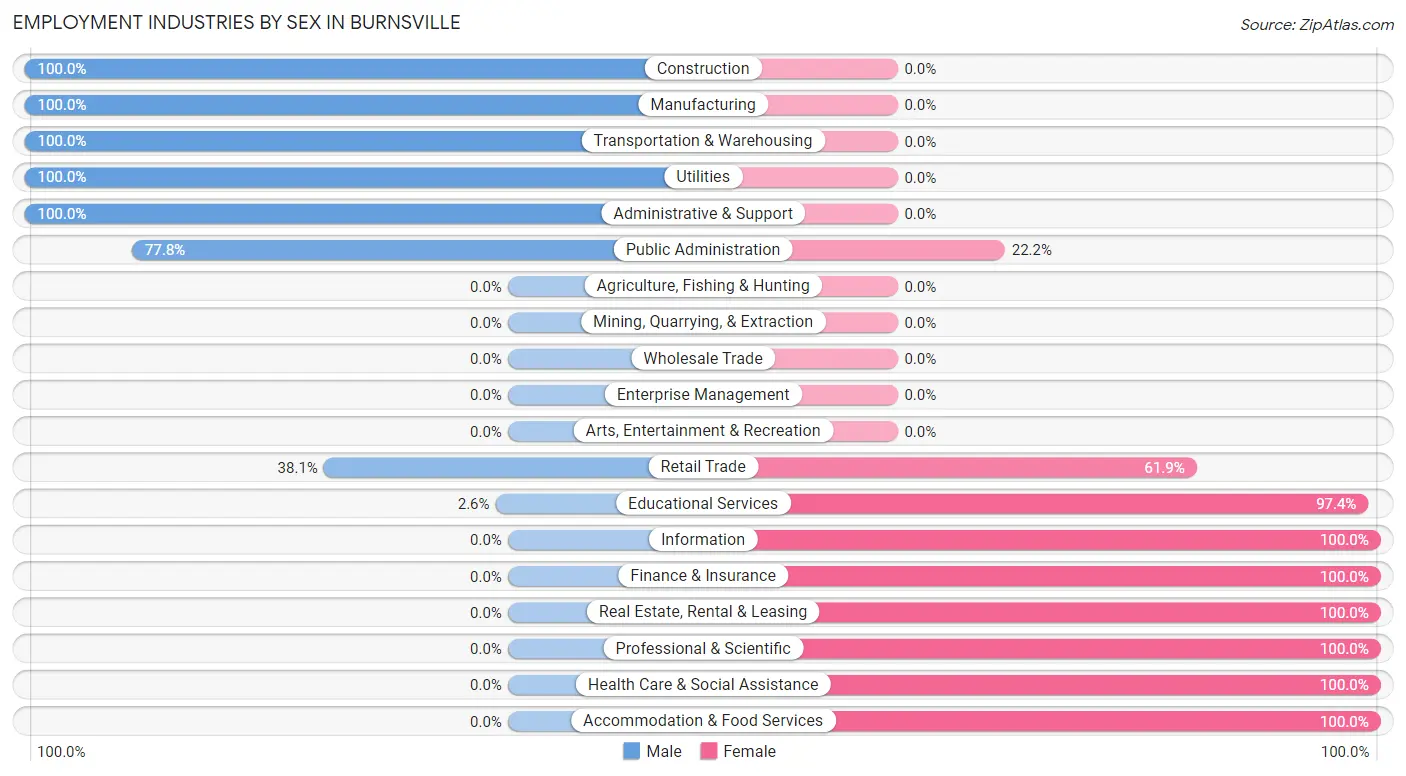
Employment Industries by Sex in Burnsville
The Burnsville industries that see more men than women are Construction (100.0%), Manufacturing (100.0%), and Transportation & Warehousing (100.0%), whereas the industries that tend to have a higher number of women are Information (100.0%), Finance & Insurance (100.0%), and Real Estate, Rental & Leasing (100.0%).
| Industry | Male | Female |
| Agriculture, Fishing & Hunting | 0 (0.0%) | 0 (0.0%) |
| Mining, Quarrying, & Extraction | 0 (0.0%) | 0 (0.0%) |
| Construction | 29 (100.0%) | 0 (0.0%) |
| Manufacturing | 18 (100.0%) | 0 (0.0%) |
| Wholesale Trade | 0 (0.0%) | 0 (0.0%) |
| Retail Trade | 8 (38.1%) | 13 (61.9%) |
| Transportation & Warehousing | 8 (100.0%) | 0 (0.0%) |
| Utilities | 6 (100.0%) | 0 (0.0%) |
| Information | 0 (0.0%) | 5 (100.0%) |
| Finance & Insurance | 0 (0.0%) | 3 (100.0%) |
| Real Estate, Rental & Leasing | 0 (0.0%) | 2 (100.0%) |
| Professional & Scientific | 0 (0.0%) | 7 (100.0%) |
| Enterprise Management | 0 (0.0%) | 0 (0.0%) |
| Administrative & Support | 14 (100.0%) | 0 (0.0%) |
| Educational Services | 1 (2.6%) | 38 (97.4%) |
| Health Care & Social Assistance | 0 (0.0%) | 12 (100.0%) |
| Arts, Entertainment & Recreation | 0 (0.0%) | 0 (0.0%) |
| Accommodation & Food Services | 0 (0.0%) | 20 (100.0%) |
| Public Administration | 7 (77.8%) | 2 (22.2%) |
| Total | 93 (47.7%) | 102 (52.3%) |
Education in Burnsville
School Enrollment in Burnsville
The most common levels of schooling among the 164 students in Burnsville are elementary school (66 | 40.2%), middle school (42 | 25.6%), and high school (32 | 19.5%).
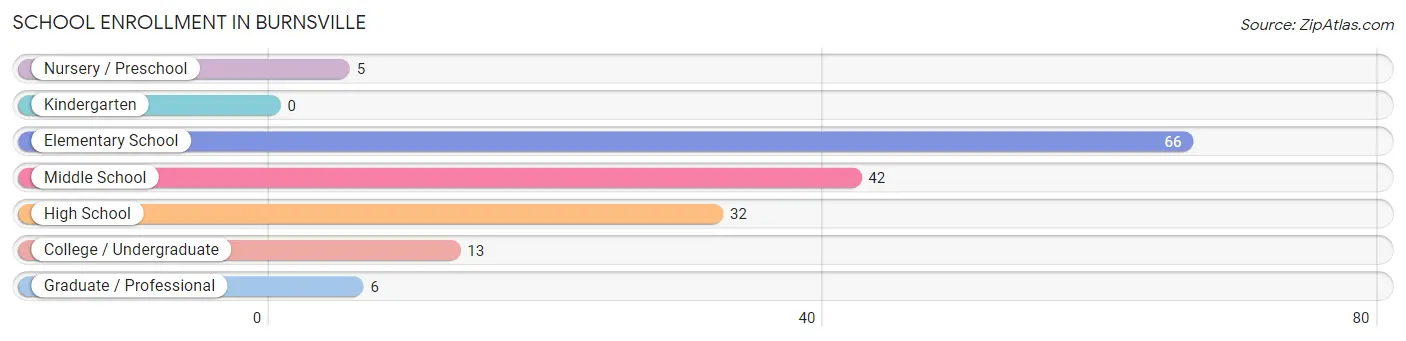
| School Level | # Students | % Students |
| Nursery / Preschool | 5 | 3.0% |
| Kindergarten | 0 | 0.0% |
| Elementary School | 66 | 40.2% |
| Middle School | 42 | 25.6% |
| High School | 32 | 19.5% |
| College / Undergraduate | 13 | 7.9% |
| Graduate / Professional | 6 | 3.7% |
| Total | 164 | 100.0% |
School Enrollment by Age by Funding Source in Burnsville
Out of a total of 164 students who are enrolled in schools in Burnsville, 6 (3.7%) attend a private institution, while the remaining 158 (96.3%) are enrolled in public schools. The age group of 18 to 19 year olds has the highest likelihood of being enrolled in private schools, with 5 (55.6% in the age bracket) enrolled. Conversely, the age group of 5 to 9 year old has the lowest likelihood of being enrolled in a private school, with 71 (100.0% in the age bracket) attending a public institution.
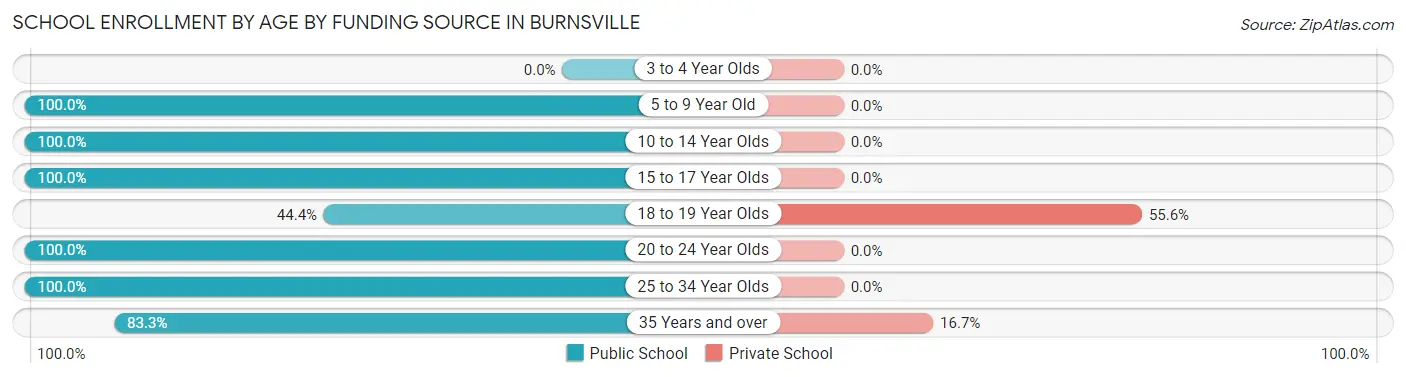
| Age Bracket | Public School | Private School |
| 3 to 4 Year Olds | 0 (0.0%) | 0 (0.0%) |
| 5 to 9 Year Old | 71 (100.0%) | 0 (0.0%) |
| 10 to 14 Year Olds | 56 (100.0%) | 0 (0.0%) |
| 15 to 17 Year Olds | 10 (100.0%) | 0 (0.0%) |
| 18 to 19 Year Olds | 4 (44.4%) | 5 (55.6%) |
| 20 to 24 Year Olds | 3 (100.0%) | 0 (0.0%) |
| 25 to 34 Year Olds | 9 (100.0%) | 0 (0.0%) |
| 35 Years and over | 5 (83.3%) | 1 (16.7%) |
| Total | 158 (96.3%) | 6 (3.7%) |
Educational Attainment by Field of Study in Burnsville
Education (49 | 60.5%), business (30 | 37.0%), physical & health sciences (1 | 1.2%), and arts & humanities (1 | 1.2%) are the most common fields of study among 81 individuals in Burnsville who have obtained a bachelor's degree or higher.
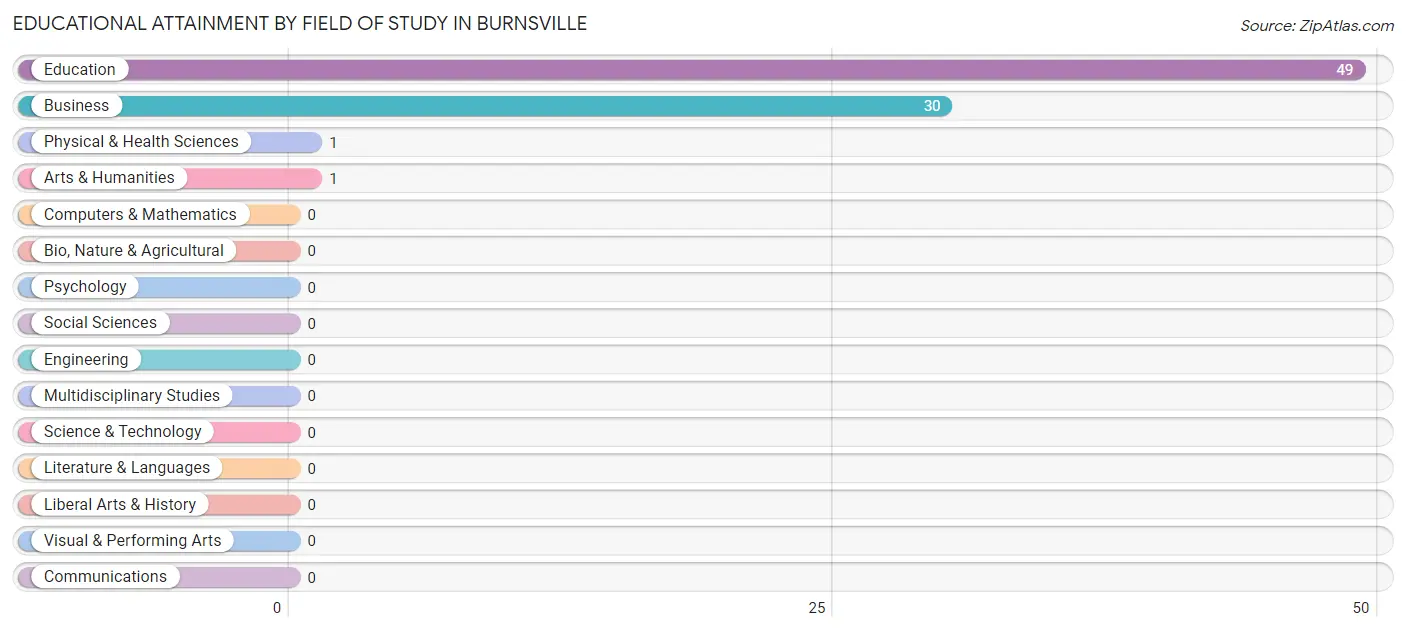
| Field of Study | # Graduates | % Graduates |
| Computers & Mathematics | 0 | 0.0% |
| Bio, Nature & Agricultural | 0 | 0.0% |
| Physical & Health Sciences | 1 | 1.2% |
| Psychology | 0 | 0.0% |
| Social Sciences | 0 | 0.0% |
| Engineering | 0 | 0.0% |
| Multidisciplinary Studies | 0 | 0.0% |
| Science & Technology | 0 | 0.0% |
| Business | 30 | 37.0% |
| Education | 49 | 60.5% |
| Literature & Languages | 0 | 0.0% |
| Liberal Arts & History | 0 | 0.0% |
| Visual & Performing Arts | 0 | 0.0% |
| Communications | 0 | 0.0% |
| Arts & Humanities | 1 | 1.2% |
| Total | 81 | 100.0% |
Transportation & Commute in Burnsville
Vehicle Availability by Sex in Burnsville
The most prevalent vehicle ownership categories in Burnsville are males with 2 vehicles (65, accounting for 70.7%) and females with 2 vehicles (75, making up 64.4%).
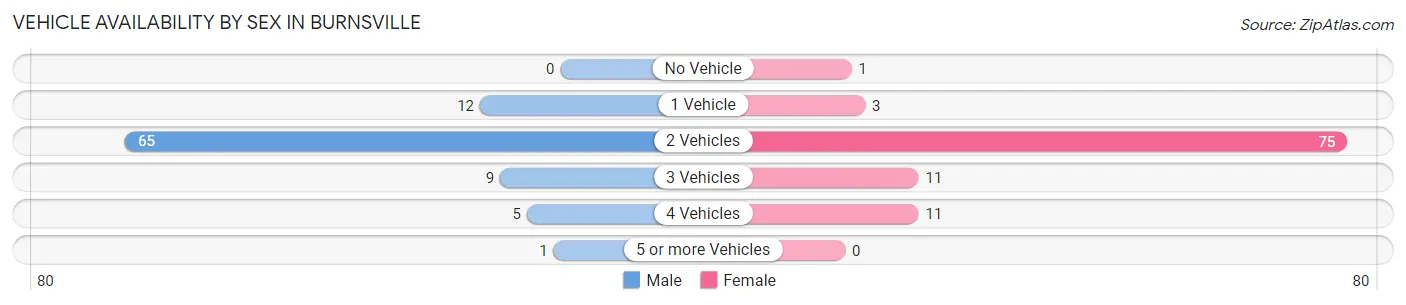
| Vehicles Available | Male | Female |
| No Vehicle | 0 (0.0%) | 1 (1.0%) |
| 1 Vehicle | 12 (13.0%) | 3 (3.0%) |
| 2 Vehicles | 65 (70.7%) | 75 (74.3%) |
| 3 Vehicles | 9 (9.8%) | 11 (10.9%) |
| 4 Vehicles | 5 (5.4%) | 11 (10.9%) |
| 5 or more Vehicles | 1 (1.1%) | 0 (0.0%) |
| Total | 92 (100.0%) | 101 (100.0%) |
Commute Time in Burnsville
The most frequently occuring commute durations in Burnsville are 30 to 34 minutes (65 commuters, 35.1%), 40 to 44 minutes (30 commuters, 16.2%), and 20 to 24 minutes (23 commuters, 12.4%).
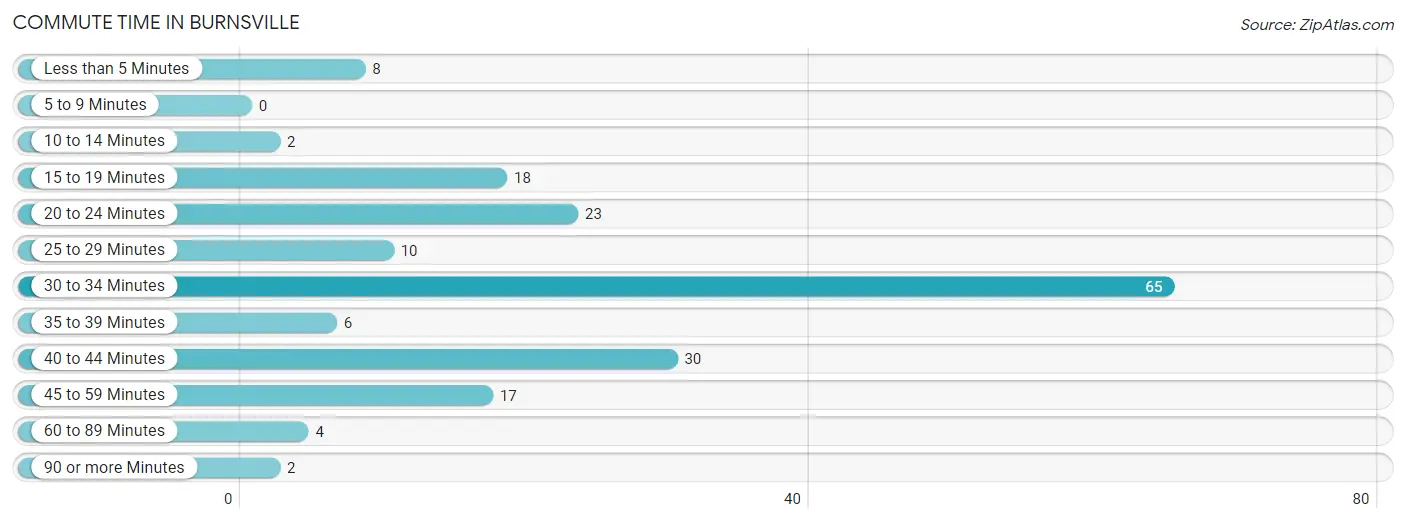
| Commute Time | # Commuters | % Commuters |
| Less than 5 Minutes | 8 | 4.3% |
| 5 to 9 Minutes | 0 | 0.0% |
| 10 to 14 Minutes | 2 | 1.1% |
| 15 to 19 Minutes | 18 | 9.7% |
| 20 to 24 Minutes | 23 | 12.4% |
| 25 to 29 Minutes | 10 | 5.4% |
| 30 to 34 Minutes | 65 | 35.1% |
| 35 to 39 Minutes | 6 | 3.2% |
| 40 to 44 Minutes | 30 | 16.2% |
| 45 to 59 Minutes | 17 | 9.2% |
| 60 to 89 Minutes | 4 | 2.2% |
| 90 or more Minutes | 2 | 1.1% |
Commute Time by Sex in Burnsville
The most common commute times in Burnsville are 40 to 44 minutes (30 commuters, 32.6%) for males and 30 to 34 minutes (48 commuters, 51.6%) for females.
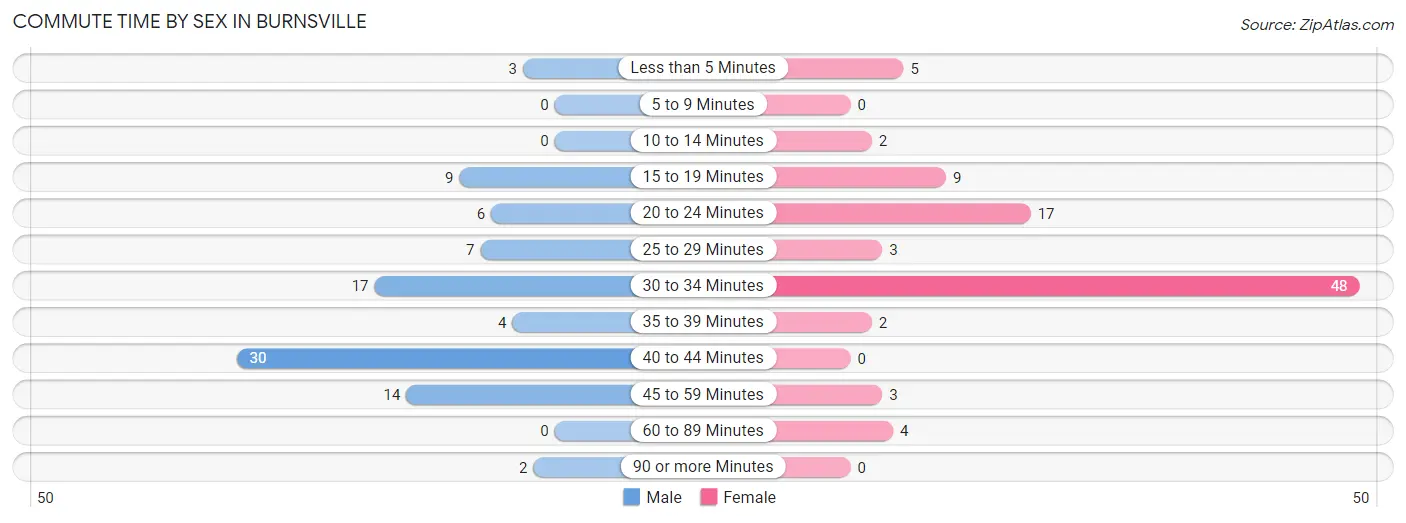
| Commute Time | Male | Female |
| Less than 5 Minutes | 3 (3.3%) | 5 (5.4%) |
| 5 to 9 Minutes | 0 (0.0%) | 0 (0.0%) |
| 10 to 14 Minutes | 0 (0.0%) | 2 (2.1%) |
| 15 to 19 Minutes | 9 (9.8%) | 9 (9.7%) |
| 20 to 24 Minutes | 6 (6.5%) | 17 (18.3%) |
| 25 to 29 Minutes | 7 (7.6%) | 3 (3.2%) |
| 30 to 34 Minutes | 17 (18.5%) | 48 (51.6%) |
| 35 to 39 Minutes | 4 (4.3%) | 2 (2.1%) |
| 40 to 44 Minutes | 30 (32.6%) | 0 (0.0%) |
| 45 to 59 Minutes | 14 (15.2%) | 3 (3.2%) |
| 60 to 89 Minutes | 0 (0.0%) | 4 (4.3%) |
| 90 or more Minutes | 2 (2.2%) | 0 (0.0%) |
Time of Departure to Work by Sex in Burnsville
The most frequent times of departure to work in Burnsville are 5:30 AM to 5:59 AM (35, 38.0%) for males and 6:30 AM to 6:59 AM (36, 38.7%) for females.
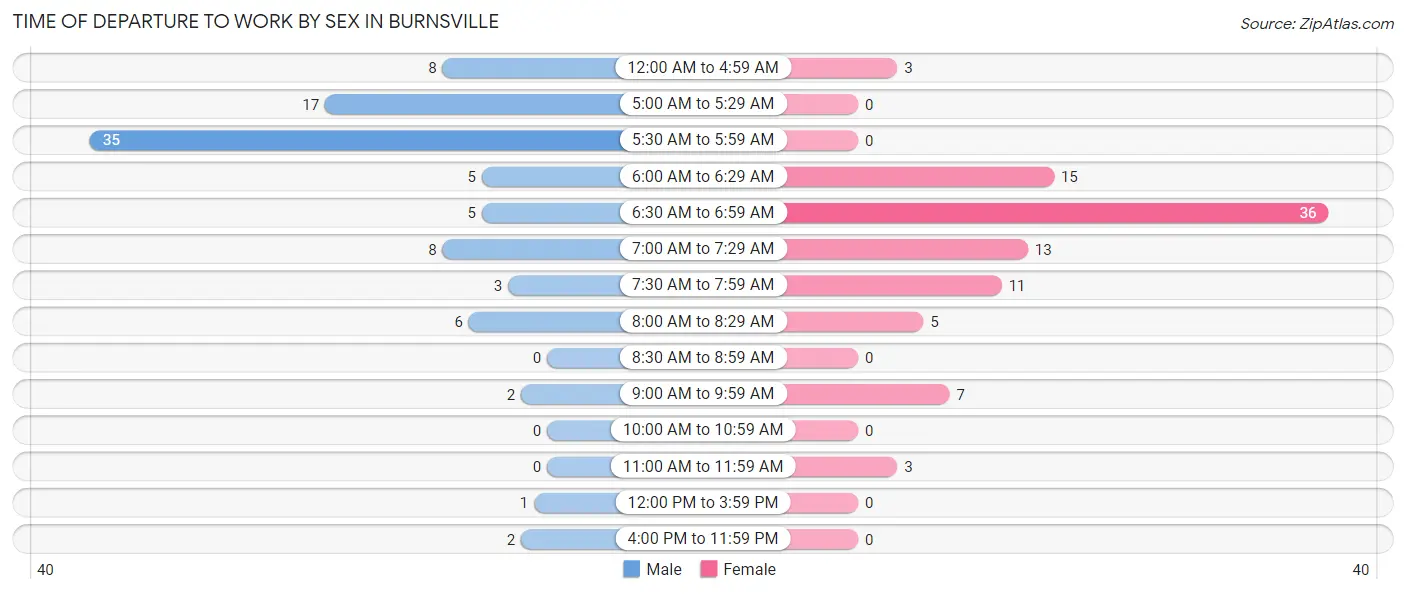
| Time of Departure | Male | Female |
| 12:00 AM to 4:59 AM | 8 (8.7%) | 3 (3.2%) |
| 5:00 AM to 5:29 AM | 17 (18.5%) | 0 (0.0%) |
| 5:30 AM to 5:59 AM | 35 (38.0%) | 0 (0.0%) |
| 6:00 AM to 6:29 AM | 5 (5.4%) | 15 (16.1%) |
| 6:30 AM to 6:59 AM | 5 (5.4%) | 36 (38.7%) |
| 7:00 AM to 7:29 AM | 8 (8.7%) | 13 (14.0%) |
| 7:30 AM to 7:59 AM | 3 (3.3%) | 11 (11.8%) |
| 8:00 AM to 8:29 AM | 6 (6.5%) | 5 (5.4%) |
| 8:30 AM to 8:59 AM | 0 (0.0%) | 0 (0.0%) |
| 9:00 AM to 9:59 AM | 2 (2.2%) | 7 (7.5%) |
| 10:00 AM to 10:59 AM | 0 (0.0%) | 0 (0.0%) |
| 11:00 AM to 11:59 AM | 0 (0.0%) | 3 (3.2%) |
| 12:00 PM to 3:59 PM | 1 (1.1%) | 0 (0.0%) |
| 4:00 PM to 11:59 PM | 2 (2.2%) | 0 (0.0%) |
| Total | 92 (100.0%) | 93 (100.0%) |
Housing Occupancy in Burnsville
Occupancy by Ownership in Burnsville
Of the total 214 dwellings in Burnsville, owner-occupied units account for 149 (69.6%), while renter-occupied units make up 65 (30.4%).
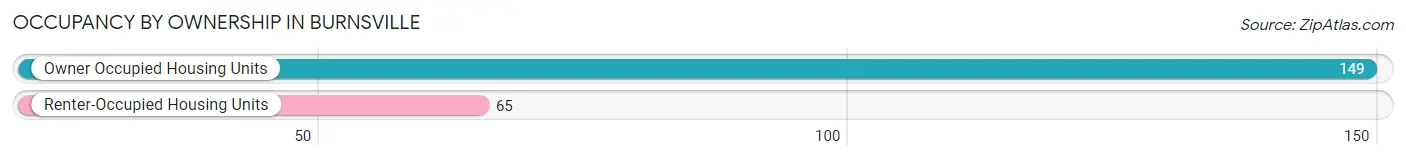
| Occupancy | # Housing Units | % Housing Units |
| Owner Occupied Housing Units | 149 | 69.6% |
| Renter-Occupied Housing Units | 65 | 30.4% |
| Total Occupied Housing Units | 214 | 100.0% |
Occupancy by Household Size in Burnsville
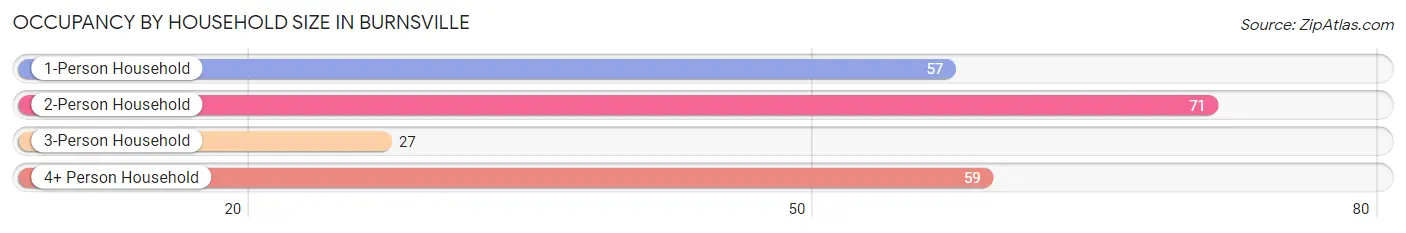
| Household Size | # Housing Units | % Housing Units |
| 1-Person Household | 57 | 26.6% |
| 2-Person Household | 71 | 33.2% |
| 3-Person Household | 27 | 12.6% |
| 4+ Person Household | 59 | 27.6% |
| Total Housing Units | 214 | 100.0% |
Occupancy by Ownership by Household Size in Burnsville
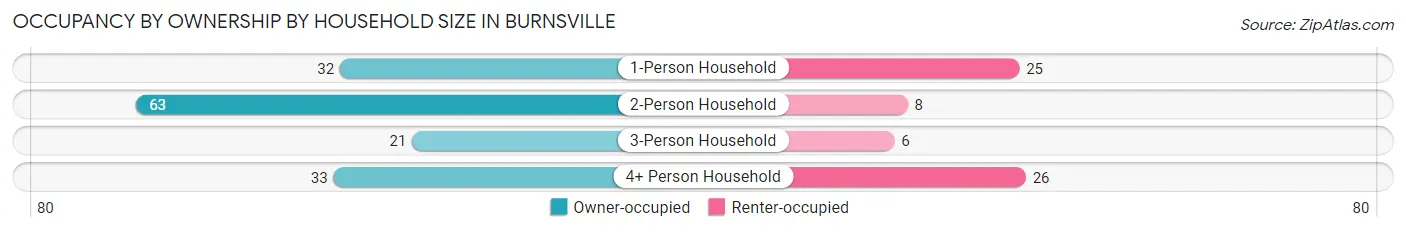
| Household Size | Owner-occupied | Renter-occupied |
| 1-Person Household | 32 (56.1%) | 25 (43.9%) |
| 2-Person Household | 63 (88.7%) | 8 (11.3%) |
| 3-Person Household | 21 (77.8%) | 6 (22.2%) |
| 4+ Person Household | 33 (55.9%) | 26 (44.1%) |
| Total Housing Units | 149 (69.6%) | 65 (30.4%) |
Occupancy by Educational Attainment in Burnsville
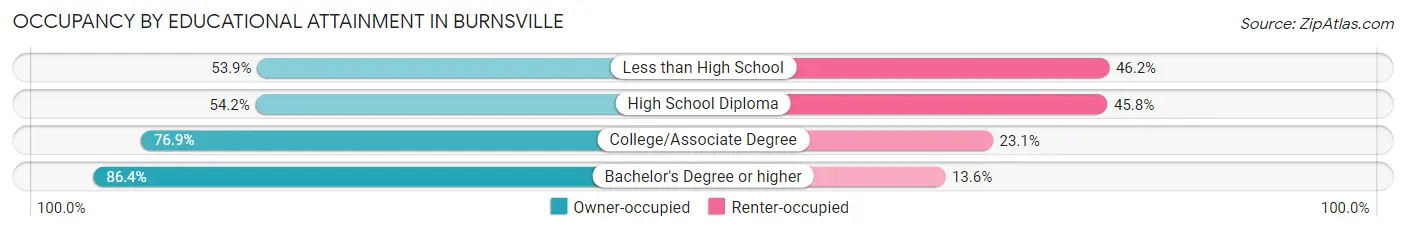
| Household Size | Owner-occupied | Renter-occupied |
| Less than High School | 7 (53.8%) | 6 (46.2%) |
| High School Diploma | 45 (54.2%) | 38 (45.8%) |
| College/Associate Degree | 40 (76.9%) | 12 (23.1%) |
| Bachelor's Degree or higher | 57 (86.4%) | 9 (13.6%) |
Occupancy by Age of Householder in Burnsville
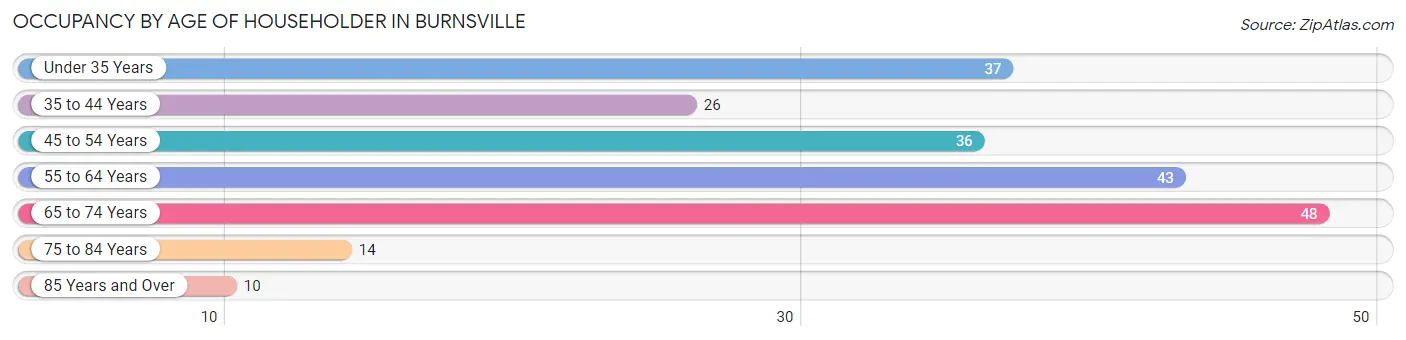
| Age Bracket | # Households | % Households |
| Under 35 Years | 37 | 17.3% |
| 35 to 44 Years | 26 | 12.1% |
| 45 to 54 Years | 36 | 16.8% |
| 55 to 64 Years | 43 | 20.1% |
| 65 to 74 Years | 48 | 22.4% |
| 75 to 84 Years | 14 | 6.5% |
| 85 Years and Over | 10 | 4.7% |
| Total | 214 | 100.0% |
Housing Finances in Burnsville
Median Income by Occupancy in Burnsville
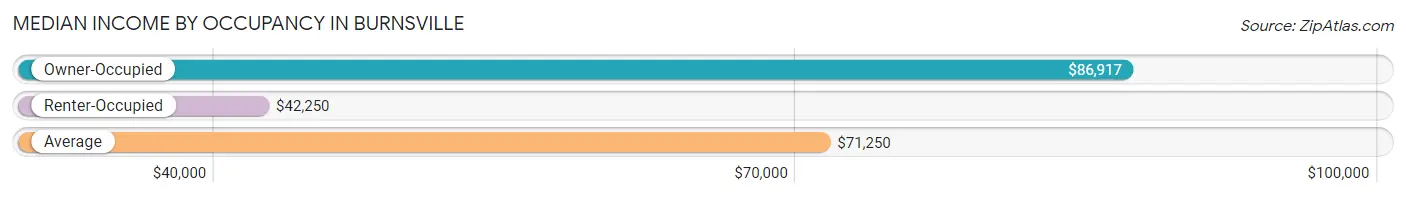
| Occupancy Type | # Households | Median Income |
| Owner-Occupied | 149 (69.6%) | $86,917 |
| Renter-Occupied | 65 (30.4%) | $42,250 |
| Average | 214 (100.0%) | $71,250 |
Occupancy by Householder Income Bracket in Burnsville
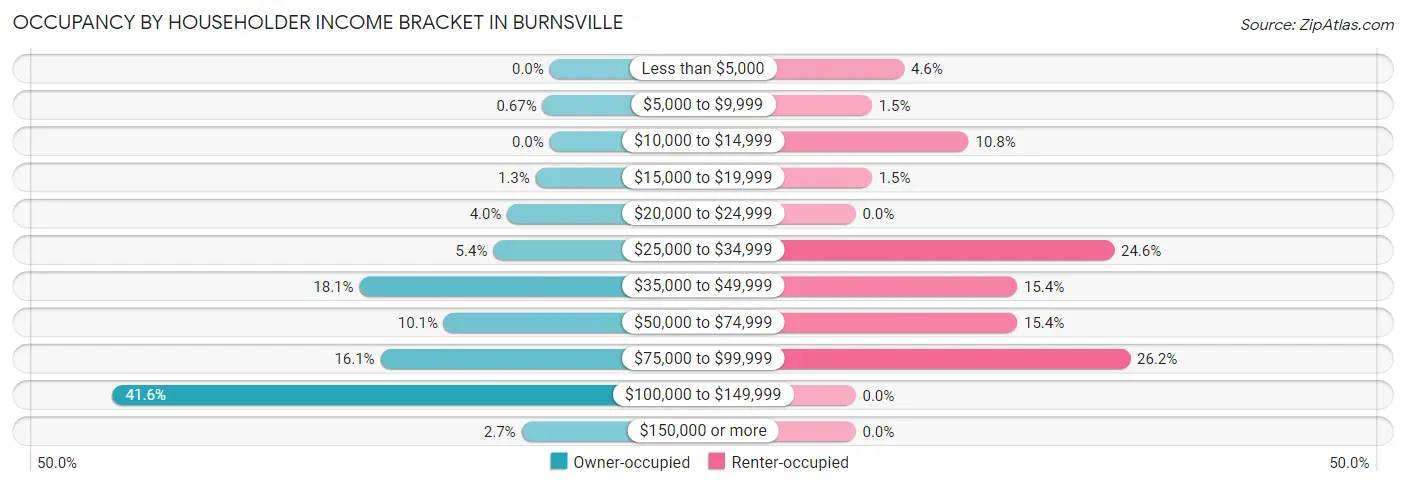
| Income Bracket | Owner-occupied | Renter-occupied |
| Less than $5,000 | 0 (0.0%) | 3 (4.6%) |
| $5,000 to $9,999 | 1 (0.7%) | 1 (1.5%) |
| $10,000 to $14,999 | 0 (0.0%) | 7 (10.8%) |
| $15,000 to $19,999 | 2 (1.3%) | 1 (1.5%) |
| $20,000 to $24,999 | 6 (4.0%) | 0 (0.0%) |
| $25,000 to $34,999 | 8 (5.4%) | 16 (24.6%) |
| $35,000 to $49,999 | 27 (18.1%) | 10 (15.4%) |
| $50,000 to $74,999 | 15 (10.1%) | 10 (15.4%) |
| $75,000 to $99,999 | 24 (16.1%) | 17 (26.2%) |
| $100,000 to $149,999 | 62 (41.6%) | 0 (0.0%) |
| $150,000 or more | 4 (2.7%) | 0 (0.0%) |
| Total | 149 (100.0%) | 65 (100.0%) |
Monthly Housing Cost Tiers in Burnsville
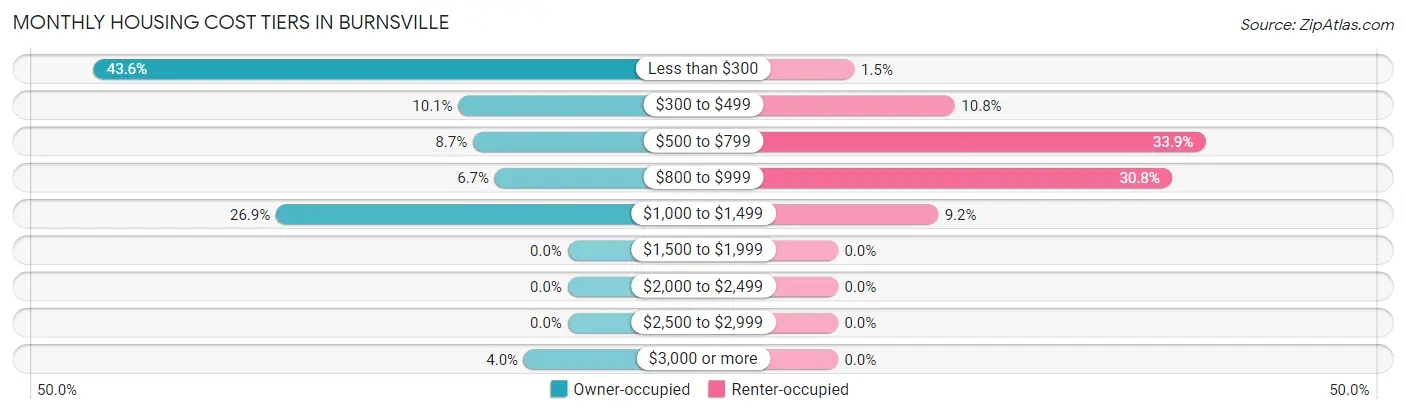
| Monthly Cost | Owner-occupied | Renter-occupied |
| Less than $300 | 65 (43.6%) | 1 (1.5%) |
| $300 to $499 | 15 (10.1%) | 7 (10.8%) |
| $500 to $799 | 13 (8.7%) | 22 (33.9%) |
| $800 to $999 | 10 (6.7%) | 20 (30.8%) |
| $1,000 to $1,499 | 40 (26.9%) | 6 (9.2%) |
| $1,500 to $1,999 | 0 (0.0%) | 0 (0.0%) |
| $2,000 to $2,499 | 0 (0.0%) | 0 (0.0%) |
| $2,500 to $2,999 | 0 (0.0%) | 0 (0.0%) |
| $3,000 or more | 6 (4.0%) | 0 (0.0%) |
| Total | 149 (100.0%) | 65 (100.0%) |
Physical Housing Characteristics in Burnsville
Housing Structures in Burnsville
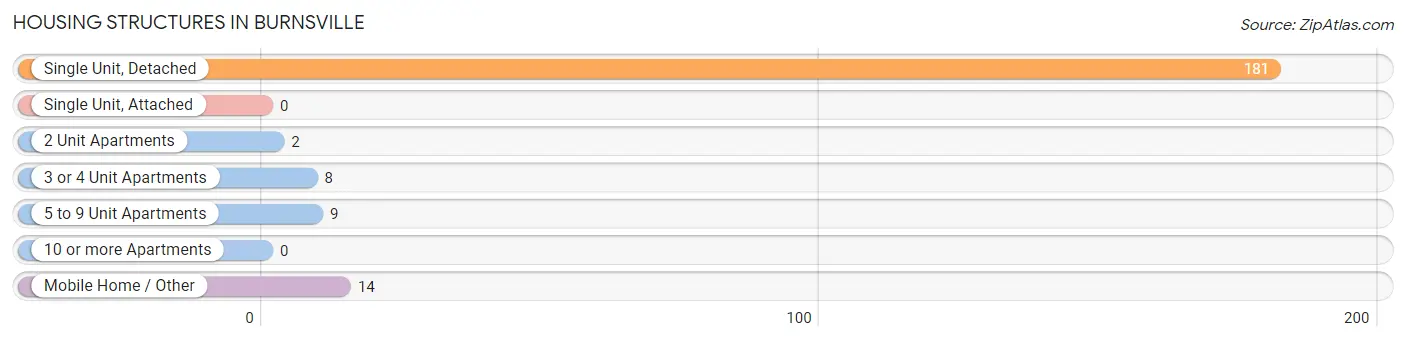
| Structure Type | # Housing Units | % Housing Units |
| Single Unit, Detached | 181 | 84.6% |
| Single Unit, Attached | 0 | 0.0% |
| 2 Unit Apartments | 2 | 0.9% |
| 3 or 4 Unit Apartments | 8 | 3.7% |
| 5 to 9 Unit Apartments | 9 | 4.2% |
| 10 or more Apartments | 0 | 0.0% |
| Mobile Home / Other | 14 | 6.5% |
| Total | 214 | 100.0% |
Housing Structures by Occupancy in Burnsville
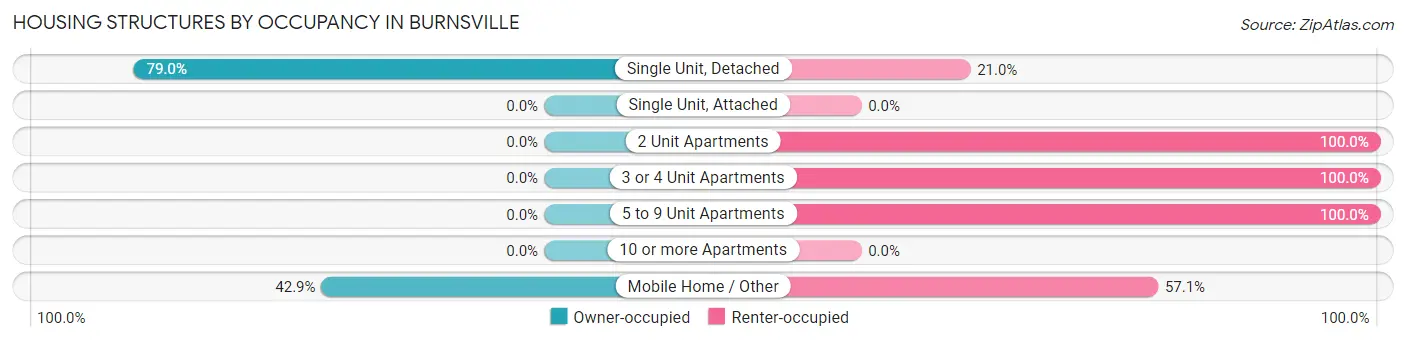
| Structure Type | Owner-occupied | Renter-occupied |
| Single Unit, Detached | 143 (79.0%) | 38 (21.0%) |
| Single Unit, Attached | 0 (0.0%) | 0 (0.0%) |
| 2 Unit Apartments | 0 (0.0%) | 2 (100.0%) |
| 3 or 4 Unit Apartments | 0 (0.0%) | 8 (100.0%) |
| 5 to 9 Unit Apartments | 0 (0.0%) | 9 (100.0%) |
| 10 or more Apartments | 0 (0.0%) | 0 (0.0%) |
| Mobile Home / Other | 6 (42.9%) | 8 (57.1%) |
| Total | 149 (69.6%) | 65 (30.4%) |
Housing Structures by Number of Rooms in Burnsville
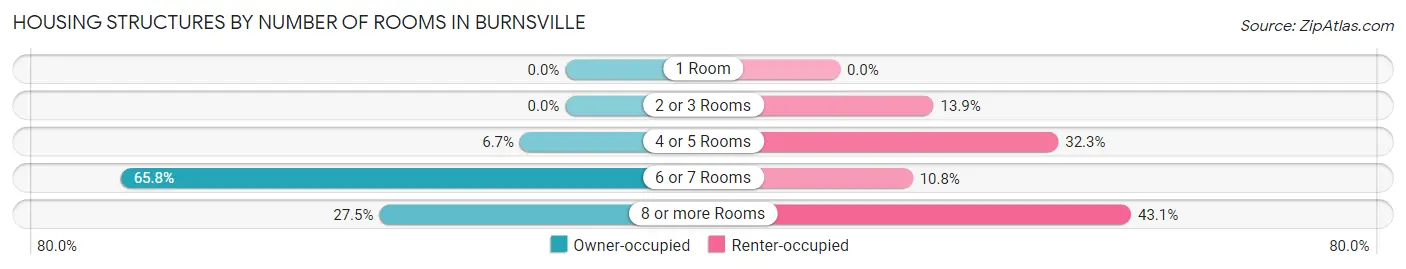
| Number of Rooms | Owner-occupied | Renter-occupied |
| 1 Room | 0 (0.0%) | 0 (0.0%) |
| 2 or 3 Rooms | 0 (0.0%) | 9 (13.9%) |
| 4 or 5 Rooms | 10 (6.7%) | 21 (32.3%) |
| 6 or 7 Rooms | 98 (65.8%) | 7 (10.8%) |
| 8 or more Rooms | 41 (27.5%) | 28 (43.1%) |
| Total | 149 (100.0%) | 65 (100.0%) |
Housing Structure by Heating Type in Burnsville
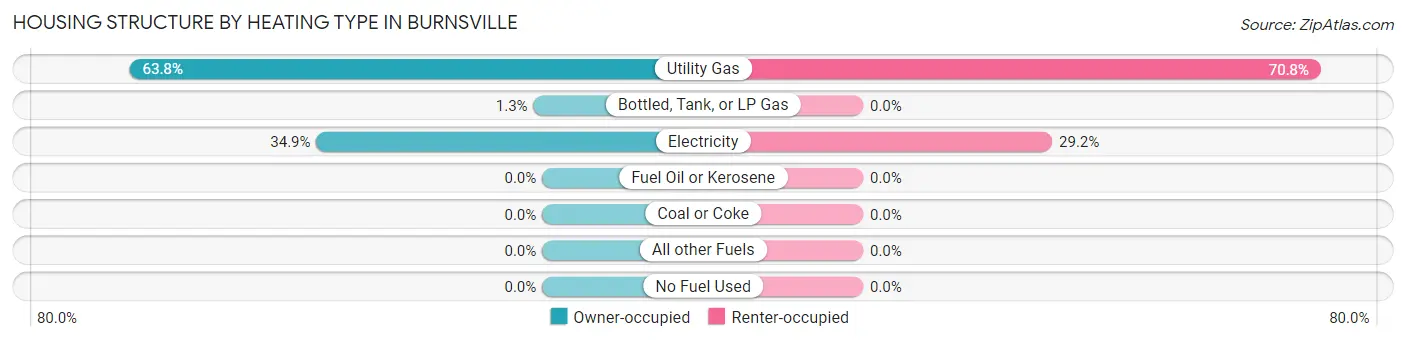
| Heating Type | Owner-occupied | Renter-occupied |
| Utility Gas | 95 (63.8%) | 46 (70.8%) |
| Bottled, Tank, or LP Gas | 2 (1.3%) | 0 (0.0%) |
| Electricity | 52 (34.9%) | 19 (29.2%) |
| Fuel Oil or Kerosene | 0 (0.0%) | 0 (0.0%) |
| Coal or Coke | 0 (0.0%) | 0 (0.0%) |
| All other Fuels | 0 (0.0%) | 0 (0.0%) |
| No Fuel Used | 0 (0.0%) | 0 (0.0%) |
| Total | 149 (100.0%) | 65 (100.0%) |
Household Vehicle Usage in Burnsville
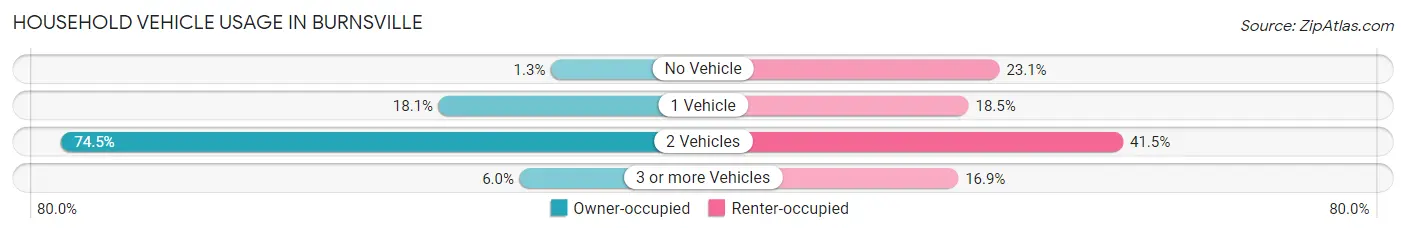
| Vehicles per Household | Owner-occupied | Renter-occupied |
| No Vehicle | 2 (1.3%) | 15 (23.1%) |
| 1 Vehicle | 27 (18.1%) | 12 (18.5%) |
| 2 Vehicles | 111 (74.5%) | 27 (41.5%) |
| 3 or more Vehicles | 9 (6.0%) | 11 (16.9%) |
| Total | 149 (100.0%) | 65 (100.0%) |
Real Estate & Mortgages in Burnsville
Real Estate and Mortgage Overview in Burnsville
| Characteristic | Without Mortgage | With Mortgage |
| Housing Units | 94 | 55 |
| Median Property Value | $92,700 | $129,700 |
| Median Household Income | $88,500 | $0 |
| Monthly Housing Costs | $241 | $0 |
| Real Estate Taxes | $485 | $0 |
Property Value by Mortgage Status in Burnsville
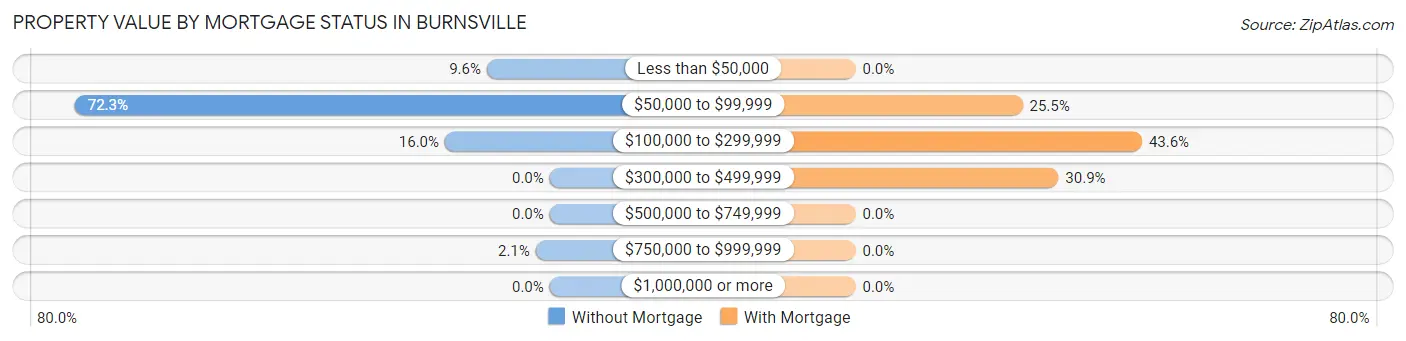
| Property Value | Without Mortgage | With Mortgage |
| Less than $50,000 | 9 (9.6%) | 0 (0.0%) |
| $50,000 to $99,999 | 68 (72.3%) | 14 (25.5%) |
| $100,000 to $299,999 | 15 (16.0%) | 24 (43.6%) |
| $300,000 to $499,999 | 0 (0.0%) | 17 (30.9%) |
| $500,000 to $749,999 | 0 (0.0%) | 0 (0.0%) |
| $750,000 to $999,999 | 2 (2.1%) | 0 (0.0%) |
| $1,000,000 or more | 0 (0.0%) | 0 (0.0%) |
| Total | 94 (100.0%) | 55 (100.0%) |
Household Income by Mortgage Status in Burnsville
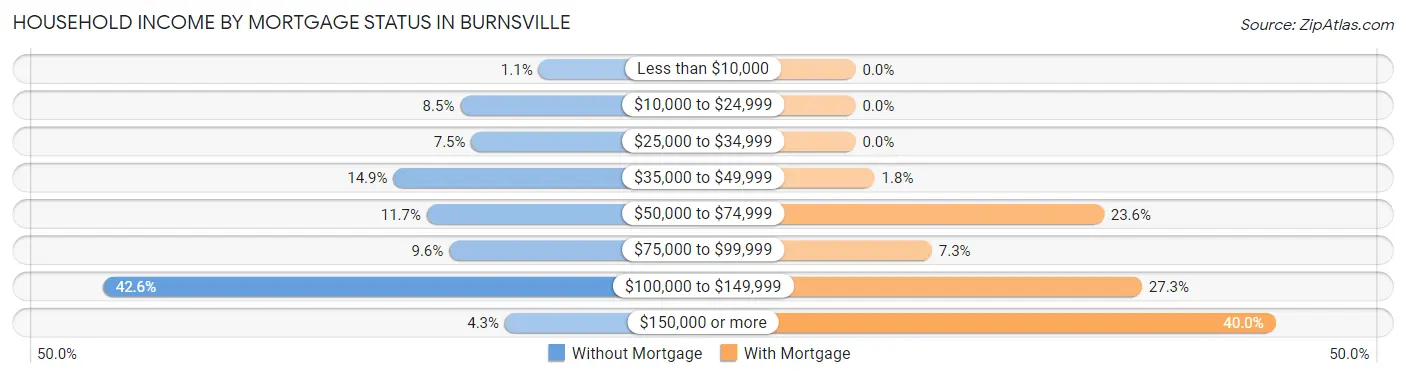
| Household Income | Without Mortgage | With Mortgage |
| Less than $10,000 | 1 (1.1%) | 0 (0.0%) |
| $10,000 to $24,999 | 8 (8.5%) | 0 (0.0%) |
| $25,000 to $34,999 | 7 (7.4%) | 0 (0.0%) |
| $35,000 to $49,999 | 14 (14.9%) | 1 (1.8%) |
| $50,000 to $74,999 | 11 (11.7%) | 13 (23.6%) |
| $75,000 to $99,999 | 9 (9.6%) | 4 (7.3%) |
| $100,000 to $149,999 | 40 (42.5%) | 15 (27.3%) |
| $150,000 or more | 4 (4.3%) | 22 (40.0%) |
| Total | 94 (100.0%) | 55 (100.0%) |
Property Value to Household Income Ratio in Burnsville
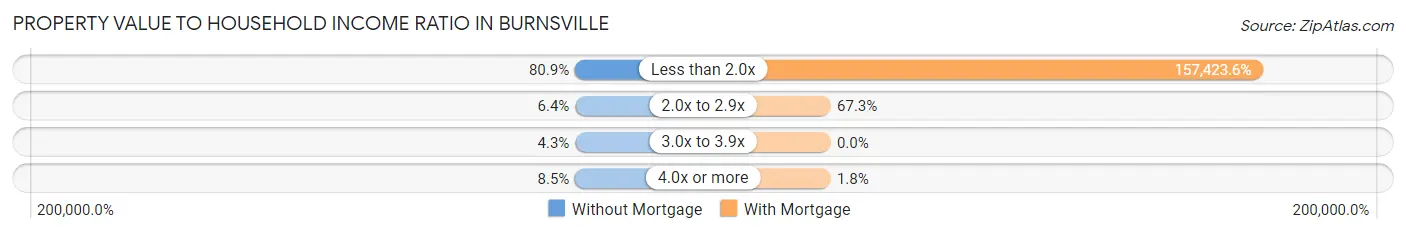
| Value-to-Income Ratio | Without Mortgage | With Mortgage |
| Less than 2.0x | 76 (80.8%) | 86,583 (157,423.6%) |
| 2.0x to 2.9x | 6 (6.4%) | 37 (67.3%) |
| 3.0x to 3.9x | 4 (4.3%) | 0 (0.0%) |
| 4.0x or more | 8 (8.5%) | 1 (1.8%) |
| Total | 94 (100.0%) | 55 (100.0%) |
Real Estate Taxes by Mortgage Status in Burnsville
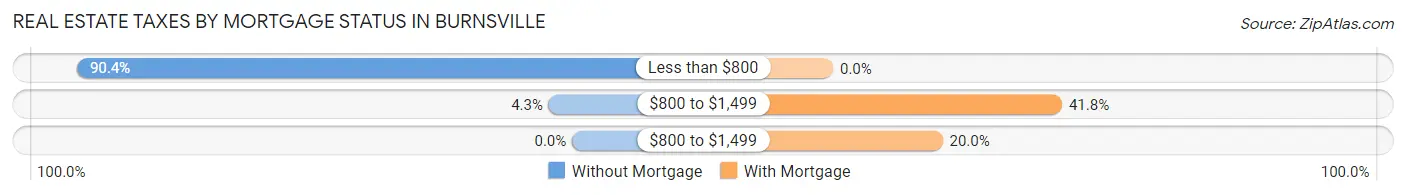
| Property Taxes | Without Mortgage | With Mortgage |
| Less than $800 | 85 (90.4%) | 0 (0.0%) |
| $800 to $1,499 | 4 (4.3%) | 23 (41.8%) |
| $800 to $1,499 | 0 (0.0%) | 11 (20.0%) |
| Total | 94 (100.0%) | 55 (100.0%) |
Health & Disability in Burnsville
Health Insurance Coverage by Age in Burnsville
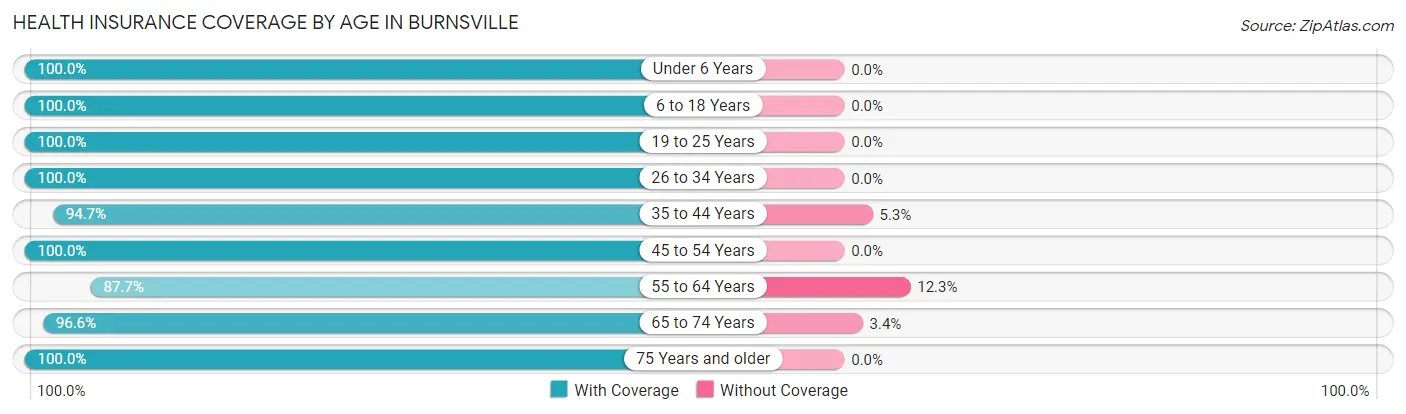
| Age Bracket | With Coverage | Without Coverage |
| Under 6 Years | 6 (100.0%) | 0 (0.0%) |
| 6 to 18 Years | 151 (100.0%) | 0 (0.0%) |
| 19 to 25 Years | 15 (100.0%) | 0 (0.0%) |
| 26 to 34 Years | 73 (100.0%) | 0 (0.0%) |
| 35 to 44 Years | 36 (94.7%) | 2 (5.3%) |
| 45 to 54 Years | 47 (100.0%) | 0 (0.0%) |
| 55 to 64 Years | 57 (87.7%) | 8 (12.3%) |
| 65 to 74 Years | 85 (96.6%) | 3 (3.4%) |
| 75 Years and older | 26 (100.0%) | 0 (0.0%) |
| Total | 496 (97.5%) | 13 (2.5%) |
Health Insurance Coverage by Citizenship Status in Burnsville
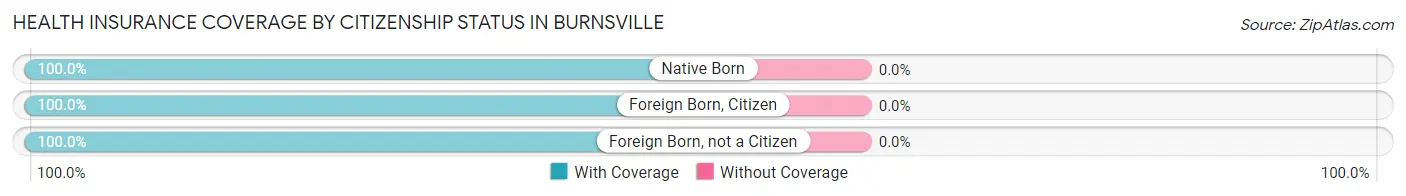
| Citizenship Status | With Coverage | Without Coverage |
| Native Born | 6 (100.0%) | 0 (0.0%) |
| Foreign Born, Citizen | 151 (100.0%) | 0 (0.0%) |
| Foreign Born, not a Citizen | 15 (100.0%) | 0 (0.0%) |
Health Insurance Coverage by Household Income in Burnsville
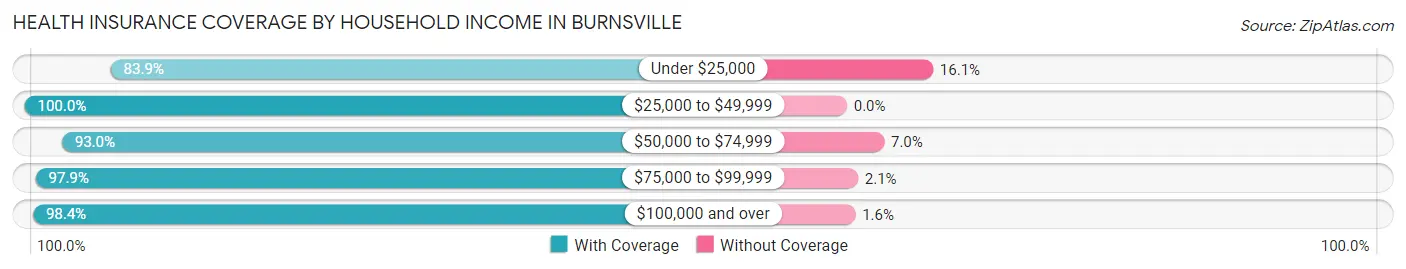
| Household Income | With Coverage | Without Coverage |
| Under $25,000 | 26 (83.9%) | 5 (16.1%) |
| $25,000 to $49,999 | 163 (100.0%) | 0 (0.0%) |
| $50,000 to $74,999 | 40 (93.0%) | 3 (7.0%) |
| $75,000 to $99,999 | 142 (97.9%) | 3 (2.1%) |
| $100,000 and over | 125 (98.4%) | 2 (1.6%) |
Public vs Private Health Insurance Coverage by Age in Burnsville
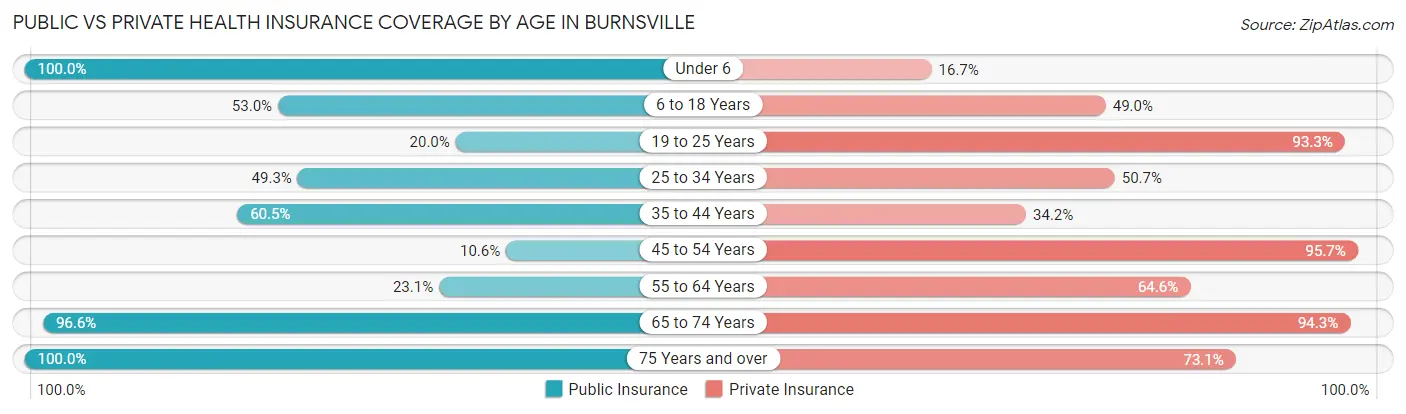
| Age Bracket | Public Insurance | Private Insurance |
| Under 6 | 6 (100.0%) | 1 (16.7%) |
| 6 to 18 Years | 80 (53.0%) | 74 (49.0%) |
| 19 to 25 Years | 3 (20.0%) | 14 (93.3%) |
| 25 to 34 Years | 36 (49.3%) | 37 (50.7%) |
| 35 to 44 Years | 23 (60.5%) | 13 (34.2%) |
| 45 to 54 Years | 5 (10.6%) | 45 (95.7%) |
| 55 to 64 Years | 15 (23.1%) | 42 (64.6%) |
| 65 to 74 Years | 85 (96.6%) | 83 (94.3%) |
| 75 Years and over | 26 (100.0%) | 19 (73.1%) |
| Total | 279 (54.8%) | 328 (64.4%) |
Disability Status by Sex by Age in Burnsville
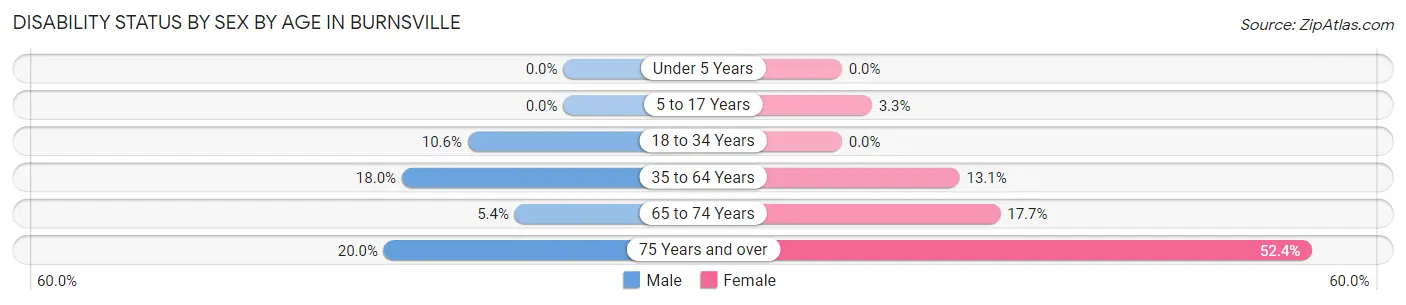
| Age Bracket | Male | Female |
| Under 5 Years | 0 (0.0%) | 0 (0.0%) |
| 5 to 17 Years | 0 (0.0%) | 1 (3.3%) |
| 18 to 34 Years | 5 (10.6%) | 0 (0.0%) |
| 35 to 64 Years | 16 (18.0%) | 8 (13.1%) |
| 65 to 74 Years | 2 (5.4%) | 9 (17.6%) |
| 75 Years and over | 1 (20.0%) | 11 (52.4%) |
Disability Class by Sex by Age in Burnsville
Disability Class: Hearing Difficulty
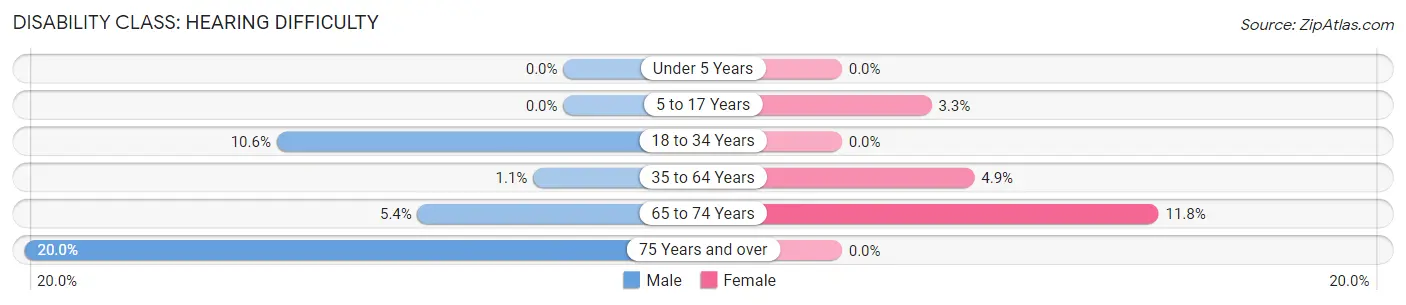
| Age Bracket | Male | Female |
| Under 5 Years | 0 (0.0%) | 0 (0.0%) |
| 5 to 17 Years | 0 (0.0%) | 1 (3.3%) |
| 18 to 34 Years | 5 (10.6%) | 0 (0.0%) |
| 35 to 64 Years | 1 (1.1%) | 3 (4.9%) |
| 65 to 74 Years | 2 (5.4%) | 6 (11.8%) |
| 75 Years and over | 1 (20.0%) | 0 (0.0%) |
Disability Class: Vision Difficulty
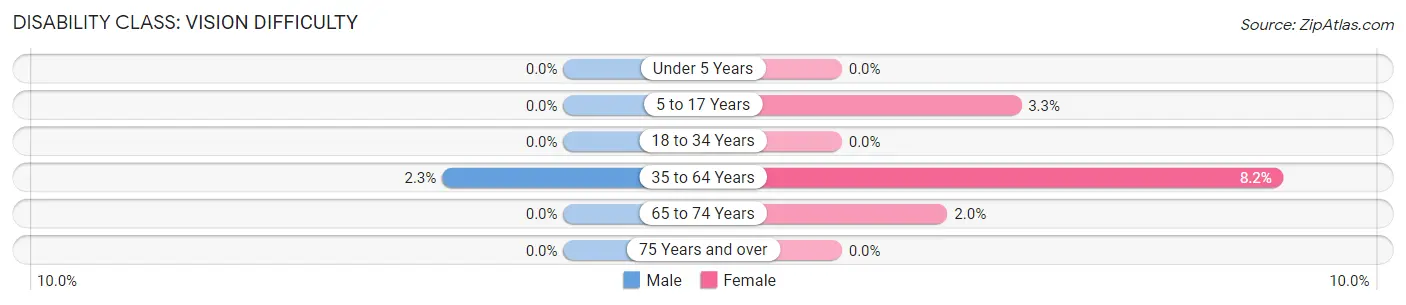
| Age Bracket | Male | Female |
| Under 5 Years | 0 (0.0%) | 0 (0.0%) |
| 5 to 17 Years | 0 (0.0%) | 1 (3.3%) |
| 18 to 34 Years | 0 (0.0%) | 0 (0.0%) |
| 35 to 64 Years | 2 (2.2%) | 5 (8.2%) |
| 65 to 74 Years | 0 (0.0%) | 1 (2.0%) |
| 75 Years and over | 0 (0.0%) | 0 (0.0%) |
Disability Class: Cognitive Difficulty
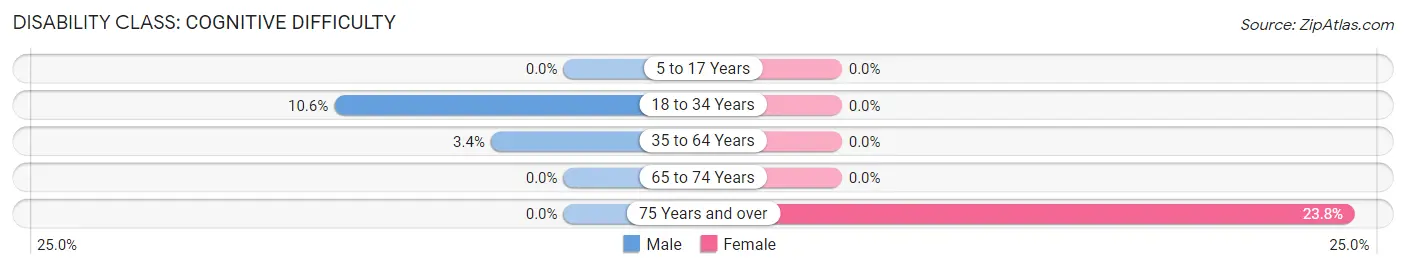
| Age Bracket | Male | Female |
| 5 to 17 Years | 0 (0.0%) | 0 (0.0%) |
| 18 to 34 Years | 5 (10.6%) | 0 (0.0%) |
| 35 to 64 Years | 3 (3.4%) | 0 (0.0%) |
| 65 to 74 Years | 0 (0.0%) | 0 (0.0%) |
| 75 Years and over | 0 (0.0%) | 5 (23.8%) |
Disability Class: Ambulatory Difficulty
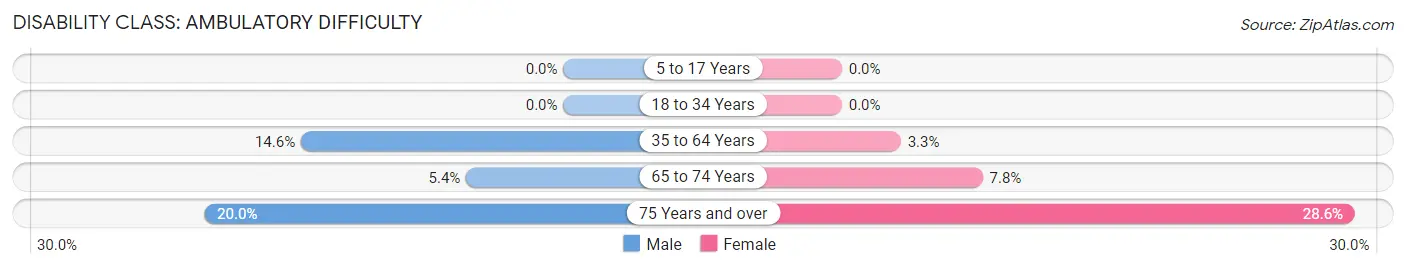
| Age Bracket | Male | Female |
| 5 to 17 Years | 0 (0.0%) | 0 (0.0%) |
| 18 to 34 Years | 0 (0.0%) | 0 (0.0%) |
| 35 to 64 Years | 13 (14.6%) | 2 (3.3%) |
| 65 to 74 Years | 2 (5.4%) | 4 (7.8%) |
| 75 Years and over | 1 (20.0%) | 6 (28.6%) |
Disability Class: Self-Care Difficulty
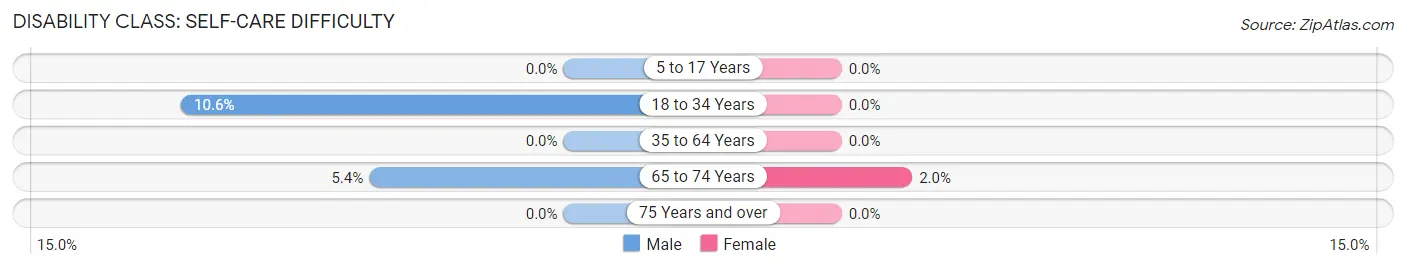
| Age Bracket | Male | Female |
| 5 to 17 Years | 0 (0.0%) | 0 (0.0%) |
| 18 to 34 Years | 5 (10.6%) | 0 (0.0%) |
| 35 to 64 Years | 0 (0.0%) | 0 (0.0%) |
| 65 to 74 Years | 2 (5.4%) | 1 (2.0%) |
| 75 Years and over | 0 (0.0%) | 0 (0.0%) |
Technology Access in Burnsville
Computing Device Access in Burnsville
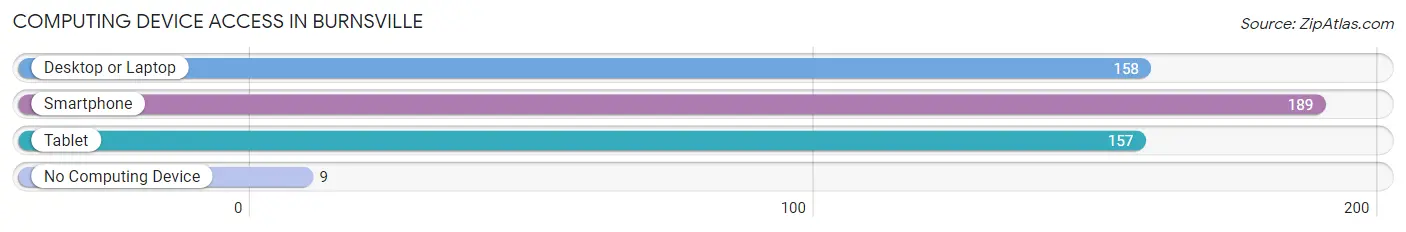
| Device Type | # Households | % Households |
| Desktop or Laptop | 158 | 73.8% |
| Smartphone | 189 | 88.3% |
| Tablet | 157 | 73.4% |
| No Computing Device | 9 | 4.2% |
| Total | 214 | 100.0% |
Internet Access in Burnsville
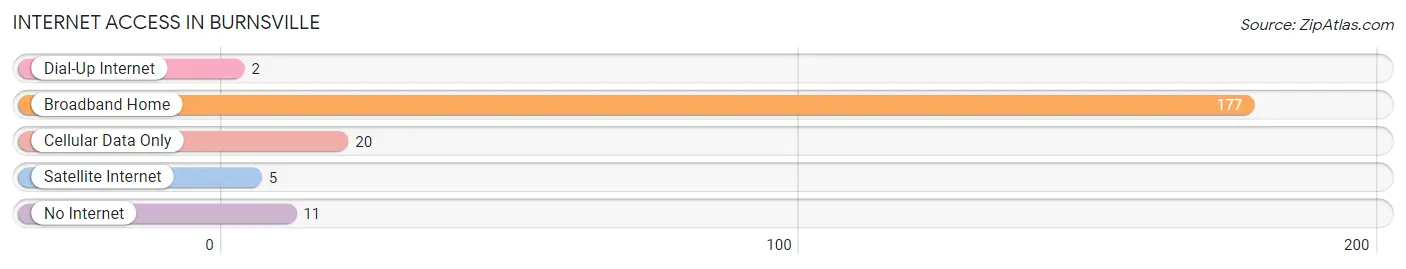
| Internet Type | # Households | % Households |
| Dial-Up Internet | 2 | 0.9% |
| Broadband Home | 177 | 82.7% |
| Cellular Data Only | 20 | 9.3% |
| Satellite Internet | 5 | 2.3% |
| No Internet | 11 | 5.1% |
| Total | 214 | 100.0% |
Burnsville Summary
Burnsville, West Virginia is a small town located in Braxton County in the central part of the state. It is situated along the Elk River, and is the county seat of Braxton County. The town was founded in 1832 and named after William Burns, a local landowner. The population of Burnsville was 1,845 at the 2010 census.
Geography
Burnsville is located at 38°45'25" North, 80°45'25" West (38.756944, -80.756944). It is situated in the Appalachian Mountains, and is surrounded by the Elk River and its tributaries. The town is located in the Elk River Valley, and is surrounded by hills and mountains. The highest point in the area is Big Run Mountain, which rises to an elevation of 2,845 feet.
The climate in Burnsville is humid continental, with hot summers and cold winters. The average annual temperature is 54°F, and the average annual precipitation is 42 inches.
Economy
The economy of Burnsville is largely based on agriculture and tourism. The town is home to several small businesses, including a grocery store, a hardware store, and a restaurant. The town also has a small industrial park, which is home to several manufacturing companies.
The town is also home to several tourist attractions, including the Burnsville Historical Museum, the Burnsville Lake State Park, and the Elk River Wildlife Management Area.
Demographics
As of the 2010 census, the population of Burnsville was 1,845. The racial makeup of the town was 97.2% White, 0.7% African American, 0.2% Native American, 0.2% Asian, 0.1% Pacific Islander, 0.2% from other races, and 1.0% from two or more races. Hispanic or Latino of any race were 0.7% of the population.
The median income for a household in Burnsville was $30,938, and the median income for a family was $37,917. The per capita income for the town was $17,845. About 16.2% of families and 19.2% of the population were below the poverty line, including 25.2% of those under age 18 and 11.2% of those age 65 or over.
Education
Burnsville is served by the Braxton County School District. The town has one elementary school, one middle school, and one high school. The town also has a public library, which is part of the West Virginia Library Commission.
Conclusion
Burnsville, West Virginia is a small town located in Braxton County in the central part of the state. It is situated along the Elk River, and is the county seat of Braxton County. The town was founded in 1832 and named after William Burns, a local landowner. The economy of Burnsville is largely based on agriculture and tourism, and the town is home to several small businesses, tourist attractions, and educational institutions. The population of Burnsville was 1,845 at the 2010 census, and the racial makeup of the town was 97.2% White, 0.7% African American, 0.2% Native American, 0.2% Asian, 0.1% Pacific Islander, 0.2% from other races, and 1.0% from two or more races. The median income for a household in Burnsville was $30,938, and the median income for a family was $37,917. The per capita income for the town was $17,845. About 16.2% of families and 19.2% of the population were below the poverty line.
Common Questions
What is Per Capita Income in Burnsville?
Per Capita income in Burnsville is $29,266.
What is the Median Family Income in Burnsville?
Median Family Income in Burnsville is $86,083.
What is the Median Household income in Burnsville?
Median Household Income in Burnsville is $71,250.
What is Inequality or Gini Index in Burnsville?
Inequality or Gini Index in Burnsville is 0.29.
What is the Total Population of Burnsville?
Total Population of Burnsville is 509.
What is the Total Male Population of Burnsville?
Total Male Population of Burnsville is 296.
What is the Total Female Population of Burnsville?
Total Female Population of Burnsville is 213.
What is the Ratio of Males per 100 Females in Burnsville?
There are 138.97 Males per 100 Females in Burnsville.
What is the Ratio of Females per 100 Males in Burnsville?
There are 71.96 Females per 100 Males in Burnsville.
What is the Median Population Age in Burnsville?
Median Population Age in Burnsville is 35.7 Years.
What is the Average Family Size in Burnsville
Average Family Size in Burnsville is 2.9 People.
What is the Average Household Size in Burnsville
Average Household Size in Burnsville is 2.4 People.
How Large is the Labor Force in Burnsville?
There are 219 People in the Labor Forcein in Burnsville.
What is the Percentage of People in the Labor Force in Burnsville?
59.2% of People are in the Labor Force in Burnsville.
What is the Unemployment Rate in Burnsville?
Unemployment Rate in Burnsville is 11.0%.