Buckhannon, WV Map & Demographics
Buckhannon Map
Buckhannon Overview
$24,155
PER CAPITA INCOME
$59,605
AVG FAMILY INCOME
$43,621
AVG HOUSEHOLD INCOME
25.0%
WAGE / INCOME GAP [ % ]
75.0¢/ $1
WAGE / INCOME GAP [ $ ]
0.46
INEQUALITY / GINI INDEX
5,201
TOTAL POPULATION
2,657
MALE POPULATION
2,544
FEMALE POPULATION
104.44
MALES / 100 FEMALES
95.75
FEMALES / 100 MALES
35.8
MEDIAN AGE
2.9
AVG FAMILY SIZE
2.0
AVG HOUSEHOLD SIZE
2,119
LABOR FORCE [ PEOPLE ]
47.1%
PERCENT IN LABOR FORCE
6.1%
UNEMPLOYMENT RATE
Buckhannon Zip Codes
Buckhannon Area Codes
Income in Buckhannon
Income Overview in Buckhannon
Per Capita Income in Buckhannon is $24,155, while median incomes of families and households are $59,605 and $43,621 respectively.
| Characteristic | Number | Measure |
| Per Capita Income | 5,201 | $24,155 |
| Median Family Income | 994 | $59,605 |
| Mean Family Income | 994 | $70,747 |
| Median Household Income | 2,010 | $43,621 |
| Mean Household Income | 2,010 | $58,939 |
| Income Deficit | 994 | $0 |
| Wage / Income Gap (%) | 5,201 | 25.05% |
| Wage / Income Gap ($) | 5,201 | 74.95¢ per $1 |
| Gini / Inequality Index | 5,201 | 0.46 |
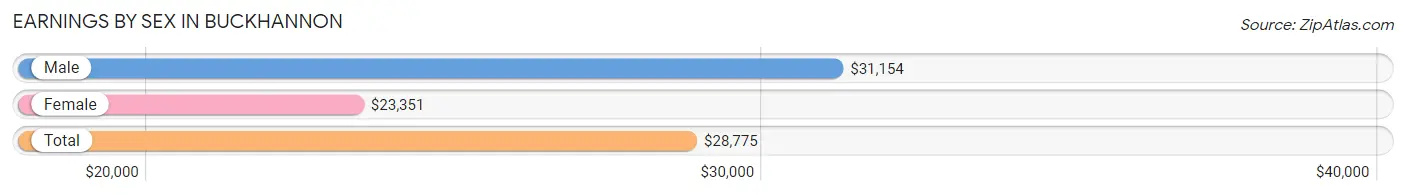
Earnings by Sex in Buckhannon
Average Earnings in Buckhannon are $28,775, $31,154 for men and $23,351 for women, a difference of 25.1%.
| Sex | Number | Average Earnings |
| Male | 1,232 (52.0%) | $31,154 |
| Female | 1,136 (48.0%) | $23,351 |
| Total | 2,368 (100.0%) | $28,775 |
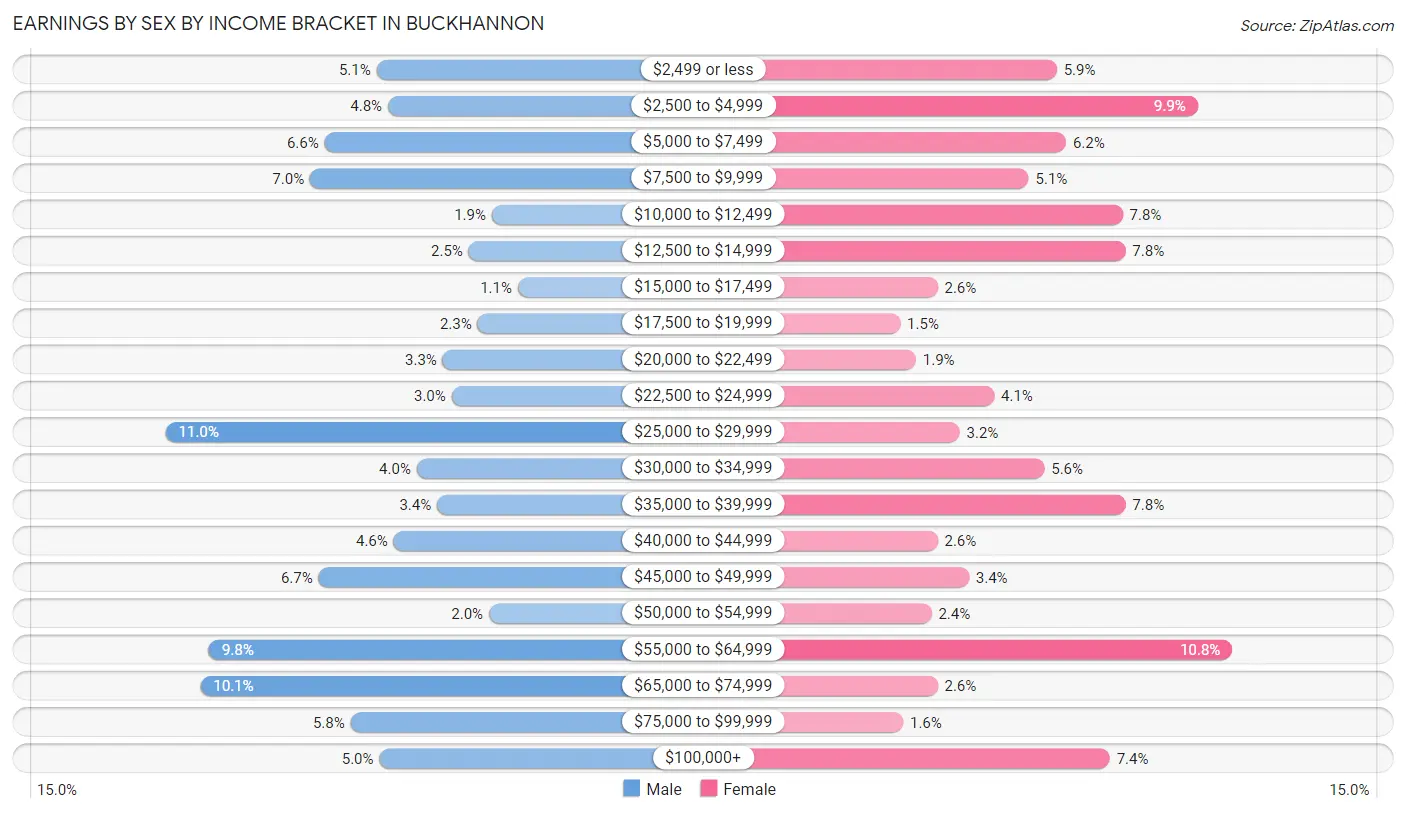
Earnings by Sex by Income Bracket in Buckhannon
The most common earnings brackets in Buckhannon are $25,000 to $29,999 for men (136 | 11.0%) and $55,000 to $64,999 for women (123 | 10.8%).
| Income | Male | Female |
| $2,499 or less | 63 (5.1%) | 67 (5.9%) |
| $2,500 to $4,999 | 59 (4.8%) | 112 (9.9%) |
| $5,000 to $7,499 | 81 (6.6%) | 70 (6.2%) |
| $7,500 to $9,999 | 86 (7.0%) | 58 (5.1%) |
| $10,000 to $12,499 | 23 (1.9%) | 88 (7.7%) |
| $12,500 to $14,999 | 31 (2.5%) | 89 (7.8%) |
| $15,000 to $17,499 | 14 (1.1%) | 29 (2.5%) |
| $17,500 to $19,999 | 28 (2.3%) | 17 (1.5%) |
| $20,000 to $22,499 | 40 (3.3%) | 22 (1.9%) |
| $22,500 to $24,999 | 37 (3.0%) | 47 (4.1%) |
| $25,000 to $29,999 | 136 (11.0%) | 36 (3.2%) |
| $30,000 to $34,999 | 49 (4.0%) | 63 (5.6%) |
| $35,000 to $39,999 | 42 (3.4%) | 89 (7.8%) |
| $40,000 to $44,999 | 57 (4.6%) | 29 (2.5%) |
| $45,000 to $49,999 | 83 (6.7%) | 39 (3.4%) |
| $50,000 to $54,999 | 24 (1.9%) | 27 (2.4%) |
| $55,000 to $64,999 | 121 (9.8%) | 123 (10.8%) |
| $65,000 to $74,999 | 124 (10.1%) | 29 (2.5%) |
| $75,000 to $99,999 | 72 (5.8%) | 18 (1.6%) |
| $100,000+ | 62 (5.0%) | 84 (7.4%) |
| Total | 1,232 (100.0%) | 1,136 (100.0%) |
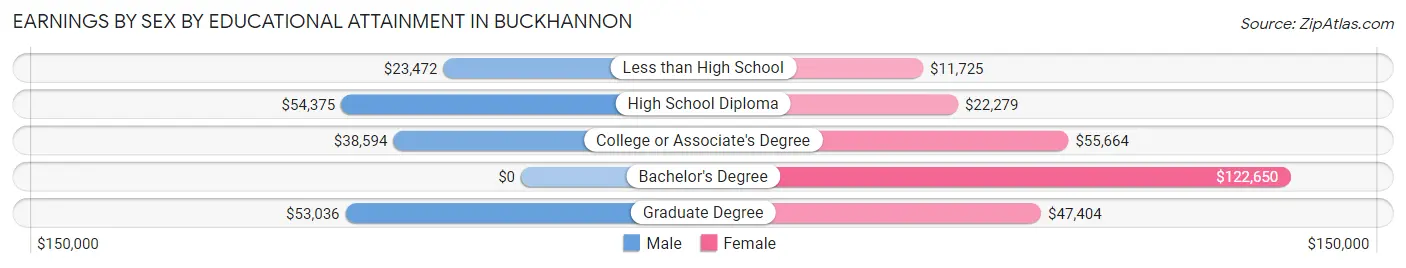
Earnings by Sex by Educational Attainment in Buckhannon
Average earnings in Buckhannon are $43,523 for men and $35,302 for women, a difference of 18.9%. Men with an educational attainment of high school diploma enjoy the highest average annual earnings of $54,375, while those with less than high school education earn the least with $23,472. Women with an educational attainment of bachelor's degree earn the most with the average annual earnings of $122,650, while those with less than high school education have the smallest earnings of $11,725.
| Educational Attainment | Male Income | Female Income |
| Less than High School | $23,472 | $11,725 |
| High School Diploma | $54,375 | $22,279 |
| College or Associate's Degree | $38,594 | $55,664 |
| Bachelor's Degree | - | - |
| Graduate Degree | $53,036 | $47,404 |
| Total | $43,523 | $35,302 |
Family Income in Buckhannon
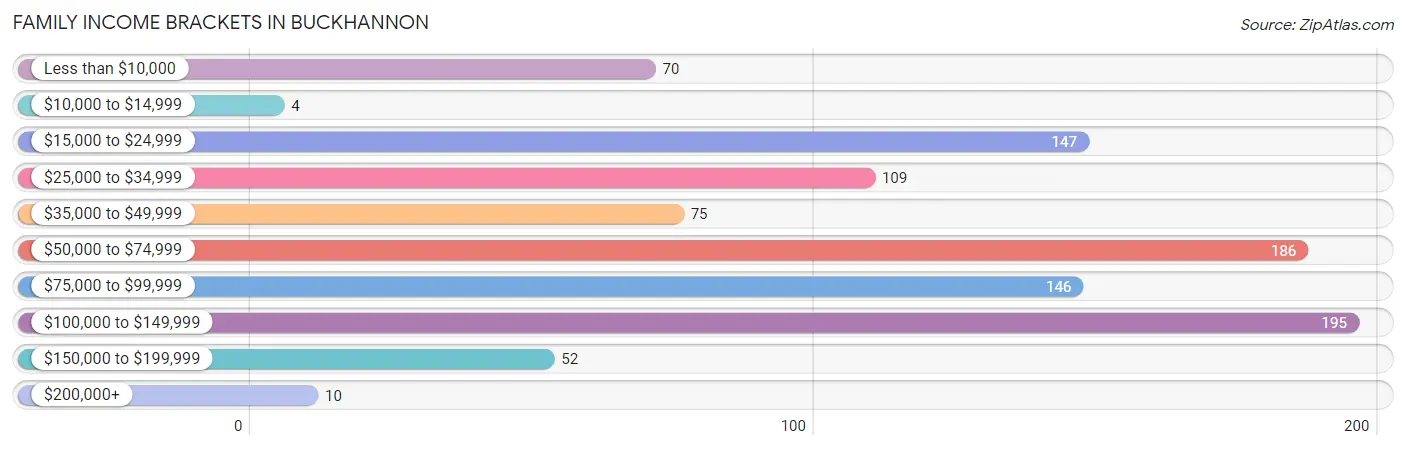
Family Income Brackets in Buckhannon
According to the Buckhannon family income data, there are 195 families falling into the $100,000 to $149,999 income range, which is the most common income bracket and makes up 19.6% of all families. Conversely, the $10,000 to $14,999 income bracket is the least frequent group with only 4 families (0.4%) belonging to this category.
| Income Bracket | # Families | % Families |
| Less than $10,000 | 70 | 7.0% |
| $10,000 to $14,999 | 4 | 0.4% |
| $15,000 to $24,999 | 147 | 14.8% |
| $25,000 to $34,999 | 109 | 11.0% |
| $35,000 to $49,999 | 75 | 7.5% |
| $50,000 to $74,999 | 186 | 18.7% |
| $75,000 to $99,999 | 146 | 14.7% |
| $100,000 to $149,999 | 195 | 19.6% |
| $150,000 to $199,999 | 52 | 5.2% |
| $200,000+ | 10 | 1.0% |
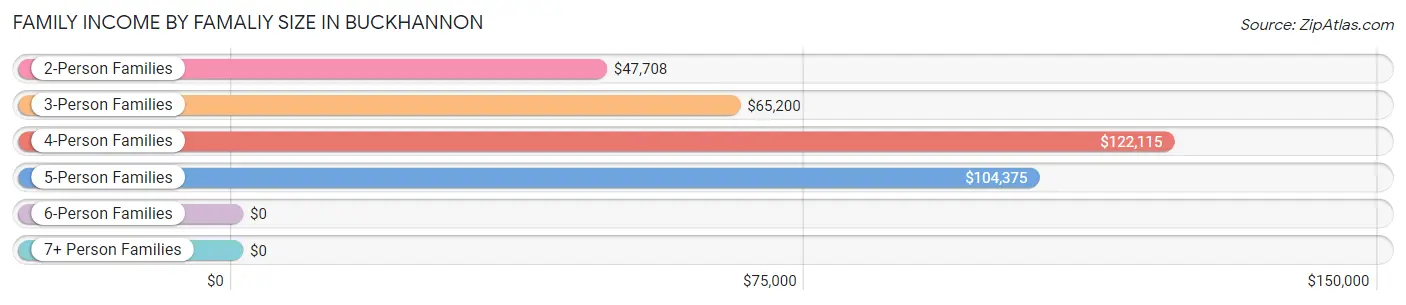
Family Income by Famaliy Size in Buckhannon
4-person families (114 | 11.5%) account for the highest median family income in Buckhannon with $122,115 per family, while 4-person families (114 | 11.5%) have the highest median income of $30,529 per family member.
| Income Bracket | # Families | Median Income |
| 2-Person Families | 455 (45.8%) | $47,708 |
| 3-Person Families | 340 (34.2%) | $65,200 |
| 4-Person Families | 114 (11.5%) | $122,115 |
| 5-Person Families | 85 (8.6%) | $104,375 |
| 6-Person Families | 0 (0.0%) | $0 |
| 7+ Person Families | 0 (0.0%) | $0 |
| Total | 994 (100.0%) | $59,605 |
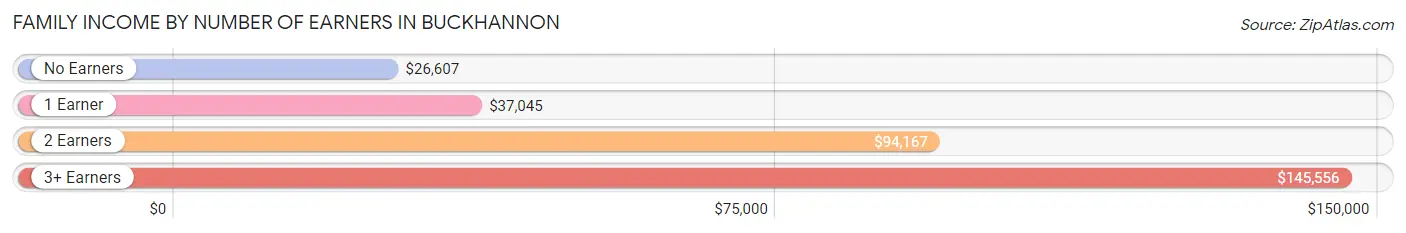
Family Income by Number of Earners in Buckhannon
The median family income in Buckhannon is $59,605, with families comprising 3+ earners (28) having the highest median family income of $145,556, while families with no earners (238) have the lowest median family income of $26,607, accounting for 2.8% and 23.9% of families, respectively.
| Number of Earners | # Families | Median Income |
| No Earners | 238 (23.9%) | $26,607 |
| 1 Earner | 320 (32.2%) | $37,045 |
| 2 Earners | 408 (41.0%) | $94,167 |
| 3+ Earners | 28 (2.8%) | $145,556 |
| Total | 994 (100.0%) | $59,605 |
Household Income in Buckhannon
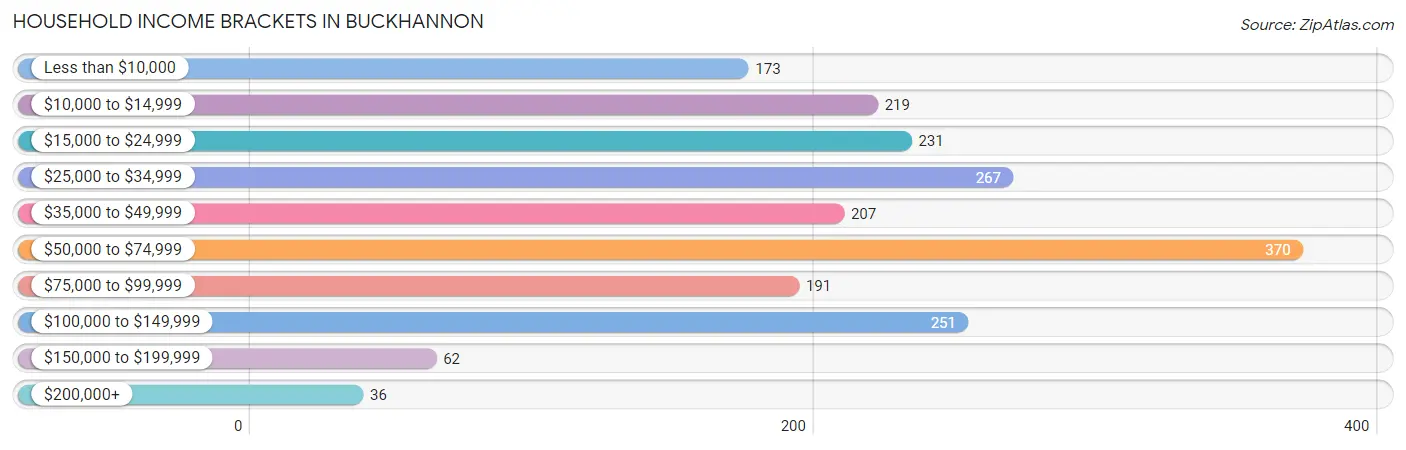
Household Income Brackets in Buckhannon
With 370 households falling in the category, the $50,000 to $74,999 income range is the most frequent in Buckhannon, accounting for 18.4% of all households. In contrast, only 36 households (1.8%) fall into the $200,000+ income bracket, making it the least populous group.
| Income Bracket | # Households | % Households |
| Less than $10,000 | 173 | 8.6% |
| $10,000 to $14,999 | 219 | 10.9% |
| $15,000 to $24,999 | 231 | 11.5% |
| $25,000 to $34,999 | 267 | 13.3% |
| $35,000 to $49,999 | 207 | 10.3% |
| $50,000 to $74,999 | 370 | 18.4% |
| $75,000 to $99,999 | 191 | 9.5% |
| $100,000 to $149,999 | 251 | 12.5% |
| $150,000 to $199,999 | 62 | 3.1% |
| $200,000+ | 36 | 1.8% |
Household Income by Householder Age in Buckhannon
The median household income in Buckhannon is $43,621, with the highest median household income of $92,951 found in the 15 to 24 years age bracket for the primary householder. A total of 87 households (4.3%) fall into this category. Meanwhile, the 45 to 64 years age bracket for the primary householder has the lowest median household income of $28,523, with 812 households (40.4%) in this group.
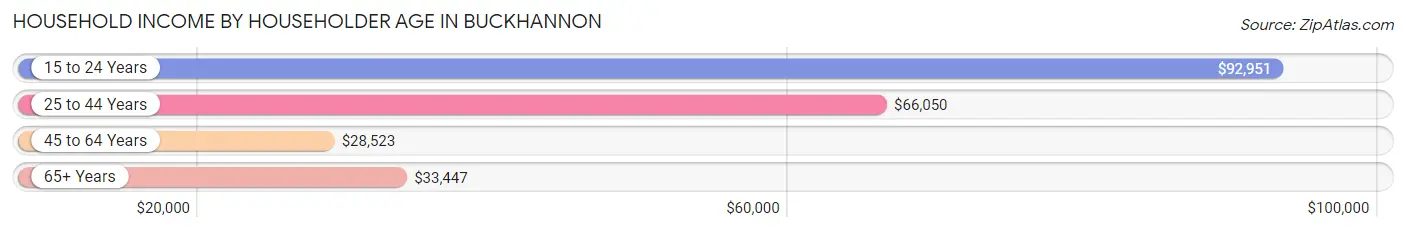
| Income Bracket | # Households | Median Income |
| 15 to 24 Years | 87 (4.3%) | $92,951 |
| 25 to 44 Years | 532 (26.5%) | $66,050 |
| 45 to 64 Years | 812 (40.4%) | $28,523 |
| 65+ Years | 579 (28.8%) | $33,447 |
| Total | 2,010 (100.0%) | $43,621 |
Poverty in Buckhannon
Income Below Poverty by Sex and Age in Buckhannon
With 15.9% poverty level for males and 28.2% for females among the residents of Buckhannon, under 5 year old males and 15 year old females are the most vulnerable to poverty, with 50 males (50.5%) and 15 females (100.0%) in their respective age groups living below the poverty level.
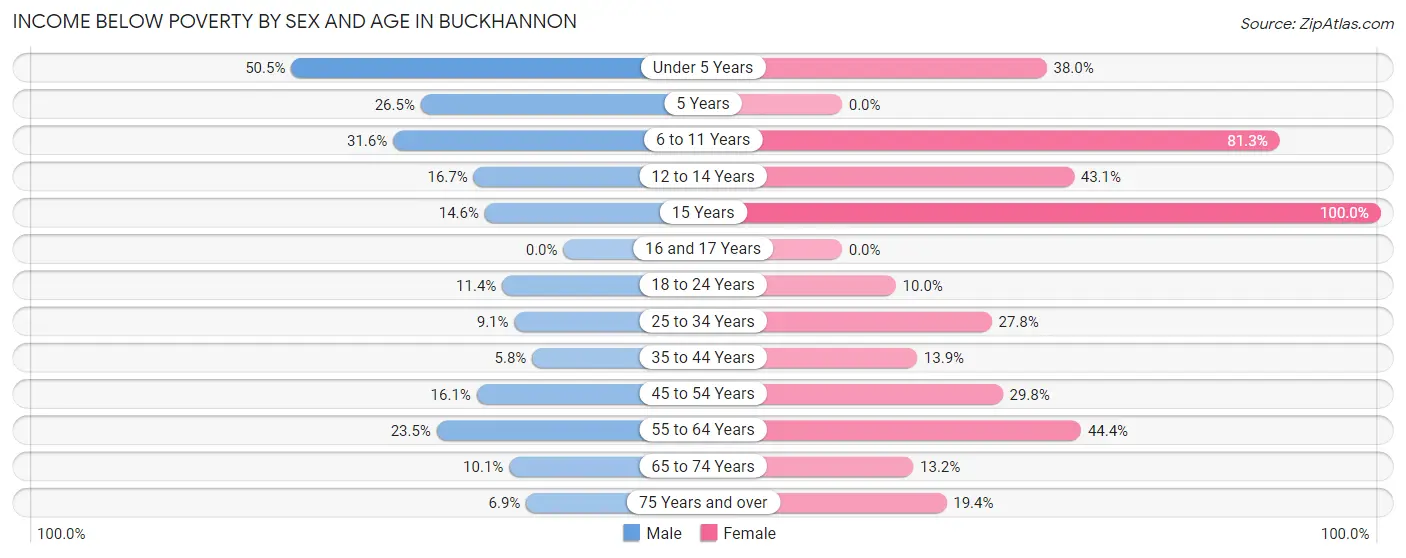
| Age Bracket | Male | Female |
| Under 5 Years | 50 (50.5%) | 38 (38.0%) |
| 5 Years | 9 (26.5%) | 0 (0.0%) |
| 6 to 11 Years | 55 (31.6%) | 52 (81.2%) |
| 12 to 14 Years | 8 (16.7%) | 31 (43.1%) |
| 15 Years | 14 (14.6%) | 15 (100.0%) |
| 16 and 17 Years | 0 (0.0%) | 0 (0.0%) |
| 18 to 24 Years | 10 (11.4%) | 17 (10.0%) |
| 25 to 34 Years | 5 (9.1%) | 84 (27.8%) |
| 35 to 44 Years | 28 (5.8%) | 35 (13.9%) |
| 45 to 54 Years | 42 (16.1%) | 71 (29.8%) |
| 55 to 64 Years | 67 (23.5%) | 170 (44.4%) |
| 65 to 74 Years | 16 (10.1%) | 38 (13.2%) |
| 75 Years and over | 8 (6.9%) | 39 (19.4%) |
| Total | 312 (15.9%) | 590 (28.2%) |
Income Above Poverty by Sex and Age in Buckhannon
According to the poverty statistics in Buckhannon, males aged 16 and 17 years and females aged 16 and 17 years are the age groups that are most secure financially, with 100.0% of males and 100.0% of females in these age groups living above the poverty line.
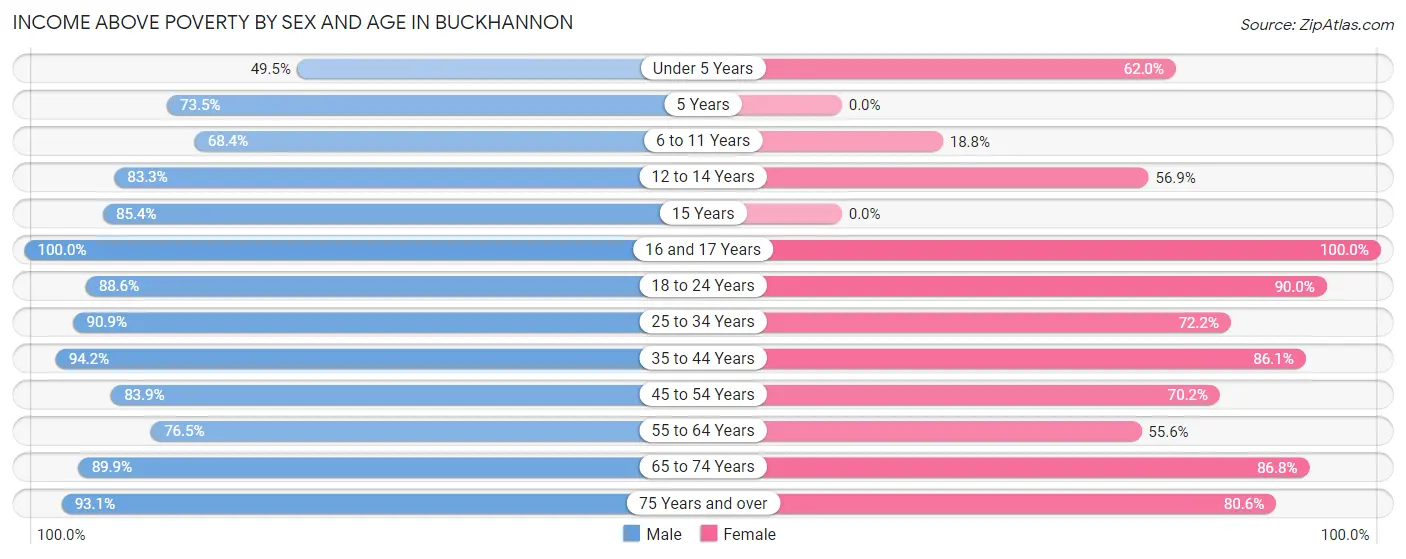
| Age Bracket | Male | Female |
| Under 5 Years | 49 (49.5%) | 62 (62.0%) |
| 5 Years | 25 (73.5%) | 0 (0.0%) |
| 6 to 11 Years | 119 (68.4%) | 12 (18.8%) |
| 12 to 14 Years | 40 (83.3%) | 41 (56.9%) |
| 15 Years | 82 (85.4%) | 0 (0.0%) |
| 16 and 17 Years | 69 (100.0%) | 6 (100.0%) |
| 18 to 24 Years | 78 (88.6%) | 153 (90.0%) |
| 25 to 34 Years | 50 (90.9%) | 218 (72.2%) |
| 35 to 44 Years | 456 (94.2%) | 216 (86.1%) |
| 45 to 54 Years | 219 (83.9%) | 167 (70.2%) |
| 55 to 64 Years | 218 (76.5%) | 213 (55.6%) |
| 65 to 74 Years | 143 (89.9%) | 249 (86.8%) |
| 75 Years and over | 108 (93.1%) | 162 (80.6%) |
| Total | 1,656 (84.2%) | 1,499 (71.8%) |
Income Below Poverty Among Married-Couple Families in Buckhannon
The poverty statistics for married-couple families in Buckhannon show that 2.7% or 19 of the total 694 families live below the poverty line. Families with 3 or 4 children have the highest poverty rate of 29.4%, comprising of 15 families. On the other hand, families with 1 or 2 children have the lowest poverty rate of 0.0%, which includes 0 families.
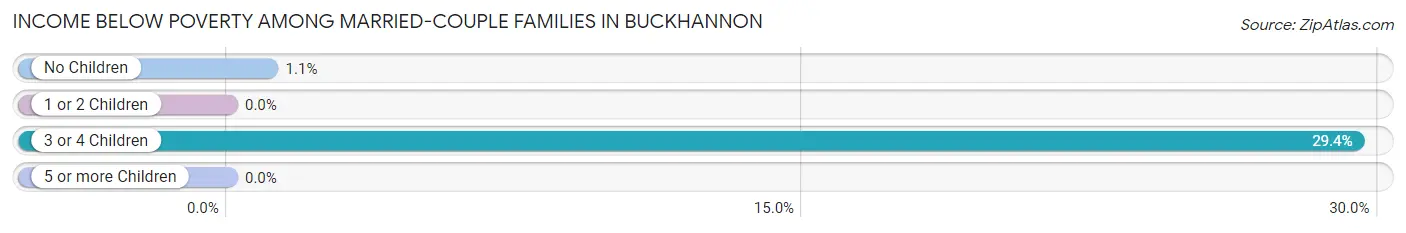
| Children | Above Poverty | Below Poverty |
| No Children | 375 (98.9%) | 4 (1.1%) |
| 1 or 2 Children | 264 (100.0%) | 0 (0.0%) |
| 3 or 4 Children | 36 (70.6%) | 15 (29.4%) |
| 5 or more Children | 0 (0.0%) | 0 (0.0%) |
| Total | 675 (97.3%) | 19 (2.7%) |
Income Below Poverty Among Single-Parent Households in Buckhannon
According to the poverty data in Buckhannon, 47.1% or 33 single-father households and 48.7% or 112 single-mother households are living below the poverty line. Among single-father households, those with 1 or 2 children have the highest poverty rate, with 33 households (64.7%) experiencing poverty. Likewise, among single-mother households, those with 3 or 4 children have the highest poverty rate, with 19 households (100.0%) falling below the poverty line.
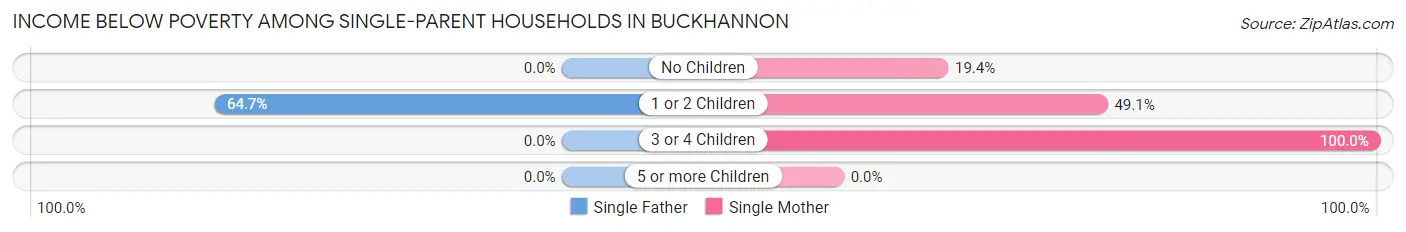
| Children | Single Father | Single Mother |
| No Children | 0 (0.0%) | 7 (19.4%) |
| 1 or 2 Children | 33 (64.7%) | 86 (49.1%) |
| 3 or 4 Children | 0 (0.0%) | 19 (100.0%) |
| 5 or more Children | 0 (0.0%) | 0 (0.0%) |
| Total | 33 (47.1%) | 112 (48.7%) |
Income Below Poverty Among Married-Couple vs Single-Parent Households in Buckhannon
The poverty data for Buckhannon shows that 19 of the married-couple family households (2.7%) and 145 of the single-parent households (48.3%) are living below the poverty level. Within the married-couple family households, those with 3 or 4 children have the highest poverty rate, with 15 households (29.4%) falling below the poverty line. Among the single-parent households, those with 3 or 4 children have the highest poverty rate, with 19 household (100.0%) living below poverty.
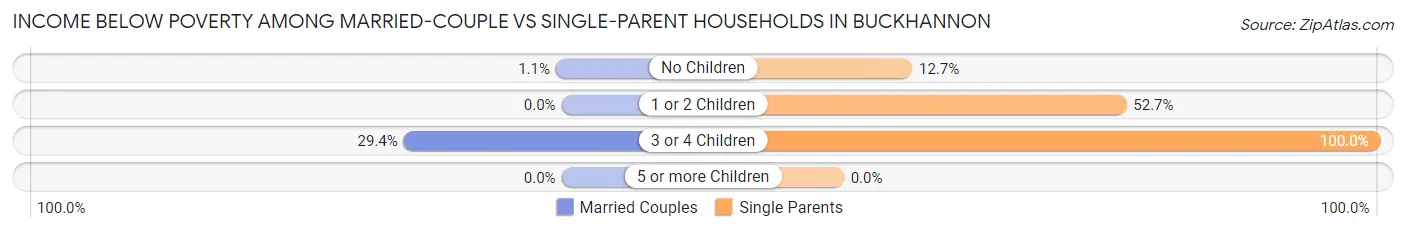
| Children | Married-Couple Families | Single-Parent Households |
| No Children | 4 (1.1%) | 7 (12.7%) |
| 1 or 2 Children | 0 (0.0%) | 119 (52.6%) |
| 3 or 4 Children | 15 (29.4%) | 19 (100.0%) |
| 5 or more Children | 0 (0.0%) | 0 (0.0%) |
| Total | 19 (2.7%) | 145 (48.3%) |
Race in Buckhannon
The most populous races in Buckhannon are White / Caucasian (4,560 | 87.7%), Black / African American (373 | 7.2%), and Hispanic or Latino (184 | 3.5%).
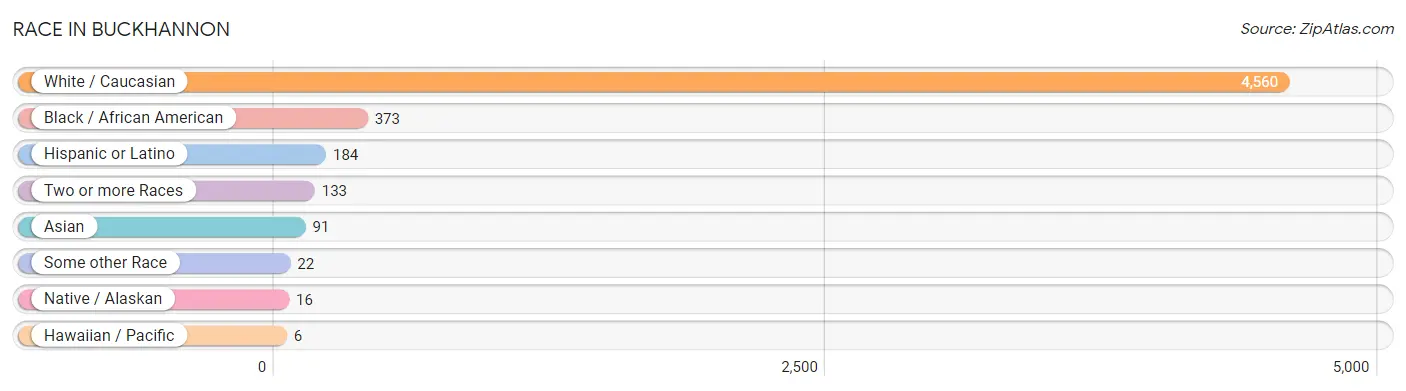
| Race | # Population | % Population |
| Asian | 91 | 1.8% |
| Black / African American | 373 | 7.2% |
| Hawaiian / Pacific | 6 | 0.1% |
| Hispanic or Latino | 184 | 3.5% |
| Native / Alaskan | 16 | 0.3% |
| White / Caucasian | 4,560 | 87.7% |
| Two or more Races | 133 | 2.6% |
| Some other Race | 22 | 0.4% |
| Total | 5,201 | 100.0% |
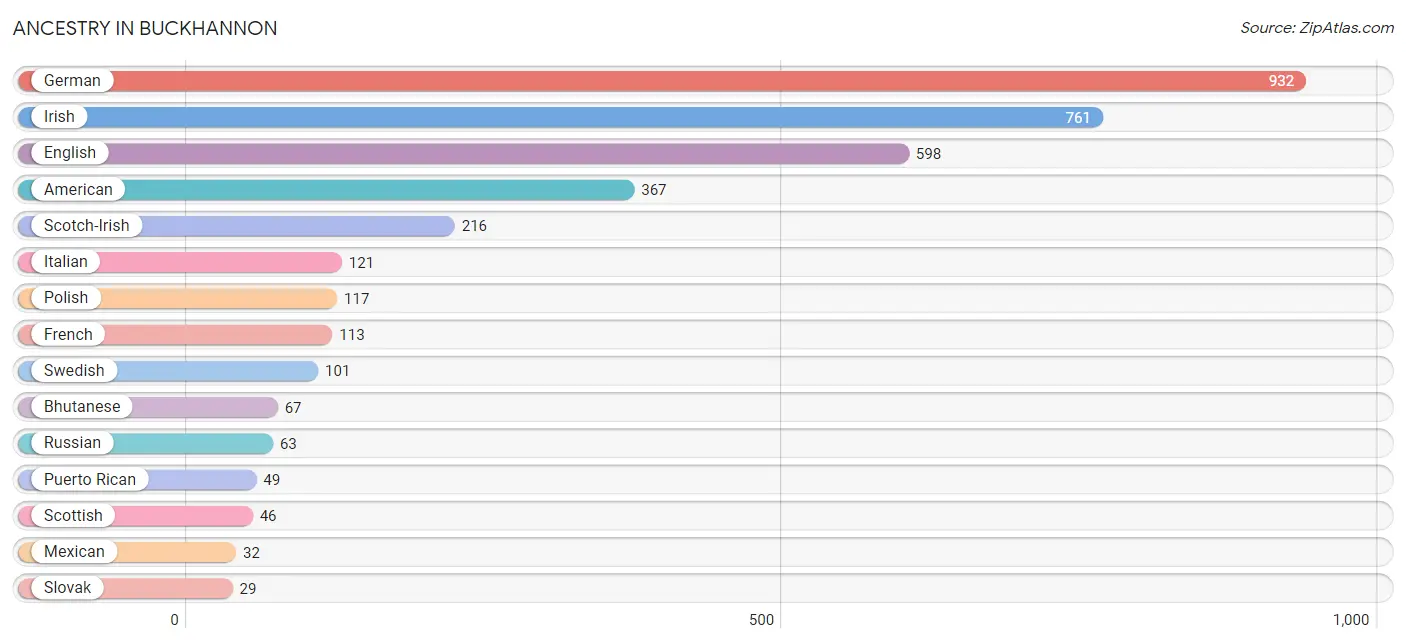
Ancestry in Buckhannon
The most populous ancestries reported in Buckhannon are German (932 | 17.9%), Irish (761 | 14.6%), English (598 | 11.5%), American (367 | 7.1%), and Scotch-Irish (216 | 4.2%), together accounting for 55.3% of all Buckhannon residents.
| Ancestry | # Population | % Population |
| African | 27 | 0.5% |
| Alaska Native | 4 | 0.1% |
| American | 367 | 7.1% |
| Bhutanese | 67 | 1.3% |
| Cherokee | 11 | 0.2% |
| Cuban | 12 | 0.2% |
| Czech | 7 | 0.1% |
| Danish | 5 | 0.1% |
| Dutch | 28 | 0.5% |
| English | 598 | 11.5% |
| European | 24 | 0.5% |
| Finnish | 7 | 0.1% |
| French | 113 | 2.2% |
| French Canadian | 5 | 0.1% |
| German | 932 | 17.9% |
| Greek | 4 | 0.1% |
| Haitian | 1 | 0.0% |
| Hungarian | 12 | 0.2% |
| Irish | 761 | 14.6% |
| Italian | 121 | 2.3% |
| Korean | 21 | 0.4% |
| Mexican | 32 | 0.6% |
| Native Hawaiian | 15 | 0.3% |
| Polish | 117 | 2.2% |
| Portuguese | 14 | 0.3% |
| Puerto Rican | 49 | 0.9% |
| Russian | 63 | 1.2% |
| Scotch-Irish | 216 | 4.2% |
| Scottish | 46 | 0.9% |
| Slovak | 29 | 0.6% |
| Sri Lankan | 10 | 0.2% |
| Subsaharan African | 27 | 0.5% |
| Swedish | 101 | 1.9% |
| Swiss | 20 | 0.4% |
| Thai | 6 | 0.1% |
| Ukrainian | 16 | 0.3% |
| Welsh | 26 | 0.5% | View All 37 Rows |
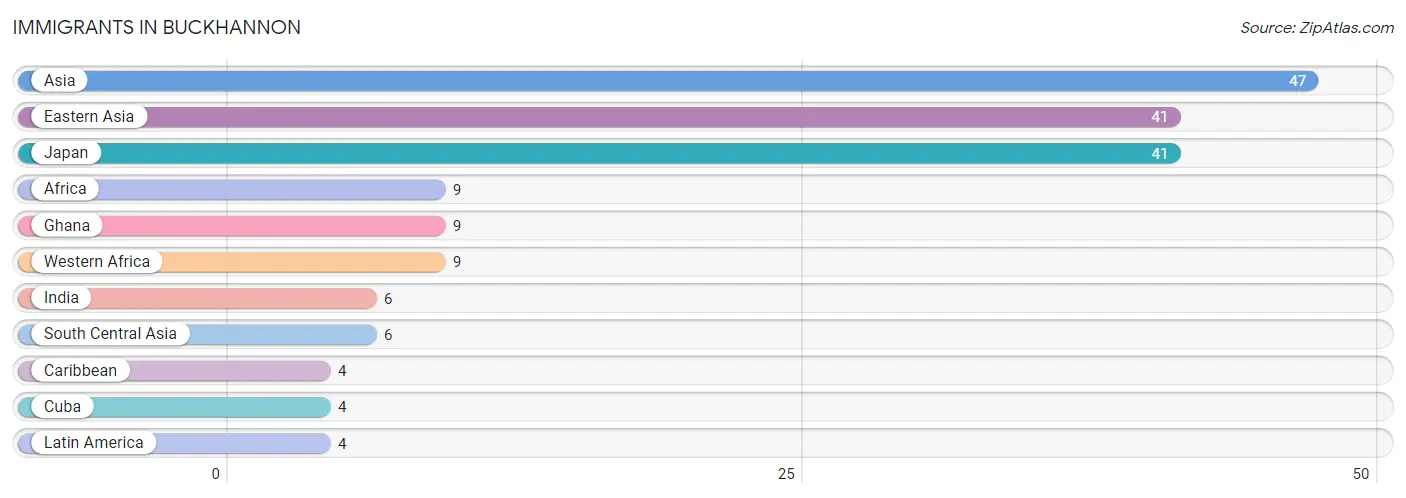
Immigrants in Buckhannon
The most numerous immigrant groups reported in Buckhannon came from Asia (47 | 0.9%), Eastern Asia (41 | 0.8%), Japan (41 | 0.8%), Africa (9 | 0.2%), and Ghana (9 | 0.2%), together accounting for 2.8% of all Buckhannon residents.
| Immigration Origin | # Population | % Population |
| Africa | 9 | 0.2% |
| Asia | 47 | 0.9% |
| Caribbean | 4 | 0.1% |
| Cuba | 4 | 0.1% |
| Eastern Asia | 41 | 0.8% |
| Ghana | 9 | 0.2% |
| India | 6 | 0.1% |
| Japan | 41 | 0.8% |
| Latin America | 4 | 0.1% |
| South Central Asia | 6 | 0.1% |
| Western Africa | 9 | 0.2% | View All 11 Rows |
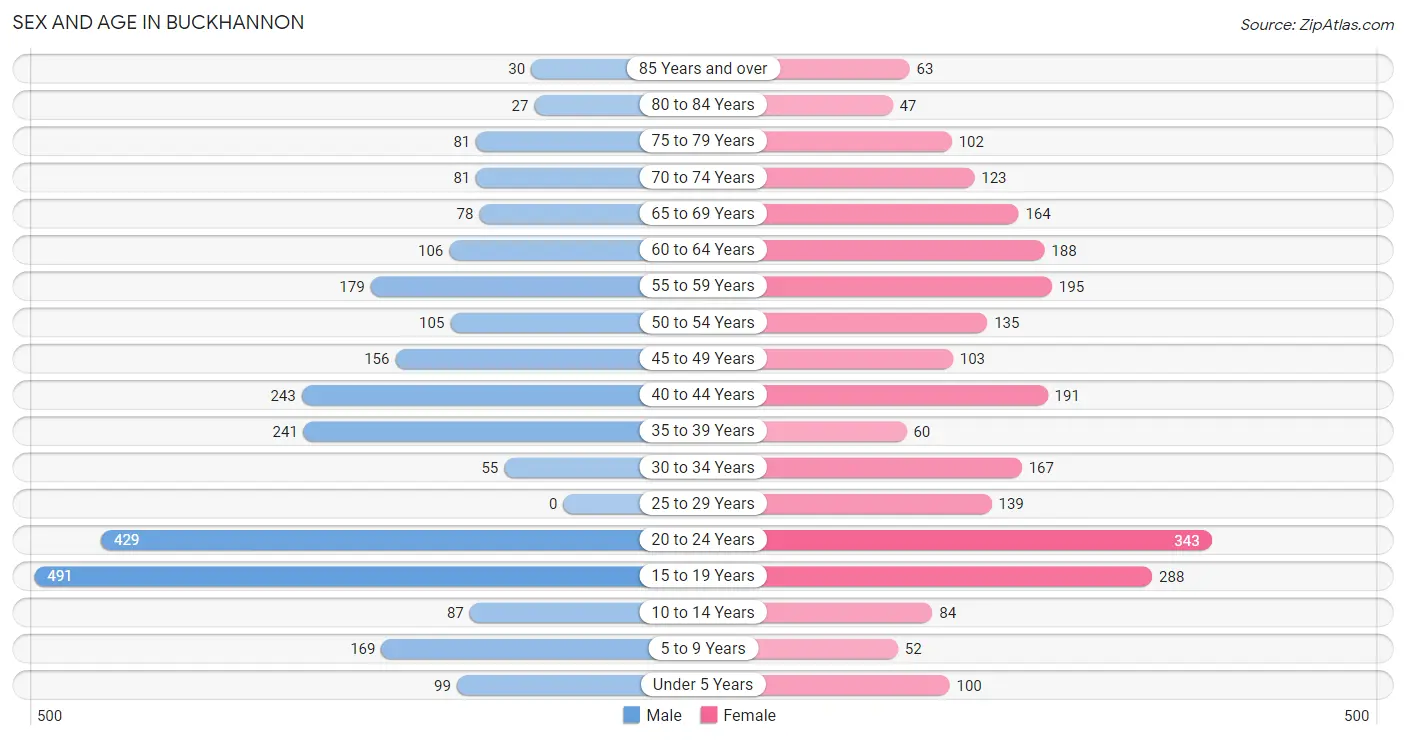
Sex and Age in Buckhannon
Sex and Age in Buckhannon
The most populous age groups in Buckhannon are 15 to 19 Years (491 | 18.5%) for men and 20 to 24 Years (343 | 13.5%) for women.
| Age Bracket | Male | Female |
| Under 5 Years | 99 (3.7%) | 100 (3.9%) |
| 5 to 9 Years | 169 (6.4%) | 52 (2.0%) |
| 10 to 14 Years | 87 (3.3%) | 84 (3.3%) |
| 15 to 19 Years | 491 (18.5%) | 288 (11.3%) |
| 20 to 24 Years | 429 (16.2%) | 343 (13.5%) |
| 25 to 29 Years | 0 (0.0%) | 139 (5.5%) |
| 30 to 34 Years | 55 (2.1%) | 167 (6.6%) |
| 35 to 39 Years | 241 (9.1%) | 60 (2.4%) |
| 40 to 44 Years | 243 (9.1%) | 191 (7.5%) |
| 45 to 49 Years | 156 (5.9%) | 103 (4.1%) |
| 50 to 54 Years | 105 (4.0%) | 135 (5.3%) |
| 55 to 59 Years | 179 (6.7%) | 195 (7.7%) |
| 60 to 64 Years | 106 (4.0%) | 188 (7.4%) |
| 65 to 69 Years | 78 (2.9%) | 164 (6.5%) |
| 70 to 74 Years | 81 (3.0%) | 123 (4.8%) |
| 75 to 79 Years | 81 (3.0%) | 102 (4.0%) |
| 80 to 84 Years | 27 (1.0%) | 47 (1.8%) |
| 85 Years and over | 30 (1.1%) | 63 (2.5%) |
| Total | 2,657 (100.0%) | 2,544 (100.0%) |
Families and Households in Buckhannon
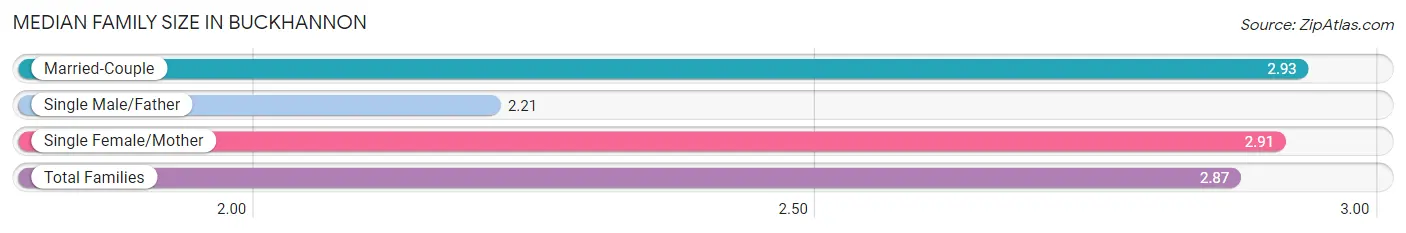
Median Family Size in Buckhannon
The median family size in Buckhannon is 2.87 persons per family, with married-couple families (694 | 69.8%) accounting for the largest median family size of 2.93 persons per family. On the other hand, single male/father families (70 | 7.0%) represent the smallest median family size with 2.21 persons per family.
| Family Type | # Families | Family Size |
| Married-Couple | 694 (69.8%) | 2.93 |
| Single Male/Father | 70 (7.0%) | 2.21 |
| Single Female/Mother | 230 (23.1%) | 2.91 |
| Total Families | 994 (100.0%) | 2.87 |
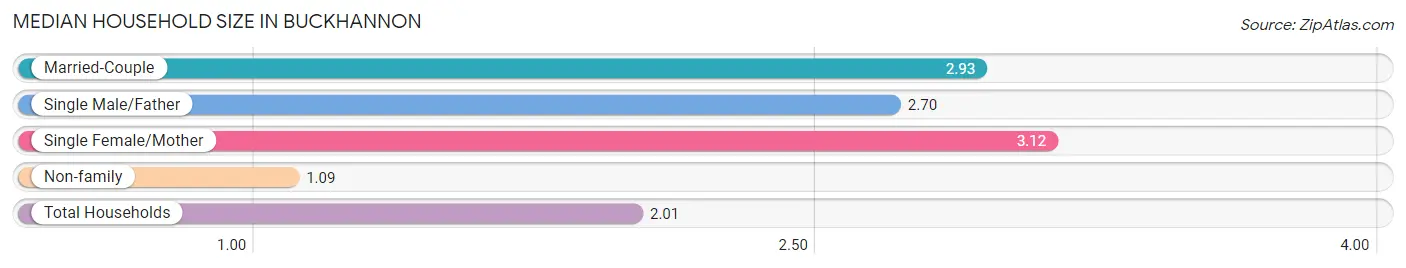
Median Household Size in Buckhannon
The median household size in Buckhannon is 2.01 persons per household, with single female/mother households (230 | 11.4%) accounting for the largest median household size of 3.12 persons per household. non-family households (1,016 | 50.5%) represent the smallest median household size with 1.09 persons per household.
| Household Type | # Households | Household Size |
| Married-Couple | 694 (34.5%) | 2.93 |
| Single Male/Father | 70 (3.5%) | 2.70 |
| Single Female/Mother | 230 (11.4%) | 3.12 |
| Non-family | 1,016 (50.5%) | 1.09 |
| Total Households | 2,010 (100.0%) | 2.01 |
Household Size by Marriage Status in Buckhannon
Out of a total of 2,010 households in Buckhannon, 994 (49.4%) are family households, while 1,016 (50.5%) are nonfamily households. The most numerous type of family households are 2-person households, comprising 399, and the most common type of nonfamily households are 1-person households, comprising 913.
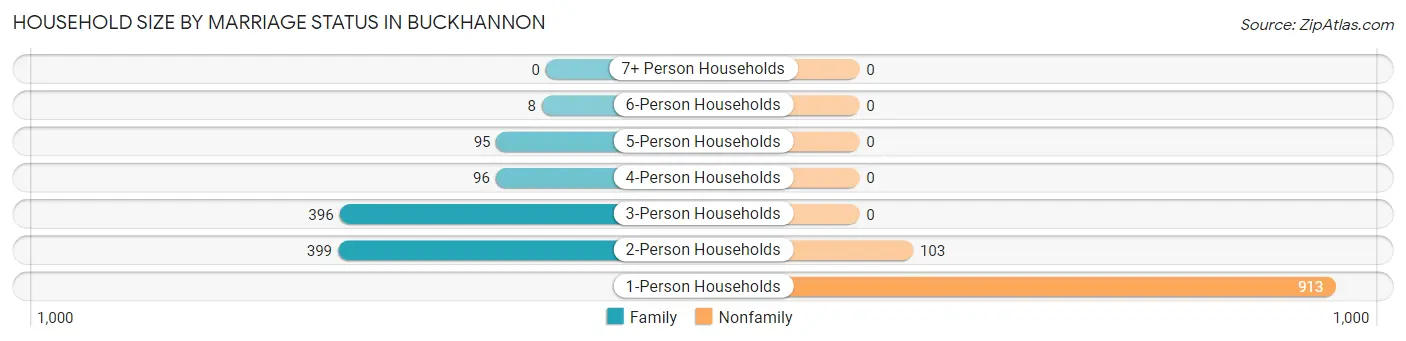
| Household Size | Family Households | Nonfamily Households |
| 1-Person Households | - | 913 (45.4%) |
| 2-Person Households | 399 (19.9%) | 103 (5.1%) |
| 3-Person Households | 396 (19.7%) | 0 (0.0%) |
| 4-Person Households | 96 (4.8%) | 0 (0.0%) |
| 5-Person Households | 95 (4.7%) | 0 (0.0%) |
| 6-Person Households | 8 (0.4%) | 0 (0.0%) |
| 7+ Person Households | 0 (0.0%) | 0 (0.0%) |
| Total | 994 (49.4%) | 1,016 (50.5%) |
Female Fertility in Buckhannon
Fertility by Age in Buckhannon
Average fertility rate in Buckhannon is 11.0 births per 1,000 women. Women in the age bracket of 20 to 34 years have the highest fertility rate with 23.0 births per 1,000 women. Women in the age bracket of 20 to 34 years acount for 100.0% of all women with births.
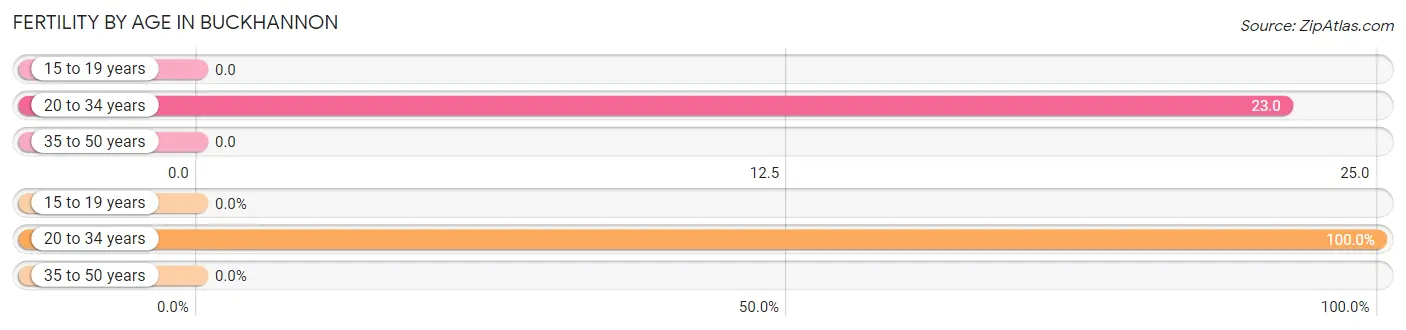
| Age Bracket | Women with Births | Births / 1,000 Women |
| 15 to 19 years | 0 (0.0%) | 0.0 |
| 20 to 34 years | 15 (100.0%) | 23.0 |
| 35 to 50 years | 0 (0.0%) | 0.0 |
| Total | 15 (100.0%) | 11.0 |
Fertility by Age by Marriage Status in Buckhannon
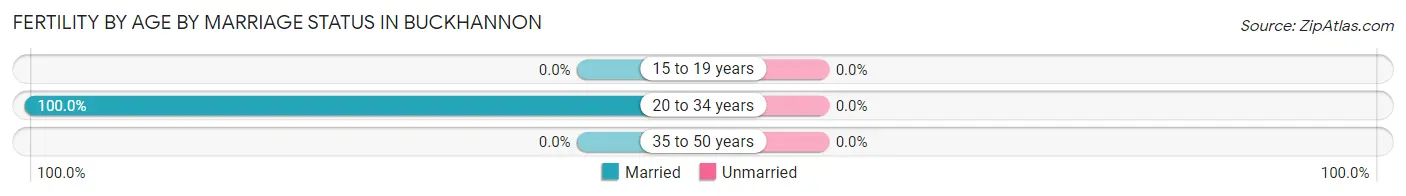
| Age Bracket | Married | Unmarried |
| 15 to 19 years | 0 (0.0%) | 0 (0.0%) |
| 20 to 34 years | 15 (100.0%) | 0 (0.0%) |
| 35 to 50 years | 0 (0.0%) | 0 (0.0%) |
| Total | 15 (100.0%) | 0 (0.0%) |
Fertility by Education in Buckhannon
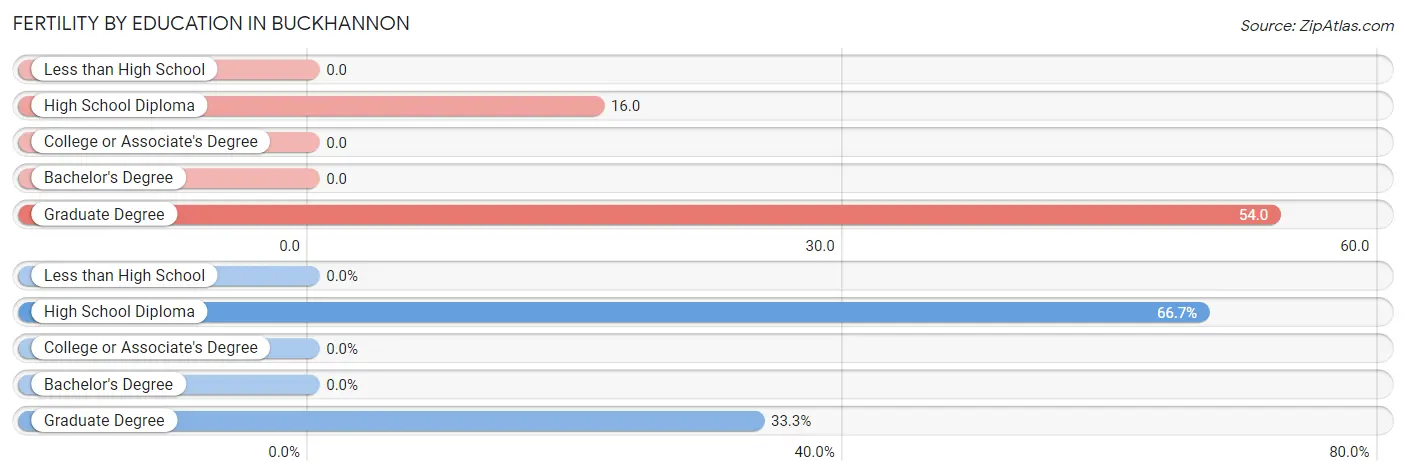
| Educational Attainment | Women with Births | Births / 1,000 Women |
| Less than High School | 0 (0.0%) | 0.0 |
| High School Diploma | 10 (66.7%) | 16.0 |
| College or Associate's Degree | 0 (0.0%) | 0.0 |
| Bachelor's Degree | 0 (0.0%) | 0.0 |
| Graduate Degree | 5 (33.3%) | 54.0 |
| Total | 15 (100.0%) | 11.0 |
Fertility by Education by Marriage Status in Buckhannon
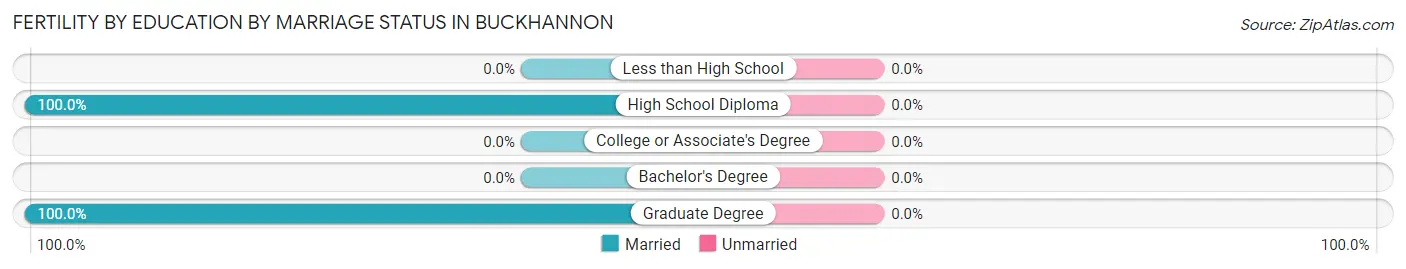
| Educational Attainment | Married | Unmarried |
| Less than High School | 0 (0.0%) | 0 (0.0%) |
| High School Diploma | 10 (100.0%) | 0 (0.0%) |
| College or Associate's Degree | 0 (0.0%) | 0 (0.0%) |
| Bachelor's Degree | 0 (0.0%) | 0 (0.0%) |
| Graduate Degree | 5 (100.0%) | 0 (0.0%) |
| Total | 15 (100.0%) | 0 (0.0%) |
Employment Characteristics in Buckhannon
Employment by Class of Employer in Buckhannon
Among the 1,889 employed individuals in Buckhannon, private company employees (1,136 | 60.1%), self-employed (not incorporated) (227 | 12.0%), and not-for-profit organizations (165 | 8.7%) make up the most common classes of employment.
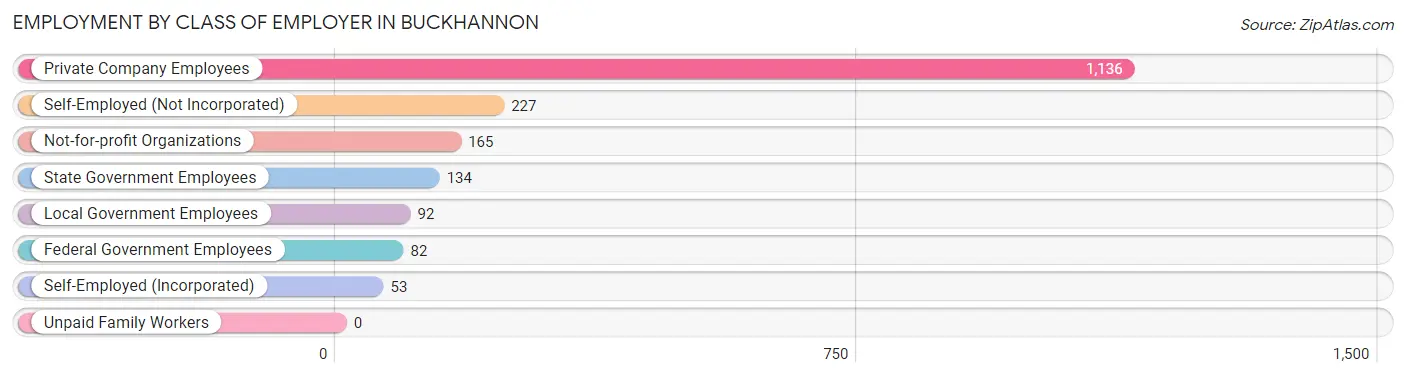
| Employer Class | # Employees | % Employees |
| Private Company Employees | 1,136 | 60.1% |
| Self-Employed (Incorporated) | 53 | 2.8% |
| Self-Employed (Not Incorporated) | 227 | 12.0% |
| Not-for-profit Organizations | 165 | 8.7% |
| Local Government Employees | 92 | 4.9% |
| State Government Employees | 134 | 7.1% |
| Federal Government Employees | 82 | 4.3% |
| Unpaid Family Workers | 0 | 0.0% |
| Total | 1,889 | 100.0% |
Employment Status by Age in Buckhannon
According to the labor force statistics for Buckhannon, out of the total population over 16 years of age (4,499), 47.1% or 2,119 individuals are in the labor force, with 6.1% or 129 of them unemployed. The age group with the highest labor force participation rate is 35 to 44 years, with 92.9% or 683 individuals in the labor force. Within the labor force, the 25 to 29 years age range has the highest percentage of unemployed individuals, with 47.4% or 9 of them being unemployed.
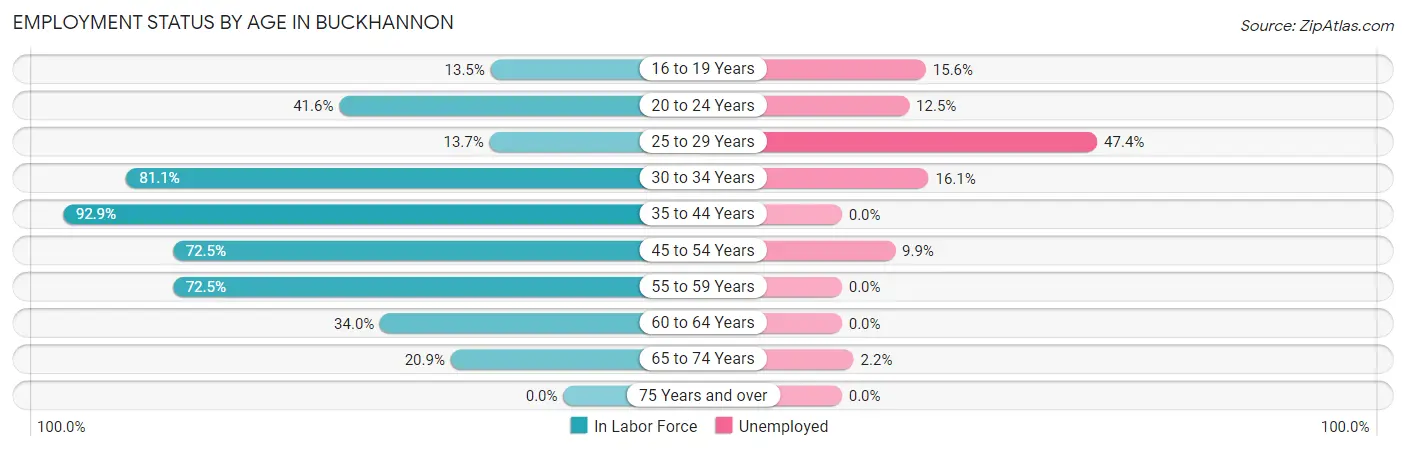
| Age Bracket | In Labor Force | Unemployed |
| 16 to 19 Years | 90 (13.5%) | 14 (15.6%) |
| 20 to 24 Years | 321 (41.6%) | 40 (12.5%) |
| 25 to 29 Years | 19 (13.7%) | 9 (47.4%) |
| 30 to 34 Years | 180 (81.1%) | 29 (16.1%) |
| 35 to 44 Years | 683 (92.9%) | 0 (0.0%) |
| 45 to 54 Years | 362 (72.5%) | 36 (9.9%) |
| 55 to 59 Years | 271 (72.5%) | 0 (0.0%) |
| 60 to 64 Years | 100 (34.0%) | 0 (0.0%) |
| 65 to 74 Years | 93 (20.9%) | 2 (2.2%) |
| 75 Years and over | 0 (0.0%) | 0 (0.0%) |
| Total | 2,119 (47.1%) | 129 (6.1%) |
Employment Status by Educational Attainment in Buckhannon
According to labor force statistics for Buckhannon, 71.4% of individuals (1,616) out of the total population between 25 and 64 years of age (2,263) are in the labor force, with 4.6% or 74 of them being unemployed. The group with the highest labor force participation rate are those with the educational attainment of bachelor's degree or higher, with 90.4% or 462 individuals in the labor force. Within the labor force, individuals with less than high school education have the highest percentage of unemployment, with 24.2% or 36 of them being unemployed.
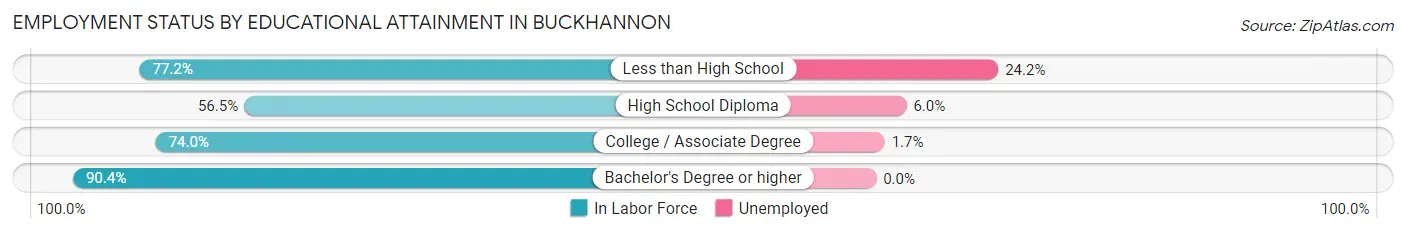
| Educational Attainment | In Labor Force | Unemployed |
| Less than High School | 149 (77.2%) | 47 (24.2%) |
| High School Diploma | 484 (56.5%) | 51 (6.0%) |
| College / Associate Degree | 520 (74.0%) | 12 (1.7%) |
| Bachelor's Degree or higher | 462 (90.4%) | 0 (0.0%) |
| Total | 1,616 (71.4%) | 104 (4.6%) |
Employment Occupations by Sex in Buckhannon
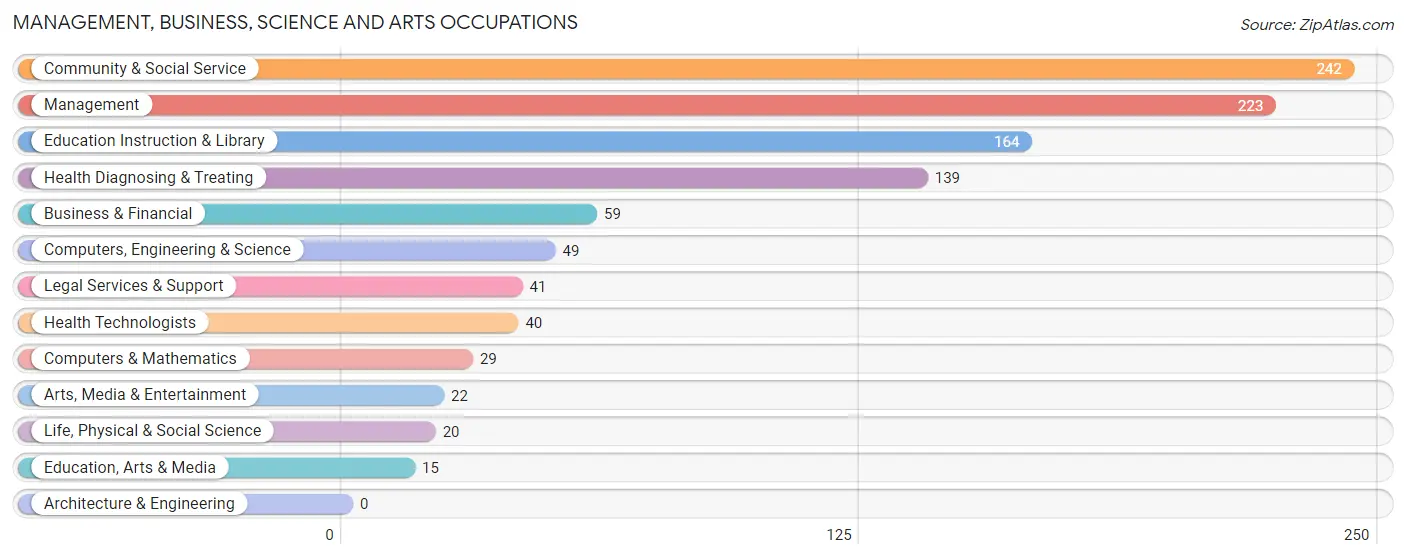
Management, Business, Science and Arts Occupations
The most common Management, Business, Science and Arts occupations in Buckhannon are Community & Social Service (242 | 12.2%), Management (223 | 11.2%), Education Instruction & Library (164 | 8.3%), Health Diagnosing & Treating (139 | 7.0%), and Business & Financial (59 | 3.0%).
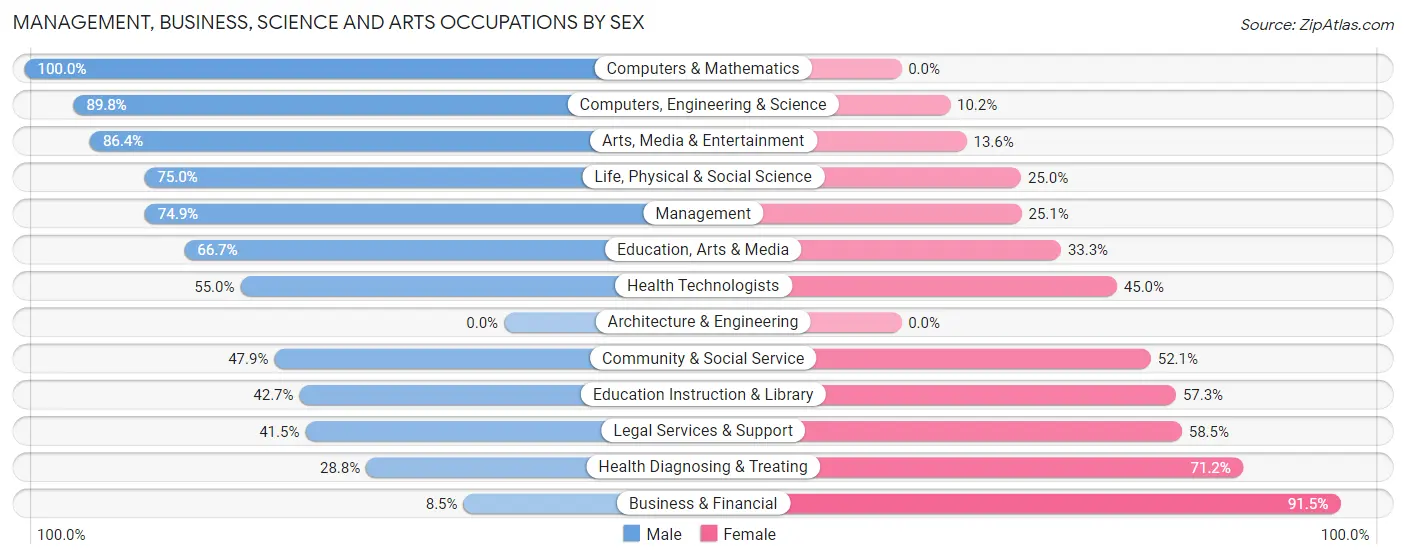
Management, Business, Science and Arts Occupations by Sex
Within the Management, Business, Science and Arts occupations in Buckhannon, the most male-oriented occupations are Computers & Mathematics (100.0%), Computers, Engineering & Science (89.8%), and Arts, Media & Entertainment (86.4%), while the most female-oriented occupations are Business & Financial (91.5%), Health Diagnosing & Treating (71.2%), and Legal Services & Support (58.5%).
| Occupation | Male | Female |
| Management | 167 (74.9%) | 56 (25.1%) |
| Business & Financial | 5 (8.5%) | 54 (91.5%) |
| Computers, Engineering & Science | 44 (89.8%) | 5 (10.2%) |
| Computers & Mathematics | 29 (100.0%) | 0 (0.0%) |
| Architecture & Engineering | 0 (0.0%) | 0 (0.0%) |
| Life, Physical & Social Science | 15 (75.0%) | 5 (25.0%) |
| Community & Social Service | 116 (47.9%) | 126 (52.1%) |
| Education, Arts & Media | 10 (66.7%) | 5 (33.3%) |
| Legal Services & Support | 17 (41.5%) | 24 (58.5%) |
| Education Instruction & Library | 70 (42.7%) | 94 (57.3%) |
| Arts, Media & Entertainment | 19 (86.4%) | 3 (13.6%) |
| Health Diagnosing & Treating | 40 (28.8%) | 99 (71.2%) |
| Health Technologists | 22 (55.0%) | 18 (45.0%) |
| Total (Category) | 372 (52.2%) | 340 (47.7%) |
| Total (Overall) | 1,073 (53.9%) | 916 (46.1%) |
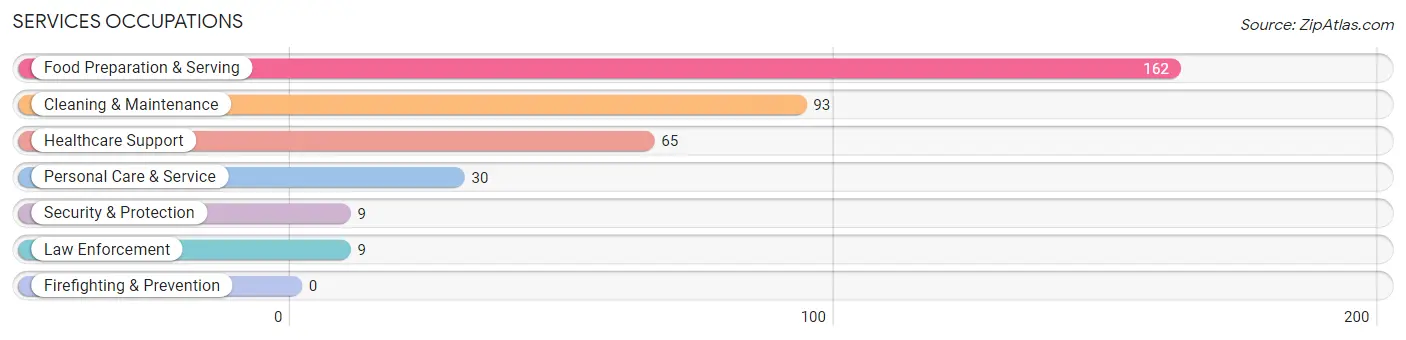
Services Occupations
The most common Services occupations in Buckhannon are Food Preparation & Serving (162 | 8.1%), Cleaning & Maintenance (93 | 4.7%), Healthcare Support (65 | 3.3%), Personal Care & Service (30 | 1.5%), and Security & Protection (9 | 0.4%).
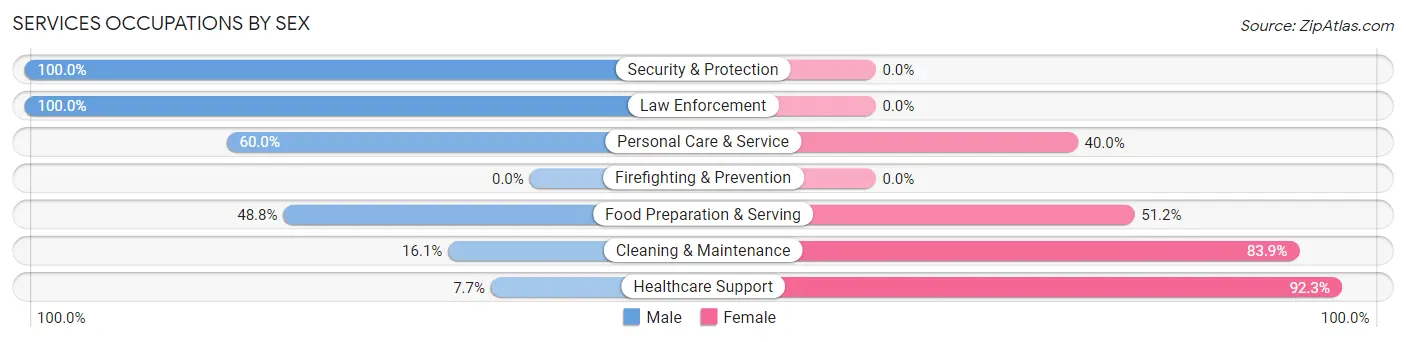
Services Occupations by Sex
Within the Services occupations in Buckhannon, the most male-oriented occupations are Security & Protection (100.0%), Law Enforcement (100.0%), and Personal Care & Service (60.0%), while the most female-oriented occupations are Healthcare Support (92.3%), Cleaning & Maintenance (83.9%), and Food Preparation & Serving (51.2%).
| Occupation | Male | Female |
| Healthcare Support | 5 (7.7%) | 60 (92.3%) |
| Security & Protection | 9 (100.0%) | 0 (0.0%) |
| Firefighting & Prevention | 0 (0.0%) | 0 (0.0%) |
| Law Enforcement | 9 (100.0%) | 0 (0.0%) |
| Food Preparation & Serving | 79 (48.8%) | 83 (51.2%) |
| Cleaning & Maintenance | 15 (16.1%) | 78 (83.9%) |
| Personal Care & Service | 18 (60.0%) | 12 (40.0%) |
| Total (Category) | 126 (35.1%) | 233 (64.9%) |
| Total (Overall) | 1,073 (53.9%) | 916 (46.1%) |
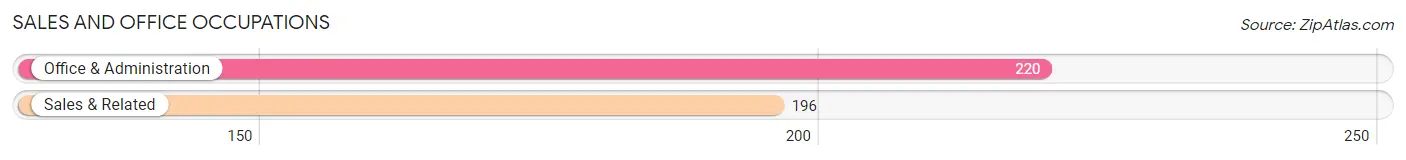
Sales and Office Occupations
The most common Sales and Office occupations in Buckhannon are Office & Administration (220 | 11.1%), and Sales & Related (196 | 9.9%).
Sales and Office Occupations by Sex
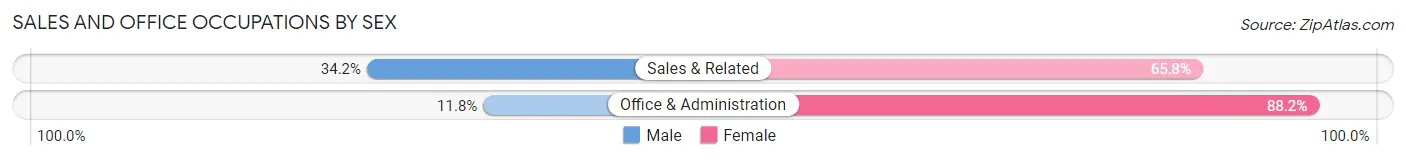
| Occupation | Male | Female |
| Sales & Related | 67 (34.2%) | 129 (65.8%) |
| Office & Administration | 26 (11.8%) | 194 (88.2%) |
| Total (Category) | 93 (22.4%) | 323 (77.6%) |
| Total (Overall) | 1,073 (53.9%) | 916 (46.1%) |
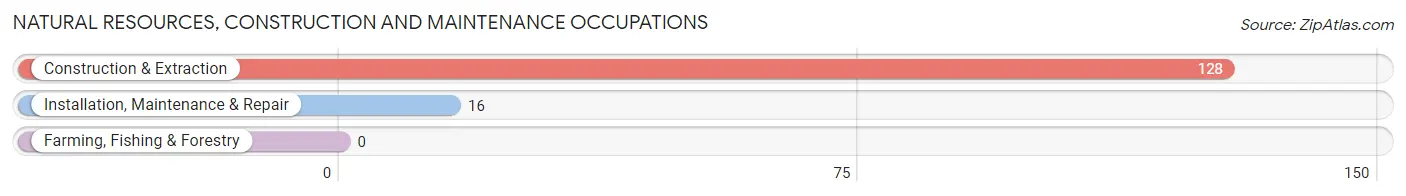
Natural Resources, Construction and Maintenance Occupations
The most common Natural Resources, Construction and Maintenance occupations in Buckhannon are Construction & Extraction (128 | 6.4%), and Installation, Maintenance & Repair (16 | 0.8%).
Natural Resources, Construction and Maintenance Occupations by Sex
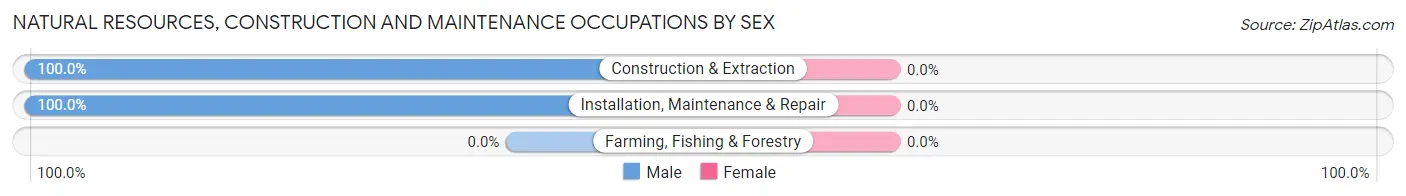
| Occupation | Male | Female |
| Farming, Fishing & Forestry | 0 (0.0%) | 0 (0.0%) |
| Construction & Extraction | 128 (100.0%) | 0 (0.0%) |
| Installation, Maintenance & Repair | 16 (100.0%) | 0 (0.0%) |
| Total (Category) | 144 (100.0%) | 0 (0.0%) |
| Total (Overall) | 1,073 (53.9%) | 916 (46.1%) |
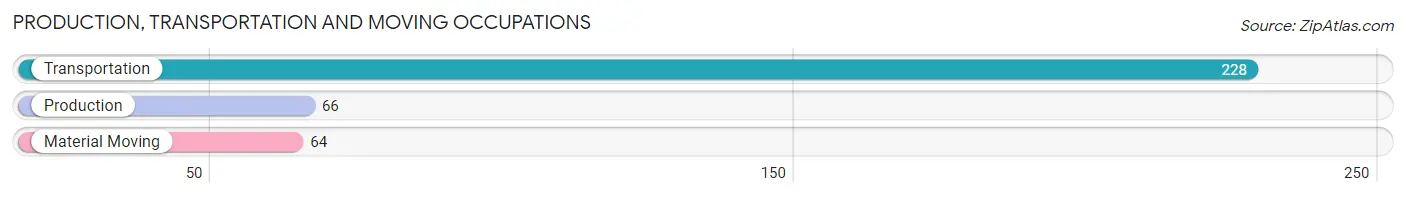
Production, Transportation and Moving Occupations
The most common Production, Transportation and Moving occupations in Buckhannon are Transportation (228 | 11.5%), Production (66 | 3.3%), and Material Moving (64 | 3.2%).
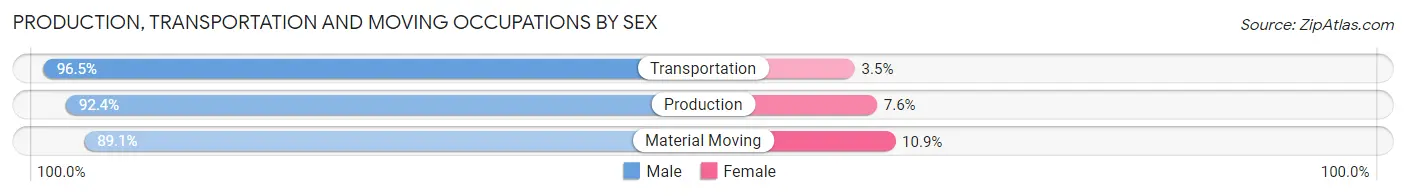
Production, Transportation and Moving Occupations by Sex
| Occupation | Male | Female |
| Production | 61 (92.4%) | 5 (7.6%) |
| Transportation | 220 (96.5%) | 8 (3.5%) |
| Material Moving | 57 (89.1%) | 7 (10.9%) |
| Total (Category) | 338 (94.4%) | 20 (5.6%) |
| Total (Overall) | 1,073 (53.9%) | 916 (46.1%) |
Employment Industries by Sex in Buckhannon
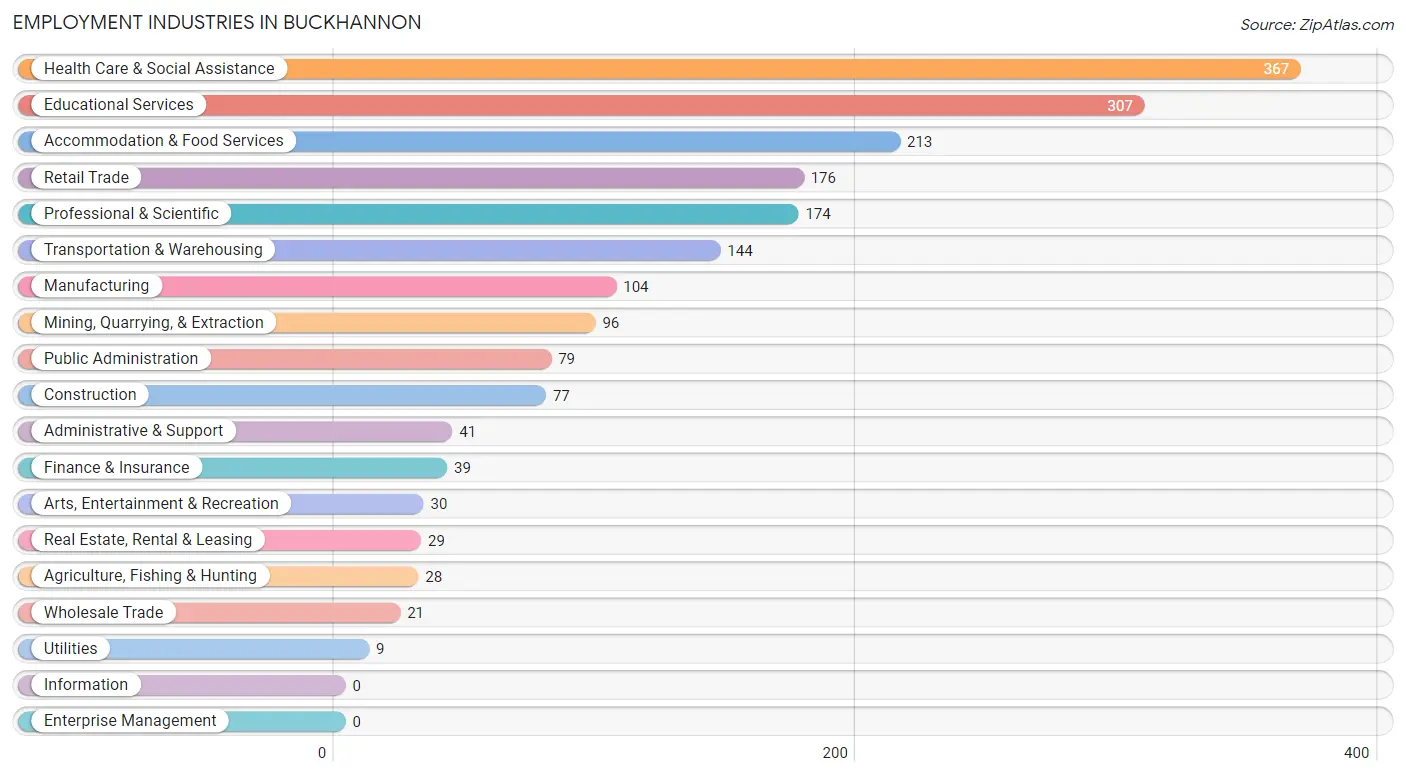
Employment Industries in Buckhannon
The major employment industries in Buckhannon include Health Care & Social Assistance (367 | 18.4%), Educational Services (307 | 15.4%), Accommodation & Food Services (213 | 10.7%), Retail Trade (176 | 8.8%), and Professional & Scientific (174 | 8.7%).
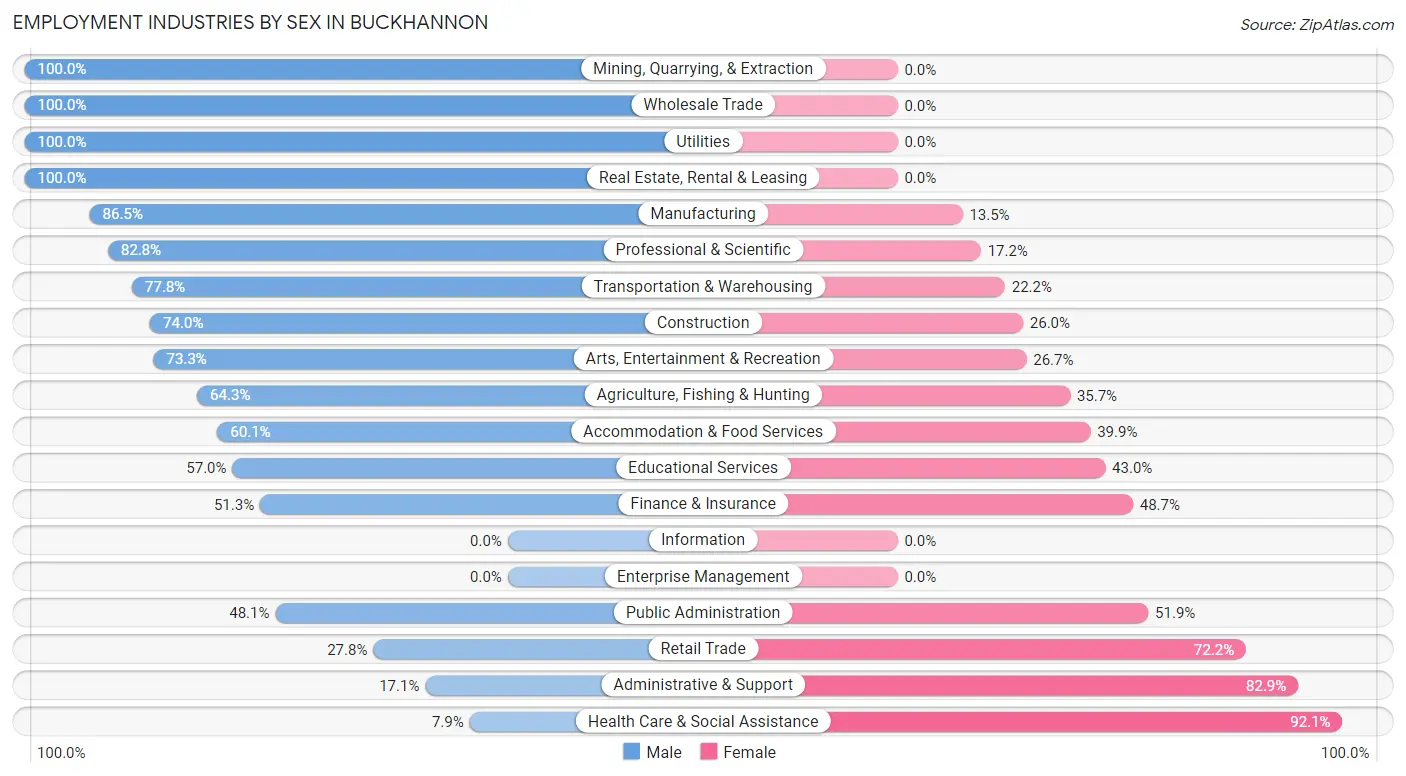
Employment Industries by Sex in Buckhannon
The Buckhannon industries that see more men than women are Mining, Quarrying, & Extraction (100.0%), Wholesale Trade (100.0%), and Utilities (100.0%), whereas the industries that tend to have a higher number of women are Health Care & Social Assistance (92.1%), Administrative & Support (82.9%), and Retail Trade (72.2%).
| Industry | Male | Female |
| Agriculture, Fishing & Hunting | 18 (64.3%) | 10 (35.7%) |
| Mining, Quarrying, & Extraction | 96 (100.0%) | 0 (0.0%) |
| Construction | 57 (74.0%) | 20 (26.0%) |
| Manufacturing | 90 (86.5%) | 14 (13.5%) |
| Wholesale Trade | 21 (100.0%) | 0 (0.0%) |
| Retail Trade | 49 (27.8%) | 127 (72.2%) |
| Transportation & Warehousing | 112 (77.8%) | 32 (22.2%) |
| Utilities | 9 (100.0%) | 0 (0.0%) |
| Information | 0 (0.0%) | 0 (0.0%) |
| Finance & Insurance | 20 (51.3%) | 19 (48.7%) |
| Real Estate, Rental & Leasing | 29 (100.0%) | 0 (0.0%) |
| Professional & Scientific | 144 (82.8%) | 30 (17.2%) |
| Enterprise Management | 0 (0.0%) | 0 (0.0%) |
| Administrative & Support | 7 (17.1%) | 34 (82.9%) |
| Educational Services | 175 (57.0%) | 132 (43.0%) |
| Health Care & Social Assistance | 29 (7.9%) | 338 (92.1%) |
| Arts, Entertainment & Recreation | 22 (73.3%) | 8 (26.7%) |
| Accommodation & Food Services | 128 (60.1%) | 85 (39.9%) |
| Public Administration | 38 (48.1%) | 41 (51.9%) |
| Total | 1,073 (53.9%) | 916 (46.1%) |
Education in Buckhannon
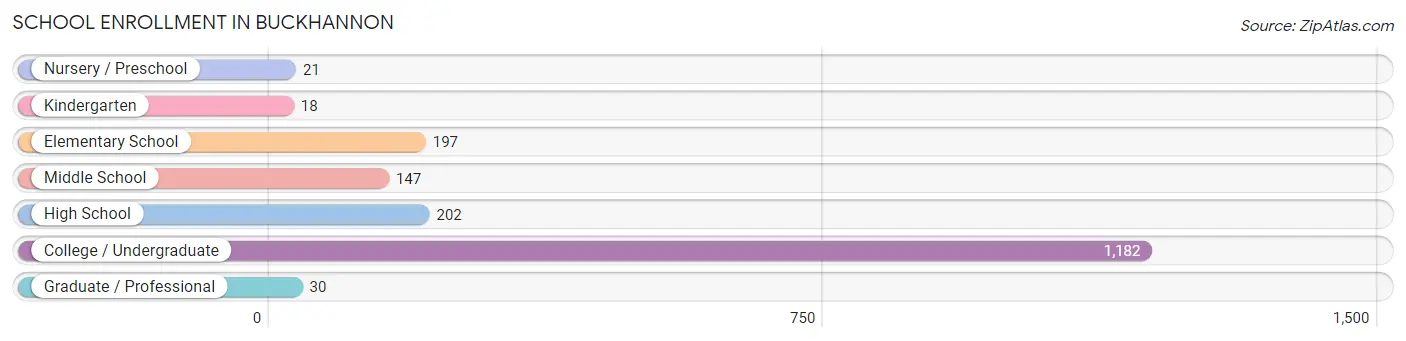
School Enrollment in Buckhannon
The most common levels of schooling among the 1,797 students in Buckhannon are college / undergraduate (1,182 | 65.8%), high school (202 | 11.2%), and elementary school (197 | 11.0%).
| School Level | # Students | % Students |
| Nursery / Preschool | 21 | 1.2% |
| Kindergarten | 18 | 1.0% |
| Elementary School | 197 | 11.0% |
| Middle School | 147 | 8.2% |
| High School | 202 | 11.2% |
| College / Undergraduate | 1,182 | 65.8% |
| Graduate / Professional | 30 | 1.7% |
| Total | 1,797 | 100.0% |
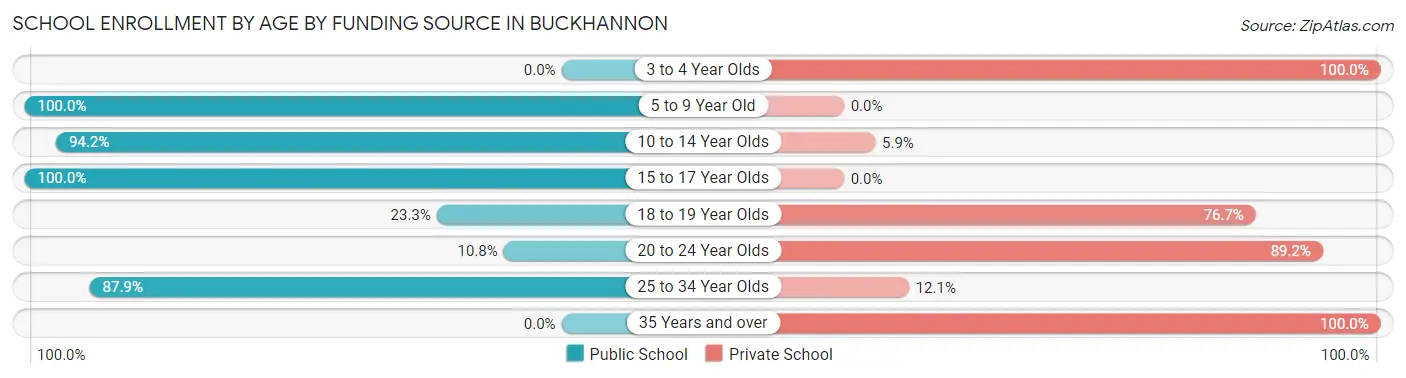
School Enrollment by Age by Funding Source in Buckhannon
Out of a total of 1,797 students who are enrolled in schools in Buckhannon, 1,003 (55.8%) attend a private institution, while the remaining 794 (44.2%) are enrolled in public schools. The age group of 3 to 4 year olds has the highest likelihood of being enrolled in private schools, with 5 (100.0% in the age bracket) enrolled. Conversely, the age group of 5 to 9 year old has the lowest likelihood of being enrolled in a private school, with 221 (100.0% in the age bracket) attending a public institution.
| Age Bracket | Public School | Private School |
| 3 to 4 Year Olds | 0 (0.0%) | 5 (100.0%) |
| 5 to 9 Year Old | 221 (100.0%) | 0 (0.0%) |
| 10 to 14 Year Olds | 161 (94.2%) | 10 (5.9%) |
| 15 to 17 Year Olds | 186 (100.0%) | 0 (0.0%) |
| 18 to 19 Year Olds | 137 (23.3%) | 452 (76.7%) |
| 20 to 24 Year Olds | 61 (10.8%) | 505 (89.2%) |
| 25 to 34 Year Olds | 29 (87.9%) | 4 (12.1%) |
| 35 Years and over | 0 (0.0%) | 26 (100.0%) |
| Total | 794 (44.2%) | 1,003 (55.8%) |
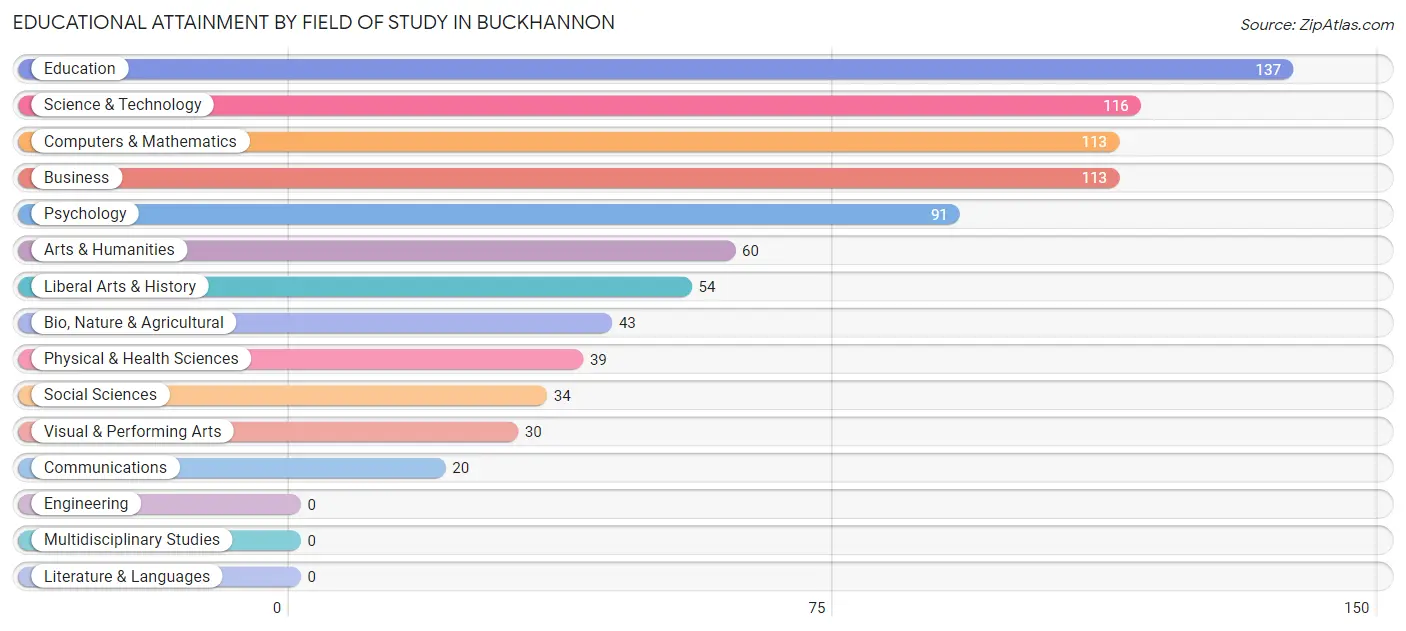
Educational Attainment by Field of Study in Buckhannon
Education (137 | 16.1%), science & technology (116 | 13.7%), computers & mathematics (113 | 13.3%), business (113 | 13.3%), and psychology (91 | 10.7%) are the most common fields of study among 850 individuals in Buckhannon who have obtained a bachelor's degree or higher.
| Field of Study | # Graduates | % Graduates |
| Computers & Mathematics | 113 | 13.3% |
| Bio, Nature & Agricultural | 43 | 5.1% |
| Physical & Health Sciences | 39 | 4.6% |
| Psychology | 91 | 10.7% |
| Social Sciences | 34 | 4.0% |
| Engineering | 0 | 0.0% |
| Multidisciplinary Studies | 0 | 0.0% |
| Science & Technology | 116 | 13.7% |
| Business | 113 | 13.3% |
| Education | 137 | 16.1% |
| Literature & Languages | 0 | 0.0% |
| Liberal Arts & History | 54 | 6.4% |
| Visual & Performing Arts | 30 | 3.5% |
| Communications | 20 | 2.4% |
| Arts & Humanities | 60 | 7.1% |
| Total | 850 | 100.0% |
Transportation & Commute in Buckhannon
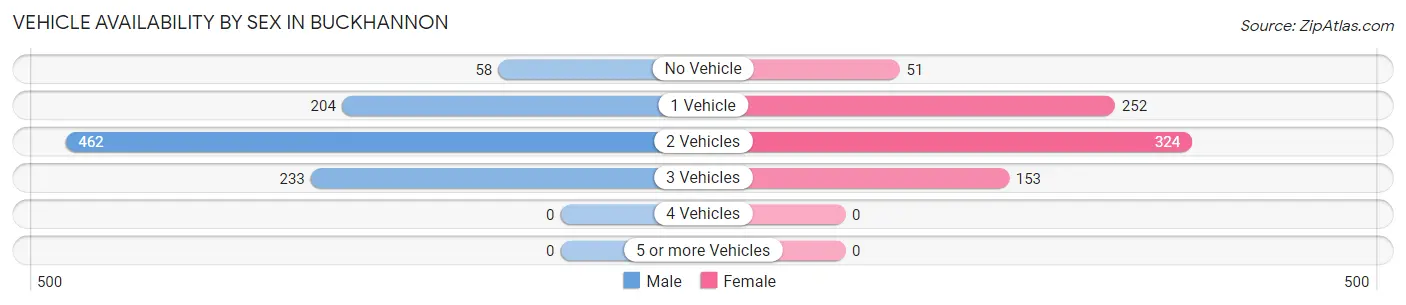
Vehicle Availability by Sex in Buckhannon
The most prevalent vehicle ownership categories in Buckhannon are males with 2 vehicles (462, accounting for 48.3%) and females with 2 vehicles (324, making up 59.2%).
| Vehicles Available | Male | Female |
| No Vehicle | 58 (6.1%) | 51 (6.5%) |
| 1 Vehicle | 204 (21.3%) | 252 (32.3%) |
| 2 Vehicles | 462 (48.3%) | 324 (41.5%) |
| 3 Vehicles | 233 (24.3%) | 153 (19.6%) |
| 4 Vehicles | 0 (0.0%) | 0 (0.0%) |
| 5 or more Vehicles | 0 (0.0%) | 0 (0.0%) |
| Total | 957 (100.0%) | 780 (100.0%) |
Commute Time in Buckhannon
The most frequently occuring commute durations in Buckhannon are 5 to 9 minutes (547 commuters, 34.6%), 10 to 14 minutes (278 commuters, 17.6%), and less than 5 minutes (235 commuters, 14.8%).
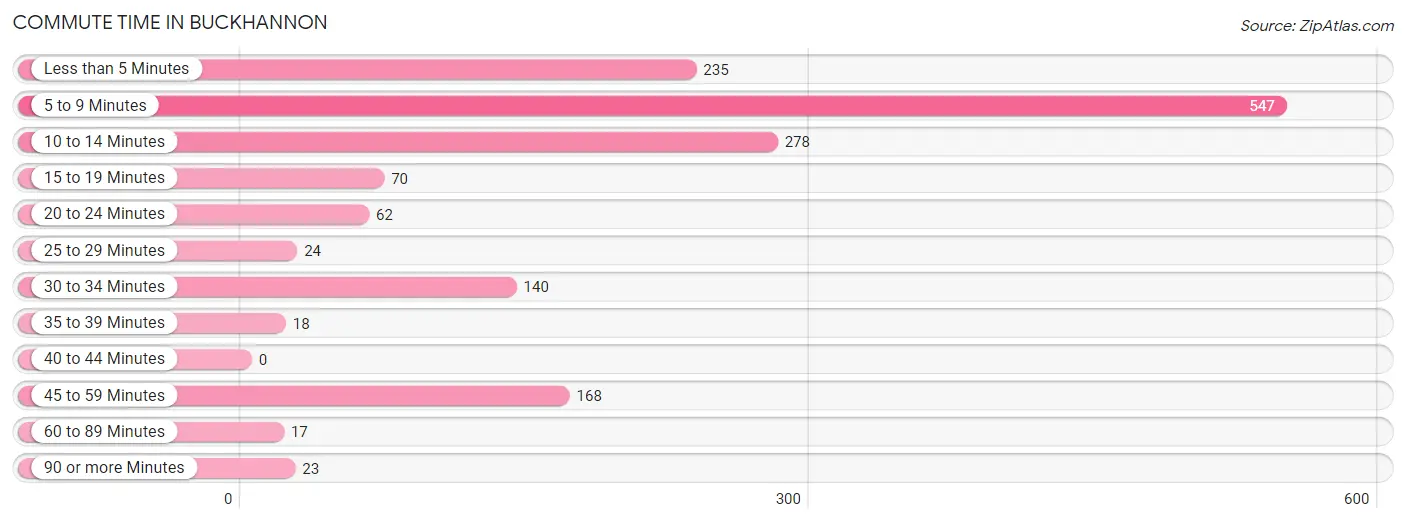
| Commute Time | # Commuters | % Commuters |
| Less than 5 Minutes | 235 | 14.8% |
| 5 to 9 Minutes | 547 | 34.6% |
| 10 to 14 Minutes | 278 | 17.6% |
| 15 to 19 Minutes | 70 | 4.4% |
| 20 to 24 Minutes | 62 | 3.9% |
| 25 to 29 Minutes | 24 | 1.5% |
| 30 to 34 Minutes | 140 | 8.8% |
| 35 to 39 Minutes | 18 | 1.1% |
| 40 to 44 Minutes | 0 | 0.0% |
| 45 to 59 Minutes | 168 | 10.6% |
| 60 to 89 Minutes | 17 | 1.1% |
| 90 or more Minutes | 23 | 1.5% |
Commute Time by Sex in Buckhannon
The most common commute times in Buckhannon are 5 to 9 minutes (309 commuters, 35.3%) for males and 5 to 9 minutes (238 commuters, 33.7%) for females.
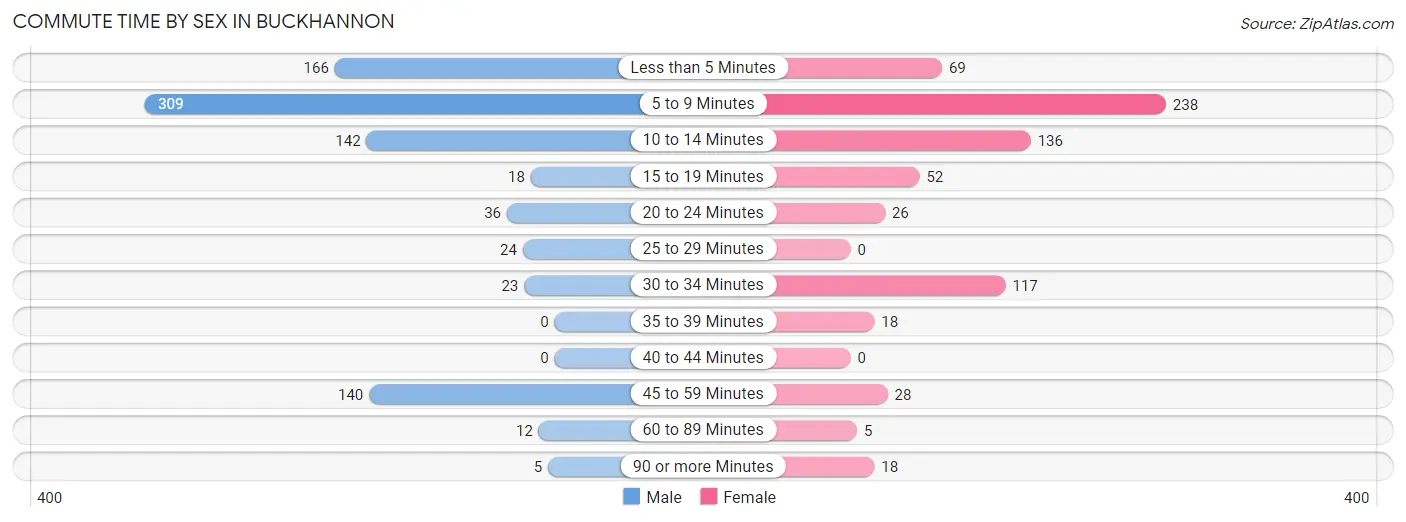
| Commute Time | Male | Female |
| Less than 5 Minutes | 166 (19.0%) | 69 (9.8%) |
| 5 to 9 Minutes | 309 (35.3%) | 238 (33.7%) |
| 10 to 14 Minutes | 142 (16.2%) | 136 (19.2%) |
| 15 to 19 Minutes | 18 (2.1%) | 52 (7.4%) |
| 20 to 24 Minutes | 36 (4.1%) | 26 (3.7%) |
| 25 to 29 Minutes | 24 (2.7%) | 0 (0.0%) |
| 30 to 34 Minutes | 23 (2.6%) | 117 (16.6%) |
| 35 to 39 Minutes | 0 (0.0%) | 18 (2.5%) |
| 40 to 44 Minutes | 0 (0.0%) | 0 (0.0%) |
| 45 to 59 Minutes | 140 (16.0%) | 28 (4.0%) |
| 60 to 89 Minutes | 12 (1.4%) | 5 (0.7%) |
| 90 or more Minutes | 5 (0.6%) | 18 (2.5%) |
Time of Departure to Work by Sex in Buckhannon
The most frequent times of departure to work in Buckhannon are 12:00 AM to 4:59 AM (157, 17.9%) for males and 7:00 AM to 7:29 AM (170, 24.0%) for females.
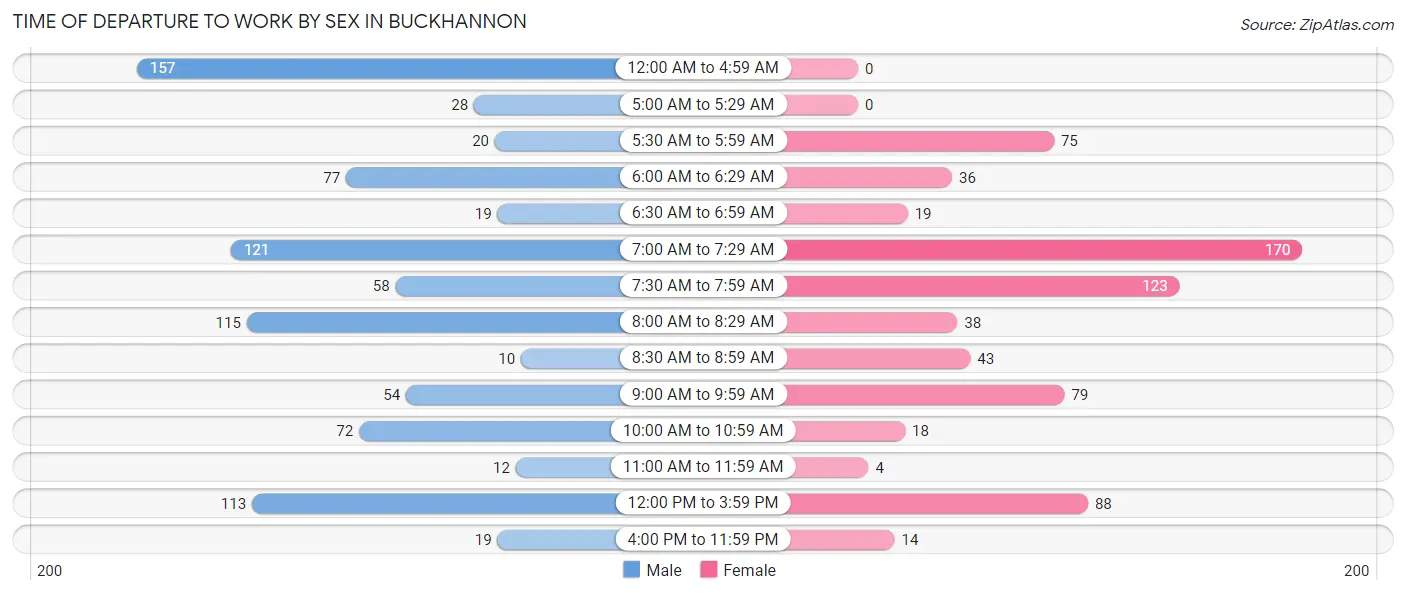
| Time of Departure | Male | Female |
| 12:00 AM to 4:59 AM | 157 (17.9%) | 0 (0.0%) |
| 5:00 AM to 5:29 AM | 28 (3.2%) | 0 (0.0%) |
| 5:30 AM to 5:59 AM | 20 (2.3%) | 75 (10.6%) |
| 6:00 AM to 6:29 AM | 77 (8.8%) | 36 (5.1%) |
| 6:30 AM to 6:59 AM | 19 (2.2%) | 19 (2.7%) |
| 7:00 AM to 7:29 AM | 121 (13.8%) | 170 (24.0%) |
| 7:30 AM to 7:59 AM | 58 (6.6%) | 123 (17.4%) |
| 8:00 AM to 8:29 AM | 115 (13.1%) | 38 (5.4%) |
| 8:30 AM to 8:59 AM | 10 (1.1%) | 43 (6.1%) |
| 9:00 AM to 9:59 AM | 54 (6.2%) | 79 (11.2%) |
| 10:00 AM to 10:59 AM | 72 (8.2%) | 18 (2.5%) |
| 11:00 AM to 11:59 AM | 12 (1.4%) | 4 (0.6%) |
| 12:00 PM to 3:59 PM | 113 (12.9%) | 88 (12.4%) |
| 4:00 PM to 11:59 PM | 19 (2.2%) | 14 (2.0%) |
| Total | 875 (100.0%) | 707 (100.0%) |
Housing Occupancy in Buckhannon
Occupancy by Ownership in Buckhannon
Of the total 2,010 dwellings in Buckhannon, owner-occupied units account for 1,258 (62.6%), while renter-occupied units make up 752 (37.4%).
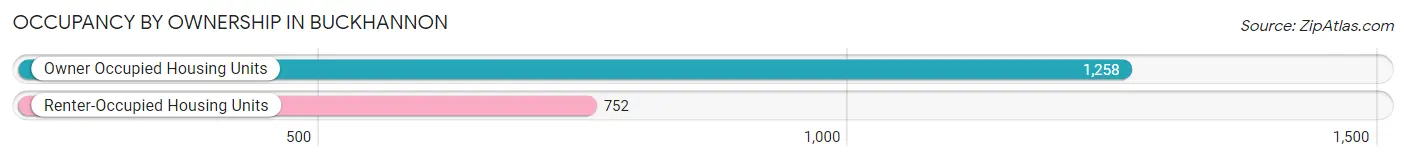
| Occupancy | # Housing Units | % Housing Units |
| Owner Occupied Housing Units | 1,258 | 62.6% |
| Renter-Occupied Housing Units | 752 | 37.4% |
| Total Occupied Housing Units | 2,010 | 100.0% |
Occupancy by Household Size in Buckhannon
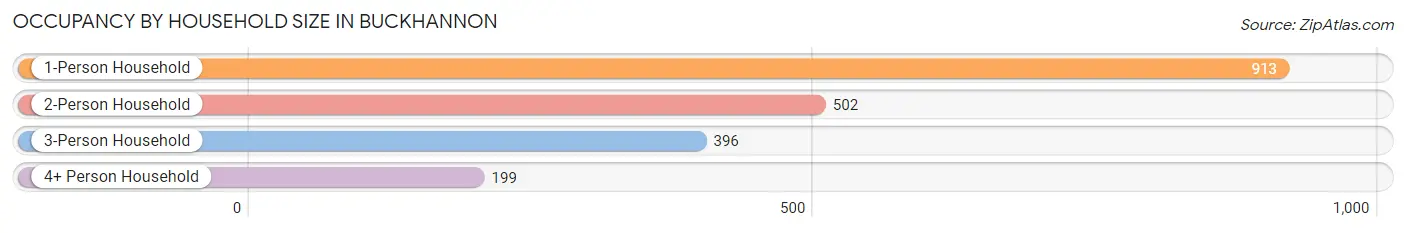
| Household Size | # Housing Units | % Housing Units |
| 1-Person Household | 913 | 45.4% |
| 2-Person Household | 502 | 25.0% |
| 3-Person Household | 396 | 19.7% |
| 4+ Person Household | 199 | 9.9% |
| Total Housing Units | 2,010 | 100.0% |
Occupancy by Ownership by Household Size in Buckhannon
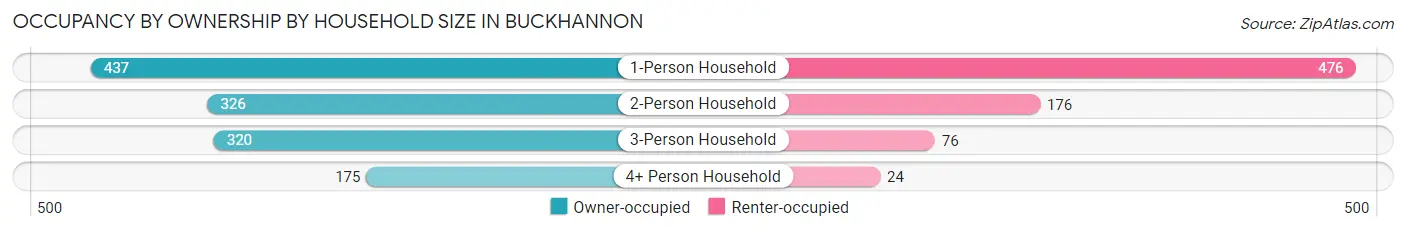
| Household Size | Owner-occupied | Renter-occupied |
| 1-Person Household | 437 (47.9%) | 476 (52.1%) |
| 2-Person Household | 326 (64.9%) | 176 (35.1%) |
| 3-Person Household | 320 (80.8%) | 76 (19.2%) |
| 4+ Person Household | 175 (87.9%) | 24 (12.1%) |
| Total Housing Units | 1,258 (62.6%) | 752 (37.4%) |
Occupancy by Educational Attainment in Buckhannon
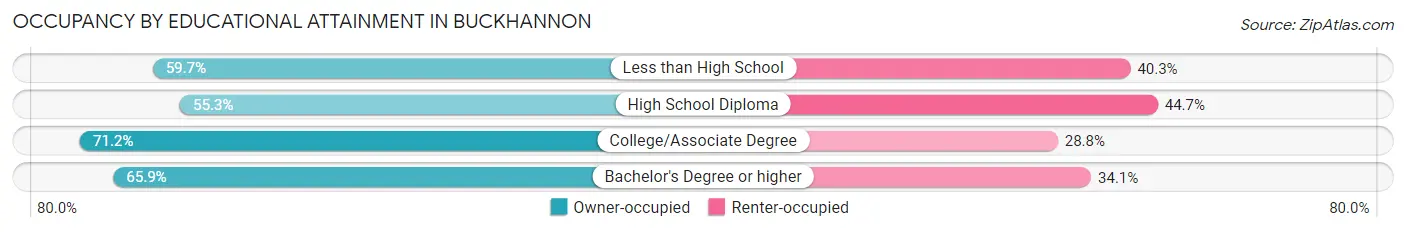
| Household Size | Owner-occupied | Renter-occupied |
| Less than High School | 108 (59.7%) | 73 (40.3%) |
| High School Diploma | 441 (55.3%) | 356 (44.7%) |
| College/Associate Degree | 388 (71.2%) | 157 (28.8%) |
| Bachelor's Degree or higher | 321 (65.9%) | 166 (34.1%) |
Occupancy by Age of Householder in Buckhannon
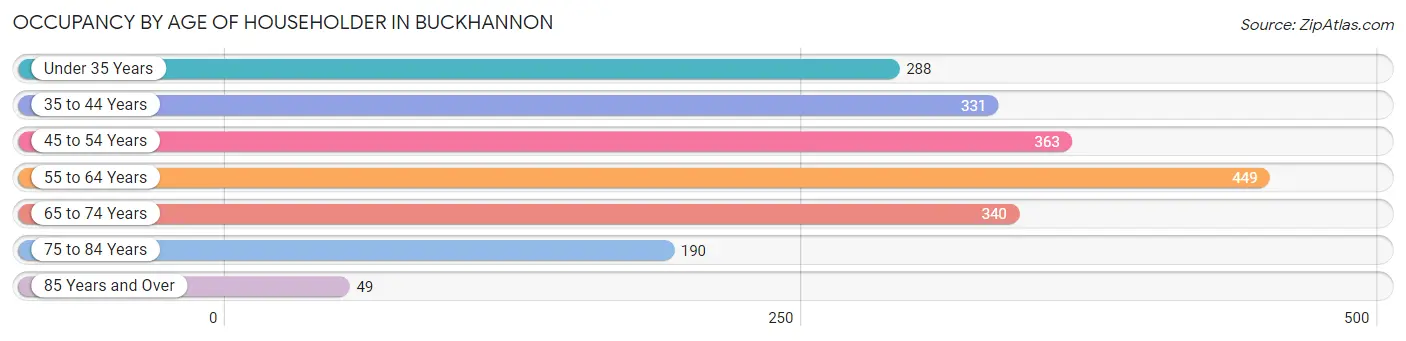
| Age Bracket | # Households | % Households |
| Under 35 Years | 288 | 14.3% |
| 35 to 44 Years | 331 | 16.5% |
| 45 to 54 Years | 363 | 18.1% |
| 55 to 64 Years | 449 | 22.3% |
| 65 to 74 Years | 340 | 16.9% |
| 75 to 84 Years | 190 | 9.5% |
| 85 Years and Over | 49 | 2.4% |
| Total | 2,010 | 100.0% |
Housing Finances in Buckhannon
Median Income by Occupancy in Buckhannon
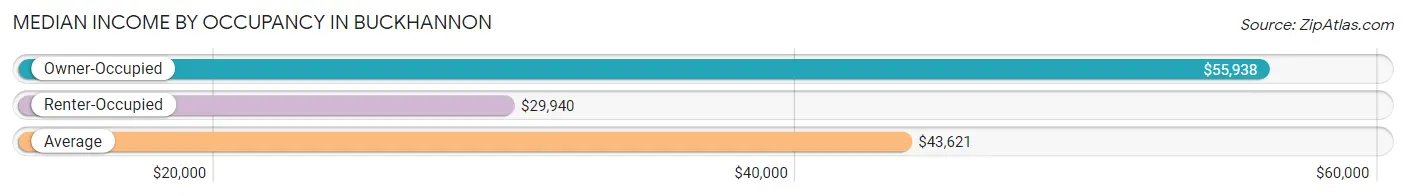
| Occupancy Type | # Households | Median Income |
| Owner-Occupied | 1,258 (62.6%) | $55,938 |
| Renter-Occupied | 752 (37.4%) | $29,940 |
| Average | 2,010 (100.0%) | $43,621 |
Occupancy by Householder Income Bracket in Buckhannon
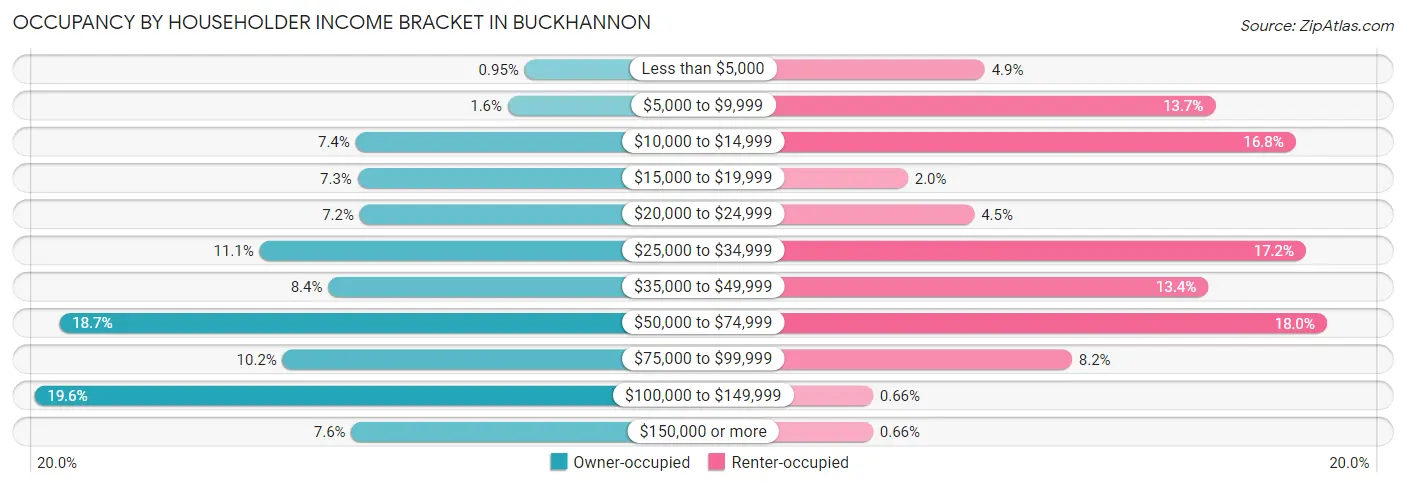
| Income Bracket | Owner-occupied | Renter-occupied |
| Less than $5,000 | 12 (0.9%) | 37 (4.9%) |
| $5,000 to $9,999 | 20 (1.6%) | 103 (13.7%) |
| $10,000 to $14,999 | 93 (7.4%) | 126 (16.8%) |
| $15,000 to $19,999 | 92 (7.3%) | 15 (2.0%) |
| $20,000 to $24,999 | 91 (7.2%) | 34 (4.5%) |
| $25,000 to $34,999 | 139 (11.1%) | 129 (17.2%) |
| $35,000 to $49,999 | 106 (8.4%) | 101 (13.4%) |
| $50,000 to $74,999 | 235 (18.7%) | 135 (17.9%) |
| $75,000 to $99,999 | 128 (10.2%) | 62 (8.2%) |
| $100,000 to $149,999 | 247 (19.6%) | 5 (0.7%) |
| $150,000 or more | 95 (7.5%) | 5 (0.7%) |
| Total | 1,258 (100.0%) | 752 (100.0%) |
Monthly Housing Cost Tiers in Buckhannon
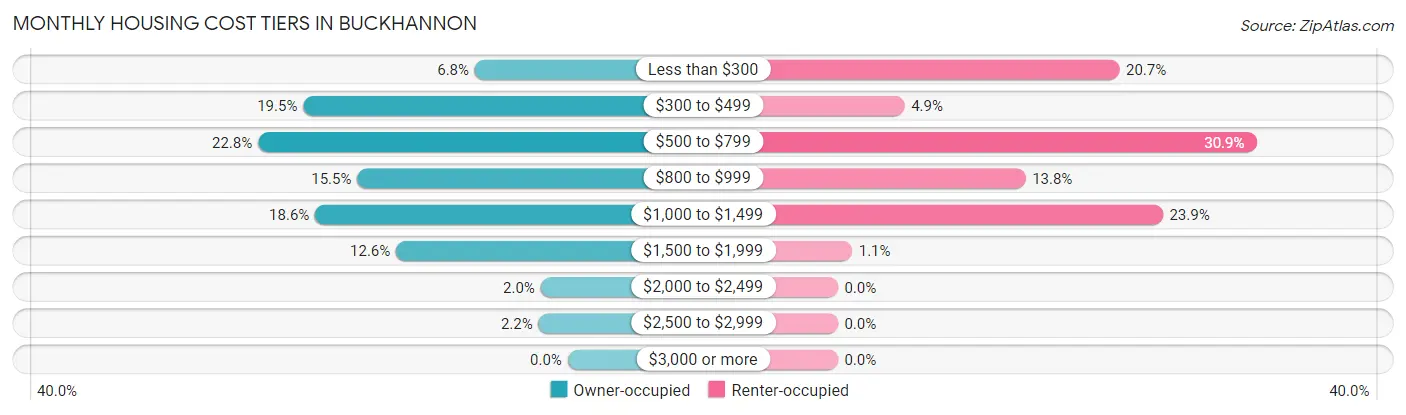
| Monthly Cost | Owner-occupied | Renter-occupied |
| Less than $300 | 86 (6.8%) | 156 (20.7%) |
| $300 to $499 | 245 (19.5%) | 37 (4.9%) |
| $500 to $799 | 287 (22.8%) | 232 (30.8%) |
| $800 to $999 | 195 (15.5%) | 104 (13.8%) |
| $1,000 to $1,499 | 234 (18.6%) | 180 (23.9%) |
| $1,500 to $1,999 | 159 (12.6%) | 8 (1.1%) |
| $2,000 to $2,499 | 25 (2.0%) | 0 (0.0%) |
| $2,500 to $2,999 | 27 (2.1%) | 0 (0.0%) |
| $3,000 or more | 0 (0.0%) | 0 (0.0%) |
| Total | 1,258 (100.0%) | 752 (100.0%) |
Physical Housing Characteristics in Buckhannon
Housing Structures in Buckhannon
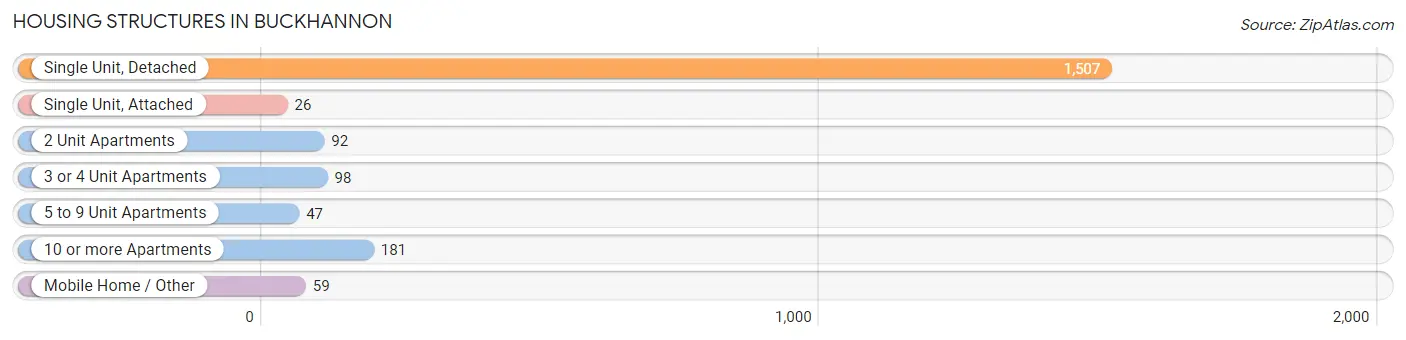
| Structure Type | # Housing Units | % Housing Units |
| Single Unit, Detached | 1,507 | 75.0% |
| Single Unit, Attached | 26 | 1.3% |
| 2 Unit Apartments | 92 | 4.6% |
| 3 or 4 Unit Apartments | 98 | 4.9% |
| 5 to 9 Unit Apartments | 47 | 2.3% |
| 10 or more Apartments | 181 | 9.0% |
| Mobile Home / Other | 59 | 2.9% |
| Total | 2,010 | 100.0% |
Housing Structures by Occupancy in Buckhannon
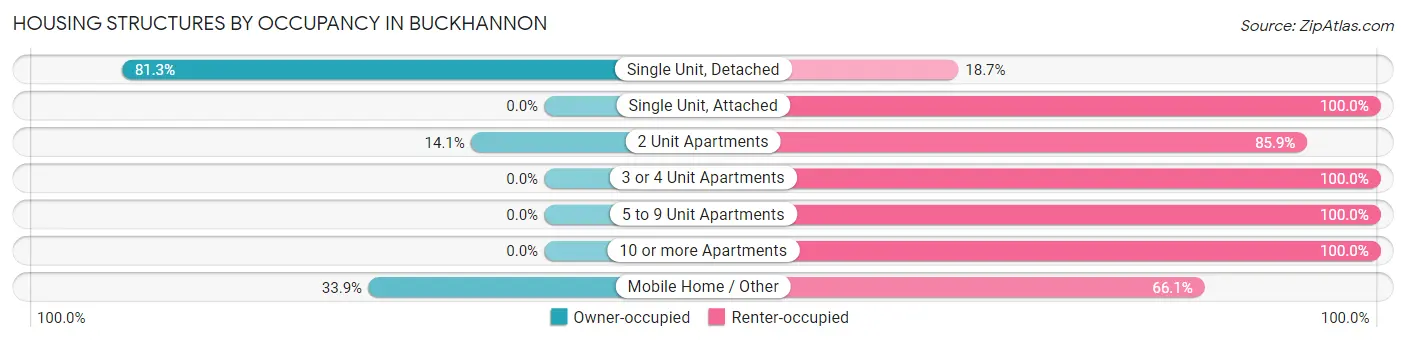
| Structure Type | Owner-occupied | Renter-occupied |
| Single Unit, Detached | 1,225 (81.3%) | 282 (18.7%) |
| Single Unit, Attached | 0 (0.0%) | 26 (100.0%) |
| 2 Unit Apartments | 13 (14.1%) | 79 (85.9%) |
| 3 or 4 Unit Apartments | 0 (0.0%) | 98 (100.0%) |
| 5 to 9 Unit Apartments | 0 (0.0%) | 47 (100.0%) |
| 10 or more Apartments | 0 (0.0%) | 181 (100.0%) |
| Mobile Home / Other | 20 (33.9%) | 39 (66.1%) |
| Total | 1,258 (62.6%) | 752 (37.4%) |
Housing Structures by Number of Rooms in Buckhannon
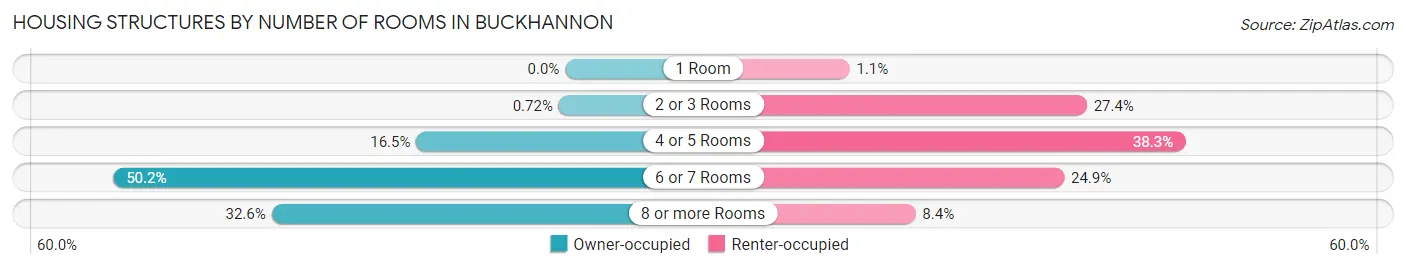
| Number of Rooms | Owner-occupied | Renter-occupied |
| 1 Room | 0 (0.0%) | 8 (1.1%) |
| 2 or 3 Rooms | 9 (0.7%) | 206 (27.4%) |
| 4 or 5 Rooms | 208 (16.5%) | 288 (38.3%) |
| 6 or 7 Rooms | 631 (50.2%) | 187 (24.9%) |
| 8 or more Rooms | 410 (32.6%) | 63 (8.4%) |
| Total | 1,258 (100.0%) | 752 (100.0%) |
Housing Structure by Heating Type in Buckhannon
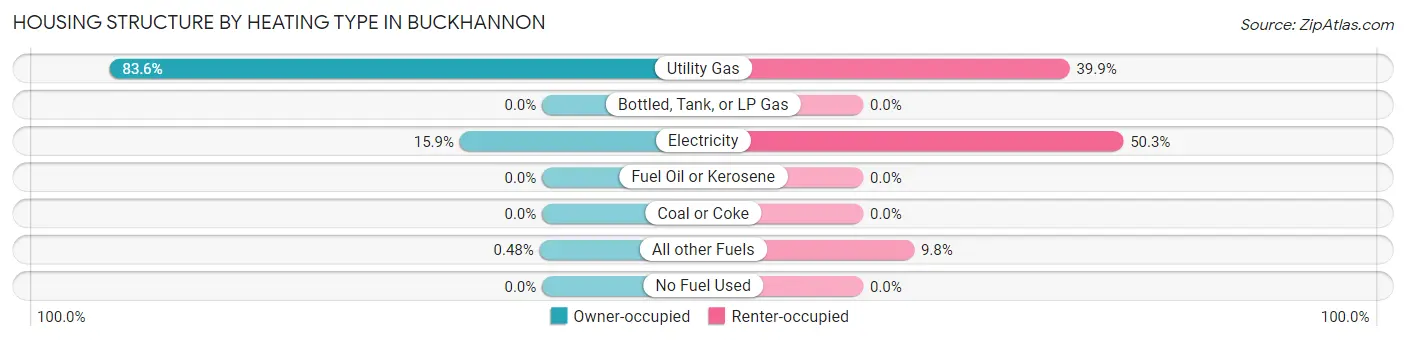
| Heating Type | Owner-occupied | Renter-occupied |
| Utility Gas | 1,052 (83.6%) | 300 (39.9%) |
| Bottled, Tank, or LP Gas | 0 (0.0%) | 0 (0.0%) |
| Electricity | 200 (15.9%) | 378 (50.3%) |
| Fuel Oil or Kerosene | 0 (0.0%) | 0 (0.0%) |
| Coal or Coke | 0 (0.0%) | 0 (0.0%) |
| All other Fuels | 6 (0.5%) | 74 (9.8%) |
| No Fuel Used | 0 (0.0%) | 0 (0.0%) |
| Total | 1,258 (100.0%) | 752 (100.0%) |
Household Vehicle Usage in Buckhannon
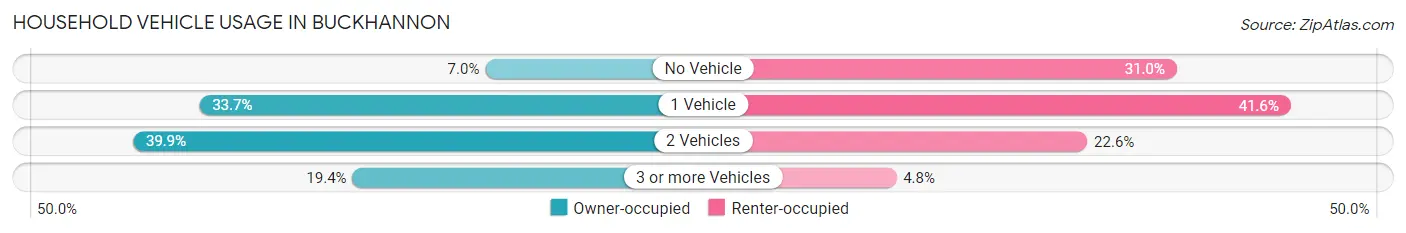
| Vehicles per Household | Owner-occupied | Renter-occupied |
| No Vehicle | 88 (7.0%) | 233 (31.0%) |
| 1 Vehicle | 424 (33.7%) | 313 (41.6%) |
| 2 Vehicles | 502 (39.9%) | 170 (22.6%) |
| 3 or more Vehicles | 244 (19.4%) | 36 (4.8%) |
| Total | 1,258 (100.0%) | 752 (100.0%) |
Real Estate & Mortgages in Buckhannon
Real Estate and Mortgage Overview in Buckhannon
| Characteristic | Without Mortgage | With Mortgage |
| Housing Units | 435 | 823 |
| Median Property Value | $141,300 | $149,600 |
| Median Household Income | $43,045 | $86 |
| Monthly Housing Costs | $390 | $0 |
| Real Estate Taxes | $694 | $0 |
Property Value by Mortgage Status in Buckhannon
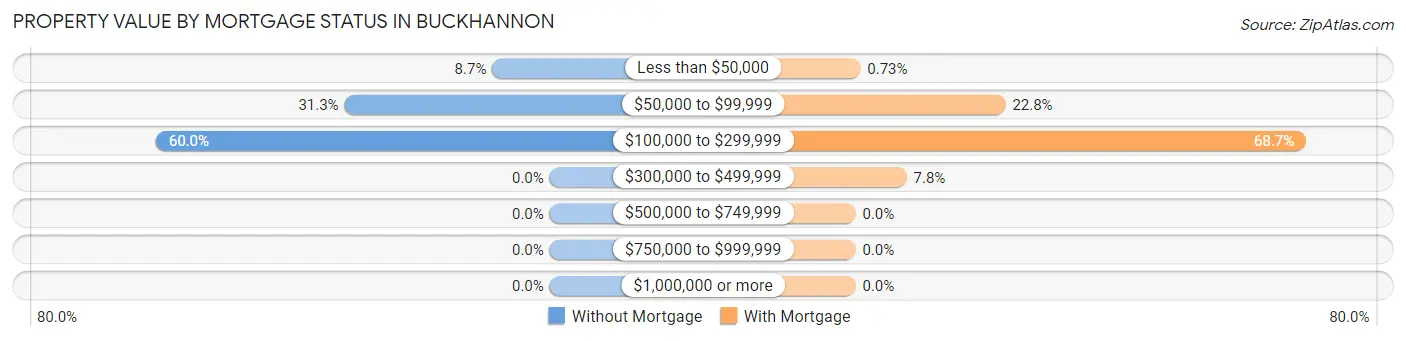
| Property Value | Without Mortgage | With Mortgage |
| Less than $50,000 | 38 (8.7%) | 6 (0.7%) |
| $50,000 to $99,999 | 136 (31.3%) | 188 (22.8%) |
| $100,000 to $299,999 | 261 (60.0%) | 565 (68.6%) |
| $300,000 to $499,999 | 0 (0.0%) | 64 (7.8%) |
| $500,000 to $749,999 | 0 (0.0%) | 0 (0.0%) |
| $750,000 to $999,999 | 0 (0.0%) | 0 (0.0%) |
| $1,000,000 or more | 0 (0.0%) | 0 (0.0%) |
| Total | 435 (100.0%) | 823 (100.0%) |
Household Income by Mortgage Status in Buckhannon
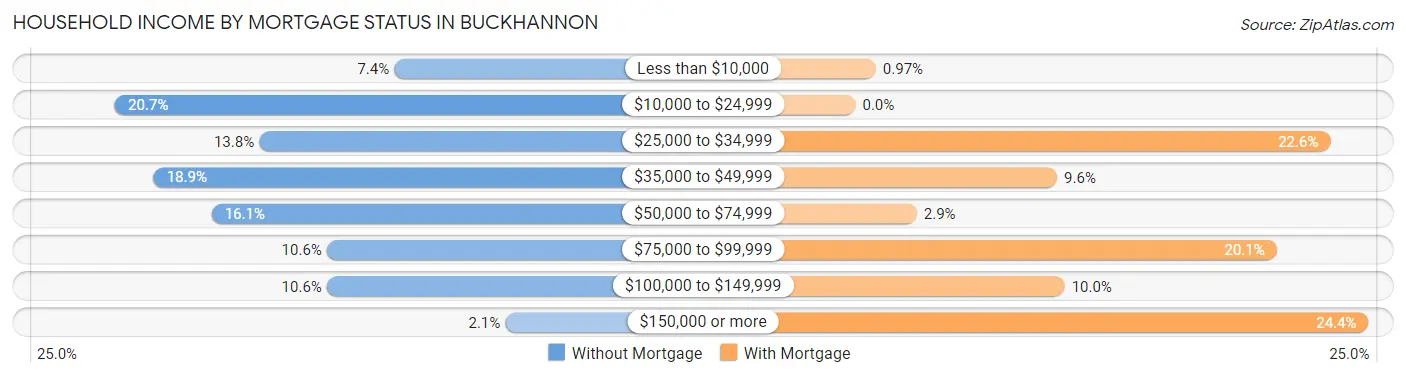
| Household Income | Without Mortgage | With Mortgage |
| Less than $10,000 | 32 (7.4%) | 8 (1.0%) |
| $10,000 to $24,999 | 90 (20.7%) | 0 (0.0%) |
| $25,000 to $34,999 | 60 (13.8%) | 186 (22.6%) |
| $35,000 to $49,999 | 82 (18.9%) | 79 (9.6%) |
| $50,000 to $74,999 | 70 (16.1%) | 24 (2.9%) |
| $75,000 to $99,999 | 46 (10.6%) | 165 (20.1%) |
| $100,000 to $149,999 | 46 (10.6%) | 82 (10.0%) |
| $150,000 or more | 9 (2.1%) | 201 (24.4%) |
| Total | 435 (100.0%) | 823 (100.0%) |
Property Value to Household Income Ratio in Buckhannon
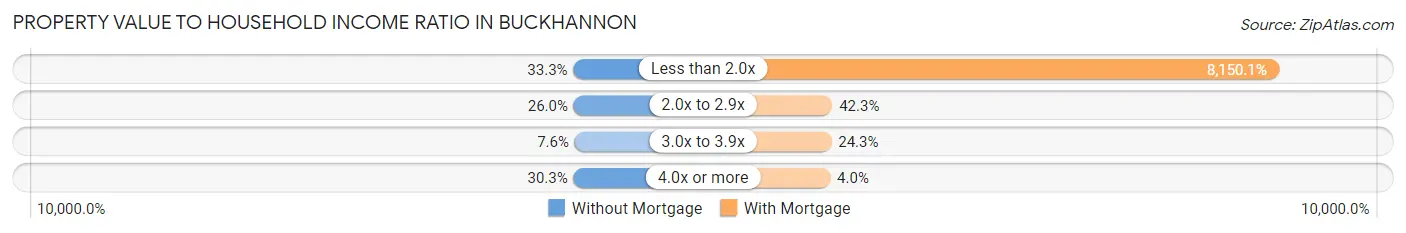
| Value-to-Income Ratio | Without Mortgage | With Mortgage |
| Less than 2.0x | 145 (33.3%) | 67,075 (8,150.1%) |
| 2.0x to 2.9x | 113 (26.0%) | 348 (42.3%) |
| 3.0x to 3.9x | 33 (7.6%) | 200 (24.3%) |
| 4.0x or more | 132 (30.3%) | 33 (4.0%) |
| Total | 435 (100.0%) | 823 (100.0%) |
Real Estate Taxes by Mortgage Status in Buckhannon
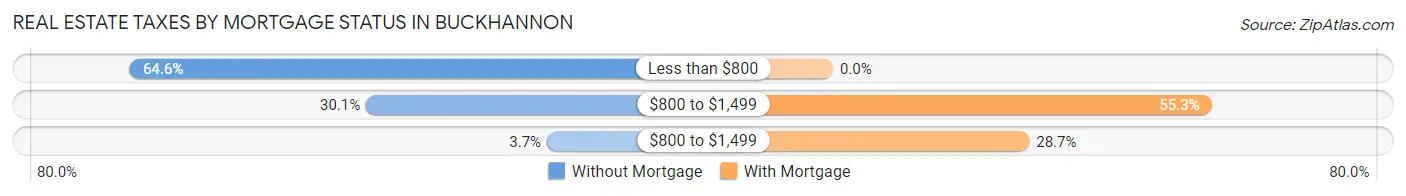
| Property Taxes | Without Mortgage | With Mortgage |
| Less than $800 | 281 (64.6%) | 0 (0.0%) |
| $800 to $1,499 | 131 (30.1%) | 455 (55.3%) |
| $800 to $1,499 | 16 (3.7%) | 236 (28.7%) |
| Total | 435 (100.0%) | 823 (100.0%) |
Health & Disability in Buckhannon
Health Insurance Coverage by Age in Buckhannon
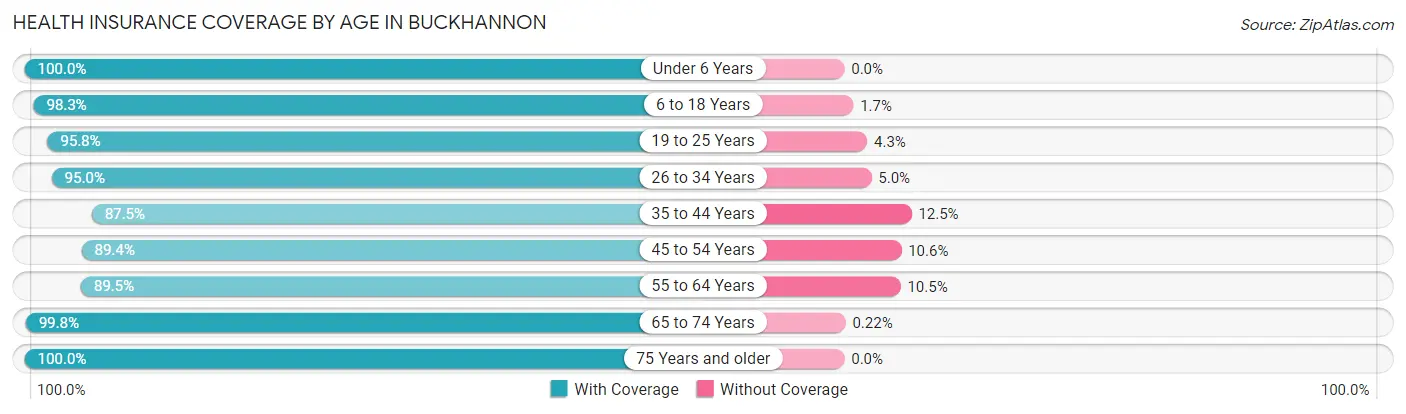
| Age Bracket | With Coverage | Without Coverage |
| Under 6 Years | 233 (100.0%) | 0 (0.0%) |
| 6 to 18 Years | 886 (98.3%) | 15 (1.7%) |
| 19 to 25 Years | 969 (95.8%) | 43 (4.3%) |
| 26 to 34 Years | 339 (95.0%) | 18 (5.0%) |
| 35 to 44 Years | 643 (87.5%) | 92 (12.5%) |
| 45 to 54 Years | 446 (89.4%) | 53 (10.6%) |
| 55 to 64 Years | 598 (89.5%) | 70 (10.5%) |
| 65 to 74 Years | 445 (99.8%) | 1 (0.2%) |
| 75 Years and older | 317 (100.0%) | 0 (0.0%) |
| Total | 4,876 (94.4%) | 292 (5.7%) |
Health Insurance Coverage by Citizenship Status in Buckhannon
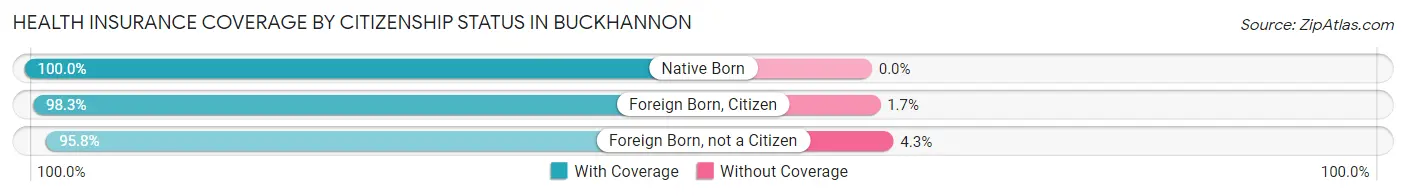
| Citizenship Status | With Coverage | Without Coverage |
| Native Born | 233 (100.0%) | 0 (0.0%) |
| Foreign Born, Citizen | 886 (98.3%) | 15 (1.7%) |
| Foreign Born, not a Citizen | 969 (95.8%) | 43 (4.3%) |
Health Insurance Coverage by Household Income in Buckhannon
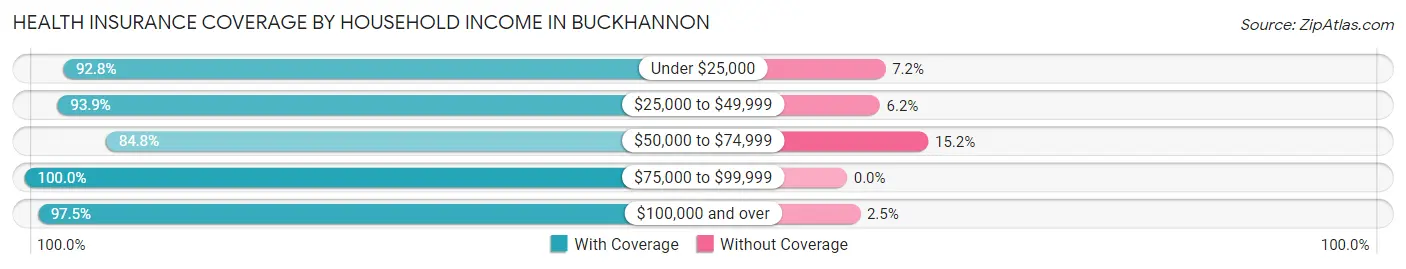
| Household Income | With Coverage | Without Coverage |
| Under $25,000 | 838 (92.8%) | 65 (7.2%) |
| $25,000 to $49,999 | 870 (93.9%) | 57 (6.1%) |
| $50,000 to $74,999 | 557 (84.8%) | 100 (15.2%) |
| $75,000 to $99,999 | 465 (100.0%) | 0 (0.0%) |
| $100,000 and over | 1,069 (97.5%) | 27 (2.5%) |
Public vs Private Health Insurance Coverage by Age in Buckhannon
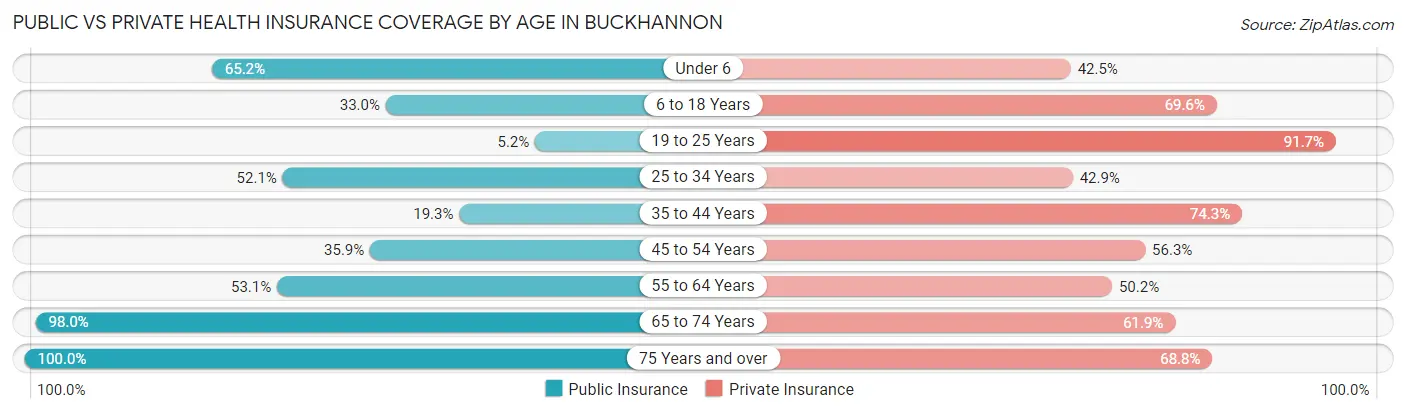
| Age Bracket | Public Insurance | Private Insurance |
| Under 6 | 152 (65.2%) | 99 (42.5%) |
| 6 to 18 Years | 297 (33.0%) | 627 (69.6%) |
| 19 to 25 Years | 53 (5.2%) | 928 (91.7%) |
| 25 to 34 Years | 186 (52.1%) | 153 (42.9%) |
| 35 to 44 Years | 142 (19.3%) | 546 (74.3%) |
| 45 to 54 Years | 179 (35.9%) | 281 (56.3%) |
| 55 to 64 Years | 355 (53.1%) | 335 (50.1%) |
| 65 to 74 Years | 437 (98.0%) | 276 (61.9%) |
| 75 Years and over | 317 (100.0%) | 218 (68.8%) |
| Total | 2,118 (41.0%) | 3,463 (67.0%) |
Disability Status by Sex by Age in Buckhannon
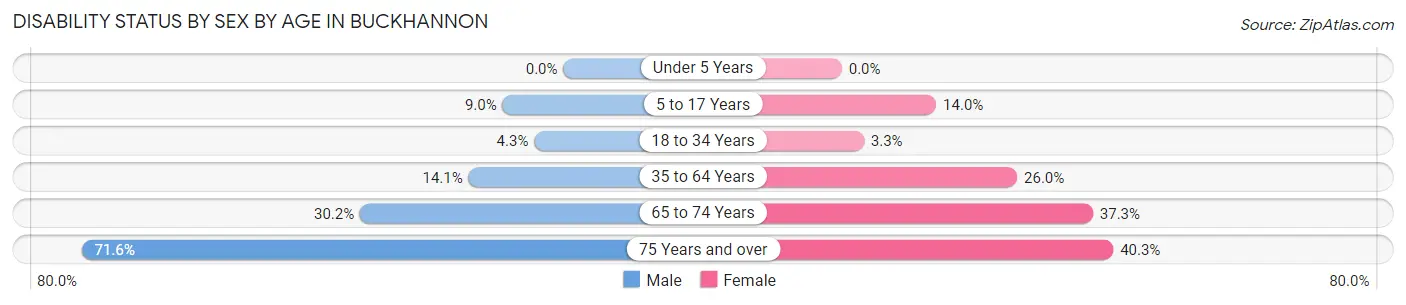
| Age Bracket | Male | Female |
| Under 5 Years | 0 (0.0%) | 0 (0.0%) |
| 5 to 17 Years | 38 (9.0%) | 22 (14.0%) |
| 18 to 34 Years | 35 (4.3%) | 30 (3.3%) |
| 35 to 64 Years | 145 (14.1%) | 227 (26.0%) |
| 65 to 74 Years | 48 (30.2%) | 107 (37.3%) |
| 75 Years and over | 83 (71.6%) | 81 (40.3%) |
Disability Class by Sex by Age in Buckhannon
Disability Class: Hearing Difficulty
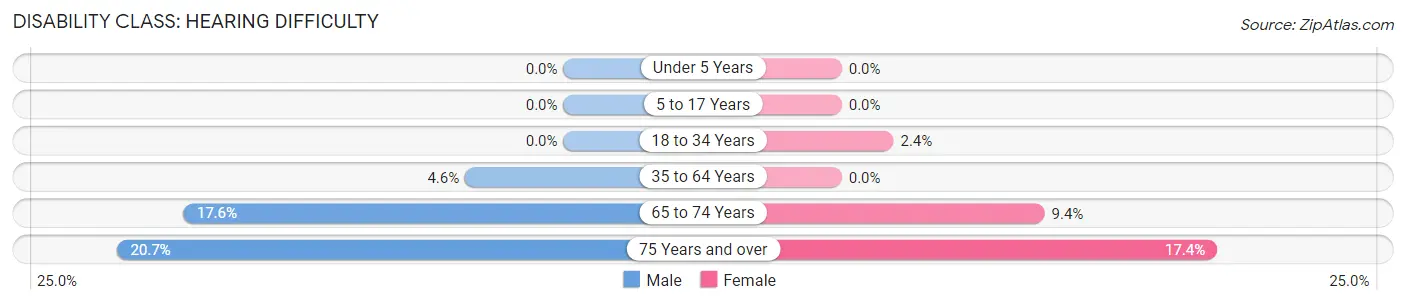
| Age Bracket | Male | Female |
| Under 5 Years | 0 (0.0%) | 0 (0.0%) |
| 5 to 17 Years | 0 (0.0%) | 0 (0.0%) |
| 18 to 34 Years | 0 (0.0%) | 22 (2.4%) |
| 35 to 64 Years | 47 (4.6%) | 0 (0.0%) |
| 65 to 74 Years | 28 (17.6%) | 27 (9.4%) |
| 75 Years and over | 24 (20.7%) | 35 (17.4%) |
Disability Class: Vision Difficulty
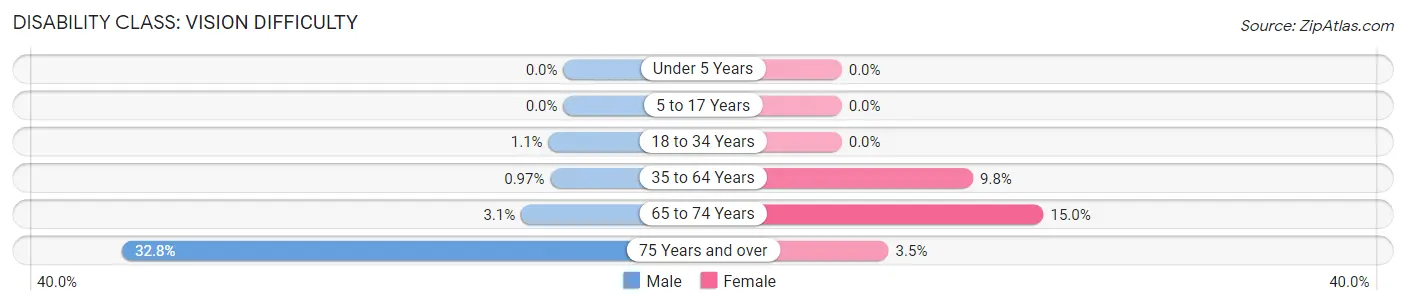
| Age Bracket | Male | Female |
| Under 5 Years | 0 (0.0%) | 0 (0.0%) |
| 5 to 17 Years | 0 (0.0%) | 0 (0.0%) |
| 18 to 34 Years | 9 (1.1%) | 0 (0.0%) |
| 35 to 64 Years | 10 (1.0%) | 85 (9.8%) |
| 65 to 74 Years | 5 (3.1%) | 43 (15.0%) |
| 75 Years and over | 38 (32.8%) | 7 (3.5%) |
Disability Class: Cognitive Difficulty
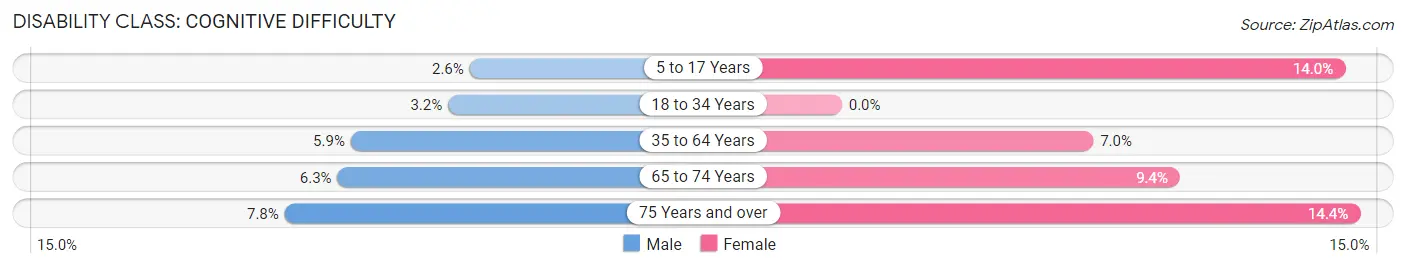
| Age Bracket | Male | Female |
| 5 to 17 Years | 11 (2.6%) | 22 (14.0%) |
| 18 to 34 Years | 26 (3.2%) | 0 (0.0%) |
| 35 to 64 Years | 61 (5.9%) | 61 (7.0%) |
| 65 to 74 Years | 10 (6.3%) | 27 (9.4%) |
| 75 Years and over | 9 (7.8%) | 29 (14.4%) |
Disability Class: Ambulatory Difficulty
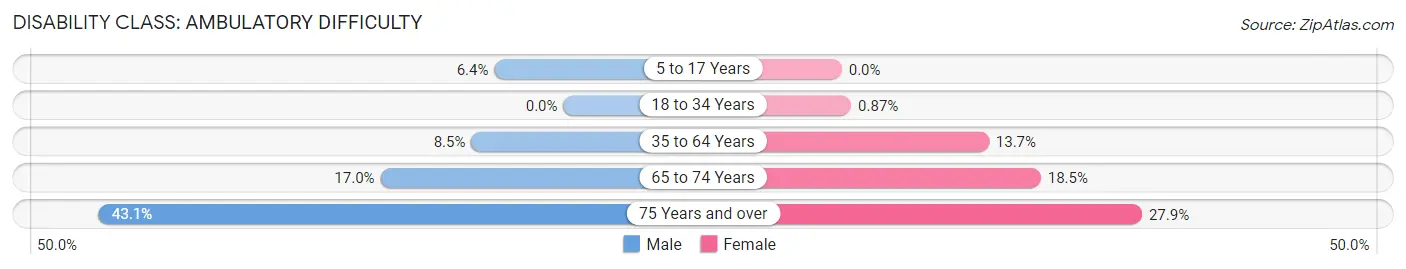
| Age Bracket | Male | Female |
| 5 to 17 Years | 27 (6.4%) | 0 (0.0%) |
| 18 to 34 Years | 0 (0.0%) | 8 (0.9%) |
| 35 to 64 Years | 88 (8.5%) | 119 (13.7%) |
| 65 to 74 Years | 27 (17.0%) | 53 (18.5%) |
| 75 Years and over | 50 (43.1%) | 56 (27.9%) |
Disability Class: Self-Care Difficulty
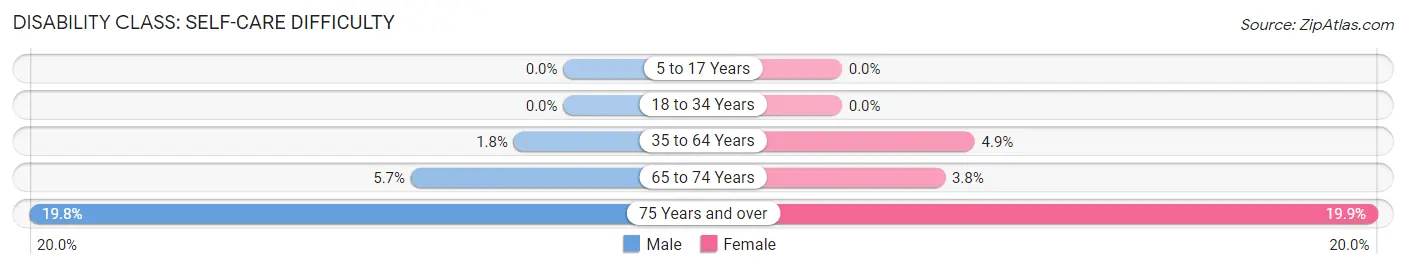
| Age Bracket | Male | Female |
| 5 to 17 Years | 0 (0.0%) | 0 (0.0%) |
| 18 to 34 Years | 0 (0.0%) | 0 (0.0%) |
| 35 to 64 Years | 19 (1.8%) | 43 (4.9%) |
| 65 to 74 Years | 9 (5.7%) | 11 (3.8%) |
| 75 Years and over | 23 (19.8%) | 40 (19.9%) |
Technology Access in Buckhannon
Computing Device Access in Buckhannon
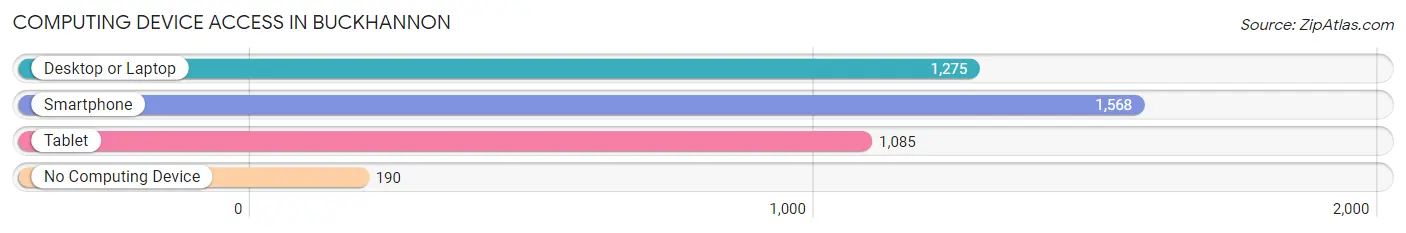
| Device Type | # Households | % Households |
| Desktop or Laptop | 1,275 | 63.4% |
| Smartphone | 1,568 | 78.0% |
| Tablet | 1,085 | 54.0% |
| No Computing Device | 190 | 9.5% |
| Total | 2,010 | 100.0% |
Internet Access in Buckhannon
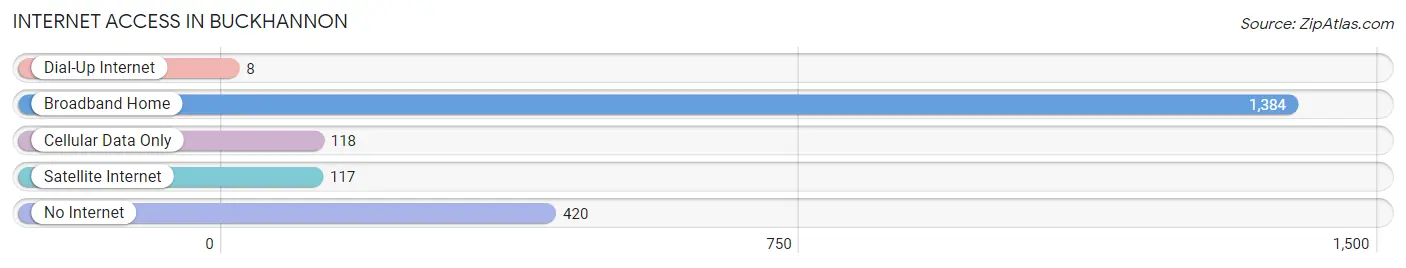
| Internet Type | # Households | % Households |
| Dial-Up Internet | 8 | 0.4% |
| Broadband Home | 1,384 | 68.9% |
| Cellular Data Only | 118 | 5.9% |
| Satellite Internet | 117 | 5.8% |
| No Internet | 420 | 20.9% |
| Total | 2,010 | 100.0% |
Buckhannon Summary
Buckhannon, West Virginia is a small city located in the north-central part of the state. It is the county seat of Upshur County and is situated in the foothills of the Allegheny Mountains. The city has a population of 5,639 according to the 2010 census.
History
The area that is now Buckhannon was first settled in 1764 by a group of settlers from Pennsylvania. The settlement was originally known as Buckhannon Old Town and was located near the present-day city of Buckhannon. The town was officially incorporated in 1816 and was named after the nearby Buckhannon River.
The city was an important stop on the Northwestern Turnpike, which connected the Ohio River to the Potomac River. The turnpike was an important route for settlers heading west and for goods being transported between the two rivers.
During the Civil War, Buckhannon was the site of several skirmishes between Union and Confederate forces. The city was also the site of the Battle of Buckhannon, which was fought on July 6, 1861. The battle was a Confederate victory and resulted in the capture of several Union soldiers.
Geography
Buckhannon is located in the north-central part of West Virginia, in the foothills of the Allegheny Mountains. The city is situated at the confluence of the Buckhannon and West Fork Rivers. The city has a total area of 2.3 square miles, all of which is land.
The city has a humid continental climate, with cold winters and hot, humid summers. The average annual temperature is 50.2°F, with an average high of 68.2°F in July and an average low of 32.2°F in January. The average annual precipitation is 40.3 inches.
Economy
The economy of Buckhannon is largely based on the service industry. The city is home to several retail stores, restaurants, and other businesses. The city is also home to several manufacturing companies, including a paper mill and a furniture factory.
The city is also home to several educational institutions, including West Virginia Wesleyan College and the West Virginia School of Osteopathic Medicine. The city is also home to the West Virginia Strawberry Festival, which is held annually in May.
Demographics
According to the 2010 census, the population of Buckhannon was 5,639. The racial makeup of the city was 95.2% White, 1.7% African American, 0.3% Native American, 0.7% Asian, 0.1% Pacific Islander, 0.7% from other races, and 1.3% from two or more races. Hispanic or Latino of any race were 1.7% of the population.
The median income for a household in the city was $30,938, and the median income for a family was $41,944. The per capita income for the city was $17,845. About 16.2% of families and 20.2% of the population were below the poverty line, including 28.2% of those under age 18 and 11.2% of those age 65 or over.
Common Questions
What is Per Capita Income in Buckhannon?
Per Capita income in Buckhannon is $24,155.
What is the Median Family Income in Buckhannon?
Median Family Income in Buckhannon is $59,605.
What is the Median Household income in Buckhannon?
Median Household Income in Buckhannon is $43,621.
What is Income or Wage Gap in Buckhannon?
Income or Wage Gap in Buckhannon is 25.0%.
Women in Buckhannon earn 75.0 cents for every dollar earned by a man.
What is Inequality or Gini Index in Buckhannon?
Inequality or Gini Index in Buckhannon is 0.46.
What is the Total Population of Buckhannon?
Total Population of Buckhannon is 5,201.
What is the Total Male Population of Buckhannon?
Total Male Population of Buckhannon is 2,657.
What is the Total Female Population of Buckhannon?
Total Female Population of Buckhannon is 2,544.
What is the Ratio of Males per 100 Females in Buckhannon?
There are 104.44 Males per 100 Females in Buckhannon.
What is the Ratio of Females per 100 Males in Buckhannon?
There are 95.75 Females per 100 Males in Buckhannon.
What is the Median Population Age in Buckhannon?
Median Population Age in Buckhannon is 35.8 Years.
What is the Average Family Size in Buckhannon
Average Family Size in Buckhannon is 2.9 People.
What is the Average Household Size in Buckhannon
Average Household Size in Buckhannon is 2.0 People.
How Large is the Labor Force in Buckhannon?
There are 2,119 People in the Labor Forcein in Buckhannon.
What is the Percentage of People in the Labor Force in Buckhannon?
47.1% of People are in the Labor Force in Buckhannon.
What is the Unemployment Rate in Buckhannon?
Unemployment Rate in Buckhannon is 6.1%.