Boomer, WV Map & Demographics
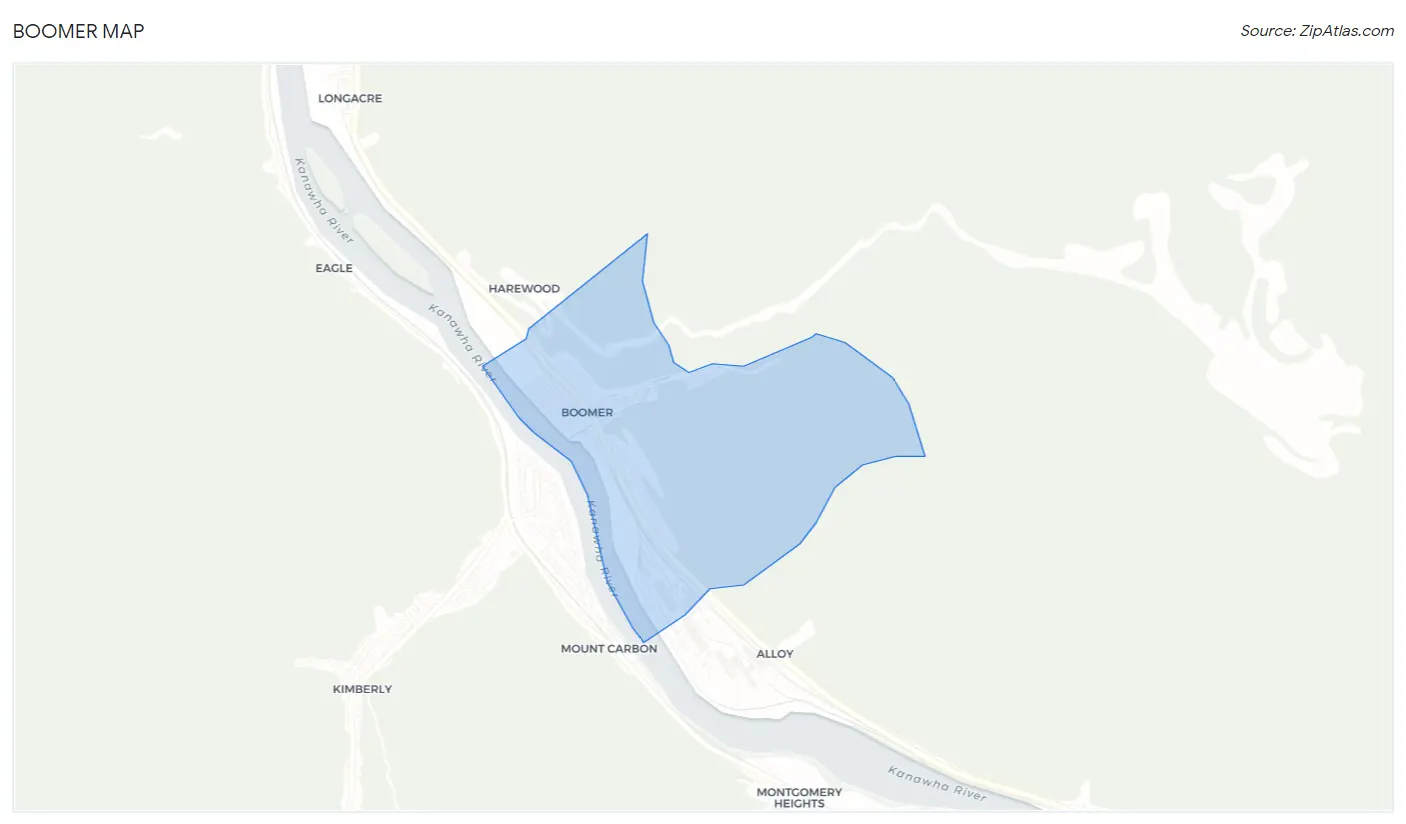
Boomer Map
Boomer Overview
$20,137
PER CAPITA INCOME
$29,048
AVG HOUSEHOLD INCOME
0.38
INEQUALITY / GINI INDEX
537
TOTAL POPULATION
371
MALE POPULATION
166
FEMALE POPULATION
223.49
MALES / 100 FEMALES
44.74
FEMALES / 100 MALES
44.3
MEDIAN AGE
3.3
AVG FAMILY SIZE
1.7
AVG HOUSEHOLD SIZE
184
LABOR FORCE [ PEOPLE ]
44.2%
PERCENT IN LABOR FORCE
9.2%
UNEMPLOYMENT RATE
Boomer Zip Codes
Boomer Area Codes
Income in Boomer
Income Overview in Boomer
| Characteristic | Number | Measure |
| Per Capita Income | 537 | $20,137 |
| Median Family Income | 88 | $0 |
| Mean Family Income | 88 | $54,886 |
| Median Household Income | 310 | $29,048 |
| Mean Household Income | 310 | $35,620 |
| Income Deficit | 88 | $0 |
| Wage / Income Gap (%) | 537 | 0.00% |
| Wage / Income Gap ($) | 537 | 100.00¢ per $1 |
| Gini / Inequality Index | 537 | 0.38 |
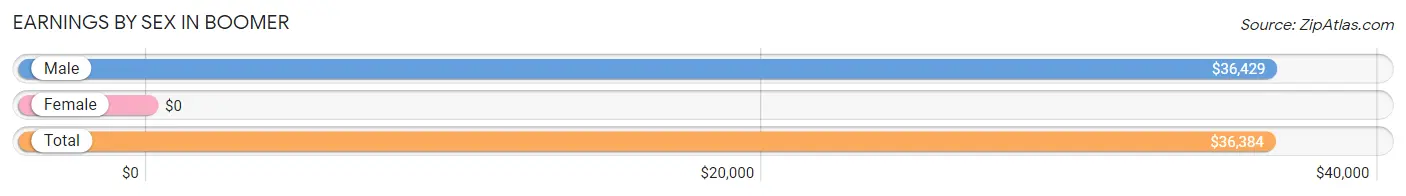
Earnings by Sex in Boomer
| Sex | Number | Average Earnings |
| Male | 82 (49.1%) | $36,429 |
| Female | 85 (50.9%) | $0 |
| Total | 167 (100.0%) | $36,384 |
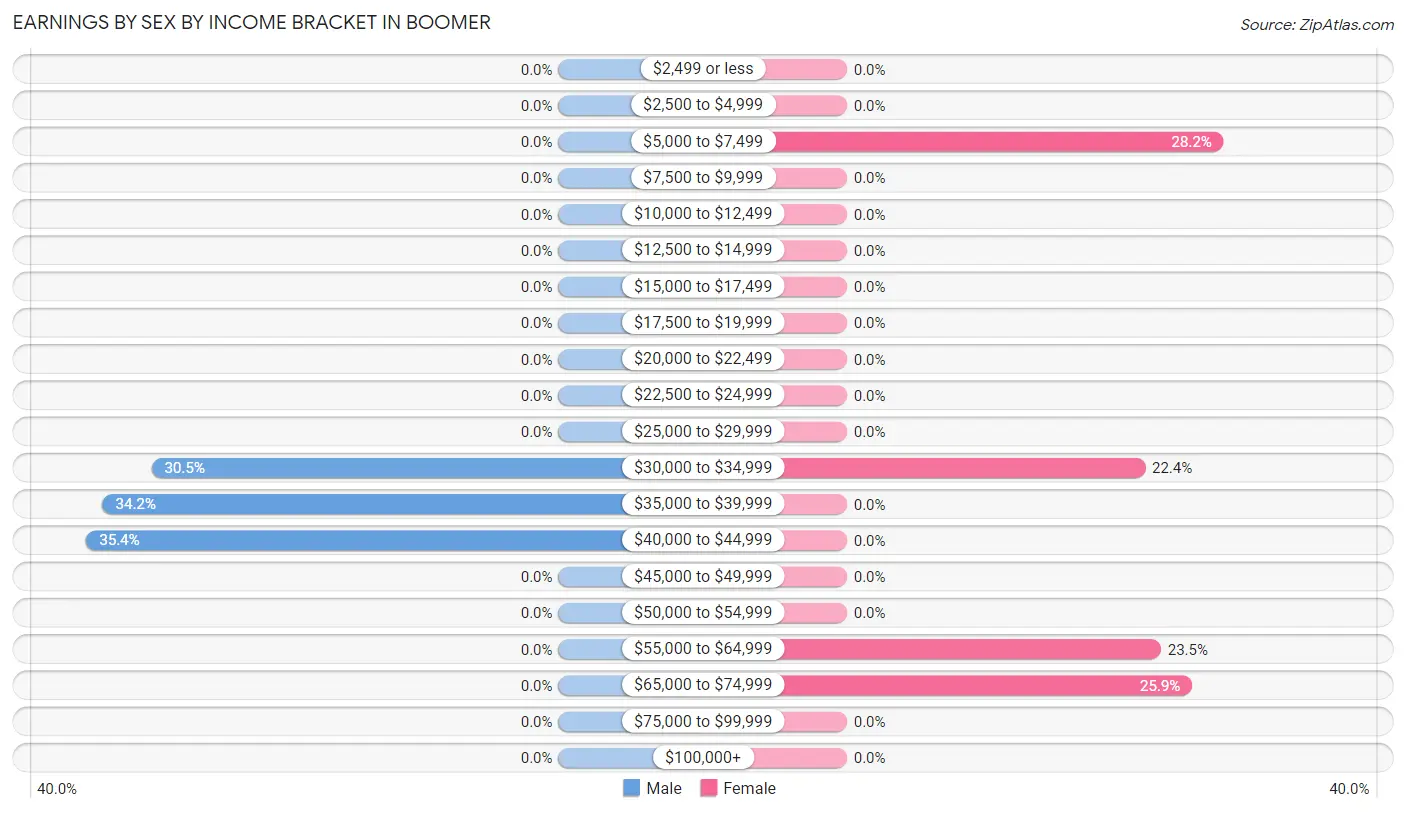
Earnings by Sex by Income Bracket in Boomer
The most common earnings brackets in Boomer are $40,000 to $44,999 for men (29 | 35.4%) and $5,000 to $7,499 for women (24 | 28.2%).
| Income | Male | Female |
| $2,499 or less | 0 (0.0%) | 0 (0.0%) |
| $2,500 to $4,999 | 0 (0.0%) | 0 (0.0%) |
| $5,000 to $7,499 | 0 (0.0%) | 24 (28.2%) |
| $7,500 to $9,999 | 0 (0.0%) | 0 (0.0%) |
| $10,000 to $12,499 | 0 (0.0%) | 0 (0.0%) |
| $12,500 to $14,999 | 0 (0.0%) | 0 (0.0%) |
| $15,000 to $17,499 | 0 (0.0%) | 0 (0.0%) |
| $17,500 to $19,999 | 0 (0.0%) | 0 (0.0%) |
| $20,000 to $22,499 | 0 (0.0%) | 0 (0.0%) |
| $22,500 to $24,999 | 0 (0.0%) | 0 (0.0%) |
| $25,000 to $29,999 | 0 (0.0%) | 0 (0.0%) |
| $30,000 to $34,999 | 25 (30.5%) | 19 (22.4%) |
| $35,000 to $39,999 | 28 (34.2%) | 0 (0.0%) |
| $40,000 to $44,999 | 29 (35.4%) | 0 (0.0%) |
| $45,000 to $49,999 | 0 (0.0%) | 0 (0.0%) |
| $50,000 to $54,999 | 0 (0.0%) | 0 (0.0%) |
| $55,000 to $64,999 | 0 (0.0%) | 20 (23.5%) |
| $65,000 to $74,999 | 0 (0.0%) | 22 (25.9%) |
| $75,000 to $99,999 | 0 (0.0%) | 0 (0.0%) |
| $100,000+ | 0 (0.0%) | 0 (0.0%) |
| Total | 82 (100.0%) | 85 (100.0%) |
Earnings by Sex by Educational Attainment in Boomer
| Educational Attainment | Male Income | Female Income |
| Less than High School | - | - |
| High School Diploma | - | - |
| College or Associate's Degree | - | - |
| Bachelor's Degree | - | - |
| Graduate Degree | - | - |
| Total | $36,429 | $0 |
Family Income in Boomer
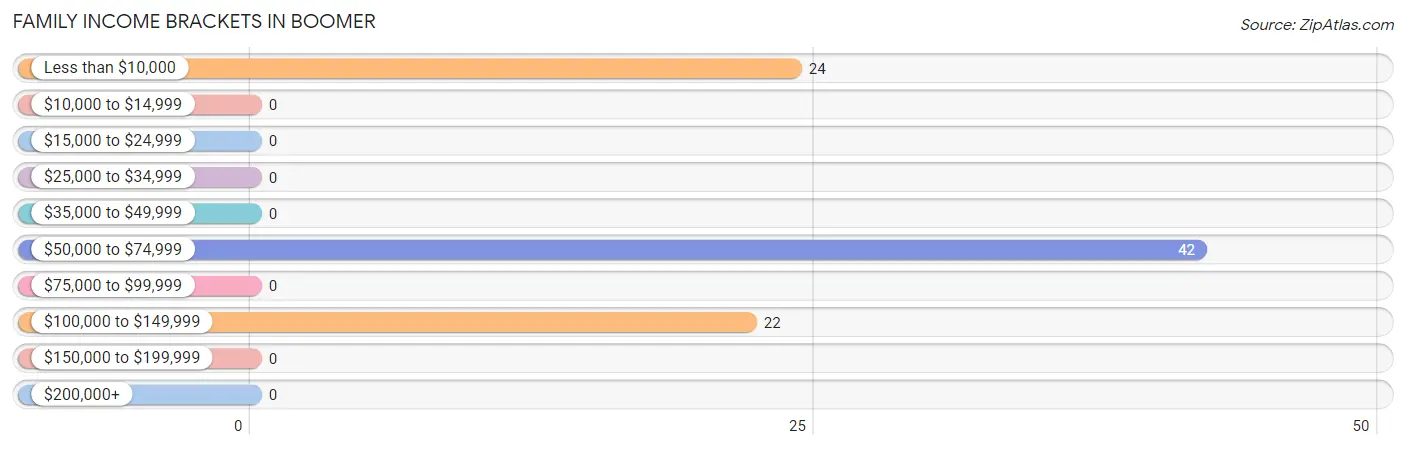
Family Income Brackets in Boomer
According to the Boomer family income data, there are 42 families falling into the $50,000 to $74,999 income range, which is the most common income bracket and makes up 47.7% of all families.
| Income Bracket | # Families | % Families |
| Less than $10,000 | 24 | 27.3% |
| $10,000 to $14,999 | 0 | 0.0% |
| $15,000 to $24,999 | 0 | 0.0% |
| $25,000 to $34,999 | 0 | 0.0% |
| $35,000 to $49,999 | 0 | 0.0% |
| $50,000 to $74,999 | 42 | 47.7% |
| $75,000 to $99,999 | 0 | 0.0% |
| $100,000 to $149,999 | 22 | 25.0% |
| $150,000 to $199,999 | 0 | 0.0% |
| $200,000+ | 0 | 0.0% |
Family Income by Famaliy Size in Boomer
| Income Bracket | # Families | Median Income |
| 2-Person Families | 22 (25.0%) | $0 |
| 3-Person Families | 24 (27.3%) | $0 |
| 4-Person Families | 0 (0.0%) | $0 |
| 5-Person Families | 42 (47.7%) | $0 |
| 6-Person Families | 0 (0.0%) | $0 |
| 7+ Person Families | 0 (0.0%) | $0 |
| Total | 88 (100.0%) | $0 |
Family Income by Number of Earners in Boomer
| Number of Earners | # Families | Median Income |
| No Earners | 0 (0.0%) | $0 |
| 1 Earner | 66 (75.0%) | $0 |
| 2 Earners | 22 (25.0%) | $0 |
| 3+ Earners | 0 (0.0%) | $0 |
| Total | 88 (100.0%) | $0 |
Household Income in Boomer
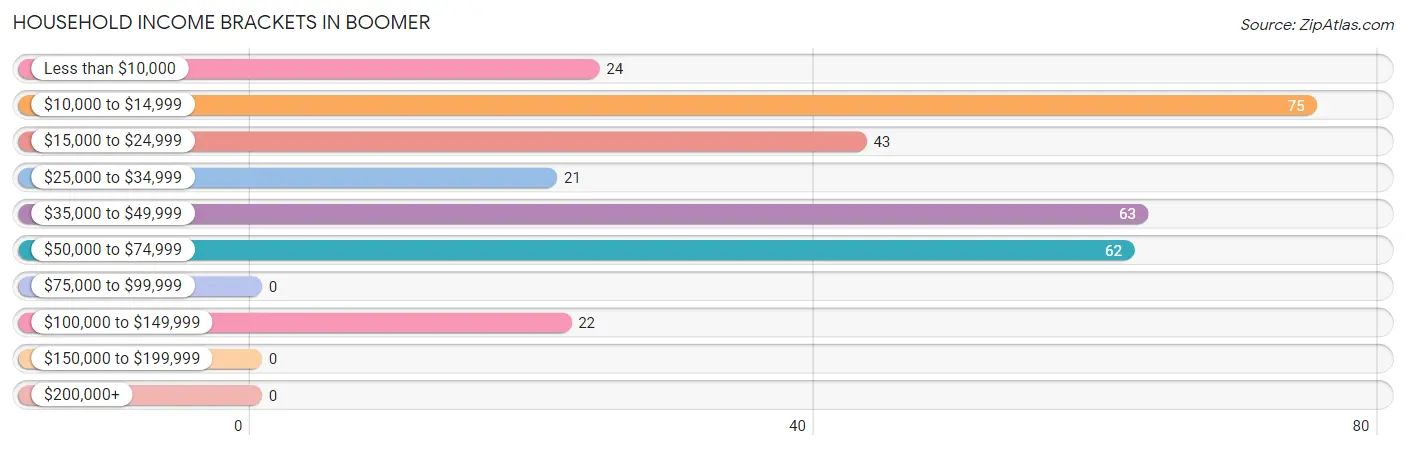
Household Income Brackets in Boomer
With 75 households falling in the category, the $10,000 to $14,999 income range is the most frequent in Boomer, accounting for 24.2% of all households.
| Income Bracket | # Households | % Households |
| Less than $10,000 | 24 | 7.7% |
| $10,000 to $14,999 | 75 | 24.2% |
| $15,000 to $24,999 | 43 | 13.9% |
| $25,000 to $34,999 | 21 | 6.8% |
| $35,000 to $49,999 | 63 | 20.3% |
| $50,000 to $74,999 | 62 | 20.0% |
| $75,000 to $99,999 | 0 | 0.0% |
| $100,000 to $149,999 | 22 | 7.1% |
| $150,000 to $199,999 | 0 | 0.0% |
| $200,000+ | 0 | 0.0% |
Household Income by Householder Age in Boomer
The median household income in Boomer is $29,048, with the highest median household income of $36,830 found in the 25 to 44 years age bracket for the primary householder. A total of 89 households (28.7%) fall into this category.
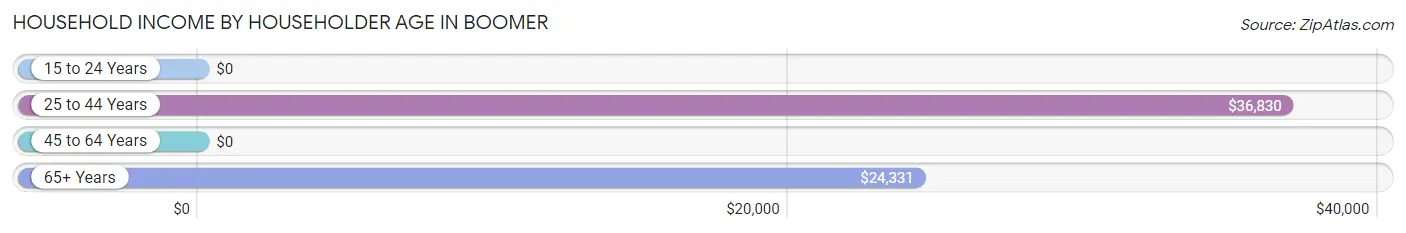
| Income Bracket | # Households | Median Income |
| 15 to 24 Years | 0 (0.0%) | $0 |
| 25 to 44 Years | 89 (28.7%) | $36,830 |
| 45 to 64 Years | 120 (38.7%) | $0 |
| 65+ Years | 101 (32.6%) | $24,331 |
| Total | 310 (100.0%) | $29,048 |
Poverty in Boomer
Income Below Poverty by Sex and Age in Boomer
With 34.8% poverty level for males and 24.7% for females among the residents of Boomer, under 5 year old males and 25 to 34 year old females are the most vulnerable to poverty, with 23 males (100.0%) and 24 females (54.5%) in their respective age groups living below the poverty level.
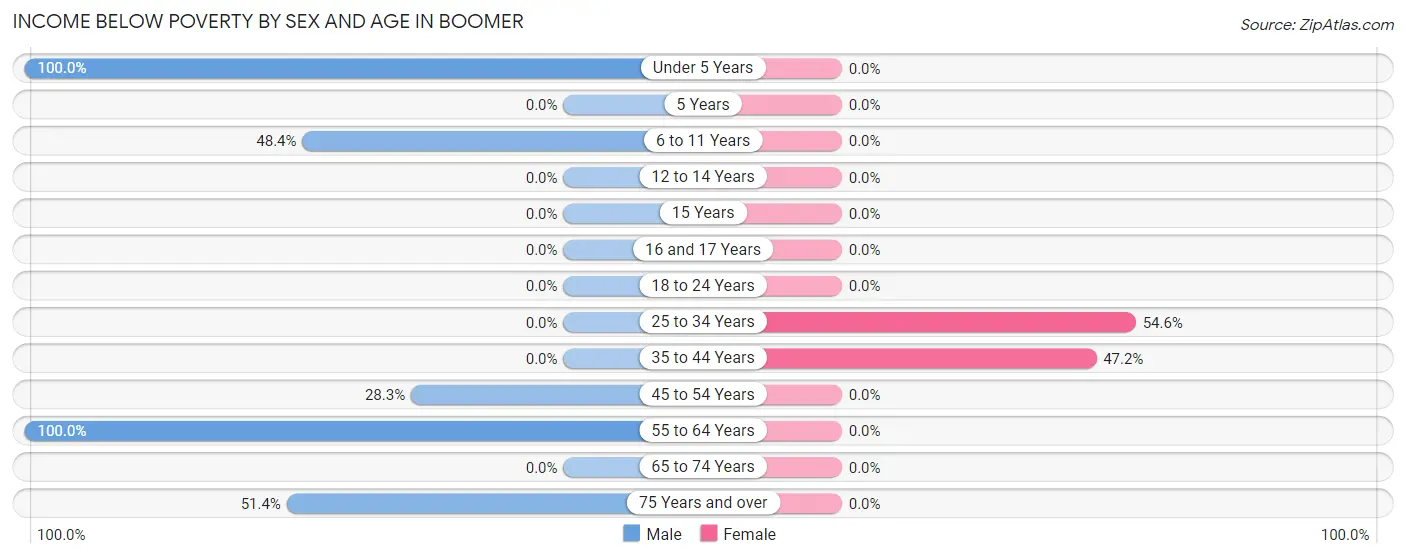
| Age Bracket | Male | Female |
| Under 5 Years | 23 (100.0%) | 0 (0.0%) |
| 5 Years | 0 (0.0%) | 0 (0.0%) |
| 6 to 11 Years | 31 (48.4%) | 0 (0.0%) |
| 12 to 14 Years | 0 (0.0%) | 0 (0.0%) |
| 15 Years | 0 (0.0%) | 0 (0.0%) |
| 16 and 17 Years | 0 (0.0%) | 0 (0.0%) |
| 18 to 24 Years | 0 (0.0%) | 0 (0.0%) |
| 25 to 34 Years | 0 (0.0%) | 24 (54.5%) |
| 35 to 44 Years | 0 (0.0%) | 17 (47.2%) |
| 45 to 54 Years | 28 (28.3%) | 0 (0.0%) |
| 55 to 64 Years | 28 (100.0%) | 0 (0.0%) |
| 65 to 74 Years | 0 (0.0%) | 0 (0.0%) |
| 75 Years and over | 19 (51.3%) | 0 (0.0%) |
| Total | 129 (34.8%) | 41 (24.7%) |
Income Above Poverty by Sex and Age in Boomer
According to the poverty statistics in Boomer, males aged 12 to 14 years and females aged 45 to 54 years are the age groups that are most secure financially, with 100.0% of males and 100.0% of females in these age groups living above the poverty line.
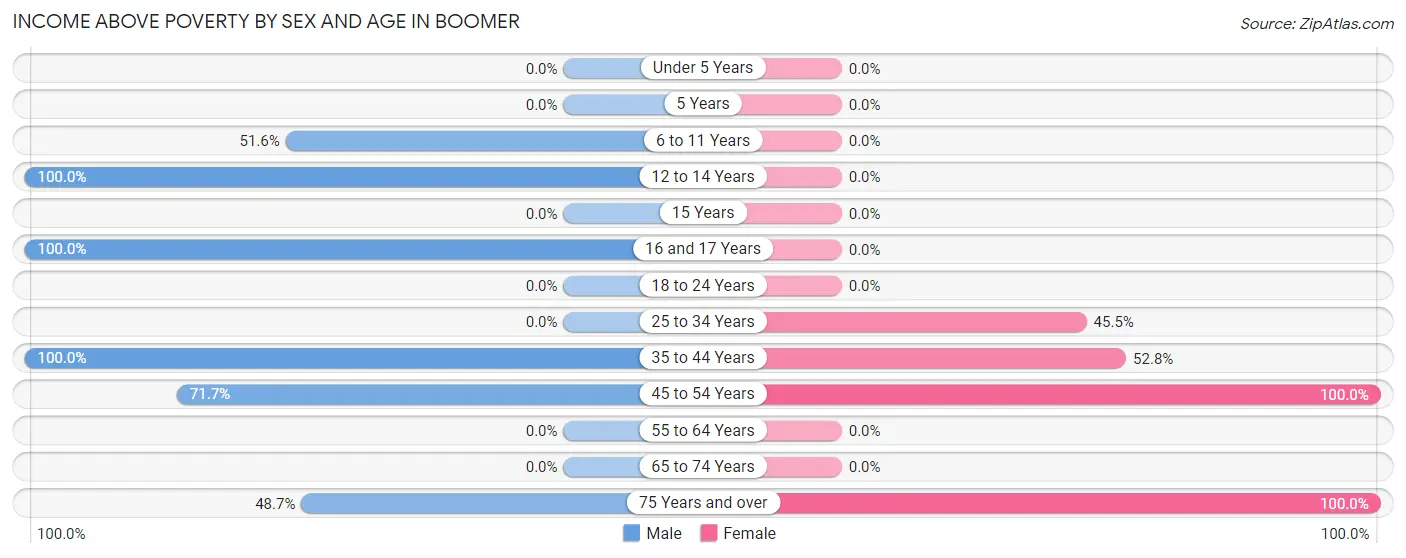
| Age Bracket | Male | Female |
| Under 5 Years | 0 (0.0%) | 0 (0.0%) |
| 5 Years | 0 (0.0%) | 0 (0.0%) |
| 6 to 11 Years | 33 (51.6%) | 0 (0.0%) |
| 12 to 14 Years | 34 (100.0%) | 0 (0.0%) |
| 15 Years | 0 (0.0%) | 0 (0.0%) |
| 16 and 17 Years | 33 (100.0%) | 0 (0.0%) |
| 18 to 24 Years | 0 (0.0%) | 0 (0.0%) |
| 25 to 34 Years | 0 (0.0%) | 20 (45.5%) |
| 35 to 44 Years | 53 (100.0%) | 19 (52.8%) |
| 45 to 54 Years | 71 (71.7%) | 22 (100.0%) |
| 55 to 64 Years | 0 (0.0%) | 0 (0.0%) |
| 65 to 74 Years | 0 (0.0%) | 0 (0.0%) |
| 75 Years and over | 18 (48.6%) | 64 (100.0%) |
| Total | 242 (65.2%) | 125 (75.3%) |
Income Below Poverty Among Married-Couple Families in Boomer
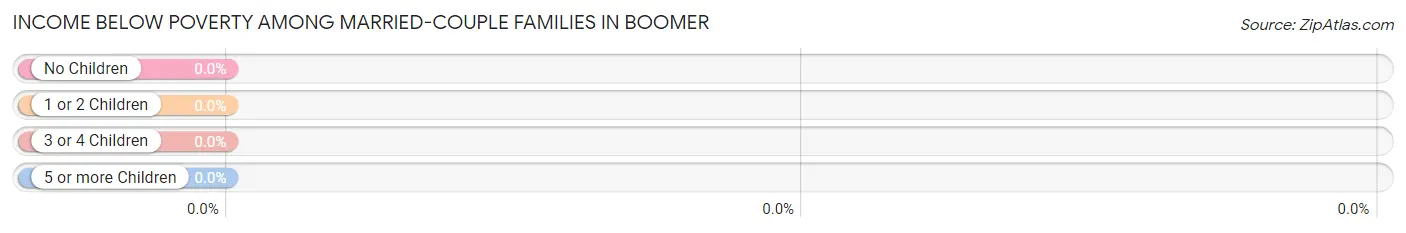
| Children | Above Poverty | Below Poverty |
| No Children | 22 (100.0%) | 0 (0.0%) |
| 1 or 2 Children | 0 (0.0%) | 0 (0.0%) |
| 3 or 4 Children | 42 (100.0%) | 0 (0.0%) |
| 5 or more Children | 0 (0.0%) | 0 (0.0%) |
| Total | 64 (100.0%) | 0 (0.0%) |
Income Below Poverty Among Single-Parent Households in Boomer
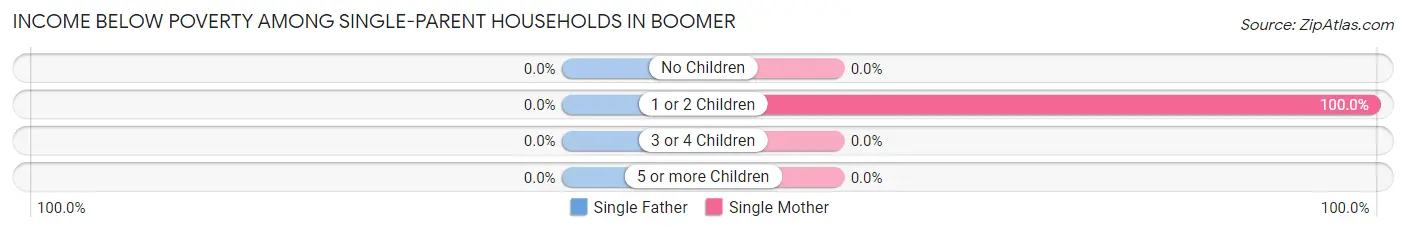
| Children | Single Father | Single Mother |
| No Children | 0 (0.0%) | 0 (0.0%) |
| 1 or 2 Children | 0 (0.0%) | 24 (100.0%) |
| 3 or 4 Children | 0 (0.0%) | 0 (0.0%) |
| 5 or more Children | 0 (0.0%) | 0 (0.0%) |
| Total | 0 (0.0%) | 24 (100.0%) |
Income Below Poverty Among Married-Couple vs Single-Parent Households in Boomer
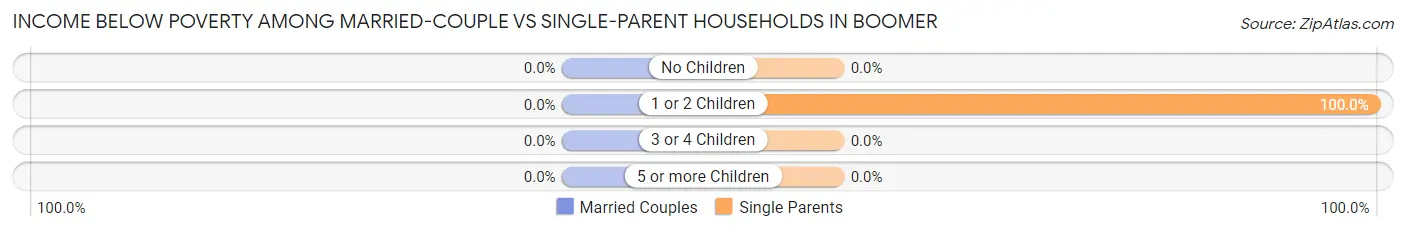
| Children | Married-Couple Families | Single-Parent Households |
| No Children | 0 (0.0%) | 0 (0.0%) |
| 1 or 2 Children | 0 (0.0%) | 24 (100.0%) |
| 3 or 4 Children | 0 (0.0%) | 0 (0.0%) |
| 5 or more Children | 0 (0.0%) | 0 (0.0%) |
| Total | 0 (0.0%) | 24 (100.0%) |
Race in Boomer
The most populous races in Boomer are White / Caucasian (332 | 61.8%), and Black / African American (205 | 38.2%).
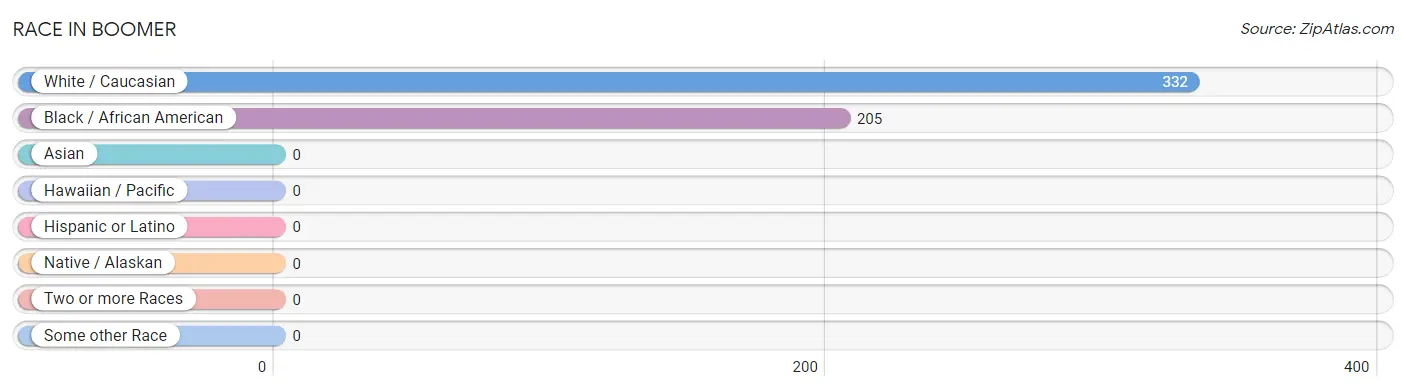
| Race | # Population | % Population |
| Asian | 0 | 0.0% |
| Black / African American | 205 | 38.2% |
| Hawaiian / Pacific | 0 | 0.0% |
| Hispanic or Latino | 0 | 0.0% |
| Native / Alaskan | 0 | 0.0% |
| White / Caucasian | 332 | 61.8% |
| Two or more Races | 0 | 0.0% |
| Some other Race | 0 | 0.0% |
| Total | 537 | 100.0% |
Ancestry in Boomer
The most populous ancestries reported in Boomer are American (78 | 14.5%), German (56 | 10.4%), Eastern European (28 | 5.2%), French (21 | 3.9%), and European (20 | 3.7%), together accounting for 37.8% of all Boomer residents.
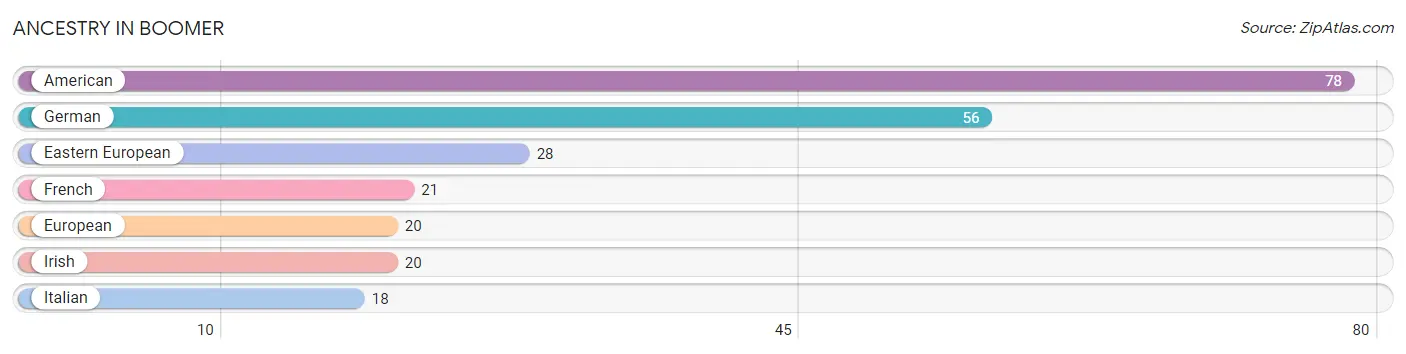
| Ancestry | # Population | % Population |
| American | 78 | 14.5% |
| Eastern European | 28 | 5.2% |
| European | 20 | 3.7% |
| French | 21 | 3.9% |
| German | 56 | 10.4% |
| Irish | 20 | 3.7% |
| Italian | 18 | 3.4% | View All 7 Rows |
Immigrants in Boomer

| Immigration Origin | # Population | % Population | View All 0 Rows |
Sex and Age in Boomer
Sex and Age in Boomer
The most populous age groups in Boomer are 5 to 9 Years (64 | 17.2%) for men and 25 to 29 Years (44 | 26.5%) for women.
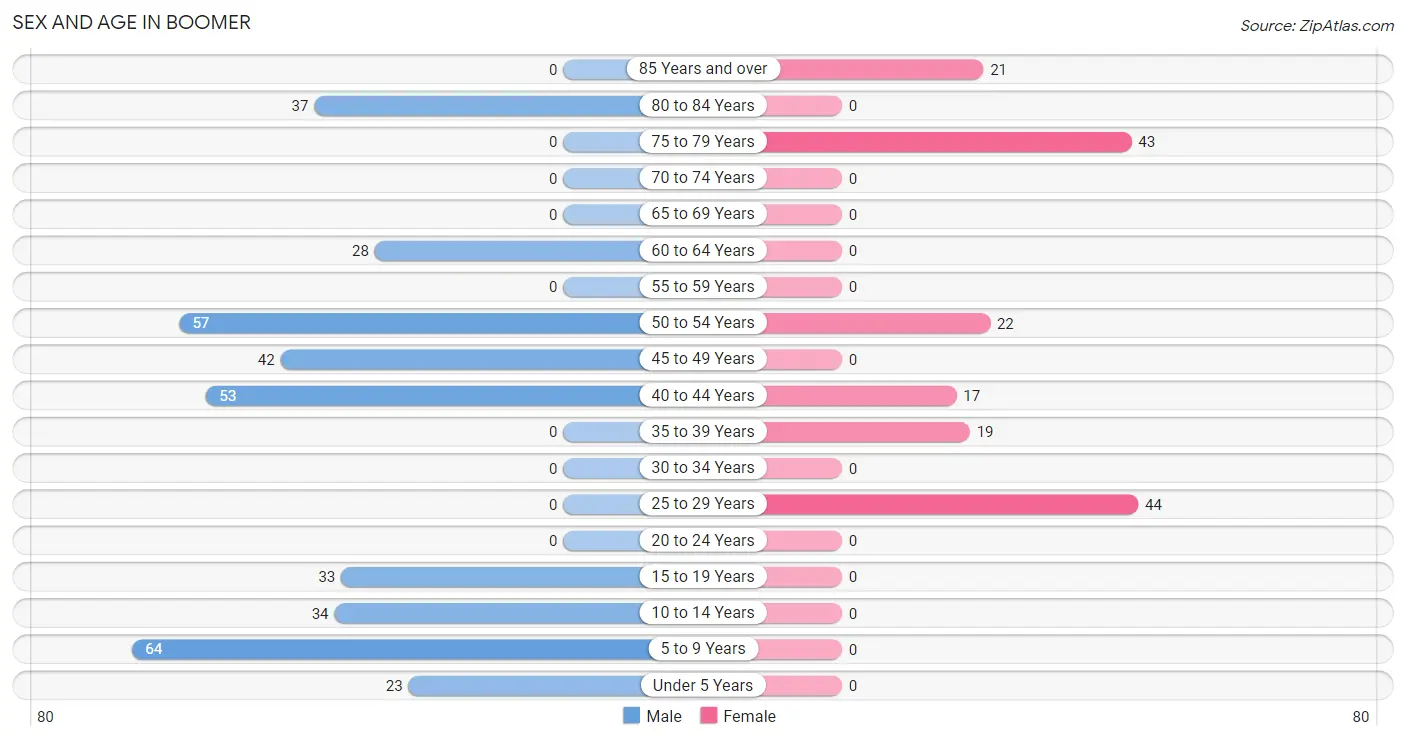
| Age Bracket | Male | Female |
| Under 5 Years | 23 (6.2%) | 0 (0.0%) |
| 5 to 9 Years | 64 (17.2%) | 0 (0.0%) |
| 10 to 14 Years | 34 (9.2%) | 0 (0.0%) |
| 15 to 19 Years | 33 (8.9%) | 0 (0.0%) |
| 20 to 24 Years | 0 (0.0%) | 0 (0.0%) |
| 25 to 29 Years | 0 (0.0%) | 44 (26.5%) |
| 30 to 34 Years | 0 (0.0%) | 0 (0.0%) |
| 35 to 39 Years | 0 (0.0%) | 19 (11.5%) |
| 40 to 44 Years | 53 (14.3%) | 17 (10.2%) |
| 45 to 49 Years | 42 (11.3%) | 0 (0.0%) |
| 50 to 54 Years | 57 (15.4%) | 22 (13.3%) |
| 55 to 59 Years | 0 (0.0%) | 0 (0.0%) |
| 60 to 64 Years | 28 (7.5%) | 0 (0.0%) |
| 65 to 69 Years | 0 (0.0%) | 0 (0.0%) |
| 70 to 74 Years | 0 (0.0%) | 0 (0.0%) |
| 75 to 79 Years | 0 (0.0%) | 43 (25.9%) |
| 80 to 84 Years | 37 (10.0%) | 0 (0.0%) |
| 85 Years and over | 0 (0.0%) | 21 (12.7%) |
| Total | 371 (100.0%) | 166 (100.0%) |
Families and Households in Boomer
Median Family Size in Boomer
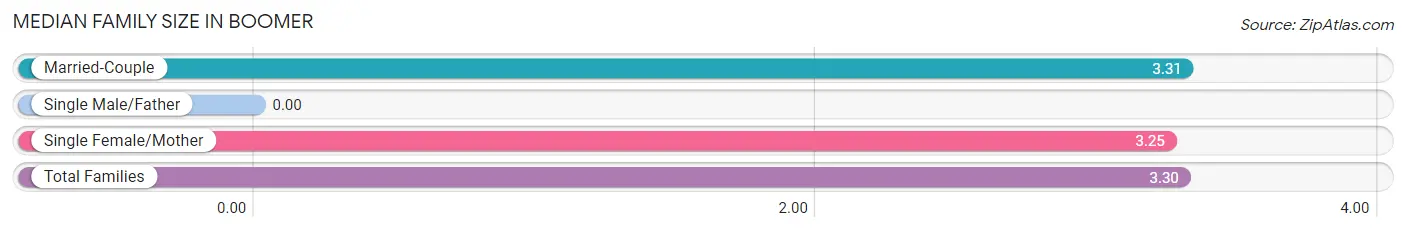
| Family Type | # Families | Family Size |
| Married-Couple | 64 (72.7%) | 3.31 |
| Single Male/Father | 0 (0.0%) | - |
| Single Female/Mother | 24 (27.3%) | 3.25 |
| Total Families | 88 (100.0%) | 3.30 |
Median Household Size in Boomer
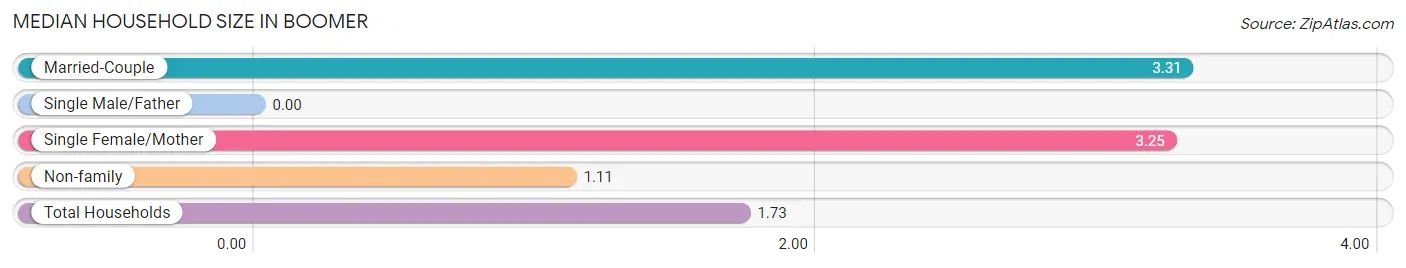
| Household Type | # Households | Household Size |
| Married-Couple | 64 (20.6%) | 3.31 |
| Single Male/Father | 0 (0.0%) | - |
| Single Female/Mother | 24 (7.7%) | 3.25 |
| Non-family | 222 (71.6%) | 1.11 |
| Total Households | 310 (100.0%) | 1.73 |
Household Size by Marriage Status in Boomer
Out of a total of 310 households in Boomer, 88 (28.4%) are family households, while 222 (71.6%) are nonfamily households. The most numerous type of family households are 5-person households, comprising 42, and the most common type of nonfamily households are 1-person households, comprising 205.
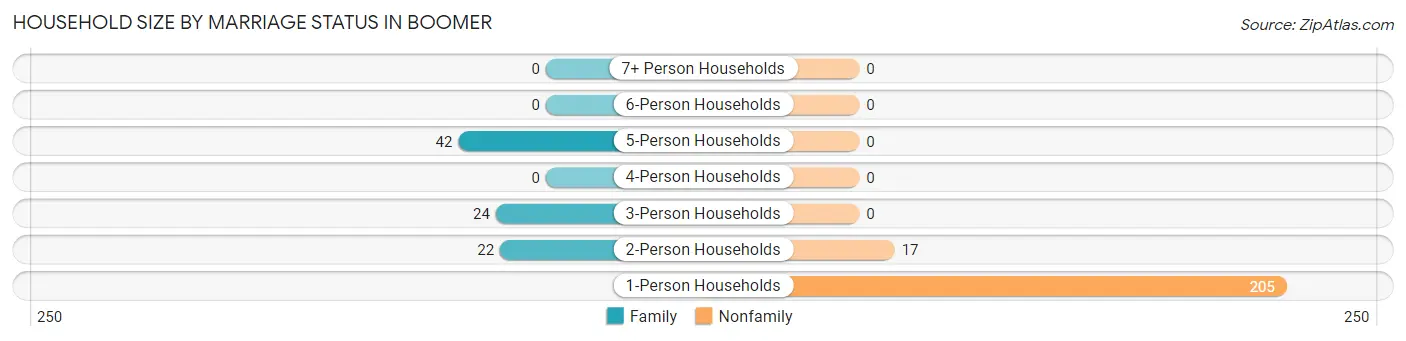
| Household Size | Family Households | Nonfamily Households |
| 1-Person Households | - | 205 (66.1%) |
| 2-Person Households | 22 (7.1%) | 17 (5.5%) |
| 3-Person Households | 24 (7.7%) | 0 (0.0%) |
| 4-Person Households | 0 (0.0%) | 0 (0.0%) |
| 5-Person Households | 42 (13.6%) | 0 (0.0%) |
| 6-Person Households | 0 (0.0%) | 0 (0.0%) |
| 7+ Person Households | 0 (0.0%) | 0 (0.0%) |
| Total | 88 (28.4%) | 222 (71.6%) |
Female Fertility in Boomer
Fertility by Age in Boomer
| Age Bracket | Women with Births | Births / 1,000 Women |
| 15 to 19 years | 0 (0.0%) | 0.0 |
| 20 to 34 years | 0 (0.0%) | 0.0 |
| 35 to 50 years | 0 (0.0%) | 0.0 |
| Total | 0 (0.0%) | 0.0 |
Fertility by Age by Marriage Status in Boomer
| Age Bracket | Married | Unmarried |
| 15 to 19 years | 0 (0.0%) | 0 (0.0%) |
| 20 to 34 years | 0 (0.0%) | 0 (0.0%) |
| 35 to 50 years | 0 (0.0%) | 0 (0.0%) |
| Total | 0 (0.0%) | 0 (0.0%) |
Fertility by Education in Boomer
| Educational Attainment | Women with Births | Births / 1,000 Women |
| Less than High School | 0 (0.0%) | 0.0 |
| High School Diploma | 0 (0.0%) | 0.0 |
| College or Associate's Degree | 0 (0.0%) | 0.0 |
| Bachelor's Degree | 0 (0.0%) | 0.0 |
| Graduate Degree | 0 (0.0%) | 0.0 |
| Total | 0 (0.0%) | 0.0 |
Fertility by Education by Marriage Status in Boomer
| Educational Attainment | Married | Unmarried |
| Less than High School | 0 (0.0%) | 0 (0.0%) |
| High School Diploma | 0 (0.0%) | 0 (0.0%) |
| College or Associate's Degree | 0 (0.0%) | 0 (0.0%) |
| Bachelor's Degree | 0 (0.0%) | 0 (0.0%) |
| Graduate Degree | 0 (0.0%) | 0 (0.0%) |
| Total | 0 (0.0%) | 0 (0.0%) |
Employment Characteristics in Boomer
Employment by Class of Employer in Boomer
Among the 167 employed individuals in Boomer, private company employees (71 | 42.5%), state government employees (51 | 30.5%), and self-employed (not incorporated) (25 | 15.0%) make up the most common classes of employment.
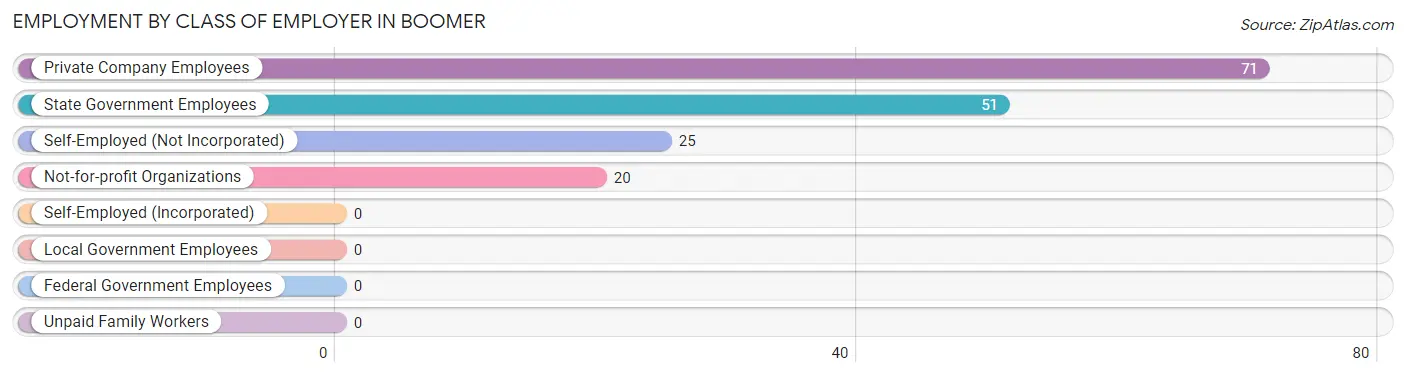
| Employer Class | # Employees | % Employees |
| Private Company Employees | 71 | 42.5% |
| Self-Employed (Incorporated) | 0 | 0.0% |
| Self-Employed (Not Incorporated) | 25 | 15.0% |
| Not-for-profit Organizations | 20 | 12.0% |
| Local Government Employees | 0 | 0.0% |
| State Government Employees | 51 | 30.5% |
| Federal Government Employees | 0 | 0.0% |
| Unpaid Family Workers | 0 | 0.0% |
| Total | 167 | 100.0% |
Employment Status by Age in Boomer
According to the labor force statistics for Boomer, out of the total population over 16 years of age (416), 44.2% or 184 individuals are in the labor force, with 9.2% or 17 of them unemployed. The age group with the highest labor force participation rate is 25 to 29 years, with 100.0% or 44 individuals in the labor force. Within the labor force, the 35 to 44 years age range has the highest percentage of unemployed individuals, with 19.1% or 17 of them being unemployed.
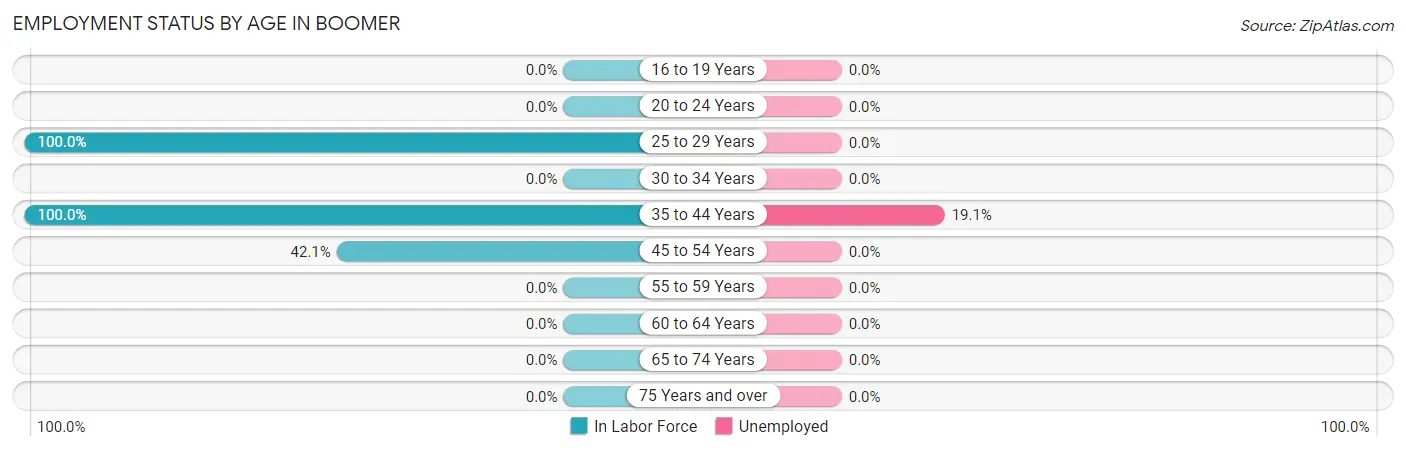
| Age Bracket | In Labor Force | Unemployed |
| 16 to 19 Years | 0 (0.0%) | 0 (0.0%) |
| 20 to 24 Years | 0 (0.0%) | 0 (0.0%) |
| 25 to 29 Years | 44 (100.0%) | 0 (0.0%) |
| 30 to 34 Years | 0 (0.0%) | 0 (0.0%) |
| 35 to 44 Years | 89 (100.0%) | 17 (19.1%) |
| 45 to 54 Years | 51 (42.1%) | 0 (0.0%) |
| 55 to 59 Years | 0 (0.0%) | 0 (0.0%) |
| 60 to 64 Years | 0 (0.0%) | 0 (0.0%) |
| 65 to 74 Years | 0 (0.0%) | 0 (0.0%) |
| 75 Years and over | 0 (0.0%) | 0 (0.0%) |
| Total | 184 (44.2%) | 17 (9.2%) |
Employment Status by Educational Attainment in Boomer
According to labor force statistics for Boomer, 65.2% of individuals (184) out of the total population between 25 and 64 years of age (282) are in the labor force, with 9.2% or 17 of them being unemployed. The group with the highest labor force participation rate are those with the educational attainment of bachelor's degree or higher, with 100.0% or 22 individuals in the labor force. Within the labor force, individuals with high school diploma education have the highest percentage of unemployment, with 18.1% or 17 of them being unemployed.
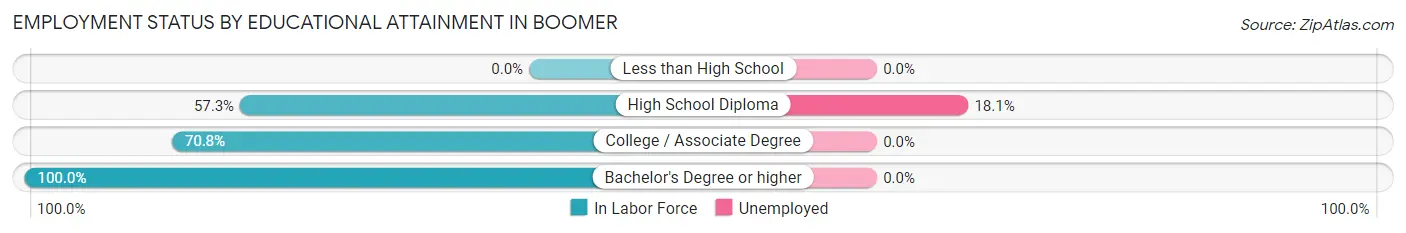
| Educational Attainment | In Labor Force | Unemployed |
| Less than High School | 0 (0.0%) | 0 (0.0%) |
| High School Diploma | 94 (57.3%) | 30 (18.1%) |
| College / Associate Degree | 68 (70.8%) | 0 (0.0%) |
| Bachelor's Degree or higher | 22 (100.0%) | 0 (0.0%) |
| Total | 184 (65.2%) | 26 (9.2%) |
Employment Occupations by Sex in Boomer
Management, Business, Science and Arts Occupations
The most common Management, Business, Science and Arts occupations in Boomer are Community & Social Service (22 | 13.2%), Education Instruction & Library (22 | 13.2%), and Health Diagnosing & Treating (20 | 12.0%).
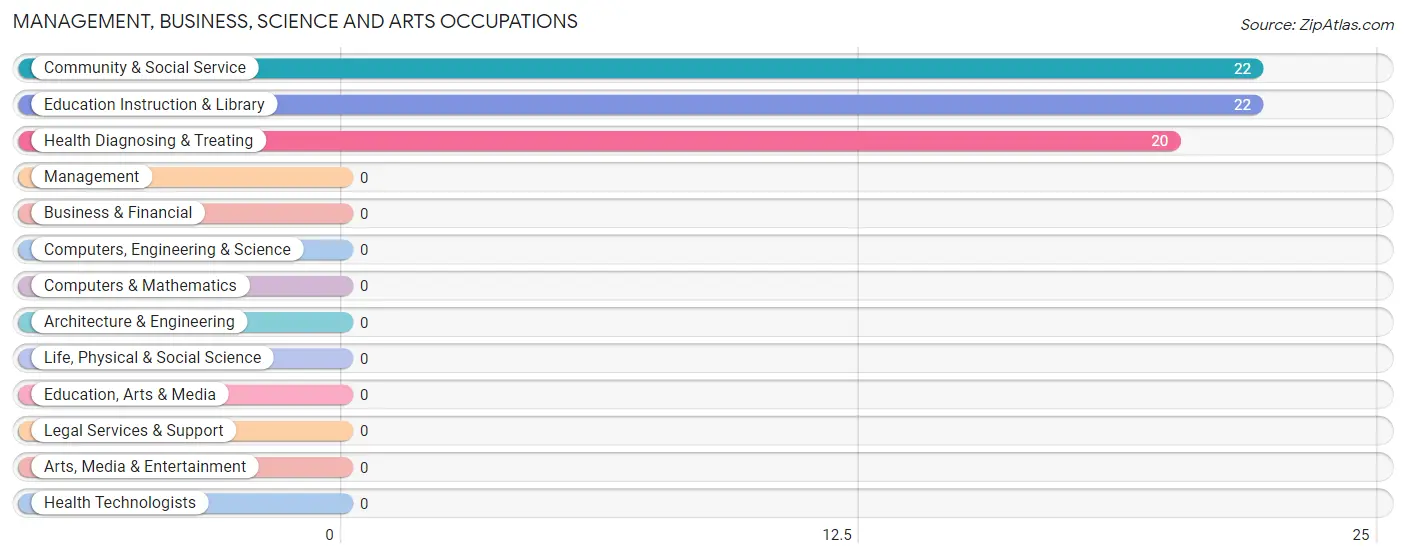
Management, Business, Science and Arts Occupations by Sex
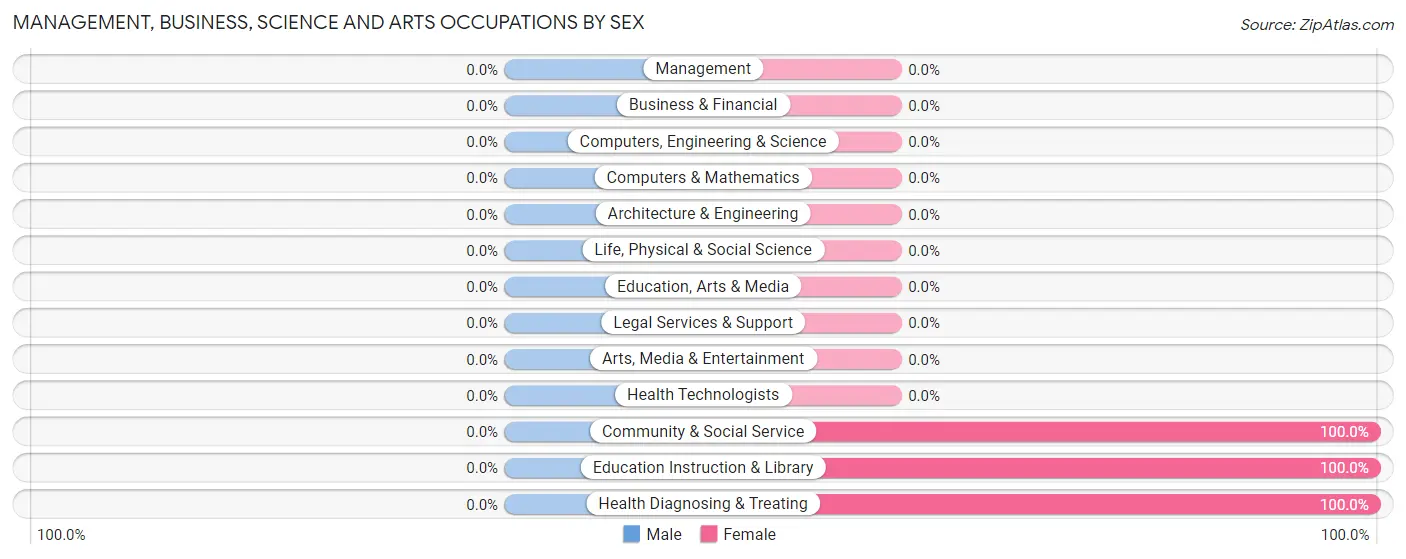
| Occupation | Male | Female |
| Management | 0 (0.0%) | 0 (0.0%) |
| Business & Financial | 0 (0.0%) | 0 (0.0%) |
| Computers, Engineering & Science | 0 (0.0%) | 0 (0.0%) |
| Computers & Mathematics | 0 (0.0%) | 0 (0.0%) |
| Architecture & Engineering | 0 (0.0%) | 0 (0.0%) |
| Life, Physical & Social Science | 0 (0.0%) | 0 (0.0%) |
| Community & Social Service | 0 (0.0%) | 22 (100.0%) |
| Education, Arts & Media | 0 (0.0%) | 0 (0.0%) |
| Legal Services & Support | 0 (0.0%) | 0 (0.0%) |
| Education Instruction & Library | 0 (0.0%) | 22 (100.0%) |
| Arts, Media & Entertainment | 0 (0.0%) | 0 (0.0%) |
| Health Diagnosing & Treating | 0 (0.0%) | 20 (100.0%) |
| Health Technologists | 0 (0.0%) | 0 (0.0%) |
| Total (Category) | 0 (0.0%) | 42 (100.0%) |
| Total (Overall) | 82 (49.1%) | 85 (50.9%) |
Services Occupations
Services Occupations by Sex
| Occupation | Male | Female |
| Healthcare Support | 0 (0.0%) | 0 (0.0%) |
| Security & Protection | 0 (0.0%) | 0 (0.0%) |
| Firefighting & Prevention | 0 (0.0%) | 0 (0.0%) |
| Law Enforcement | 0 (0.0%) | 0 (0.0%) |
| Food Preparation & Serving | 0 (0.0%) | 0 (0.0%) |
| Cleaning & Maintenance | 0 (0.0%) | 0 (0.0%) |
| Personal Care & Service | 0 (0.0%) | 0 (0.0%) |
| Total (Category) | 0 (0.0%) | 0 (0.0%) |
| Total (Overall) | 82 (49.1%) | 85 (50.9%) |
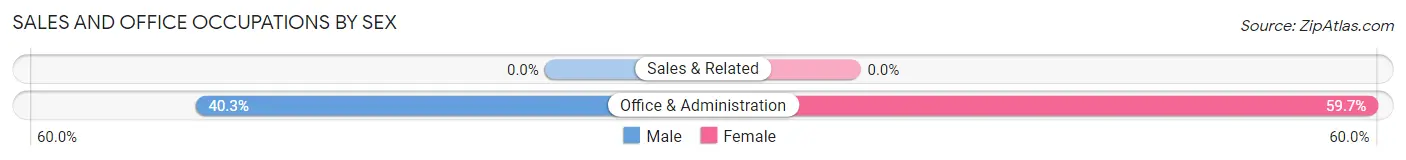
Sales and Office Occupations
The most common Sales and Office occupations in Boomer are , and Office & Administration (72 | 43.1%).
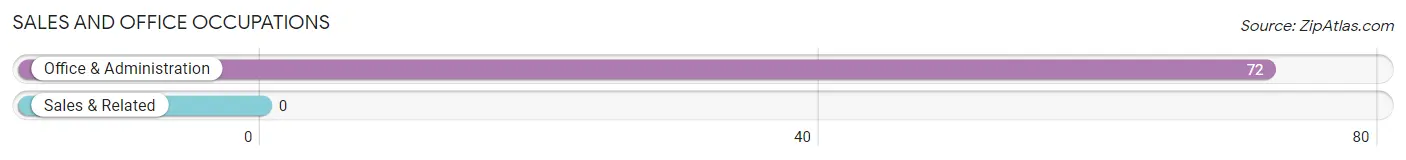
Sales and Office Occupations by Sex
| Occupation | Male | Female |
| Sales & Related | 0 (0.0%) | 0 (0.0%) |
| Office & Administration | 29 (40.3%) | 43 (59.7%) |
| Total (Category) | 29 (40.3%) | 43 (59.7%) |
| Total (Overall) | 82 (49.1%) | 85 (50.9%) |
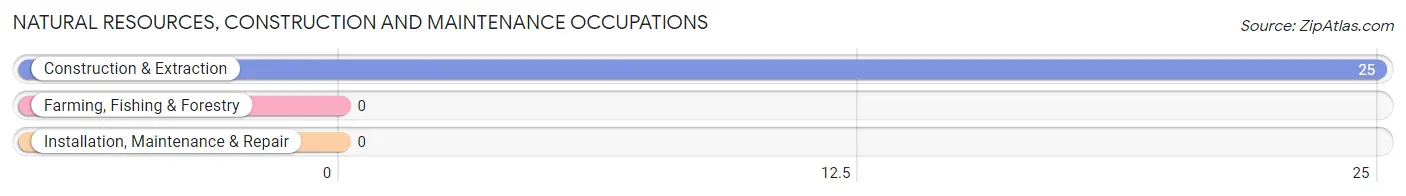
Natural Resources, Construction and Maintenance Occupations
The most common Natural Resources, Construction and Maintenance occupations in Boomer are , and Construction & Extraction (25 | 15.0%).
Natural Resources, Construction and Maintenance Occupations by Sex
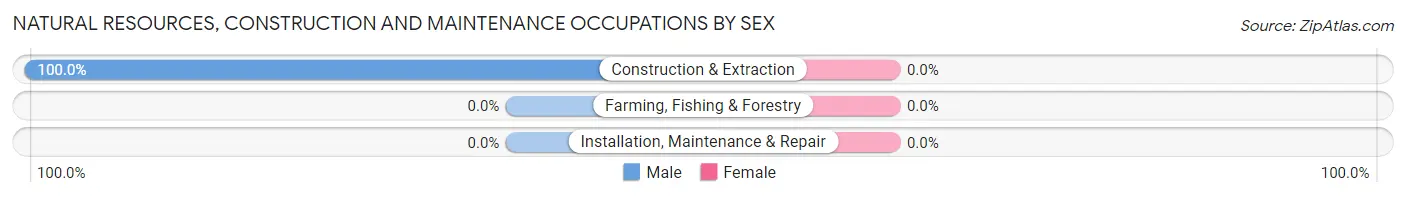
| Occupation | Male | Female |
| Farming, Fishing & Forestry | 0 (0.0%) | 0 (0.0%) |
| Construction & Extraction | 25 (100.0%) | 0 (0.0%) |
| Installation, Maintenance & Repair | 0 (0.0%) | 0 (0.0%) |
| Total (Category) | 25 (100.0%) | 0 (0.0%) |
| Total (Overall) | 82 (49.1%) | 85 (50.9%) |
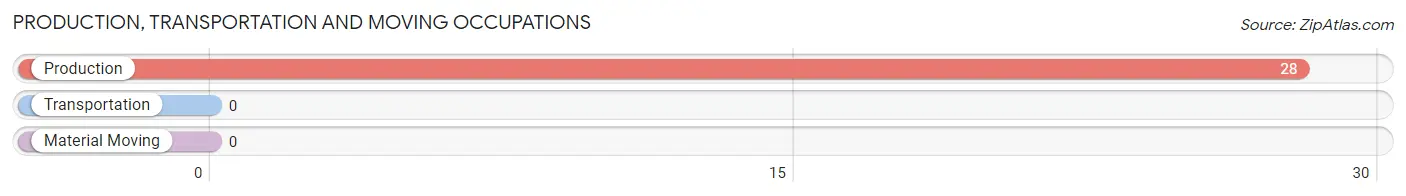
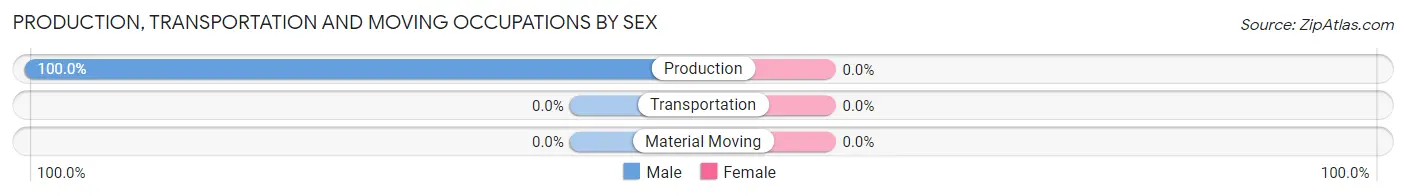
Production, Transportation and Moving Occupations
The most common Production, Transportation and Moving occupations in Boomer are , and Production (28 | 16.8%).
Production, Transportation and Moving Occupations by Sex
| Occupation | Male | Female |
| Production | 28 (100.0%) | 0 (0.0%) |
| Transportation | 0 (0.0%) | 0 (0.0%) |
| Material Moving | 0 (0.0%) | 0 (0.0%) |
| Total (Category) | 28 (100.0%) | 0 (0.0%) |
| Total (Overall) | 82 (49.1%) | 85 (50.9%) |
Employment Industries by Sex in Boomer
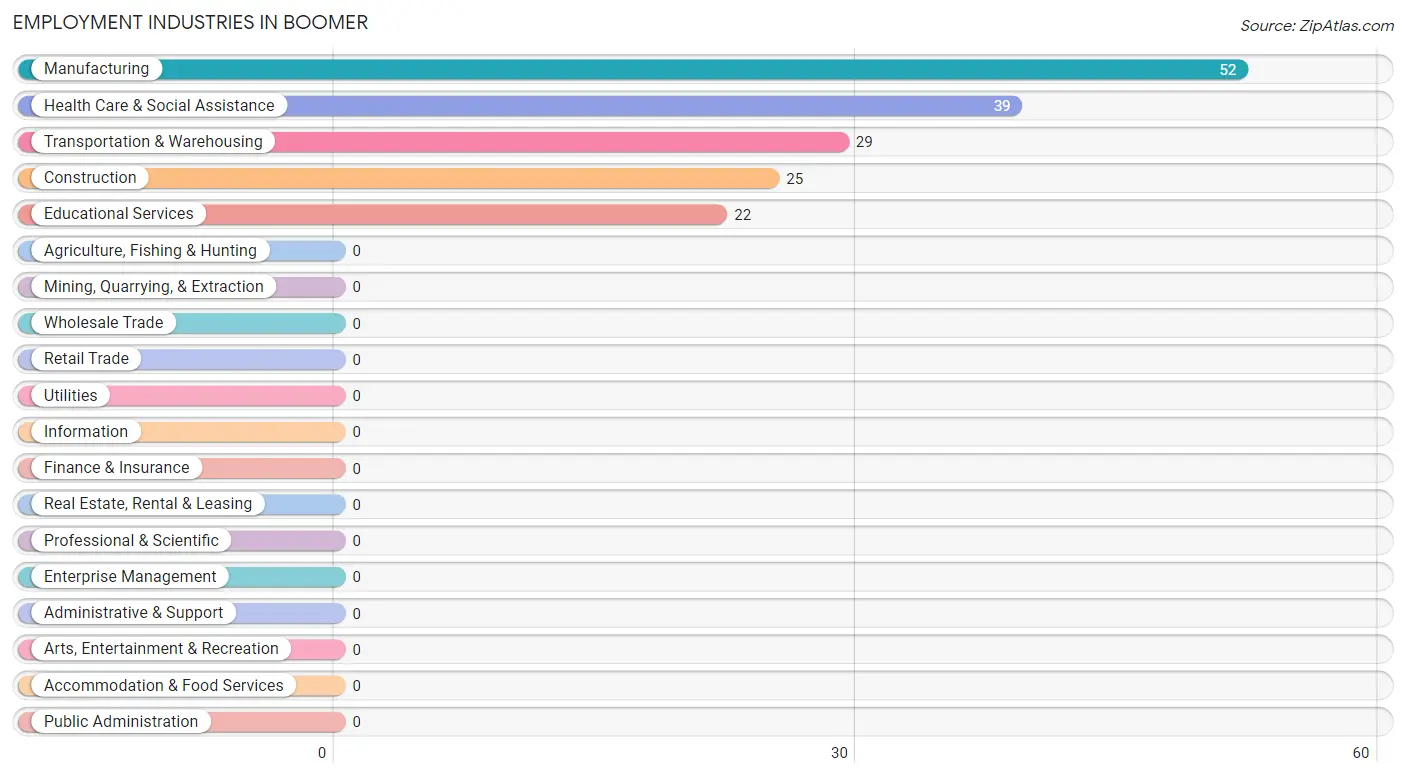
Employment Industries in Boomer
The major employment industries in Boomer include Manufacturing (52 | 31.1%), Health Care & Social Assistance (39 | 23.4%), Transportation & Warehousing (29 | 17.4%), Construction (25 | 15.0%), and Educational Services (22 | 13.2%).
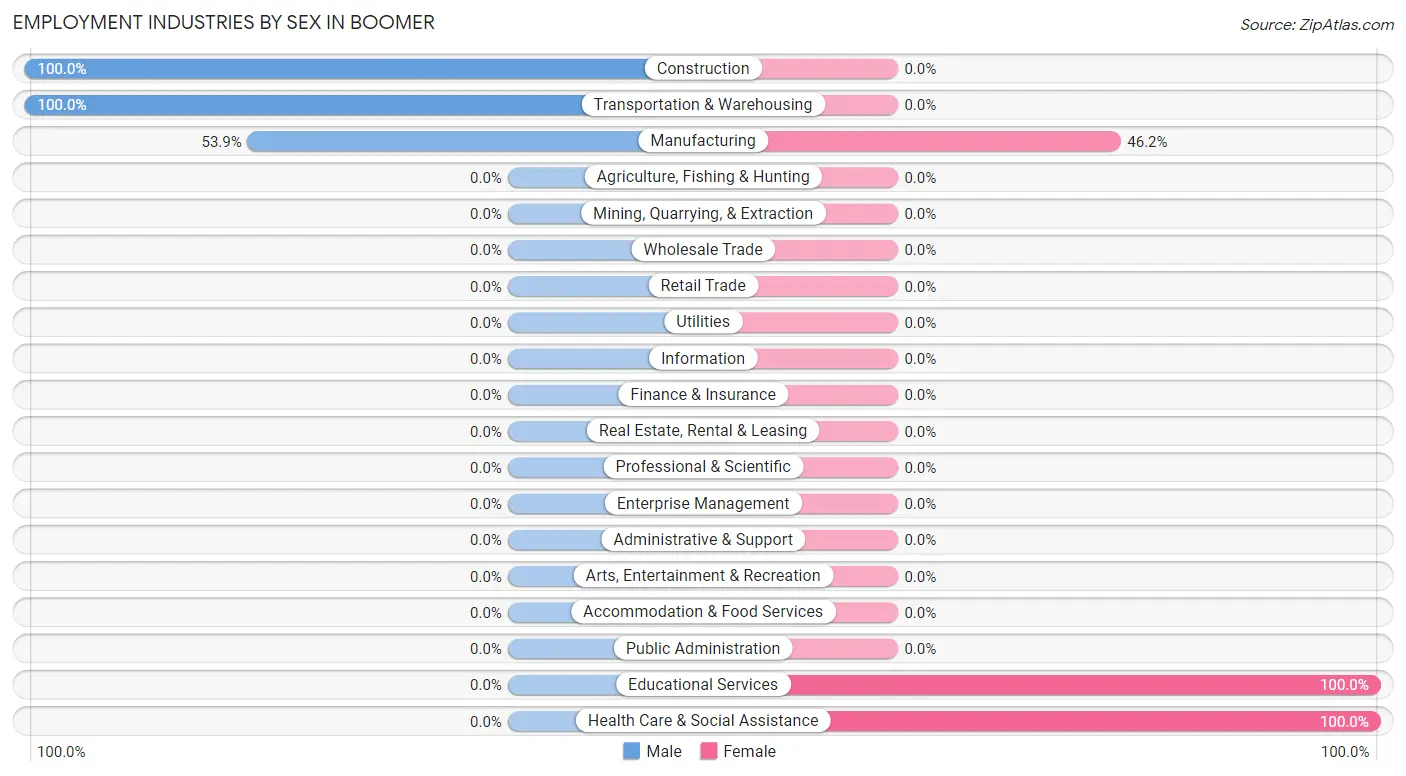
Employment Industries by Sex in Boomer
The Boomer industries that see more men than women are Construction (100.0%), Transportation & Warehousing (100.0%), and Manufacturing (53.8%), whereas the industries that tend to have a higher number of women are Educational Services (100.0%), Health Care & Social Assistance (100.0%), and Manufacturing (46.2%).
| Industry | Male | Female |
| Agriculture, Fishing & Hunting | 0 (0.0%) | 0 (0.0%) |
| Mining, Quarrying, & Extraction | 0 (0.0%) | 0 (0.0%) |
| Construction | 25 (100.0%) | 0 (0.0%) |
| Manufacturing | 28 (53.8%) | 24 (46.2%) |
| Wholesale Trade | 0 (0.0%) | 0 (0.0%) |
| Retail Trade | 0 (0.0%) | 0 (0.0%) |
| Transportation & Warehousing | 29 (100.0%) | 0 (0.0%) |
| Utilities | 0 (0.0%) | 0 (0.0%) |
| Information | 0 (0.0%) | 0 (0.0%) |
| Finance & Insurance | 0 (0.0%) | 0 (0.0%) |
| Real Estate, Rental & Leasing | 0 (0.0%) | 0 (0.0%) |
| Professional & Scientific | 0 (0.0%) | 0 (0.0%) |
| Enterprise Management | 0 (0.0%) | 0 (0.0%) |
| Administrative & Support | 0 (0.0%) | 0 (0.0%) |
| Educational Services | 0 (0.0%) | 22 (100.0%) |
| Health Care & Social Assistance | 0 (0.0%) | 39 (100.0%) |
| Arts, Entertainment & Recreation | 0 (0.0%) | 0 (0.0%) |
| Accommodation & Food Services | 0 (0.0%) | 0 (0.0%) |
| Public Administration | 0 (0.0%) | 0 (0.0%) |
| Total | 82 (49.1%) | 85 (50.9%) |
Education in Boomer
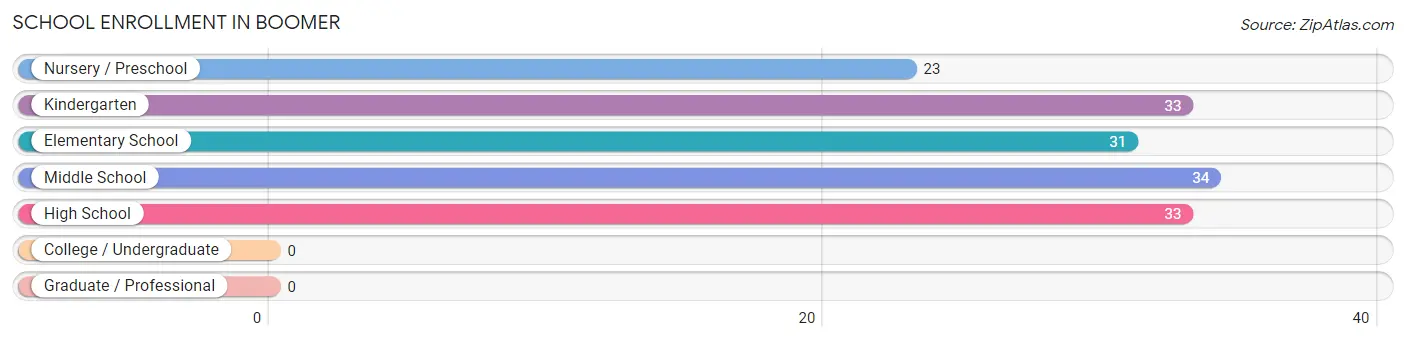
School Enrollment in Boomer
The most common levels of schooling among the 154 students in Boomer are middle school (34 | 22.1%), kindergarten (33 | 21.4%), and high school (33 | 21.4%).
| School Level | # Students | % Students |
| Nursery / Preschool | 23 | 14.9% |
| Kindergarten | 33 | 21.4% |
| Elementary School | 31 | 20.1% |
| Middle School | 34 | 22.1% |
| High School | 33 | 21.4% |
| College / Undergraduate | 0 | 0.0% |
| Graduate / Professional | 0 | 0.0% |
| Total | 154 | 100.0% |
School Enrollment by Age by Funding Source in Boomer
Out of a total of 154 students who are enrolled in schools in Boomer, 31 (20.1%) attend a private institution, while the remaining 123 (79.9%) are enrolled in public schools. The age group of 5 to 9 year old has the highest likelihood of being enrolled in private schools, with 31 (48.4% in the age bracket) enrolled. Conversely, the age group of 3 to 4 year olds has the lowest likelihood of being enrolled in a private school, with 23 (100.0% in the age bracket) attending a public institution.
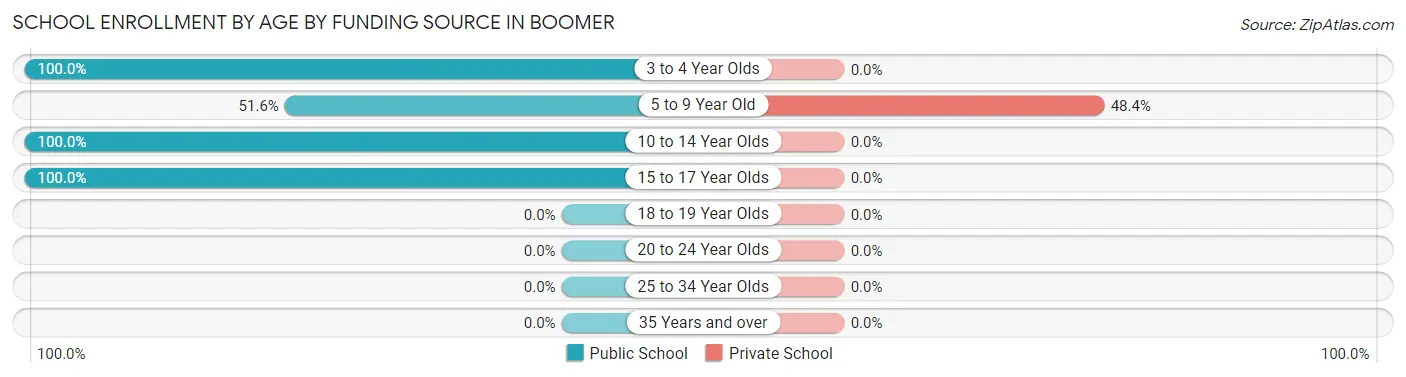
| Age Bracket | Public School | Private School |
| 3 to 4 Year Olds | 23 (100.0%) | 0 (0.0%) |
| 5 to 9 Year Old | 33 (51.6%) | 31 (48.4%) |
| 10 to 14 Year Olds | 34 (100.0%) | 0 (0.0%) |
| 15 to 17 Year Olds | 33 (100.0%) | 0 (0.0%) |
| 18 to 19 Year Olds | 0 (0.0%) | 0 (0.0%) |
| 20 to 24 Year Olds | 0 (0.0%) | 0 (0.0%) |
| 25 to 34 Year Olds | 0 (0.0%) | 0 (0.0%) |
| 35 Years and over | 0 (0.0%) | 0 (0.0%) |
| Total | 123 (79.9%) | 31 (20.1%) |
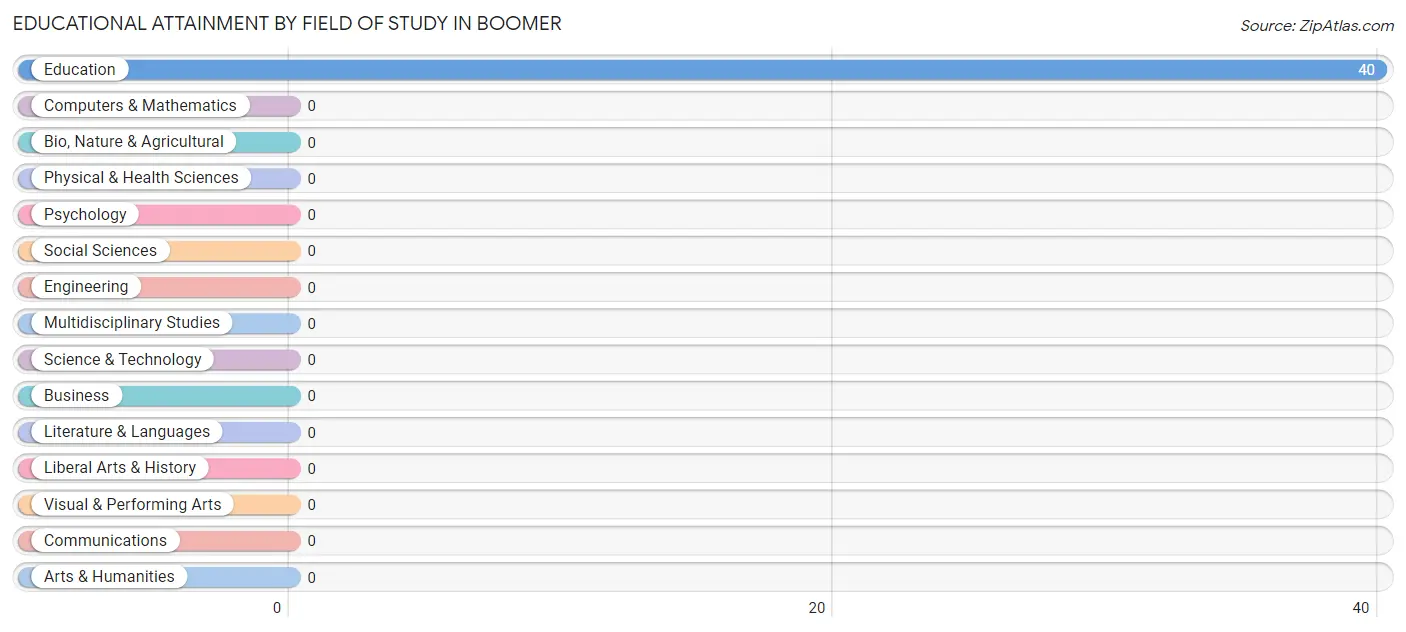
Educational Attainment by Field of Study in Boomer
, and education (40 | 100.0%) are the most common fields of study among 40 individuals in Boomer who have obtained a bachelor's degree or higher.
| Field of Study | # Graduates | % Graduates |
| Computers & Mathematics | 0 | 0.0% |
| Bio, Nature & Agricultural | 0 | 0.0% |
| Physical & Health Sciences | 0 | 0.0% |
| Psychology | 0 | 0.0% |
| Social Sciences | 0 | 0.0% |
| Engineering | 0 | 0.0% |
| Multidisciplinary Studies | 0 | 0.0% |
| Science & Technology | 0 | 0.0% |
| Business | 0 | 0.0% |
| Education | 40 | 100.0% |
| Literature & Languages | 0 | 0.0% |
| Liberal Arts & History | 0 | 0.0% |
| Visual & Performing Arts | 0 | 0.0% |
| Communications | 0 | 0.0% |
| Arts & Humanities | 0 | 0.0% |
| Total | 40 | 100.0% |
Transportation & Commute in Boomer
Vehicle Availability by Sex in Boomer
The most prevalent vehicle ownership categories in Boomer are males with 2 vehicles (53, accounting for 64.6%) and females with 2 vehicles (19, making up 62.4%).
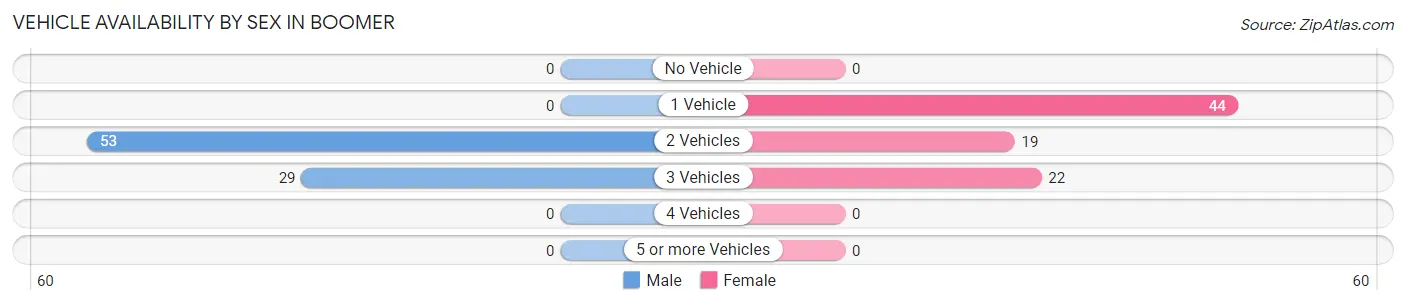
| Vehicles Available | Male | Female |
| No Vehicle | 0 (0.0%) | 0 (0.0%) |
| 1 Vehicle | 0 (0.0%) | 44 (51.8%) |
| 2 Vehicles | 53 (64.6%) | 19 (22.4%) |
| 3 Vehicles | 29 (35.4%) | 22 (25.9%) |
| 4 Vehicles | 0 (0.0%) | 0 (0.0%) |
| 5 or more Vehicles | 0 (0.0%) | 0 (0.0%) |
| Total | 82 (100.0%) | 85 (100.0%) |
Commute Time in Boomer
The most frequently occuring commute durations in Boomer are 40 to 44 minutes (63 commuters, 37.7%), 60 to 89 minutes (29 commuters, 17.4%), and 15 to 19 minutes (28 commuters, 16.8%).
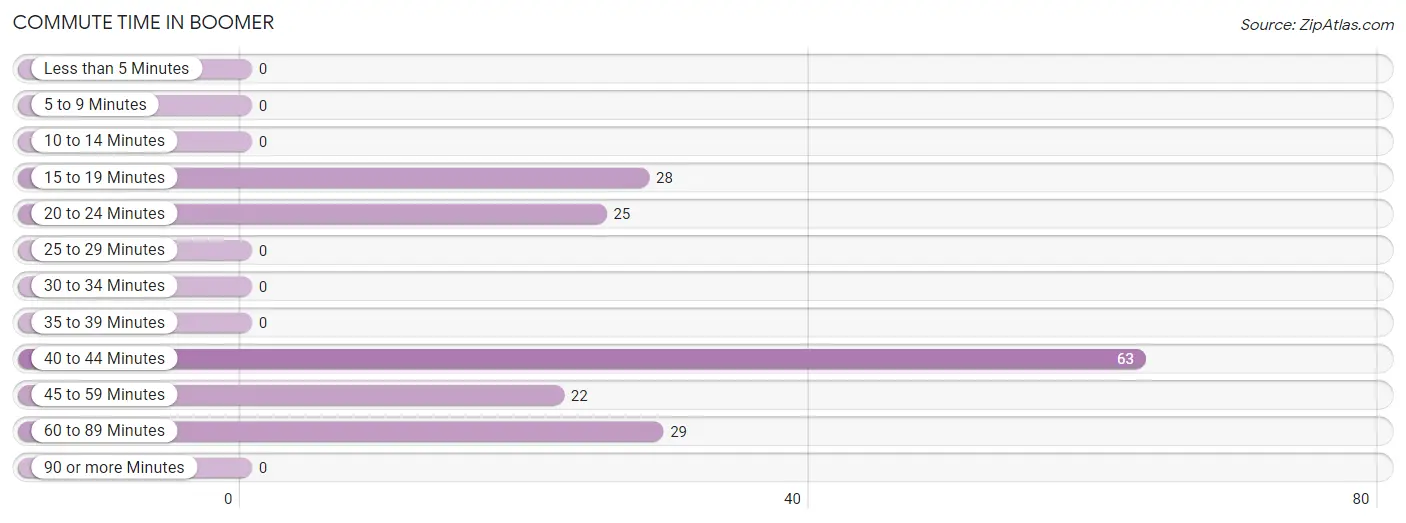
| Commute Time | # Commuters | % Commuters |
| Less than 5 Minutes | 0 | 0.0% |
| 5 to 9 Minutes | 0 | 0.0% |
| 10 to 14 Minutes | 0 | 0.0% |
| 15 to 19 Minutes | 28 | 16.8% |
| 20 to 24 Minutes | 25 | 15.0% |
| 25 to 29 Minutes | 0 | 0.0% |
| 30 to 34 Minutes | 0 | 0.0% |
| 35 to 39 Minutes | 0 | 0.0% |
| 40 to 44 Minutes | 63 | 37.7% |
| 45 to 59 Minutes | 22 | 13.2% |
| 60 to 89 Minutes | 29 | 17.4% |
| 90 or more Minutes | 0 | 0.0% |
Commute Time by Sex in Boomer
The most common commute times in Boomer are 60 to 89 minutes (29 commuters, 35.4%) for males and 40 to 44 minutes (63 commuters, 74.1%) for females.
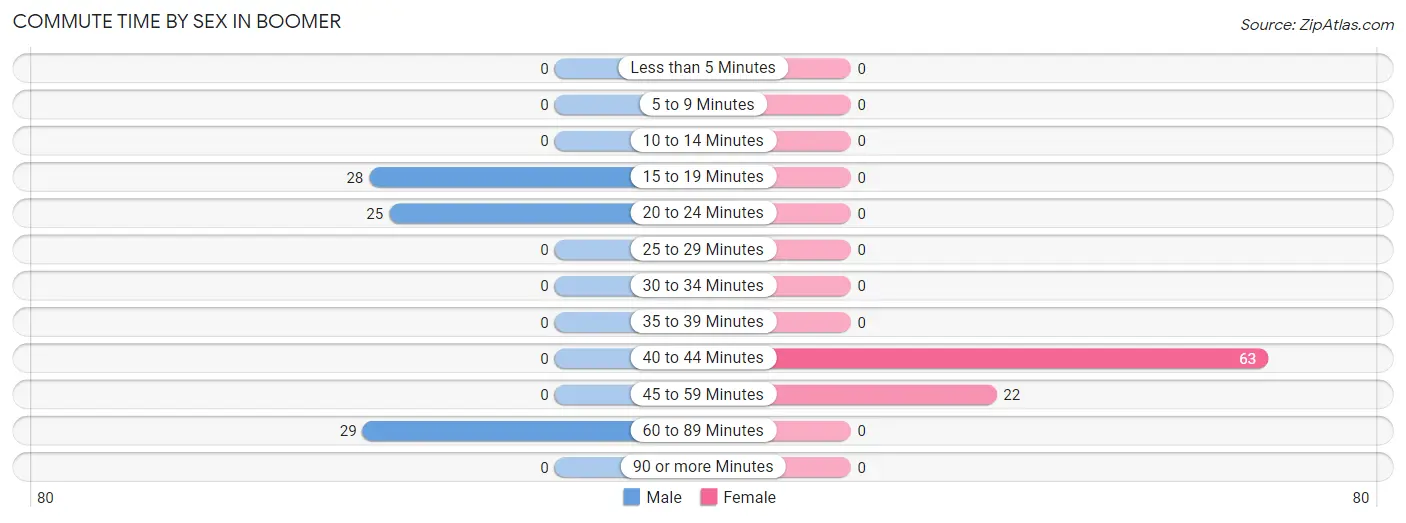
| Commute Time | Male | Female |
| Less than 5 Minutes | 0 (0.0%) | 0 (0.0%) |
| 5 to 9 Minutes | 0 (0.0%) | 0 (0.0%) |
| 10 to 14 Minutes | 0 (0.0%) | 0 (0.0%) |
| 15 to 19 Minutes | 28 (34.2%) | 0 (0.0%) |
| 20 to 24 Minutes | 25 (30.5%) | 0 (0.0%) |
| 25 to 29 Minutes | 0 (0.0%) | 0 (0.0%) |
| 30 to 34 Minutes | 0 (0.0%) | 0 (0.0%) |
| 35 to 39 Minutes | 0 (0.0%) | 0 (0.0%) |
| 40 to 44 Minutes | 0 (0.0%) | 63 (74.1%) |
| 45 to 59 Minutes | 0 (0.0%) | 22 (25.9%) |
| 60 to 89 Minutes | 29 (35.4%) | 0 (0.0%) |
| 90 or more Minutes | 0 (0.0%) | 0 (0.0%) |
Time of Departure to Work by Sex in Boomer
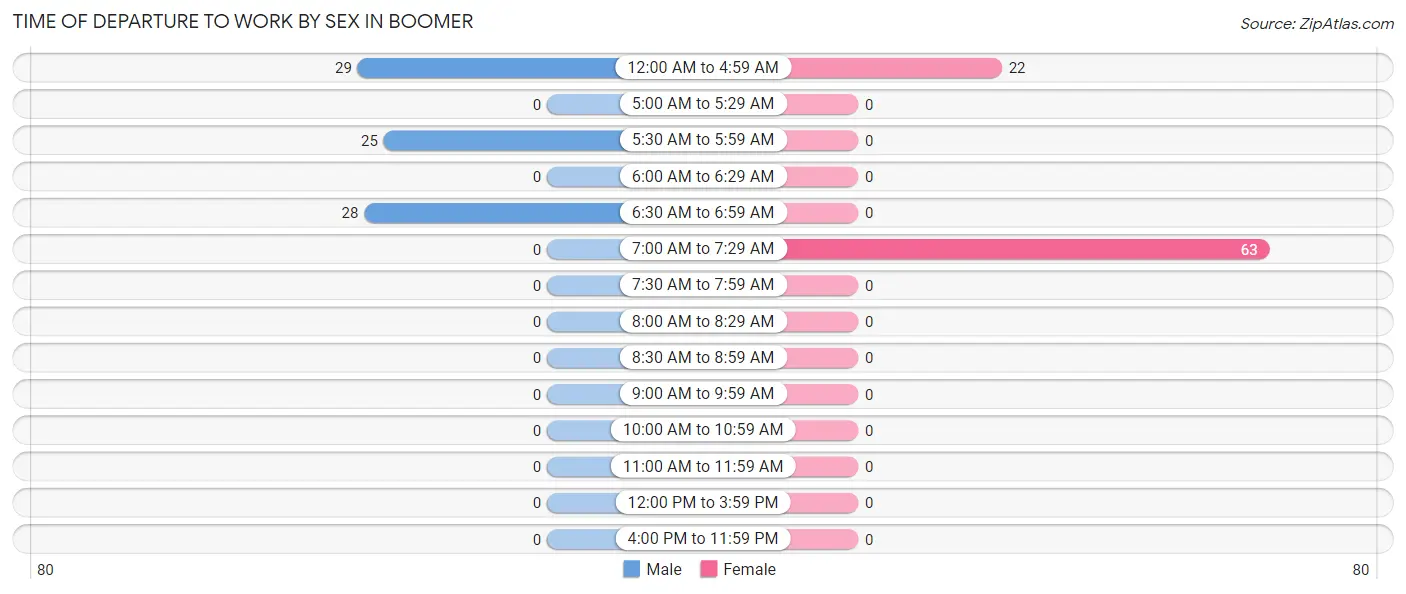
The most frequent times of departure to work in Boomer are 12:00 AM to 4:59 AM (29, 35.4%) for males and 7:00 AM to 7:29 AM (63, 74.1%) for females.
| Time of Departure | Male | Female |
| 12:00 AM to 4:59 AM | 29 (35.4%) | 22 (25.9%) |
| 5:00 AM to 5:29 AM | 0 (0.0%) | 0 (0.0%) |
| 5:30 AM to 5:59 AM | 25 (30.5%) | 0 (0.0%) |
| 6:00 AM to 6:29 AM | 0 (0.0%) | 0 (0.0%) |
| 6:30 AM to 6:59 AM | 28 (34.2%) | 0 (0.0%) |
| 7:00 AM to 7:29 AM | 0 (0.0%) | 63 (74.1%) |
| 7:30 AM to 7:59 AM | 0 (0.0%) | 0 (0.0%) |
| 8:00 AM to 8:29 AM | 0 (0.0%) | 0 (0.0%) |
| 8:30 AM to 8:59 AM | 0 (0.0%) | 0 (0.0%) |
| 9:00 AM to 9:59 AM | 0 (0.0%) | 0 (0.0%) |
| 10:00 AM to 10:59 AM | 0 (0.0%) | 0 (0.0%) |
| 11:00 AM to 11:59 AM | 0 (0.0%) | 0 (0.0%) |
| 12:00 PM to 3:59 PM | 0 (0.0%) | 0 (0.0%) |
| 4:00 PM to 11:59 PM | 0 (0.0%) | 0 (0.0%) |
| Total | 82 (100.0%) | 85 (100.0%) |
Housing Occupancy in Boomer
Occupancy by Ownership in Boomer
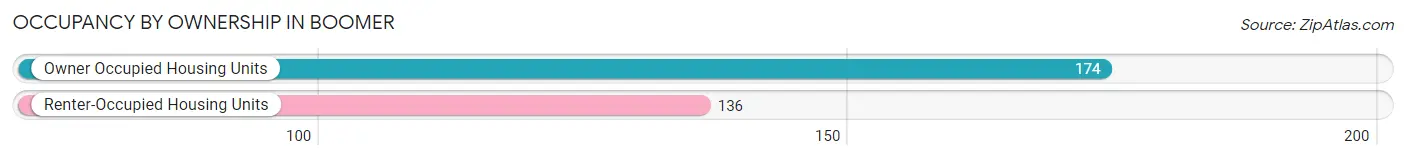
Of the total 310 dwellings in Boomer, owner-occupied units account for 174 (56.1%), while renter-occupied units make up 136 (43.9%).
| Occupancy | # Housing Units | % Housing Units |
| Owner Occupied Housing Units | 174 | 56.1% |
| Renter-Occupied Housing Units | 136 | 43.9% |
| Total Occupied Housing Units | 310 | 100.0% |
Occupancy by Household Size in Boomer
| Household Size | # Housing Units | % Housing Units |
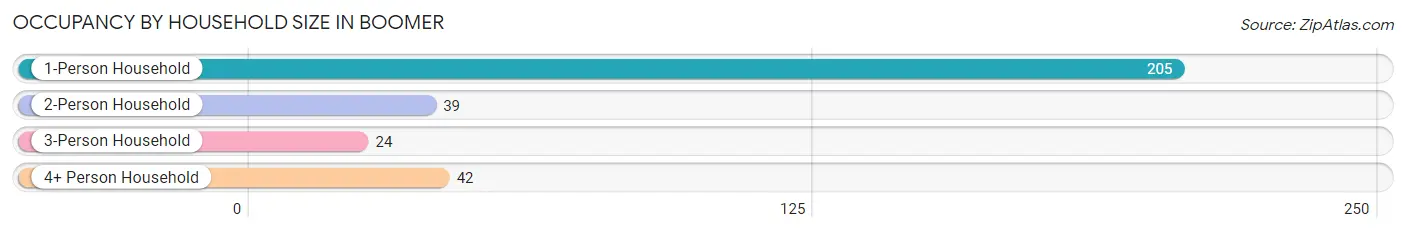
| 1-Person Household | 205 | 66.1% |
| 2-Person Household | 39 | 12.6% |
| 3-Person Household | 24 | 7.7% |
| 4+ Person Household | 42 | 13.6% |
| Total Housing Units | 310 | 100.0% |
Occupancy by Ownership by Household Size in Boomer
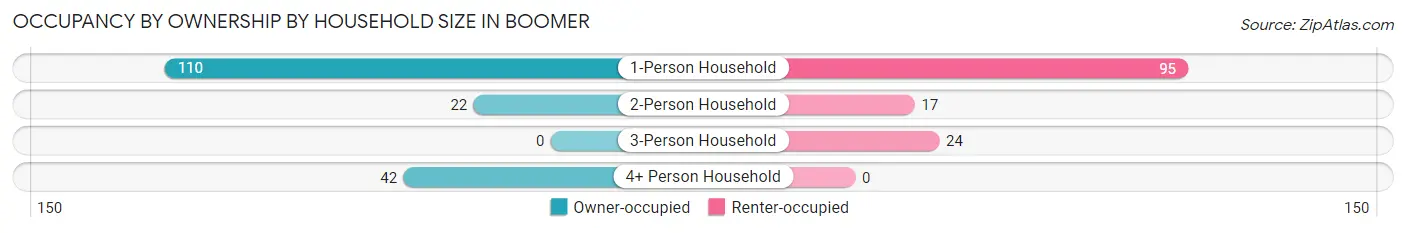
| Household Size | Owner-occupied | Renter-occupied |
| 1-Person Household | 110 (53.7%) | 95 (46.3%) |
| 2-Person Household | 22 (56.4%) | 17 (43.6%) |
| 3-Person Household | 0 (0.0%) | 24 (100.0%) |
| 4+ Person Household | 42 (100.0%) | 0 (0.0%) |
| Total Housing Units | 174 (56.1%) | 136 (43.9%) |
Occupancy by Educational Attainment in Boomer
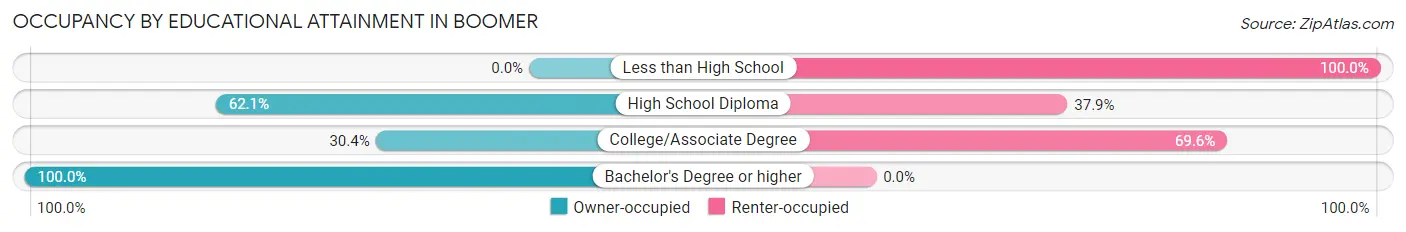
| Household Size | Owner-occupied | Renter-occupied |
| Less than High School | 0 (0.0%) | 19 (100.0%) |
| High School Diploma | 113 (62.1%) | 69 (37.9%) |
| College/Associate Degree | 21 (30.4%) | 48 (69.6%) |
| Bachelor's Degree or higher | 40 (100.0%) | 0 (0.0%) |
Occupancy by Age of Householder in Boomer
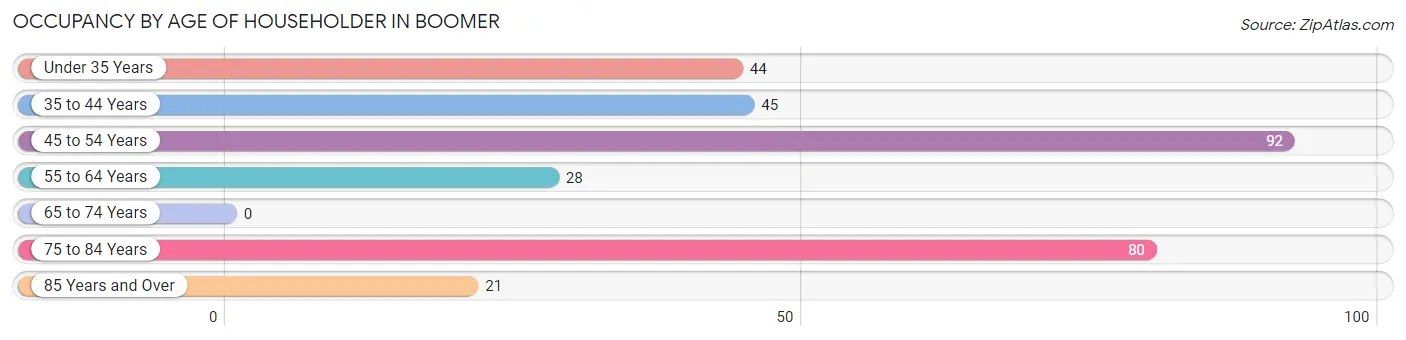
| Age Bracket | # Households | % Households |
| Under 35 Years | 44 | 14.2% |
| 35 to 44 Years | 45 | 14.5% |
| 45 to 54 Years | 92 | 29.7% |
| 55 to 64 Years | 28 | 9.0% |
| 65 to 74 Years | 0 | 0.0% |
| 75 to 84 Years | 80 | 25.8% |
| 85 Years and Over | 21 | 6.8% |
| Total | 310 | 100.0% |
Housing Finances in Boomer
Median Income by Occupancy in Boomer
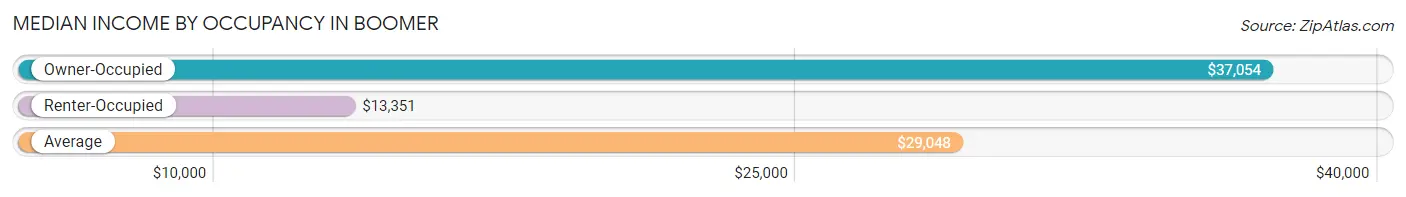
| Occupancy Type | # Households | Median Income |
| Owner-Occupied | 174 (56.1%) | $37,054 |
| Renter-Occupied | 136 (43.9%) | $13,351 |
| Average | 310 (100.0%) | $29,048 |
Occupancy by Householder Income Bracket in Boomer
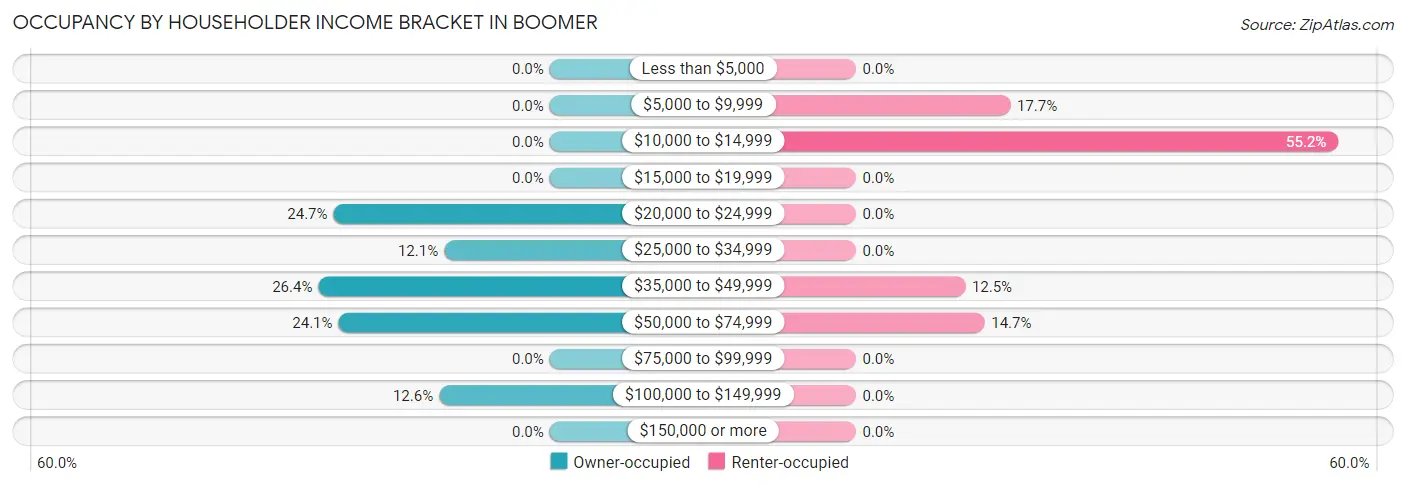
| Income Bracket | Owner-occupied | Renter-occupied |
| Less than $5,000 | 0 (0.0%) | 0 (0.0%) |
| $5,000 to $9,999 | 0 (0.0%) | 24 (17.6%) |
| $10,000 to $14,999 | 0 (0.0%) | 75 (55.1%) |
| $15,000 to $19,999 | 0 (0.0%) | 0 (0.0%) |
| $20,000 to $24,999 | 43 (24.7%) | 0 (0.0%) |
| $25,000 to $34,999 | 21 (12.1%) | 0 (0.0%) |
| $35,000 to $49,999 | 46 (26.4%) | 17 (12.5%) |
| $50,000 to $74,999 | 42 (24.1%) | 20 (14.7%) |
| $75,000 to $99,999 | 0 (0.0%) | 0 (0.0%) |
| $100,000 to $149,999 | 22 (12.6%) | 0 (0.0%) |
| $150,000 or more | 0 (0.0%) | 0 (0.0%) |
| Total | 174 (100.0%) | 136 (100.0%) |
Monthly Housing Cost Tiers in Boomer
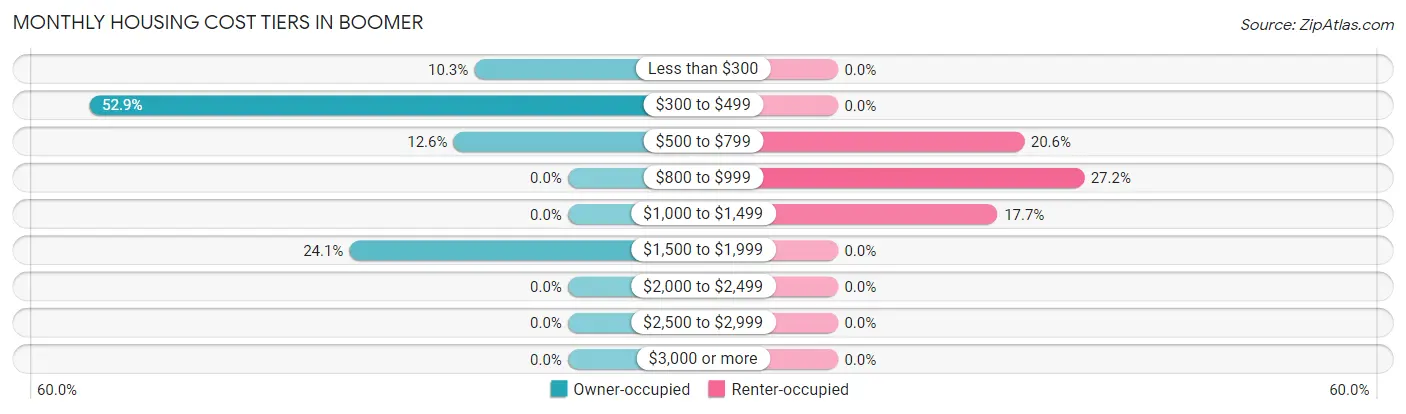
| Monthly Cost | Owner-occupied | Renter-occupied |
| Less than $300 | 18 (10.3%) | 0 (0.0%) |
| $300 to $499 | 92 (52.9%) | 0 (0.0%) |
| $500 to $799 | 22 (12.6%) | 28 (20.6%) |
| $800 to $999 | 0 (0.0%) | 37 (27.2%) |
| $1,000 to $1,499 | 0 (0.0%) | 24 (17.6%) |
| $1,500 to $1,999 | 42 (24.1%) | 0 (0.0%) |
| $2,000 to $2,499 | 0 (0.0%) | 0 (0.0%) |
| $2,500 to $2,999 | 0 (0.0%) | 0 (0.0%) |
| $3,000 or more | 0 (0.0%) | 0 (0.0%) |
| Total | 174 (100.0%) | 136 (100.0%) |
Physical Housing Characteristics in Boomer
Housing Structures in Boomer
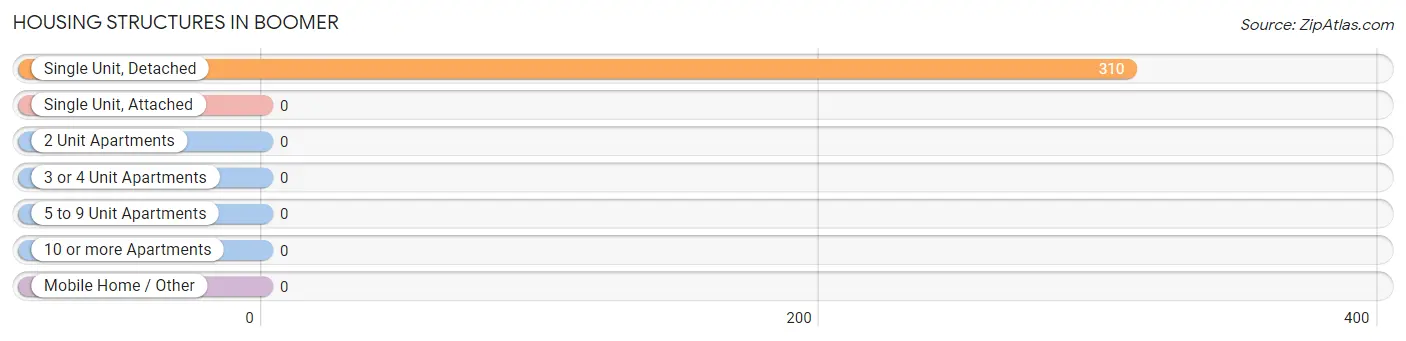
| Structure Type | # Housing Units | % Housing Units |
| Single Unit, Detached | 310 | 100.0% |
| Single Unit, Attached | 0 | 0.0% |
| 2 Unit Apartments | 0 | 0.0% |
| 3 or 4 Unit Apartments | 0 | 0.0% |
| 5 to 9 Unit Apartments | 0 | 0.0% |
| 10 or more Apartments | 0 | 0.0% |
| Mobile Home / Other | 0 | 0.0% |
| Total | 310 | 100.0% |
Housing Structures by Occupancy in Boomer
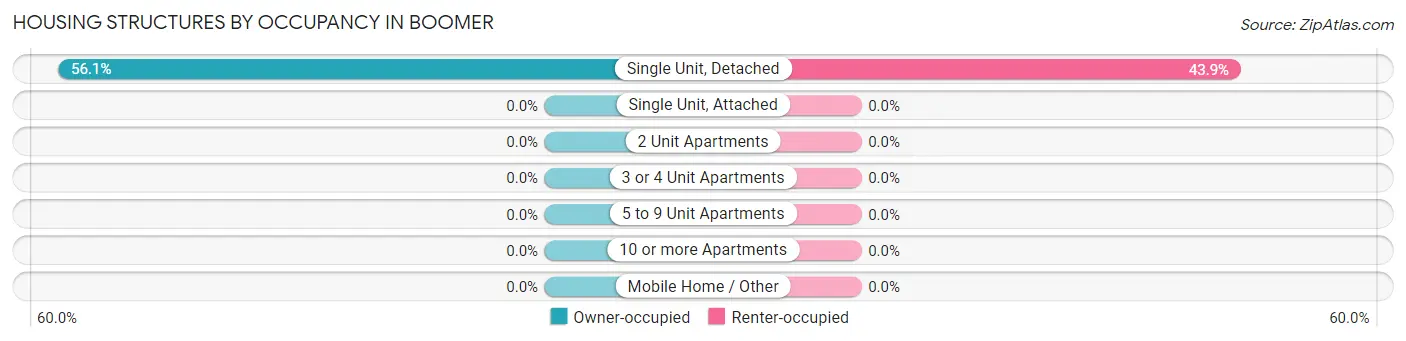
| Structure Type | Owner-occupied | Renter-occupied |
| Single Unit, Detached | 174 (56.1%) | 136 (43.9%) |
| Single Unit, Attached | 0 (0.0%) | 0 (0.0%) |
| 2 Unit Apartments | 0 (0.0%) | 0 (0.0%) |
| 3 or 4 Unit Apartments | 0 (0.0%) | 0 (0.0%) |
| 5 to 9 Unit Apartments | 0 (0.0%) | 0 (0.0%) |
| 10 or more Apartments | 0 (0.0%) | 0 (0.0%) |
| Mobile Home / Other | 0 (0.0%) | 0 (0.0%) |
| Total | 174 (56.1%) | 136 (43.9%) |
Housing Structures by Number of Rooms in Boomer
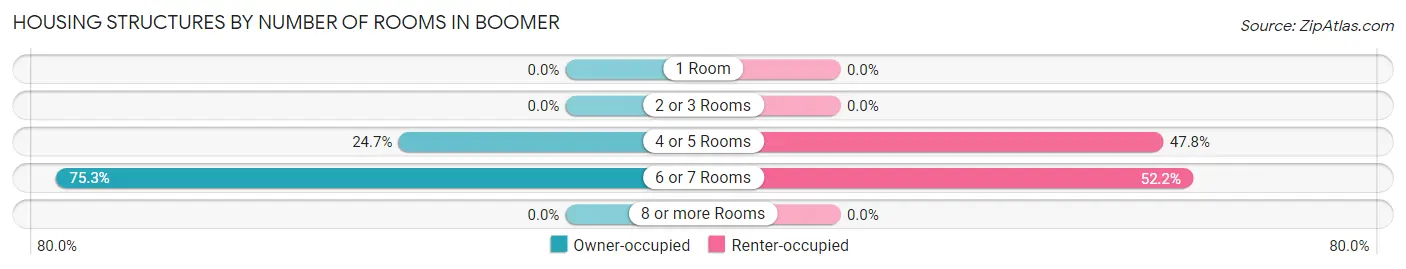
| Number of Rooms | Owner-occupied | Renter-occupied |
| 1 Room | 0 (0.0%) | 0 (0.0%) |
| 2 or 3 Rooms | 0 (0.0%) | 0 (0.0%) |
| 4 or 5 Rooms | 43 (24.7%) | 65 (47.8%) |
| 6 or 7 Rooms | 131 (75.3%) | 71 (52.2%) |
| 8 or more Rooms | 0 (0.0%) | 0 (0.0%) |
| Total | 174 (100.0%) | 136 (100.0%) |
Housing Structure by Heating Type in Boomer
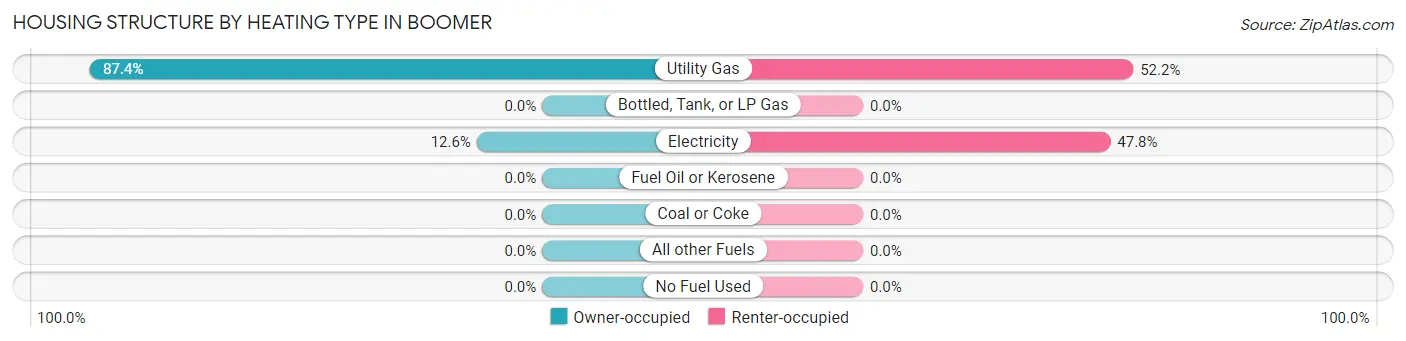
| Heating Type | Owner-occupied | Renter-occupied |
| Utility Gas | 152 (87.4%) | 71 (52.2%) |
| Bottled, Tank, or LP Gas | 0 (0.0%) | 0 (0.0%) |
| Electricity | 22 (12.6%) | 65 (47.8%) |
| Fuel Oil or Kerosene | 0 (0.0%) | 0 (0.0%) |
| Coal or Coke | 0 (0.0%) | 0 (0.0%) |
| All other Fuels | 0 (0.0%) | 0 (0.0%) |
| No Fuel Used | 0 (0.0%) | 0 (0.0%) |
| Total | 174 (100.0%) | 136 (100.0%) |
Household Vehicle Usage in Boomer
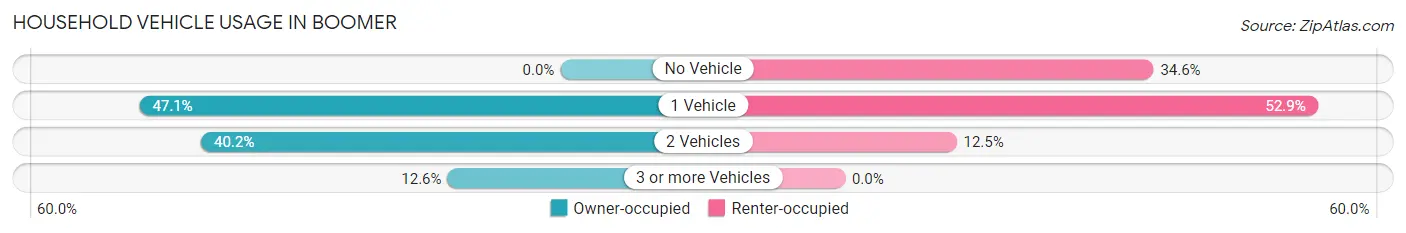
| Vehicles per Household | Owner-occupied | Renter-occupied |
| No Vehicle | 0 (0.0%) | 47 (34.6%) |
| 1 Vehicle | 82 (47.1%) | 72 (52.9%) |
| 2 Vehicles | 70 (40.2%) | 17 (12.5%) |
| 3 or more Vehicles | 22 (12.6%) | 0 (0.0%) |
| Total | 174 (100.0%) | 136 (100.0%) |
Real Estate & Mortgages in Boomer
Real Estate and Mortgage Overview in Boomer
| Characteristic | Without Mortgage | With Mortgage |
| Housing Units | 110 | 64 |
| Median Property Value | $84,300 | $0 |
| Median Household Income | $28,929 | $0 |
| Monthly Housing Costs | $379 | $0 |
| Real Estate Taxes | $286 | $0 |
Property Value by Mortgage Status in Boomer
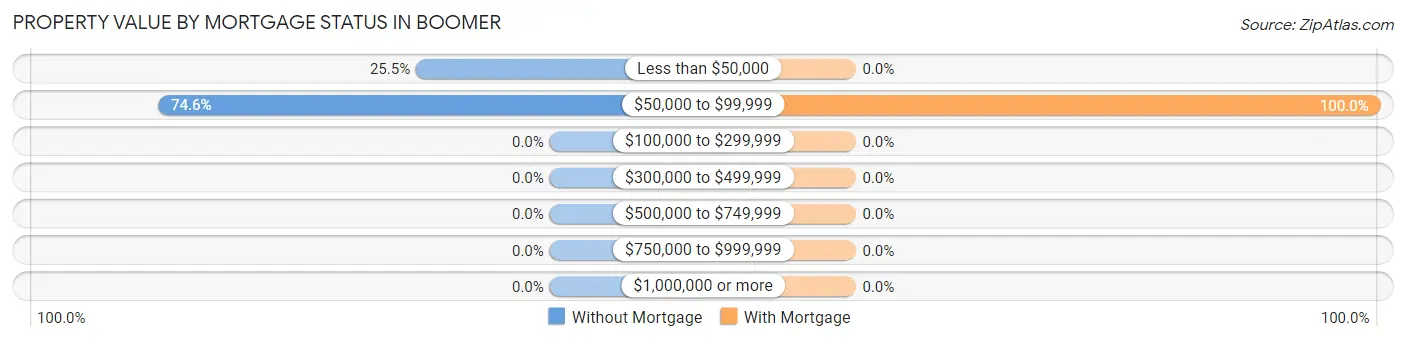
| Property Value | Without Mortgage | With Mortgage |
| Less than $50,000 | 28 (25.5%) | 0 (0.0%) |
| $50,000 to $99,999 | 82 (74.6%) | 64 (100.0%) |
| $100,000 to $299,999 | 0 (0.0%) | 0 (0.0%) |
| $300,000 to $499,999 | 0 (0.0%) | 0 (0.0%) |
| $500,000 to $749,999 | 0 (0.0%) | 0 (0.0%) |
| $750,000 to $999,999 | 0 (0.0%) | 0 (0.0%) |
| $1,000,000 or more | 0 (0.0%) | 0 (0.0%) |
| Total | 110 (100.0%) | 64 (100.0%) |
Household Income by Mortgage Status in Boomer
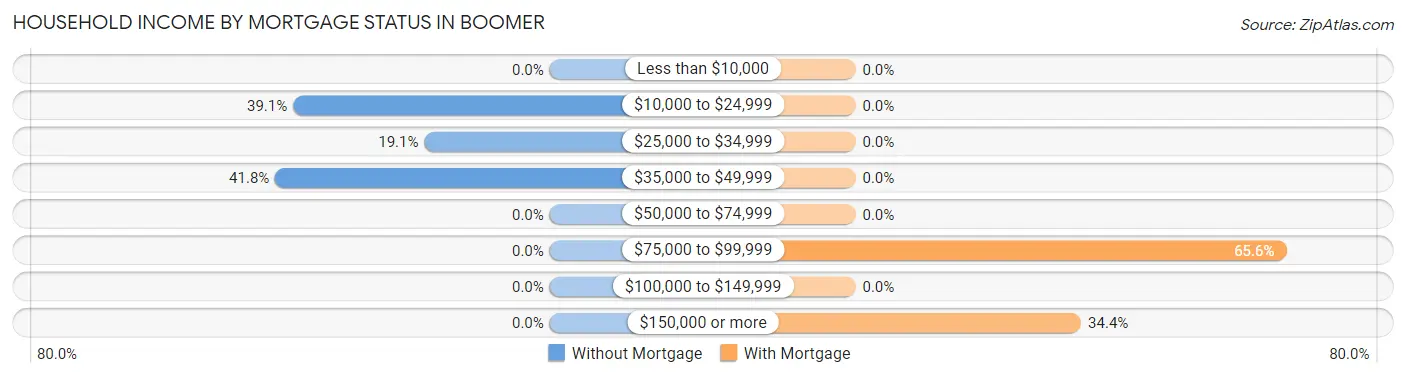
| Household Income | Without Mortgage | With Mortgage |
| Less than $10,000 | 0 (0.0%) | 0 (0.0%) |
| $10,000 to $24,999 | 43 (39.1%) | 0 (0.0%) |
| $25,000 to $34,999 | 21 (19.1%) | 0 (0.0%) |
| $35,000 to $49,999 | 46 (41.8%) | 0 (0.0%) |
| $50,000 to $74,999 | 0 (0.0%) | 0 (0.0%) |
| $75,000 to $99,999 | 0 (0.0%) | 42 (65.6%) |
| $100,000 to $149,999 | 0 (0.0%) | 0 (0.0%) |
| $150,000 or more | 0 (0.0%) | 22 (34.4%) |
| Total | 110 (100.0%) | 64 (100.0%) |
Property Value to Household Income Ratio in Boomer
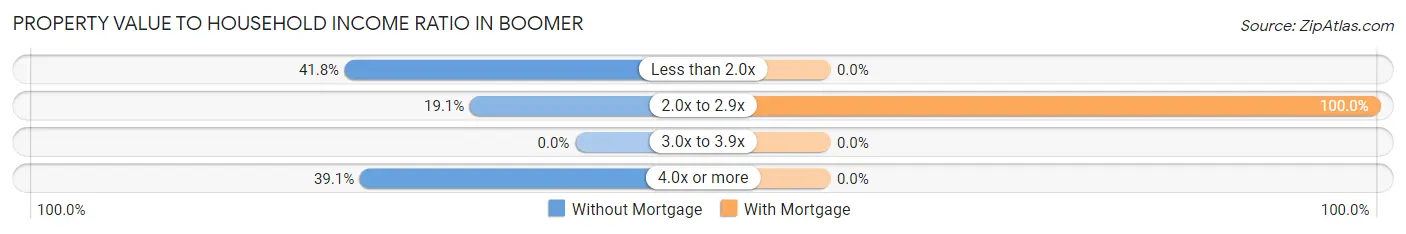
| Value-to-Income Ratio | Without Mortgage | With Mortgage |
| Less than 2.0x | 46 (41.8%) | 0 (0.0%) |
| 2.0x to 2.9x | 21 (19.1%) | 64 (100.0%) |
| 3.0x to 3.9x | 0 (0.0%) | 0 (0.0%) |
| 4.0x or more | 43 (39.1%) | 0 (0.0%) |
| Total | 110 (100.0%) | 64 (100.0%) |
Real Estate Taxes by Mortgage Status in Boomer
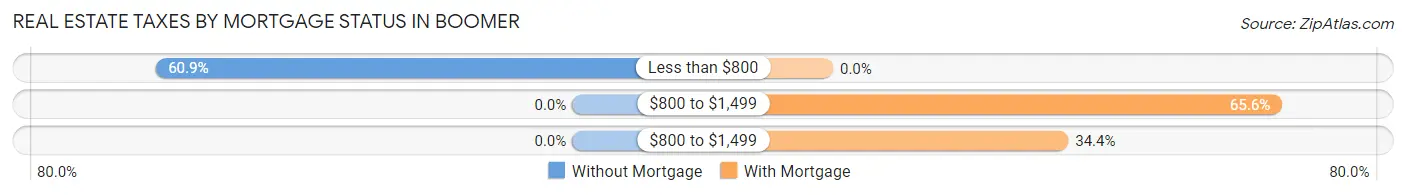
| Property Taxes | Without Mortgage | With Mortgage |
| Less than $800 | 67 (60.9%) | 0 (0.0%) |
| $800 to $1,499 | 0 (0.0%) | 42 (65.6%) |
| $800 to $1,499 | 0 (0.0%) | 22 (34.4%) |
| Total | 110 (100.0%) | 64 (100.0%) |
Health & Disability in Boomer
Health Insurance Coverage by Age in Boomer
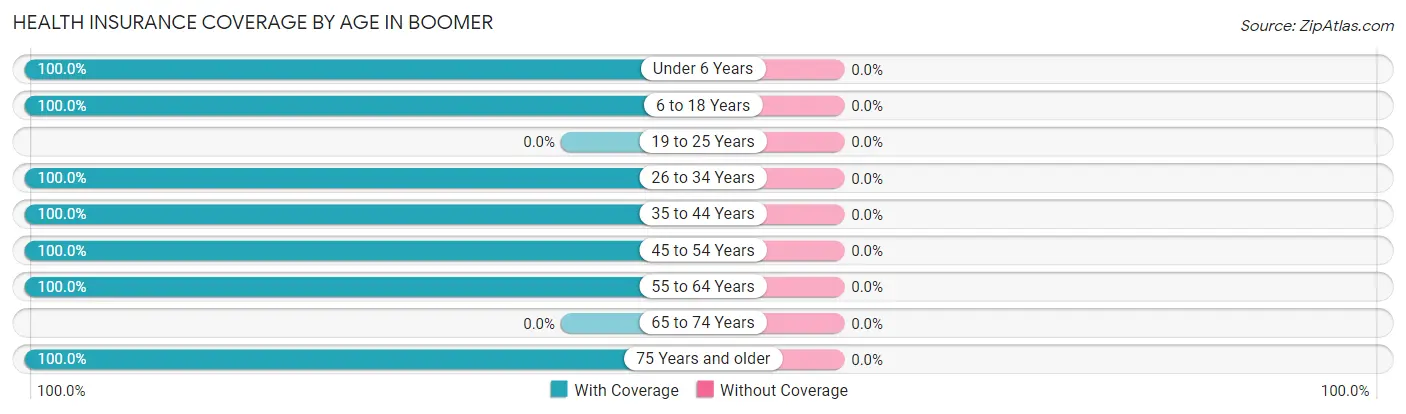
| Age Bracket | With Coverage | Without Coverage |
| Under 6 Years | 23 (100.0%) | 0 (0.0%) |
| 6 to 18 Years | 131 (100.0%) | 0 (0.0%) |
| 19 to 25 Years | 0 (0.0%) | 0 (0.0%) |
| 26 to 34 Years | 44 (100.0%) | 0 (0.0%) |
| 35 to 44 Years | 89 (100.0%) | 0 (0.0%) |
| 45 to 54 Years | 121 (100.0%) | 0 (0.0%) |
| 55 to 64 Years | 28 (100.0%) | 0 (0.0%) |
| 65 to 74 Years | 0 (0.0%) | 0 (0.0%) |
| 75 Years and older | 101 (100.0%) | 0 (0.0%) |
| Total | 537 (100.0%) | 0 (0.0%) |
Health Insurance Coverage by Citizenship Status in Boomer
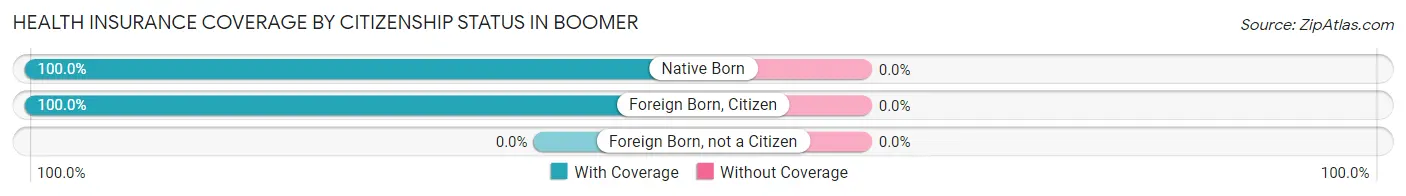
| Citizenship Status | With Coverage | Without Coverage |
| Native Born | 23 (100.0%) | 0 (0.0%) |
| Foreign Born, Citizen | 131 (100.0%) | 0 (0.0%) |
| Foreign Born, not a Citizen | 0 (0.0%) | 0 (0.0%) |
Health Insurance Coverage by Household Income in Boomer
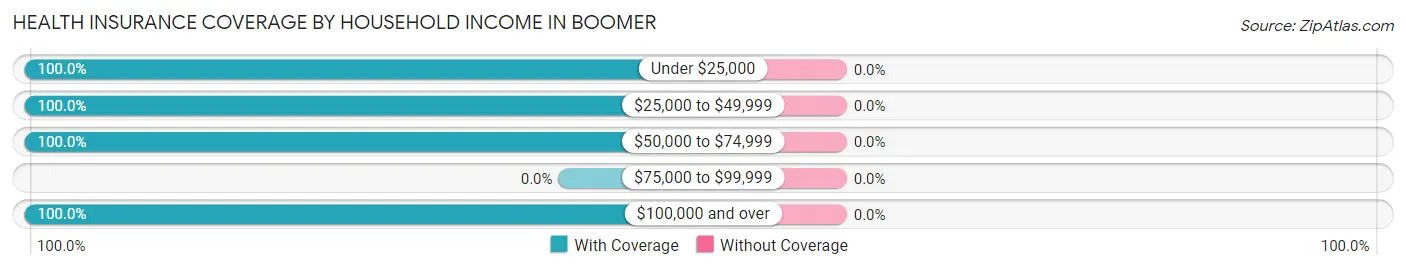
| Household Income | With Coverage | Without Coverage |
| Under $25,000 | 196 (100.0%) | 0 (0.0%) |
| $25,000 to $49,999 | 109 (100.0%) | 0 (0.0%) |
| $50,000 to $74,999 | 181 (100.0%) | 0 (0.0%) |
| $75,000 to $99,999 | 0 (0.0%) | 0 (0.0%) |
| $100,000 and over | 51 (100.0%) | 0 (0.0%) |
Public vs Private Health Insurance Coverage by Age in Boomer
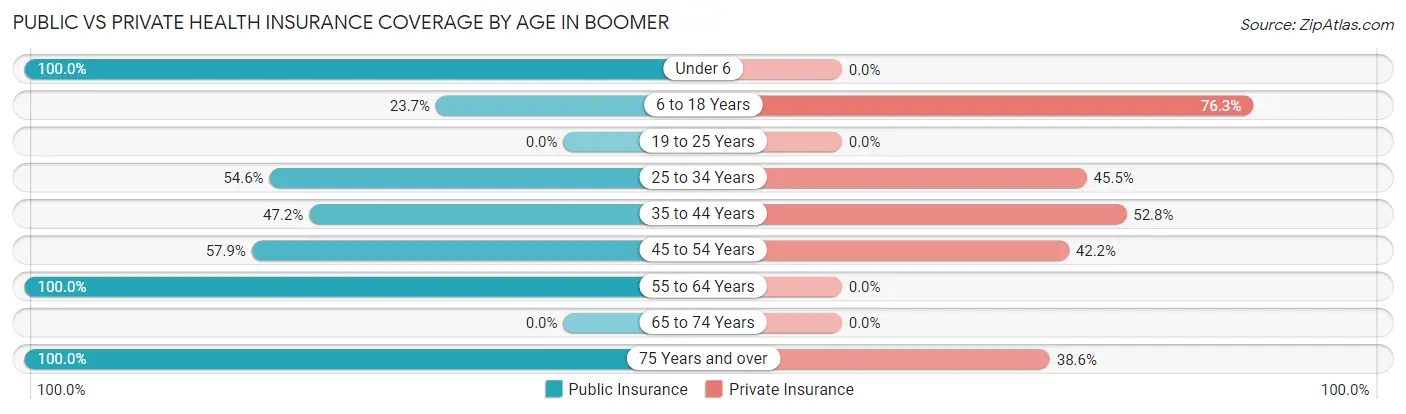
| Age Bracket | Public Insurance | Private Insurance |
| Under 6 | 23 (100.0%) | 0 (0.0%) |
| 6 to 18 Years | 31 (23.7%) | 100 (76.3%) |
| 19 to 25 Years | 0 (0.0%) | 0 (0.0%) |
| 25 to 34 Years | 24 (54.5%) | 20 (45.5%) |
| 35 to 44 Years | 42 (47.2%) | 47 (52.8%) |
| 45 to 54 Years | 70 (57.9%) | 51 (42.1%) |
| 55 to 64 Years | 28 (100.0%) | 0 (0.0%) |
| 65 to 74 Years | 0 (0.0%) | 0 (0.0%) |
| 75 Years and over | 101 (100.0%) | 39 (38.6%) |
| Total | 319 (59.4%) | 257 (47.9%) |
Disability Status by Sex by Age in Boomer
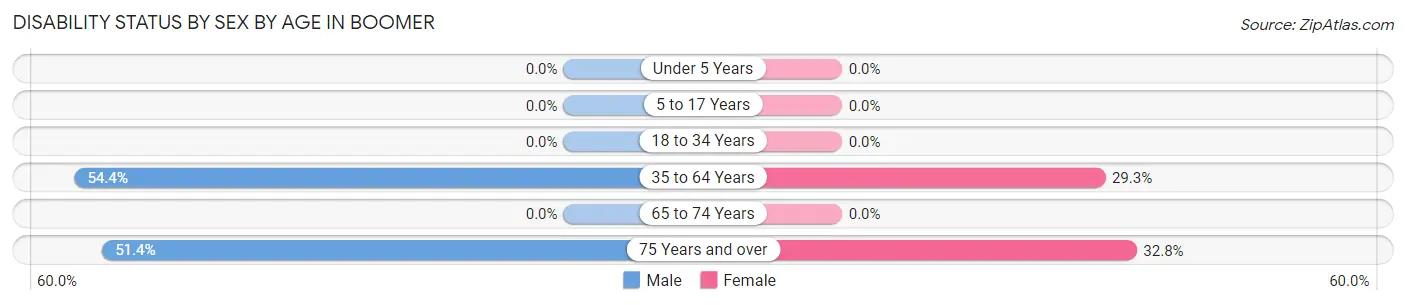
| Age Bracket | Male | Female |
| Under 5 Years | 0 (0.0%) | 0 (0.0%) |
| 5 to 17 Years | 0 (0.0%) | 0 (0.0%) |
| 18 to 34 Years | 0 (0.0%) | 0 (0.0%) |
| 35 to 64 Years | 98 (54.4%) | 17 (29.3%) |
| 65 to 74 Years | 0 (0.0%) | 0 (0.0%) |
| 75 Years and over | 19 (51.3%) | 21 (32.8%) |
Disability Class by Sex by Age in Boomer
Disability Class: Hearing Difficulty
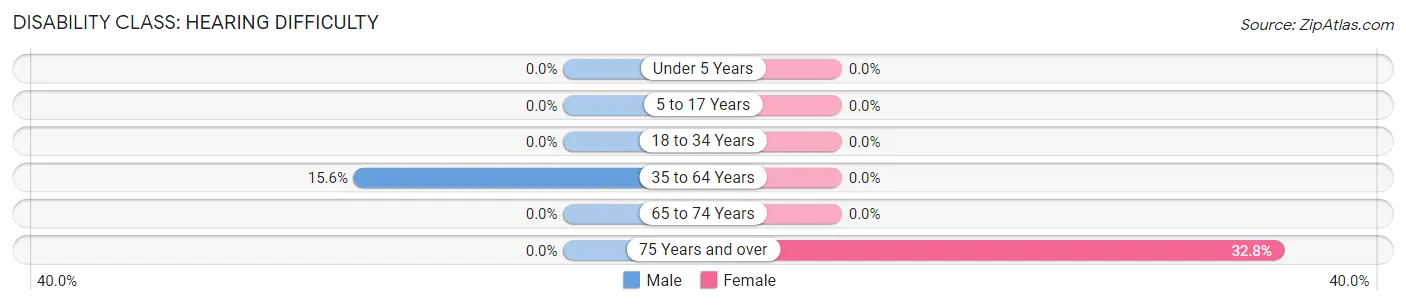
| Age Bracket | Male | Female |
| Under 5 Years | 0 (0.0%) | 0 (0.0%) |
| 5 to 17 Years | 0 (0.0%) | 0 (0.0%) |
| 18 to 34 Years | 0 (0.0%) | 0 (0.0%) |
| 35 to 64 Years | 28 (15.6%) | 0 (0.0%) |
| 65 to 74 Years | 0 (0.0%) | 0 (0.0%) |
| 75 Years and over | 0 (0.0%) | 21 (32.8%) |
Disability Class: Vision Difficulty
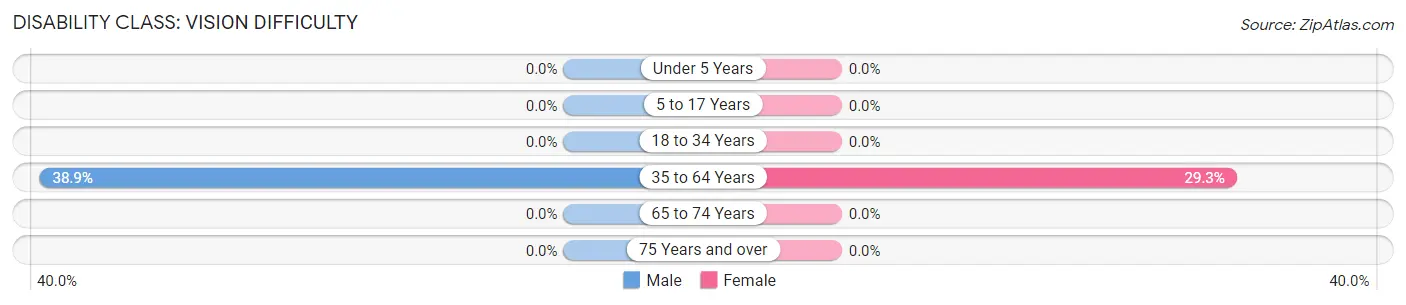
| Age Bracket | Male | Female |
| Under 5 Years | 0 (0.0%) | 0 (0.0%) |
| 5 to 17 Years | 0 (0.0%) | 0 (0.0%) |
| 18 to 34 Years | 0 (0.0%) | 0 (0.0%) |
| 35 to 64 Years | 70 (38.9%) | 17 (29.3%) |
| 65 to 74 Years | 0 (0.0%) | 0 (0.0%) |
| 75 Years and over | 0 (0.0%) | 0 (0.0%) |
Disability Class: Cognitive Difficulty
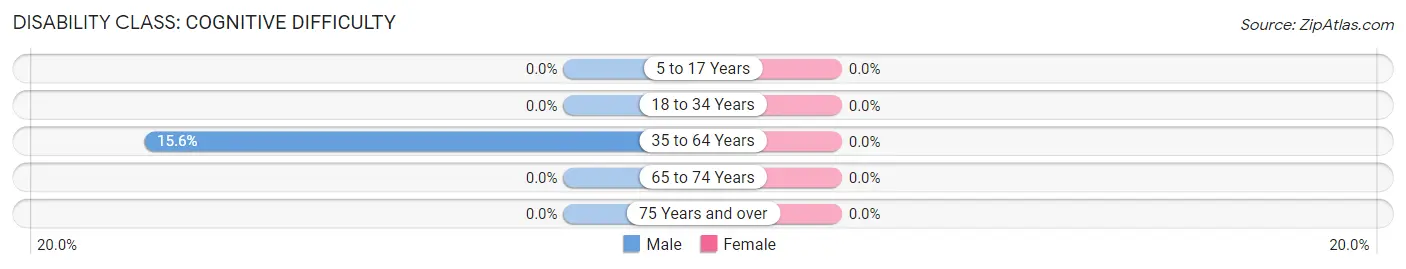
| Age Bracket | Male | Female |
| 5 to 17 Years | 0 (0.0%) | 0 (0.0%) |
| 18 to 34 Years | 0 (0.0%) | 0 (0.0%) |
| 35 to 64 Years | 28 (15.6%) | 0 (0.0%) |
| 65 to 74 Years | 0 (0.0%) | 0 (0.0%) |
| 75 Years and over | 0 (0.0%) | 0 (0.0%) |
Disability Class: Ambulatory Difficulty
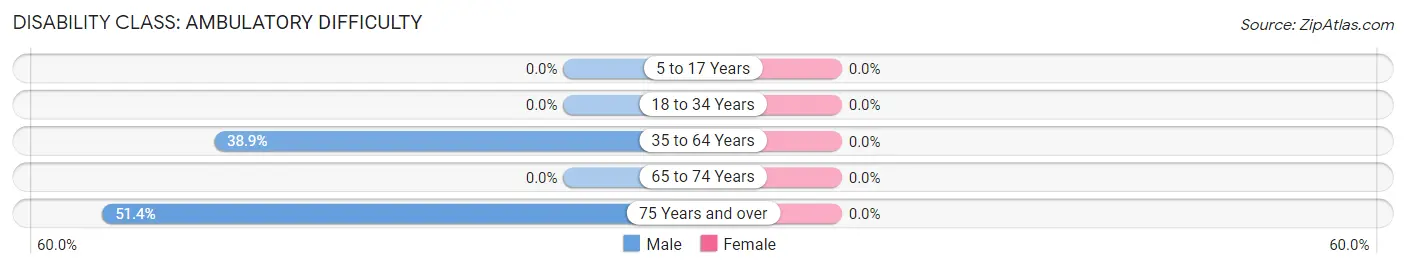
| Age Bracket | Male | Female |
| 5 to 17 Years | 0 (0.0%) | 0 (0.0%) |
| 18 to 34 Years | 0 (0.0%) | 0 (0.0%) |
| 35 to 64 Years | 70 (38.9%) | 0 (0.0%) |
| 65 to 74 Years | 0 (0.0%) | 0 (0.0%) |
| 75 Years and over | 19 (51.3%) | 0 (0.0%) |
Disability Class: Self-Care Difficulty
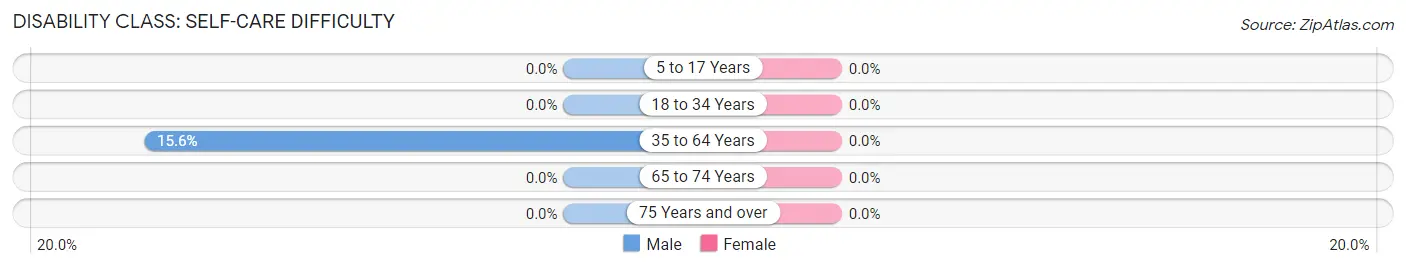
| Age Bracket | Male | Female |
| 5 to 17 Years | 0 (0.0%) | 0 (0.0%) |
| 18 to 34 Years | 0 (0.0%) | 0 (0.0%) |
| 35 to 64 Years | 28 (15.6%) | 0 (0.0%) |
| 65 to 74 Years | 0 (0.0%) | 0 (0.0%) |
| 75 Years and over | 0 (0.0%) | 0 (0.0%) |
Technology Access in Boomer
Computing Device Access in Boomer
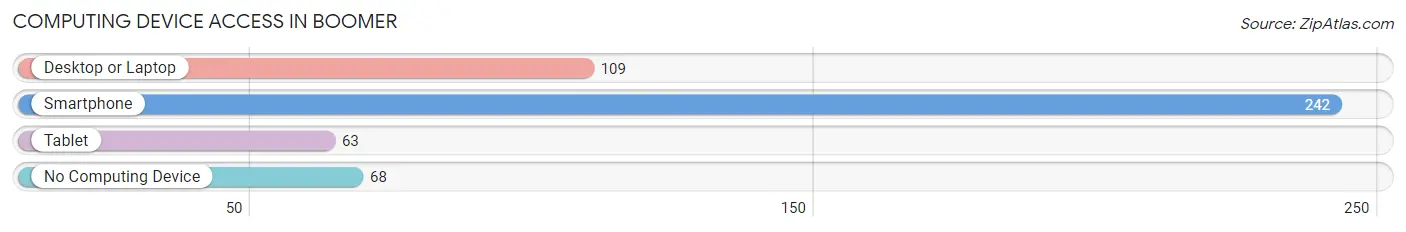
| Device Type | # Households | % Households |
| Desktop or Laptop | 109 | 35.2% |
| Smartphone | 242 | 78.1% |
| Tablet | 63 | 20.3% |
| No Computing Device | 68 | 21.9% |
| Total | 310 | 100.0% |
Internet Access in Boomer
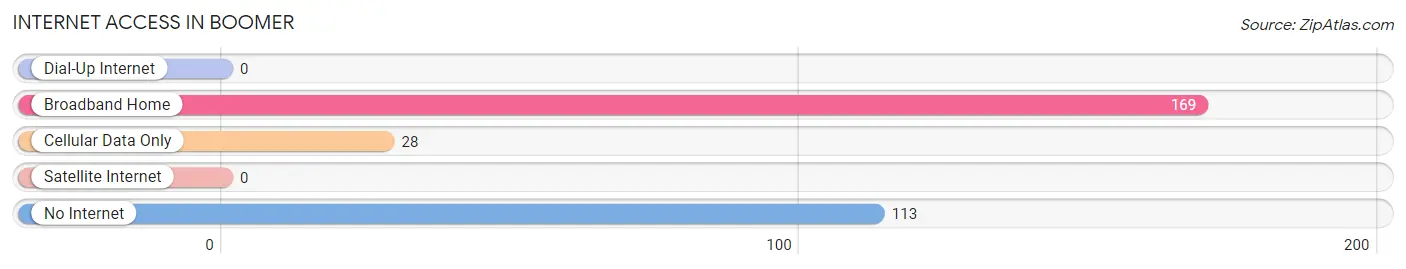
| Internet Type | # Households | % Households |
| Dial-Up Internet | 0 | 0.0% |
| Broadband Home | 169 | 54.5% |
| Cellular Data Only | 28 | 9.0% |
| Satellite Internet | 0 | 0.0% |
| No Internet | 113 | 36.4% |
| Total | 310 | 100.0% |
Boomer Summary
Boomer is an unincorporated community located in the northern part of Fayette County, West Virginia. It is situated along the banks of the New River, and is part of the Beckley metropolitan area. Boomer is a small, rural community with a population of approximately 1,000 people.
History
Boomer was first settled in the late 1700s by a group of settlers from Virginia. The town was originally known as “Boomer’s Bottom”, named after the first settler, John Boomer. The town was officially incorporated in 1891.
In the early 1900s, Boomer was a thriving coal mining town. The town was home to several coal mines, including the Boomer Coal Company, which was the largest coal mine in the area. The coal industry was the main source of employment for the town’s residents.
In the 1950s, the coal industry began to decline, and many of the town’s residents moved away in search of work. The town’s population decreased significantly, and the town’s economy suffered.
In the late 1970s, the town began to experience a resurgence. The town’s population began to increase, and new businesses began to open. The town’s economy began to improve, and the town’s population has continued to grow since then.
Geography
Boomer is located in the northern part of Fayette County, West Virginia. The town is situated along the banks of the New River, and is part of the Beckley metropolitan area. The town is located in a rural area, and is surrounded by rolling hills and forests.
The climate in Boomer is temperate, with hot summers and cold winters. The average temperature in the summer is around 75 degrees Fahrenheit, and the average temperature in the winter is around 35 degrees Fahrenheit.
Economy
The economy of Boomer is largely based on agriculture and tourism. The town is home to several farms, and the surrounding area is known for its agricultural products, such as corn, soybeans, and hay.
The town is also a popular tourist destination, and is home to several attractions, such as the New River Gorge National River, the New River Gorge Bridge, and the Bluestone National Scenic River. The town is also home to several restaurants, shops, and other businesses.
Demographics
As of the 2010 census, the population of Boomer was 1,000 people. The town is predominantly white, with a small African American population. The median household income in Boomer is $35,000, and the median home value is $90,000. The town has a high rate of poverty, with approximately 25% of the population living below the poverty line.
Common Questions
What is Per Capita Income in Boomer?
Per Capita income in Boomer is $20,137.
What is the Median Household income in Boomer?
Median Household Income in Boomer is $29,048.
What is Inequality or Gini Index in Boomer?
Inequality or Gini Index in Boomer is 0.38.
What is the Total Population of Boomer?
Total Population of Boomer is 537.
What is the Total Male Population of Boomer?
Total Male Population of Boomer is 371.
What is the Total Female Population of Boomer?
Total Female Population of Boomer is 166.
What is the Ratio of Males per 100 Females in Boomer?
There are 223.49 Males per 100 Females in Boomer.
What is the Ratio of Females per 100 Males in Boomer?
There are 44.74 Females per 100 Males in Boomer.
What is the Median Population Age in Boomer?
Median Population Age in Boomer is 44.3 Years.
What is the Average Family Size in Boomer
Average Family Size in Boomer is 3.3 People.
What is the Average Household Size in Boomer
Average Household Size in Boomer is 1.7 People.
How Large is the Labor Force in Boomer?
There are 184 People in the Labor Forcein in Boomer.
What is the Percentage of People in the Labor Force in Boomer?
44.2% of People are in the Labor Force in Boomer.
What is the Unemployment Rate in Boomer?
Unemployment Rate in Boomer is 9.2%.