Belmont, WV Map & Demographics
Belmont Map
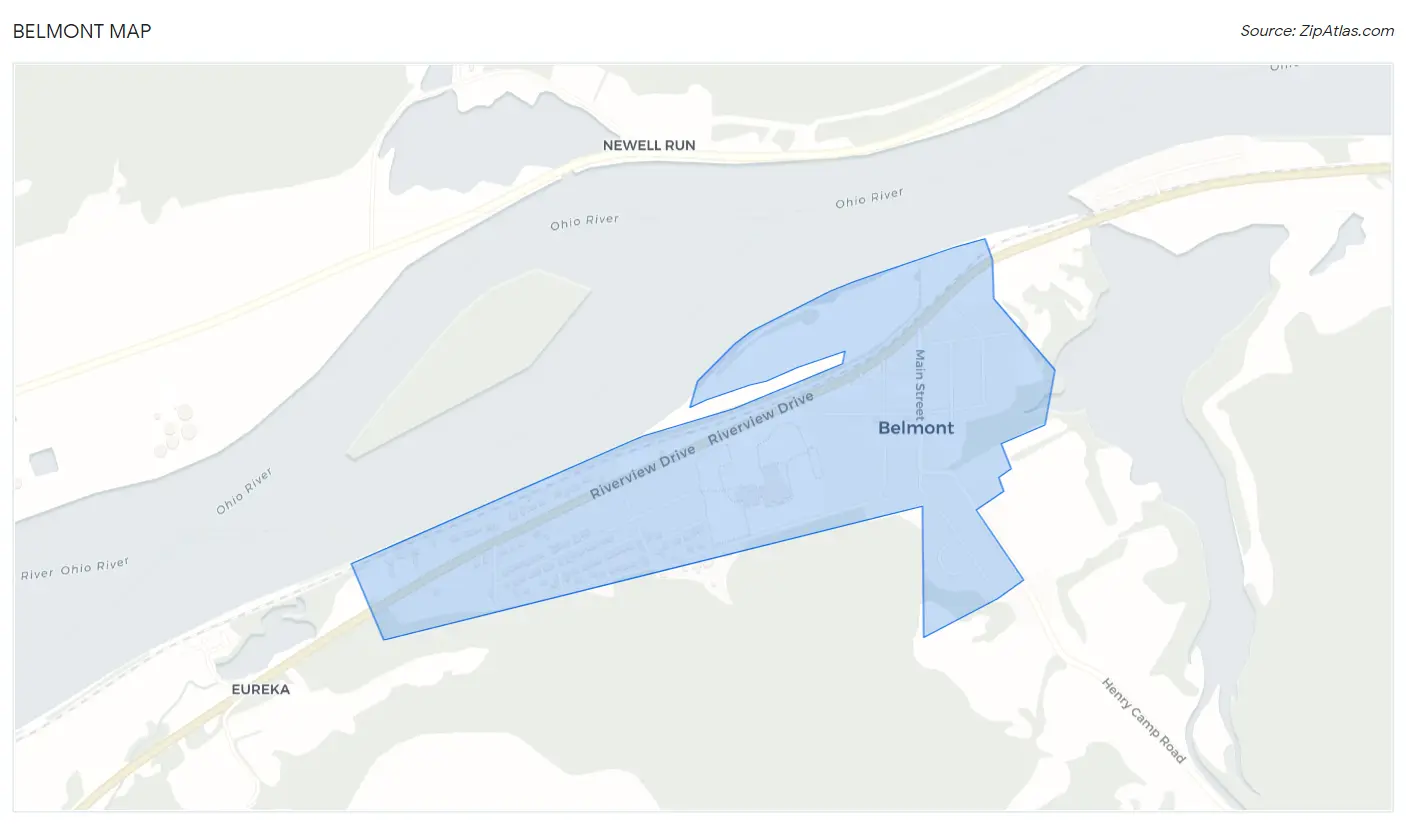
Belmont Overview
$30,282
PER CAPITA INCOME
$72,917
AVG FAMILY INCOME
$55,417
AVG HOUSEHOLD INCOME
44.8%
WAGE / INCOME GAP [ % ]
55.2¢/ $1
WAGE / INCOME GAP [ $ ]
0.39
INEQUALITY / GINI INDEX
824
TOTAL POPULATION
438
MALE POPULATION
386
FEMALE POPULATION
113.47
MALES / 100 FEMALES
88.13
FEMALES / 100 MALES
46.5
MEDIAN AGE
2.9
AVG FAMILY SIZE
2.2
AVG HOUSEHOLD SIZE
380
LABOR FORCE [ PEOPLE ]
52.2%
PERCENT IN LABOR FORCE
6.6%
UNEMPLOYMENT RATE
Belmont Zip Codes
Belmont Area Codes
Income in Belmont
Income Overview in Belmont
Per Capita Income in Belmont is $30,282, while median incomes of families and households are $72,917 and $55,417 respectively.
| Characteristic | Number | Measure |
| Per Capita Income | 824 | $30,282 |
| Median Family Income | 169 | $72,917 |
| Mean Family Income | 169 | $77,652 |
| Median Household Income | 345 | $55,417 |
| Mean Household Income | 345 | $62,892 |
| Income Deficit | 169 | $0 |
| Wage / Income Gap (%) | 824 | 44.81% |
| Wage / Income Gap ($) | 824 | 55.19¢ per $1 |
| Gini / Inequality Index | 824 | 0.39 |
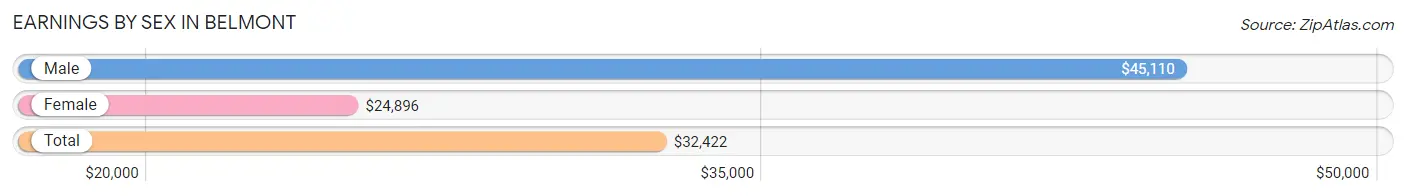
Earnings by Sex in Belmont
Average Earnings in Belmont are $32,422, $45,110 for men and $24,896 for women, a difference of 44.8%.
| Sex | Number | Average Earnings |
| Male | 258 (64.0%) | $45,110 |
| Female | 145 (36.0%) | $24,896 |
| Total | 403 (100.0%) | $32,422 |
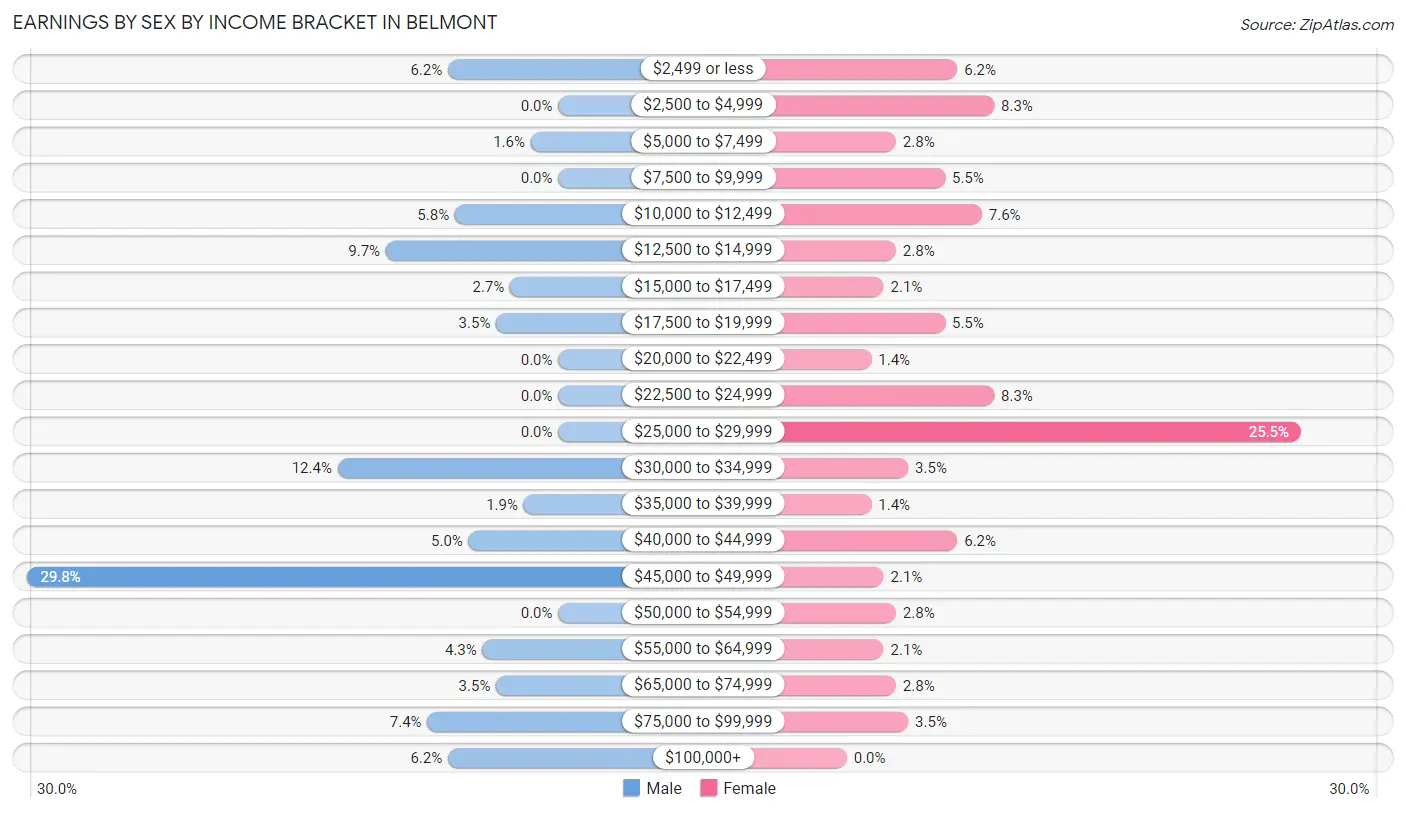
Earnings by Sex by Income Bracket in Belmont
The most common earnings brackets in Belmont are $45,000 to $49,999 for men (77 | 29.8%) and $25,000 to $29,999 for women (37 | 25.5%).
| Income | Male | Female |
| $2,499 or less | 16 (6.2%) | 9 (6.2%) |
| $2,500 to $4,999 | 0 (0.0%) | 12 (8.3%) |
| $5,000 to $7,499 | 4 (1.5%) | 4 (2.8%) |
| $7,500 to $9,999 | 0 (0.0%) | 8 (5.5%) |
| $10,000 to $12,499 | 15 (5.8%) | 11 (7.6%) |
| $12,500 to $14,999 | 25 (9.7%) | 4 (2.8%) |
| $15,000 to $17,499 | 7 (2.7%) | 3 (2.1%) |
| $17,500 to $19,999 | 9 (3.5%) | 8 (5.5%) |
| $20,000 to $22,499 | 0 (0.0%) | 2 (1.4%) |
| $22,500 to $24,999 | 0 (0.0%) | 12 (8.3%) |
| $25,000 to $29,999 | 0 (0.0%) | 37 (25.5%) |
| $30,000 to $34,999 | 32 (12.4%) | 5 (3.5%) |
| $35,000 to $39,999 | 5 (1.9%) | 2 (1.4%) |
| $40,000 to $44,999 | 13 (5.0%) | 9 (6.2%) |
| $45,000 to $49,999 | 77 (29.8%) | 3 (2.1%) |
| $50,000 to $54,999 | 0 (0.0%) | 4 (2.8%) |
| $55,000 to $64,999 | 11 (4.3%) | 3 (2.1%) |
| $65,000 to $74,999 | 9 (3.5%) | 4 (2.8%) |
| $75,000 to $99,999 | 19 (7.4%) | 5 (3.5%) |
| $100,000+ | 16 (6.2%) | 0 (0.0%) |
| Total | 258 (100.0%) | 145 (100.0%) |
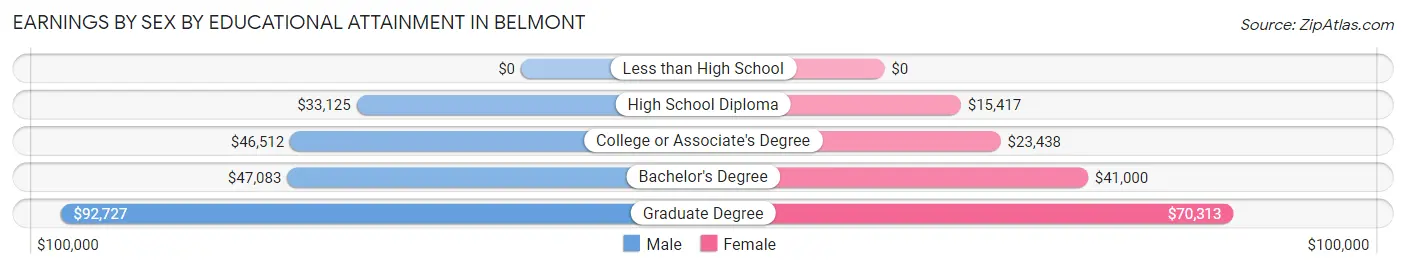
Earnings by Sex by Educational Attainment in Belmont
Average earnings in Belmont are $46,140 for men and $19,688 for women, a difference of 57.3%. Men with an educational attainment of graduate degree enjoy the highest average annual earnings of $92,727, while those with high school diploma education earn the least with $33,125. Women with an educational attainment of graduate degree earn the most with the average annual earnings of $70,313, while those with high school diploma education have the smallest earnings of $15,417.
| Educational Attainment | Male Income | Female Income |
| Less than High School | - | - |
| High School Diploma | $33,125 | $15,417 |
| College or Associate's Degree | $46,512 | $23,438 |
| Bachelor's Degree | $47,083 | $41,000 |
| Graduate Degree | $92,727 | $70,313 |
| Total | $46,140 | $19,688 |
Family Income in Belmont
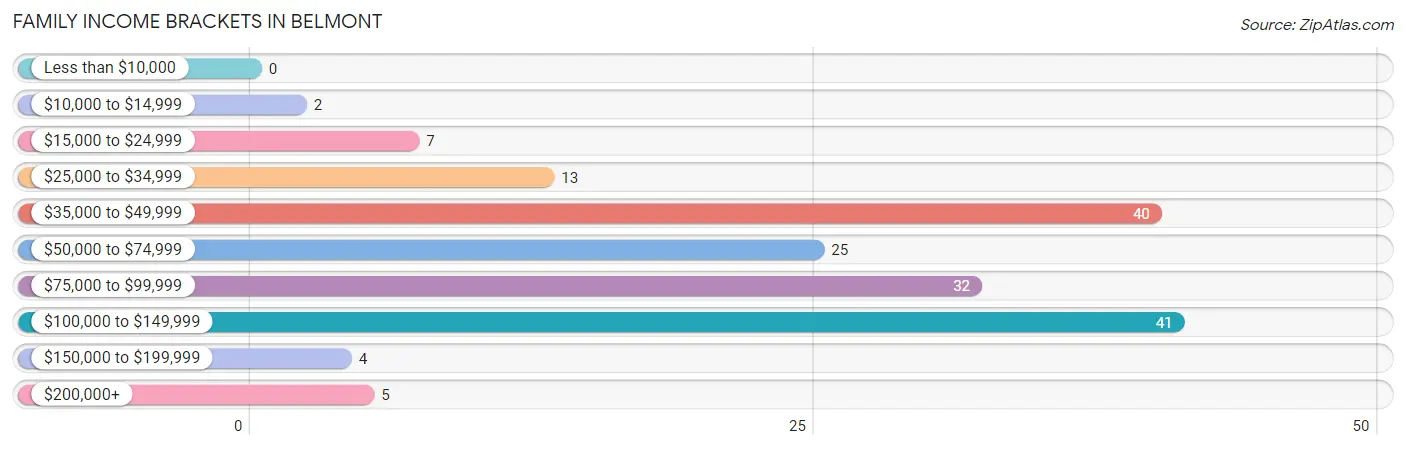
Family Income Brackets in Belmont
According to the Belmont family income data, there are 41 families falling into the $100,000 to $149,999 income range, which is the most common income bracket and makes up 24.3% of all families.
| Income Bracket | # Families | % Families |
| Less than $10,000 | 0 | 0.0% |
| $10,000 to $14,999 | 2 | 1.2% |
| $15,000 to $24,999 | 7 | 4.1% |
| $25,000 to $34,999 | 13 | 7.7% |
| $35,000 to $49,999 | 40 | 23.7% |
| $50,000 to $74,999 | 25 | 14.8% |
| $75,000 to $99,999 | 32 | 18.9% |
| $100,000 to $149,999 | 41 | 24.3% |
| $150,000 to $199,999 | 4 | 2.4% |
| $200,000+ | 5 | 3.0% |
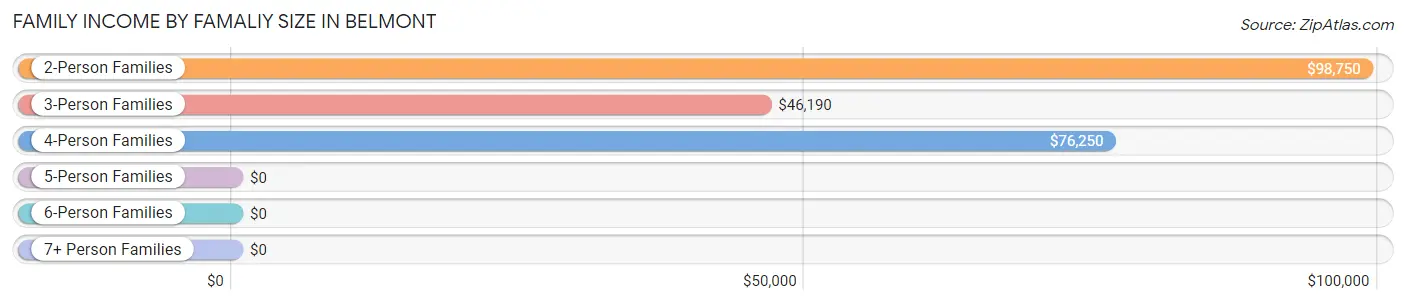
Family Income by Famaliy Size in Belmont
2-person families (82 | 48.5%) account for the highest median family income in Belmont with $98,750 per family, while 2-person families (82 | 48.5%) have the highest median income of $49,375 per family member.
| Income Bracket | # Families | Median Income |
| 2-Person Families | 82 (48.5%) | $98,750 |
| 3-Person Families | 60 (35.5%) | $46,190 |
| 4-Person Families | 14 (8.3%) | $76,250 |
| 5-Person Families | 6 (3.5%) | $0 |
| 6-Person Families | 7 (4.1%) | $0 |
| 7+ Person Families | 0 (0.0%) | $0 |
| Total | 169 (100.0%) | $72,917 |
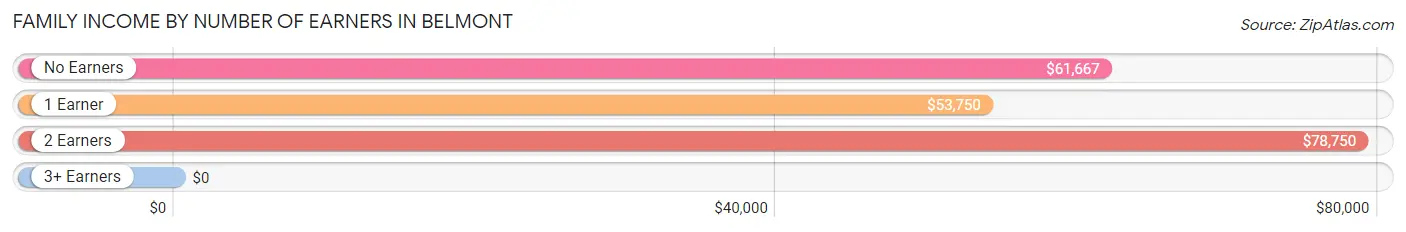
Family Income by Number of Earners in Belmont
| Number of Earners | # Families | Median Income |
| No Earners | 32 (18.9%) | $61,667 |
| 1 Earner | 54 (32.0%) | $53,750 |
| 2 Earners | 83 (49.1%) | $78,750 |
| 3+ Earners | 0 (0.0%) | $0 |
| Total | 169 (100.0%) | $72,917 |
Household Income in Belmont
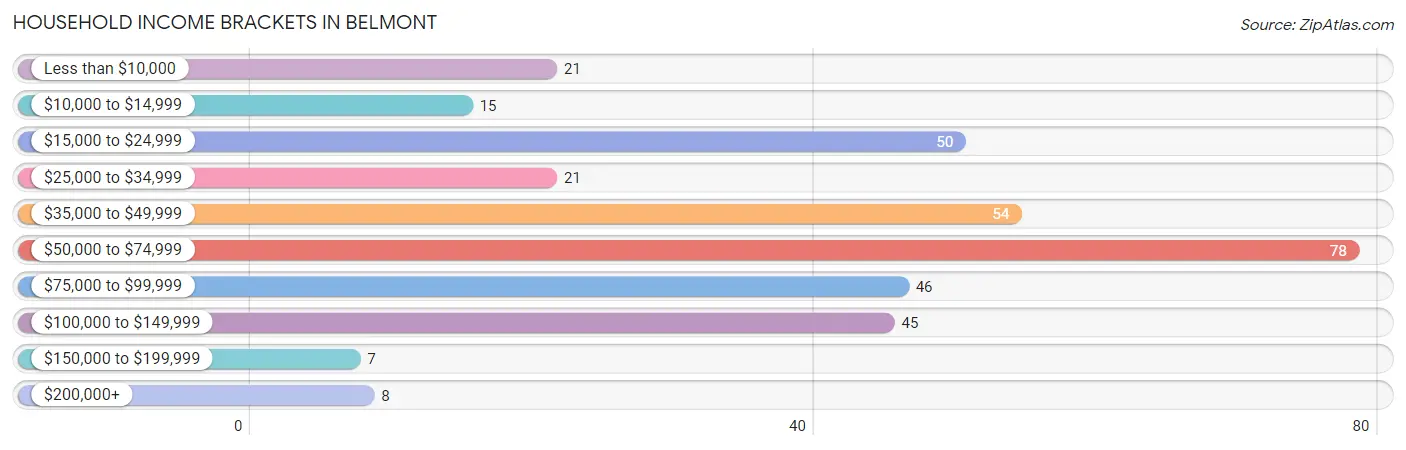
Household Income Brackets in Belmont
With 78 households falling in the category, the $50,000 to $74,999 income range is the most frequent in Belmont, accounting for 22.6% of all households. In contrast, only 7 households (2.0%) fall into the $150,000 to $199,999 income bracket, making it the least populous group.
| Income Bracket | # Households | % Households |
| Less than $10,000 | 21 | 6.1% |
| $10,000 to $14,999 | 15 | 4.3% |
| $15,000 to $24,999 | 50 | 14.5% |
| $25,000 to $34,999 | 21 | 6.1% |
| $35,000 to $49,999 | 54 | 15.7% |
| $50,000 to $74,999 | 78 | 22.6% |
| $75,000 to $99,999 | 46 | 13.3% |
| $100,000 to $149,999 | 45 | 13.0% |
| $150,000 to $199,999 | 7 | 2.0% |
| $200,000+ | 8 | 2.3% |
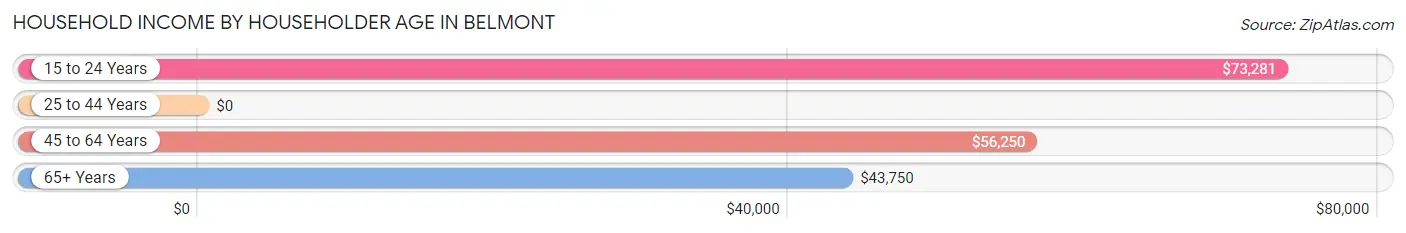
Household Income by Householder Age in Belmont
The median household income in Belmont is $55,417, with the highest median household income of $73,281 found in the 15 to 24 years age bracket for the primary householder. A total of 44 households (12.8%) fall into this category. Meanwhile, the 25 to 44 years age bracket for the primary householder has the lowest median household income of $0, with 69 households (20.0%) in this group.
| Income Bracket | # Households | Median Income |
| 15 to 24 Years | 44 (12.8%) | $73,281 |
| 25 to 44 Years | 69 (20.0%) | $0 |
| 45 to 64 Years | 99 (28.7%) | $56,250 |
| 65+ Years | 133 (38.6%) | $43,750 |
| Total | 345 (100.0%) | $55,417 |
Poverty in Belmont
Income Below Poverty by Sex and Age in Belmont
With 6.8% poverty level for males and 13.5% for females among the residents of Belmont, under 5 year old males and 5 year old females are the most vulnerable to poverty, with 7 males (31.8%) and 7 females (100.0%) in their respective age groups living below the poverty level.
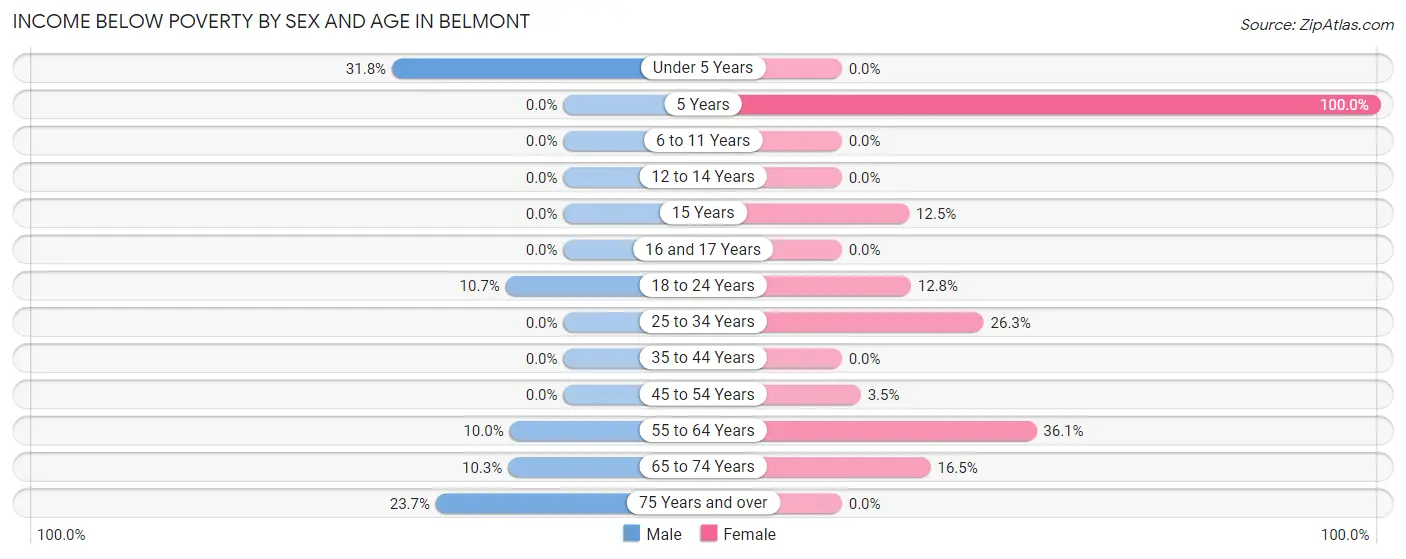
| Age Bracket | Male | Female |
| Under 5 Years | 7 (31.8%) | 0 (0.0%) |
| 5 Years | 0 (0.0%) | 7 (100.0%) |
| 6 to 11 Years | 0 (0.0%) | 0 (0.0%) |
| 12 to 14 Years | 0 (0.0%) | 0 (0.0%) |
| 15 Years | 0 (0.0%) | 1 (12.5%) |
| 16 and 17 Years | 0 (0.0%) | 0 (0.0%) |
| 18 to 24 Years | 6 (10.7%) | 5 (12.8%) |
| 25 to 34 Years | 0 (0.0%) | 5 (26.3%) |
| 35 to 44 Years | 0 (0.0%) | 0 (0.0%) |
| 45 to 54 Years | 0 (0.0%) | 2 (3.5%) |
| 55 to 64 Years | 2 (10.0%) | 13 (36.1%) |
| 65 to 74 Years | 4 (10.3%) | 14 (16.5%) |
| 75 Years and over | 9 (23.7%) | 0 (0.0%) |
| Total | 28 (6.8%) | 47 (13.5%) |
Income Above Poverty by Sex and Age in Belmont
According to the poverty statistics in Belmont, males aged 6 to 11 years and females aged under 5 years are the age groups that are most secure financially, with 100.0% of males and 100.0% of females in these age groups living above the poverty line.
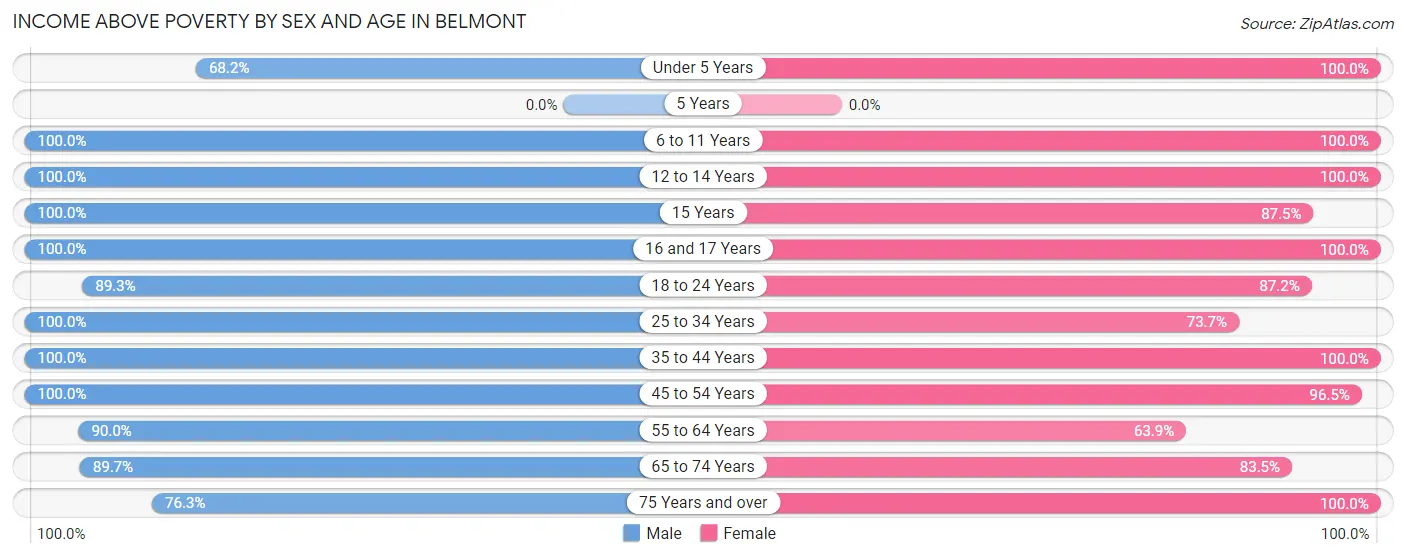
| Age Bracket | Male | Female |
| Under 5 Years | 15 (68.2%) | 3 (100.0%) |
| 5 Years | 0 (0.0%) | 0 (0.0%) |
| 6 to 11 Years | 17 (100.0%) | 12 (100.0%) |
| 12 to 14 Years | 12 (100.0%) | 8 (100.0%) |
| 15 Years | 7 (100.0%) | 7 (87.5%) |
| 16 and 17 Years | 2 (100.0%) | 9 (100.0%) |
| 18 to 24 Years | 50 (89.3%) | 34 (87.2%) |
| 25 to 34 Years | 89 (100.0%) | 14 (73.7%) |
| 35 to 44 Years | 64 (100.0%) | 33 (100.0%) |
| 45 to 54 Years | 47 (100.0%) | 55 (96.5%) |
| 55 to 64 Years | 18 (90.0%) | 23 (63.9%) |
| 65 to 74 Years | 35 (89.7%) | 71 (83.5%) |
| 75 Years and over | 29 (76.3%) | 31 (100.0%) |
| Total | 385 (93.2%) | 300 (86.5%) |
Income Below Poverty Among Married-Couple Families in Belmont
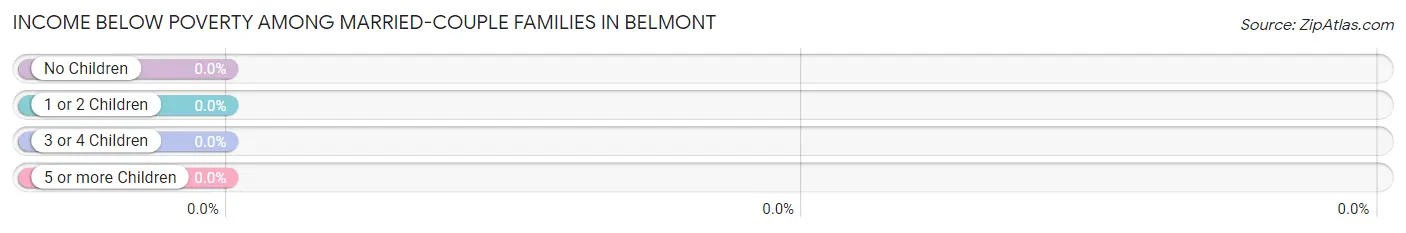
| Children | Above Poverty | Below Poverty |
| No Children | 79 (100.0%) | 0 (0.0%) |
| 1 or 2 Children | 42 (100.0%) | 0 (0.0%) |
| 3 or 4 Children | 6 (100.0%) | 0 (0.0%) |
| 5 or more Children | 0 (0.0%) | 0 (0.0%) |
| Total | 127 (100.0%) | 0 (0.0%) |
Income Below Poverty Among Single-Parent Households in Belmont
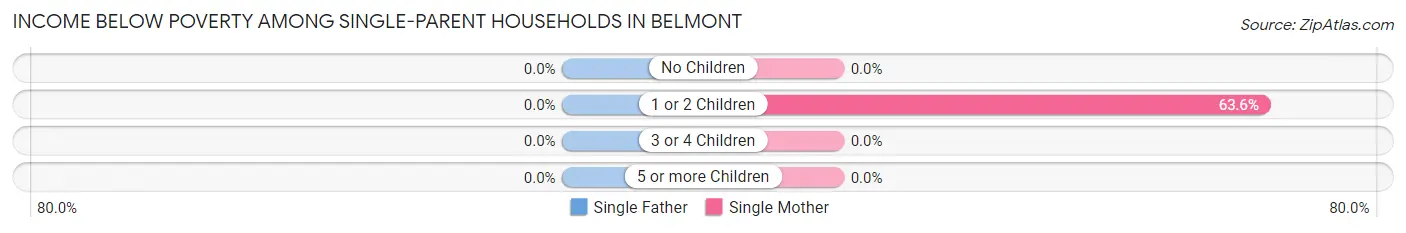
| Children | Single Father | Single Mother |
| No Children | 0 (0.0%) | 0 (0.0%) |
| 1 or 2 Children | 0 (0.0%) | 7 (63.6%) |
| 3 or 4 Children | 0 (0.0%) | 0 (0.0%) |
| 5 or more Children | 0 (0.0%) | 0 (0.0%) |
| Total | 0 (0.0%) | 7 (28.0%) |
Income Below Poverty Among Married-Couple vs Single-Parent Households in Belmont
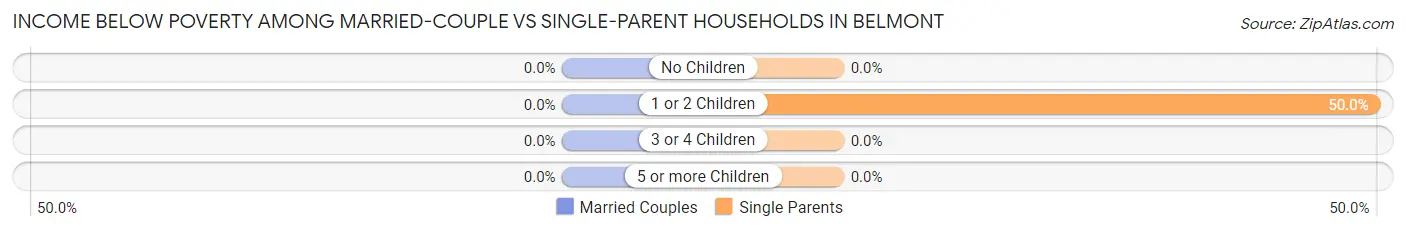
| Children | Married-Couple Families | Single-Parent Households |
| No Children | 0 (0.0%) | 0 (0.0%) |
| 1 or 2 Children | 0 (0.0%) | 7 (50.0%) |
| 3 or 4 Children | 0 (0.0%) | 0 (0.0%) |
| 5 or more Children | 0 (0.0%) | 0 (0.0%) |
| Total | 0 (0.0%) | 7 (16.7%) |
Race in Belmont
The most populous races in Belmont are White / Caucasian (813 | 98.7%), Two or more Races (11 | 1.3%), and Hispanic or Latino (2 | 0.2%).
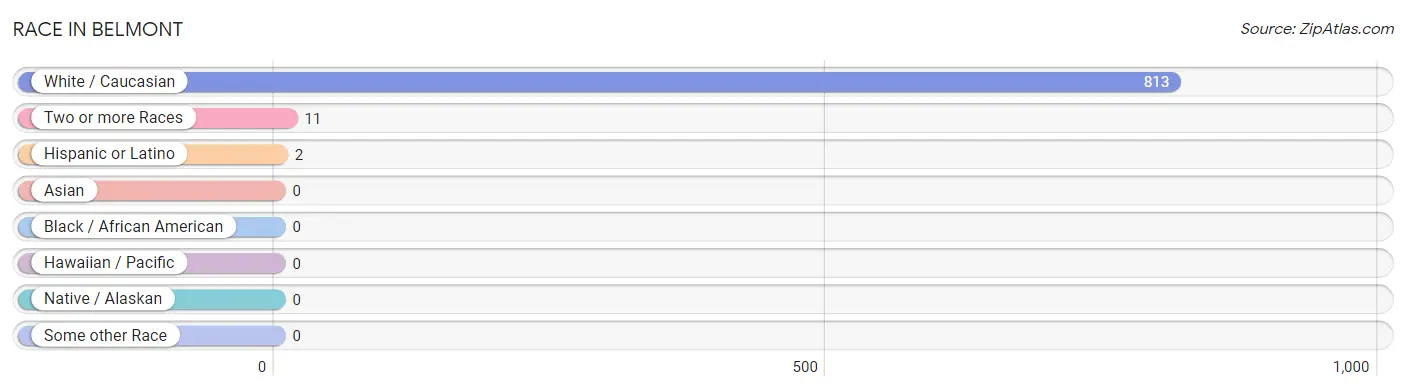
| Race | # Population | % Population |
| Asian | 0 | 0.0% |
| Black / African American | 0 | 0.0% |
| Hawaiian / Pacific | 0 | 0.0% |
| Hispanic or Latino | 2 | 0.2% |
| Native / Alaskan | 0 | 0.0% |
| White / Caucasian | 813 | 98.7% |
| Two or more Races | 11 | 1.3% |
| Some other Race | 0 | 0.0% |
| Total | 824 | 100.0% |
Ancestry in Belmont
The most populous ancestries reported in Belmont are American (159 | 19.3%), German (108 | 13.1%), Irish (87 | 10.6%), English (48 | 5.8%), and Greek (32 | 3.9%), together accounting for 52.7% of all Belmont residents.
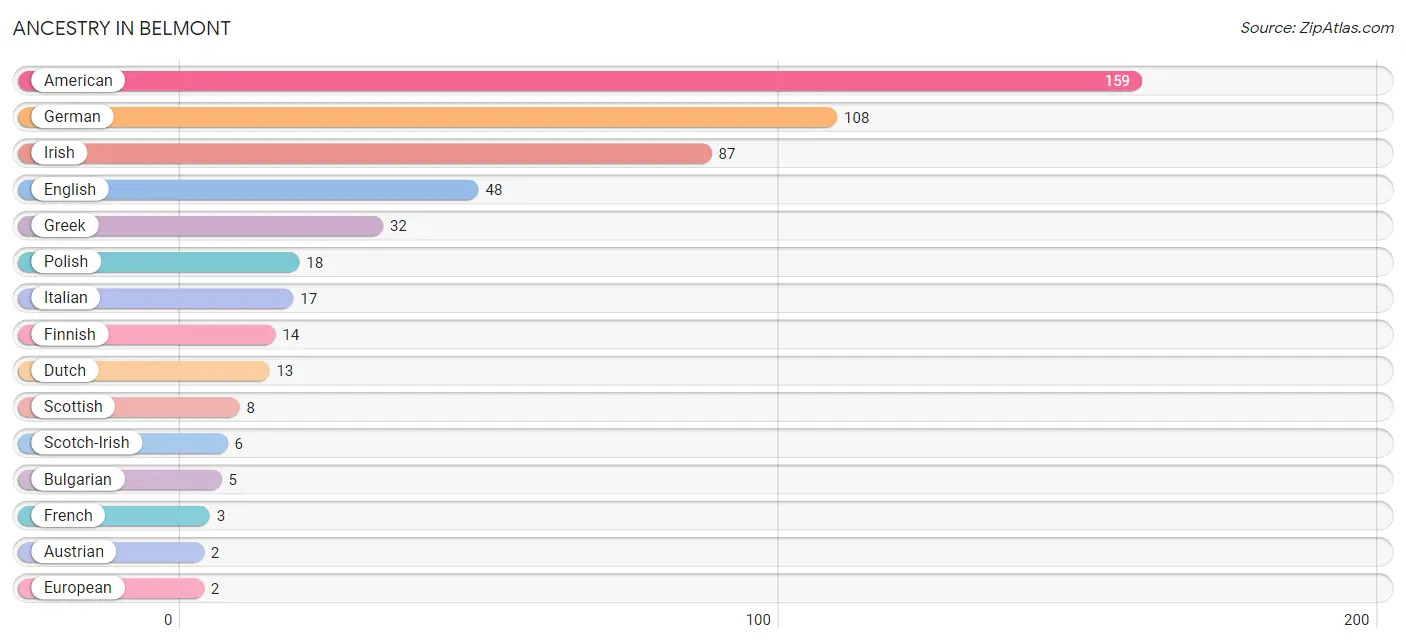
| Ancestry | # Population | % Population |
| American | 159 | 19.3% |
| Austrian | 2 | 0.2% |
| Bulgarian | 5 | 0.6% |
| Cherokee | 1 | 0.1% |
| Czech | 1 | 0.1% |
| Dutch | 13 | 1.6% |
| English | 48 | 5.8% |
| European | 2 | 0.2% |
| Finnish | 14 | 1.7% |
| French | 3 | 0.4% |
| German | 108 | 13.1% |
| Greek | 32 | 3.9% |
| Hungarian | 2 | 0.2% |
| Irish | 87 | 10.6% |
| Italian | 17 | 2.1% |
| Mexican | 2 | 0.2% |
| Norwegian | 2 | 0.2% |
| Polish | 18 | 2.2% |
| Russian | 2 | 0.2% |
| Scotch-Irish | 6 | 0.7% |
| Scottish | 8 | 1.0% |
| Slovak | 2 | 0.2% | View All 22 Rows |
Immigrants in Belmont

| Immigration Origin | # Population | % Population | View All 0 Rows |
Sex and Age in Belmont
Sex and Age in Belmont
The most populous age groups in Belmont are 25 to 29 Years (71 | 16.2%) for men and 70 to 74 Years (75 | 19.4%) for women.
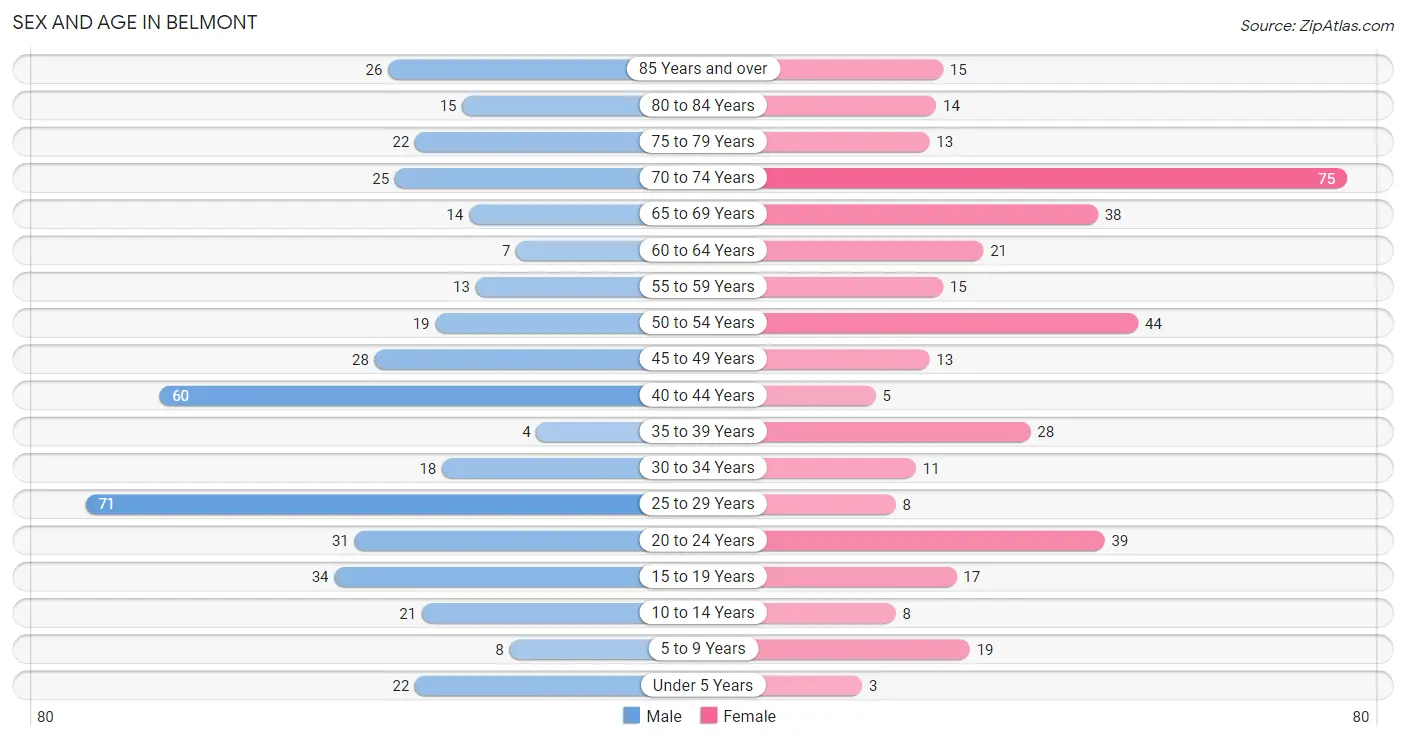
| Age Bracket | Male | Female |
| Under 5 Years | 22 (5.0%) | 3 (0.8%) |
| 5 to 9 Years | 8 (1.8%) | 19 (4.9%) |
| 10 to 14 Years | 21 (4.8%) | 8 (2.1%) |
| 15 to 19 Years | 34 (7.8%) | 17 (4.4%) |
| 20 to 24 Years | 31 (7.1%) | 39 (10.1%) |
| 25 to 29 Years | 71 (16.2%) | 8 (2.1%) |
| 30 to 34 Years | 18 (4.1%) | 11 (2.9%) |
| 35 to 39 Years | 4 (0.9%) | 28 (7.2%) |
| 40 to 44 Years | 60 (13.7%) | 5 (1.3%) |
| 45 to 49 Years | 28 (6.4%) | 13 (3.4%) |
| 50 to 54 Years | 19 (4.3%) | 44 (11.4%) |
| 55 to 59 Years | 13 (3.0%) | 15 (3.9%) |
| 60 to 64 Years | 7 (1.6%) | 21 (5.4%) |
| 65 to 69 Years | 14 (3.2%) | 38 (9.8%) |
| 70 to 74 Years | 25 (5.7%) | 75 (19.4%) |
| 75 to 79 Years | 22 (5.0%) | 13 (3.4%) |
| 80 to 84 Years | 15 (3.4%) | 14 (3.6%) |
| 85 Years and over | 26 (5.9%) | 15 (3.9%) |
| Total | 438 (100.0%) | 386 (100.0%) |
Families and Households in Belmont
Median Family Size in Belmont
The median family size in Belmont is 2.94 persons per family, with single female/mother families (25 | 14.8%) accounting for the largest median family size of 4.6 persons per family. On the other hand, married-couple families (127 | 75.1%) represent the smallest median family size with 2.54 persons per family.
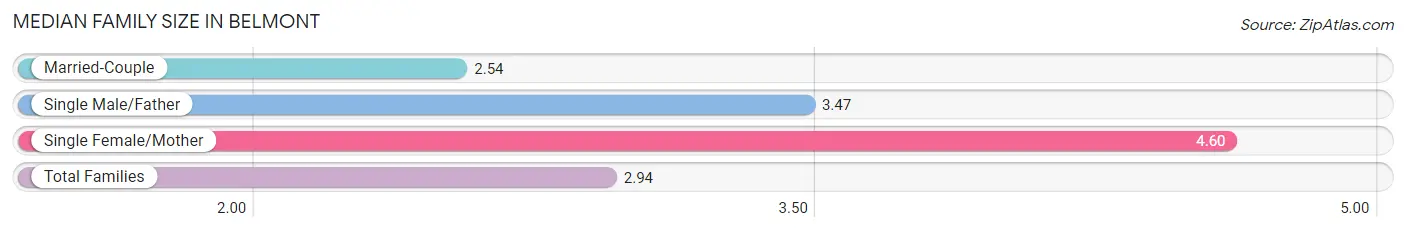
| Family Type | # Families | Family Size |
| Married-Couple | 127 (75.1%) | 2.54 |
| Single Male/Father | 17 (10.1%) | 3.47 |
| Single Female/Mother | 25 (14.8%) | 4.60 |
| Total Families | 169 (100.0%) | 2.94 |
Median Household Size in Belmont
The median household size in Belmont is 2.20 persons per household, with single female/mother households (25 | 7.2%) accounting for the largest median household size of 4.76 persons per household. non-family households (176 | 51.0%) represent the smallest median household size with 1.47 persons per household.
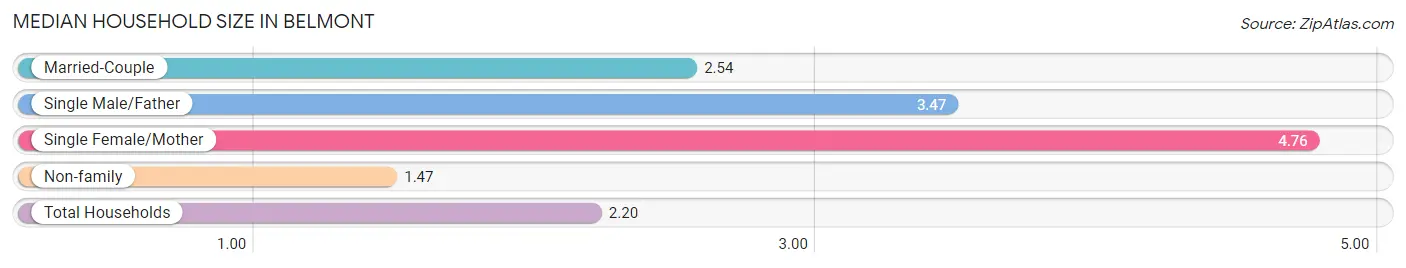
| Household Type | # Households | Household Size |
| Married-Couple | 127 (36.8%) | 2.54 |
| Single Male/Father | 17 (4.9%) | 3.47 |
| Single Female/Mother | 25 (7.2%) | 4.76 |
| Non-family | 176 (51.0%) | 1.47 |
| Total Households | 345 (100.0%) | 2.20 |
Household Size by Marriage Status in Belmont
Out of a total of 345 households in Belmont, 169 (49.0%) are family households, while 176 (51.0%) are nonfamily households. The most numerous type of family households are 2-person households, comprising 82, and the most common type of nonfamily households are 1-person households, comprising 128.
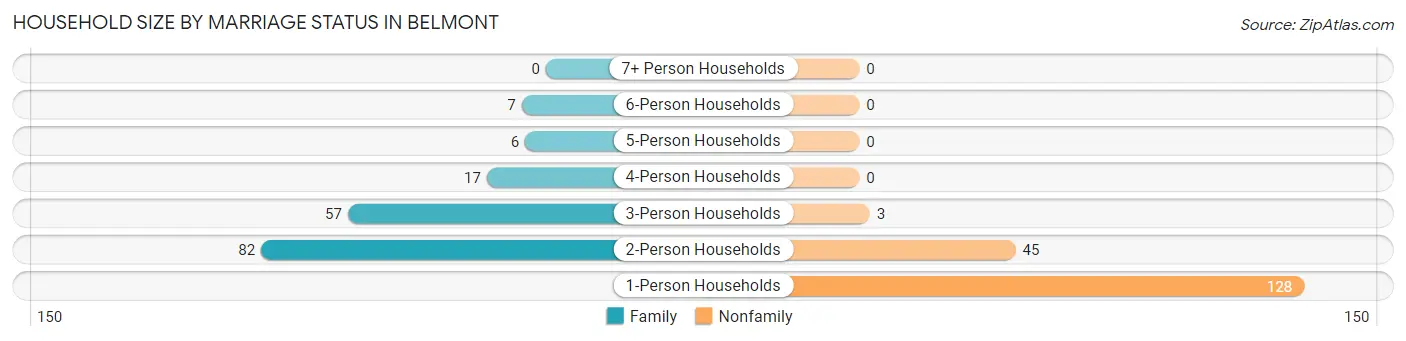
| Household Size | Family Households | Nonfamily Households |
| 1-Person Households | - | 128 (37.1%) |
| 2-Person Households | 82 (23.8%) | 45 (13.0%) |
| 3-Person Households | 57 (16.5%) | 3 (0.9%) |
| 4-Person Households | 17 (4.9%) | 0 (0.0%) |
| 5-Person Households | 6 (1.7%) | 0 (0.0%) |
| 6-Person Households | 7 (2.0%) | 0 (0.0%) |
| 7+ Person Households | 0 (0.0%) | 0 (0.0%) |
| Total | 169 (49.0%) | 176 (51.0%) |
Female Fertility in Belmont
Fertility by Age in Belmont
| Age Bracket | Women with Births | Births / 1,000 Women |
| 15 to 19 years | 0 (0.0%) | 0.0 |
| 20 to 34 years | 0 (0.0%) | 0.0 |
| 35 to 50 years | 0 (0.0%) | 0.0 |
| Total | 0 (0.0%) | 0.0 |
Fertility by Age by Marriage Status in Belmont
| Age Bracket | Married | Unmarried |
| 15 to 19 years | 0 (0.0%) | 0 (0.0%) |
| 20 to 34 years | 0 (0.0%) | 0 (0.0%) |
| 35 to 50 years | 0 (0.0%) | 0 (0.0%) |
| Total | 0 (0.0%) | 0 (0.0%) |
Fertility by Education in Belmont
| Educational Attainment | Women with Births | Births / 1,000 Women |
| Less than High School | 0 (0.0%) | 0.0 |
| High School Diploma | 0 (0.0%) | 0.0 |
| College or Associate's Degree | 0 (0.0%) | 0.0 |
| Bachelor's Degree | 0 (0.0%) | 0.0 |
| Graduate Degree | 0 (0.0%) | 0.0 |
| Total | 0 (0.0%) | 0.0 |
Fertility by Education by Marriage Status in Belmont
| Educational Attainment | Married | Unmarried |
| Less than High School | 0 (0.0%) | 0 (0.0%) |
| High School Diploma | 0 (0.0%) | 0 (0.0%) |
| College or Associate's Degree | 0 (0.0%) | 0 (0.0%) |
| Bachelor's Degree | 0 (0.0%) | 0 (0.0%) |
| Graduate Degree | 0 (0.0%) | 0 (0.0%) |
| Total | 0 (0.0%) | 0 (0.0%) |
Employment Characteristics in Belmont
Employment by Class of Employer in Belmont
Among the 325 employed individuals in Belmont, private company employees (205 | 63.1%), local government employees (53 | 16.3%), and state government employees (30 | 9.2%) make up the most common classes of employment.
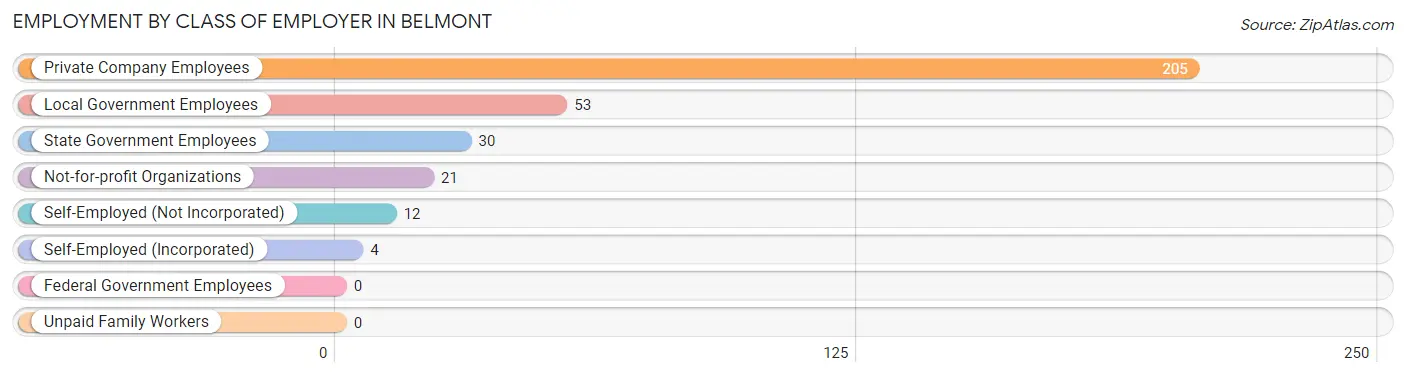
| Employer Class | # Employees | % Employees |
| Private Company Employees | 205 | 63.1% |
| Self-Employed (Incorporated) | 4 | 1.2% |
| Self-Employed (Not Incorporated) | 12 | 3.7% |
| Not-for-profit Organizations | 21 | 6.5% |
| Local Government Employees | 53 | 16.3% |
| State Government Employees | 30 | 9.2% |
| Federal Government Employees | 0 | 0.0% |
| Unpaid Family Workers | 0 | 0.0% |
| Total | 325 | 100.0% |
Employment Status by Age in Belmont
According to the labor force statistics for Belmont, out of the total population over 16 years of age (728), 52.2% or 380 individuals are in the labor force, with 6.6% or 25 of them unemployed. The age group with the highest labor force participation rate is 25 to 29 years, with 100.0% or 79 individuals in the labor force. Within the labor force, the 20 to 24 years age range has the highest percentage of unemployed individuals, with 15.6% or 10 of them being unemployed.
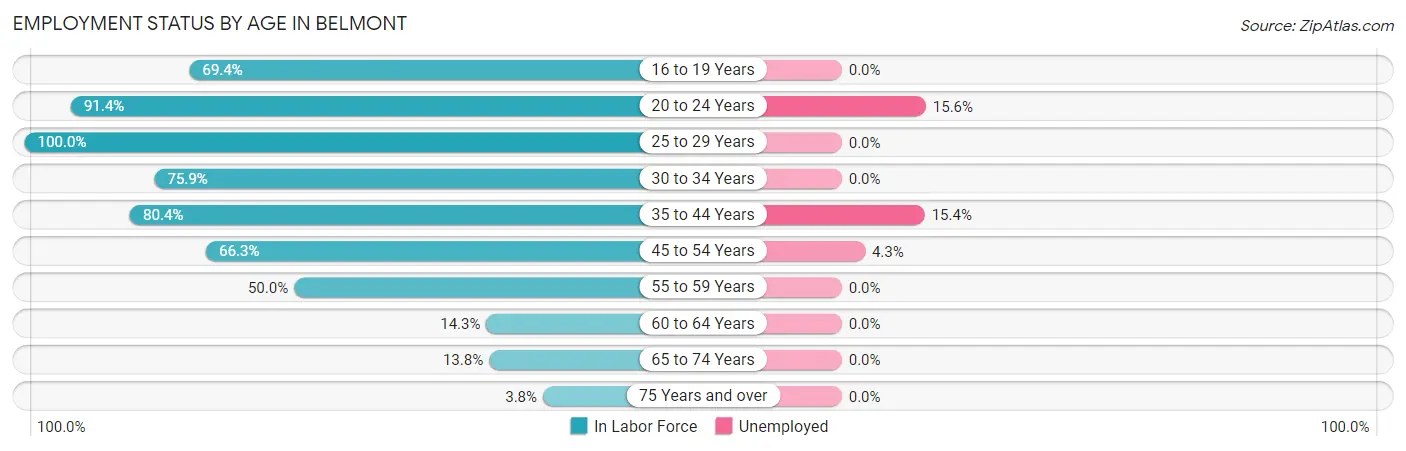
| Age Bracket | In Labor Force | Unemployed |
| 16 to 19 Years | 25 (69.4%) | 0 (0.0%) |
| 20 to 24 Years | 64 (91.4%) | 10 (15.6%) |
| 25 to 29 Years | 79 (100.0%) | 0 (0.0%) |
| 30 to 34 Years | 22 (75.9%) | 0 (0.0%) |
| 35 to 44 Years | 78 (80.4%) | 12 (15.4%) |
| 45 to 54 Years | 69 (66.3%) | 3 (4.3%) |
| 55 to 59 Years | 14 (50.0%) | 0 (0.0%) |
| 60 to 64 Years | 4 (14.3%) | 0 (0.0%) |
| 65 to 74 Years | 21 (13.8%) | 0 (0.0%) |
| 75 Years and over | 4 (3.8%) | 0 (0.0%) |
| Total | 380 (52.2%) | 25 (6.6%) |
Employment Status by Educational Attainment in Belmont
According to labor force statistics for Belmont, 72.9% of individuals (266) out of the total population between 25 and 64 years of age (365) are in the labor force, with 5.6% or 15 of them being unemployed. The group with the highest labor force participation rate are those with the educational attainment of college / associate degree, with 90.2% or 120 individuals in the labor force. Within the labor force, individuals with college / associate degree education have the highest percentage of unemployment, with 12.5% or 15 of them being unemployed.
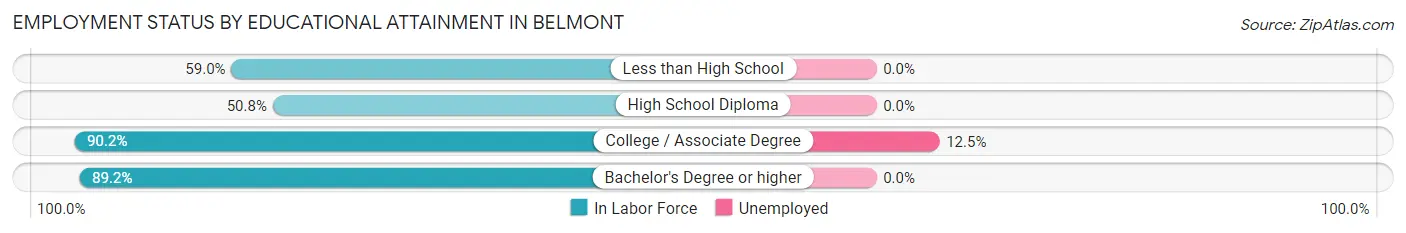
| Educational Attainment | In Labor Force | Unemployed |
| Less than High School | 23 (59.0%) | 0 (0.0%) |
| High School Diploma | 65 (50.8%) | 0 (0.0%) |
| College / Associate Degree | 120 (90.2%) | 17 (12.5%) |
| Bachelor's Degree or higher | 58 (89.2%) | 0 (0.0%) |
| Total | 266 (72.9%) | 20 (5.6%) |
Employment Occupations by Sex in Belmont
Management, Business, Science and Arts Occupations
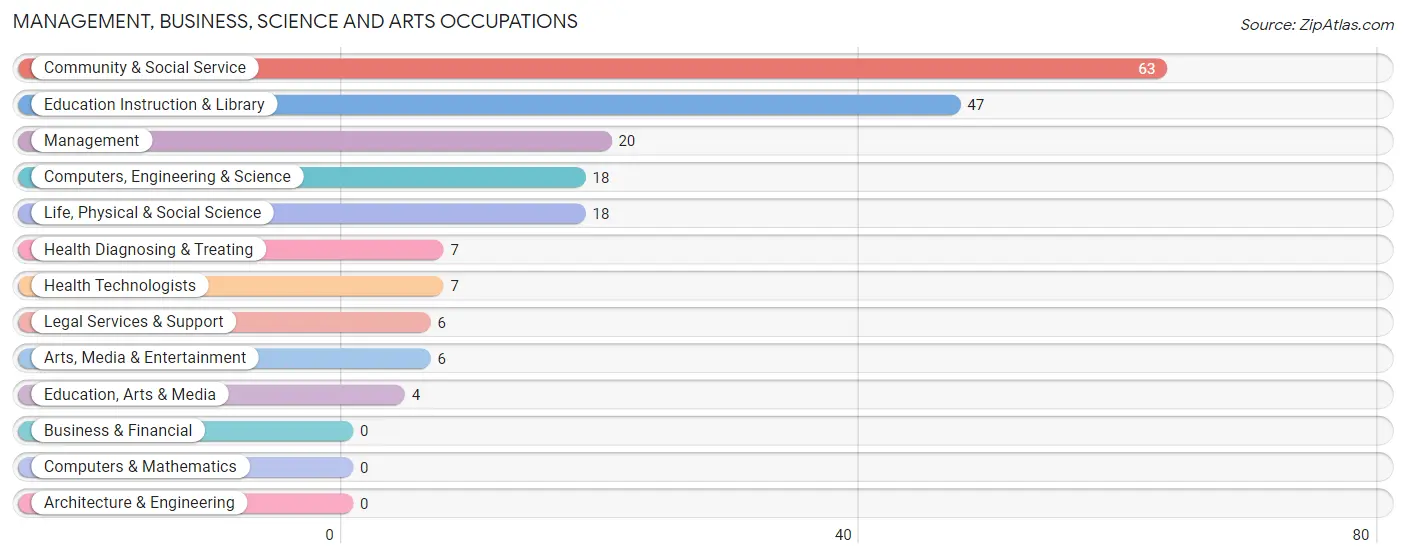
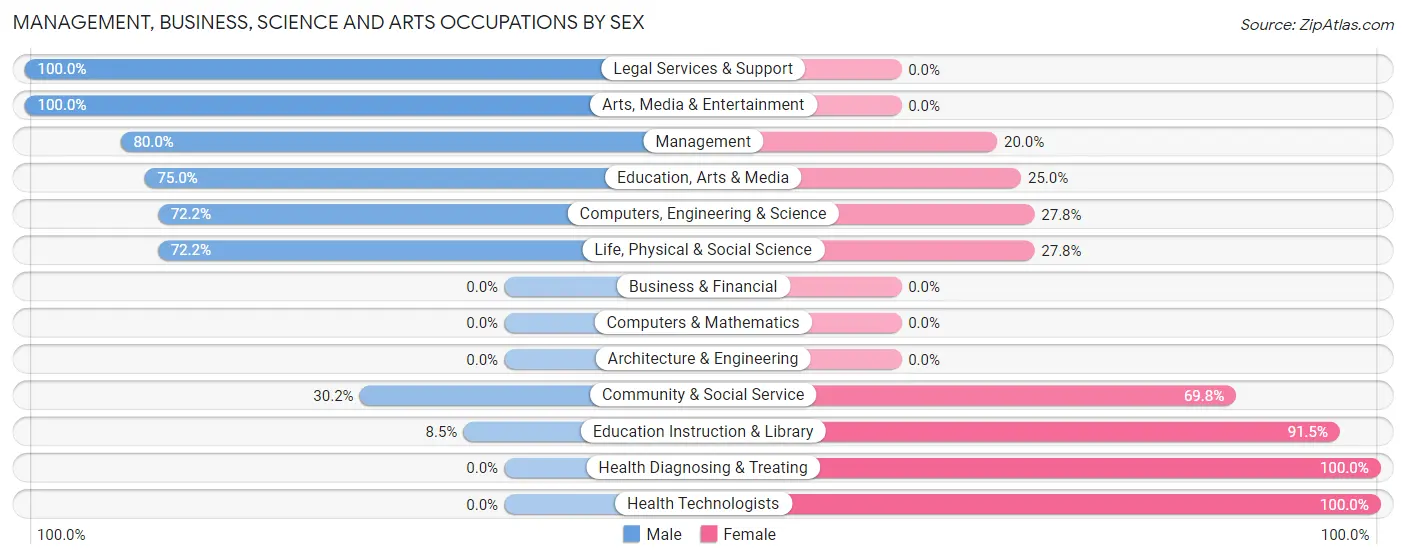
The most common Management, Business, Science and Arts occupations in Belmont are Community & Social Service (63 | 17.7%), Education Instruction & Library (47 | 13.2%), Management (20 | 5.6%), Computers, Engineering & Science (18 | 5.1%), and Life, Physical & Social Science (18 | 5.1%).
Management, Business, Science and Arts Occupations by Sex
Within the Management, Business, Science and Arts occupations in Belmont, the most male-oriented occupations are Legal Services & Support (100.0%), Arts, Media & Entertainment (100.0%), and Management (80.0%), while the most female-oriented occupations are Health Diagnosing & Treating (100.0%), Health Technologists (100.0%), and Education Instruction & Library (91.5%).
| Occupation | Male | Female |
| Management | 16 (80.0%) | 4 (20.0%) |
| Business & Financial | 0 (0.0%) | 0 (0.0%) |
| Computers, Engineering & Science | 13 (72.2%) | 5 (27.8%) |
| Computers & Mathematics | 0 (0.0%) | 0 (0.0%) |
| Architecture & Engineering | 0 (0.0%) | 0 (0.0%) |
| Life, Physical & Social Science | 13 (72.2%) | 5 (27.8%) |
| Community & Social Service | 19 (30.2%) | 44 (69.8%) |
| Education, Arts & Media | 3 (75.0%) | 1 (25.0%) |
| Legal Services & Support | 6 (100.0%) | 0 (0.0%) |
| Education Instruction & Library | 4 (8.5%) | 43 (91.5%) |
| Arts, Media & Entertainment | 6 (100.0%) | 0 (0.0%) |
| Health Diagnosing & Treating | 0 (0.0%) | 7 (100.0%) |
| Health Technologists | 0 (0.0%) | 7 (100.0%) |
| Total (Category) | 48 (44.4%) | 60 (55.6%) |
| Total (Overall) | 231 (65.1%) | 124 (34.9%) |
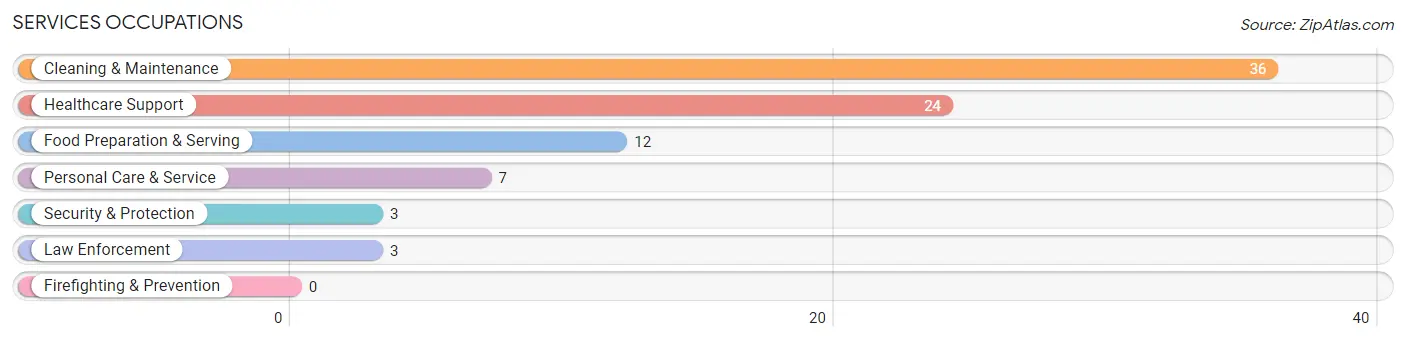
Services Occupations
The most common Services occupations in Belmont are Cleaning & Maintenance (36 | 10.1%), Healthcare Support (24 | 6.8%), Food Preparation & Serving (12 | 3.4%), Personal Care & Service (7 | 2.0%), and Security & Protection (3 | 0.9%).
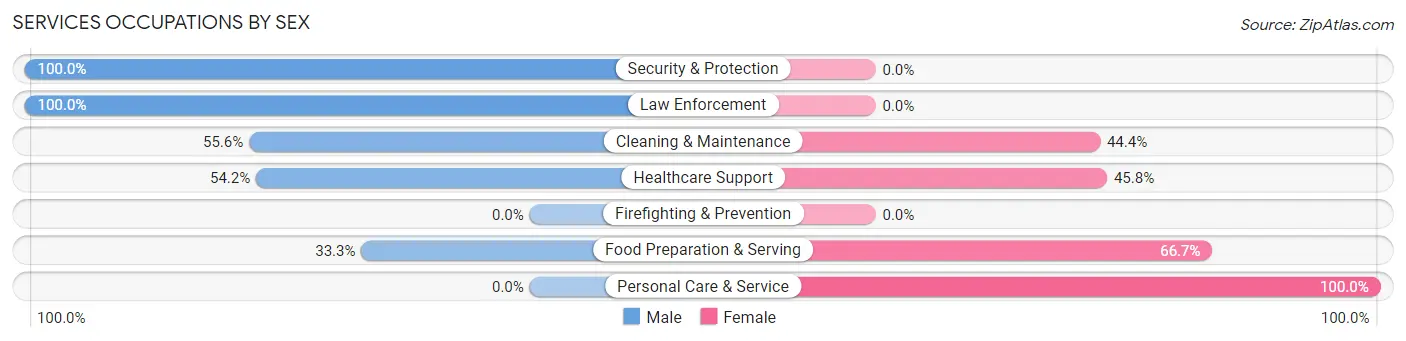
Services Occupations by Sex
Within the Services occupations in Belmont, the most male-oriented occupations are Security & Protection (100.0%), Law Enforcement (100.0%), and Cleaning & Maintenance (55.6%), while the most female-oriented occupations are Personal Care & Service (100.0%), Food Preparation & Serving (66.7%), and Healthcare Support (45.8%).
| Occupation | Male | Female |
| Healthcare Support | 13 (54.2%) | 11 (45.8%) |
| Security & Protection | 3 (100.0%) | 0 (0.0%) |
| Firefighting & Prevention | 0 (0.0%) | 0 (0.0%) |
| Law Enforcement | 3 (100.0%) | 0 (0.0%) |
| Food Preparation & Serving | 4 (33.3%) | 8 (66.7%) |
| Cleaning & Maintenance | 20 (55.6%) | 16 (44.4%) |
| Personal Care & Service | 0 (0.0%) | 7 (100.0%) |
| Total (Category) | 40 (48.8%) | 42 (51.2%) |
| Total (Overall) | 231 (65.1%) | 124 (34.9%) |
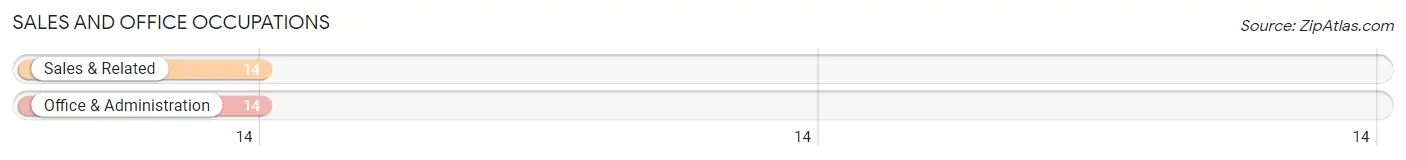
Sales and Office Occupations
The most common Sales and Office occupations in Belmont are Sales & Related (14 | 3.9%), and Office & Administration (14 | 3.9%).
Sales and Office Occupations by Sex

| Occupation | Male | Female |
| Sales & Related | 6 (42.9%) | 8 (57.1%) |
| Office & Administration | 0 (0.0%) | 14 (100.0%) |
| Total (Category) | 6 (21.4%) | 22 (78.6%) |
| Total (Overall) | 231 (65.1%) | 124 (34.9%) |
Natural Resources, Construction and Maintenance Occupations
The most common Natural Resources, Construction and Maintenance occupations in Belmont are , and Construction & Extraction (5 | 1.4%).
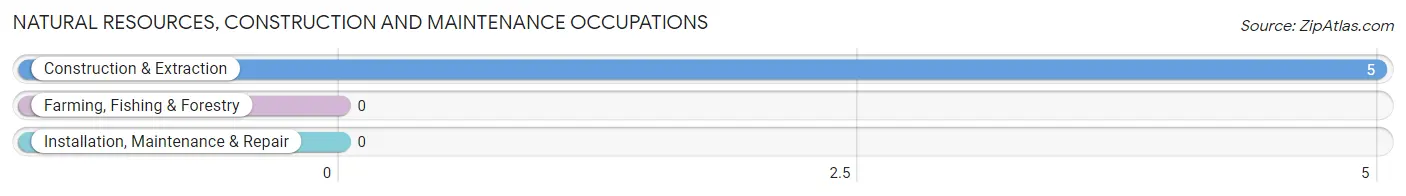
Natural Resources, Construction and Maintenance Occupations by Sex
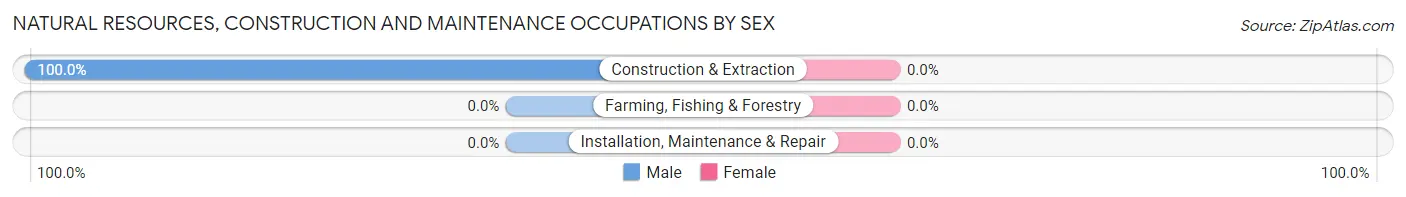
| Occupation | Male | Female |
| Farming, Fishing & Forestry | 0 (0.0%) | 0 (0.0%) |
| Construction & Extraction | 5 (100.0%) | 0 (0.0%) |
| Installation, Maintenance & Repair | 0 (0.0%) | 0 (0.0%) |
| Total (Category) | 5 (100.0%) | 0 (0.0%) |
| Total (Overall) | 231 (65.1%) | 124 (34.9%) |
Production, Transportation and Moving Occupations
The most common Production, Transportation and Moving occupations in Belmont are Production (80 | 22.5%), Material Moving (50 | 14.1%), and Transportation (2 | 0.6%).
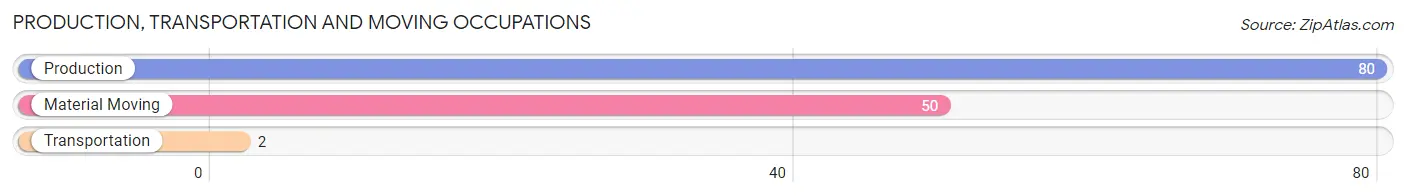
Production, Transportation and Moving Occupations by Sex
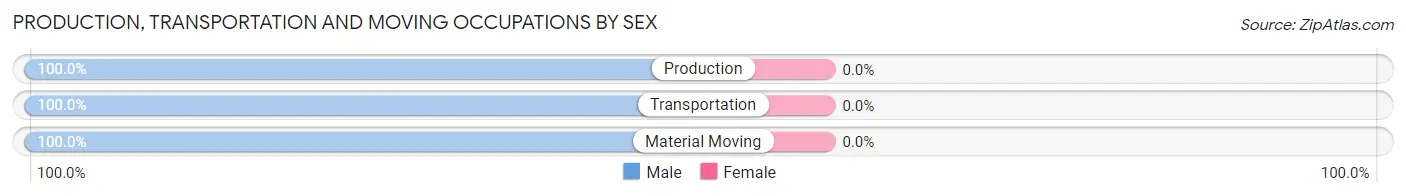
| Occupation | Male | Female |
| Production | 80 (100.0%) | 0 (0.0%) |
| Transportation | 2 (100.0%) | 0 (0.0%) |
| Material Moving | 50 (100.0%) | 0 (0.0%) |
| Total (Category) | 132 (100.0%) | 0 (0.0%) |
| Total (Overall) | 231 (65.1%) | 124 (34.9%) |
Employment Industries by Sex in Belmont
Employment Industries in Belmont
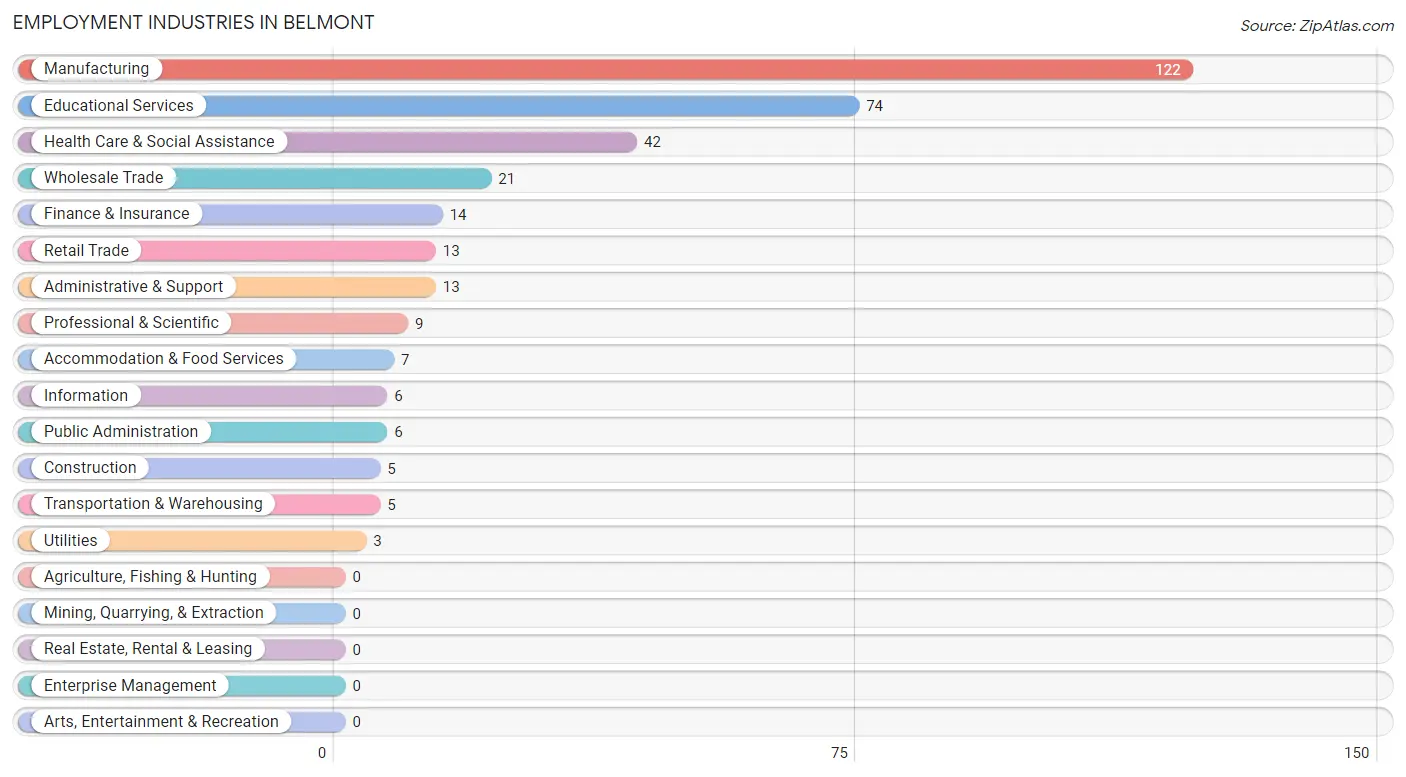
The major employment industries in Belmont include Manufacturing (122 | 34.4%), Educational Services (74 | 20.8%), Health Care & Social Assistance (42 | 11.8%), Wholesale Trade (21 | 5.9%), and Finance & Insurance (14 | 3.9%).
Employment Industries by Sex in Belmont
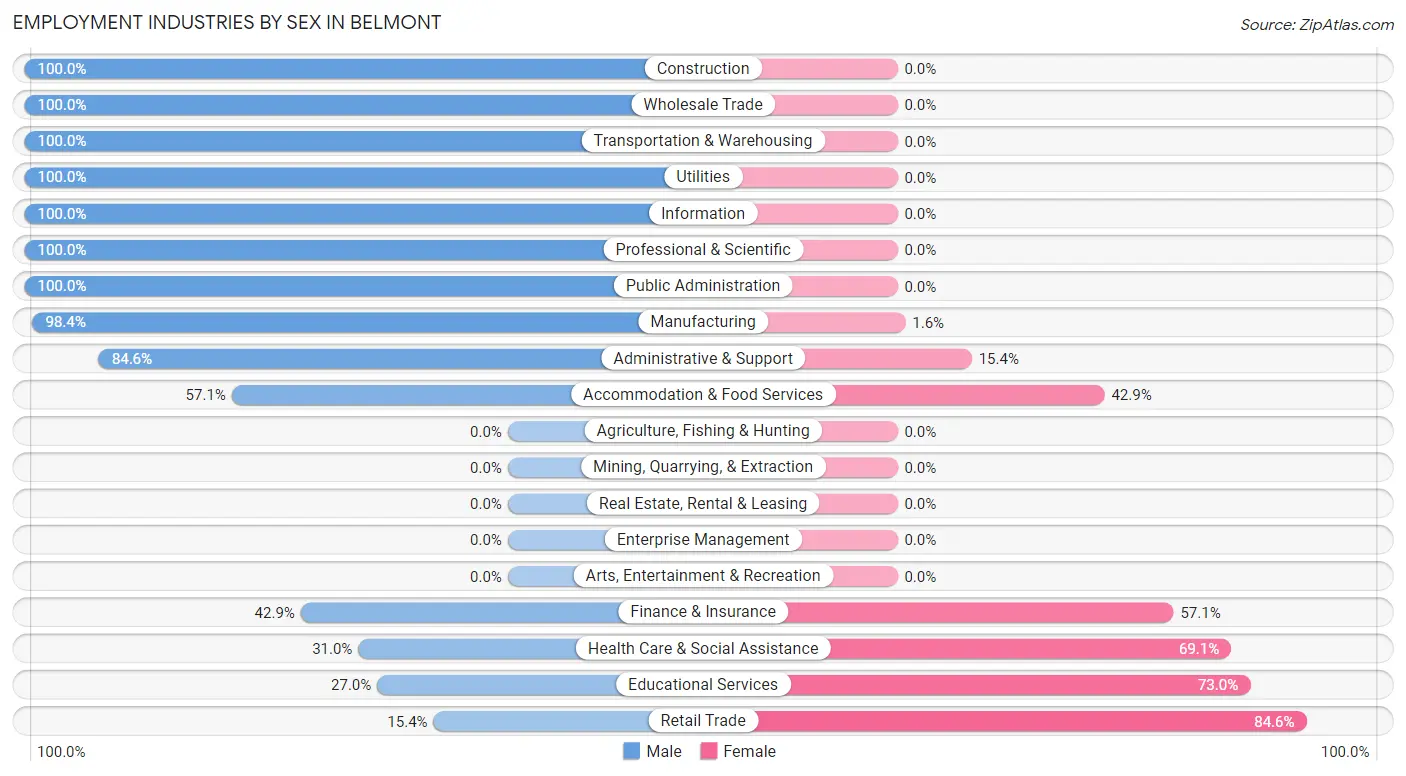
The Belmont industries that see more men than women are Construction (100.0%), Wholesale Trade (100.0%), and Transportation & Warehousing (100.0%), whereas the industries that tend to have a higher number of women are Retail Trade (84.6%), Educational Services (73.0%), and Health Care & Social Assistance (69.1%).
| Industry | Male | Female |
| Agriculture, Fishing & Hunting | 0 (0.0%) | 0 (0.0%) |
| Mining, Quarrying, & Extraction | 0 (0.0%) | 0 (0.0%) |
| Construction | 5 (100.0%) | 0 (0.0%) |
| Manufacturing | 120 (98.4%) | 2 (1.6%) |
| Wholesale Trade | 21 (100.0%) | 0 (0.0%) |
| Retail Trade | 2 (15.4%) | 11 (84.6%) |
| Transportation & Warehousing | 5 (100.0%) | 0 (0.0%) |
| Utilities | 3 (100.0%) | 0 (0.0%) |
| Information | 6 (100.0%) | 0 (0.0%) |
| Finance & Insurance | 6 (42.9%) | 8 (57.1%) |
| Real Estate, Rental & Leasing | 0 (0.0%) | 0 (0.0%) |
| Professional & Scientific | 9 (100.0%) | 0 (0.0%) |
| Enterprise Management | 0 (0.0%) | 0 (0.0%) |
| Administrative & Support | 11 (84.6%) | 2 (15.4%) |
| Educational Services | 20 (27.0%) | 54 (73.0%) |
| Health Care & Social Assistance | 13 (30.9%) | 29 (69.1%) |
| Arts, Entertainment & Recreation | 0 (0.0%) | 0 (0.0%) |
| Accommodation & Food Services | 4 (57.1%) | 3 (42.9%) |
| Public Administration | 6 (100.0%) | 0 (0.0%) |
| Total | 231 (65.1%) | 124 (34.9%) |
Education in Belmont
School Enrollment in Belmont
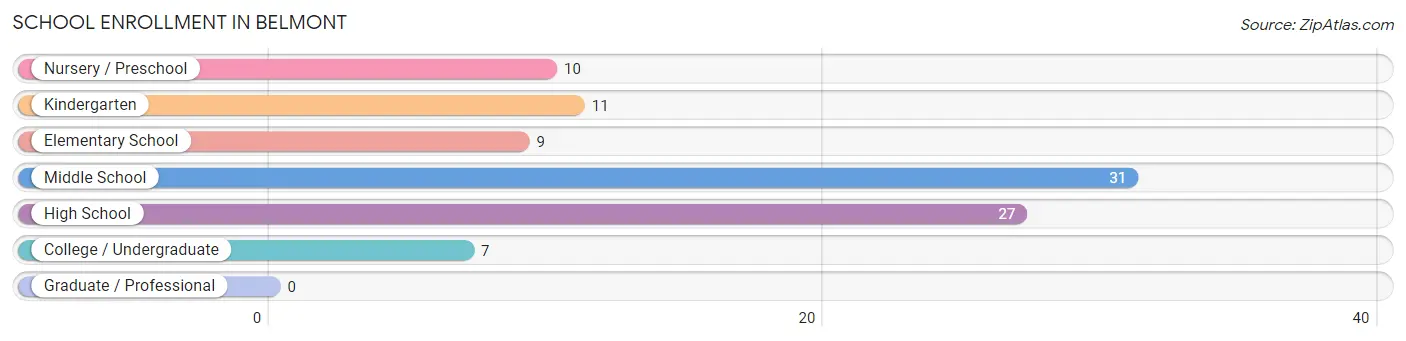
The most common levels of schooling among the 95 students in Belmont are middle school (31 | 32.6%), high school (27 | 28.4%), and kindergarten (11 | 11.6%).
| School Level | # Students | % Students |
| Nursery / Preschool | 10 | 10.5% |
| Kindergarten | 11 | 11.6% |
| Elementary School | 9 | 9.5% |
| Middle School | 31 | 32.6% |
| High School | 27 | 28.4% |
| College / Undergraduate | 7 | 7.4% |
| Graduate / Professional | 0 | 0.0% |
| Total | 95 | 100.0% |
School Enrollment by Age by Funding Source in Belmont
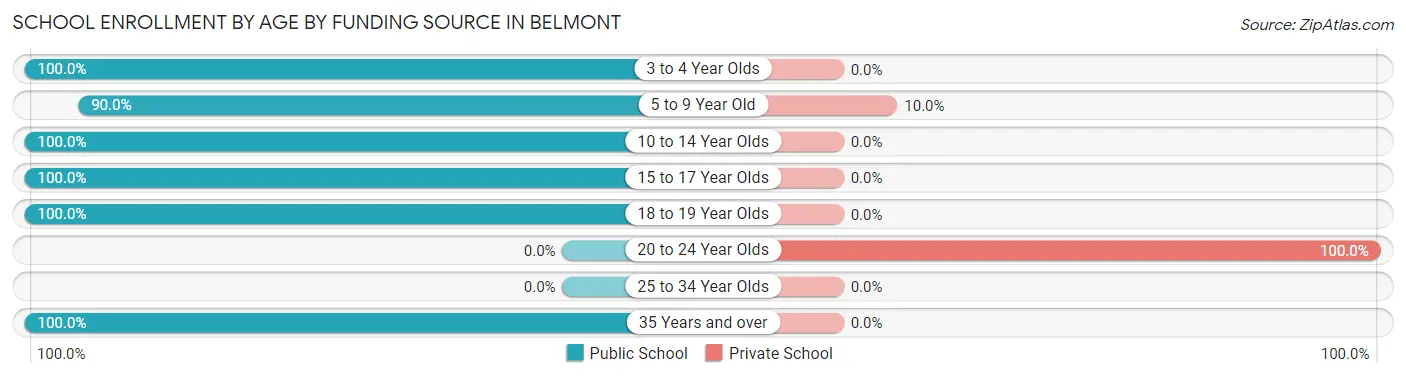
Out of a total of 95 students who are enrolled in schools in Belmont, 7 (7.4%) attend a private institution, while the remaining 88 (92.6%) are enrolled in public schools. The age group of 20 to 24 year olds has the highest likelihood of being enrolled in private schools, with 5 (100.0% in the age bracket) enrolled. Conversely, the age group of 3 to 4 year olds has the lowest likelihood of being enrolled in a private school, with 10 (100.0% in the age bracket) attending a public institution.
| Age Bracket | Public School | Private School |
| 3 to 4 Year Olds | 10 (100.0%) | 0 (0.0%) |
| 5 to 9 Year Old | 18 (90.0%) | 2 (10.0%) |
| 10 to 14 Year Olds | 29 (100.0%) | 0 (0.0%) |
| 15 to 17 Year Olds | 26 (100.0%) | 0 (0.0%) |
| 18 to 19 Year Olds | 2 (100.0%) | 0 (0.0%) |
| 20 to 24 Year Olds | 0 (0.0%) | 5 (100.0%) |
| 25 to 34 Year Olds | 0 (0.0%) | 0 (0.0%) |
| 35 Years and over | 3 (100.0%) | 0 (0.0%) |
| Total | 88 (92.6%) | 7 (7.4%) |
Educational Attainment by Field of Study in Belmont
Education (67 | 61.5%), business (13 | 11.9%), science & technology (12 | 11.0%), communications (6 | 5.5%), and liberal arts & history (4 | 3.7%) are the most common fields of study among 109 individuals in Belmont who have obtained a bachelor's degree or higher.
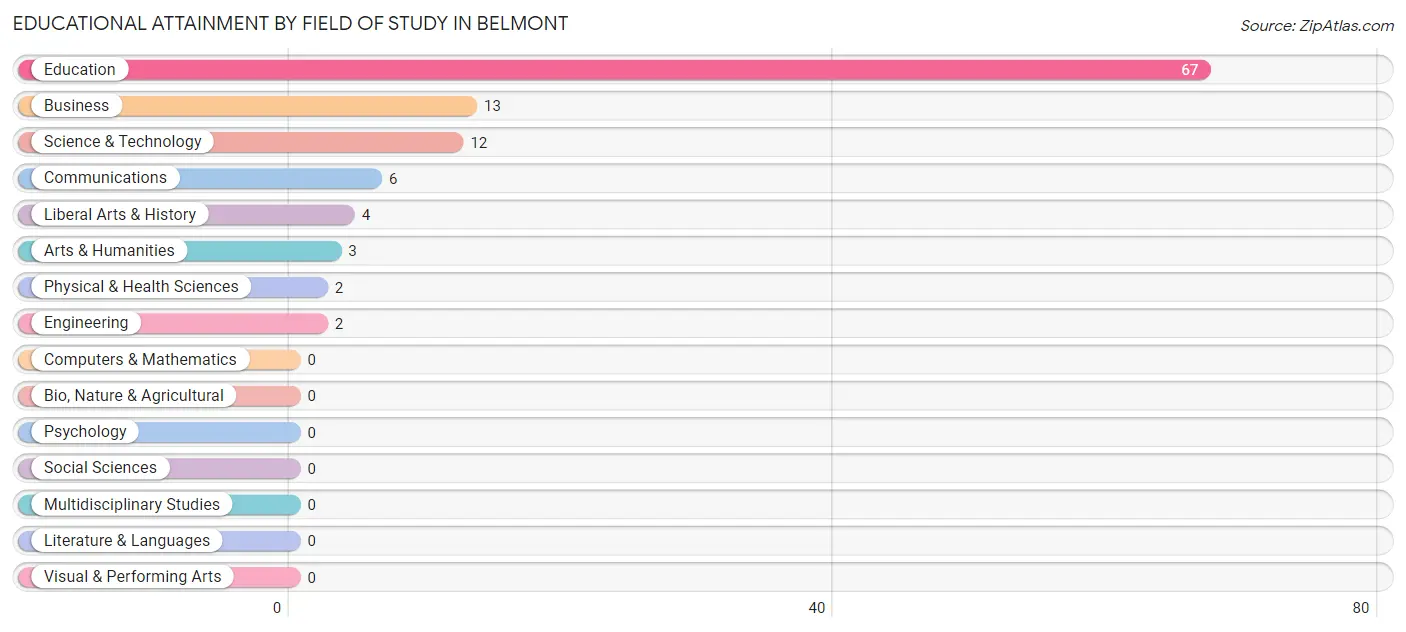
| Field of Study | # Graduates | % Graduates |
| Computers & Mathematics | 0 | 0.0% |
| Bio, Nature & Agricultural | 0 | 0.0% |
| Physical & Health Sciences | 2 | 1.8% |
| Psychology | 0 | 0.0% |
| Social Sciences | 0 | 0.0% |
| Engineering | 2 | 1.8% |
| Multidisciplinary Studies | 0 | 0.0% |
| Science & Technology | 12 | 11.0% |
| Business | 13 | 11.9% |
| Education | 67 | 61.5% |
| Literature & Languages | 0 | 0.0% |
| Liberal Arts & History | 4 | 3.7% |
| Visual & Performing Arts | 0 | 0.0% |
| Communications | 6 | 5.5% |
| Arts & Humanities | 3 | 2.8% |
| Total | 109 | 100.0% |
Transportation & Commute in Belmont
Vehicle Availability by Sex in Belmont
The most prevalent vehicle ownership categories in Belmont are males with 1 vehicle (83, accounting for 41.3%) and females with 1 vehicle (61, making up 66.9%).
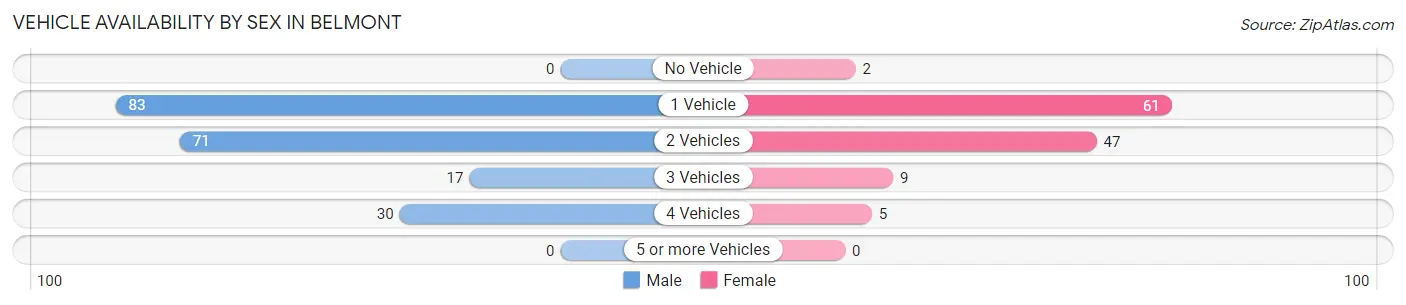
| Vehicles Available | Male | Female |
| No Vehicle | 0 (0.0%) | 2 (1.6%) |
| 1 Vehicle | 83 (41.3%) | 61 (49.2%) |
| 2 Vehicles | 71 (35.3%) | 47 (37.9%) |
| 3 Vehicles | 17 (8.5%) | 9 (7.3%) |
| 4 Vehicles | 30 (14.9%) | 5 (4.0%) |
| 5 or more Vehicles | 0 (0.0%) | 0 (0.0%) |
| Total | 201 (100.0%) | 124 (100.0%) |
Commute Time in Belmont
The most frequently occuring commute durations in Belmont are 45 to 59 minutes (69 commuters, 21.8%), 10 to 14 minutes (50 commuters, 15.8%), and 20 to 24 minutes (46 commuters, 14.6%).
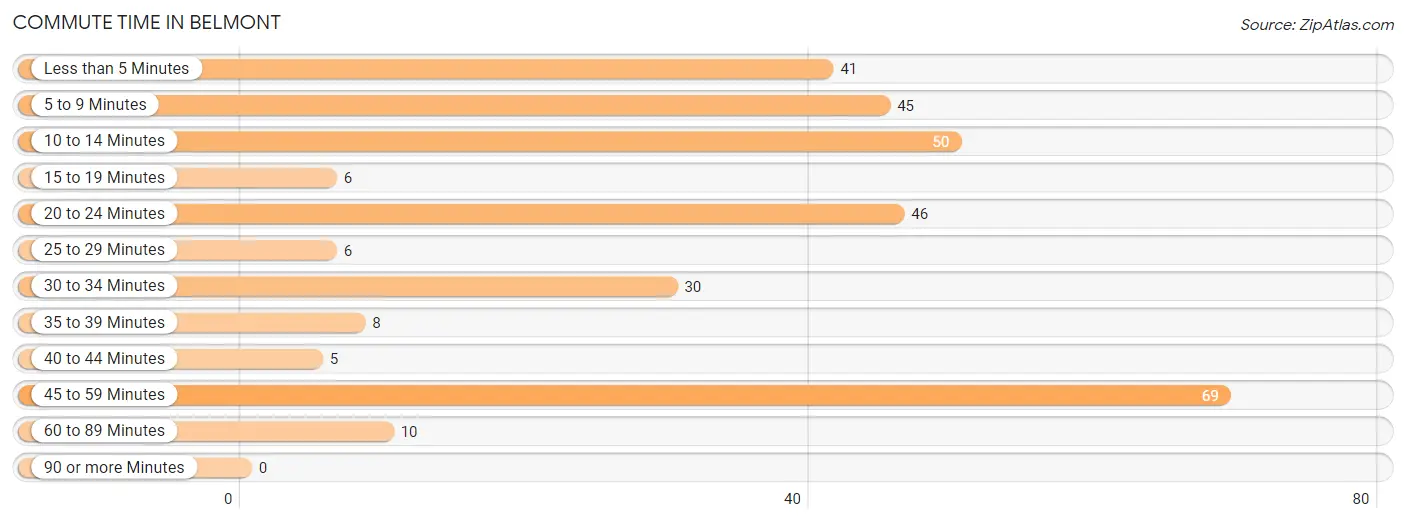
| Commute Time | # Commuters | % Commuters |
| Less than 5 Minutes | 41 | 13.0% |
| 5 to 9 Minutes | 45 | 14.2% |
| 10 to 14 Minutes | 50 | 15.8% |
| 15 to 19 Minutes | 6 | 1.9% |
| 20 to 24 Minutes | 46 | 14.6% |
| 25 to 29 Minutes | 6 | 1.9% |
| 30 to 34 Minutes | 30 | 9.5% |
| 35 to 39 Minutes | 8 | 2.5% |
| 40 to 44 Minutes | 5 | 1.6% |
| 45 to 59 Minutes | 69 | 21.8% |
| 60 to 89 Minutes | 10 | 3.2% |
| 90 or more Minutes | 0 | 0.0% |
Commute Time by Sex in Belmont
The most common commute times in Belmont are 45 to 59 minutes (69 commuters, 35.4%) for males and 20 to 24 minutes (32 commuters, 26.5%) for females.
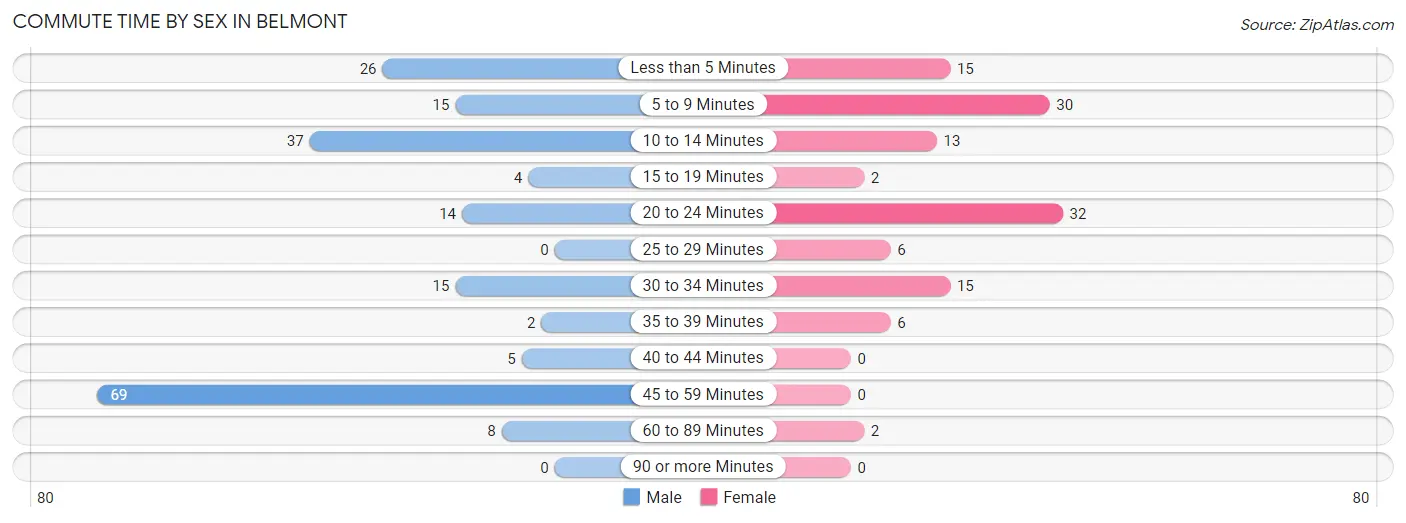
| Commute Time | Male | Female |
| Less than 5 Minutes | 26 (13.3%) | 15 (12.4%) |
| 5 to 9 Minutes | 15 (7.7%) | 30 (24.8%) |
| 10 to 14 Minutes | 37 (19.0%) | 13 (10.7%) |
| 15 to 19 Minutes | 4 (2.1%) | 2 (1.7%) |
| 20 to 24 Minutes | 14 (7.2%) | 32 (26.5%) |
| 25 to 29 Minutes | 0 (0.0%) | 6 (5.0%) |
| 30 to 34 Minutes | 15 (7.7%) | 15 (12.4%) |
| 35 to 39 Minutes | 2 (1.0%) | 6 (5.0%) |
| 40 to 44 Minutes | 5 (2.6%) | 0 (0.0%) |
| 45 to 59 Minutes | 69 (35.4%) | 0 (0.0%) |
| 60 to 89 Minutes | 8 (4.1%) | 2 (1.7%) |
| 90 or more Minutes | 0 (0.0%) | 0 (0.0%) |
Time of Departure to Work by Sex in Belmont
The most frequent times of departure to work in Belmont are 5:00 AM to 5:29 AM (79, 40.5%) for males and 7:30 AM to 7:59 AM (53, 43.8%) for females.
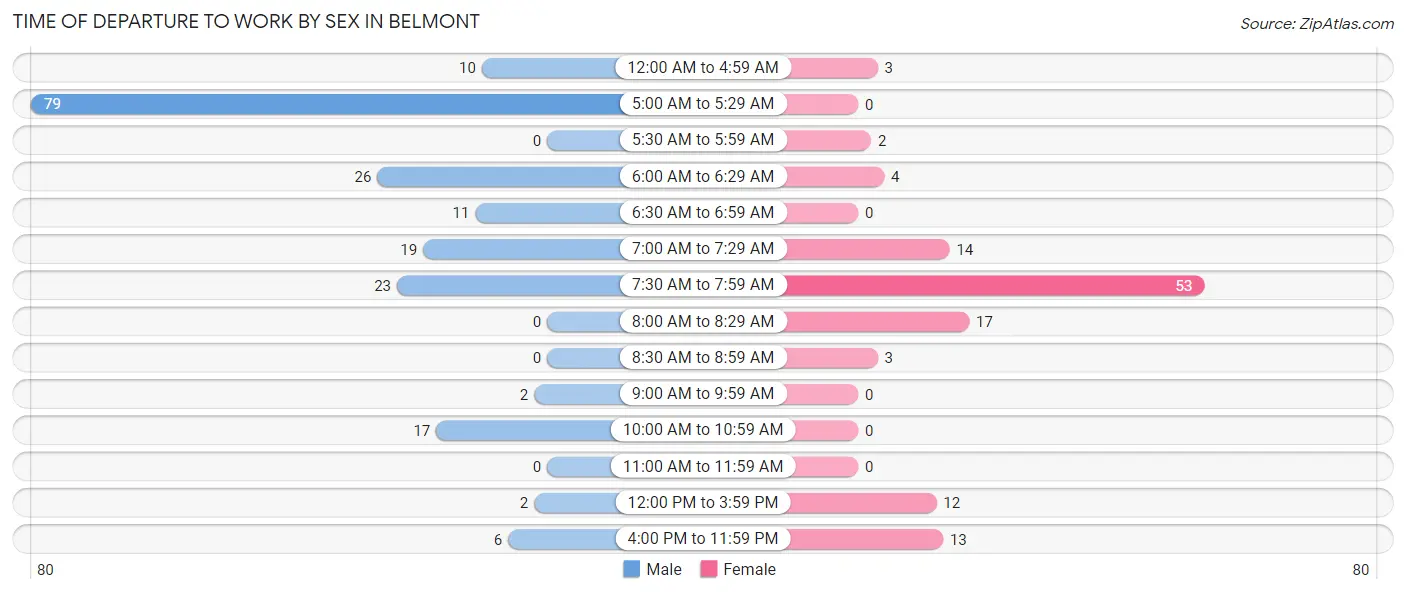
| Time of Departure | Male | Female |
| 12:00 AM to 4:59 AM | 10 (5.1%) | 3 (2.5%) |
| 5:00 AM to 5:29 AM | 79 (40.5%) | 0 (0.0%) |
| 5:30 AM to 5:59 AM | 0 (0.0%) | 2 (1.7%) |
| 6:00 AM to 6:29 AM | 26 (13.3%) | 4 (3.3%) |
| 6:30 AM to 6:59 AM | 11 (5.6%) | 0 (0.0%) |
| 7:00 AM to 7:29 AM | 19 (9.7%) | 14 (11.6%) |
| 7:30 AM to 7:59 AM | 23 (11.8%) | 53 (43.8%) |
| 8:00 AM to 8:29 AM | 0 (0.0%) | 17 (14.1%) |
| 8:30 AM to 8:59 AM | 0 (0.0%) | 3 (2.5%) |
| 9:00 AM to 9:59 AM | 2 (1.0%) | 0 (0.0%) |
| 10:00 AM to 10:59 AM | 17 (8.7%) | 0 (0.0%) |
| 11:00 AM to 11:59 AM | 0 (0.0%) | 0 (0.0%) |
| 12:00 PM to 3:59 PM | 2 (1.0%) | 12 (9.9%) |
| 4:00 PM to 11:59 PM | 6 (3.1%) | 13 (10.7%) |
| Total | 195 (100.0%) | 121 (100.0%) |
Housing Occupancy in Belmont
Occupancy by Ownership in Belmont
Of the total 345 dwellings in Belmont, owner-occupied units account for 253 (73.3%), while renter-occupied units make up 92 (26.7%).
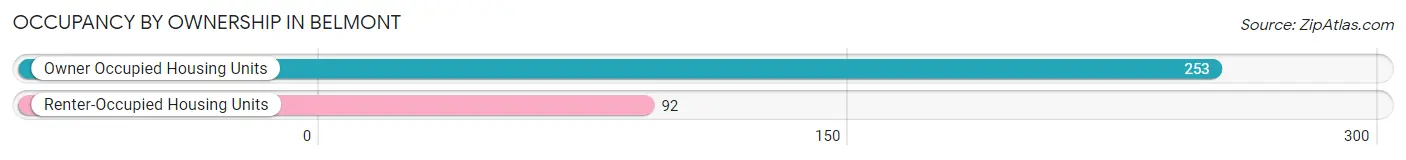
| Occupancy | # Housing Units | % Housing Units |
| Owner Occupied Housing Units | 253 | 73.3% |
| Renter-Occupied Housing Units | 92 | 26.7% |
| Total Occupied Housing Units | 345 | 100.0% |
Occupancy by Household Size in Belmont
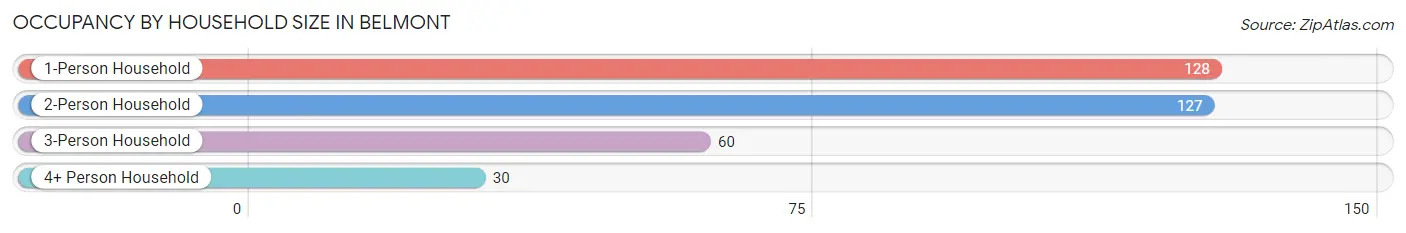
| Household Size | # Housing Units | % Housing Units |
| 1-Person Household | 128 | 37.1% |
| 2-Person Household | 127 | 36.8% |
| 3-Person Household | 60 | 17.4% |
| 4+ Person Household | 30 | 8.7% |
| Total Housing Units | 345 | 100.0% |
Occupancy by Ownership by Household Size in Belmont
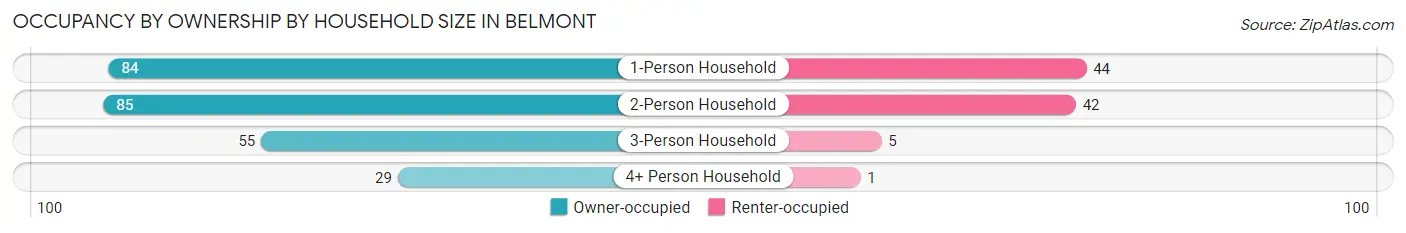
| Household Size | Owner-occupied | Renter-occupied |
| 1-Person Household | 84 (65.6%) | 44 (34.4%) |
| 2-Person Household | 85 (66.9%) | 42 (33.1%) |
| 3-Person Household | 55 (91.7%) | 5 (8.3%) |
| 4+ Person Household | 29 (96.7%) | 1 (3.3%) |
| Total Housing Units | 253 (73.3%) | 92 (26.7%) |
Occupancy by Educational Attainment in Belmont
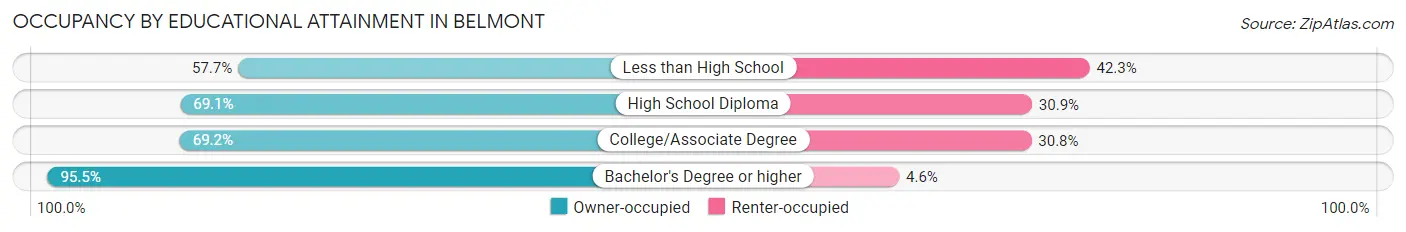
| Household Size | Owner-occupied | Renter-occupied |
| Less than High School | 15 (57.7%) | 11 (42.3%) |
| High School Diploma | 94 (69.1%) | 42 (30.9%) |
| College/Associate Degree | 81 (69.2%) | 36 (30.8%) |
| Bachelor's Degree or higher | 63 (95.5%) | 3 (4.5%) |
Occupancy by Age of Householder in Belmont
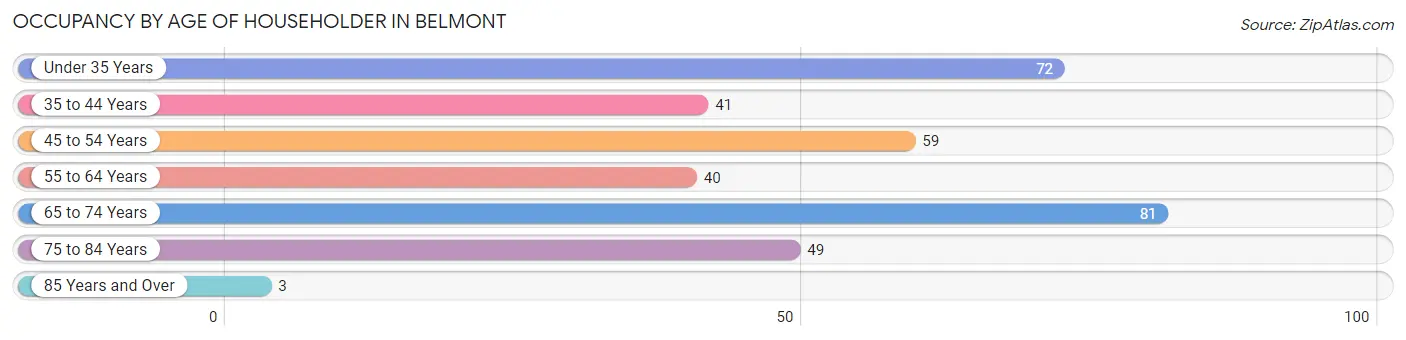
| Age Bracket | # Households | % Households |
| Under 35 Years | 72 | 20.9% |
| 35 to 44 Years | 41 | 11.9% |
| 45 to 54 Years | 59 | 17.1% |
| 55 to 64 Years | 40 | 11.6% |
| 65 to 74 Years | 81 | 23.5% |
| 75 to 84 Years | 49 | 14.2% |
| 85 Years and Over | 3 | 0.9% |
| Total | 345 | 100.0% |
Housing Finances in Belmont
Median Income by Occupancy in Belmont
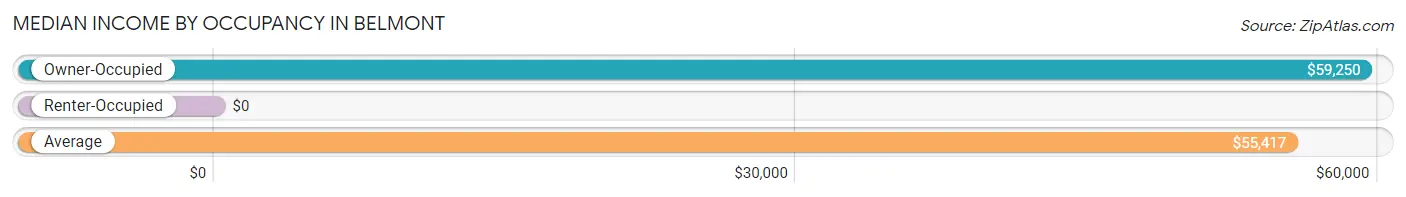
| Occupancy Type | # Households | Median Income |
| Owner-Occupied | 253 (73.3%) | $59,250 |
| Renter-Occupied | 92 (26.7%) | $0 |
| Average | 345 (100.0%) | $55,417 |
Occupancy by Householder Income Bracket in Belmont
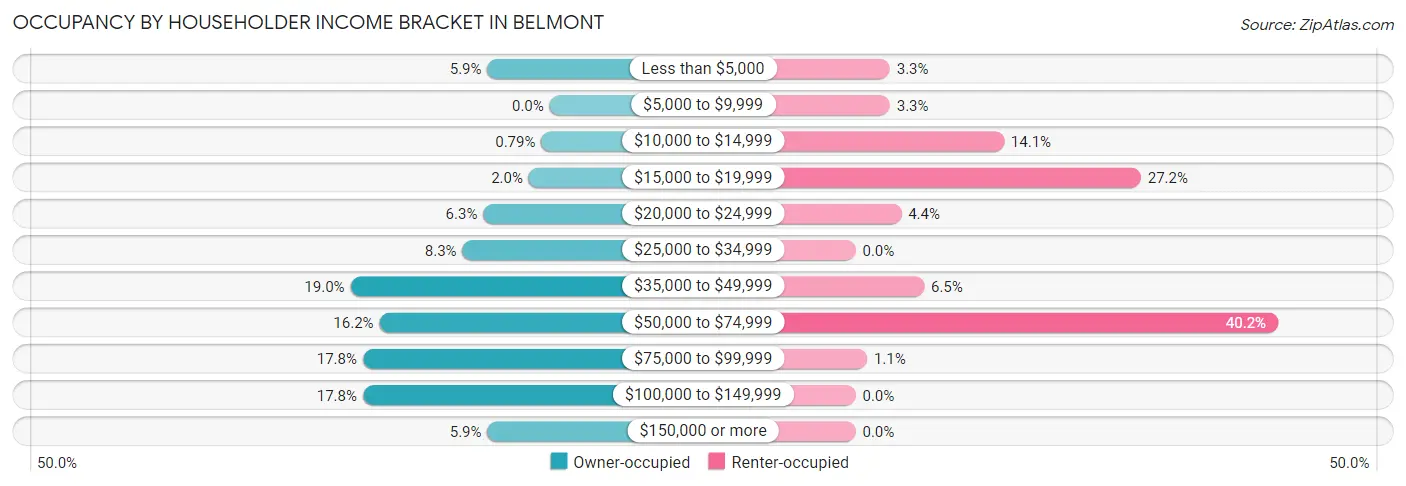
| Income Bracket | Owner-occupied | Renter-occupied |
| Less than $5,000 | 15 (5.9%) | 3 (3.3%) |
| $5,000 to $9,999 | 0 (0.0%) | 3 (3.3%) |
| $10,000 to $14,999 | 2 (0.8%) | 13 (14.1%) |
| $15,000 to $19,999 | 5 (2.0%) | 25 (27.2%) |
| $20,000 to $24,999 | 16 (6.3%) | 4 (4.3%) |
| $25,000 to $34,999 | 21 (8.3%) | 0 (0.0%) |
| $35,000 to $49,999 | 48 (19.0%) | 6 (6.5%) |
| $50,000 to $74,999 | 41 (16.2%) | 37 (40.2%) |
| $75,000 to $99,999 | 45 (17.8%) | 1 (1.1%) |
| $100,000 to $149,999 | 45 (17.8%) | 0 (0.0%) |
| $150,000 or more | 15 (5.9%) | 0 (0.0%) |
| Total | 253 (100.0%) | 92 (100.0%) |
Monthly Housing Cost Tiers in Belmont
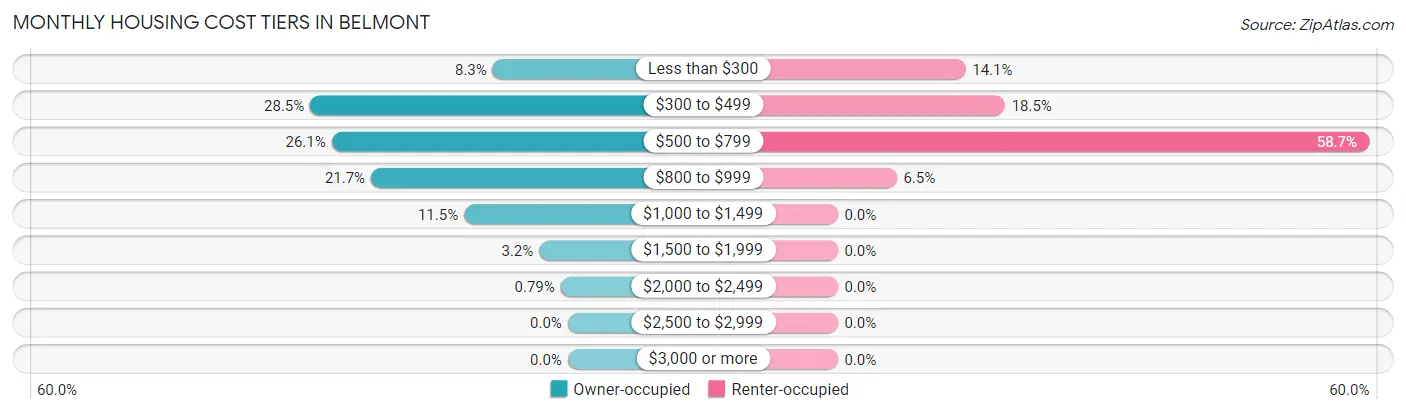
| Monthly Cost | Owner-occupied | Renter-occupied |
| Less than $300 | 21 (8.3%) | 13 (14.1%) |
| $300 to $499 | 72 (28.5%) | 17 (18.5%) |
| $500 to $799 | 66 (26.1%) | 54 (58.7%) |
| $800 to $999 | 55 (21.7%) | 6 (6.5%) |
| $1,000 to $1,499 | 29 (11.5%) | 0 (0.0%) |
| $1,500 to $1,999 | 8 (3.2%) | 0 (0.0%) |
| $2,000 to $2,499 | 2 (0.8%) | 0 (0.0%) |
| $2,500 to $2,999 | 0 (0.0%) | 0 (0.0%) |
| $3,000 or more | 0 (0.0%) | 0 (0.0%) |
| Total | 253 (100.0%) | 92 (100.0%) |
Physical Housing Characteristics in Belmont
Housing Structures in Belmont
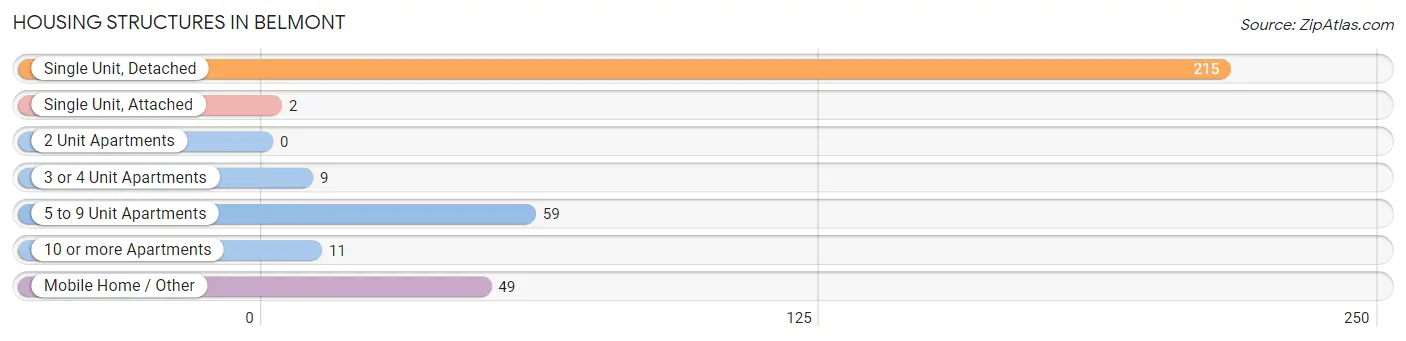
| Structure Type | # Housing Units | % Housing Units |
| Single Unit, Detached | 215 | 62.3% |
| Single Unit, Attached | 2 | 0.6% |
| 2 Unit Apartments | 0 | 0.0% |
| 3 or 4 Unit Apartments | 9 | 2.6% |
| 5 to 9 Unit Apartments | 59 | 17.1% |
| 10 or more Apartments | 11 | 3.2% |
| Mobile Home / Other | 49 | 14.2% |
| Total | 345 | 100.0% |
Housing Structures by Occupancy in Belmont
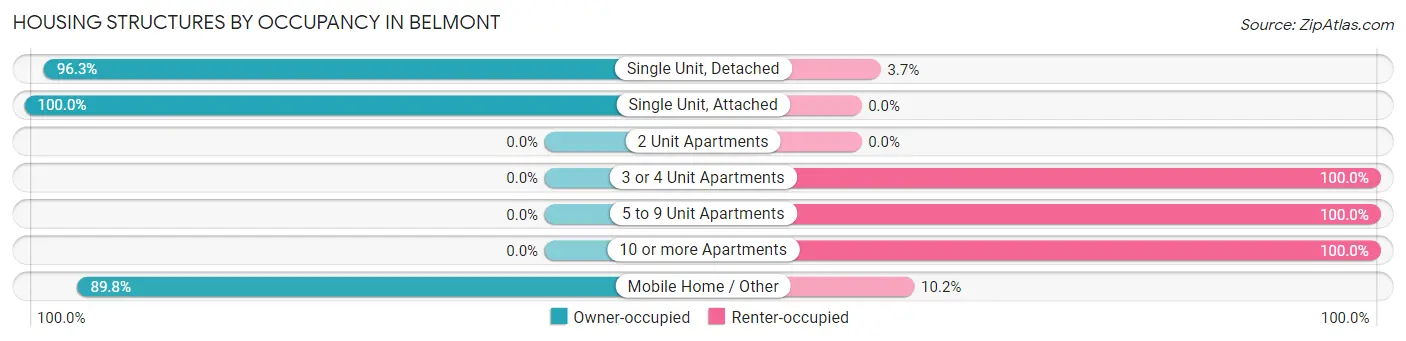
| Structure Type | Owner-occupied | Renter-occupied |
| Single Unit, Detached | 207 (96.3%) | 8 (3.7%) |
| Single Unit, Attached | 2 (100.0%) | 0 (0.0%) |
| 2 Unit Apartments | 0 (0.0%) | 0 (0.0%) |
| 3 or 4 Unit Apartments | 0 (0.0%) | 9 (100.0%) |
| 5 to 9 Unit Apartments | 0 (0.0%) | 59 (100.0%) |
| 10 or more Apartments | 0 (0.0%) | 11 (100.0%) |
| Mobile Home / Other | 44 (89.8%) | 5 (10.2%) |
| Total | 253 (73.3%) | 92 (26.7%) |
Housing Structures by Number of Rooms in Belmont
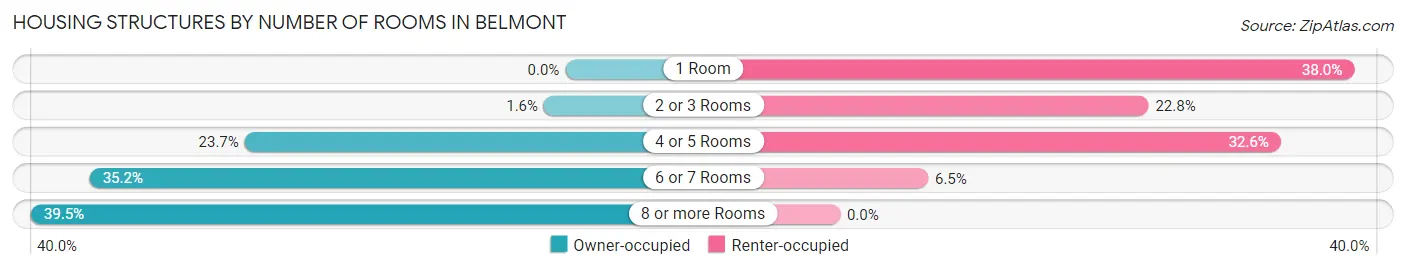
| Number of Rooms | Owner-occupied | Renter-occupied |
| 1 Room | 0 (0.0%) | 35 (38.0%) |
| 2 or 3 Rooms | 4 (1.6%) | 21 (22.8%) |
| 4 or 5 Rooms | 60 (23.7%) | 30 (32.6%) |
| 6 or 7 Rooms | 89 (35.2%) | 6 (6.5%) |
| 8 or more Rooms | 100 (39.5%) | 0 (0.0%) |
| Total | 253 (100.0%) | 92 (100.0%) |
Housing Structure by Heating Type in Belmont
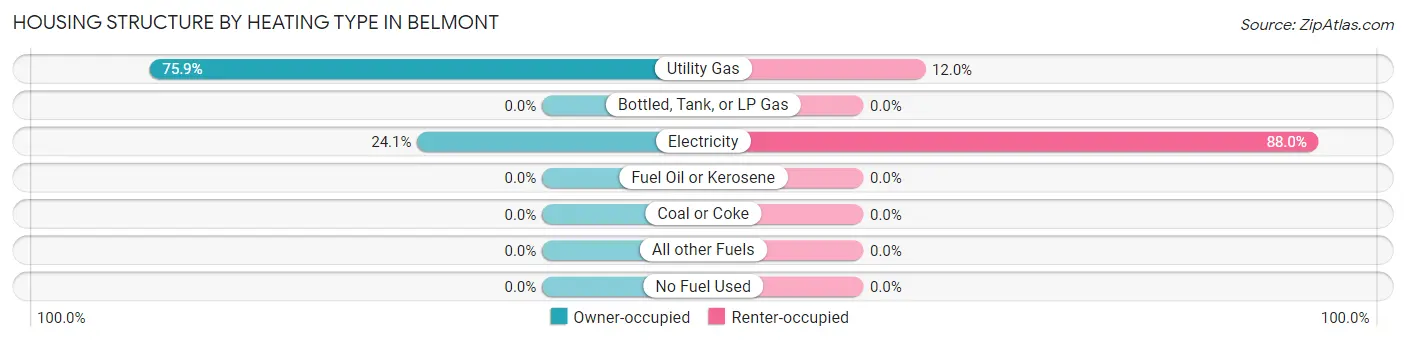
| Heating Type | Owner-occupied | Renter-occupied |
| Utility Gas | 192 (75.9%) | 11 (12.0%) |
| Bottled, Tank, or LP Gas | 0 (0.0%) | 0 (0.0%) |
| Electricity | 61 (24.1%) | 81 (88.0%) |
| Fuel Oil or Kerosene | 0 (0.0%) | 0 (0.0%) |
| Coal or Coke | 0 (0.0%) | 0 (0.0%) |
| All other Fuels | 0 (0.0%) | 0 (0.0%) |
| No Fuel Used | 0 (0.0%) | 0 (0.0%) |
| Total | 253 (100.0%) | 92 (100.0%) |
Household Vehicle Usage in Belmont
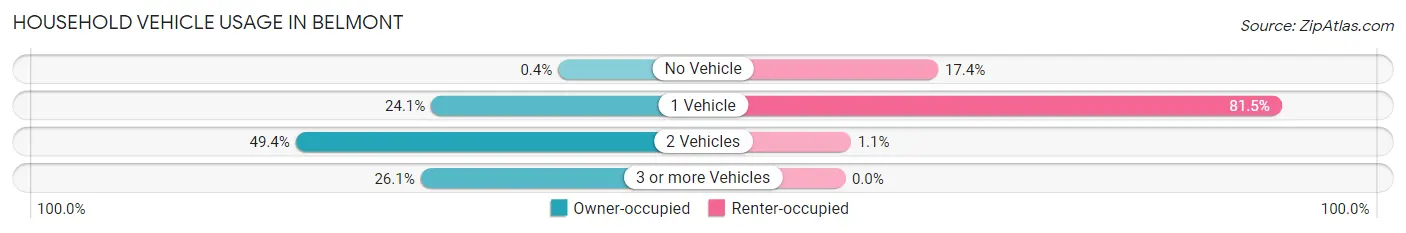
| Vehicles per Household | Owner-occupied | Renter-occupied |
| No Vehicle | 1 (0.4%) | 16 (17.4%) |
| 1 Vehicle | 61 (24.1%) | 75 (81.5%) |
| 2 Vehicles | 125 (49.4%) | 1 (1.1%) |
| 3 or more Vehicles | 66 (26.1%) | 0 (0.0%) |
| Total | 253 (100.0%) | 92 (100.0%) |
Real Estate & Mortgages in Belmont
Real Estate and Mortgage Overview in Belmont
| Characteristic | Without Mortgage | With Mortgage |
| Housing Units | 125 | 128 |
| Median Property Value | $119,900 | $115,700 |
| Median Household Income | $59,886 | $8 |
| Monthly Housing Costs | $429 | $0 |
| Real Estate Taxes | $1,088 | $9 |
Property Value by Mortgage Status in Belmont
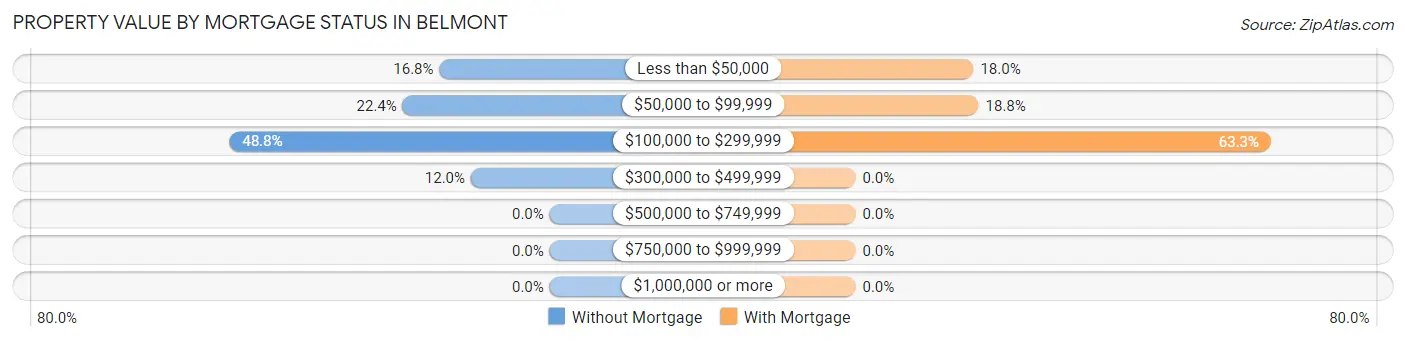
| Property Value | Without Mortgage | With Mortgage |
| Less than $50,000 | 21 (16.8%) | 23 (18.0%) |
| $50,000 to $99,999 | 28 (22.4%) | 24 (18.8%) |
| $100,000 to $299,999 | 61 (48.8%) | 81 (63.3%) |
| $300,000 to $499,999 | 15 (12.0%) | 0 (0.0%) |
| $500,000 to $749,999 | 0 (0.0%) | 0 (0.0%) |
| $750,000 to $999,999 | 0 (0.0%) | 0 (0.0%) |
| $1,000,000 or more | 0 (0.0%) | 0 (0.0%) |
| Total | 125 (100.0%) | 128 (100.0%) |
Household Income by Mortgage Status in Belmont
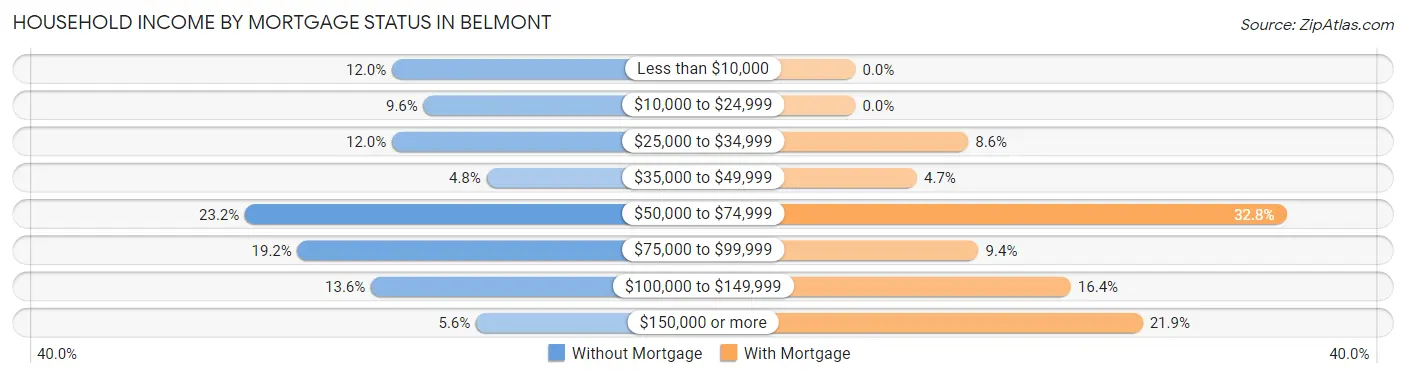
| Household Income | Without Mortgage | With Mortgage |
| Less than $10,000 | 15 (12.0%) | 0 (0.0%) |
| $10,000 to $24,999 | 12 (9.6%) | 0 (0.0%) |
| $25,000 to $34,999 | 15 (12.0%) | 11 (8.6%) |
| $35,000 to $49,999 | 6 (4.8%) | 6 (4.7%) |
| $50,000 to $74,999 | 29 (23.2%) | 42 (32.8%) |
| $75,000 to $99,999 | 24 (19.2%) | 12 (9.4%) |
| $100,000 to $149,999 | 17 (13.6%) | 21 (16.4%) |
| $150,000 or more | 7 (5.6%) | 28 (21.9%) |
| Total | 125 (100.0%) | 128 (100.0%) |
Property Value to Household Income Ratio in Belmont
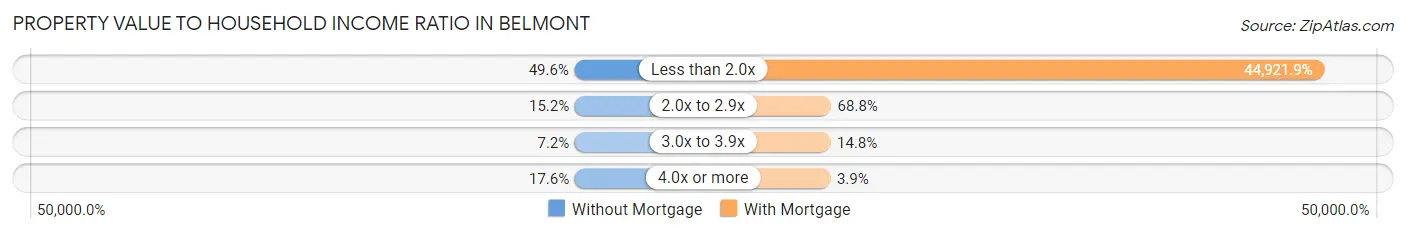
| Value-to-Income Ratio | Without Mortgage | With Mortgage |
| Less than 2.0x | 62 (49.6%) | 57,500 (44,921.9%) |
| 2.0x to 2.9x | 19 (15.2%) | 88 (68.8%) |
| 3.0x to 3.9x | 9 (7.2%) | 19 (14.8%) |
| 4.0x or more | 22 (17.6%) | 5 (3.9%) |
| Total | 125 (100.0%) | 128 (100.0%) |
Real Estate Taxes by Mortgage Status in Belmont
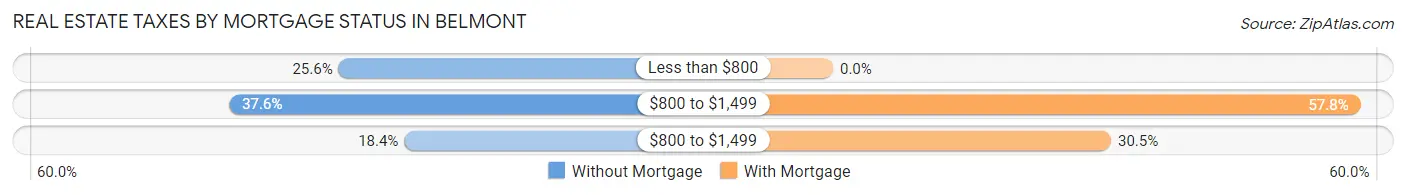
| Property Taxes | Without Mortgage | With Mortgage |
| Less than $800 | 32 (25.6%) | 0 (0.0%) |
| $800 to $1,499 | 47 (37.6%) | 74 (57.8%) |
| $800 to $1,499 | 23 (18.4%) | 39 (30.5%) |
| Total | 125 (100.0%) | 128 (100.0%) |
Health & Disability in Belmont
Health Insurance Coverage by Age in Belmont
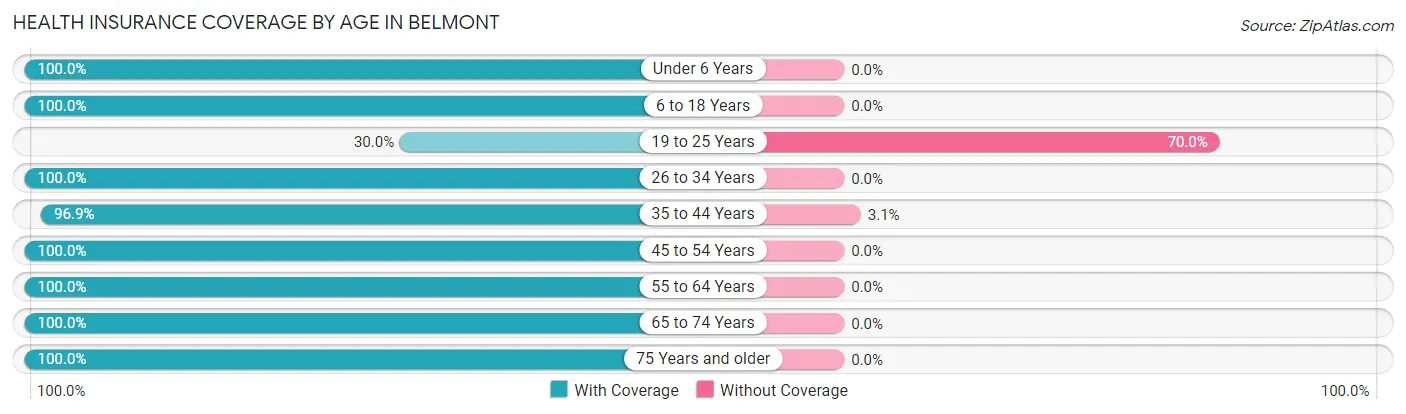
| Age Bracket | With Coverage | Without Coverage |
| Under 6 Years | 32 (100.0%) | 0 (0.0%) |
| 6 to 18 Years | 75 (100.0%) | 0 (0.0%) |
| 19 to 25 Years | 48 (30.0%) | 112 (70.0%) |
| 26 to 34 Years | 43 (100.0%) | 0 (0.0%) |
| 35 to 44 Years | 94 (96.9%) | 3 (3.1%) |
| 45 to 54 Years | 104 (100.0%) | 0 (0.0%) |
| 55 to 64 Years | 56 (100.0%) | 0 (0.0%) |
| 65 to 74 Years | 124 (100.0%) | 0 (0.0%) |
| 75 Years and older | 69 (100.0%) | 0 (0.0%) |
| Total | 645 (84.9%) | 115 (15.1%) |
Health Insurance Coverage by Citizenship Status in Belmont
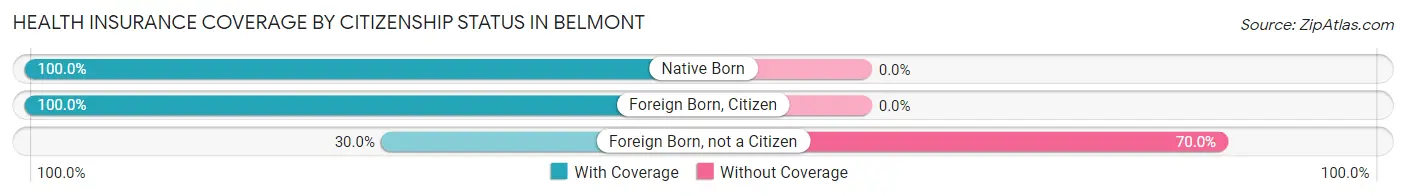
| Citizenship Status | With Coverage | Without Coverage |
| Native Born | 32 (100.0%) | 0 (0.0%) |
| Foreign Born, Citizen | 75 (100.0%) | 0 (0.0%) |
| Foreign Born, not a Citizen | 48 (30.0%) | 112 (70.0%) |
Health Insurance Coverage by Household Income in Belmont
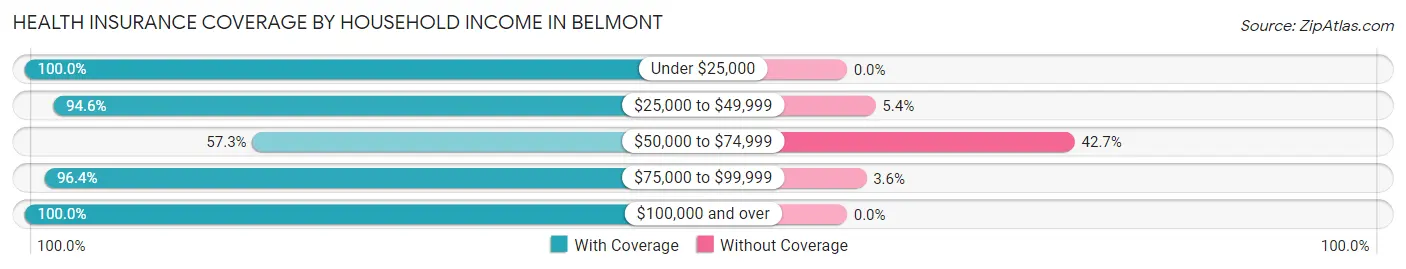
| Household Income | With Coverage | Without Coverage |
| Under $25,000 | 104 (100.0%) | 0 (0.0%) |
| $25,000 to $49,999 | 159 (94.6%) | 9 (5.4%) |
| $50,000 to $74,999 | 137 (57.3%) | 102 (42.7%) |
| $75,000 to $99,999 | 106 (96.4%) | 4 (3.6%) |
| $100,000 and over | 139 (100.0%) | 0 (0.0%) |
Public vs Private Health Insurance Coverage by Age in Belmont
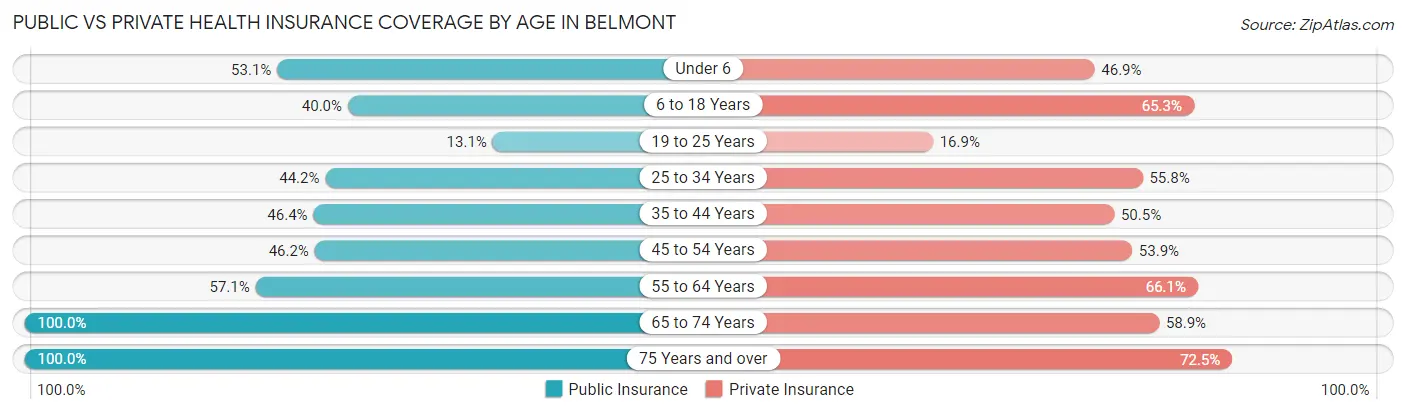
| Age Bracket | Public Insurance | Private Insurance |
| Under 6 | 17 (53.1%) | 15 (46.9%) |
| 6 to 18 Years | 30 (40.0%) | 49 (65.3%) |
| 19 to 25 Years | 21 (13.1%) | 27 (16.9%) |
| 25 to 34 Years | 19 (44.2%) | 24 (55.8%) |
| 35 to 44 Years | 45 (46.4%) | 49 (50.5%) |
| 45 to 54 Years | 48 (46.2%) | 56 (53.8%) |
| 55 to 64 Years | 32 (57.1%) | 37 (66.1%) |
| 65 to 74 Years | 124 (100.0%) | 73 (58.9%) |
| 75 Years and over | 69 (100.0%) | 50 (72.5%) |
| Total | 405 (53.3%) | 380 (50.0%) |
Disability Status by Sex by Age in Belmont
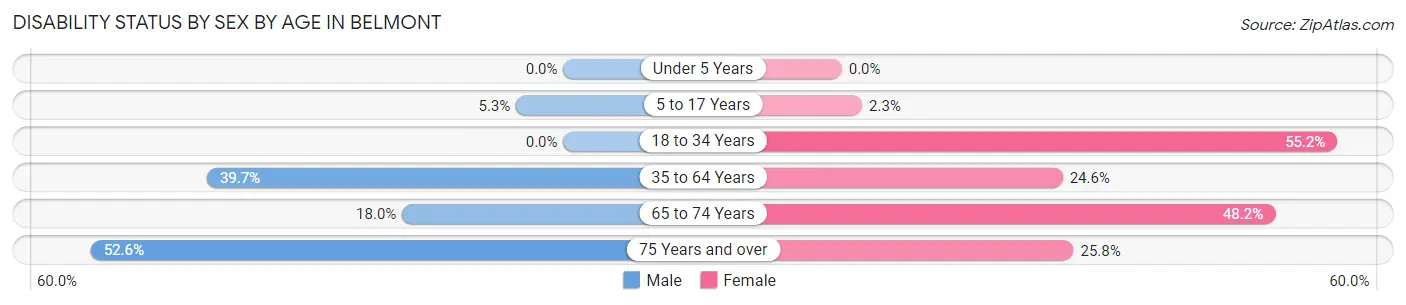
| Age Bracket | Male | Female |
| Under 5 Years | 0 (0.0%) | 0 (0.0%) |
| 5 to 17 Years | 2 (5.3%) | 1 (2.3%) |
| 18 to 34 Years | 0 (0.0%) | 32 (55.2%) |
| 35 to 64 Years | 52 (39.7%) | 31 (24.6%) |
| 65 to 74 Years | 7 (17.9%) | 41 (48.2%) |
| 75 Years and over | 20 (52.6%) | 8 (25.8%) |
Disability Class by Sex by Age in Belmont
Disability Class: Hearing Difficulty
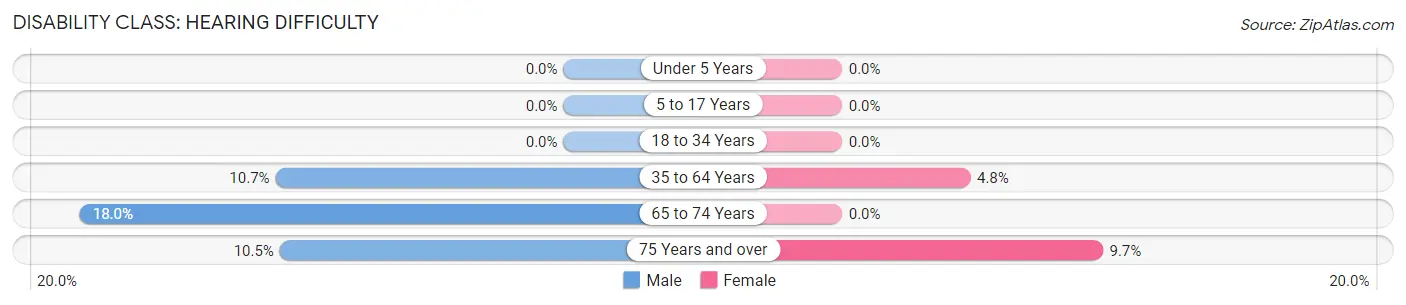
| Age Bracket | Male | Female |
| Under 5 Years | 0 (0.0%) | 0 (0.0%) |
| 5 to 17 Years | 0 (0.0%) | 0 (0.0%) |
| 18 to 34 Years | 0 (0.0%) | 0 (0.0%) |
| 35 to 64 Years | 14 (10.7%) | 6 (4.8%) |
| 65 to 74 Years | 7 (17.9%) | 0 (0.0%) |
| 75 Years and over | 4 (10.5%) | 3 (9.7%) |
Disability Class: Vision Difficulty
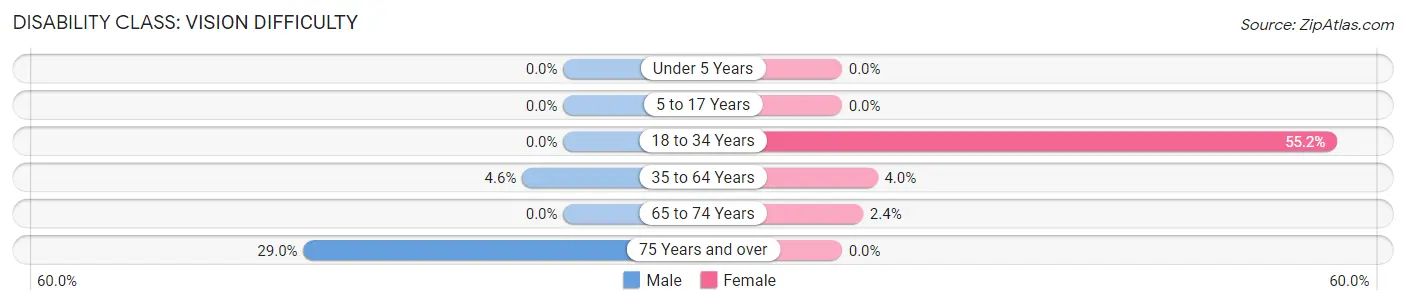
| Age Bracket | Male | Female |
| Under 5 Years | 0 (0.0%) | 0 (0.0%) |
| 5 to 17 Years | 0 (0.0%) | 0 (0.0%) |
| 18 to 34 Years | 0 (0.0%) | 32 (55.2%) |
| 35 to 64 Years | 6 (4.6%) | 5 (4.0%) |
| 65 to 74 Years | 0 (0.0%) | 2 (2.4%) |
| 75 Years and over | 11 (28.9%) | 0 (0.0%) |
Disability Class: Cognitive Difficulty
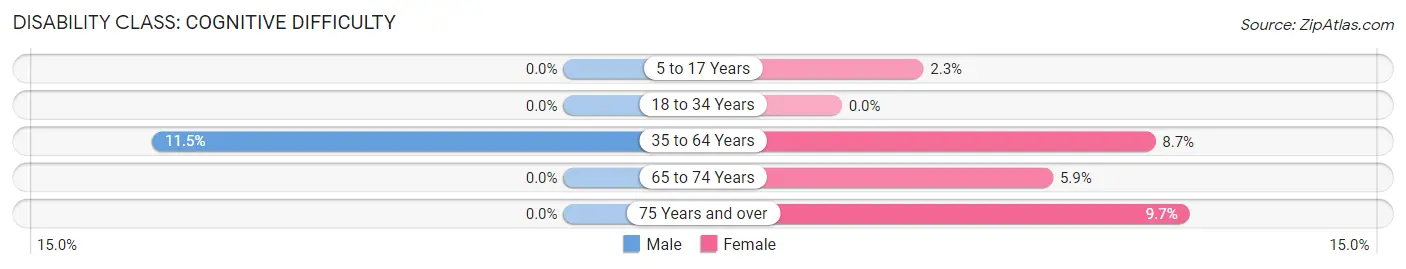
| Age Bracket | Male | Female |
| 5 to 17 Years | 0 (0.0%) | 1 (2.3%) |
| 18 to 34 Years | 0 (0.0%) | 0 (0.0%) |
| 35 to 64 Years | 15 (11.5%) | 11 (8.7%) |
| 65 to 74 Years | 0 (0.0%) | 5 (5.9%) |
| 75 Years and over | 0 (0.0%) | 3 (9.7%) |
Disability Class: Ambulatory Difficulty
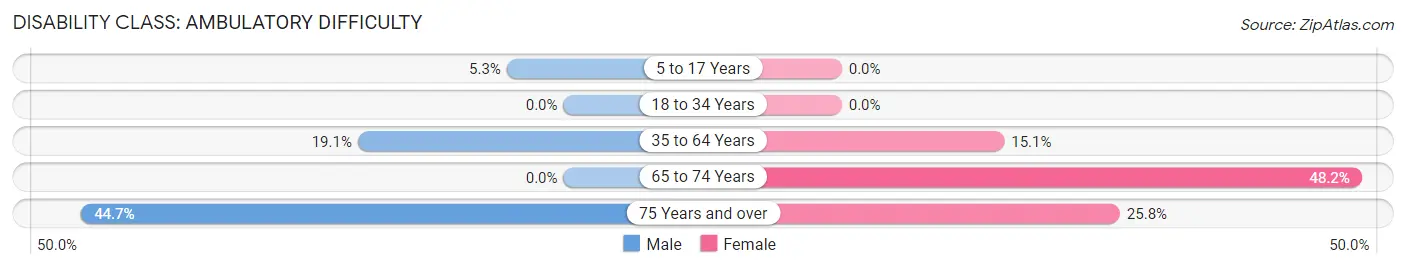
| Age Bracket | Male | Female |
| 5 to 17 Years | 2 (5.3%) | 0 (0.0%) |
| 18 to 34 Years | 0 (0.0%) | 0 (0.0%) |
| 35 to 64 Years | 25 (19.1%) | 19 (15.1%) |
| 65 to 74 Years | 0 (0.0%) | 41 (48.2%) |
| 75 Years and over | 17 (44.7%) | 8 (25.8%) |
Disability Class: Self-Care Difficulty
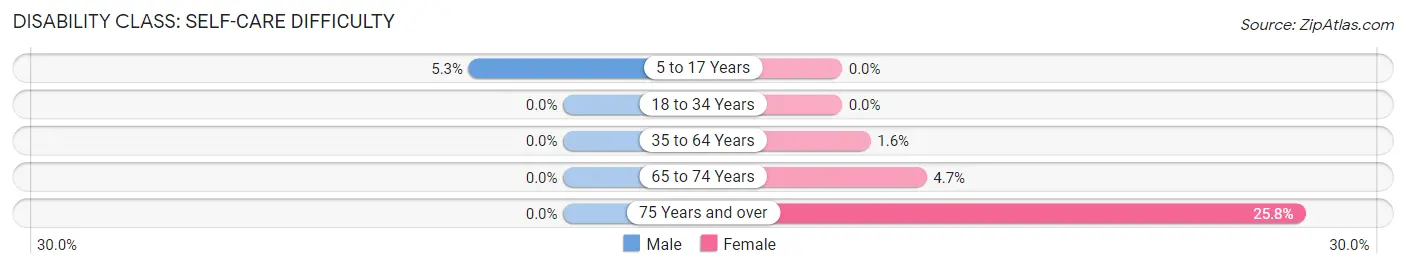
| Age Bracket | Male | Female |
| 5 to 17 Years | 2 (5.3%) | 0 (0.0%) |
| 18 to 34 Years | 0 (0.0%) | 0 (0.0%) |
| 35 to 64 Years | 0 (0.0%) | 2 (1.6%) |
| 65 to 74 Years | 0 (0.0%) | 4 (4.7%) |
| 75 Years and over | 0 (0.0%) | 8 (25.8%) |
Technology Access in Belmont
Computing Device Access in Belmont
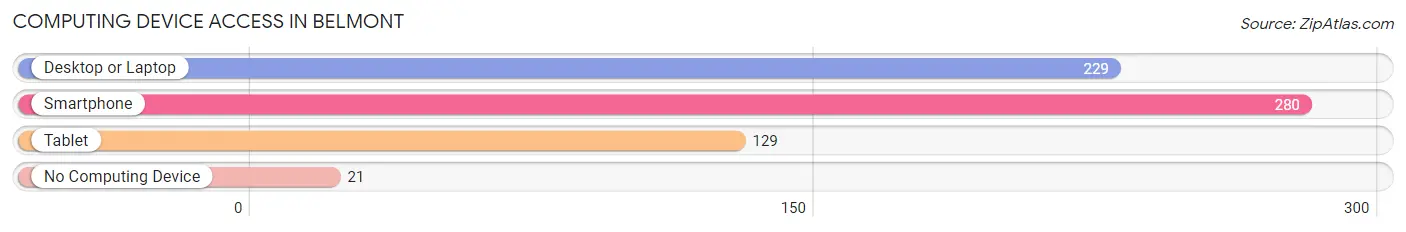
| Device Type | # Households | % Households |
| Desktop or Laptop | 229 | 66.4% |
| Smartphone | 280 | 81.2% |
| Tablet | 129 | 37.4% |
| No Computing Device | 21 | 6.1% |
| Total | 345 | 100.0% |
Internet Access in Belmont
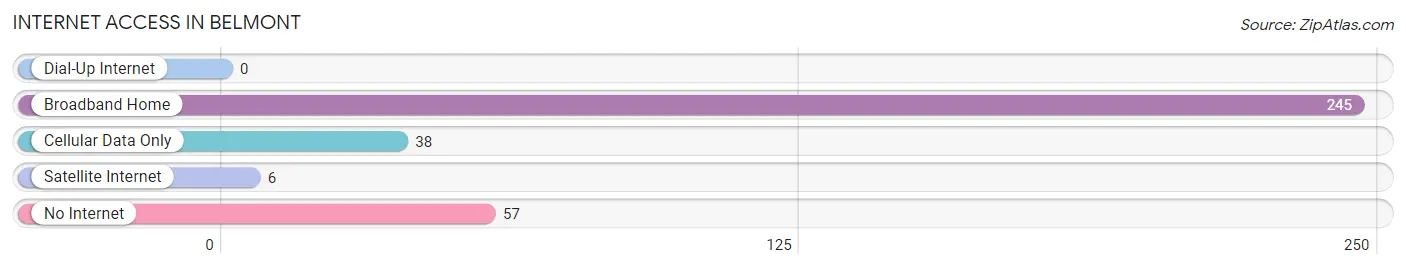
| Internet Type | # Households | % Households |
| Dial-Up Internet | 0 | 0.0% |
| Broadband Home | 245 | 71.0% |
| Cellular Data Only | 38 | 11.0% |
| Satellite Internet | 6 | 1.7% |
| No Internet | 57 | 16.5% |
| Total | 345 | 100.0% |
Belmont Summary
Belmont, West Virginia is a small town located in the northern part of the state, in the Ohio River Valley. It is situated in the foothills of the Appalachian Mountains, and is part of the Wheeling metropolitan area. The town has a population of just over 1,000 people, and is known for its rural charm and small-town atmosphere.
History
Belmont was first settled in the late 1700s by a group of German immigrants. The town was originally known as “New Germany”, and was later renamed Belmont in 1818. The town was officially incorporated in 1820, and was named after the nearby Belmont Estate, which was owned by the prominent local family of the same name.
The town grew steadily throughout the 19th century, and by the early 20th century, it had become a bustling center of commerce and industry. The town was home to several factories, including a glassworks, a tannery, and a brickworks. The town also had a thriving agricultural sector, with many local farmers growing wheat, corn, and other crops.
Geography
Belmont is located in the northern part of West Virginia, in the Ohio River Valley. The town is situated in the foothills of the Appalachian Mountains, and is part of the Wheeling metropolitan area. The town is located about 25 miles south of Wheeling, and about 50 miles west of Pittsburgh, Pennsylvania.
The town is situated on the banks of the Ohio River, and is surrounded by rolling hills and lush forests. The town is also home to several small lakes and streams, which provide a variety of recreational opportunities.
Economy
Belmont’s economy is largely based on agriculture and tourism. The town is home to several small farms, which produce a variety of crops, including wheat, corn, and soybeans. The town is also home to several small businesses, including restaurants, shops, and other services.
The town is also a popular tourist destination, and is home to several attractions, including the Belmont Mansion, the Belmont County Historical Society Museum, and the Belmont County Fairgrounds. The town is also home to several wineries, which produce a variety of wines.
Demographics
As of the 2010 census, Belmont had a population of 1,037 people. The town has a median age of 44.7 years, and a median household income of $37,941. The town is predominantly white, with 92.3% of the population identifying as such. The town also has a small Hispanic population, with 4.2% of the population identifying as Hispanic or Latino.
Belmont is a small town with a rich history and a unique culture. The town is home to a variety of businesses and attractions, and is a popular tourist destination. The town is also home to a diverse population, and is a great place to live and work.
Common Questions
What is Per Capita Income in Belmont?
Per Capita income in Belmont is $30,282.
What is the Median Family Income in Belmont?
Median Family Income in Belmont is $72,917.
What is the Median Household income in Belmont?
Median Household Income in Belmont is $55,417.
What is Income or Wage Gap in Belmont?
Income or Wage Gap in Belmont is 44.8%.
Women in Belmont earn 55.2 cents for every dollar earned by a man.
What is Inequality or Gini Index in Belmont?
Inequality or Gini Index in Belmont is 0.39.
What is the Total Population of Belmont?
Total Population of Belmont is 824.
What is the Total Male Population of Belmont?
Total Male Population of Belmont is 438.
What is the Total Female Population of Belmont?
Total Female Population of Belmont is 386.
What is the Ratio of Males per 100 Females in Belmont?
There are 113.47 Males per 100 Females in Belmont.
What is the Ratio of Females per 100 Males in Belmont?
There are 88.13 Females per 100 Males in Belmont.
What is the Median Population Age in Belmont?
Median Population Age in Belmont is 46.5 Years.
What is the Average Family Size in Belmont
Average Family Size in Belmont is 2.9 People.
What is the Average Household Size in Belmont
Average Household Size in Belmont is 2.2 People.
How Large is the Labor Force in Belmont?
There are 380 People in the Labor Forcein in Belmont.
What is the Percentage of People in the Labor Force in Belmont?
52.2% of People are in the Labor Force in Belmont.
What is the Unemployment Rate in Belmont?
Unemployment Rate in Belmont is 6.6%.