Beech Bottom, WV Map & Demographics
Beech Bottom Map
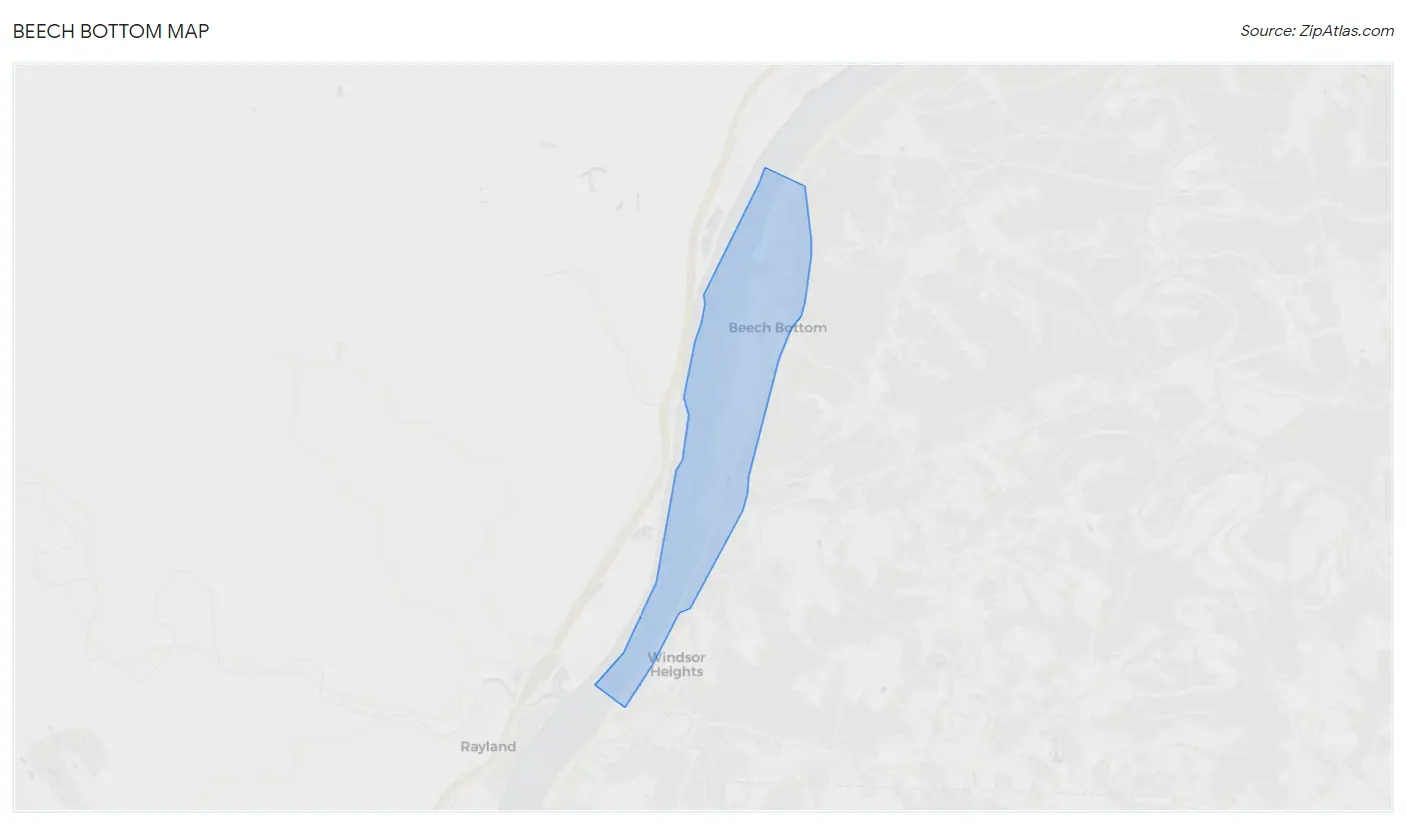
Beech Bottom Overview
$19,987
PER CAPITA INCOME
$70,313
AVG FAMILY INCOME
$28,958
AVG HOUSEHOLD INCOME
28.4%
WAGE / INCOME GAP [ % ]
71.6¢/ $1
WAGE / INCOME GAP [ $ ]
0.43
INEQUALITY / GINI INDEX
627
TOTAL POPULATION
274
MALE POPULATION
353
FEMALE POPULATION
77.62
MALES / 100 FEMALES
128.83
FEMALES / 100 MALES
44.1
MEDIAN AGE
3.9
AVG FAMILY SIZE
2.6
AVG HOUSEHOLD SIZE
312
LABOR FORCE [ PEOPLE ]
63.5%
PERCENT IN LABOR FORCE
6.4%
UNEMPLOYMENT RATE
Beech Bottom Zip Codes
Beech Bottom Area Codes
Income in Beech Bottom
Income Overview in Beech Bottom
Per Capita Income in Beech Bottom is $19,987, while median incomes of families and households are $70,313 and $28,958 respectively.
| Characteristic | Number | Measure |
| Per Capita Income | 627 | $19,987 |
| Median Family Income | 107 | $70,313 |
| Mean Family Income | 107 | $66,414 |
| Median Household Income | 238 | $28,958 |
| Mean Household Income | 238 | $46,636 |
| Income Deficit | 107 | $0 |
| Wage / Income Gap (%) | 627 | 28.44% |
| Wage / Income Gap ($) | 627 | 71.56¢ per $1 |
| Gini / Inequality Index | 627 | 0.43 |
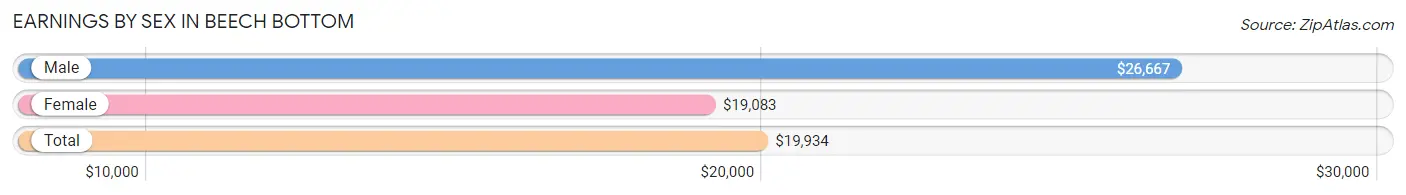
Earnings by Sex in Beech Bottom
Average Earnings in Beech Bottom are $19,934, $26,667 for men and $19,083 for women, a difference of 28.4%.
| Sex | Number | Average Earnings |
| Male | 132 (41.4%) | $26,667 |
| Female | 187 (58.6%) | $19,083 |
| Total | 319 (100.0%) | $19,934 |
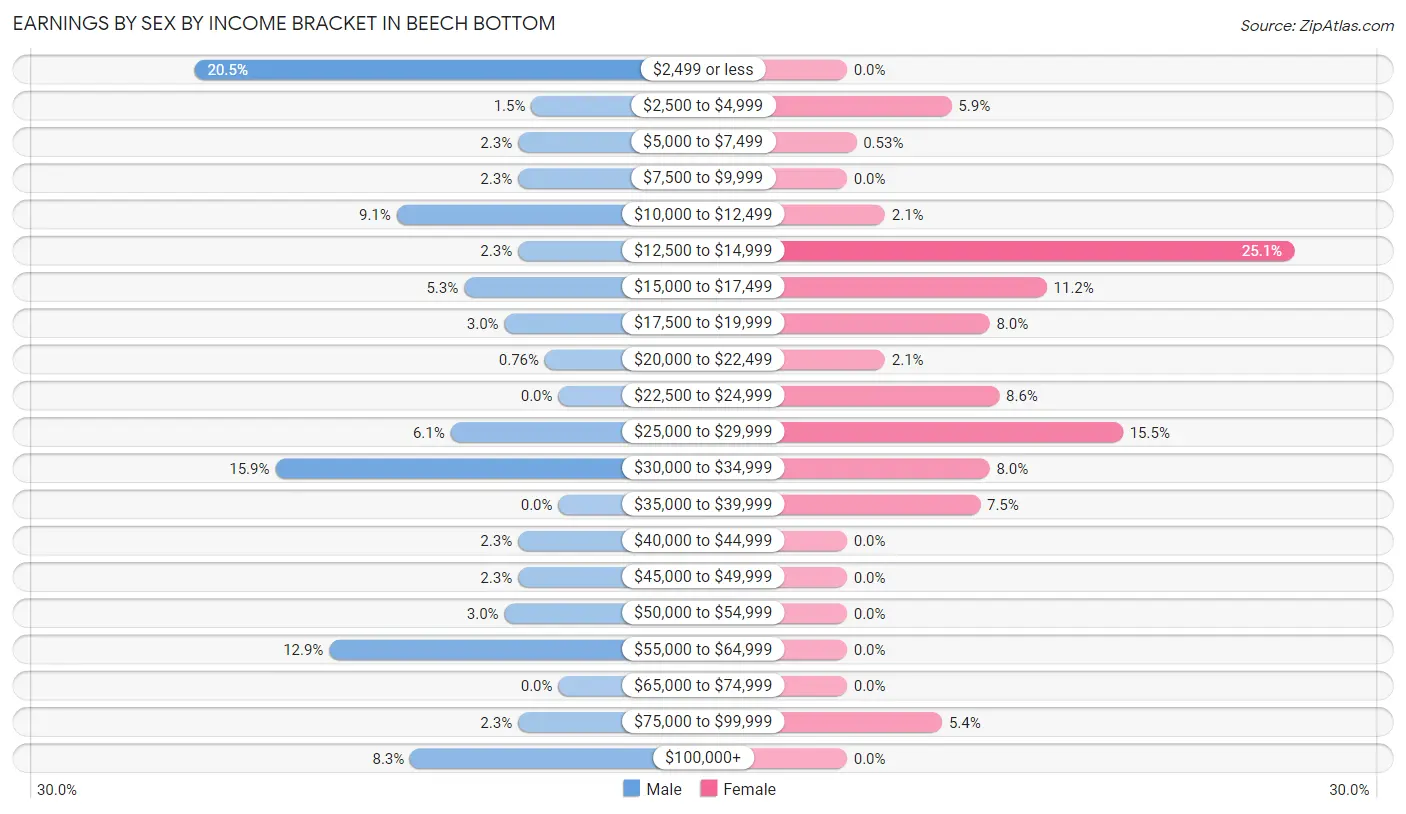
Earnings by Sex by Income Bracket in Beech Bottom
The most common earnings brackets in Beech Bottom are $2,499 or less for men (27 | 20.4%) and $12,500 to $14,999 for women (47 | 25.1%).
| Income | Male | Female |
| $2,499 or less | 27 (20.4%) | 0 (0.0%) |
| $2,500 to $4,999 | 2 (1.5%) | 11 (5.9%) |
| $5,000 to $7,499 | 3 (2.3%) | 1 (0.5%) |
| $7,500 to $9,999 | 3 (2.3%) | 0 (0.0%) |
| $10,000 to $12,499 | 12 (9.1%) | 4 (2.1%) |
| $12,500 to $14,999 | 3 (2.3%) | 47 (25.1%) |
| $15,000 to $17,499 | 7 (5.3%) | 21 (11.2%) |
| $17,500 to $19,999 | 4 (3.0%) | 15 (8.0%) |
| $20,000 to $22,499 | 1 (0.8%) | 4 (2.1%) |
| $22,500 to $24,999 | 0 (0.0%) | 16 (8.6%) |
| $25,000 to $29,999 | 8 (6.1%) | 29 (15.5%) |
| $30,000 to $34,999 | 21 (15.9%) | 15 (8.0%) |
| $35,000 to $39,999 | 0 (0.0%) | 14 (7.5%) |
| $40,000 to $44,999 | 3 (2.3%) | 0 (0.0%) |
| $45,000 to $49,999 | 3 (2.3%) | 0 (0.0%) |
| $50,000 to $54,999 | 4 (3.0%) | 0 (0.0%) |
| $55,000 to $64,999 | 17 (12.9%) | 0 (0.0%) |
| $65,000 to $74,999 | 0 (0.0%) | 0 (0.0%) |
| $75,000 to $99,999 | 3 (2.3%) | 10 (5.3%) |
| $100,000+ | 11 (8.3%) | 0 (0.0%) |
| Total | 132 (100.0%) | 187 (100.0%) |
Earnings by Sex by Educational Attainment in Beech Bottom
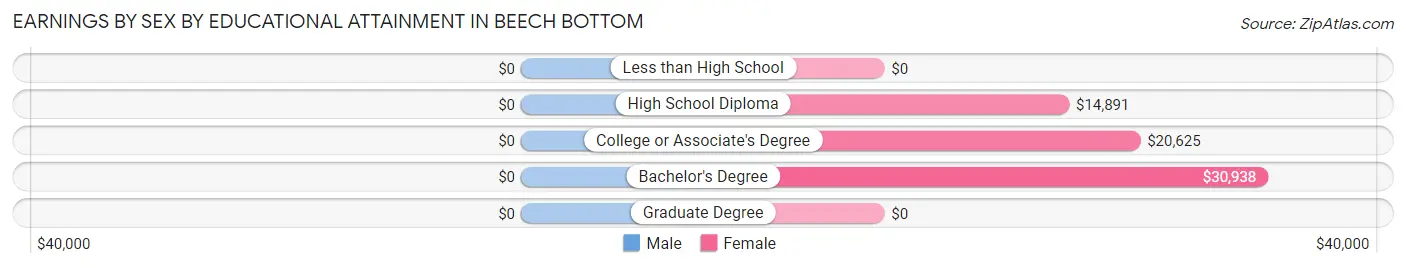
| Educational Attainment | Male Income | Female Income |
| Less than High School | - | - |
| High School Diploma | - | - |
| College or Associate's Degree | - | - |
| Bachelor's Degree | - | - |
| Graduate Degree | - | - |
| Total | $26,667 | $19,333 |
Family Income in Beech Bottom
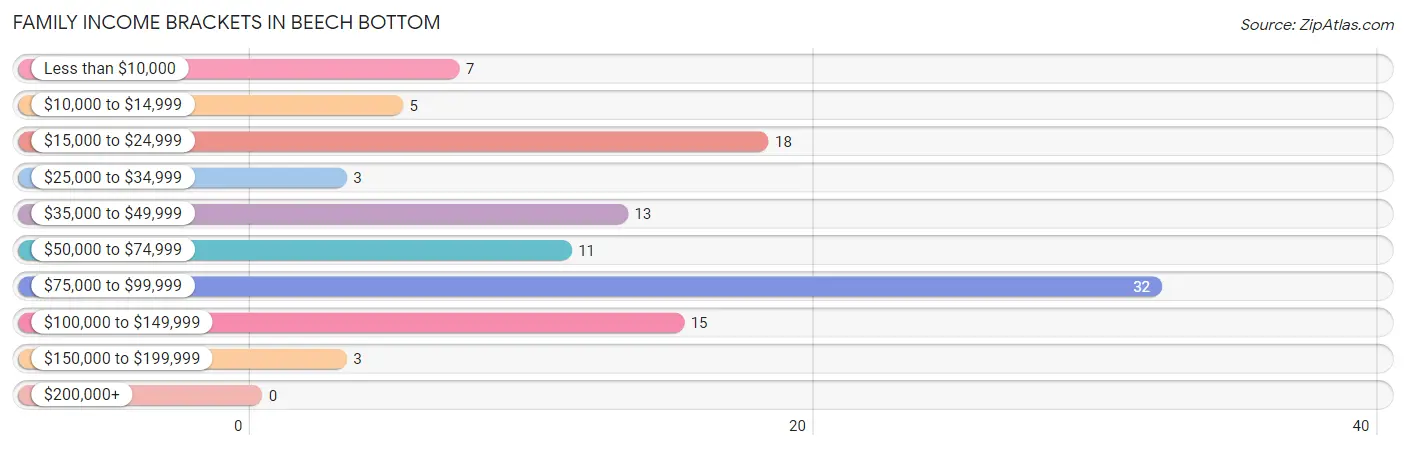
Family Income Brackets in Beech Bottom
According to the Beech Bottom family income data, there are 32 families falling into the $75,000 to $99,999 income range, which is the most common income bracket and makes up 29.9% of all families.
| Income Bracket | # Families | % Families |
| Less than $10,000 | 7 | 6.5% |
| $10,000 to $14,999 | 5 | 4.7% |
| $15,000 to $24,999 | 18 | 16.8% |
| $25,000 to $34,999 | 3 | 2.8% |
| $35,000 to $49,999 | 13 | 12.1% |
| $50,000 to $74,999 | 11 | 10.3% |
| $75,000 to $99,999 | 32 | 29.9% |
| $100,000 to $149,999 | 15 | 14.0% |
| $150,000 to $199,999 | 3 | 2.8% |
| $200,000+ | 0 | 0.0% |
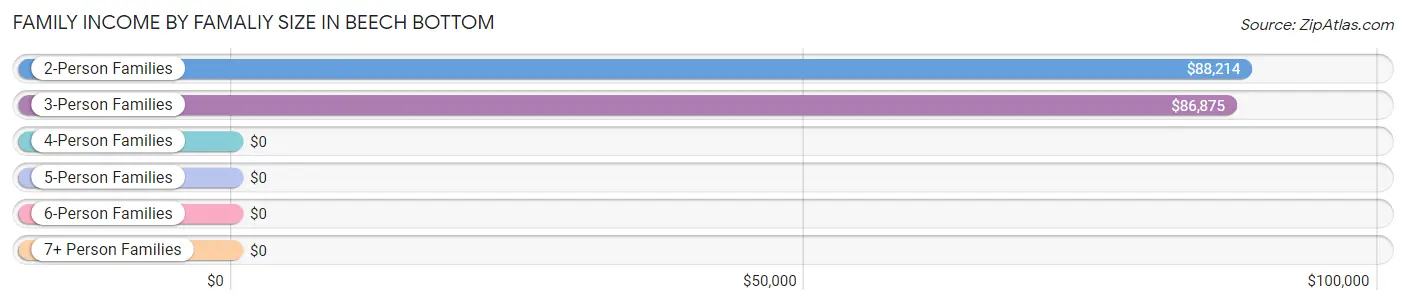
Family Income by Famaliy Size in Beech Bottom
2-person families (52 | 48.6%) account for the highest median family income in Beech Bottom with $88,214 per family, while 2-person families (52 | 48.6%) have the highest median income of $44,107 per family member.
| Income Bracket | # Families | Median Income |
| 2-Person Families | 52 (48.6%) | $88,214 |
| 3-Person Families | 26 (24.3%) | $86,875 |
| 4-Person Families | 15 (14.0%) | $0 |
| 5-Person Families | 0 (0.0%) | $0 |
| 6-Person Families | 11 (10.3%) | $0 |
| 7+ Person Families | 3 (2.8%) | $0 |
| Total | 107 (100.0%) | $70,313 |
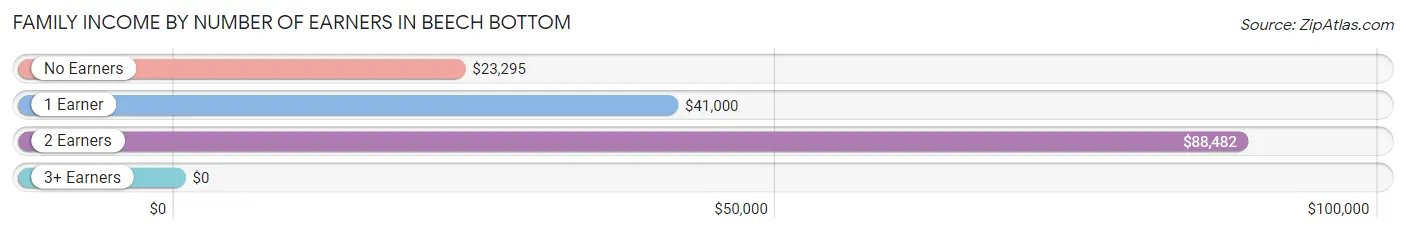
Family Income by Number of Earners in Beech Bottom
| Number of Earners | # Families | Median Income |
| No Earners | 27 (25.2%) | $23,295 |
| 1 Earner | 24 (22.4%) | $41,000 |
| 2 Earners | 47 (43.9%) | $88,482 |
| 3+ Earners | 9 (8.4%) | $0 |
| Total | 107 (100.0%) | $70,313 |
Household Income in Beech Bottom
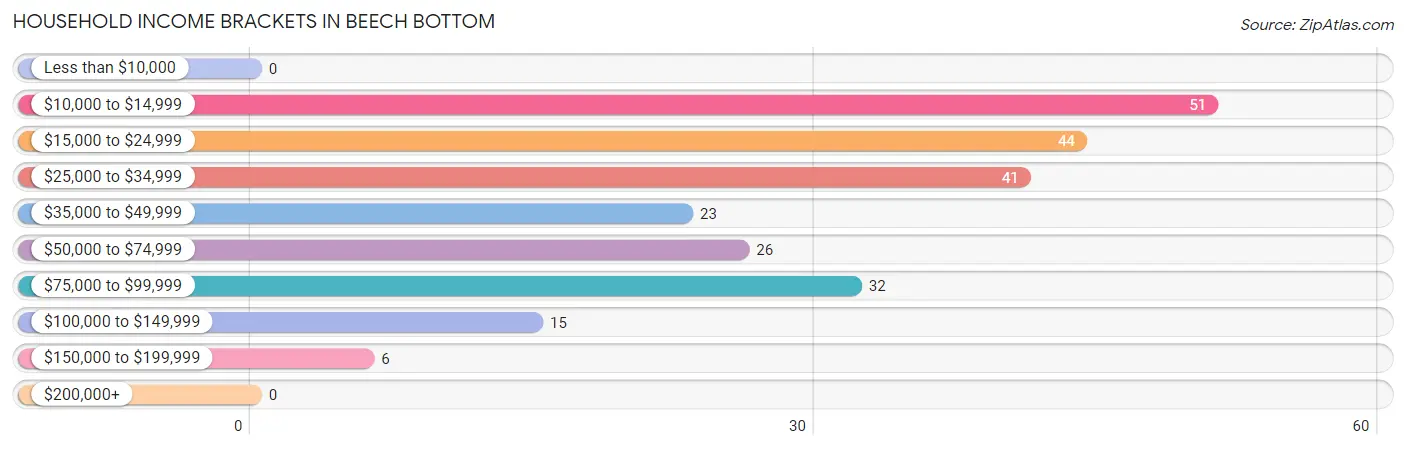
Household Income Brackets in Beech Bottom
With 51 households falling in the category, the $10,000 to $14,999 income range is the most frequent in Beech Bottom, accounting for 21.4% of all households.
| Income Bracket | # Households | % Households |
| Less than $10,000 | 0 | 0.0% |
| $10,000 to $14,999 | 51 | 21.4% |
| $15,000 to $24,999 | 44 | 18.5% |
| $25,000 to $34,999 | 41 | 17.2% |
| $35,000 to $49,999 | 23 | 9.7% |
| $50,000 to $74,999 | 26 | 10.9% |
| $75,000 to $99,999 | 32 | 13.4% |
| $100,000 to $149,999 | 15 | 6.3% |
| $150,000 to $199,999 | 6 | 2.5% |
| $200,000+ | 0 | 0.0% |
Household Income by Householder Age in Beech Bottom
The median household income in Beech Bottom is $28,958, with the highest median household income of $64,167 found in the 25 to 44 years age bracket for the primary householder. A total of 64 households (26.9%) fall into this category. Meanwhile, the 15 to 24 years age bracket for the primary householder has the lowest median household income of $0, with 10 households (4.2%) in this group.
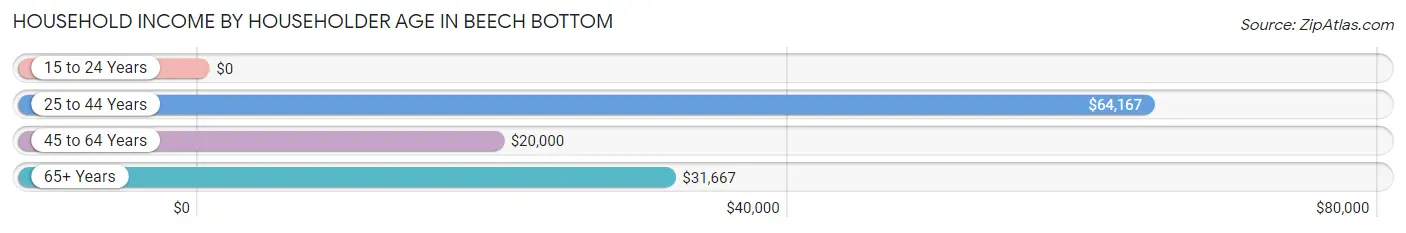
| Income Bracket | # Households | Median Income |
| 15 to 24 Years | 10 (4.2%) | $0 |
| 25 to 44 Years | 64 (26.9%) | $64,167 |
| 45 to 64 Years | 122 (51.3%) | $20,000 |
| 65+ Years | 42 (17.6%) | $31,667 |
| Total | 238 (100.0%) | $28,958 |
Poverty in Beech Bottom
Income Below Poverty by Sex and Age in Beech Bottom
With 36.9% poverty level for males and 49.7% for females among the residents of Beech Bottom, 6 to 11 year old males and under 5 year old females are the most vulnerable to poverty, with 17 males (89.5%) and 41 females (100.0%) in their respective age groups living below the poverty level.
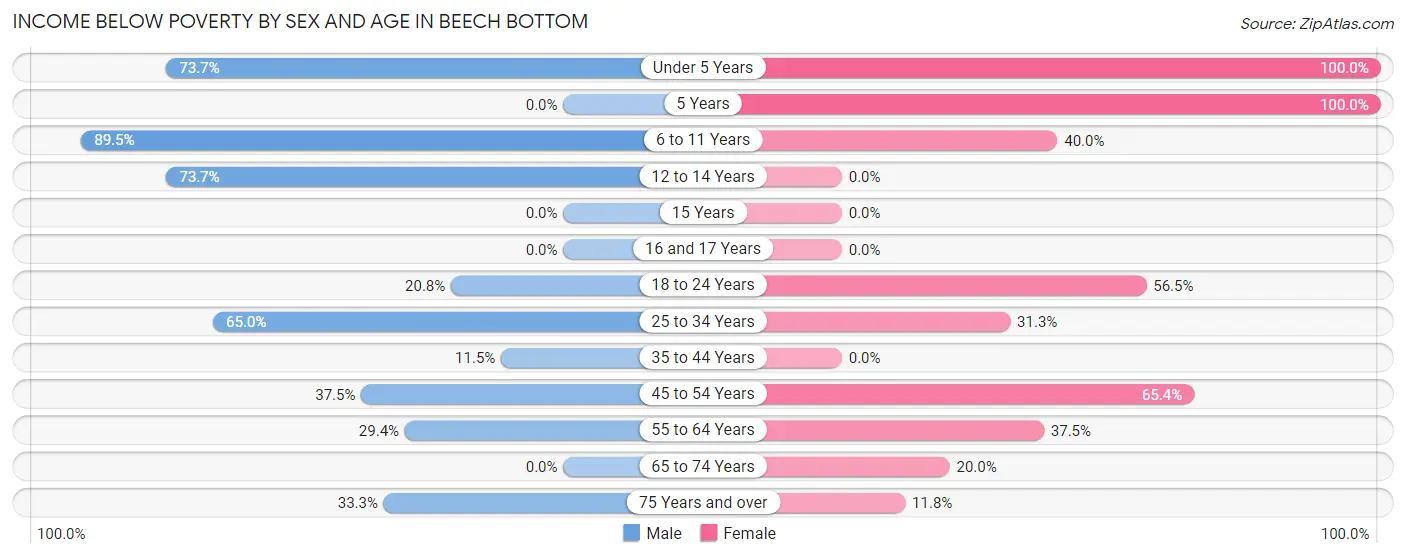
| Age Bracket | Male | Female |
| Under 5 Years | 14 (73.7%) | 41 (100.0%) |
| 5 Years | 0 (0.0%) | 3 (100.0%) |
| 6 to 11 Years | 17 (89.5%) | 8 (40.0%) |
| 12 to 14 Years | 14 (73.7%) | 0 (0.0%) |
| 15 Years | 0 (0.0%) | 0 (0.0%) |
| 16 and 17 Years | 0 (0.0%) | 0 (0.0%) |
| 18 to 24 Years | 5 (20.8%) | 13 (56.5%) |
| 25 to 34 Years | 26 (65.0%) | 10 (31.2%) |
| 35 to 44 Years | 3 (11.5%) | 0 (0.0%) |
| 45 to 54 Years | 9 (37.5%) | 68 (65.4%) |
| 55 to 64 Years | 10 (29.4%) | 18 (37.5%) |
| 65 to 74 Years | 0 (0.0%) | 3 (20.0%) |
| 75 Years and over | 3 (33.3%) | 2 (11.8%) |
| Total | 101 (36.9%) | 166 (49.7%) |
Income Above Poverty by Sex and Age in Beech Bottom
According to the poverty statistics in Beech Bottom, males aged 15 years and females aged 15 years are the age groups that are most secure financially, with 100.0% of males and 100.0% of females in these age groups living above the poverty line.
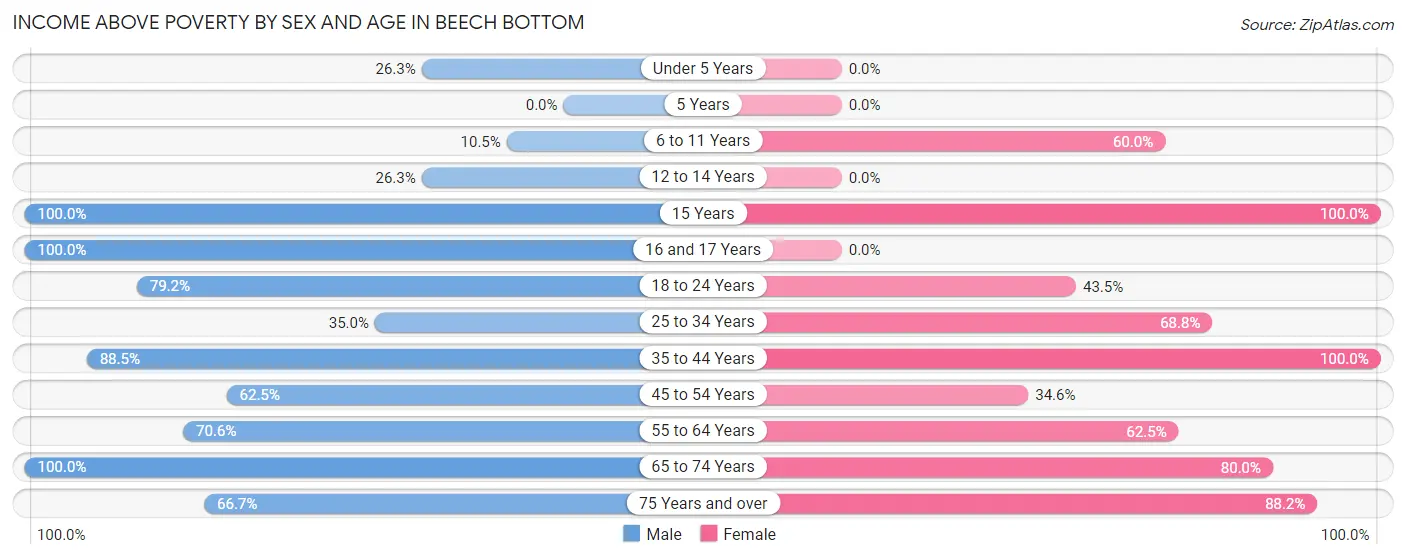
| Age Bracket | Male | Female |
| Under 5 Years | 5 (26.3%) | 0 (0.0%) |
| 5 Years | 0 (0.0%) | 0 (0.0%) |
| 6 to 11 Years | 2 (10.5%) | 12 (60.0%) |
| 12 to 14 Years | 5 (26.3%) | 0 (0.0%) |
| 15 Years | 4 (100.0%) | 2 (100.0%) |
| 16 and 17 Years | 14 (100.0%) | 0 (0.0%) |
| 18 to 24 Years | 19 (79.2%) | 10 (43.5%) |
| 25 to 34 Years | 14 (35.0%) | 22 (68.8%) |
| 35 to 44 Years | 23 (88.5%) | 29 (100.0%) |
| 45 to 54 Years | 15 (62.5%) | 36 (34.6%) |
| 55 to 64 Years | 24 (70.6%) | 30 (62.5%) |
| 65 to 74 Years | 42 (100.0%) | 12 (80.0%) |
| 75 Years and over | 6 (66.7%) | 15 (88.2%) |
| Total | 173 (63.1%) | 168 (50.3%) |
Income Below Poverty Among Married-Couple Families in Beech Bottom
The poverty statistics for married-couple families in Beech Bottom show that 9.0% or 6 of the total 67 families live below the poverty line. Families with 3 or 4 children have the highest poverty rate of 100.0%, comprising of 3 families. On the other hand, families with 1 or 2 children have the lowest poverty rate of 0.0%, which includes 0 families.
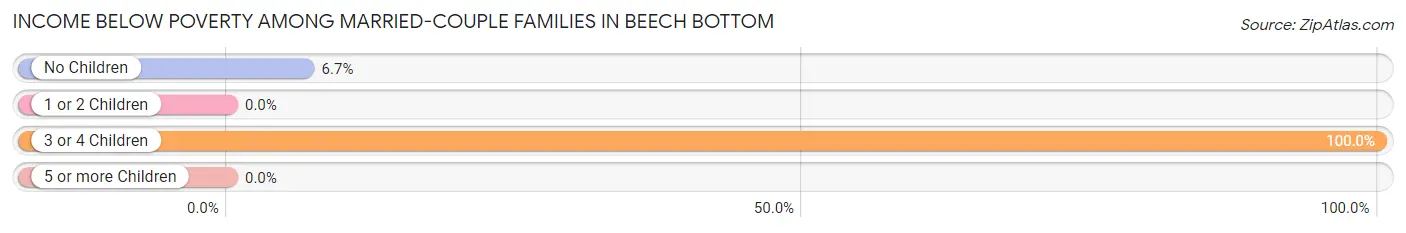
| Children | Above Poverty | Below Poverty |
| No Children | 42 (93.3%) | 3 (6.7%) |
| 1 or 2 Children | 19 (100.0%) | 0 (0.0%) |
| 3 or 4 Children | 0 (0.0%) | 3 (100.0%) |
| 5 or more Children | 0 (0.0%) | 0 (0.0%) |
| Total | 61 (91.0%) | 6 (9.0%) |
Income Below Poverty Among Single-Parent Households in Beech Bottom
According to the poverty data in Beech Bottom, 25.0% or 2 single-father households and 78.1% or 25 single-mother households are living below the poverty line. Among single-father households, those with 1 or 2 children have the highest poverty rate, with 2 households (25.0%) experiencing poverty. Likewise, among single-mother households, those with 1 or 2 children have the highest poverty rate, with 4 households (100.0%) falling below the poverty line.
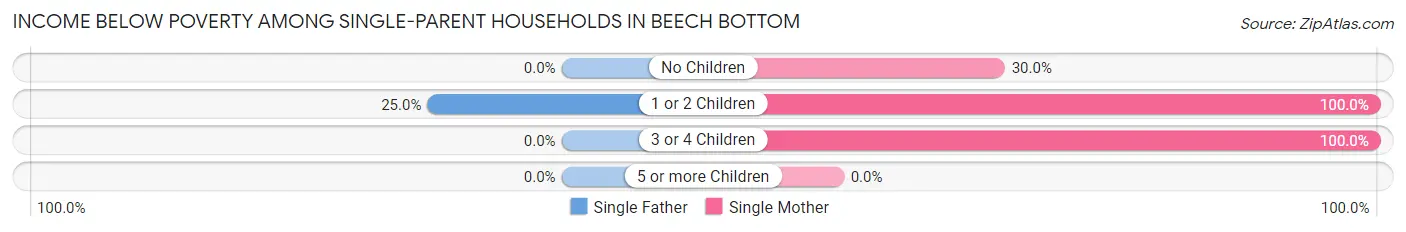
| Children | Single Father | Single Mother |
| No Children | 0 (0.0%) | 3 (30.0%) |
| 1 or 2 Children | 2 (25.0%) | 4 (100.0%) |
| 3 or 4 Children | 0 (0.0%) | 18 (100.0%) |
| 5 or more Children | 0 (0.0%) | 0 (0.0%) |
| Total | 2 (25.0%) | 25 (78.1%) |
Income Below Poverty Among Married-Couple vs Single-Parent Households in Beech Bottom
The poverty data for Beech Bottom shows that 6 of the married-couple family households (9.0%) and 27 of the single-parent households (67.5%) are living below the poverty level. Within the married-couple family households, those with 3 or 4 children have the highest poverty rate, with 3 households (100.0%) falling below the poverty line. Among the single-parent households, those with 3 or 4 children have the highest poverty rate, with 18 household (100.0%) living below poverty.

| Children | Married-Couple Families | Single-Parent Households |
| No Children | 3 (6.7%) | 3 (30.0%) |
| 1 or 2 Children | 0 (0.0%) | 6 (50.0%) |
| 3 or 4 Children | 3 (100.0%) | 18 (100.0%) |
| 5 or more Children | 0 (0.0%) | 0 (0.0%) |
| Total | 6 (9.0%) | 27 (67.5%) |
Race in Beech Bottom
The most populous races in Beech Bottom are White / Caucasian (589 | 93.9%), Two or more Races (28 | 4.5%), and Black / African American (9 | 1.4%).
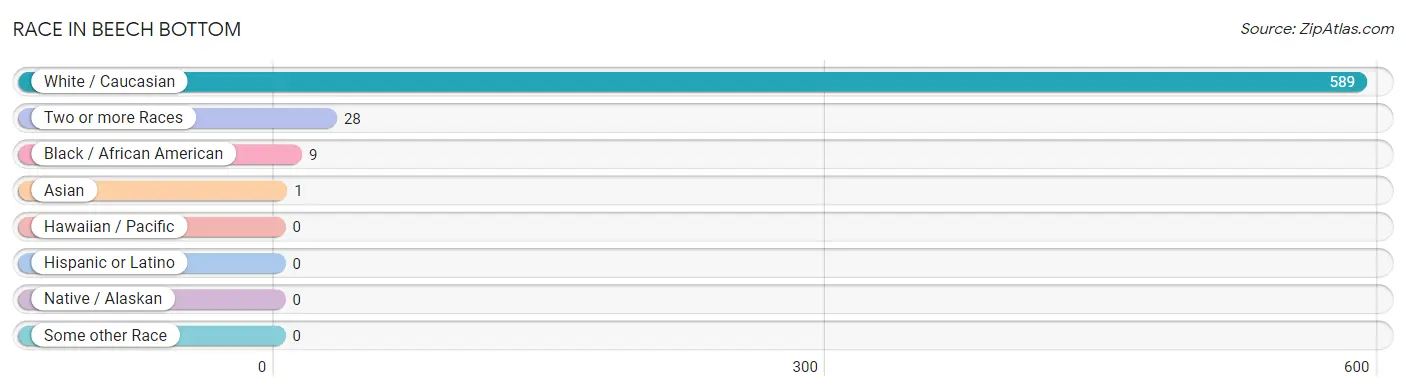
| Race | # Population | % Population |
| Asian | 1 | 0.2% |
| Black / African American | 9 | 1.4% |
| Hawaiian / Pacific | 0 | 0.0% |
| Hispanic or Latino | 0 | 0.0% |
| Native / Alaskan | 0 | 0.0% |
| White / Caucasian | 589 | 93.9% |
| Two or more Races | 28 | 4.5% |
| Some other Race | 0 | 0.0% |
| Total | 627 | 100.0% |
Ancestry in Beech Bottom
The most populous ancestries reported in Beech Bottom are Irish (119 | 19.0%), English (75 | 12.0%), German (73 | 11.6%), Hungarian (32 | 5.1%), and Polish (29 | 4.6%), together accounting for 52.3% of all Beech Bottom residents.
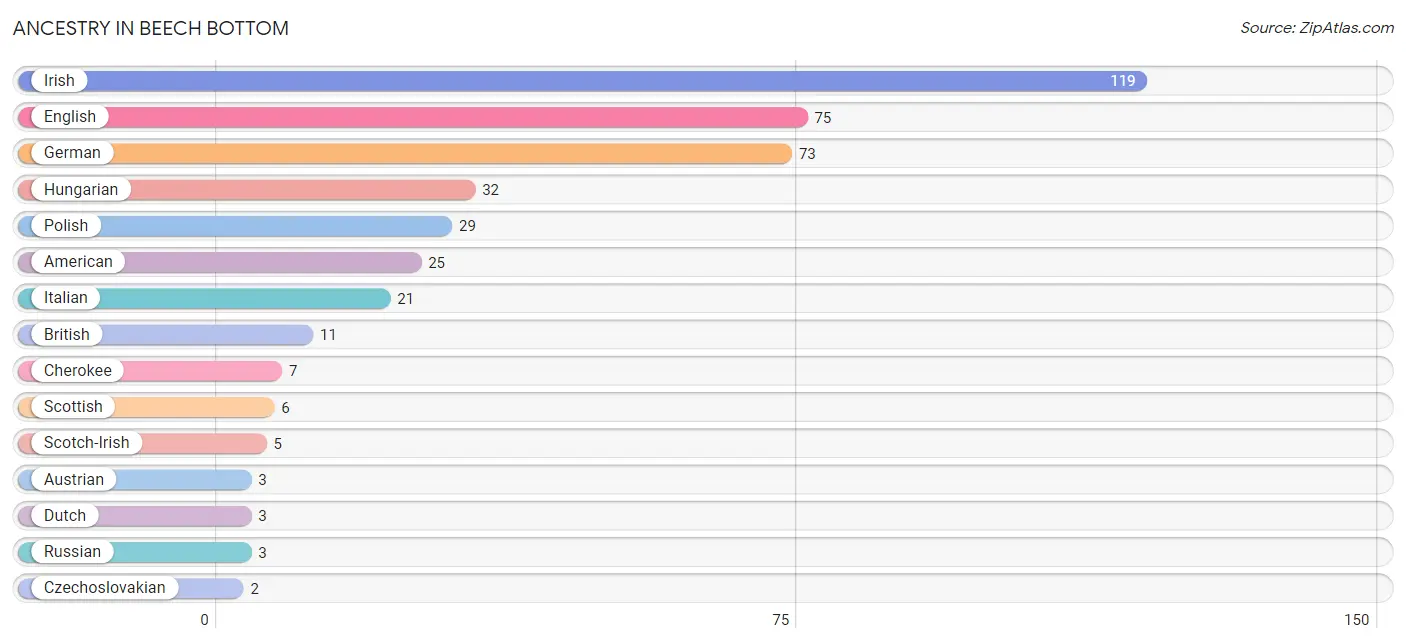
| Ancestry | # Population | % Population |
| American | 25 | 4.0% |
| Austrian | 3 | 0.5% |
| British | 11 | 1.8% |
| Cherokee | 7 | 1.1% |
| Czechoslovakian | 2 | 0.3% |
| Dutch | 3 | 0.5% |
| English | 75 | 12.0% |
| French | 1 | 0.2% |
| German | 73 | 11.6% |
| Hungarian | 32 | 5.1% |
| Irish | 119 | 19.0% |
| Italian | 21 | 3.4% |
| Korean | 1 | 0.2% |
| Polish | 29 | 4.6% |
| Russian | 3 | 0.5% |
| Scotch-Irish | 5 | 0.8% |
| Scottish | 6 | 1.0% | View All 17 Rows |
Immigrants in Beech Bottom
The most numerous immigrant groups reported in Beech Bottom came from Asia (1 | 0.2%), Philippines (1 | 0.2%), and South Eastern Asia (1 | 0.2%), together accounting for 0.5% of all Beech Bottom residents.
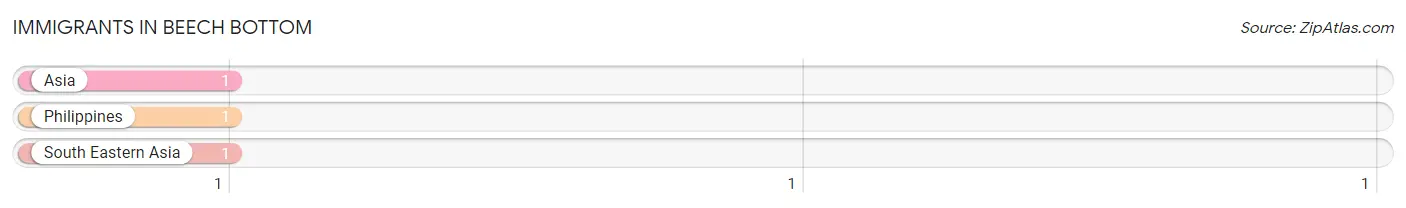
| Immigration Origin | # Population | % Population |
| Asia | 1 | 0.2% |
| Philippines | 1 | 0.2% |
| South Eastern Asia | 1 | 0.2% | View All 3 Rows |
Sex and Age in Beech Bottom
Sex and Age in Beech Bottom
The most populous age groups in Beech Bottom are 65 to 69 Years (34 | 12.4%) for men and 50 to 54 Years (67 | 19.0%) for women.
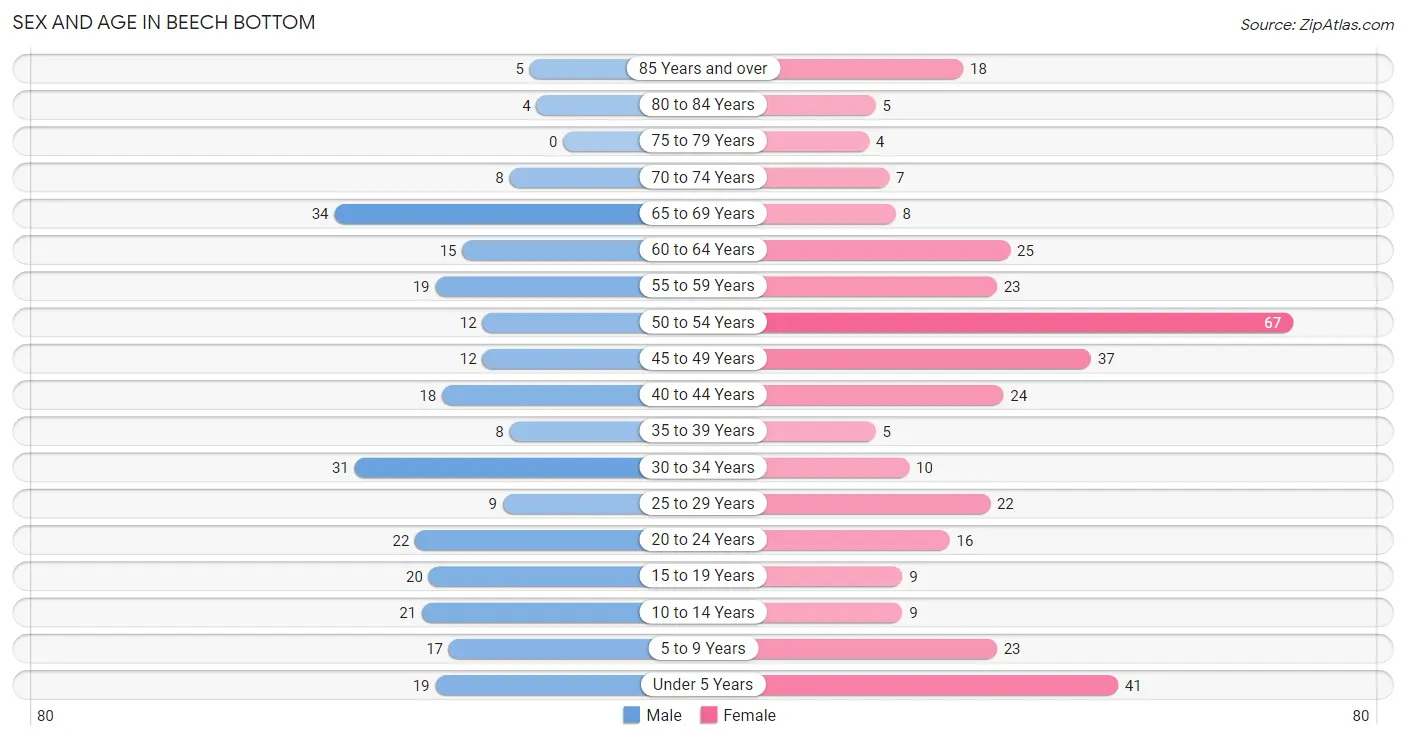
| Age Bracket | Male | Female |
| Under 5 Years | 19 (6.9%) | 41 (11.6%) |
| 5 to 9 Years | 17 (6.2%) | 23 (6.5%) |
| 10 to 14 Years | 21 (7.7%) | 9 (2.5%) |
| 15 to 19 Years | 20 (7.3%) | 9 (2.5%) |
| 20 to 24 Years | 22 (8.0%) | 16 (4.5%) |
| 25 to 29 Years | 9 (3.3%) | 22 (6.2%) |
| 30 to 34 Years | 31 (11.3%) | 10 (2.8%) |
| 35 to 39 Years | 8 (2.9%) | 5 (1.4%) |
| 40 to 44 Years | 18 (6.6%) | 24 (6.8%) |
| 45 to 49 Years | 12 (4.4%) | 37 (10.5%) |
| 50 to 54 Years | 12 (4.4%) | 67 (19.0%) |
| 55 to 59 Years | 19 (6.9%) | 23 (6.5%) |
| 60 to 64 Years | 15 (5.5%) | 25 (7.1%) |
| 65 to 69 Years | 34 (12.4%) | 8 (2.3%) |
| 70 to 74 Years | 8 (2.9%) | 7 (2.0%) |
| 75 to 79 Years | 0 (0.0%) | 4 (1.1%) |
| 80 to 84 Years | 4 (1.5%) | 5 (1.4%) |
| 85 Years and over | 5 (1.8%) | 18 (5.1%) |
| Total | 274 (100.0%) | 353 (100.0%) |
Families and Households in Beech Bottom
Median Family Size in Beech Bottom
The median family size in Beech Bottom is 3.86 persons per family, with single male/father families (8 | 7.5%) accounting for the largest median family size of 6.38 persons per family. On the other hand, married-couple families (67 | 62.6%) represent the smallest median family size with 3.43 persons per family.
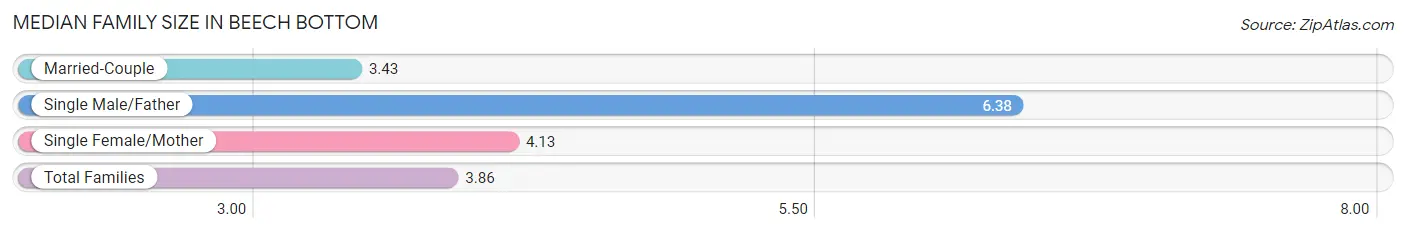
| Family Type | # Families | Family Size |
| Married-Couple | 67 (62.6%) | 3.43 |
| Single Male/Father | 8 (7.5%) | 6.38 |
| Single Female/Mother | 32 (29.9%) | 4.13 |
| Total Families | 107 (100.0%) | 3.86 |
Median Household Size in Beech Bottom
The median household size in Beech Bottom is 2.59 persons per household, with single male/father households (8 | 3.4%) accounting for the largest median household size of 11 persons per household. non-family households (131 | 55.0%) represent the smallest median household size with 1.18 persons per household.
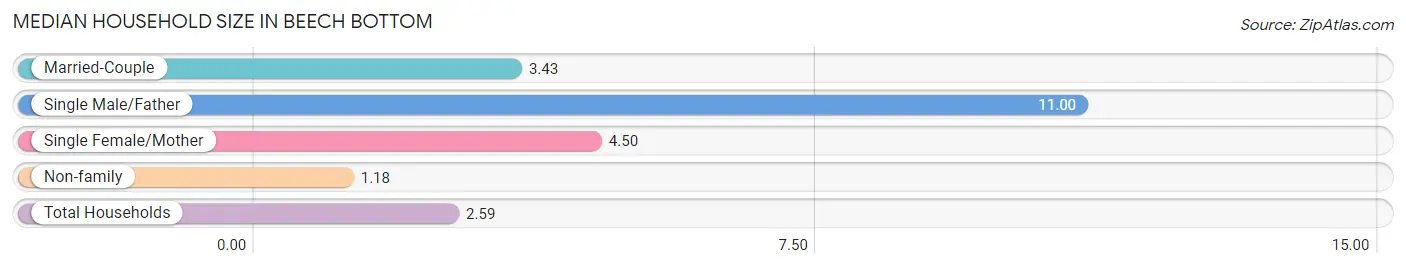
| Household Type | # Households | Household Size |
| Married-Couple | 67 (28.1%) | 3.43 |
| Single Male/Father | 8 (3.4%) | 11.00 |
| Single Female/Mother | 32 (13.5%) | 4.50 |
| Non-family | 131 (55.0%) | 1.18 |
| Total Households | 238 (100.0%) | 2.59 |
Household Size by Marriage Status in Beech Bottom
Out of a total of 238 households in Beech Bottom, 107 (45.0%) are family households, while 131 (55.0%) are nonfamily households. The most numerous type of family households are 2-person households, comprising 40, and the most common type of nonfamily households are 1-person households, comprising 112.
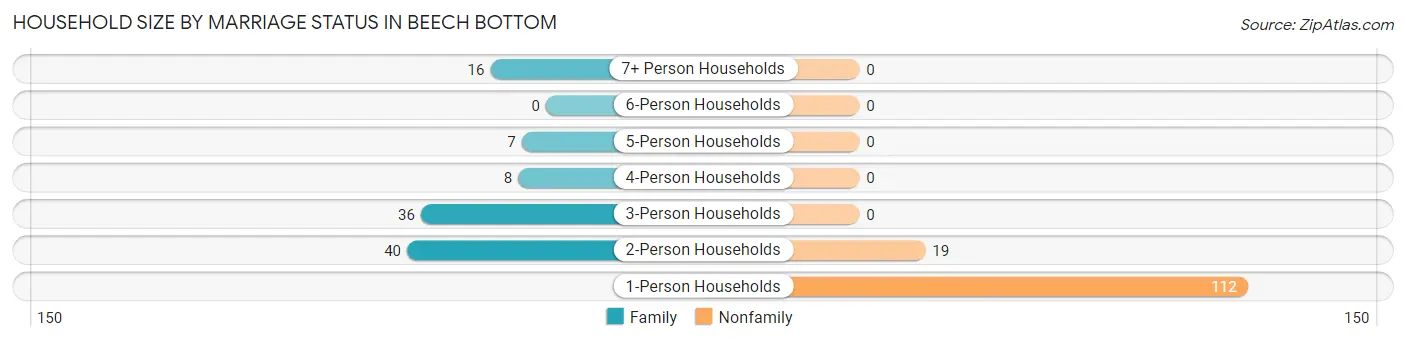
| Household Size | Family Households | Nonfamily Households |
| 1-Person Households | - | 112 (47.1%) |
| 2-Person Households | 40 (16.8%) | 19 (8.0%) |
| 3-Person Households | 36 (15.1%) | 0 (0.0%) |
| 4-Person Households | 8 (3.4%) | 0 (0.0%) |
| 5-Person Households | 7 (2.9%) | 0 (0.0%) |
| 6-Person Households | 0 (0.0%) | 0 (0.0%) |
| 7+ Person Households | 16 (6.7%) | 0 (0.0%) |
| Total | 107 (45.0%) | 131 (55.0%) |
Female Fertility in Beech Bottom
Fertility by Age in Beech Bottom
Average fertility rate in Beech Bottom is 118.0 births per 1,000 women. Women in the age bracket of 15 to 19 years have the highest fertility rate with 778.0 births per 1,000 women. Women in the age bracket of 20 to 34 years acount for 53.3% of all women with births.
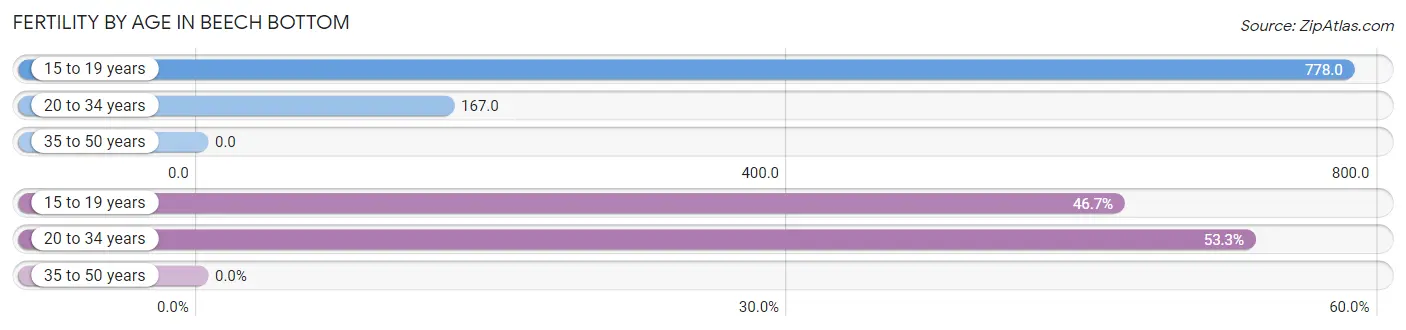
| Age Bracket | Women with Births | Births / 1,000 Women |
| 15 to 19 years | 7 (46.7%) | 778.0 |
| 20 to 34 years | 8 (53.3%) | 167.0 |
| 35 to 50 years | 0 (0.0%) | 0.0 |
| Total | 15 (100.0%) | 118.0 |
Fertility by Age by Marriage Status in Beech Bottom
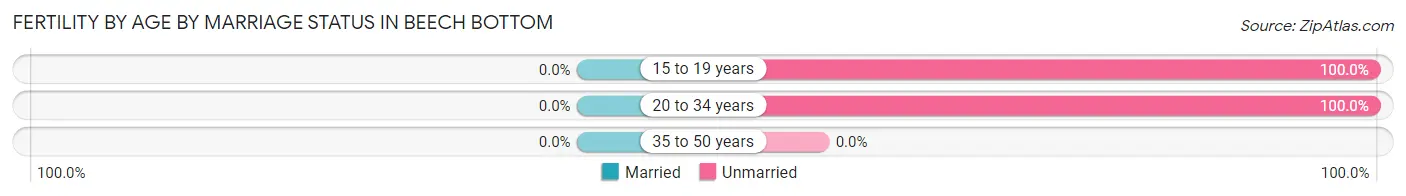
| Age Bracket | Married | Unmarried |
| 15 to 19 years | 0 (0.0%) | 7 (100.0%) |
| 20 to 34 years | 0 (0.0%) | 8 (100.0%) |
| 35 to 50 years | 0 (0.0%) | 0 (0.0%) |
| Total | 0 (0.0%) | 15 (100.0%) |
Fertility by Education in Beech Bottom
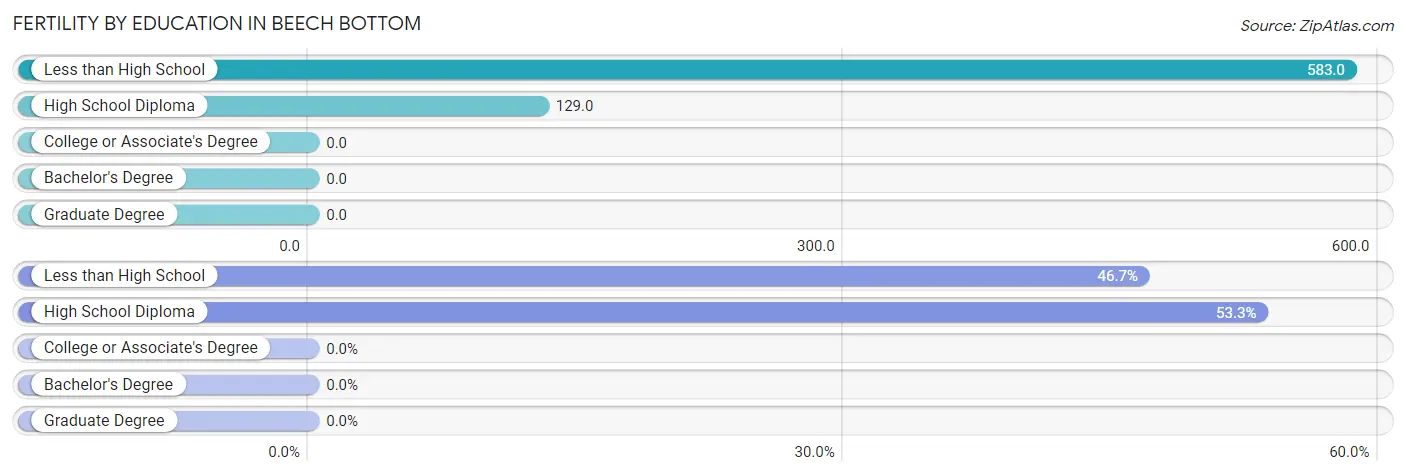
| Educational Attainment | Women with Births | Births / 1,000 Women |
| Less than High School | 7 (46.7%) | 583.0 |
| High School Diploma | 8 (53.3%) | 129.0 |
| College or Associate's Degree | 0 (0.0%) | 0.0 |
| Bachelor's Degree | 0 (0.0%) | 0.0 |
| Graduate Degree | 0 (0.0%) | 0.0 |
| Total | 15 (100.0%) | 118.0 |
Fertility by Education by Marriage Status in Beech Bottom
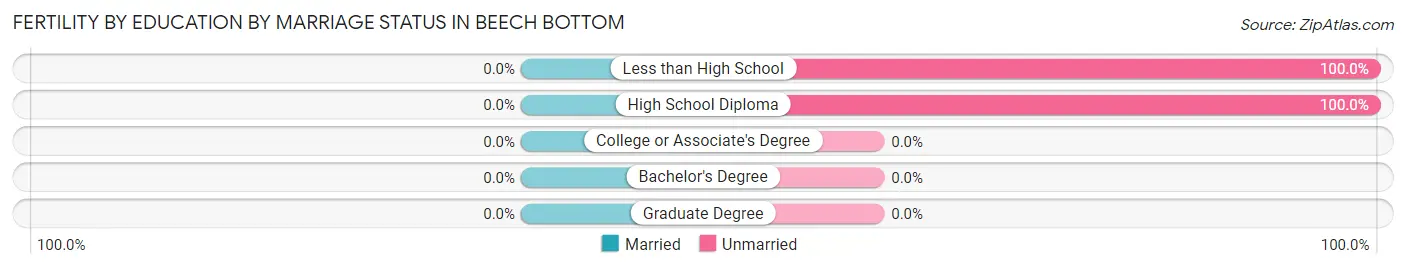
| Educational Attainment | Married | Unmarried |
| Less than High School | 0 (0.0%) | 7 (100.0%) |
| High School Diploma | 0 (0.0%) | 8 (100.0%) |
| College or Associate's Degree | 0 (0.0%) | 0 (0.0%) |
| Bachelor's Degree | 0 (0.0%) | 0 (0.0%) |
| Graduate Degree | 0 (0.0%) | 0 (0.0%) |
| Total | 0 (0.0%) | 15 (100.0%) |
Employment Characteristics in Beech Bottom
Employment by Class of Employer in Beech Bottom
Among the 279 employed individuals in Beech Bottom, private company employees (208 | 74.6%), not-for-profit organizations (32 | 11.5%), and self-employed (incorporated) (19 | 6.8%) make up the most common classes of employment.
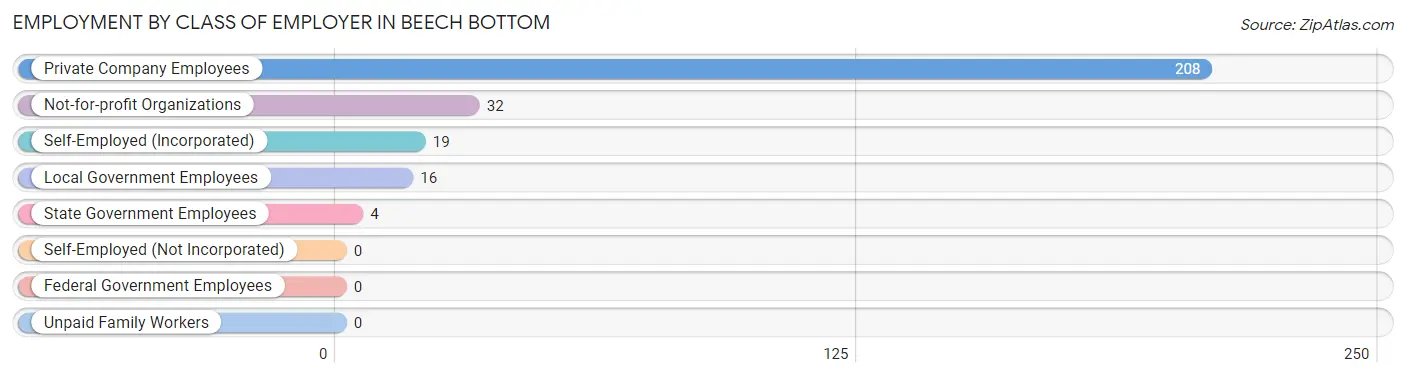
| Employer Class | # Employees | % Employees |
| Private Company Employees | 208 | 74.6% |
| Self-Employed (Incorporated) | 19 | 6.8% |
| Self-Employed (Not Incorporated) | 0 | 0.0% |
| Not-for-profit Organizations | 32 | 11.5% |
| Local Government Employees | 16 | 5.7% |
| State Government Employees | 4 | 1.4% |
| Federal Government Employees | 0 | 0.0% |
| Unpaid Family Workers | 0 | 0.0% |
| Total | 279 | 100.0% |
Employment Status by Age in Beech Bottom
According to the labor force statistics for Beech Bottom, out of the total population over 16 years of age (491), 63.5% or 312 individuals are in the labor force, with 6.4% or 20 of them unemployed. The age group with the highest labor force participation rate is 16 to 19 years, with 100.0% or 23 individuals in the labor force. Within the labor force, the 30 to 34 years age range has the highest percentage of unemployed individuals, with 45.8% or 11 of them being unemployed.
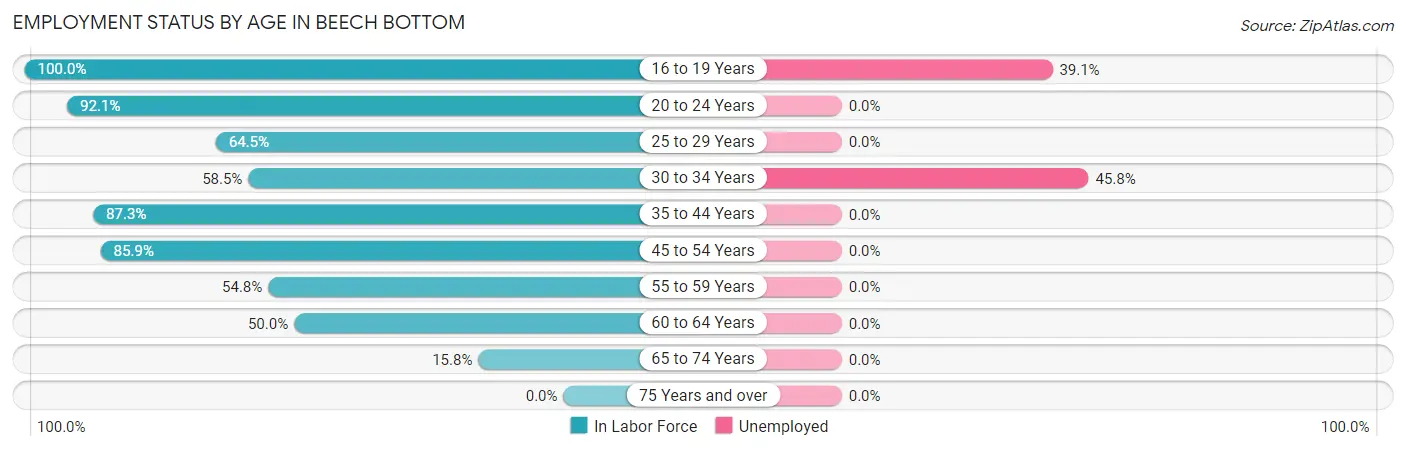
| Age Bracket | In Labor Force | Unemployed |
| 16 to 19 Years | 23 (100.0%) | 9 (39.1%) |
| 20 to 24 Years | 35 (92.1%) | 0 (0.0%) |
| 25 to 29 Years | 20 (64.5%) | 0 (0.0%) |
| 30 to 34 Years | 24 (58.5%) | 11 (45.8%) |
| 35 to 44 Years | 48 (87.3%) | 0 (0.0%) |
| 45 to 54 Years | 110 (85.9%) | 0 (0.0%) |
| 55 to 59 Years | 23 (54.8%) | 0 (0.0%) |
| 60 to 64 Years | 20 (50.0%) | 0 (0.0%) |
| 65 to 74 Years | 9 (15.8%) | 0 (0.0%) |
| 75 Years and over | 0 (0.0%) | 0 (0.0%) |
| Total | 312 (63.5%) | 20 (6.4%) |
Employment Status by Educational Attainment in Beech Bottom
According to labor force statistics for Beech Bottom, 72.7% of individuals (245) out of the total population between 25 and 64 years of age (337) are in the labor force, with 4.5% or 11 of them being unemployed. The group with the highest labor force participation rate are those with the educational attainment of bachelor's degree or higher, with 92.7% or 38 individuals in the labor force. Within the labor force, individuals with less than high school education have the highest percentage of unemployment, with 62.5% or 10 of them being unemployed.
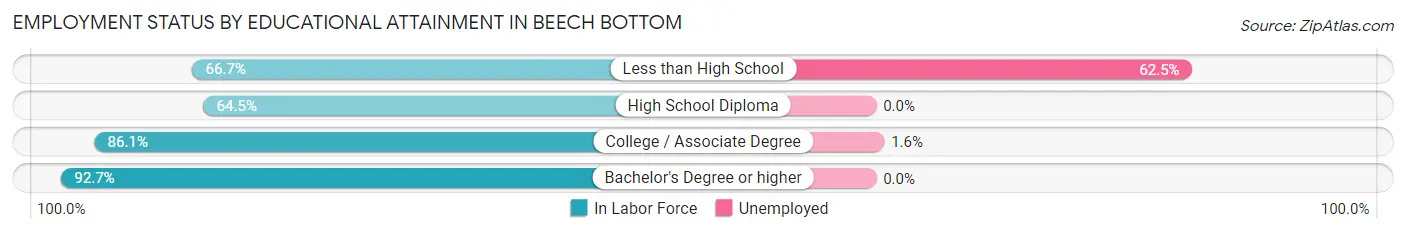
| Educational Attainment | In Labor Force | Unemployed |
| Less than High School | 16 (66.7%) | 15 (62.5%) |
| High School Diploma | 129 (64.5%) | 0 (0.0%) |
| College / Associate Degree | 62 (86.1%) | 1 (1.6%) |
| Bachelor's Degree or higher | 38 (92.7%) | 0 (0.0%) |
| Total | 245 (72.7%) | 15 (4.5%) |
Employment Occupations by Sex in Beech Bottom
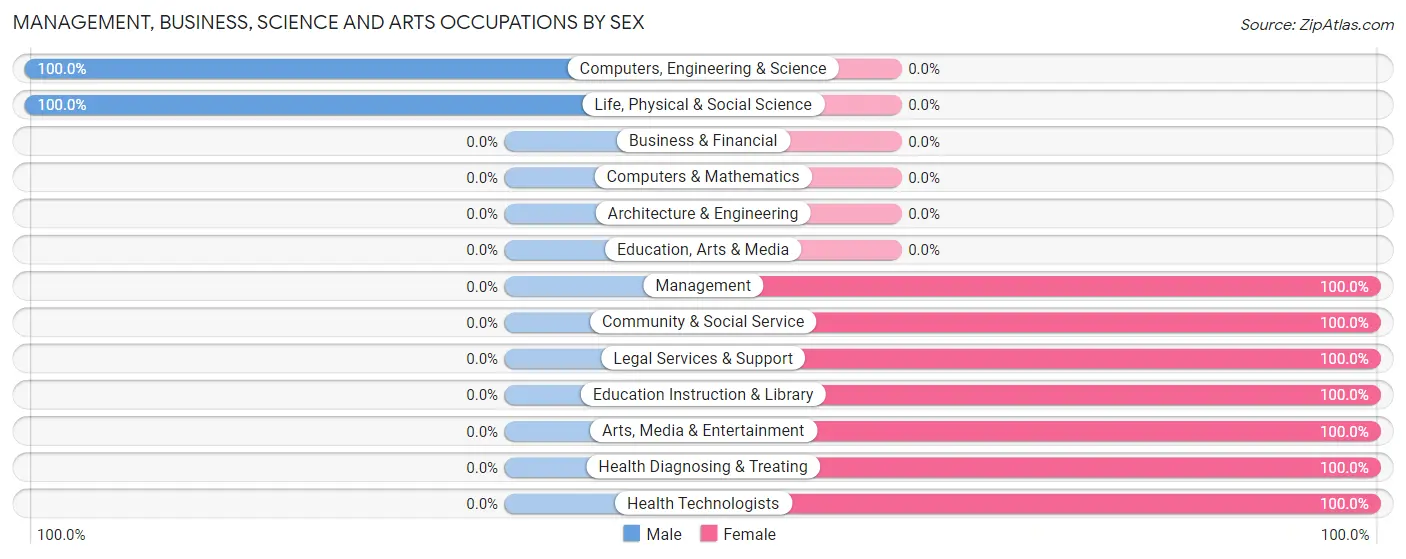
Management, Business, Science and Arts Occupations
The most common Management, Business, Science and Arts occupations in Beech Bottom are Management (18 | 6.2%), Community & Social Service (10 | 3.4%), Health Diagnosing & Treating (8 | 2.7%), Education Instruction & Library (6 | 2.1%), and Arts, Media & Entertainment (3 | 1.0%).
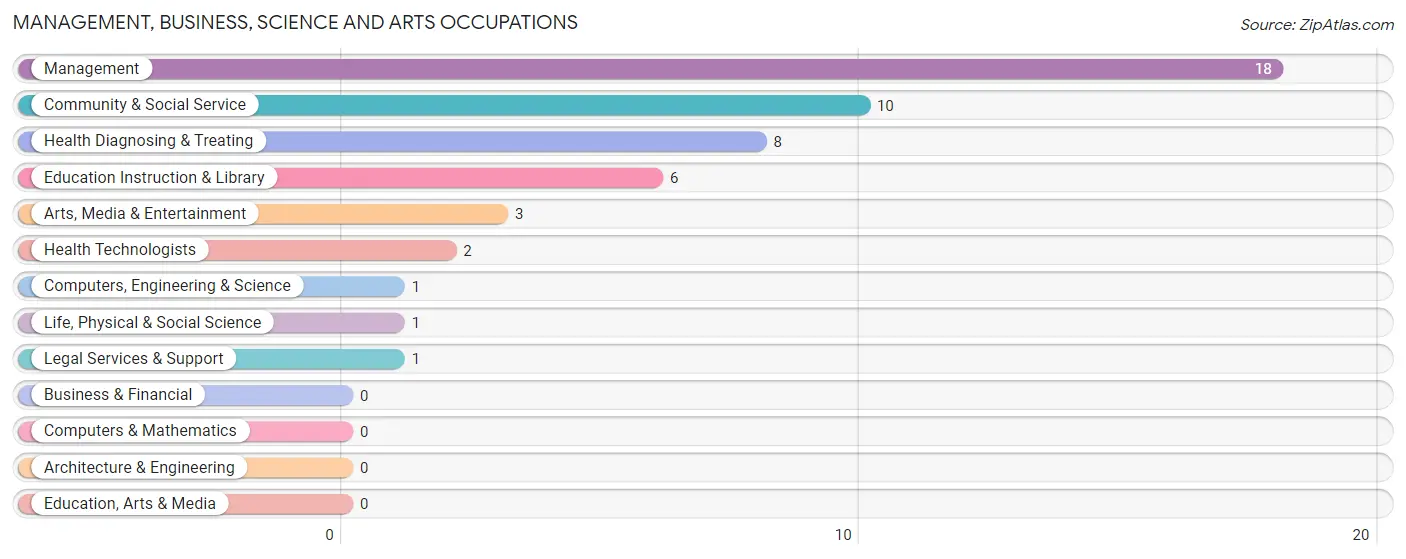
Management, Business, Science and Arts Occupations by Sex
Within the Management, Business, Science and Arts occupations in Beech Bottom, the most male-oriented occupations are Computers, Engineering & Science (100.0%), and Life, Physical & Social Science (100.0%), while the most female-oriented occupations are Management (100.0%), Community & Social Service (100.0%), and Legal Services & Support (100.0%).
| Occupation | Male | Female |
| Management | 0 (0.0%) | 18 (100.0%) |
| Business & Financial | 0 (0.0%) | 0 (0.0%) |
| Computers, Engineering & Science | 1 (100.0%) | 0 (0.0%) |
| Computers & Mathematics | 0 (0.0%) | 0 (0.0%) |
| Architecture & Engineering | 0 (0.0%) | 0 (0.0%) |
| Life, Physical & Social Science | 1 (100.0%) | 0 (0.0%) |
| Community & Social Service | 0 (0.0%) | 10 (100.0%) |
| Education, Arts & Media | 0 (0.0%) | 0 (0.0%) |
| Legal Services & Support | 0 (0.0%) | 1 (100.0%) |
| Education Instruction & Library | 0 (0.0%) | 6 (100.0%) |
| Arts, Media & Entertainment | 0 (0.0%) | 3 (100.0%) |
| Health Diagnosing & Treating | 0 (0.0%) | 8 (100.0%) |
| Health Technologists | 0 (0.0%) | 2 (100.0%) |
| Total (Category) | 1 (2.7%) | 36 (97.3%) |
| Total (Overall) | 113 (38.7%) | 179 (61.3%) |
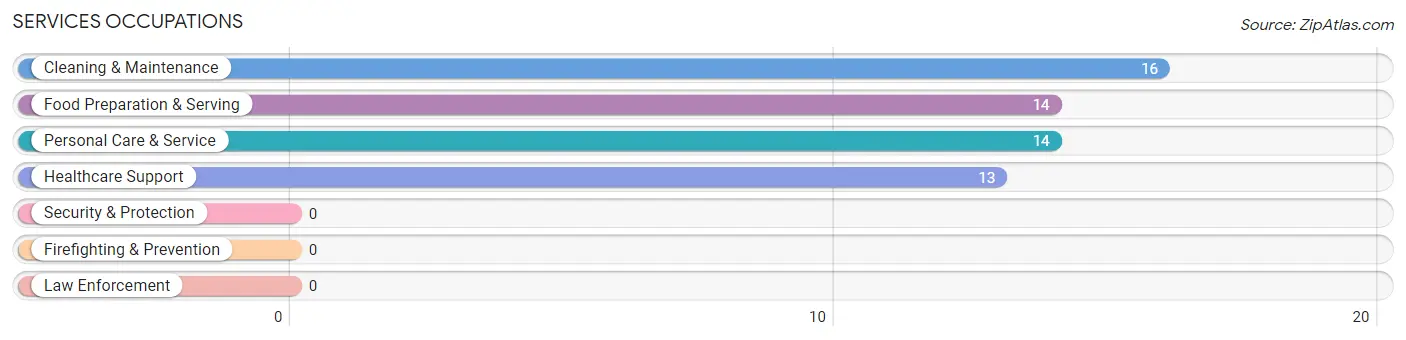
Services Occupations
The most common Services occupations in Beech Bottom are Cleaning & Maintenance (16 | 5.5%), Food Preparation & Serving (14 | 4.8%), Personal Care & Service (14 | 4.8%), and Healthcare Support (13 | 4.4%).
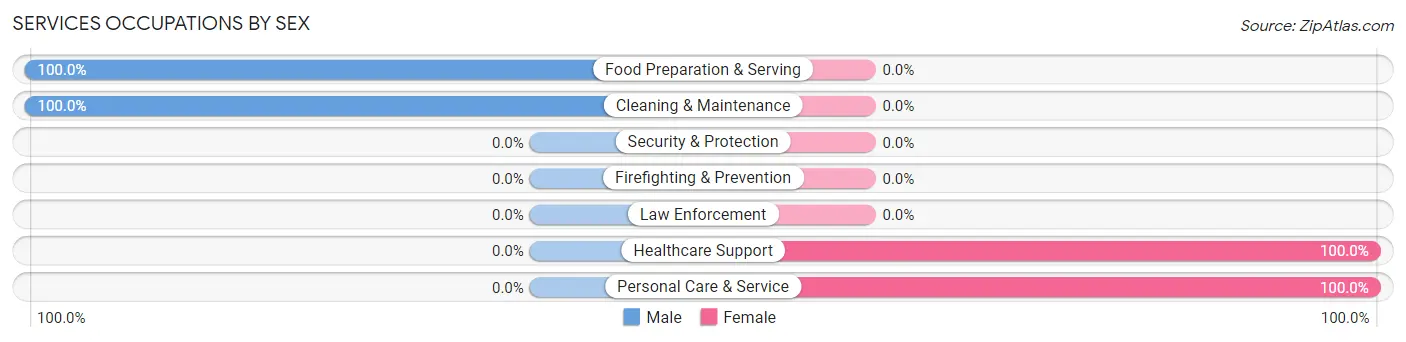
Services Occupations by Sex
Within the Services occupations in Beech Bottom, the most male-oriented occupations are Food Preparation & Serving (100.0%), and Cleaning & Maintenance (100.0%), while the most female-oriented occupations are Healthcare Support (100.0%), and Personal Care & Service (100.0%).
| Occupation | Male | Female |
| Healthcare Support | 0 (0.0%) | 13 (100.0%) |
| Security & Protection | 0 (0.0%) | 0 (0.0%) |
| Firefighting & Prevention | 0 (0.0%) | 0 (0.0%) |
| Law Enforcement | 0 (0.0%) | 0 (0.0%) |
| Food Preparation & Serving | 14 (100.0%) | 0 (0.0%) |
| Cleaning & Maintenance | 16 (100.0%) | 0 (0.0%) |
| Personal Care & Service | 0 (0.0%) | 14 (100.0%) |
| Total (Category) | 30 (52.6%) | 27 (47.4%) |
| Total (Overall) | 113 (38.7%) | 179 (61.3%) |
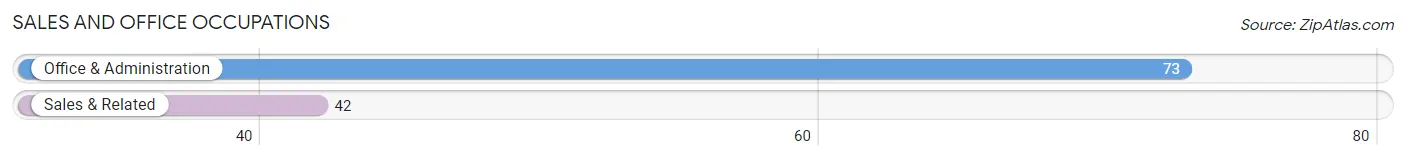
Sales and Office Occupations
The most common Sales and Office occupations in Beech Bottom are Office & Administration (73 | 25.0%), and Sales & Related (42 | 14.4%).
Sales and Office Occupations by Sex
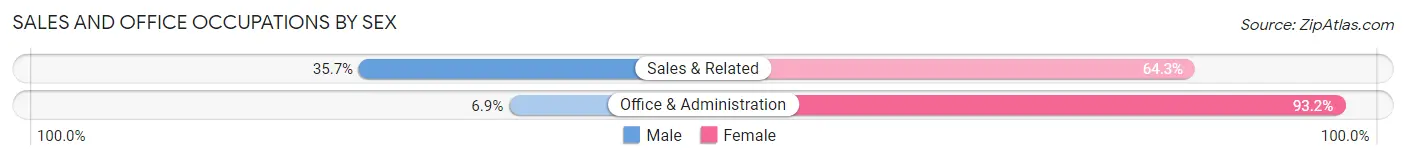
| Occupation | Male | Female |
| Sales & Related | 15 (35.7%) | 27 (64.3%) |
| Office & Administration | 5 (6.9%) | 68 (93.1%) |
| Total (Category) | 20 (17.4%) | 95 (82.6%) |
| Total (Overall) | 113 (38.7%) | 179 (61.3%) |
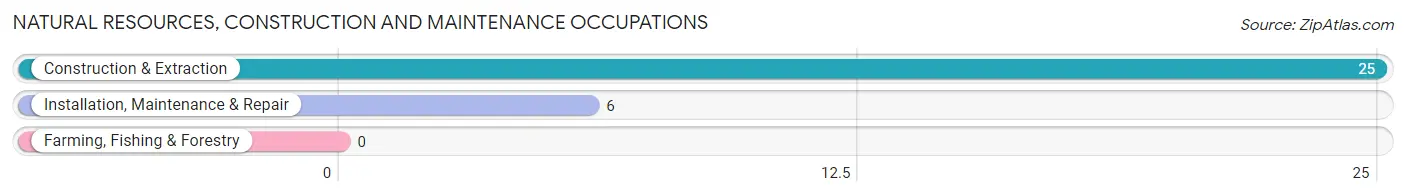
Natural Resources, Construction and Maintenance Occupations
The most common Natural Resources, Construction and Maintenance occupations in Beech Bottom are Construction & Extraction (25 | 8.6%), and Installation, Maintenance & Repair (6 | 2.1%).
Natural Resources, Construction and Maintenance Occupations by Sex
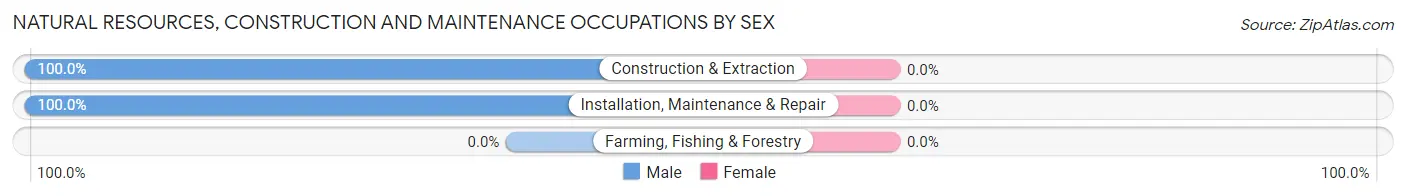
| Occupation | Male | Female |
| Farming, Fishing & Forestry | 0 (0.0%) | 0 (0.0%) |
| Construction & Extraction | 25 (100.0%) | 0 (0.0%) |
| Installation, Maintenance & Repair | 6 (100.0%) | 0 (0.0%) |
| Total (Category) | 31 (100.0%) | 0 (0.0%) |
| Total (Overall) | 113 (38.7%) | 179 (61.3%) |
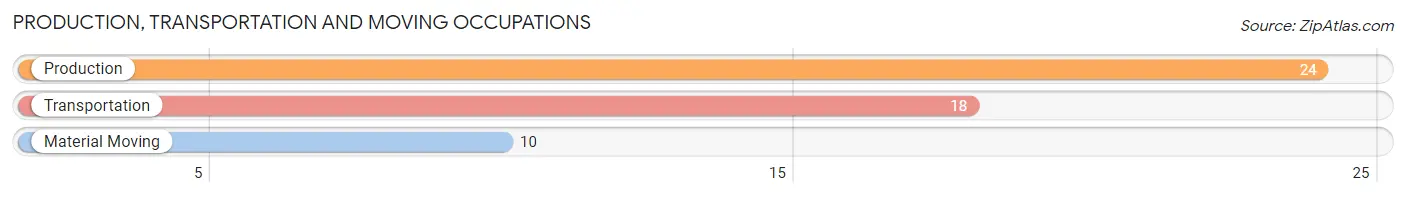
Production, Transportation and Moving Occupations
The most common Production, Transportation and Moving occupations in Beech Bottom are Production (24 | 8.2%), Transportation (18 | 6.2%), and Material Moving (10 | 3.4%).
Production, Transportation and Moving Occupations by Sex
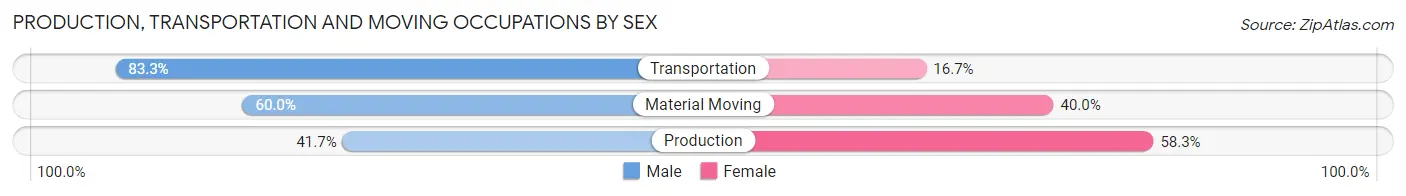
| Occupation | Male | Female |
| Production | 10 (41.7%) | 14 (58.3%) |
| Transportation | 15 (83.3%) | 3 (16.7%) |
| Material Moving | 6 (60.0%) | 4 (40.0%) |
| Total (Category) | 31 (59.6%) | 21 (40.4%) |
| Total (Overall) | 113 (38.7%) | 179 (61.3%) |
Employment Industries by Sex in Beech Bottom
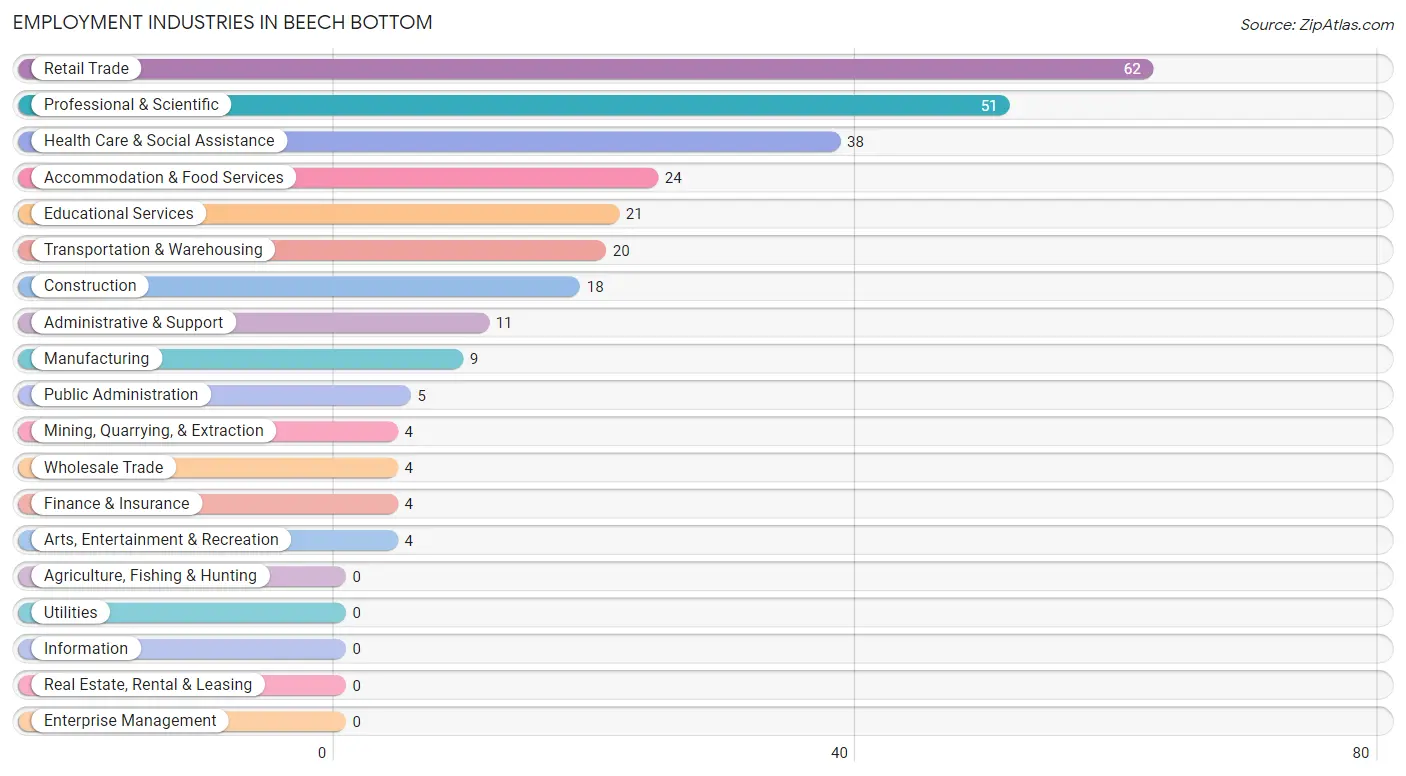
Employment Industries in Beech Bottom
The major employment industries in Beech Bottom include Retail Trade (62 | 21.2%), Professional & Scientific (51 | 17.5%), Health Care & Social Assistance (38 | 13.0%), Accommodation & Food Services (24 | 8.2%), and Educational Services (21 | 7.2%).
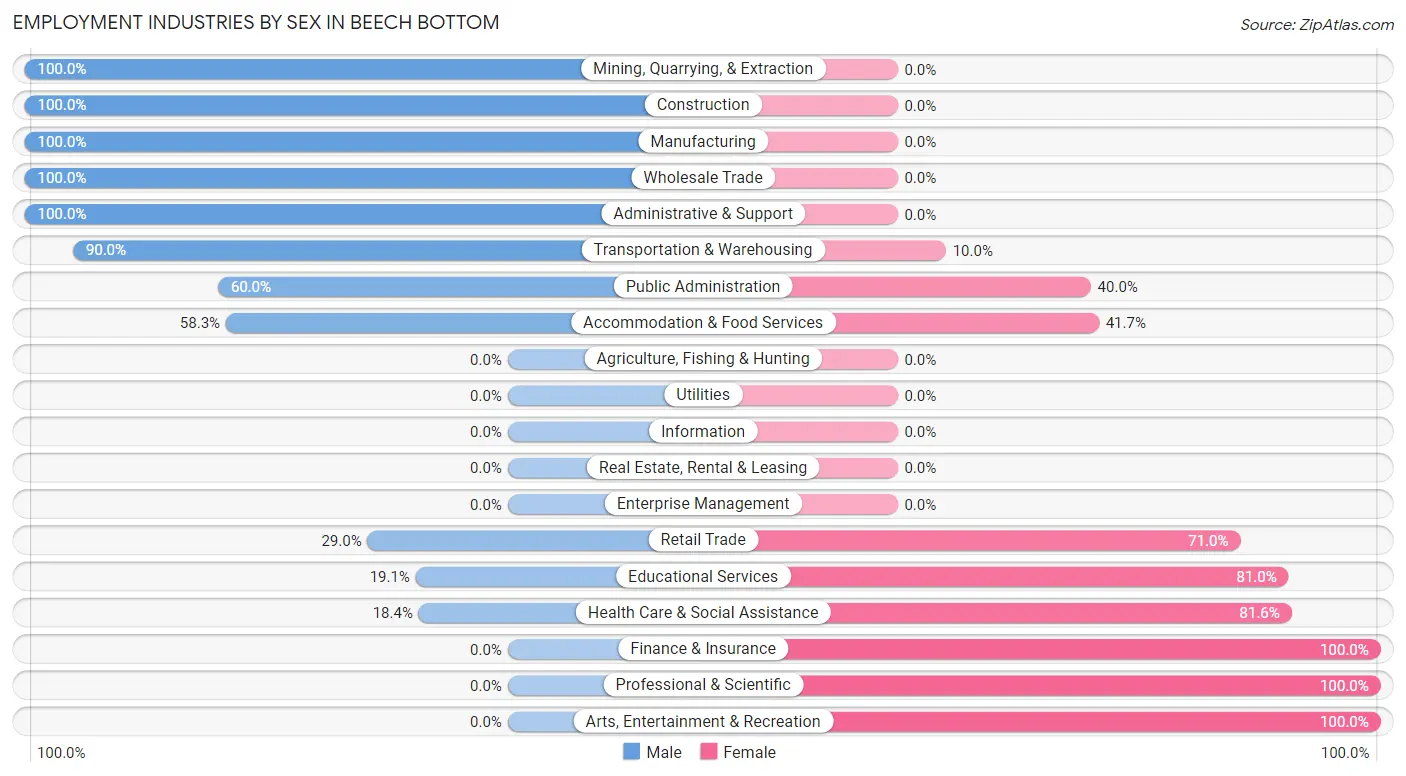
Employment Industries by Sex in Beech Bottom
The Beech Bottom industries that see more men than women are Mining, Quarrying, & Extraction (100.0%), Construction (100.0%), and Manufacturing (100.0%), whereas the industries that tend to have a higher number of women are Finance & Insurance (100.0%), Professional & Scientific (100.0%), and Arts, Entertainment & Recreation (100.0%).
| Industry | Male | Female |
| Agriculture, Fishing & Hunting | 0 (0.0%) | 0 (0.0%) |
| Mining, Quarrying, & Extraction | 4 (100.0%) | 0 (0.0%) |
| Construction | 18 (100.0%) | 0 (0.0%) |
| Manufacturing | 9 (100.0%) | 0 (0.0%) |
| Wholesale Trade | 4 (100.0%) | 0 (0.0%) |
| Retail Trade | 18 (29.0%) | 44 (71.0%) |
| Transportation & Warehousing | 18 (90.0%) | 2 (10.0%) |
| Utilities | 0 (0.0%) | 0 (0.0%) |
| Information | 0 (0.0%) | 0 (0.0%) |
| Finance & Insurance | 0 (0.0%) | 4 (100.0%) |
| Real Estate, Rental & Leasing | 0 (0.0%) | 0 (0.0%) |
| Professional & Scientific | 0 (0.0%) | 51 (100.0%) |
| Enterprise Management | 0 (0.0%) | 0 (0.0%) |
| Administrative & Support | 11 (100.0%) | 0 (0.0%) |
| Educational Services | 4 (19.1%) | 17 (80.9%) |
| Health Care & Social Assistance | 7 (18.4%) | 31 (81.6%) |
| Arts, Entertainment & Recreation | 0 (0.0%) | 4 (100.0%) |
| Accommodation & Food Services | 14 (58.3%) | 10 (41.7%) |
| Public Administration | 3 (60.0%) | 2 (40.0%) |
| Total | 113 (38.7%) | 179 (61.3%) |
Education in Beech Bottom
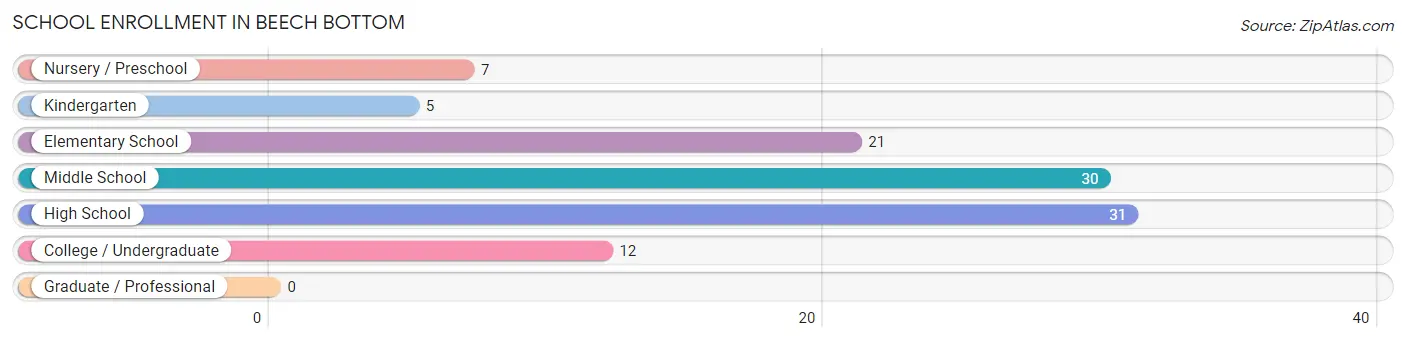
School Enrollment in Beech Bottom
The most common levels of schooling among the 106 students in Beech Bottom are high school (31 | 29.2%), middle school (30 | 28.3%), and elementary school (21 | 19.8%).
| School Level | # Students | % Students |
| Nursery / Preschool | 7 | 6.6% |
| Kindergarten | 5 | 4.7% |
| Elementary School | 21 | 19.8% |
| Middle School | 30 | 28.3% |
| High School | 31 | 29.2% |
| College / Undergraduate | 12 | 11.3% |
| Graduate / Professional | 0 | 0.0% |
| Total | 106 | 100.0% |
School Enrollment by Age by Funding Source in Beech Bottom
Out of a total of 106 students who are enrolled in schools in Beech Bottom, 4 (3.8%) attend a private institution, while the remaining 102 (96.2%) are enrolled in public schools. The age group of 3 to 4 year olds has the highest likelihood of being enrolled in private schools, with 4 (100.0% in the age bracket) enrolled. Conversely, the age group of 5 to 9 year old has the lowest likelihood of being enrolled in a private school, with 40 (100.0% in the age bracket) attending a public institution.
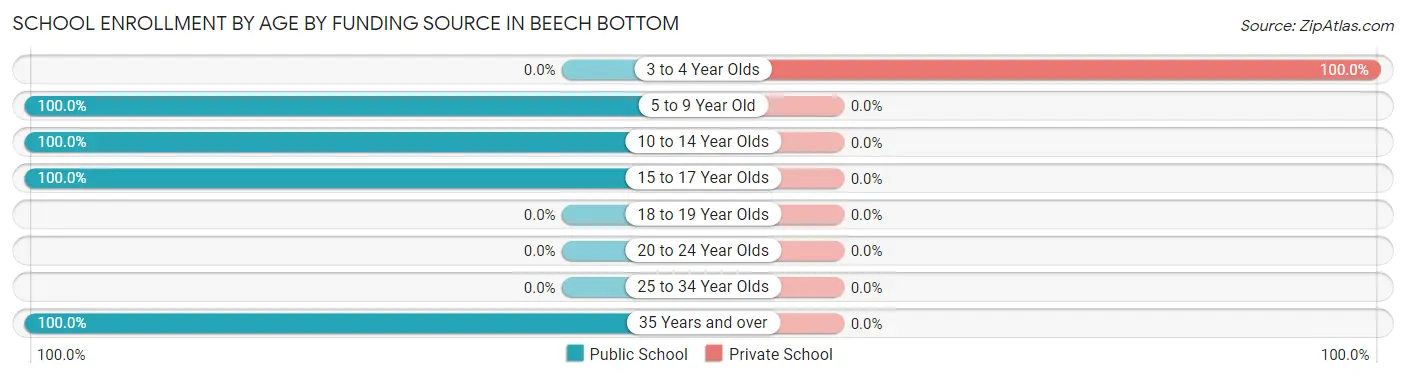
| Age Bracket | Public School | Private School |
| 3 to 4 Year Olds | 0 (0.0%) | 4 (100.0%) |
| 5 to 9 Year Old | 40 (100.0%) | 0 (0.0%) |
| 10 to 14 Year Olds | 30 (100.0%) | 0 (0.0%) |
| 15 to 17 Year Olds | 20 (100.0%) | 0 (0.0%) |
| 18 to 19 Year Olds | 0 (0.0%) | 0 (0.0%) |
| 20 to 24 Year Olds | 0 (0.0%) | 0 (0.0%) |
| 25 to 34 Year Olds | 0 (0.0%) | 0 (0.0%) |
| 35 Years and over | 12 (100.0%) | 0 (0.0%) |
| Total | 102 (96.2%) | 4 (3.8%) |
Educational Attainment by Field of Study in Beech Bottom
Business (17 | 32.7%), arts & humanities (13 | 25.0%), education (5 | 9.6%), psychology (4 | 7.7%), and communications (4 | 7.7%) are the most common fields of study among 52 individuals in Beech Bottom who have obtained a bachelor's degree or higher.
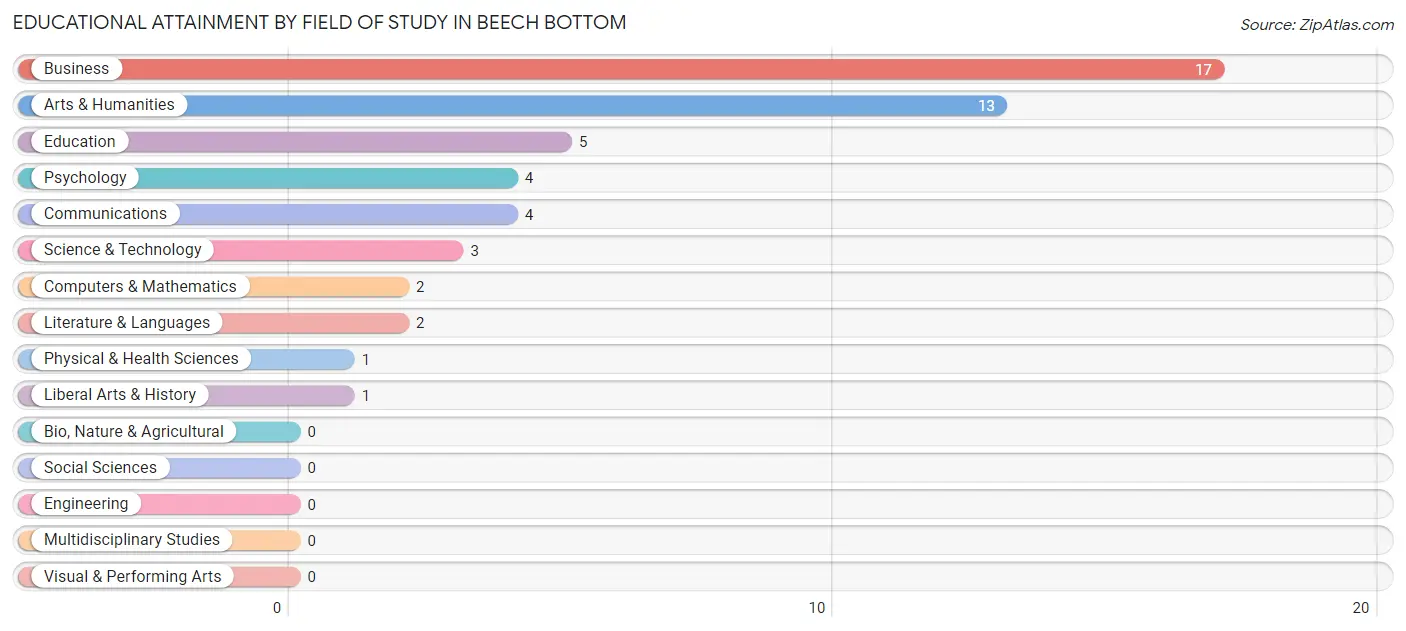
| Field of Study | # Graduates | % Graduates |
| Computers & Mathematics | 2 | 3.8% |
| Bio, Nature & Agricultural | 0 | 0.0% |
| Physical & Health Sciences | 1 | 1.9% |
| Psychology | 4 | 7.7% |
| Social Sciences | 0 | 0.0% |
| Engineering | 0 | 0.0% |
| Multidisciplinary Studies | 0 | 0.0% |
| Science & Technology | 3 | 5.8% |
| Business | 17 | 32.7% |
| Education | 5 | 9.6% |
| Literature & Languages | 2 | 3.8% |
| Liberal Arts & History | 1 | 1.9% |
| Visual & Performing Arts | 0 | 0.0% |
| Communications | 4 | 7.7% |
| Arts & Humanities | 13 | 25.0% |
| Total | 52 | 100.0% |
Transportation & Commute in Beech Bottom
Vehicle Availability by Sex in Beech Bottom
The most prevalent vehicle ownership categories in Beech Bottom are males with 1 vehicle (38, accounting for 35.2%) and females with 1 vehicle (126, making up 22.2%).
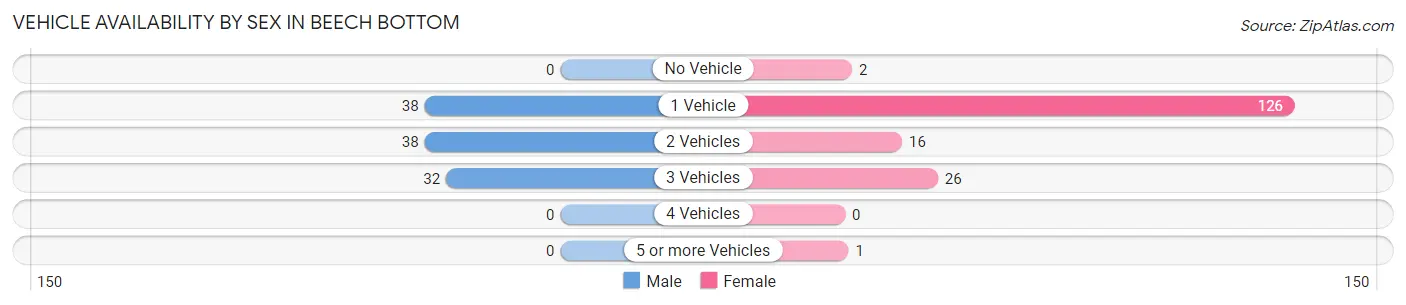
| Vehicles Available | Male | Female |
| No Vehicle | 0 (0.0%) | 2 (1.2%) |
| 1 Vehicle | 38 (35.2%) | 126 (73.7%) |
| 2 Vehicles | 38 (35.2%) | 16 (9.4%) |
| 3 Vehicles | 32 (29.6%) | 26 (15.2%) |
| 4 Vehicles | 0 (0.0%) | 0 (0.0%) |
| 5 or more Vehicles | 0 (0.0%) | 1 (0.6%) |
| Total | 108 (100.0%) | 171 (100.0%) |
Commute Time in Beech Bottom
The most frequently occuring commute durations in Beech Bottom are 30 to 34 minutes (60 commuters, 21.9%), 40 to 44 minutes (58 commuters, 21.2%), and 20 to 24 minutes (38 commuters, 13.9%).
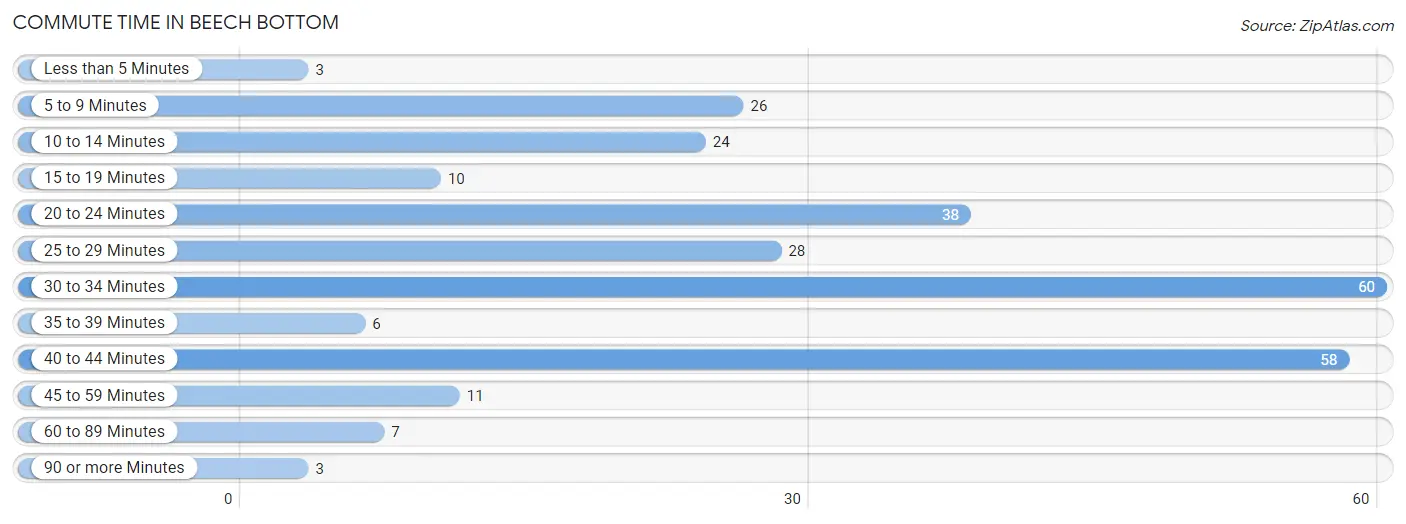
| Commute Time | # Commuters | % Commuters |
| Less than 5 Minutes | 3 | 1.1% |
| 5 to 9 Minutes | 26 | 9.5% |
| 10 to 14 Minutes | 24 | 8.8% |
| 15 to 19 Minutes | 10 | 3.6% |
| 20 to 24 Minutes | 38 | 13.9% |
| 25 to 29 Minutes | 28 | 10.2% |
| 30 to 34 Minutes | 60 | 21.9% |
| 35 to 39 Minutes | 6 | 2.2% |
| 40 to 44 Minutes | 58 | 21.2% |
| 45 to 59 Minutes | 11 | 4.0% |
| 60 to 89 Minutes | 7 | 2.5% |
| 90 or more Minutes | 3 | 1.1% |
Commute Time by Sex in Beech Bottom
The most common commute times in Beech Bottom are 30 to 34 minutes (32 commuters, 30.5%) for males and 40 to 44 minutes (58 commuters, 34.3%) for females.
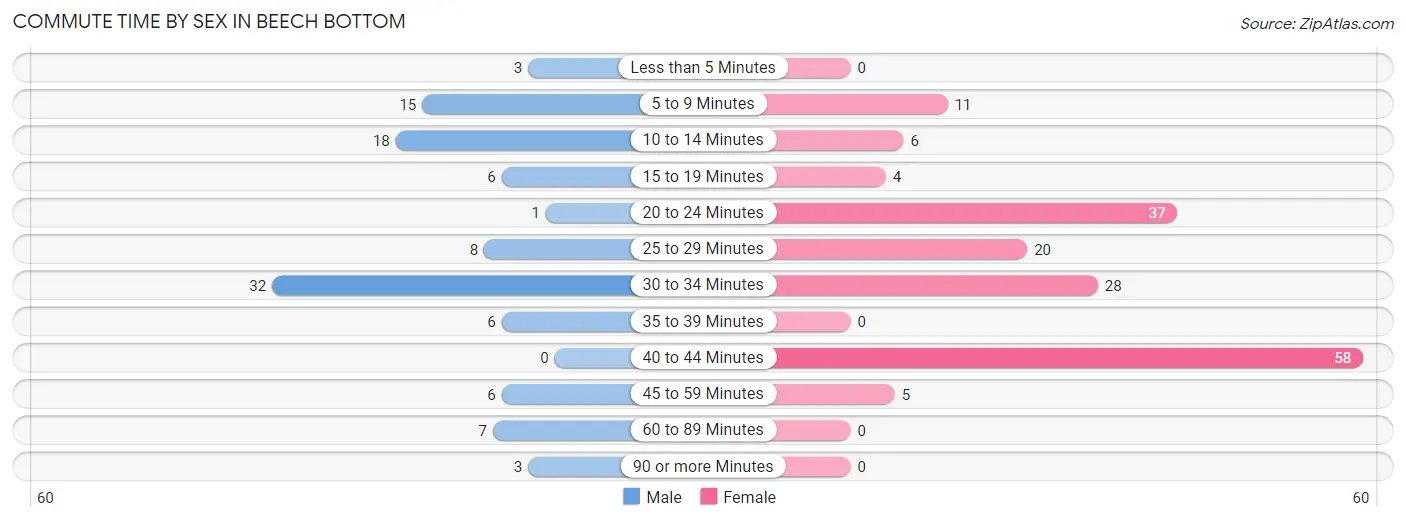
| Commute Time | Male | Female |
| Less than 5 Minutes | 3 (2.9%) | 0 (0.0%) |
| 5 to 9 Minutes | 15 (14.3%) | 11 (6.5%) |
| 10 to 14 Minutes | 18 (17.1%) | 6 (3.5%) |
| 15 to 19 Minutes | 6 (5.7%) | 4 (2.4%) |
| 20 to 24 Minutes | 1 (0.9%) | 37 (21.9%) |
| 25 to 29 Minutes | 8 (7.6%) | 20 (11.8%) |
| 30 to 34 Minutes | 32 (30.5%) | 28 (16.6%) |
| 35 to 39 Minutes | 6 (5.7%) | 0 (0.0%) |
| 40 to 44 Minutes | 0 (0.0%) | 58 (34.3%) |
| 45 to 59 Minutes | 6 (5.7%) | 5 (3.0%) |
| 60 to 89 Minutes | 7 (6.7%) | 0 (0.0%) |
| 90 or more Minutes | 3 (2.9%) | 0 (0.0%) |
Time of Departure to Work by Sex in Beech Bottom
The most frequent times of departure to work in Beech Bottom are 8:00 AM to 8:29 AM (24, 22.9%) for males and 12:00 AM to 4:59 AM (70, 41.4%) for females.
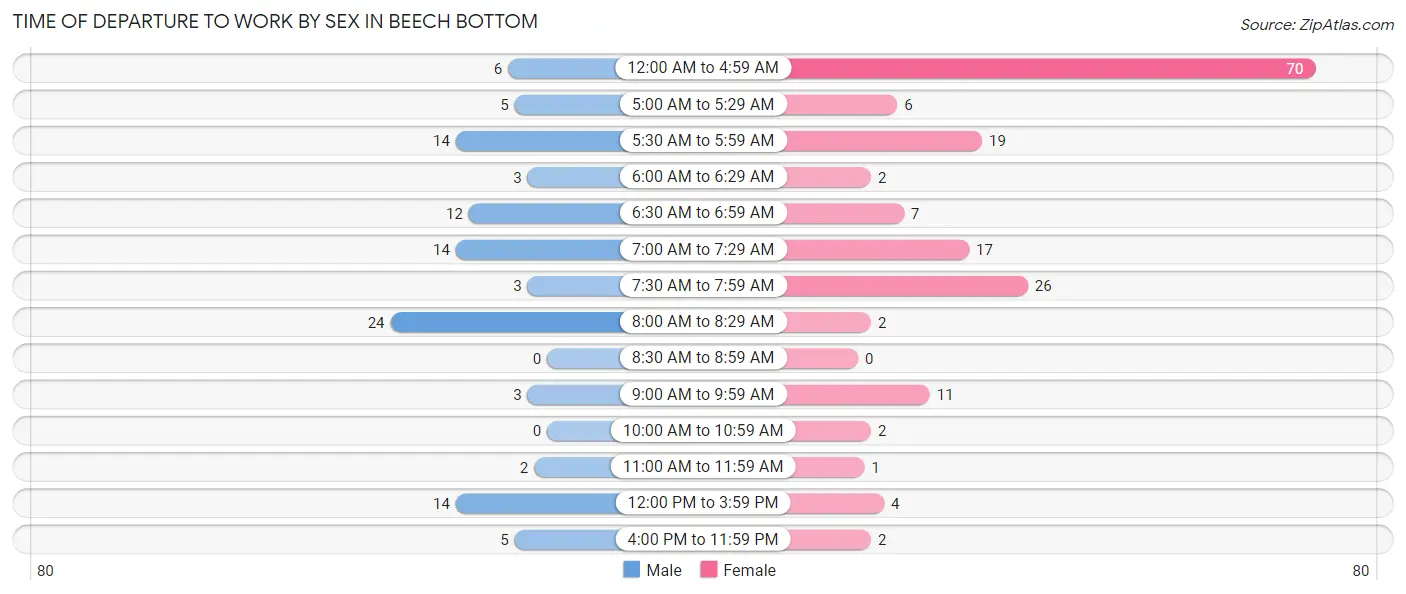
| Time of Departure | Male | Female |
| 12:00 AM to 4:59 AM | 6 (5.7%) | 70 (41.4%) |
| 5:00 AM to 5:29 AM | 5 (4.8%) | 6 (3.5%) |
| 5:30 AM to 5:59 AM | 14 (13.3%) | 19 (11.2%) |
| 6:00 AM to 6:29 AM | 3 (2.9%) | 2 (1.2%) |
| 6:30 AM to 6:59 AM | 12 (11.4%) | 7 (4.1%) |
| 7:00 AM to 7:29 AM | 14 (13.3%) | 17 (10.1%) |
| 7:30 AM to 7:59 AM | 3 (2.9%) | 26 (15.4%) |
| 8:00 AM to 8:29 AM | 24 (22.9%) | 2 (1.2%) |
| 8:30 AM to 8:59 AM | 0 (0.0%) | 0 (0.0%) |
| 9:00 AM to 9:59 AM | 3 (2.9%) | 11 (6.5%) |
| 10:00 AM to 10:59 AM | 0 (0.0%) | 2 (1.2%) |
| 11:00 AM to 11:59 AM | 2 (1.9%) | 1 (0.6%) |
| 12:00 PM to 3:59 PM | 14 (13.3%) | 4 (2.4%) |
| 4:00 PM to 11:59 PM | 5 (4.8%) | 2 (1.2%) |
| Total | 105 (100.0%) | 169 (100.0%) |
Housing Occupancy in Beech Bottom
Occupancy by Ownership in Beech Bottom
Of the total 238 dwellings in Beech Bottom, owner-occupied units account for 187 (78.6%), while renter-occupied units make up 51 (21.4%).
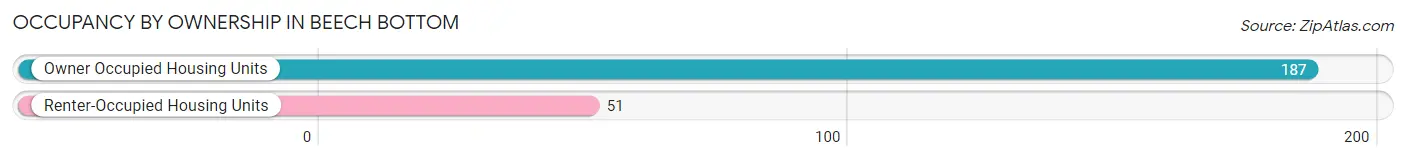
| Occupancy | # Housing Units | % Housing Units |
| Owner Occupied Housing Units | 187 | 78.6% |
| Renter-Occupied Housing Units | 51 | 21.4% |
| Total Occupied Housing Units | 238 | 100.0% |
Occupancy by Household Size in Beech Bottom
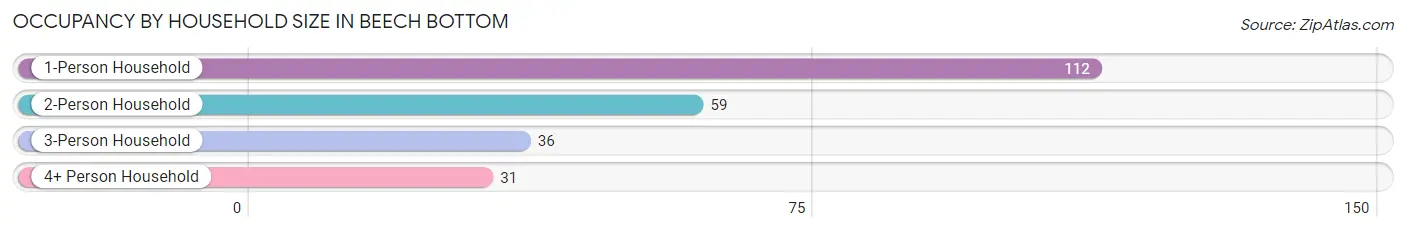
| Household Size | # Housing Units | % Housing Units |
| 1-Person Household | 112 | 47.1% |
| 2-Person Household | 59 | 24.8% |
| 3-Person Household | 36 | 15.1% |
| 4+ Person Household | 31 | 13.0% |
| Total Housing Units | 238 | 100.0% |
Occupancy by Ownership by Household Size in Beech Bottom
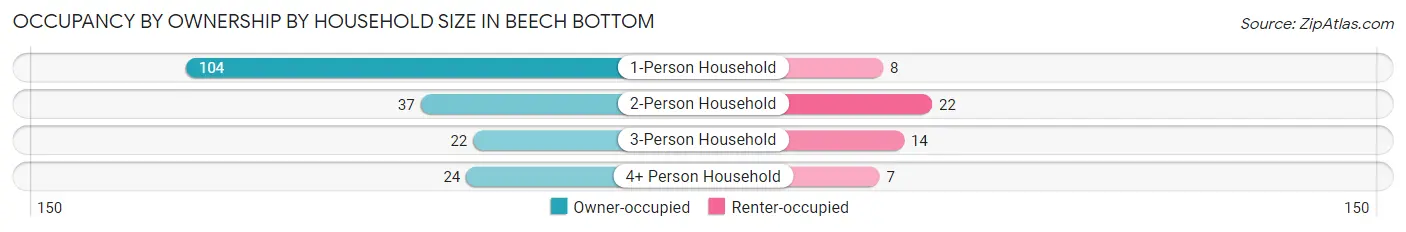
| Household Size | Owner-occupied | Renter-occupied |
| 1-Person Household | 104 (92.9%) | 8 (7.1%) |
| 2-Person Household | 37 (62.7%) | 22 (37.3%) |
| 3-Person Household | 22 (61.1%) | 14 (38.9%) |
| 4+ Person Household | 24 (77.4%) | 7 (22.6%) |
| Total Housing Units | 187 (78.6%) | 51 (21.4%) |
Occupancy by Educational Attainment in Beech Bottom
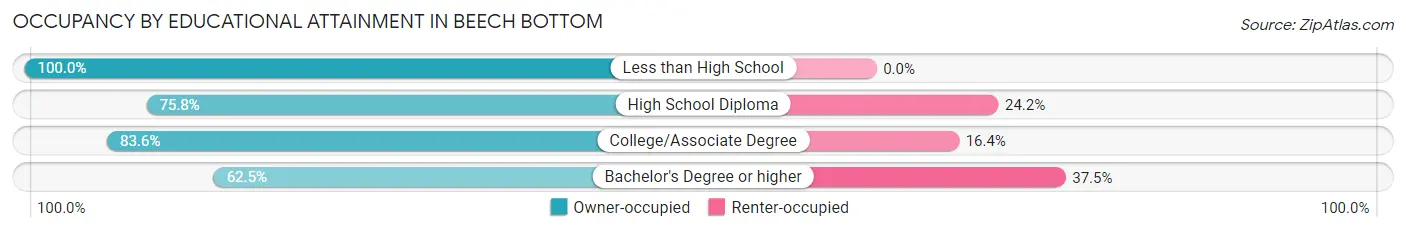
| Household Size | Owner-occupied | Renter-occupied |
| Less than High School | 18 (100.0%) | 0 (0.0%) |
| High School Diploma | 113 (75.8%) | 36 (24.2%) |
| College/Associate Degree | 46 (83.6%) | 9 (16.4%) |
| Bachelor's Degree or higher | 10 (62.5%) | 6 (37.5%) |
Occupancy by Age of Householder in Beech Bottom
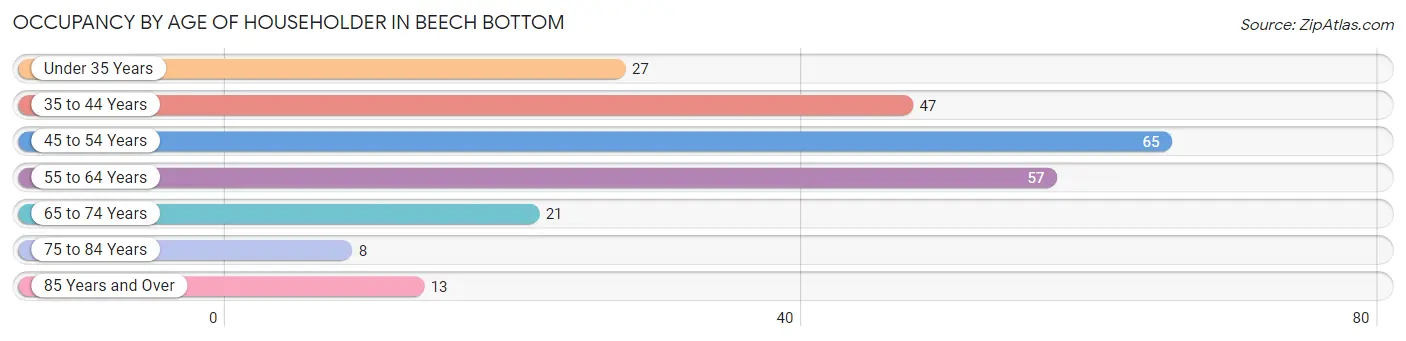
| Age Bracket | # Households | % Households |
| Under 35 Years | 27 | 11.3% |
| 35 to 44 Years | 47 | 19.8% |
| 45 to 54 Years | 65 | 27.3% |
| 55 to 64 Years | 57 | 23.9% |
| 65 to 74 Years | 21 | 8.8% |
| 75 to 84 Years | 8 | 3.4% |
| 85 Years and Over | 13 | 5.5% |
| Total | 238 | 100.0% |
Housing Finances in Beech Bottom
Median Income by Occupancy in Beech Bottom
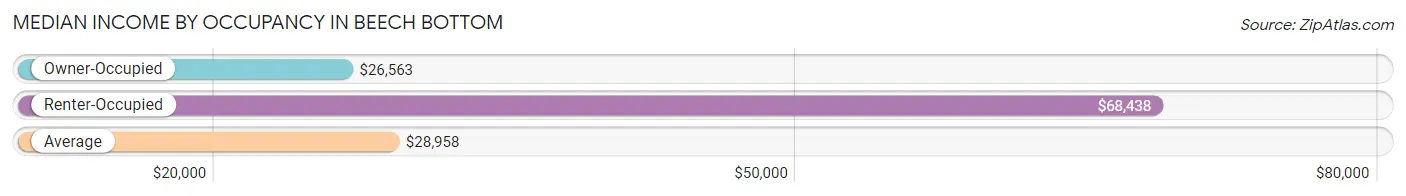
| Occupancy Type | # Households | Median Income |
| Owner-Occupied | 187 (78.6%) | $26,563 |
| Renter-Occupied | 51 (21.4%) | $68,438 |
| Average | 238 (100.0%) | $28,958 |
Occupancy by Householder Income Bracket in Beech Bottom
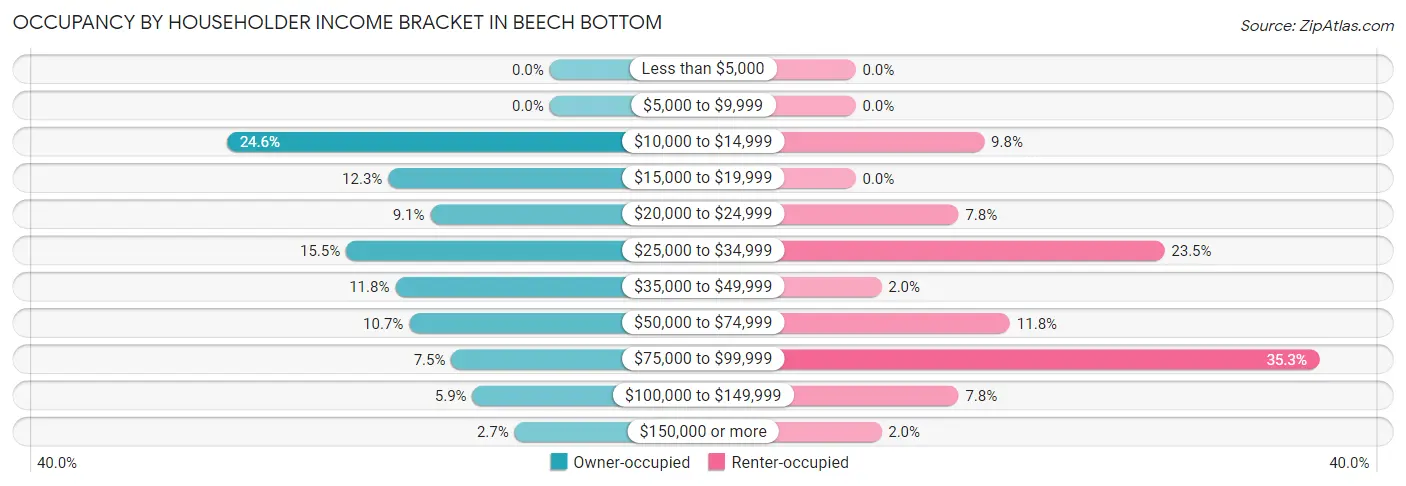
| Income Bracket | Owner-occupied | Renter-occupied |
| Less than $5,000 | 0 (0.0%) | 0 (0.0%) |
| $5,000 to $9,999 | 0 (0.0%) | 0 (0.0%) |
| $10,000 to $14,999 | 46 (24.6%) | 5 (9.8%) |
| $15,000 to $19,999 | 23 (12.3%) | 0 (0.0%) |
| $20,000 to $24,999 | 17 (9.1%) | 4 (7.8%) |
| $25,000 to $34,999 | 29 (15.5%) | 12 (23.5%) |
| $35,000 to $49,999 | 22 (11.8%) | 1 (2.0%) |
| $50,000 to $74,999 | 20 (10.7%) | 6 (11.8%) |
| $75,000 to $99,999 | 14 (7.5%) | 18 (35.3%) |
| $100,000 to $149,999 | 11 (5.9%) | 4 (7.8%) |
| $150,000 or more | 5 (2.7%) | 1 (2.0%) |
| Total | 187 (100.0%) | 51 (100.0%) |
Monthly Housing Cost Tiers in Beech Bottom
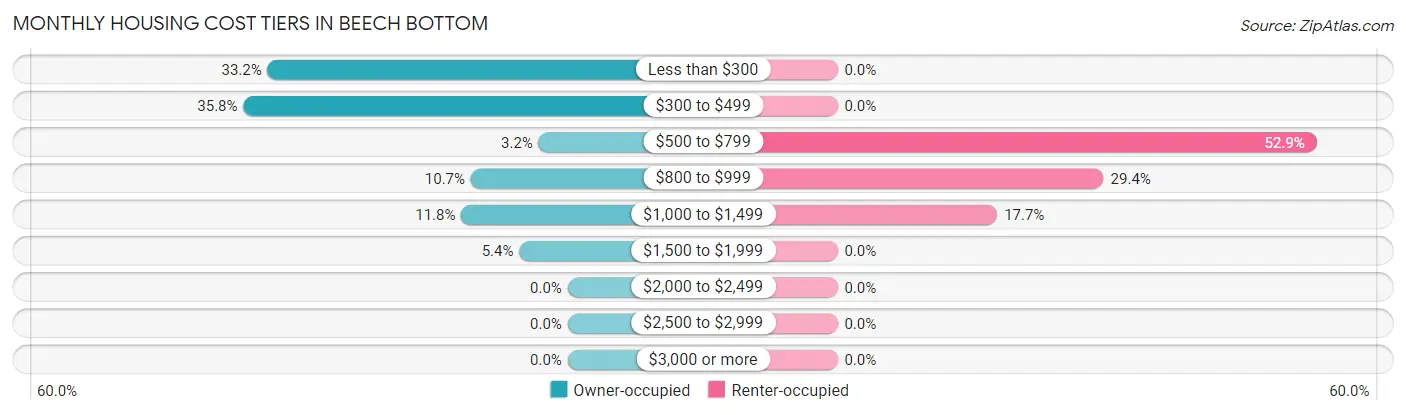
| Monthly Cost | Owner-occupied | Renter-occupied |
| Less than $300 | 62 (33.2%) | 0 (0.0%) |
| $300 to $499 | 67 (35.8%) | 0 (0.0%) |
| $500 to $799 | 6 (3.2%) | 27 (52.9%) |
| $800 to $999 | 20 (10.7%) | 15 (29.4%) |
| $1,000 to $1,499 | 22 (11.8%) | 9 (17.6%) |
| $1,500 to $1,999 | 10 (5.3%) | 0 (0.0%) |
| $2,000 to $2,499 | 0 (0.0%) | 0 (0.0%) |
| $2,500 to $2,999 | 0 (0.0%) | 0 (0.0%) |
| $3,000 or more | 0 (0.0%) | 0 (0.0%) |
| Total | 187 (100.0%) | 51 (100.0%) |
Physical Housing Characteristics in Beech Bottom
Housing Structures in Beech Bottom
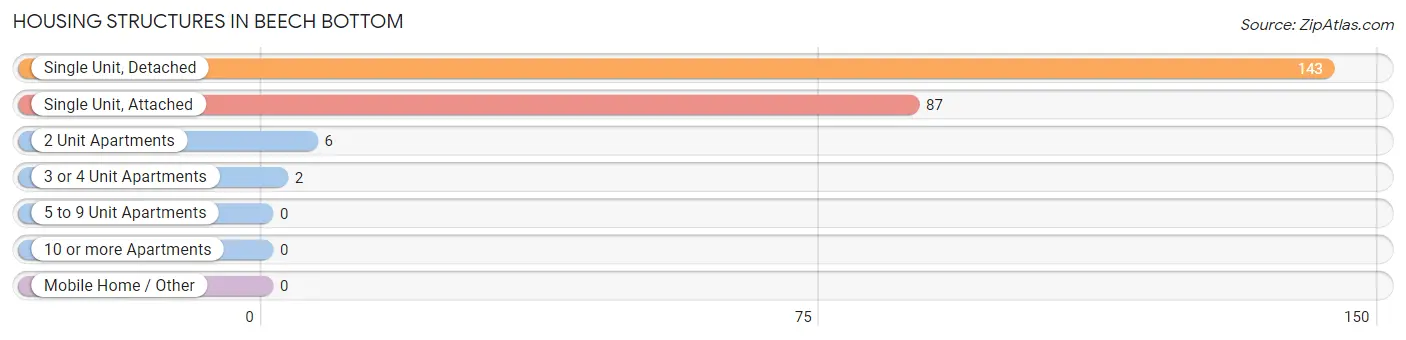
| Structure Type | # Housing Units | % Housing Units |
| Single Unit, Detached | 143 | 60.1% |
| Single Unit, Attached | 87 | 36.5% |
| 2 Unit Apartments | 6 | 2.5% |
| 3 or 4 Unit Apartments | 2 | 0.8% |
| 5 to 9 Unit Apartments | 0 | 0.0% |
| 10 or more Apartments | 0 | 0.0% |
| Mobile Home / Other | 0 | 0.0% |
| Total | 238 | 100.0% |
Housing Structures by Occupancy in Beech Bottom
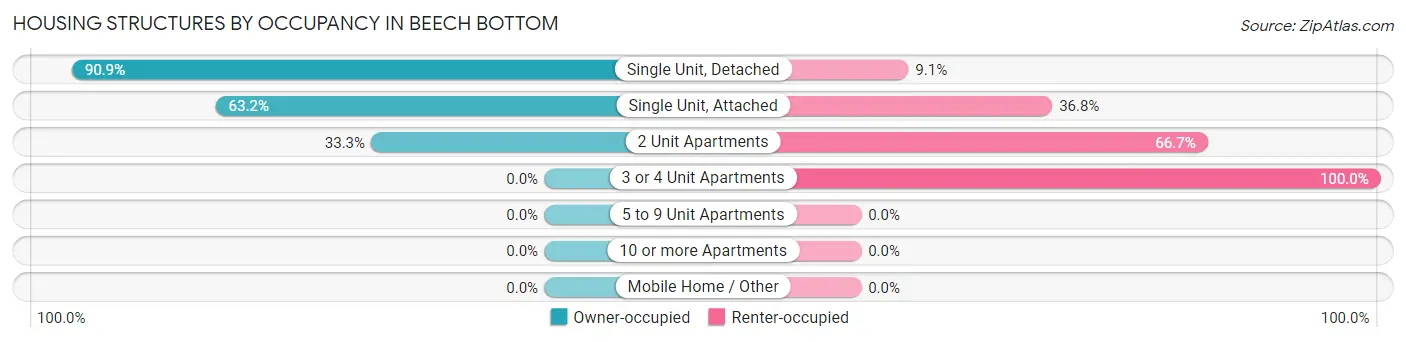
| Structure Type | Owner-occupied | Renter-occupied |
| Single Unit, Detached | 130 (90.9%) | 13 (9.1%) |
| Single Unit, Attached | 55 (63.2%) | 32 (36.8%) |
| 2 Unit Apartments | 2 (33.3%) | 4 (66.7%) |
| 3 or 4 Unit Apartments | 0 (0.0%) | 2 (100.0%) |
| 5 to 9 Unit Apartments | 0 (0.0%) | 0 (0.0%) |
| 10 or more Apartments | 0 (0.0%) | 0 (0.0%) |
| Mobile Home / Other | 0 (0.0%) | 0 (0.0%) |
| Total | 187 (78.6%) | 51 (21.4%) |
Housing Structures by Number of Rooms in Beech Bottom
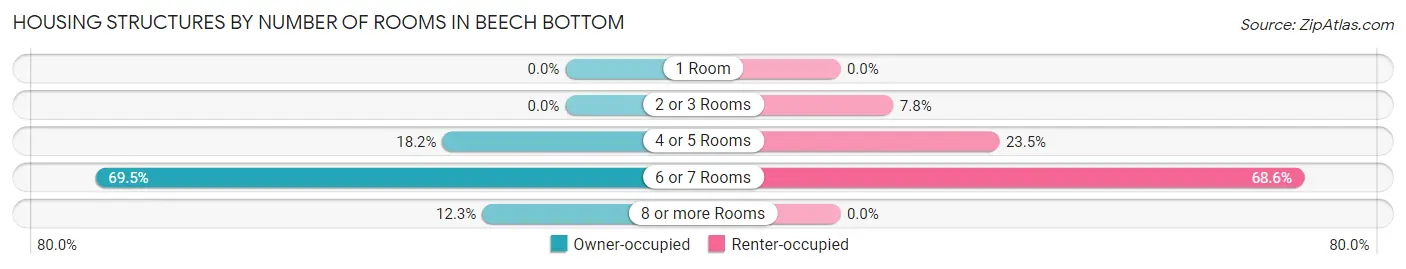
| Number of Rooms | Owner-occupied | Renter-occupied |
| 1 Room | 0 (0.0%) | 0 (0.0%) |
| 2 or 3 Rooms | 0 (0.0%) | 4 (7.8%) |
| 4 or 5 Rooms | 34 (18.2%) | 12 (23.5%) |
| 6 or 7 Rooms | 130 (69.5%) | 35 (68.6%) |
| 8 or more Rooms | 23 (12.3%) | 0 (0.0%) |
| Total | 187 (100.0%) | 51 (100.0%) |
Housing Structure by Heating Type in Beech Bottom
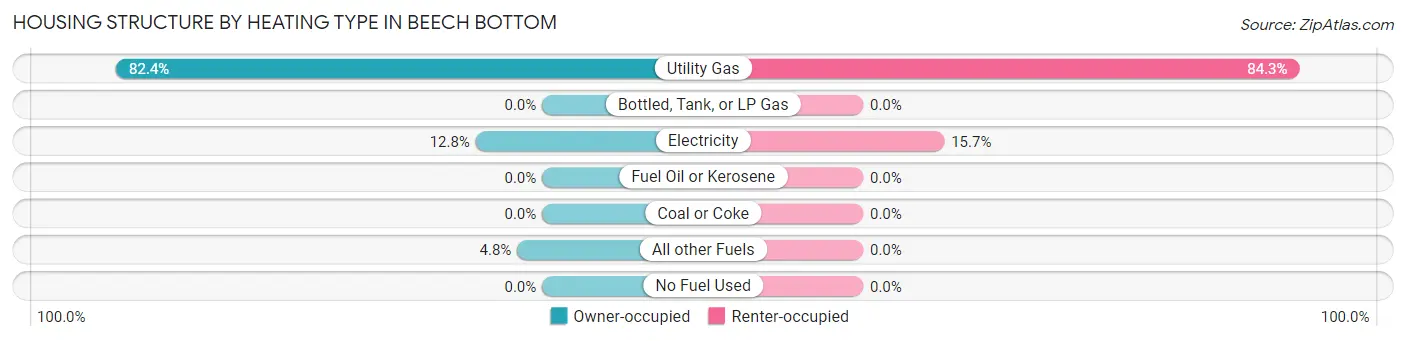
| Heating Type | Owner-occupied | Renter-occupied |
| Utility Gas | 154 (82.4%) | 43 (84.3%) |
| Bottled, Tank, or LP Gas | 0 (0.0%) | 0 (0.0%) |
| Electricity | 24 (12.8%) | 8 (15.7%) |
| Fuel Oil or Kerosene | 0 (0.0%) | 0 (0.0%) |
| Coal or Coke | 0 (0.0%) | 0 (0.0%) |
| All other Fuels | 9 (4.8%) | 0 (0.0%) |
| No Fuel Used | 0 (0.0%) | 0 (0.0%) |
| Total | 187 (100.0%) | 51 (100.0%) |
Household Vehicle Usage in Beech Bottom
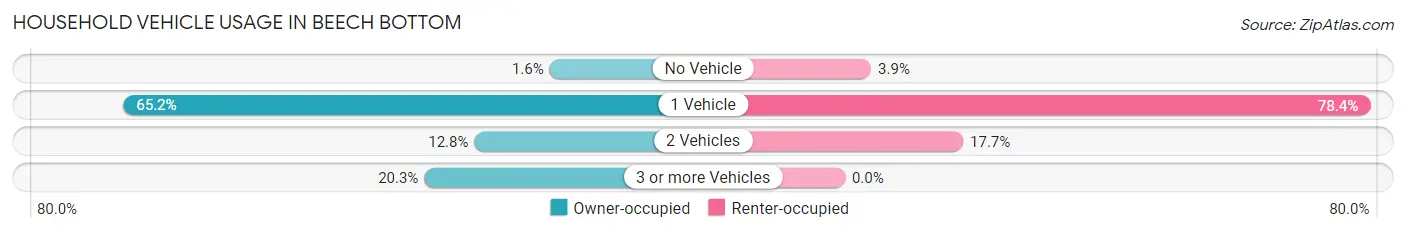
| Vehicles per Household | Owner-occupied | Renter-occupied |
| No Vehicle | 3 (1.6%) | 2 (3.9%) |
| 1 Vehicle | 122 (65.2%) | 40 (78.4%) |
| 2 Vehicles | 24 (12.8%) | 9 (17.6%) |
| 3 or more Vehicles | 38 (20.3%) | 0 (0.0%) |
| Total | 187 (100.0%) | 51 (100.0%) |
Real Estate & Mortgages in Beech Bottom
Real Estate and Mortgage Overview in Beech Bottom
| Characteristic | Without Mortgage | With Mortgage |
| Housing Units | 123 | 64 |
| Median Property Value | $34,500 | $96,700 |
| Median Household Income | $17,917 | $3 |
| Monthly Housing Costs | $242 | $0 |
| Real Estate Taxes | $257 | $4 |
Property Value by Mortgage Status in Beech Bottom
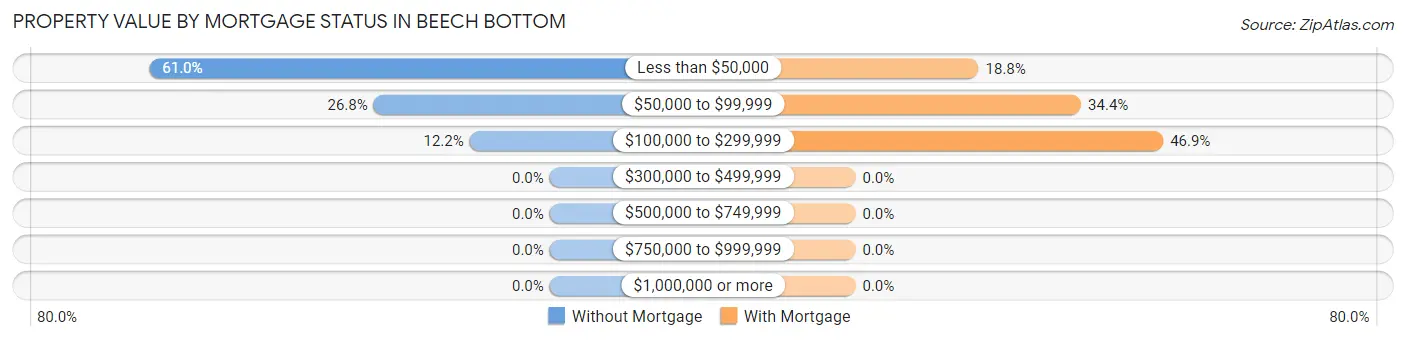
| Property Value | Without Mortgage | With Mortgage |
| Less than $50,000 | 75 (61.0%) | 12 (18.8%) |
| $50,000 to $99,999 | 33 (26.8%) | 22 (34.4%) |
| $100,000 to $299,999 | 15 (12.2%) | 30 (46.9%) |
| $300,000 to $499,999 | 0 (0.0%) | 0 (0.0%) |
| $500,000 to $749,999 | 0 (0.0%) | 0 (0.0%) |
| $750,000 to $999,999 | 0 (0.0%) | 0 (0.0%) |
| $1,000,000 or more | 0 (0.0%) | 0 (0.0%) |
| Total | 123 (100.0%) | 64 (100.0%) |
Household Income by Mortgage Status in Beech Bottom
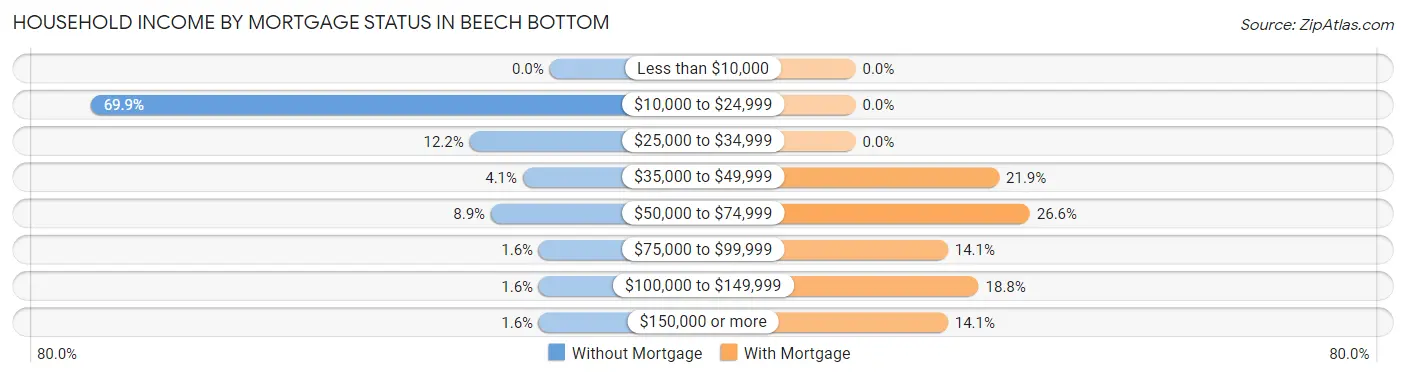
| Household Income | Without Mortgage | With Mortgage |
| Less than $10,000 | 0 (0.0%) | 0 (0.0%) |
| $10,000 to $24,999 | 86 (69.9%) | 0 (0.0%) |
| $25,000 to $34,999 | 15 (12.2%) | 0 (0.0%) |
| $35,000 to $49,999 | 5 (4.1%) | 14 (21.9%) |
| $50,000 to $74,999 | 11 (8.9%) | 17 (26.6%) |
| $75,000 to $99,999 | 2 (1.6%) | 9 (14.1%) |
| $100,000 to $149,999 | 2 (1.6%) | 12 (18.8%) |
| $150,000 or more | 2 (1.6%) | 9 (14.1%) |
| Total | 123 (100.0%) | 64 (100.0%) |
Property Value to Household Income Ratio in Beech Bottom
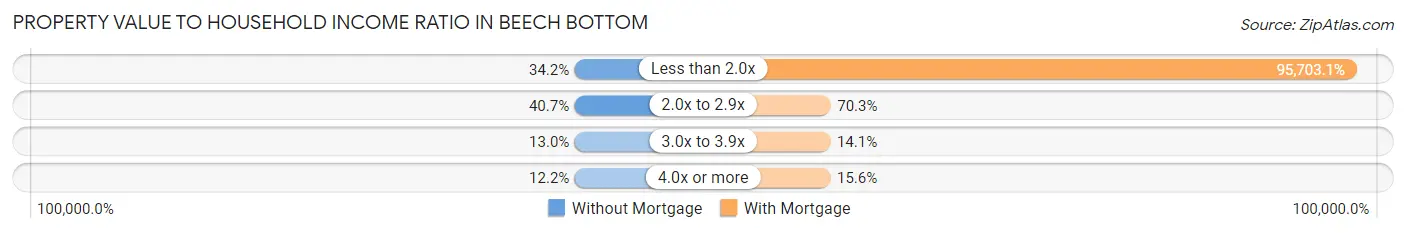
| Value-to-Income Ratio | Without Mortgage | With Mortgage |
| Less than 2.0x | 42 (34.2%) | 61,250 (95,703.1%) |
| 2.0x to 2.9x | 50 (40.6%) | 45 (70.3%) |
| 3.0x to 3.9x | 16 (13.0%) | 9 (14.1%) |
| 4.0x or more | 15 (12.2%) | 10 (15.6%) |
| Total | 123 (100.0%) | 64 (100.0%) |
Real Estate Taxes by Mortgage Status in Beech Bottom
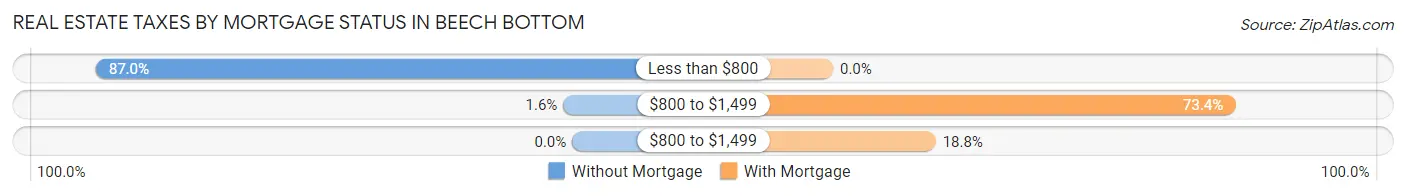
| Property Taxes | Without Mortgage | With Mortgage |
| Less than $800 | 107 (87.0%) | 0 (0.0%) |
| $800 to $1,499 | 2 (1.6%) | 47 (73.4%) |
| $800 to $1,499 | 0 (0.0%) | 12 (18.8%) |
| Total | 123 (100.0%) | 64 (100.0%) |
Health & Disability in Beech Bottom
Health Insurance Coverage by Age in Beech Bottom
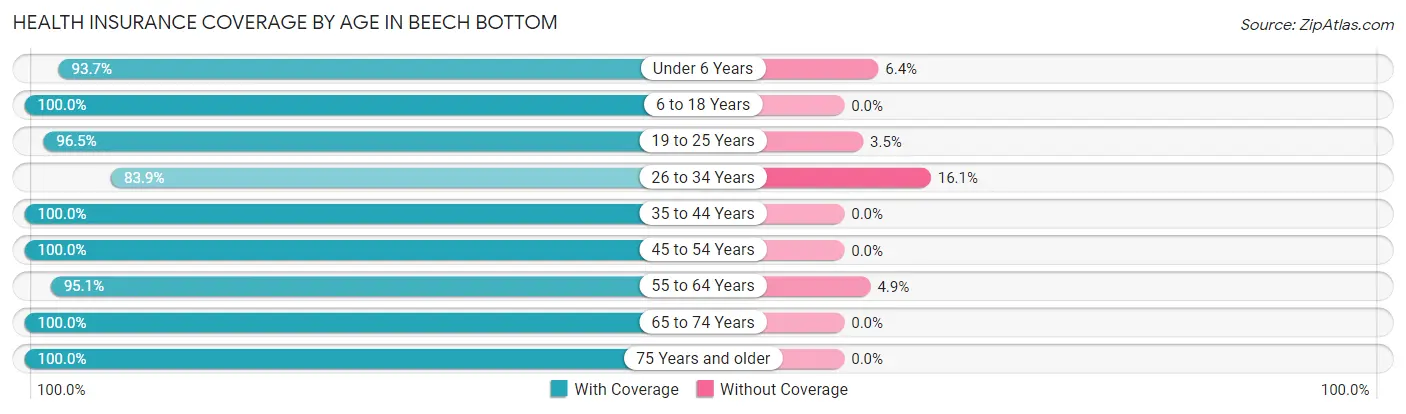
| Age Bracket | With Coverage | Without Coverage |
| Under 6 Years | 59 (93.6%) | 4 (6.4%) |
| 6 to 18 Years | 87 (100.0%) | 0 (0.0%) |
| 19 to 25 Years | 55 (96.5%) | 2 (3.5%) |
| 26 to 34 Years | 52 (83.9%) | 10 (16.1%) |
| 35 to 44 Years | 55 (100.0%) | 0 (0.0%) |
| 45 to 54 Years | 128 (100.0%) | 0 (0.0%) |
| 55 to 64 Years | 78 (95.1%) | 4 (4.9%) |
| 65 to 74 Years | 57 (100.0%) | 0 (0.0%) |
| 75 Years and older | 26 (100.0%) | 0 (0.0%) |
| Total | 597 (96.8%) | 20 (3.2%) |
Health Insurance Coverage by Citizenship Status in Beech Bottom
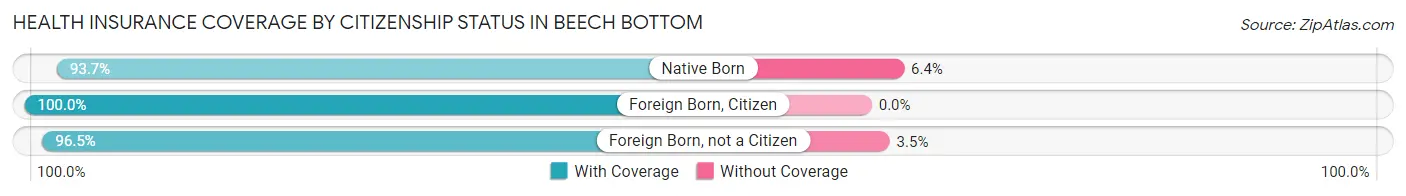
| Citizenship Status | With Coverage | Without Coverage |
| Native Born | 59 (93.6%) | 4 (6.4%) |
| Foreign Born, Citizen | 87 (100.0%) | 0 (0.0%) |
| Foreign Born, not a Citizen | 55 (96.5%) | 2 (3.5%) |
Health Insurance Coverage by Household Income in Beech Bottom
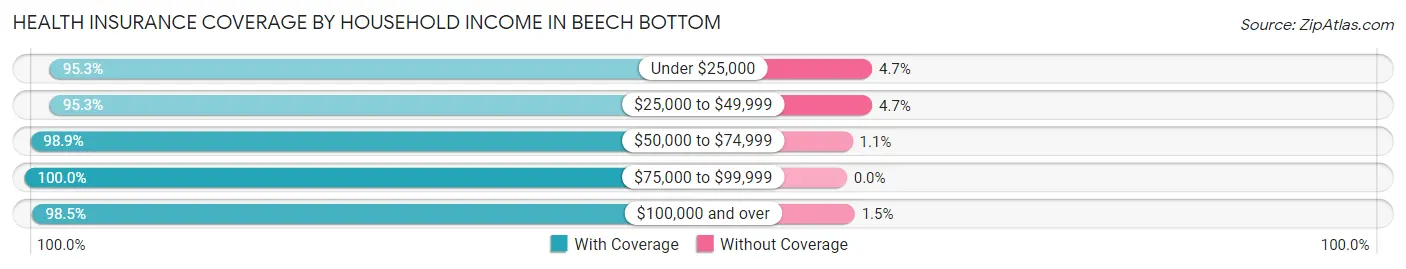
| Household Income | With Coverage | Without Coverage |
| Under $25,000 | 161 (95.3%) | 8 (4.7%) |
| $25,000 to $49,999 | 201 (95.3%) | 10 (4.7%) |
| $50,000 to $74,999 | 92 (98.9%) | 1 (1.1%) |
| $75,000 to $99,999 | 77 (100.0%) | 0 (0.0%) |
| $100,000 and over | 66 (98.5%) | 1 (1.5%) |
Public vs Private Health Insurance Coverage by Age in Beech Bottom
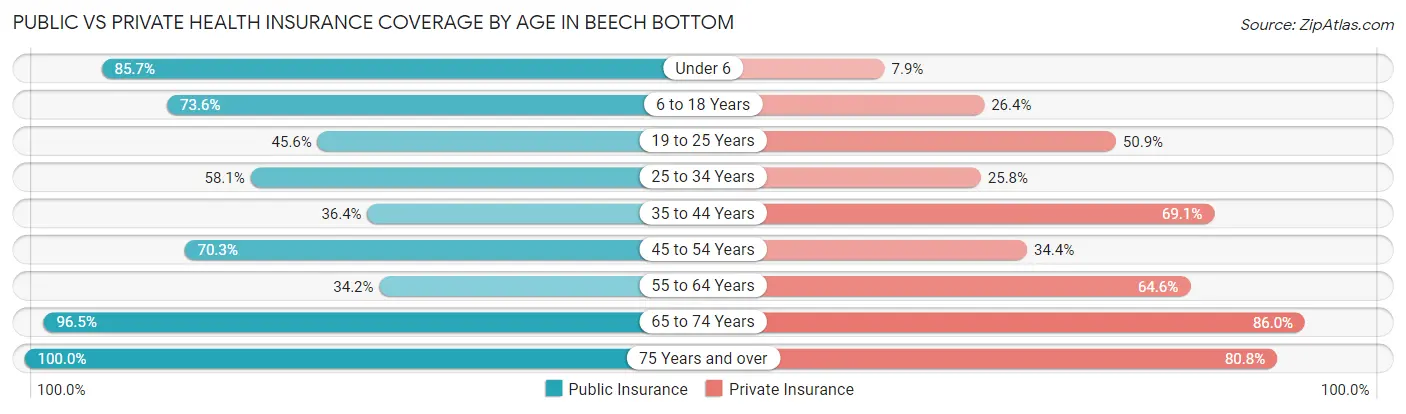
| Age Bracket | Public Insurance | Private Insurance |
| Under 6 | 54 (85.7%) | 5 (7.9%) |
| 6 to 18 Years | 64 (73.6%) | 23 (26.4%) |
| 19 to 25 Years | 26 (45.6%) | 29 (50.9%) |
| 25 to 34 Years | 36 (58.1%) | 16 (25.8%) |
| 35 to 44 Years | 20 (36.4%) | 38 (69.1%) |
| 45 to 54 Years | 90 (70.3%) | 44 (34.4%) |
| 55 to 64 Years | 28 (34.2%) | 53 (64.6%) |
| 65 to 74 Years | 55 (96.5%) | 49 (86.0%) |
| 75 Years and over | 26 (100.0%) | 21 (80.8%) |
| Total | 399 (64.7%) | 278 (45.1%) |
Disability Status by Sex by Age in Beech Bottom
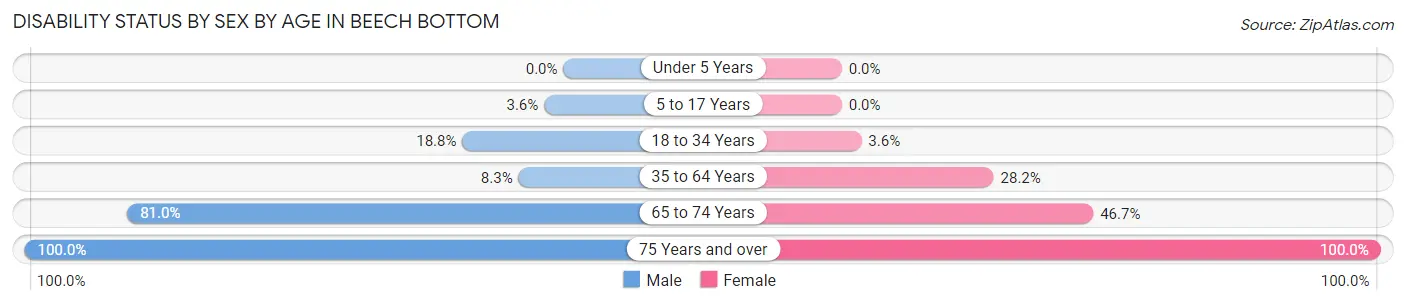
| Age Bracket | Male | Female |
| Under 5 Years | 0 (0.0%) | 0 (0.0%) |
| 5 to 17 Years | 2 (3.6%) | 0 (0.0%) |
| 18 to 34 Years | 12 (18.8%) | 2 (3.6%) |
| 35 to 64 Years | 7 (8.3%) | 51 (28.2%) |
| 65 to 74 Years | 34 (80.9%) | 7 (46.7%) |
| 75 Years and over | 9 (100.0%) | 17 (100.0%) |
Disability Class by Sex by Age in Beech Bottom
Disability Class: Hearing Difficulty
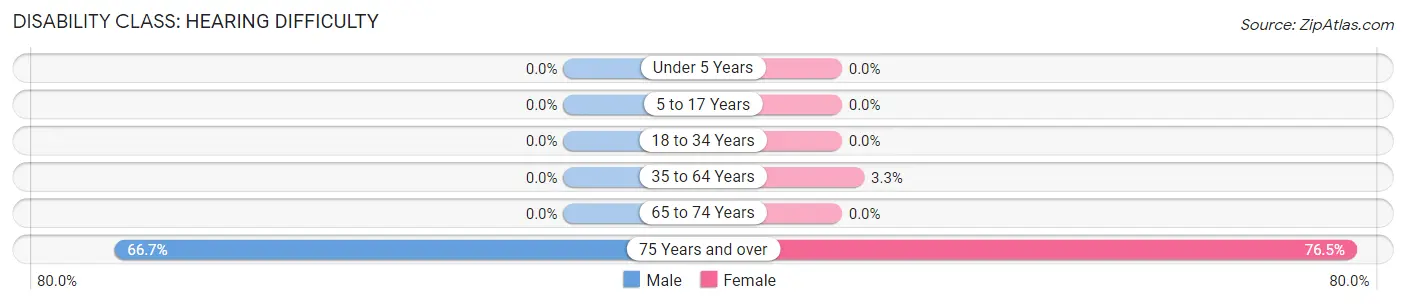
| Age Bracket | Male | Female |
| Under 5 Years | 0 (0.0%) | 0 (0.0%) |
| 5 to 17 Years | 0 (0.0%) | 0 (0.0%) |
| 18 to 34 Years | 0 (0.0%) | 0 (0.0%) |
| 35 to 64 Years | 0 (0.0%) | 6 (3.3%) |
| 65 to 74 Years | 0 (0.0%) | 0 (0.0%) |
| 75 Years and over | 6 (66.7%) | 13 (76.5%) |
Disability Class: Vision Difficulty
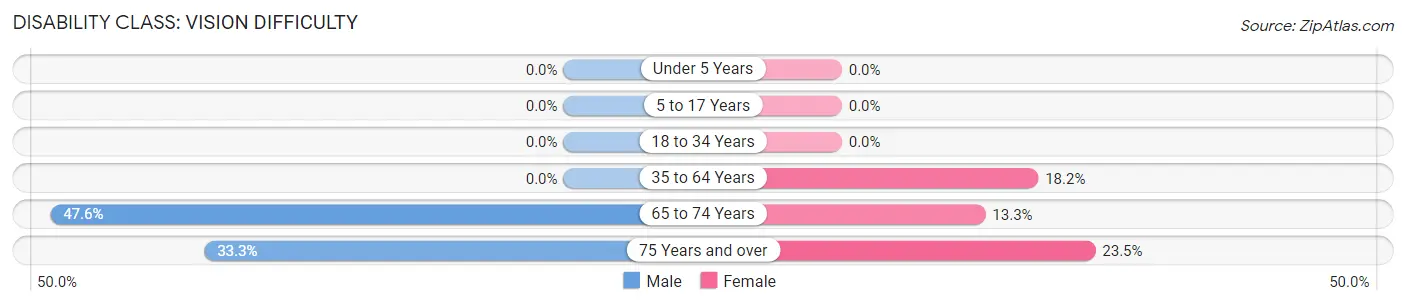
| Age Bracket | Male | Female |
| Under 5 Years | 0 (0.0%) | 0 (0.0%) |
| 5 to 17 Years | 0 (0.0%) | 0 (0.0%) |
| 18 to 34 Years | 0 (0.0%) | 0 (0.0%) |
| 35 to 64 Years | 0 (0.0%) | 33 (18.2%) |
| 65 to 74 Years | 20 (47.6%) | 2 (13.3%) |
| 75 Years and over | 3 (33.3%) | 4 (23.5%) |
Disability Class: Cognitive Difficulty
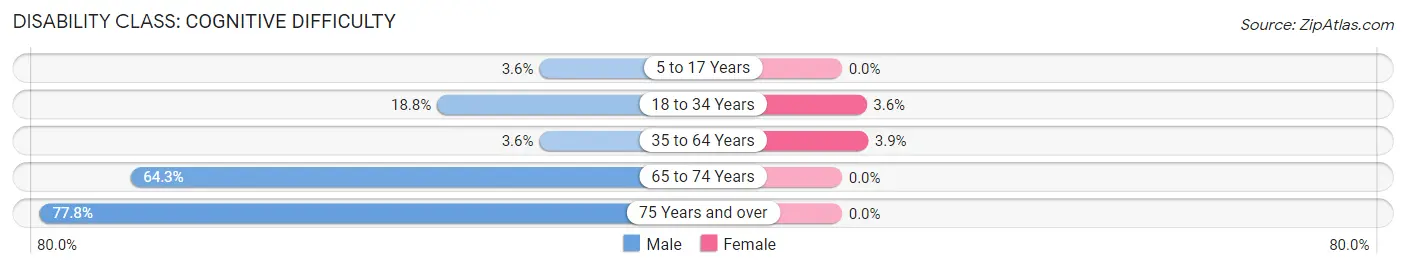
| Age Bracket | Male | Female |
| 5 to 17 Years | 2 (3.6%) | 0 (0.0%) |
| 18 to 34 Years | 12 (18.8%) | 2 (3.6%) |
| 35 to 64 Years | 3 (3.6%) | 7 (3.9%) |
| 65 to 74 Years | 27 (64.3%) | 0 (0.0%) |
| 75 Years and over | 7 (77.8%) | 0 (0.0%) |
Disability Class: Ambulatory Difficulty
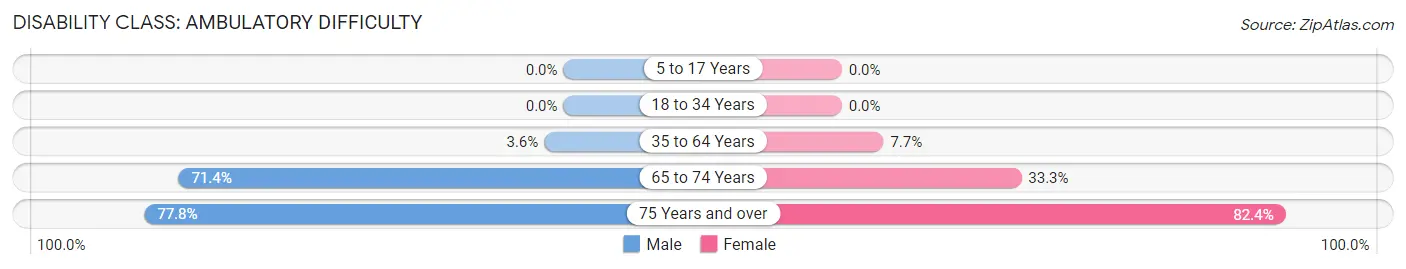
| Age Bracket | Male | Female |
| 5 to 17 Years | 0 (0.0%) | 0 (0.0%) |
| 18 to 34 Years | 0 (0.0%) | 0 (0.0%) |
| 35 to 64 Years | 3 (3.6%) | 14 (7.7%) |
| 65 to 74 Years | 30 (71.4%) | 5 (33.3%) |
| 75 Years and over | 7 (77.8%) | 14 (82.4%) |
Disability Class: Self-Care Difficulty
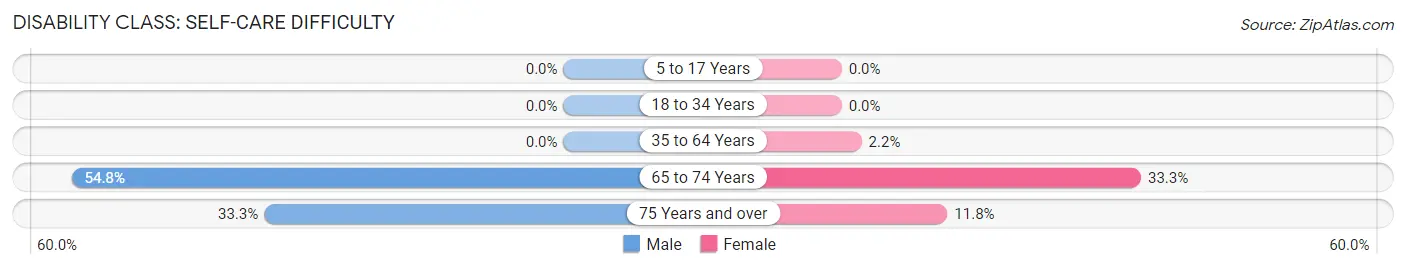
| Age Bracket | Male | Female |
| 5 to 17 Years | 0 (0.0%) | 0 (0.0%) |
| 18 to 34 Years | 0 (0.0%) | 0 (0.0%) |
| 35 to 64 Years | 0 (0.0%) | 4 (2.2%) |
| 65 to 74 Years | 23 (54.8%) | 5 (33.3%) |
| 75 Years and over | 3 (33.3%) | 2 (11.8%) |
Technology Access in Beech Bottom
Computing Device Access in Beech Bottom
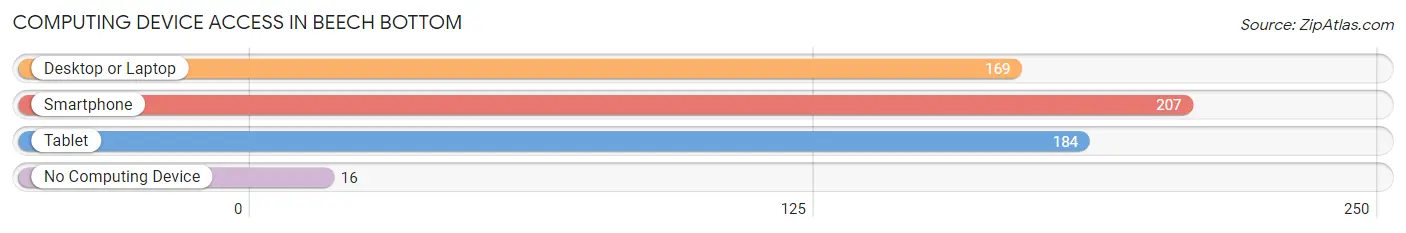
| Device Type | # Households | % Households |
| Desktop or Laptop | 169 | 71.0% |
| Smartphone | 207 | 87.0% |
| Tablet | 184 | 77.3% |
| No Computing Device | 16 | 6.7% |
| Total | 238 | 100.0% |
Internet Access in Beech Bottom
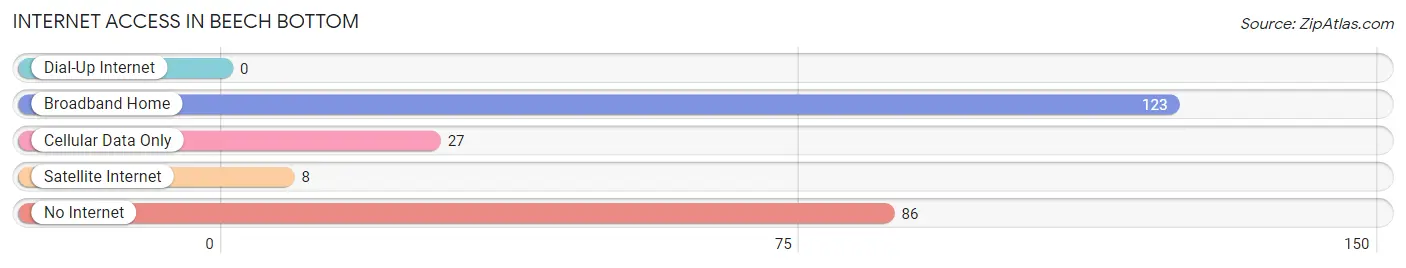
| Internet Type | # Households | % Households |
| Dial-Up Internet | 0 | 0.0% |
| Broadband Home | 123 | 51.7% |
| Cellular Data Only | 27 | 11.3% |
| Satellite Internet | 8 | 3.4% |
| No Internet | 86 | 36.1% |
| Total | 238 | 100.0% |
Beech Bottom Summary
Beech Bottom is a small town located in Brooke County, West Virginia. It is situated along the Ohio River, just south of the city of Wheeling. The town has a population of approximately 1,000 people and is part of the Weirton-Steubenville Metropolitan Statistical Area.
Geography
Beech Bottom is located in the northern panhandle of West Virginia, along the Ohio River. It is situated in the northern part of Brooke County, just south of the city of Wheeling. The town is located at an elevation of 845 feet above sea level. The town is surrounded by rolling hills and wooded areas, and is located in the Appalachian Plateau region of the state.
The climate in Beech Bottom is classified as humid continental, with hot summers and cold winters. The average annual temperature is around 50 degrees Fahrenheit, with average highs in the summer reaching around 80 degrees and lows in the winter reaching around 20 degrees. The average annual precipitation is around 40 inches, with most of the precipitation occurring in the spring and summer months.
History
Beech Bottom was first settled in the early 1800s by a group of German immigrants. The town was originally known as “Beech Bottom Settlement” and was located along the Ohio River. The town was officially incorporated in 1872 and was named after the nearby Beech Bottom Creek.
The town grew slowly over the years, and by the early 1900s, it had become a thriving community. The town was home to several businesses, including a sawmill, a gristmill, a blacksmith shop, and a general store. The town also had a post office, a school, and several churches.
In the late 1800s and early 1900s, Beech Bottom was a popular destination for tourists. The town was known for its scenic views of the Ohio River and its surrounding hills. The town was also home to several resorts, including the Beech Bottom Hotel, which was built in 1891.
Economy
The economy of Beech Bottom is largely based on the service industry. The town is home to several restaurants, bars, and other businesses that cater to tourists and locals alike. The town is also home to several manufacturing companies, including a steel mill and a paper mill.
The town is also home to several small businesses, including a grocery store, a hardware store, and a pharmacy. The town is also home to several banks and other financial institutions.
Demographics
As of the 2010 census, the population of Beech Bottom was 1,000 people. The racial makeup of the town was 97.2% White, 0.7% African American, 0.3% Native American, 0.2% Asian, and 1.6% from other races. The median household income was $30,000, and the median family income was $35,000.
The town is home to several churches, including the Beech Bottom United Methodist Church, the Beech Bottom Baptist Church, and the Beech Bottom Presbyterian Church. The town is also home to several schools, including Beech Bottom Elementary School and Beech Bottom High School.
Conclusion
Beech Bottom is a small town located in Brooke County, West Virginia. It is situated along the Ohio River, just south of the city of Wheeling. The town has a population of approximately 1,000 people and is part of the Weirton-Steubenville Metropolitan Statistical Area. The town’s economy is largely based on the service industry, and it is home to several manufacturing companies, small businesses, and financial institutions. The town is also home to several churches and schools.
Common Questions
What is Per Capita Income in Beech Bottom?
Per Capita income in Beech Bottom is $19,987.
What is the Median Family Income in Beech Bottom?
Median Family Income in Beech Bottom is $70,313.
What is the Median Household income in Beech Bottom?
Median Household Income in Beech Bottom is $28,958.
What is Income or Wage Gap in Beech Bottom?
Income or Wage Gap in Beech Bottom is 28.4%.
Women in Beech Bottom earn 71.6 cents for every dollar earned by a man.
What is Inequality or Gini Index in Beech Bottom?
Inequality or Gini Index in Beech Bottom is 0.43.
What is the Total Population of Beech Bottom?
Total Population of Beech Bottom is 627.
What is the Total Male Population of Beech Bottom?
Total Male Population of Beech Bottom is 274.
What is the Total Female Population of Beech Bottom?
Total Female Population of Beech Bottom is 353.
What is the Ratio of Males per 100 Females in Beech Bottom?
There are 77.62 Males per 100 Females in Beech Bottom.
What is the Ratio of Females per 100 Males in Beech Bottom?
There are 128.83 Females per 100 Males in Beech Bottom.
What is the Median Population Age in Beech Bottom?
Median Population Age in Beech Bottom is 44.1 Years.
What is the Average Family Size in Beech Bottom
Average Family Size in Beech Bottom is 3.9 People.
What is the Average Household Size in Beech Bottom
Average Household Size in Beech Bottom is 2.6 People.
How Large is the Labor Force in Beech Bottom?
There are 312 People in the Labor Forcein in Beech Bottom.
What is the Percentage of People in the Labor Force in Beech Bottom?
63.5% of People are in the Labor Force in Beech Bottom.
What is the Unemployment Rate in Beech Bottom?
Unemployment Rate in Beech Bottom is 6.4%.