Beaver, WV Map & Demographics
Beaver Map
Beaver Overview
$29,533
PER CAPITA INCOME
$85,060
AVG FAMILY INCOME
$29,780
AVG HOUSEHOLD INCOME
64.8%
WAGE / INCOME GAP [ % ]
35.2¢/ $1
WAGE / INCOME GAP [ $ ]
0.42
INEQUALITY / GINI INDEX
918
TOTAL POPULATION
427
MALE POPULATION
491
FEMALE POPULATION
86.97
MALES / 100 FEMALES
114.99
FEMALES / 100 MALES
51.0
MEDIAN AGE
2.9
AVG FAMILY SIZE
2.0
AVG HOUSEHOLD SIZE
416
LABOR FORCE [ PEOPLE ]
50.0%
PERCENT IN LABOR FORCE
Beaver Zip Codes
Beaver Area Codes
Income in Beaver
Income Overview in Beaver
Per Capita Income in Beaver is $29,533, while median incomes of families and households are $85,060 and $29,780 respectively.
| Characteristic | Number | Measure |
| Per Capita Income | 918 | $29,533 |
| Median Family Income | 229 | $85,060 |
| Mean Family Income | 229 | $86,193 |
| Median Household Income | 450 | $29,780 |
| Mean Household Income | 450 | $56,476 |
| Income Deficit | 229 | $0 |
| Wage / Income Gap (%) | 918 | 64.79% |
| Wage / Income Gap ($) | 918 | 35.21¢ per $1 |
| Gini / Inequality Index | 918 | 0.42 |
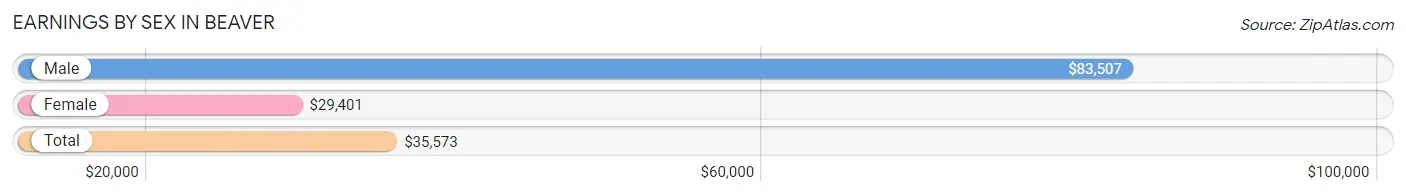
Earnings by Sex in Beaver
Average Earnings in Beaver are $35,573, $83,507 for men and $29,401 for women, a difference of 64.8%.
| Sex | Number | Average Earnings |
| Male | 160 (38.5%) | $83,507 |
| Female | 256 (61.5%) | $29,401 |
| Total | 416 (100.0%) | $35,573 |
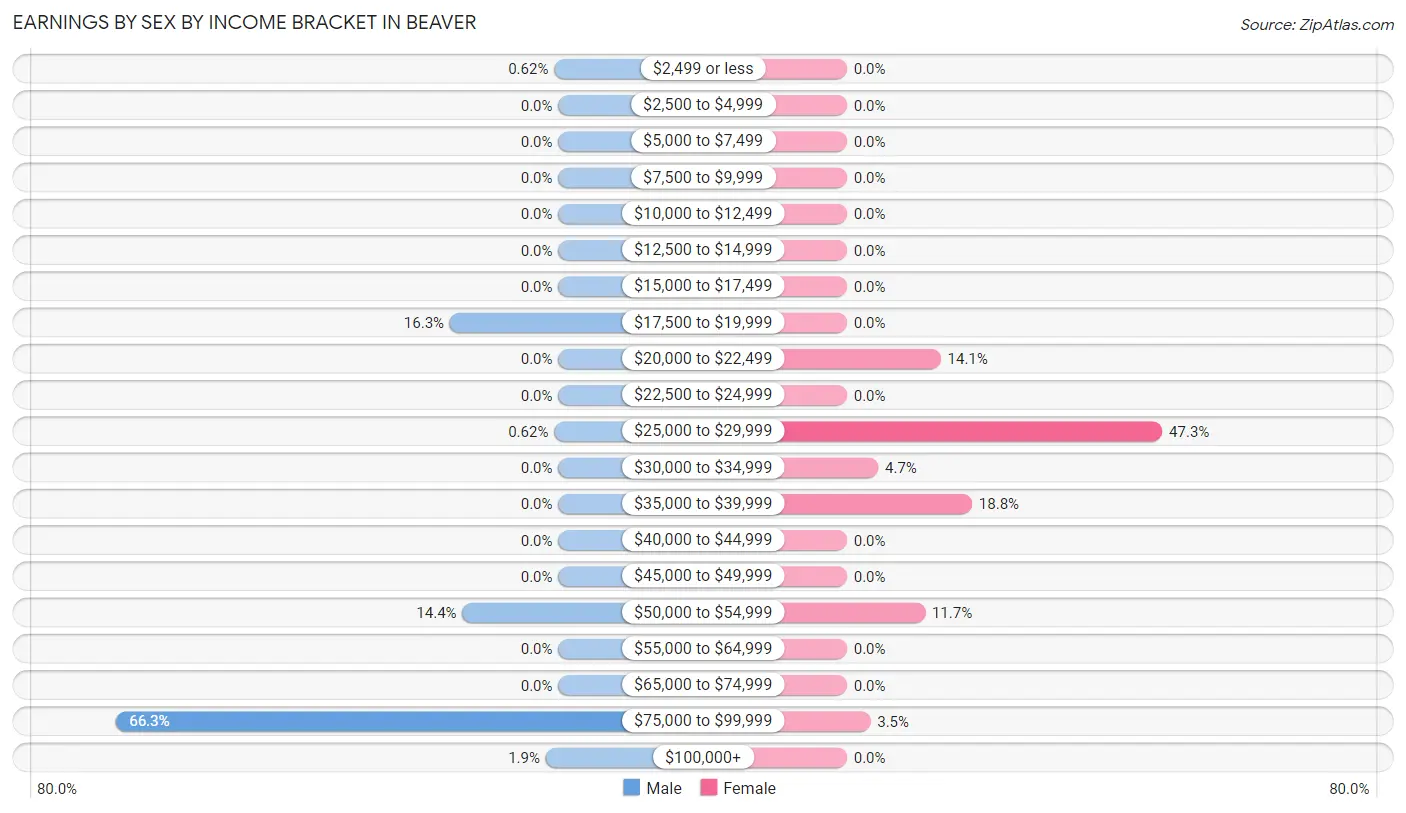
Earnings by Sex by Income Bracket in Beaver
The most common earnings brackets in Beaver are $75,000 to $99,999 for men (106 | 66.2%) and $25,000 to $29,999 for women (121 | 47.3%).
| Income | Male | Female |
| $2,499 or less | 1 (0.6%) | 0 (0.0%) |
| $2,500 to $4,999 | 0 (0.0%) | 0 (0.0%) |
| $5,000 to $7,499 | 0 (0.0%) | 0 (0.0%) |
| $7,500 to $9,999 | 0 (0.0%) | 0 (0.0%) |
| $10,000 to $12,499 | 0 (0.0%) | 0 (0.0%) |
| $12,500 to $14,999 | 0 (0.0%) | 0 (0.0%) |
| $15,000 to $17,499 | 0 (0.0%) | 0 (0.0%) |
| $17,500 to $19,999 | 26 (16.3%) | 0 (0.0%) |
| $20,000 to $22,499 | 0 (0.0%) | 36 (14.1%) |
| $22,500 to $24,999 | 0 (0.0%) | 0 (0.0%) |
| $25,000 to $29,999 | 1 (0.6%) | 121 (47.3%) |
| $30,000 to $34,999 | 0 (0.0%) | 12 (4.7%) |
| $35,000 to $39,999 | 0 (0.0%) | 48 (18.8%) |
| $40,000 to $44,999 | 0 (0.0%) | 0 (0.0%) |
| $45,000 to $49,999 | 0 (0.0%) | 0 (0.0%) |
| $50,000 to $54,999 | 23 (14.4%) | 30 (11.7%) |
| $55,000 to $64,999 | 0 (0.0%) | 0 (0.0%) |
| $65,000 to $74,999 | 0 (0.0%) | 0 (0.0%) |
| $75,000 to $99,999 | 106 (66.2%) | 9 (3.5%) |
| $100,000+ | 3 (1.9%) | 0 (0.0%) |
| Total | 160 (100.0%) | 256 (100.0%) |
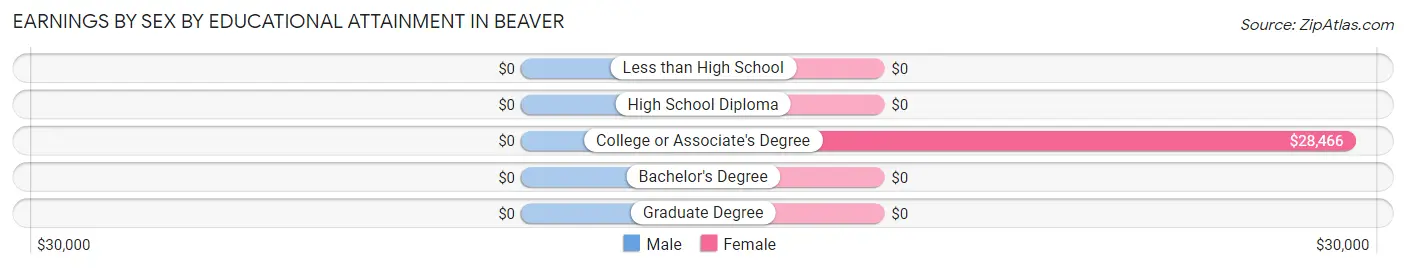
Earnings by Sex by Educational Attainment in Beaver
| Educational Attainment | Male Income | Female Income |
| Less than High School | - | - |
| High School Diploma | - | - |
| College or Associate's Degree | - | - |
| Bachelor's Degree | - | - |
| Graduate Degree | - | - |
| Total | $83,524 | $29,401 |
Family Income in Beaver
Family Income Brackets in Beaver
According to the Beaver family income data, there are 57 families falling into the $100,000 to $149,999 income range, which is the most common income bracket and makes up 24.9% of all families.
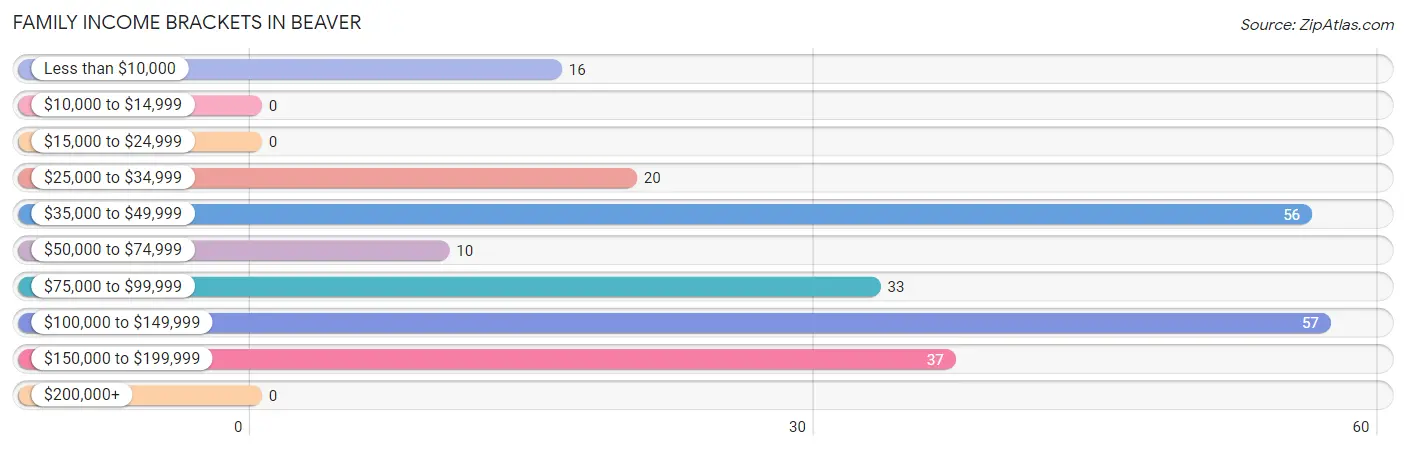
| Income Bracket | # Families | % Families |
| Less than $10,000 | 16 | 7.0% |
| $10,000 to $14,999 | 0 | 0.0% |
| $15,000 to $24,999 | 0 | 0.0% |
| $25,000 to $34,999 | 20 | 8.7% |
| $35,000 to $49,999 | 56 | 24.5% |
| $50,000 to $74,999 | 10 | 4.4% |
| $75,000 to $99,999 | 33 | 14.4% |
| $100,000 to $149,999 | 57 | 24.9% |
| $150,000 to $199,999 | 37 | 16.2% |
| $200,000+ | 0 | 0.0% |
Family Income by Famaliy Size in Beaver
2-person families (125 | 54.6%) account for the highest median family income in Beaver with $43,728 per family, while 2-person families (125 | 54.6%) have the highest median income of $21,864 per family member.
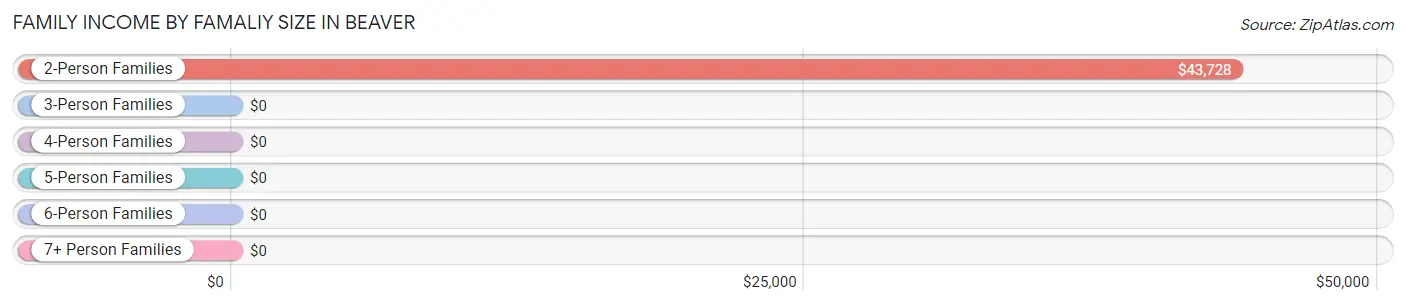
| Income Bracket | # Families | Median Income |
| 2-Person Families | 125 (54.6%) | $43,728 |
| 3-Person Families | 22 (9.6%) | $0 |
| 4-Person Families | 82 (35.8%) | $0 |
| 5-Person Families | 0 (0.0%) | $0 |
| 6-Person Families | 0 (0.0%) | $0 |
| 7+ Person Families | 0 (0.0%) | $0 |
| Total | 229 (100.0%) | $85,060 |
Family Income by Number of Earners in Beaver
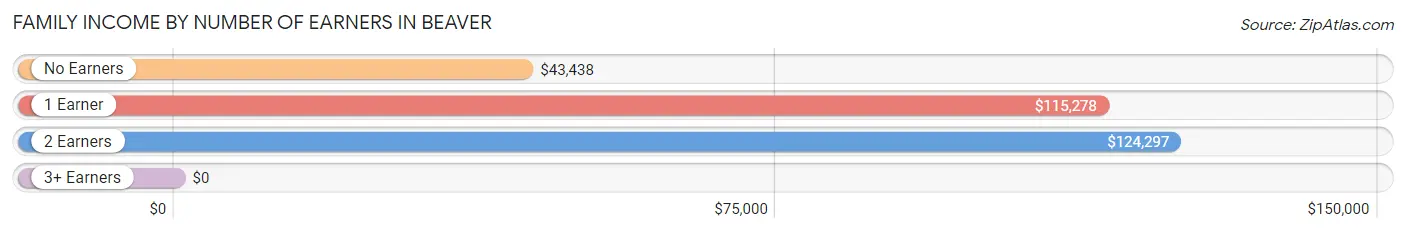
| Number of Earners | # Families | Median Income |
| No Earners | 112 (48.9%) | $43,438 |
| 1 Earner | 22 (9.6%) | $115,278 |
| 2 Earners | 95 (41.5%) | $124,297 |
| 3+ Earners | 0 (0.0%) | $0 |
| Total | 229 (100.0%) | $85,060 |
Household Income in Beaver
Household Income Brackets in Beaver
With 199 households falling in the category, the $25,000 to $34,999 income range is the most frequent in Beaver, accounting for 44.2% of all households.
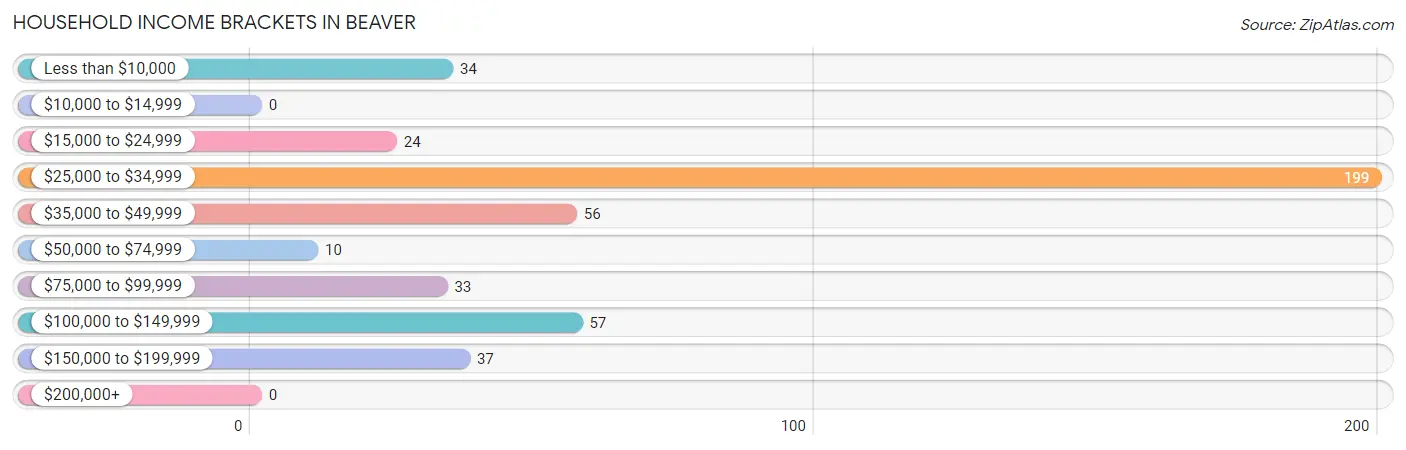
| Income Bracket | # Households | % Households |
| Less than $10,000 | 34 | 7.6% |
| $10,000 to $14,999 | 0 | 0.0% |
| $15,000 to $24,999 | 24 | 5.3% |
| $25,000 to $34,999 | 199 | 44.2% |
| $35,000 to $49,999 | 56 | 12.4% |
| $50,000 to $74,999 | 10 | 2.2% |
| $75,000 to $99,999 | 33 | 7.3% |
| $100,000 to $149,999 | 57 | 12.7% |
| $150,000 to $199,999 | 37 | 8.2% |
| $200,000+ | 0 | 0.0% |
Household Income by Householder Age in Beaver

| Income Bracket | # Households | Median Income |
| 15 to 24 Years | 0 (0.0%) | $0 |
| 25 to 44 Years | 115 (25.6%) | $0 |
| 45 to 64 Years | 210 (46.7%) | $0 |
| 65+ Years | 125 (27.8%) | $0 |
| Total | 450 (100.0%) | $29,780 |
Poverty in Beaver
Income Below Poverty by Sex and Age in Beaver
With 11.2% poverty level for males and 7.1% for females among the residents of Beaver, 75 year old and over males and 75 year old and over females are the most vulnerable to poverty, with 16 males (22.2%) and 17 females (41.5%) in their respective age groups living below the poverty level.
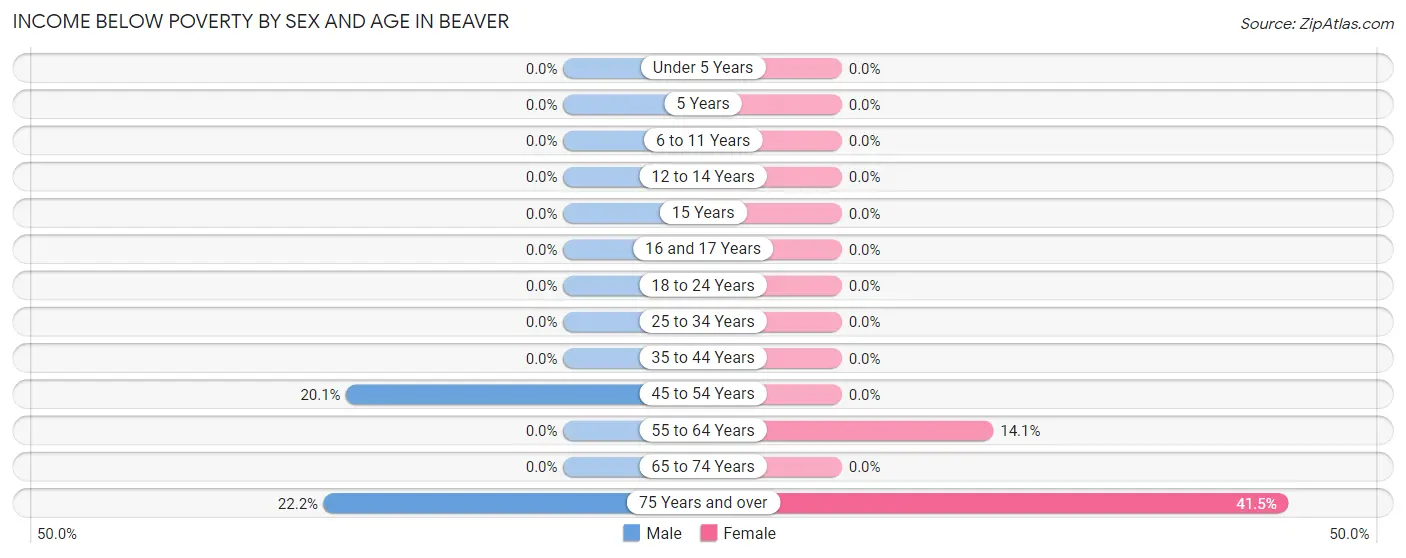
| Age Bracket | Male | Female |
| Under 5 Years | 0 (0.0%) | 0 (0.0%) |
| 5 Years | 0 (0.0%) | 0 (0.0%) |
| 6 to 11 Years | 0 (0.0%) | 0 (0.0%) |
| 12 to 14 Years | 0 (0.0%) | 0 (0.0%) |
| 15 Years | 0 (0.0%) | 0 (0.0%) |
| 16 and 17 Years | 0 (0.0%) | 0 (0.0%) |
| 18 to 24 Years | 0 (0.0%) | 0 (0.0%) |
| 25 to 34 Years | 0 (0.0%) | 0 (0.0%) |
| 35 to 44 Years | 0 (0.0%) | 0 (0.0%) |
| 45 to 54 Years | 32 (20.1%) | 0 (0.0%) |
| 55 to 64 Years | 0 (0.0%) | 18 (14.1%) |
| 65 to 74 Years | 0 (0.0%) | 0 (0.0%) |
| 75 Years and over | 16 (22.2%) | 17 (41.5%) |
| Total | 48 (11.2%) | 35 (7.1%) |
Income Above Poverty by Sex and Age in Beaver
According to the poverty statistics in Beaver, males aged 12 to 14 years and females aged under 5 years are the age groups that are most secure financially, with 100.0% of males and 100.0% of females in these age groups living above the poverty line.
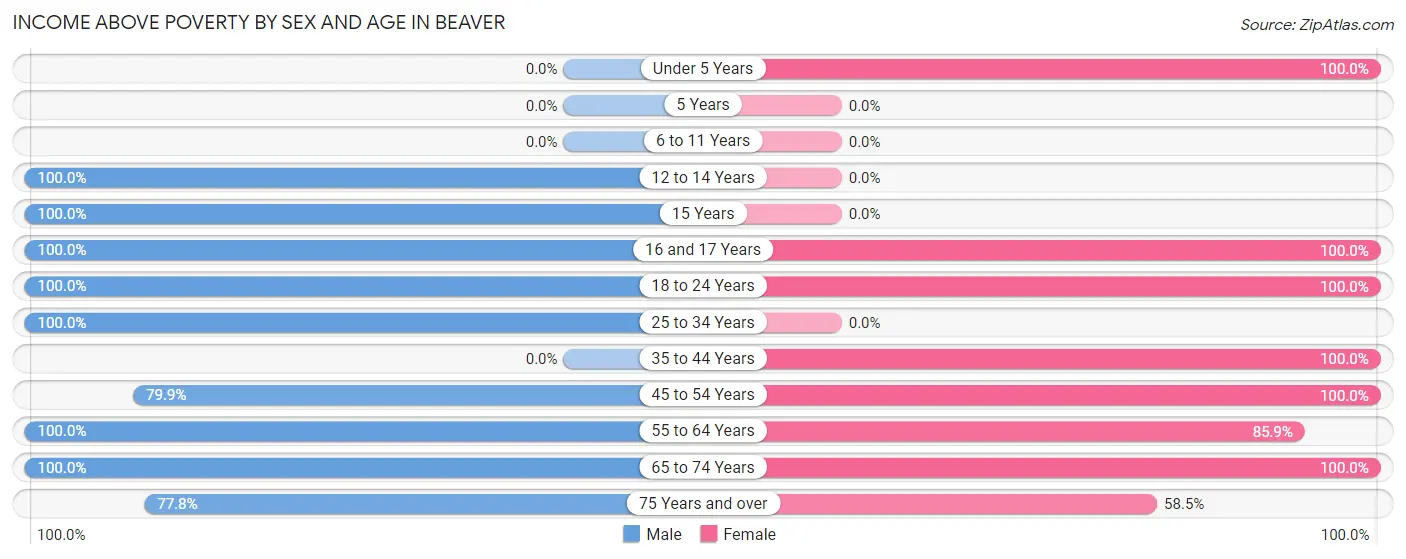
| Age Bracket | Male | Female |
| Under 5 Years | 0 (0.0%) | 1 (100.0%) |
| 5 Years | 0 (0.0%) | 0 (0.0%) |
| 6 to 11 Years | 0 (0.0%) | 0 (0.0%) |
| 12 to 14 Years | 58 (100.0%) | 0 (0.0%) |
| 15 Years | 27 (100.0%) | 0 (0.0%) |
| 16 and 17 Years | 1 (100.0%) | 48 (100.0%) |
| 18 to 24 Years | 28 (100.0%) | 40 (100.0%) |
| 25 to 34 Years | 1 (100.0%) | 0 (0.0%) |
| 35 to 44 Years | 0 (0.0%) | 150 (100.0%) |
| 45 to 54 Years | 127 (79.9%) | 39 (100.0%) |
| 55 to 64 Years | 52 (100.0%) | 110 (85.9%) |
| 65 to 74 Years | 29 (100.0%) | 44 (100.0%) |
| 75 Years and over | 56 (77.8%) | 24 (58.5%) |
| Total | 379 (88.8%) | 456 (92.9%) |
Income Below Poverty Among Married-Couple Families in Beaver
The poverty statistics for married-couple families in Beaver show that 7.0% or 16 of the total 228 families live below the poverty line. Families with no children have the highest poverty rate of 11.0%, comprising of 16 families. On the other hand, families with 1 or 2 children have the lowest poverty rate of 0.0%, which includes 0 families.
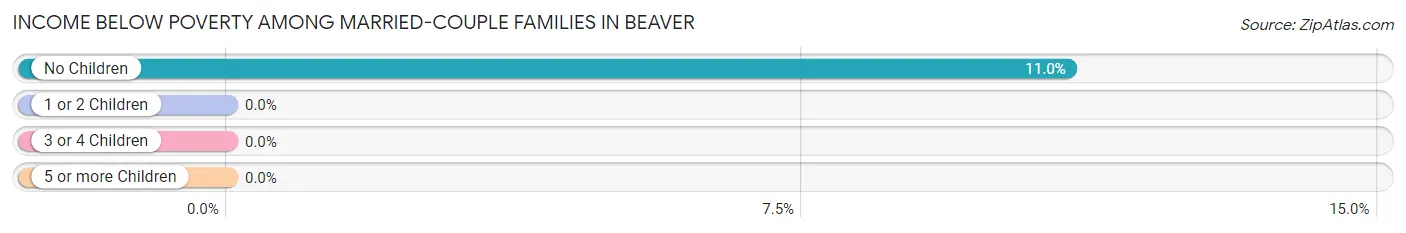
| Children | Above Poverty | Below Poverty |
| No Children | 130 (89.0%) | 16 (11.0%) |
| 1 or 2 Children | 82 (100.0%) | 0 (0.0%) |
| 3 or 4 Children | 0 (0.0%) | 0 (0.0%) |
| 5 or more Children | 0 (0.0%) | 0 (0.0%) |
| Total | 212 (93.0%) | 16 (7.0%) |
Income Below Poverty Among Single-Parent Households in Beaver
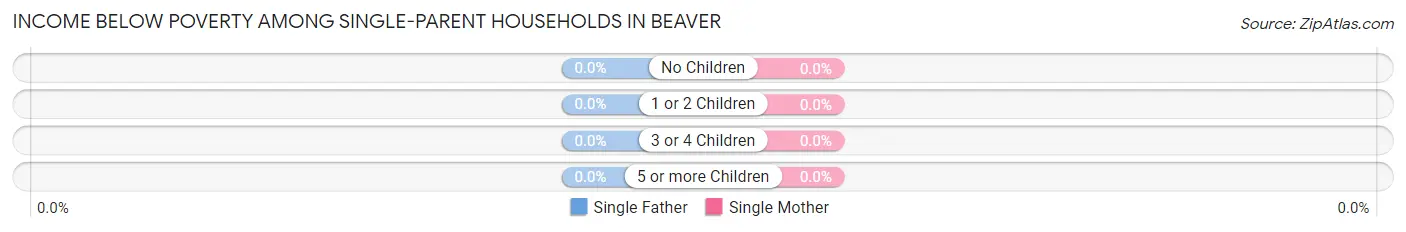
| Children | Single Father | Single Mother |
| No Children | 0 (0.0%) | 0 (0.0%) |
| 1 or 2 Children | 0 (0.0%) | 0 (0.0%) |
| 3 or 4 Children | 0 (0.0%) | 0 (0.0%) |
| 5 or more Children | 0 (0.0%) | 0 (0.0%) |
| Total | 0 (0.0%) | 0 (0.0%) |
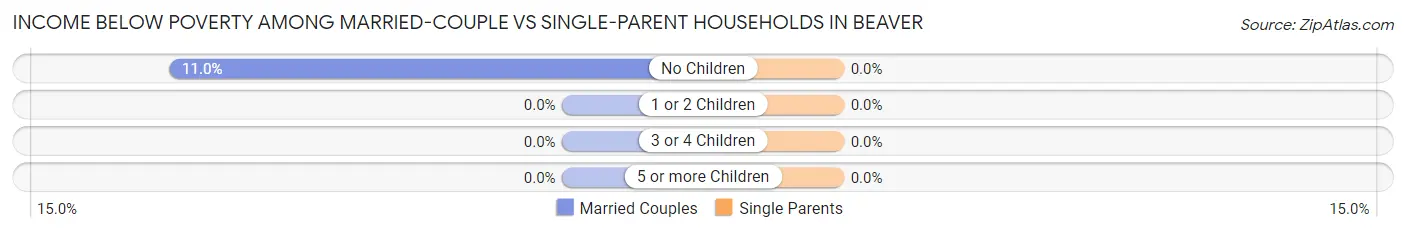
Income Below Poverty Among Married-Couple vs Single-Parent Households in Beaver
| Children | Married-Couple Families | Single-Parent Households |
| No Children | 16 (11.0%) | 0 (0.0%) |
| 1 or 2 Children | 0 (0.0%) | 0 (0.0%) |
| 3 or 4 Children | 0 (0.0%) | 0 (0.0%) |
| 5 or more Children | 0 (0.0%) | 0 (0.0%) |
| Total | 16 (7.0%) | 0 (0.0%) |
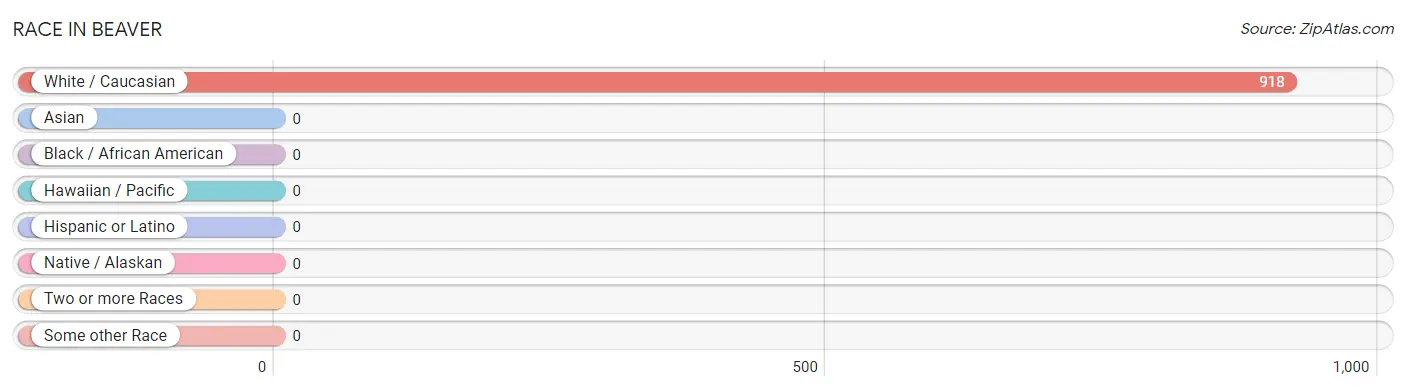
Race in Beaver
The most populous races in Beaver are , and White / Caucasian (918 | 100.0%).
| Race | # Population | % Population |
| Asian | 0 | 0.0% |
| Black / African American | 0 | 0.0% |
| Hawaiian / Pacific | 0 | 0.0% |
| Hispanic or Latino | 0 | 0.0% |
| Native / Alaskan | 0 | 0.0% |
| White / Caucasian | 918 | 100.0% |
| Two or more Races | 0 | 0.0% |
| Some other Race | 0 | 0.0% |
| Total | 918 | 100.0% |
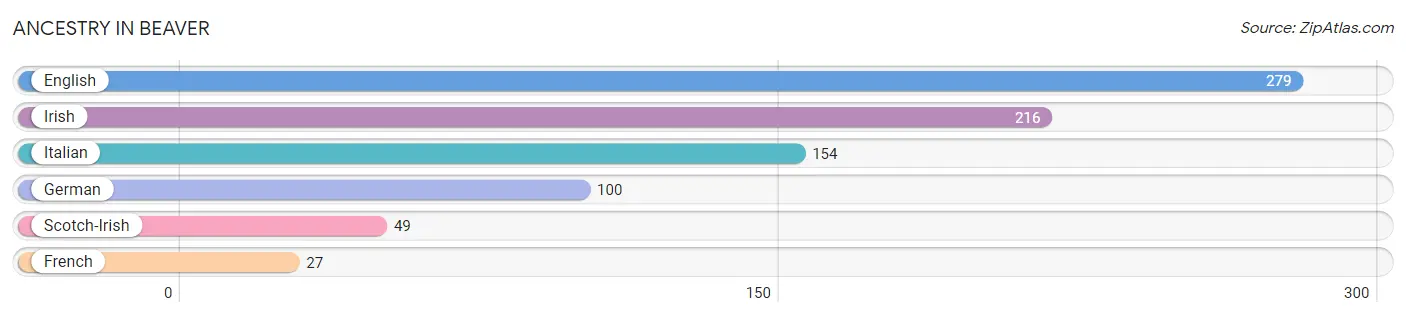
Ancestry in Beaver
The most populous ancestries reported in Beaver are English (279 | 30.4%), Irish (216 | 23.5%), Italian (154 | 16.8%), German (100 | 10.9%), and Scotch-Irish (49 | 5.3%), together accounting for 86.9% of all Beaver residents.
| Ancestry | # Population | % Population |
| English | 279 | 30.4% |
| French | 27 | 2.9% |
| German | 100 | 10.9% |
| Irish | 216 | 23.5% |
| Italian | 154 | 16.8% |
| Scotch-Irish | 49 | 5.3% | View All 6 Rows |
Immigrants in Beaver

| Immigration Origin | # Population | % Population | View All 0 Rows |
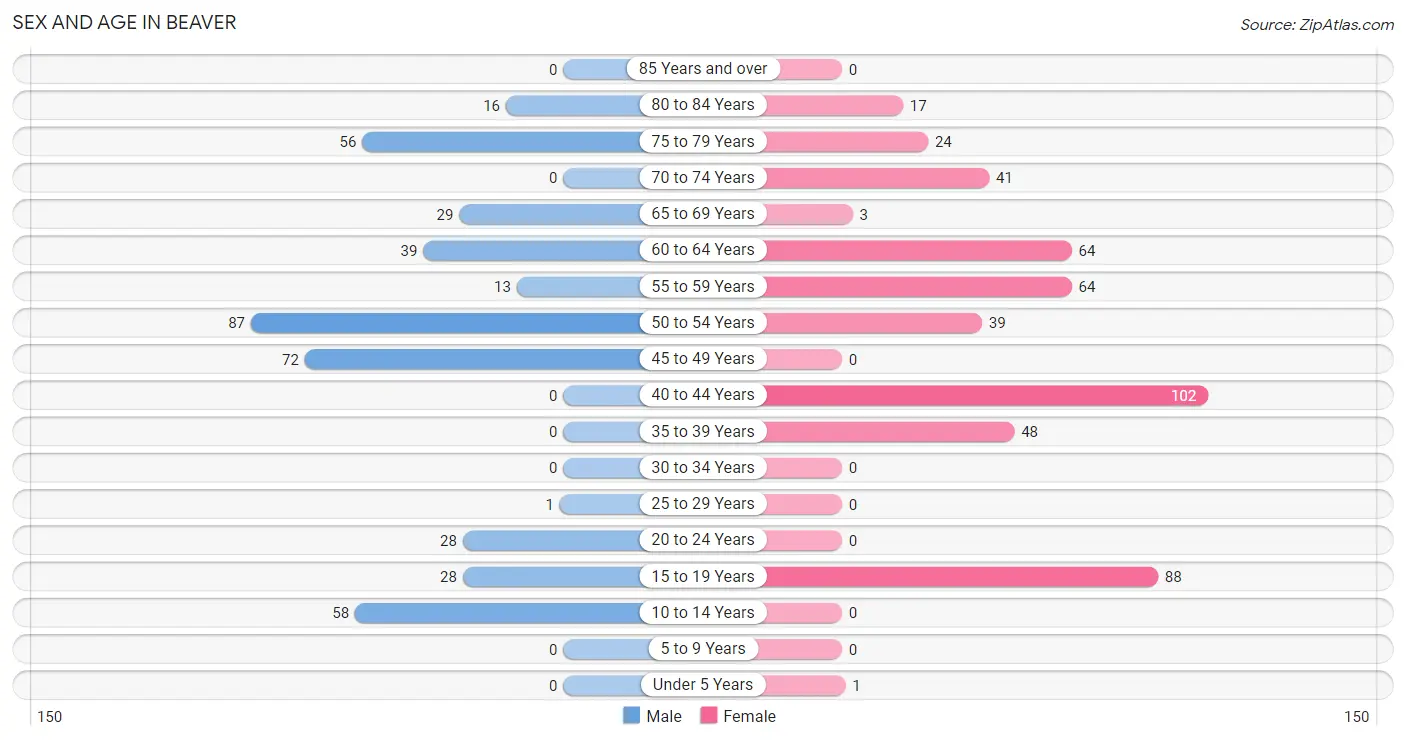
Sex and Age in Beaver
Sex and Age in Beaver
The most populous age groups in Beaver are 50 to 54 Years (87 | 20.4%) for men and 40 to 44 Years (102 | 20.8%) for women.
| Age Bracket | Male | Female |
| Under 5 Years | 0 (0.0%) | 1 (0.2%) |
| 5 to 9 Years | 0 (0.0%) | 0 (0.0%) |
| 10 to 14 Years | 58 (13.6%) | 0 (0.0%) |
| 15 to 19 Years | 28 (6.6%) | 88 (17.9%) |
| 20 to 24 Years | 28 (6.6%) | 0 (0.0%) |
| 25 to 29 Years | 1 (0.2%) | 0 (0.0%) |
| 30 to 34 Years | 0 (0.0%) | 0 (0.0%) |
| 35 to 39 Years | 0 (0.0%) | 48 (9.8%) |
| 40 to 44 Years | 0 (0.0%) | 102 (20.8%) |
| 45 to 49 Years | 72 (16.9%) | 0 (0.0%) |
| 50 to 54 Years | 87 (20.4%) | 39 (7.9%) |
| 55 to 59 Years | 13 (3.0%) | 64 (13.0%) |
| 60 to 64 Years | 39 (9.1%) | 64 (13.0%) |
| 65 to 69 Years | 29 (6.8%) | 3 (0.6%) |
| 70 to 74 Years | 0 (0.0%) | 41 (8.4%) |
| 75 to 79 Years | 56 (13.1%) | 24 (4.9%) |
| 80 to 84 Years | 16 (3.7%) | 17 (3.5%) |
| 85 Years and over | 0 (0.0%) | 0 (0.0%) |
| Total | 427 (100.0%) | 491 (100.0%) |
Families and Households in Beaver
Median Family Size in Beaver
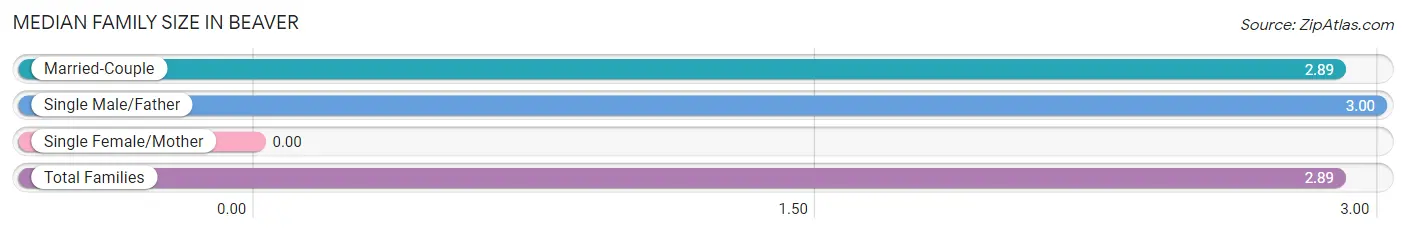
| Family Type | # Families | Family Size |
| Married-Couple | 228 (99.6%) | 2.89 |
| Single Male/Father | 1 (0.4%) | 3.00 |
| Single Female/Mother | 0 (0.0%) | - |
| Total Families | 229 (100.0%) | 2.89 |
Median Household Size in Beaver
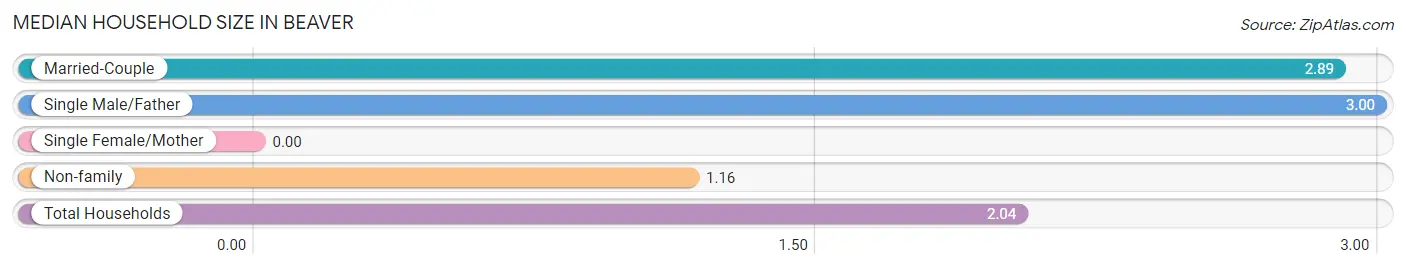
| Household Type | # Households | Household Size |
| Married-Couple | 228 (50.7%) | 2.89 |
| Single Male/Father | 1 (0.2%) | 3.00 |
| Single Female/Mother | 0 (0.0%) | - |
| Non-family | 221 (49.1%) | 1.16 |
| Total Households | 450 (100.0%) | 2.04 |
Household Size by Marriage Status in Beaver
Out of a total of 450 households in Beaver, 229 (50.9%) are family households, while 221 (49.1%) are nonfamily households. The most numerous type of family households are 2-person households, comprising 125, and the most common type of nonfamily households are 1-person households, comprising 189.
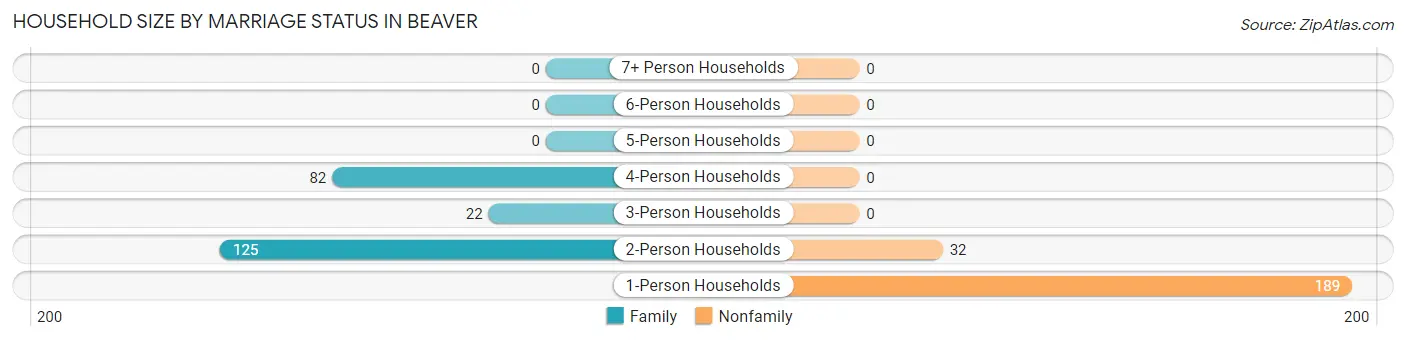
| Household Size | Family Households | Nonfamily Households |
| 1-Person Households | - | 189 (42.0%) |
| 2-Person Households | 125 (27.8%) | 32 (7.1%) |
| 3-Person Households | 22 (4.9%) | 0 (0.0%) |
| 4-Person Households | 82 (18.2%) | 0 (0.0%) |
| 5-Person Households | 0 (0.0%) | 0 (0.0%) |
| 6-Person Households | 0 (0.0%) | 0 (0.0%) |
| 7+ Person Households | 0 (0.0%) | 0 (0.0%) |
| Total | 229 (50.9%) | 221 (49.1%) |
Female Fertility in Beaver
Fertility by Age in Beaver
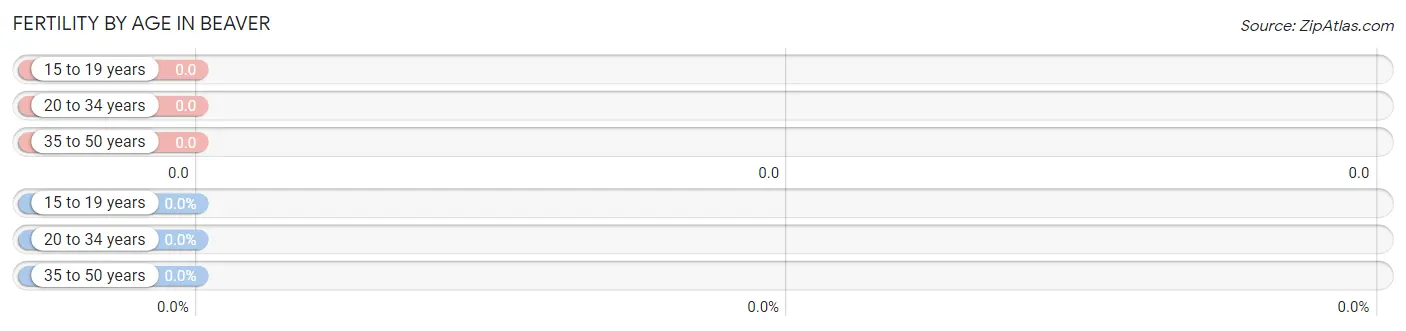
| Age Bracket | Women with Births | Births / 1,000 Women |
| 15 to 19 years | 0 (0.0%) | 0.0 |
| 20 to 34 years | 0 (0.0%) | 0.0 |
| 35 to 50 years | 0 (0.0%) | 0.0 |
| Total | 0 (0.0%) | 0.0 |
Fertility by Age by Marriage Status in Beaver
| Age Bracket | Married | Unmarried |
| 15 to 19 years | 0 (0.0%) | 0 (0.0%) |
| 20 to 34 years | 0 (0.0%) | 0 (0.0%) |
| 35 to 50 years | 0 (0.0%) | 0 (0.0%) |
| Total | 0 (0.0%) | 0 (0.0%) |
Fertility by Education in Beaver
| Educational Attainment | Women with Births | Births / 1,000 Women |
| Less than High School | 0 (0.0%) | 0.0 |
| High School Diploma | 0 (0.0%) | 0.0 |
| College or Associate's Degree | 0 (0.0%) | 0.0 |
| Bachelor's Degree | 0 (0.0%) | 0.0 |
| Graduate Degree | 0 (0.0%) | 0.0 |
| Total | 0 (0.0%) | 0.0 |
Fertility by Education by Marriage Status in Beaver
| Educational Attainment | Married | Unmarried |
| Less than High School | 0 (0.0%) | 0 (0.0%) |
| High School Diploma | 0 (0.0%) | 0 (0.0%) |
| College or Associate's Degree | 0 (0.0%) | 0 (0.0%) |
| Bachelor's Degree | 0 (0.0%) | 0 (0.0%) |
| Graduate Degree | 0 (0.0%) | 0 (0.0%) |
| Total | 0 (0.0%) | 0 (0.0%) |
Employment Characteristics in Beaver
Employment by Class of Employer in Beaver
Among the 386 employed individuals in Beaver, private company employees (271 | 70.2%), self-employed (not incorporated) (67 | 17.4%), and not-for-profit organizations (29 | 7.5%) make up the most common classes of employment.
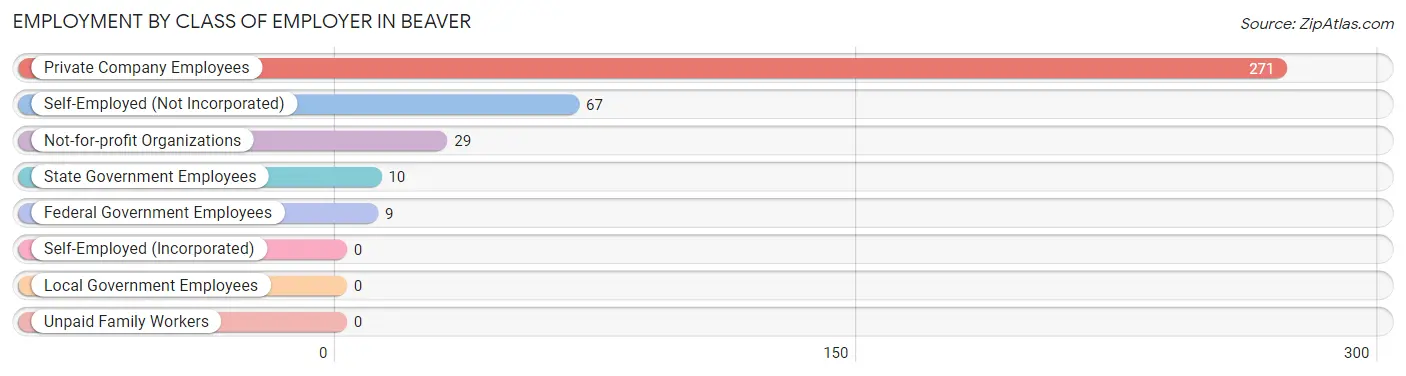
| Employer Class | # Employees | % Employees |
| Private Company Employees | 271 | 70.2% |
| Self-Employed (Incorporated) | 0 | 0.0% |
| Self-Employed (Not Incorporated) | 67 | 17.4% |
| Not-for-profit Organizations | 29 | 7.5% |
| Local Government Employees | 0 | 0.0% |
| State Government Employees | 10 | 2.6% |
| Federal Government Employees | 9 | 2.3% |
| Unpaid Family Workers | 0 | 0.0% |
| Total | 386 | 100.0% |
Employment Status by Age in Beaver
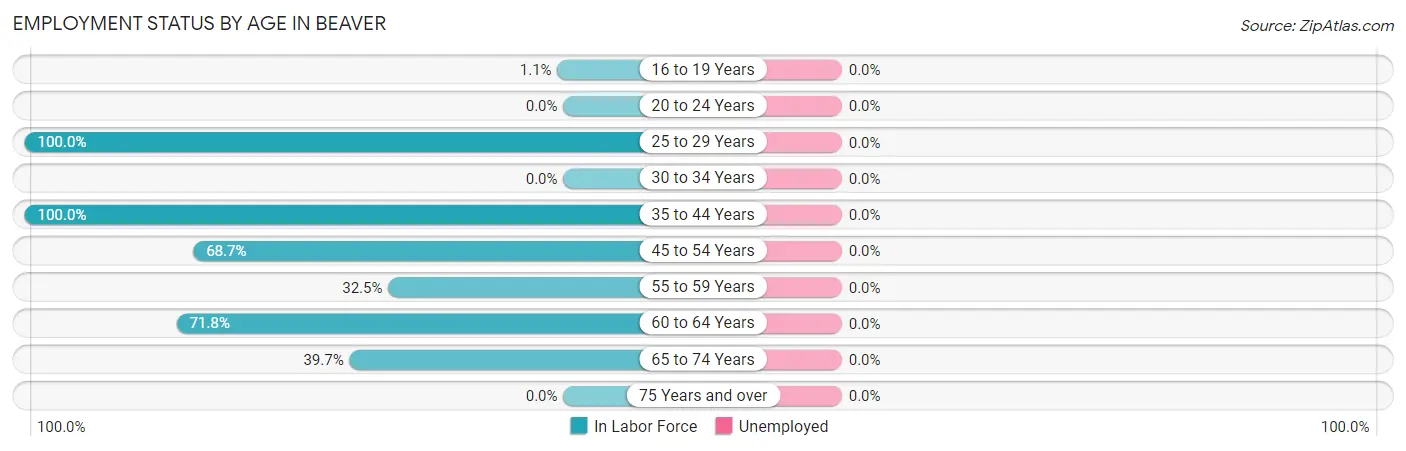
| Age Bracket | In Labor Force | Unemployed |
| 16 to 19 Years | 1 (1.1%) | 0 (0.0%) |
| 20 to 24 Years | 0 (0.0%) | 0 (0.0%) |
| 25 to 29 Years | 1 (100.0%) | 0 (0.0%) |
| 30 to 34 Years | 0 (0.0%) | 0 (0.0%) |
| 35 to 44 Years | 150 (100.0%) | 0 (0.0%) |
| 45 to 54 Years | 136 (68.7%) | 0 (0.0%) |
| 55 to 59 Years | 25 (32.5%) | 0 (0.0%) |
| 60 to 64 Years | 74 (71.8%) | 0 (0.0%) |
| 65 to 74 Years | 29 (39.7%) | 0 (0.0%) |
| 75 Years and over | 0 (0.0%) | 0 (0.0%) |
| Total | 416 (50.0%) | 0 (0.0%) |
Employment Status by Educational Attainment in Beaver
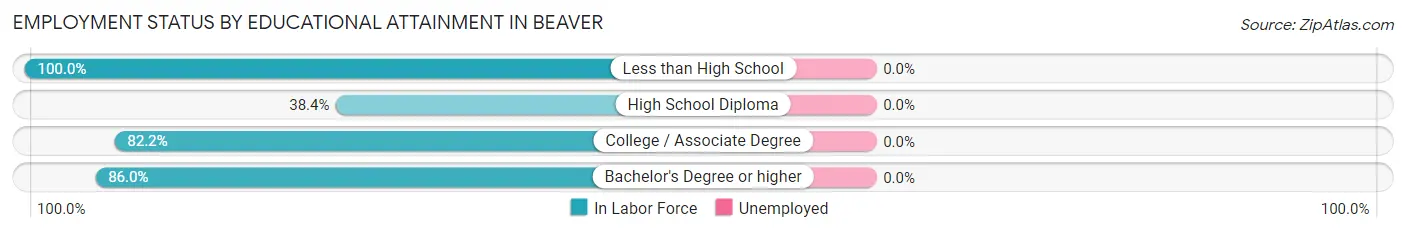
| Educational Attainment | In Labor Force | Unemployed |
| Less than High School | 1 (100.0%) | 0 (0.0%) |
| High School Diploma | 48 (38.4%) | 0 (0.0%) |
| College / Associate Degree | 208 (82.2%) | 0 (0.0%) |
| Bachelor's Degree or higher | 129 (86.0%) | 0 (0.0%) |
| Total | 386 (73.0%) | 0 (0.0%) |
Employment Occupations by Sex in Beaver
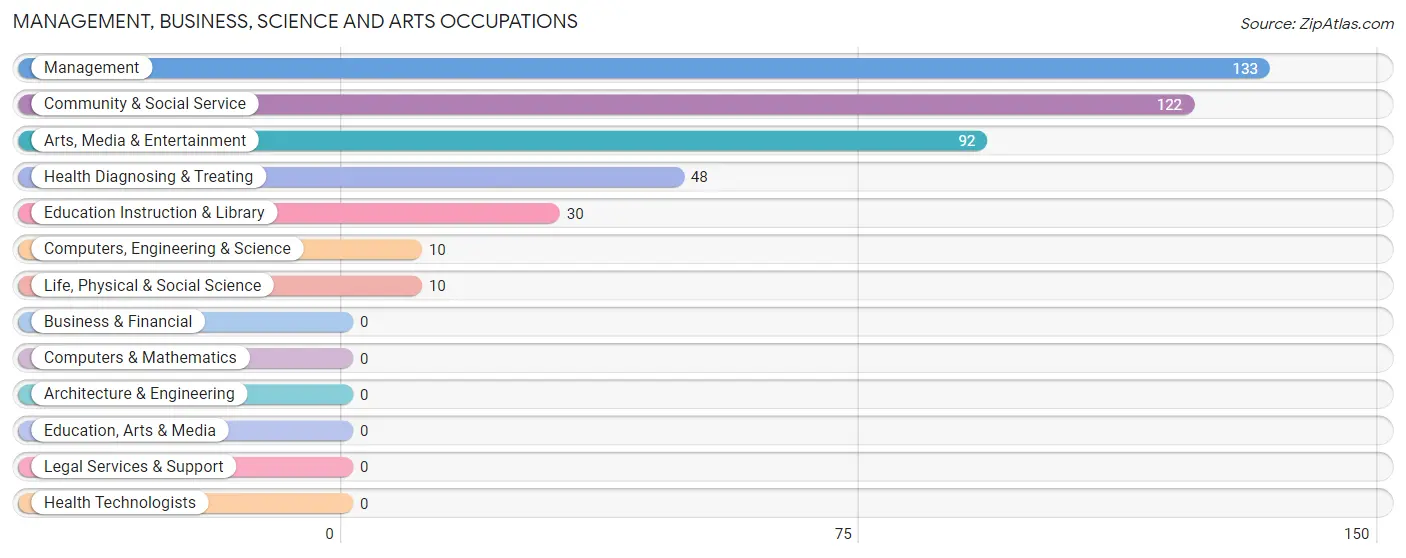
Management, Business, Science and Arts Occupations
The most common Management, Business, Science and Arts occupations in Beaver are Management (133 | 32.0%), Community & Social Service (122 | 29.3%), Arts, Media & Entertainment (92 | 22.1%), Health Diagnosing & Treating (48 | 11.5%), and Education Instruction & Library (30 | 7.2%).
Management, Business, Science and Arts Occupations by Sex
Within the Management, Business, Science and Arts occupations in Beaver, the most male-oriented occupations are Computers, Engineering & Science (100.0%), Life, Physical & Social Science (100.0%), and Management (66.2%), while the most female-oriented occupations are Education Instruction & Library (100.0%), Health Diagnosing & Treating (100.0%), and Community & Social Service (78.7%).
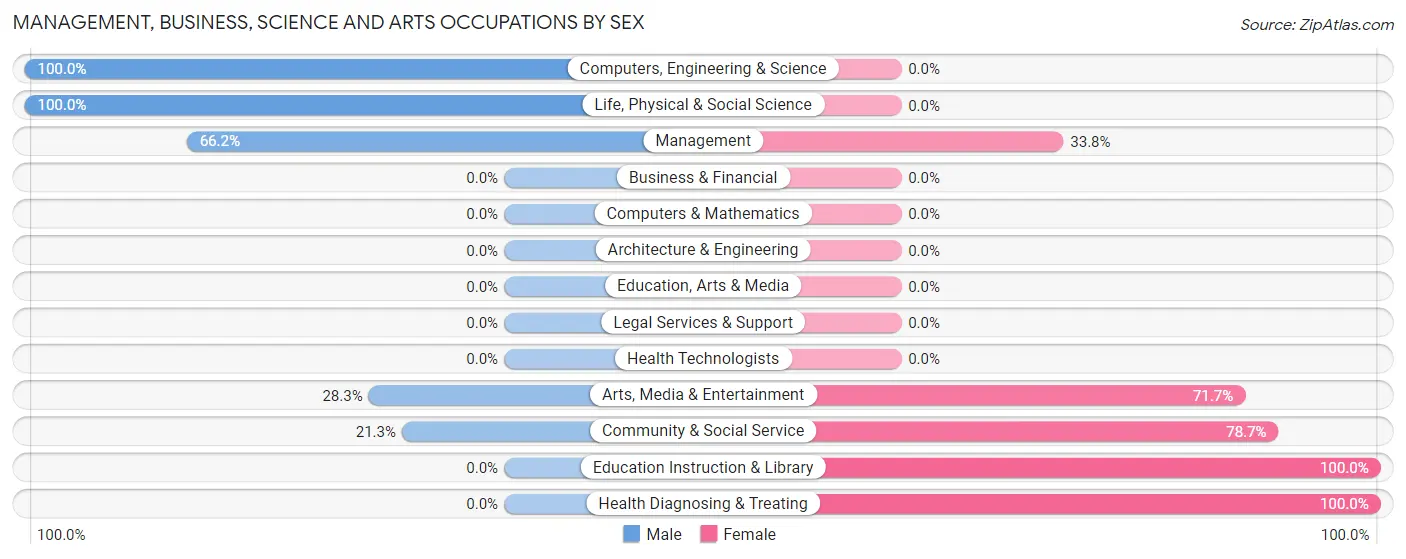
| Occupation | Male | Female |
| Management | 88 (66.2%) | 45 (33.8%) |
| Business & Financial | 0 (0.0%) | 0 (0.0%) |
| Computers, Engineering & Science | 10 (100.0%) | 0 (0.0%) |
| Computers & Mathematics | 0 (0.0%) | 0 (0.0%) |
| Architecture & Engineering | 0 (0.0%) | 0 (0.0%) |
| Life, Physical & Social Science | 10 (100.0%) | 0 (0.0%) |
| Community & Social Service | 26 (21.3%) | 96 (78.7%) |
| Education, Arts & Media | 0 (0.0%) | 0 (0.0%) |
| Legal Services & Support | 0 (0.0%) | 0 (0.0%) |
| Education Instruction & Library | 0 (0.0%) | 30 (100.0%) |
| Arts, Media & Entertainment | 26 (28.3%) | 66 (71.7%) |
| Health Diagnosing & Treating | 0 (0.0%) | 48 (100.0%) |
| Health Technologists | 0 (0.0%) | 0 (0.0%) |
| Total (Category) | 124 (39.6%) | 189 (60.4%) |
| Total (Overall) | 160 (38.5%) | 256 (61.5%) |
Services Occupations
The most common Services occupations in Beaver are , and Personal Care & Service (55 | 13.2%).
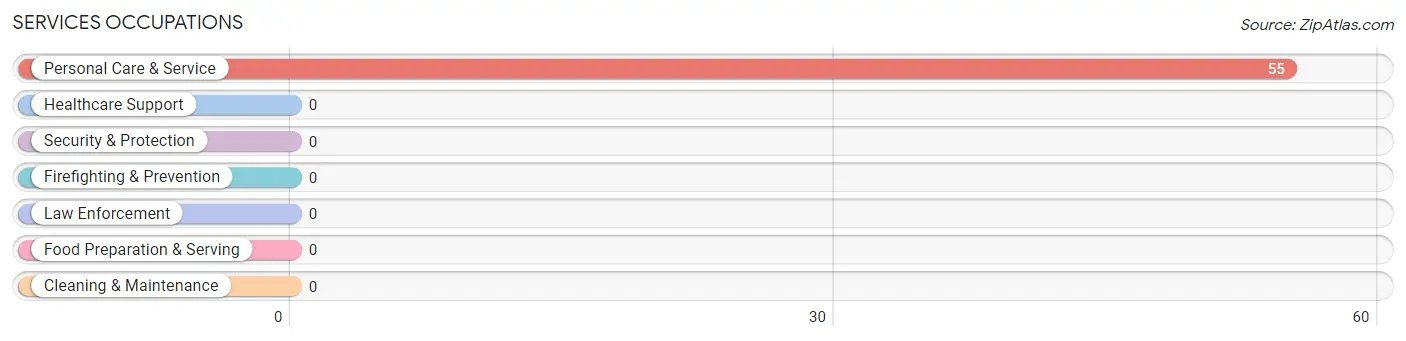
Services Occupations by Sex
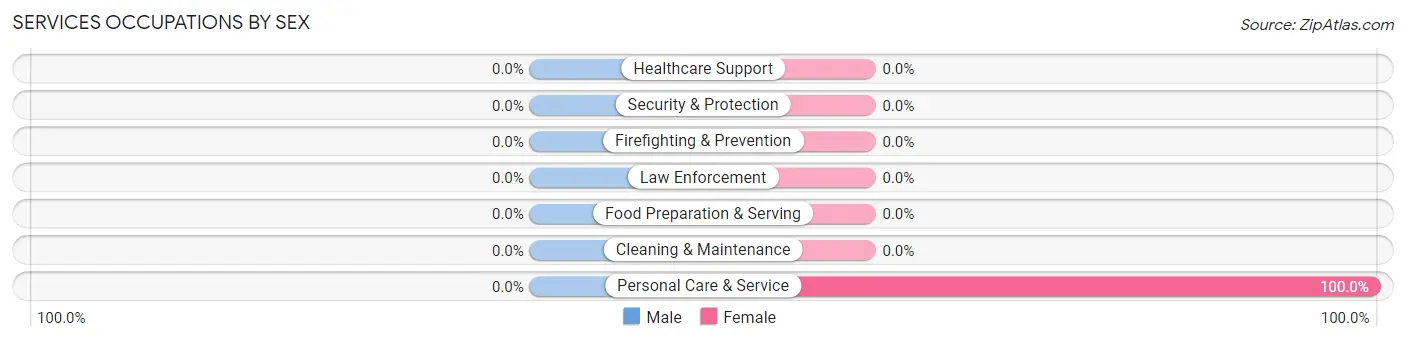
| Occupation | Male | Female |
| Healthcare Support | 0 (0.0%) | 0 (0.0%) |
| Security & Protection | 0 (0.0%) | 0 (0.0%) |
| Firefighting & Prevention | 0 (0.0%) | 0 (0.0%) |
| Law Enforcement | 0 (0.0%) | 0 (0.0%) |
| Food Preparation & Serving | 0 (0.0%) | 0 (0.0%) |
| Cleaning & Maintenance | 0 (0.0%) | 0 (0.0%) |
| Personal Care & Service | 0 (0.0%) | 55 (100.0%) |
| Total (Category) | 0 (0.0%) | 55 (100.0%) |
| Total (Overall) | 160 (38.5%) | 256 (61.5%) |
Sales and Office Occupations
The most common Sales and Office occupations in Beaver are , and Office & Administration (12 | 2.9%).
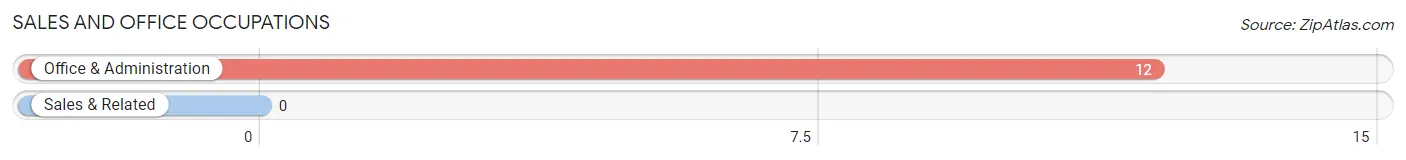
Sales and Office Occupations by Sex
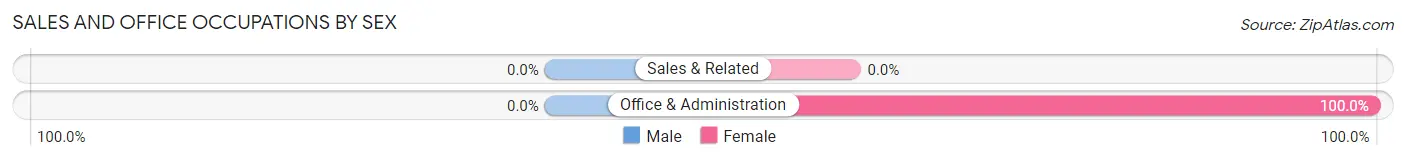
| Occupation | Male | Female |
| Sales & Related | 0 (0.0%) | 0 (0.0%) |
| Office & Administration | 0 (0.0%) | 12 (100.0%) |
| Total (Category) | 0 (0.0%) | 12 (100.0%) |
| Total (Overall) | 160 (38.5%) | 256 (61.5%) |
Natural Resources, Construction and Maintenance Occupations
The most common Natural Resources, Construction and Maintenance occupations in Beaver are , and Construction & Extraction (2 | 0.5%).
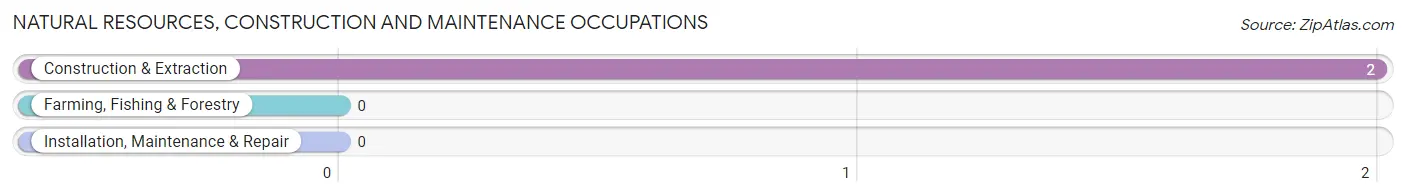
Natural Resources, Construction and Maintenance Occupations by Sex
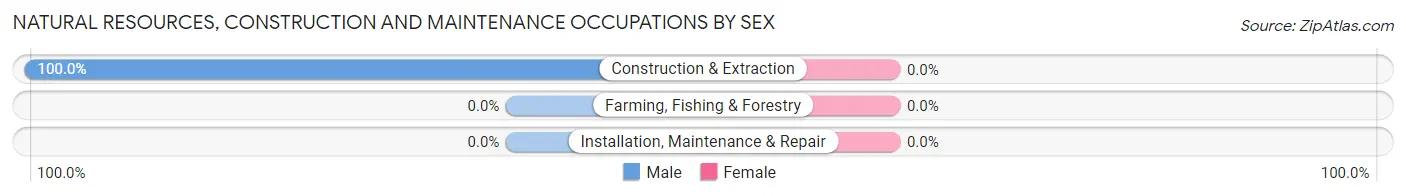
| Occupation | Male | Female |
| Farming, Fishing & Forestry | 0 (0.0%) | 0 (0.0%) |
| Construction & Extraction | 2 (100.0%) | 0 (0.0%) |
| Installation, Maintenance & Repair | 0 (0.0%) | 0 (0.0%) |
| Total (Category) | 2 (100.0%) | 0 (0.0%) |
| Total (Overall) | 160 (38.5%) | 256 (61.5%) |
Production, Transportation and Moving Occupations
The most common Production, Transportation and Moving occupations in Beaver are , and Production (34 | 8.2%).
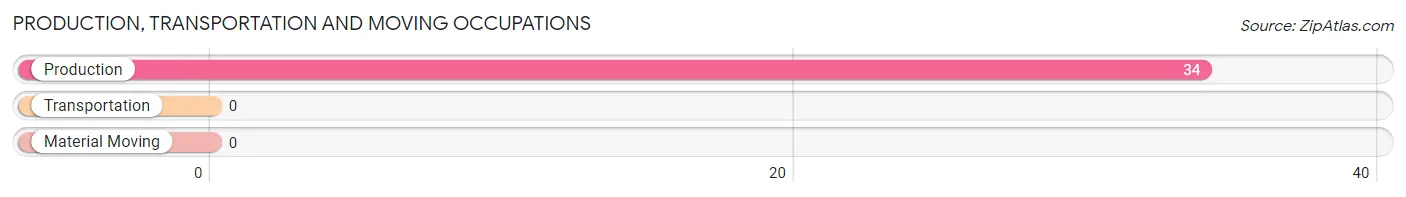
Production, Transportation and Moving Occupations by Sex
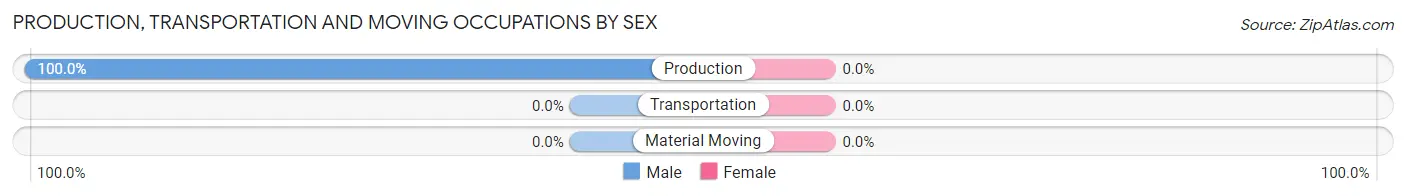
| Occupation | Male | Female |
| Production | 34 (100.0%) | 0 (0.0%) |
| Transportation | 0 (0.0%) | 0 (0.0%) |
| Material Moving | 0 (0.0%) | 0 (0.0%) |
| Total (Category) | 34 (100.0%) | 0 (0.0%) |
| Total (Overall) | 160 (38.5%) | 256 (61.5%) |
Employment Industries by Sex in Beaver
Employment Industries in Beaver
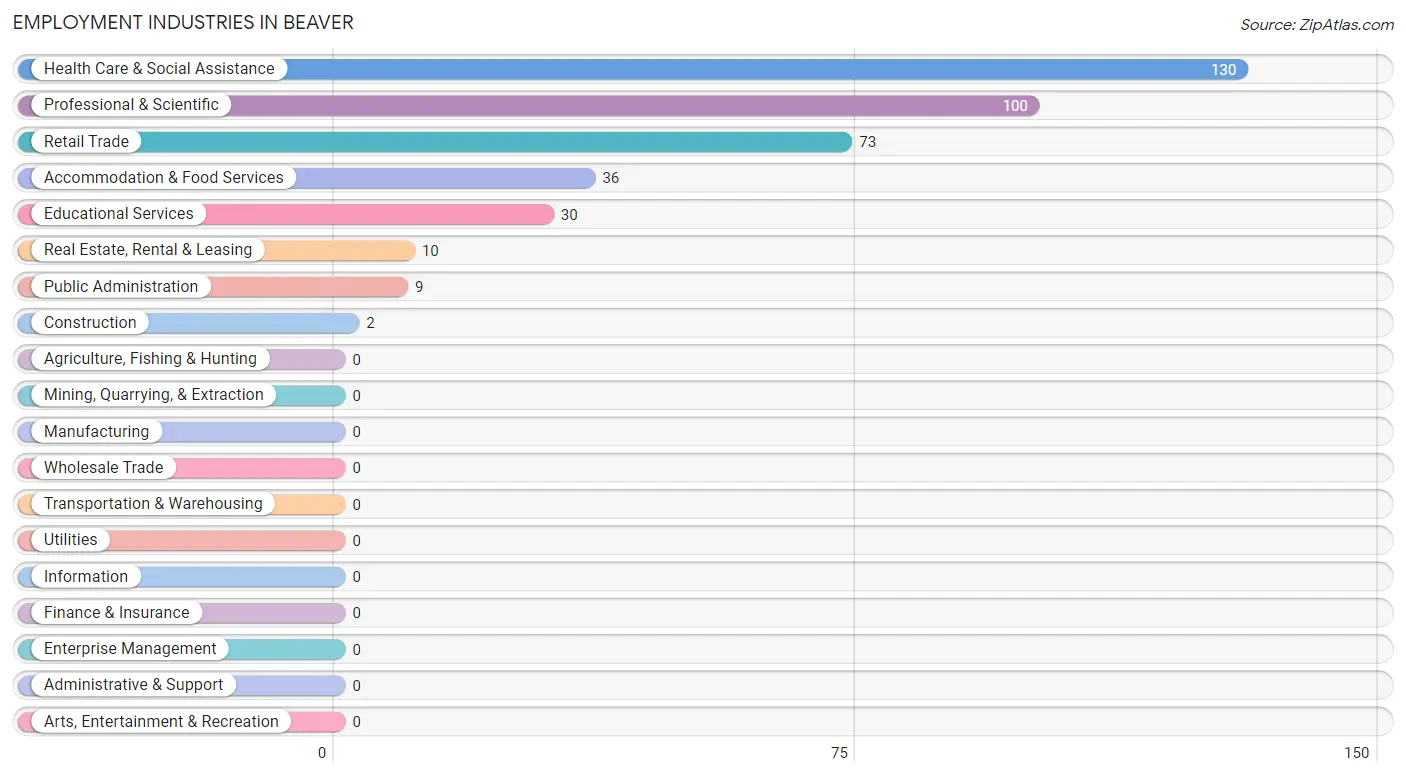
The major employment industries in Beaver include Health Care & Social Assistance (130 | 31.2%), Professional & Scientific (100 | 24.0%), Retail Trade (73 | 17.5%), Accommodation & Food Services (36 | 8.6%), and Educational Services (30 | 7.2%).
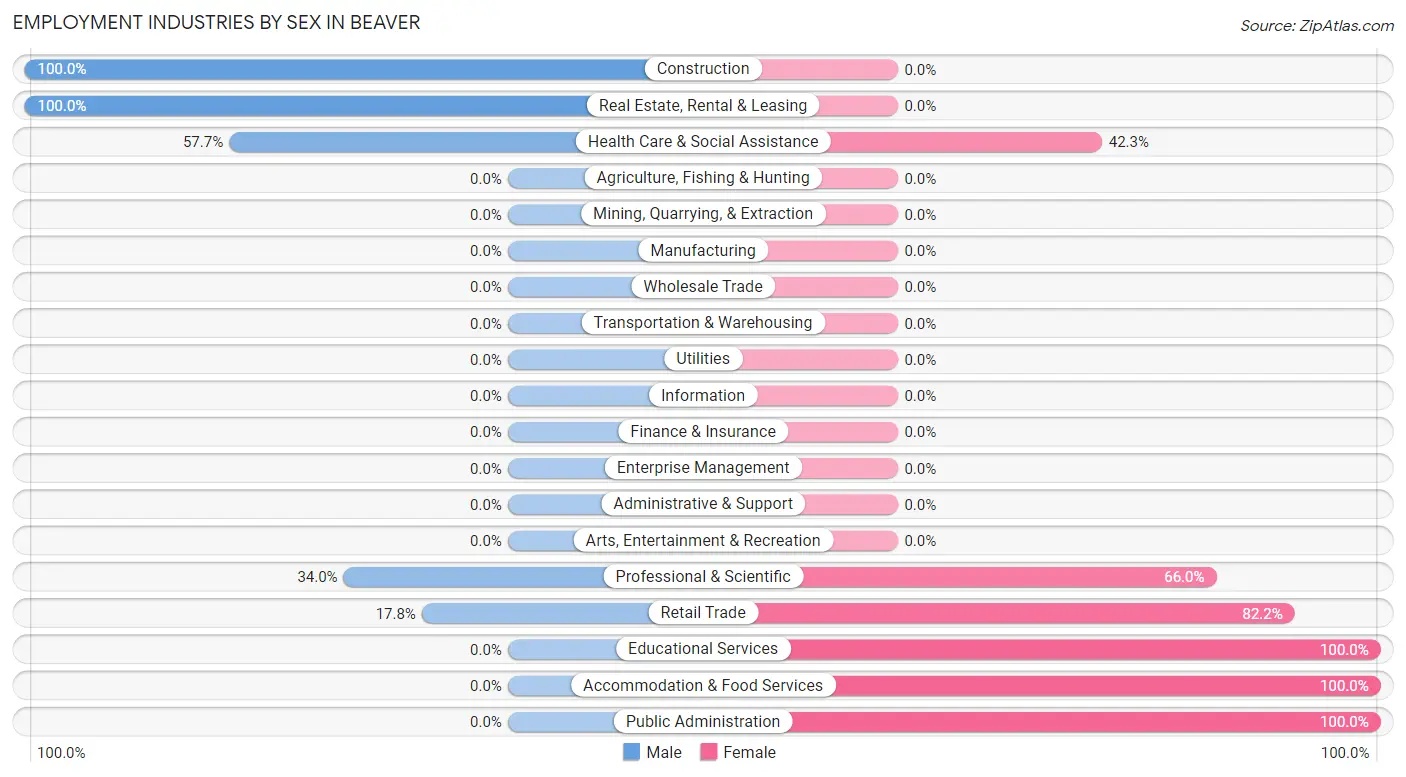
Employment Industries by Sex in Beaver
The Beaver industries that see more men than women are Construction (100.0%), Real Estate, Rental & Leasing (100.0%), and Health Care & Social Assistance (57.7%), whereas the industries that tend to have a higher number of women are Educational Services (100.0%), Accommodation & Food Services (100.0%), and Public Administration (100.0%).
| Industry | Male | Female |
| Agriculture, Fishing & Hunting | 0 (0.0%) | 0 (0.0%) |
| Mining, Quarrying, & Extraction | 0 (0.0%) | 0 (0.0%) |
| Construction | 2 (100.0%) | 0 (0.0%) |
| Manufacturing | 0 (0.0%) | 0 (0.0%) |
| Wholesale Trade | 0 (0.0%) | 0 (0.0%) |
| Retail Trade | 13 (17.8%) | 60 (82.2%) |
| Transportation & Warehousing | 0 (0.0%) | 0 (0.0%) |
| Utilities | 0 (0.0%) | 0 (0.0%) |
| Information | 0 (0.0%) | 0 (0.0%) |
| Finance & Insurance | 0 (0.0%) | 0 (0.0%) |
| Real Estate, Rental & Leasing | 10 (100.0%) | 0 (0.0%) |
| Professional & Scientific | 34 (34.0%) | 66 (66.0%) |
| Enterprise Management | 0 (0.0%) | 0 (0.0%) |
| Administrative & Support | 0 (0.0%) | 0 (0.0%) |
| Educational Services | 0 (0.0%) | 30 (100.0%) |
| Health Care & Social Assistance | 75 (57.7%) | 55 (42.3%) |
| Arts, Entertainment & Recreation | 0 (0.0%) | 0 (0.0%) |
| Accommodation & Food Services | 0 (0.0%) | 36 (100.0%) |
| Public Administration | 0 (0.0%) | 9 (100.0%) |
| Total | 160 (38.5%) | 256 (61.5%) |
Education in Beaver
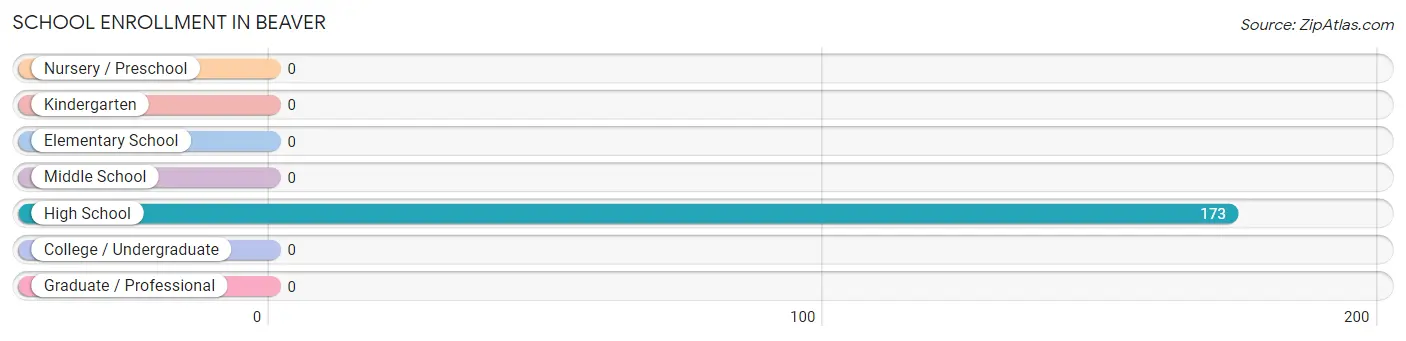
School Enrollment in Beaver
| School Level | # Students | % Students |
| Nursery / Preschool | 0 | 0.0% |
| Kindergarten | 0 | 0.0% |
| Elementary School | 0 | 0.0% |
| Middle School | 0 | 0.0% |
| High School | 173 | 100.0% |
| College / Undergraduate | 0 | 0.0% |
| Graduate / Professional | 0 | 0.0% |
| Total | 173 | 100.0% |
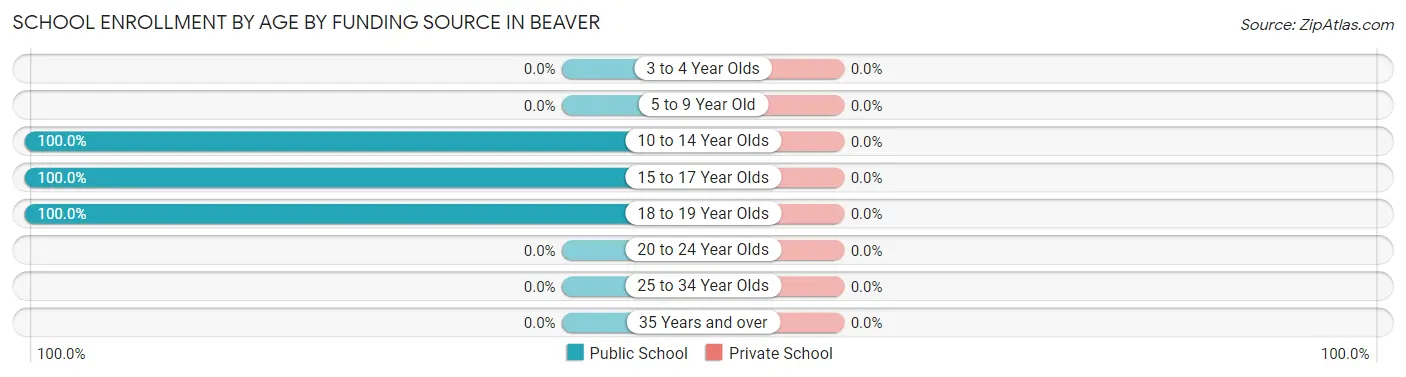
School Enrollment by Age by Funding Source in Beaver
| Age Bracket | Public School | Private School |
| 3 to 4 Year Olds | 0 (0.0%) | 0 (0.0%) |
| 5 to 9 Year Old | 0 (0.0%) | 0 (0.0%) |
| 10 to 14 Year Olds | 58 (100.0%) | 0 (0.0%) |
| 15 to 17 Year Olds | 75 (100.0%) | 0 (0.0%) |
| 18 to 19 Year Olds | 40 (100.0%) | 0 (0.0%) |
| 20 to 24 Year Olds | 0 (0.0%) | 0 (0.0%) |
| 25 to 34 Year Olds | 0 (0.0%) | 0 (0.0%) |
| 35 Years and over | 0 (0.0%) | 0 (0.0%) |
| Total | 173 (100.0%) | 0 (0.0%) |
Educational Attainment by Field of Study in Beaver
Education (77 | 43.0%), literature & languages (55 | 30.7%), visual & performing arts (34 | 19.0%), physical & health sciences (10 | 5.6%), and business (3 | 1.7%) are the most common fields of study among 179 individuals in Beaver who have obtained a bachelor's degree or higher.
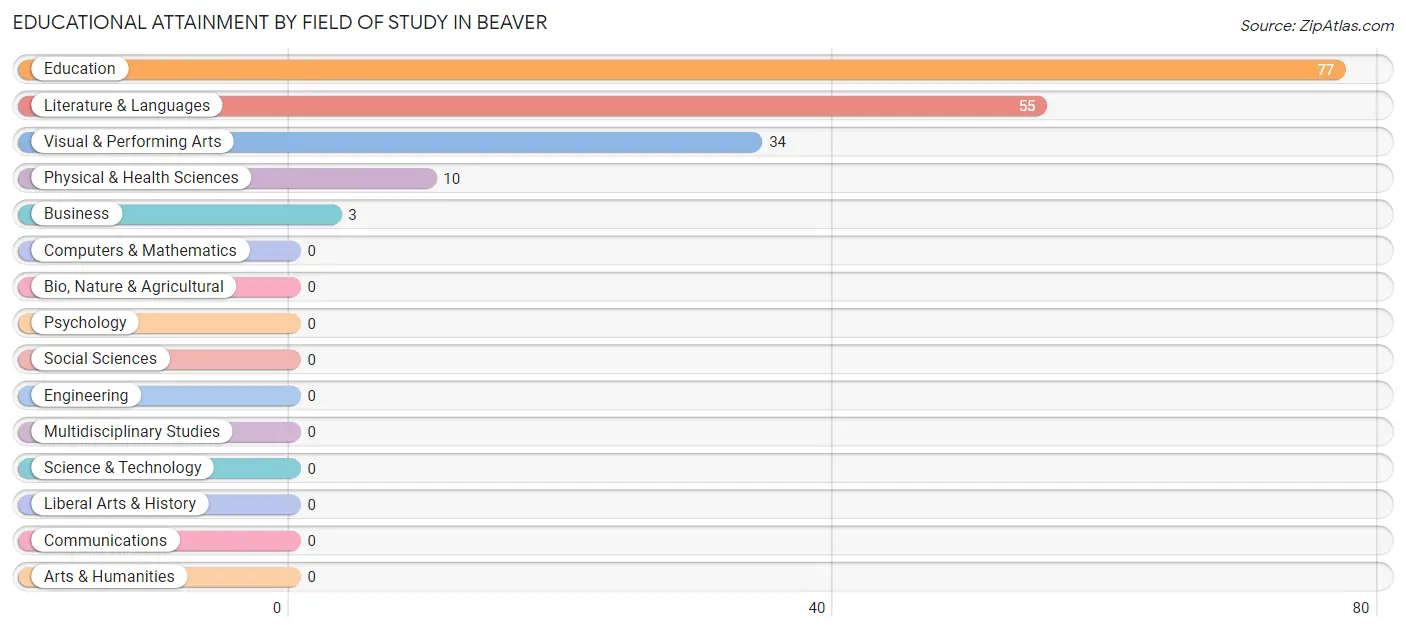
| Field of Study | # Graduates | % Graduates |
| Computers & Mathematics | 0 | 0.0% |
| Bio, Nature & Agricultural | 0 | 0.0% |
| Physical & Health Sciences | 10 | 5.6% |
| Psychology | 0 | 0.0% |
| Social Sciences | 0 | 0.0% |
| Engineering | 0 | 0.0% |
| Multidisciplinary Studies | 0 | 0.0% |
| Science & Technology | 0 | 0.0% |
| Business | 3 | 1.7% |
| Education | 77 | 43.0% |
| Literature & Languages | 55 | 30.7% |
| Liberal Arts & History | 0 | 0.0% |
| Visual & Performing Arts | 34 | 19.0% |
| Communications | 0 | 0.0% |
| Arts & Humanities | 0 | 0.0% |
| Total | 179 | 100.0% |
Transportation & Commute in Beaver
Vehicle Availability by Sex in Beaver
The most prevalent vehicle ownership categories in Beaver are males with 2 vehicles (98, accounting for 61.3%) and females with 2 vehicles (105, making up 43.4%).
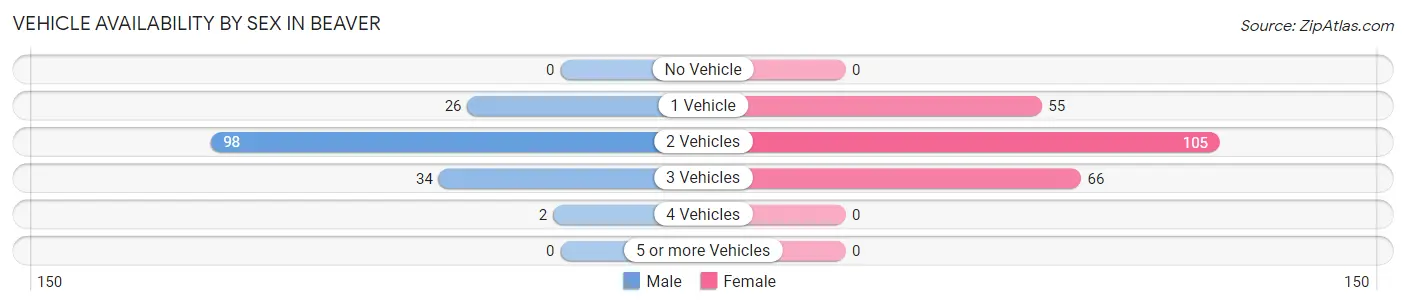
| Vehicles Available | Male | Female |
| No Vehicle | 0 (0.0%) | 0 (0.0%) |
| 1 Vehicle | 26 (16.3%) | 55 (24.3%) |
| 2 Vehicles | 98 (61.3%) | 105 (46.5%) |
| 3 Vehicles | 34 (21.2%) | 66 (29.2%) |
| 4 Vehicles | 2 (1.3%) | 0 (0.0%) |
| 5 or more Vehicles | 0 (0.0%) | 0 (0.0%) |
| Total | 160 (100.0%) | 226 (100.0%) |
Commute Time in Beaver
The most frequently occuring commute durations in Beaver are 30 to 34 minutes (72 commuters, 22.5%), 5 to 9 minutes (64 commuters, 20.0%), and 60 to 89 minutes (62 commuters, 19.4%).
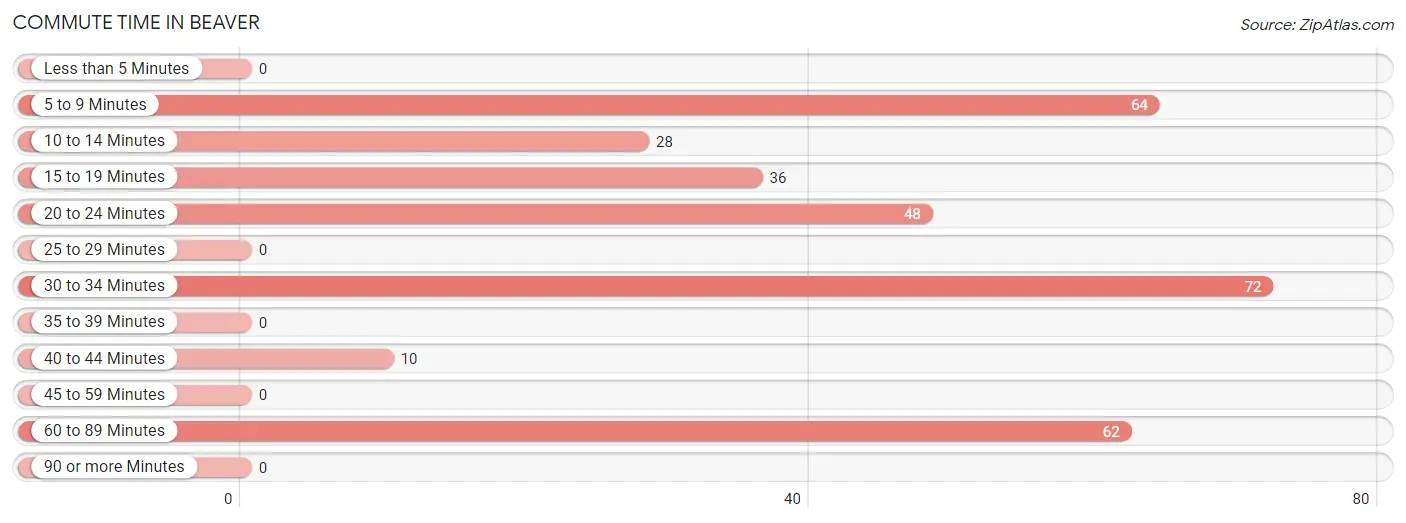
| Commute Time | # Commuters | % Commuters |
| Less than 5 Minutes | 0 | 0.0% |
| 5 to 9 Minutes | 64 | 20.0% |
| 10 to 14 Minutes | 28 | 8.7% |
| 15 to 19 Minutes | 36 | 11.3% |
| 20 to 24 Minutes | 48 | 15.0% |
| 25 to 29 Minutes | 0 | 0.0% |
| 30 to 34 Minutes | 72 | 22.5% |
| 35 to 39 Minutes | 0 | 0.0% |
| 40 to 44 Minutes | 10 | 3.1% |
| 45 to 59 Minutes | 0 | 0.0% |
| 60 to 89 Minutes | 62 | 19.4% |
| 90 or more Minutes | 0 | 0.0% |
Commute Time by Sex in Beaver
The most common commute times in Beaver are 30 to 34 minutes (72 commuters, 45.0%) for males and 5 to 9 minutes (64 commuters, 40.0%) for females.
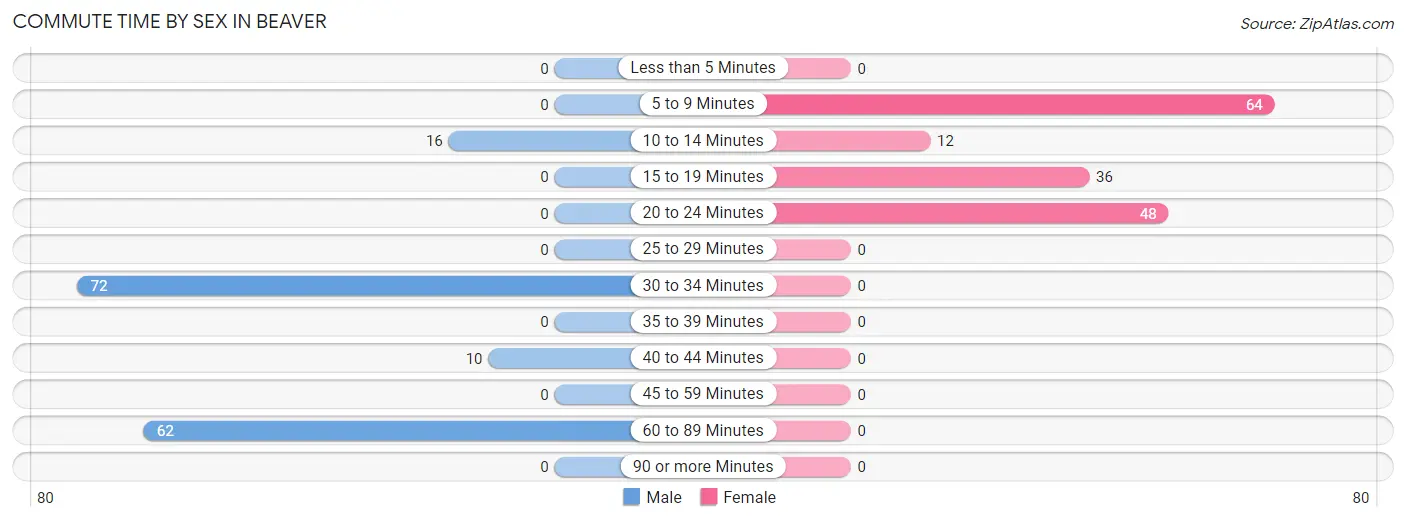
| Commute Time | Male | Female |
| Less than 5 Minutes | 0 (0.0%) | 0 (0.0%) |
| 5 to 9 Minutes | 0 (0.0%) | 64 (40.0%) |
| 10 to 14 Minutes | 16 (10.0%) | 12 (7.5%) |
| 15 to 19 Minutes | 0 (0.0%) | 36 (22.5%) |
| 20 to 24 Minutes | 0 (0.0%) | 48 (30.0%) |
| 25 to 29 Minutes | 0 (0.0%) | 0 (0.0%) |
| 30 to 34 Minutes | 72 (45.0%) | 0 (0.0%) |
| 35 to 39 Minutes | 0 (0.0%) | 0 (0.0%) |
| 40 to 44 Minutes | 10 (6.2%) | 0 (0.0%) |
| 45 to 59 Minutes | 0 (0.0%) | 0 (0.0%) |
| 60 to 89 Minutes | 62 (38.8%) | 0 (0.0%) |
| 90 or more Minutes | 0 (0.0%) | 0 (0.0%) |
Time of Departure to Work by Sex in Beaver
The most frequent times of departure to work in Beaver are 7:00 AM to 7:29 AM (72, 45.0%) for males and 7:30 AM to 7:59 AM (112, 70.0%) for females.
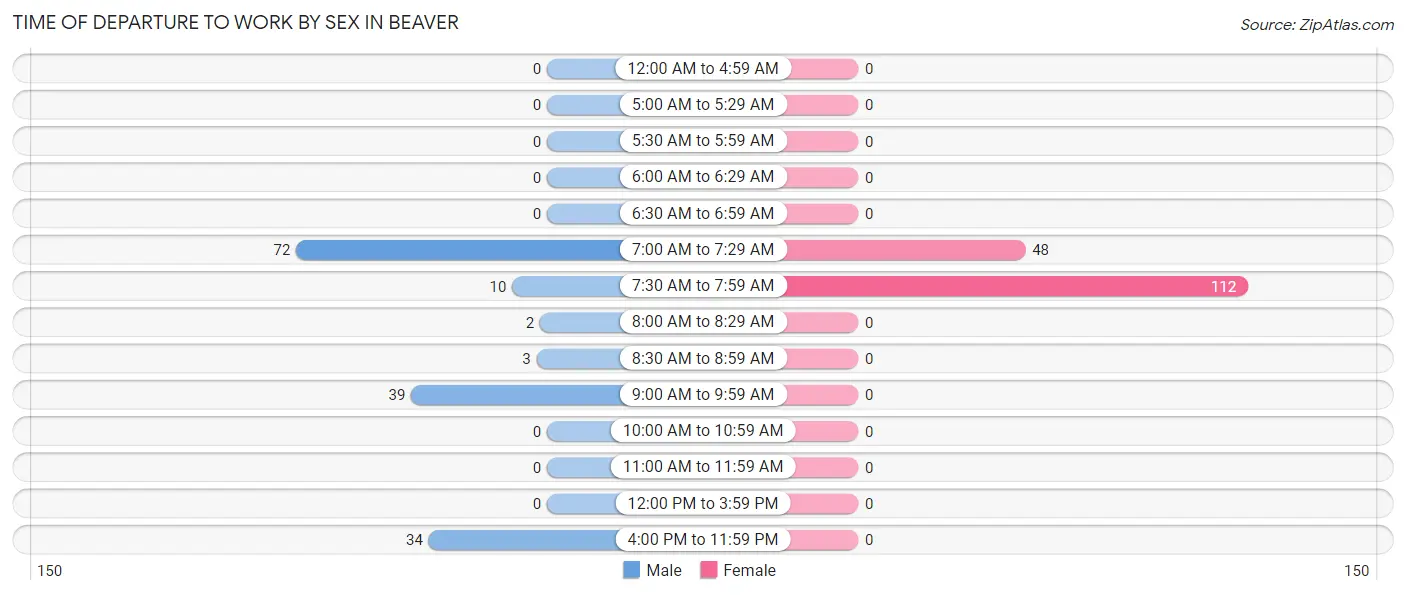
| Time of Departure | Male | Female |
| 12:00 AM to 4:59 AM | 0 (0.0%) | 0 (0.0%) |
| 5:00 AM to 5:29 AM | 0 (0.0%) | 0 (0.0%) |
| 5:30 AM to 5:59 AM | 0 (0.0%) | 0 (0.0%) |
| 6:00 AM to 6:29 AM | 0 (0.0%) | 0 (0.0%) |
| 6:30 AM to 6:59 AM | 0 (0.0%) | 0 (0.0%) |
| 7:00 AM to 7:29 AM | 72 (45.0%) | 48 (30.0%) |
| 7:30 AM to 7:59 AM | 10 (6.2%) | 112 (70.0%) |
| 8:00 AM to 8:29 AM | 2 (1.3%) | 0 (0.0%) |
| 8:30 AM to 8:59 AM | 3 (1.9%) | 0 (0.0%) |
| 9:00 AM to 9:59 AM | 39 (24.4%) | 0 (0.0%) |
| 10:00 AM to 10:59 AM | 0 (0.0%) | 0 (0.0%) |
| 11:00 AM to 11:59 AM | 0 (0.0%) | 0 (0.0%) |
| 12:00 PM to 3:59 PM | 0 (0.0%) | 0 (0.0%) |
| 4:00 PM to 11:59 PM | 34 (21.2%) | 0 (0.0%) |
| Total | 160 (100.0%) | 160 (100.0%) |
Housing Occupancy in Beaver
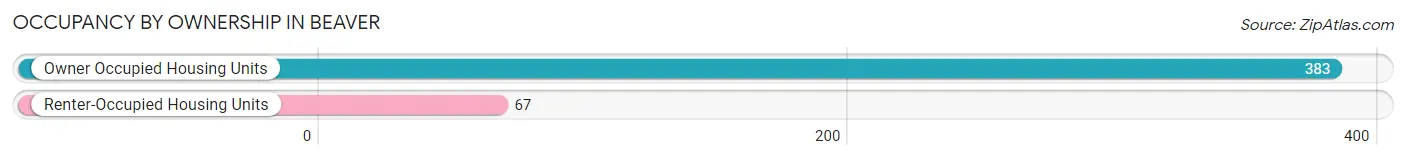
Occupancy by Ownership in Beaver
Of the total 450 dwellings in Beaver, owner-occupied units account for 383 (85.1%), while renter-occupied units make up 67 (14.9%).
| Occupancy | # Housing Units | % Housing Units |
| Owner Occupied Housing Units | 383 | 85.1% |
| Renter-Occupied Housing Units | 67 | 14.9% |
| Total Occupied Housing Units | 450 | 100.0% |
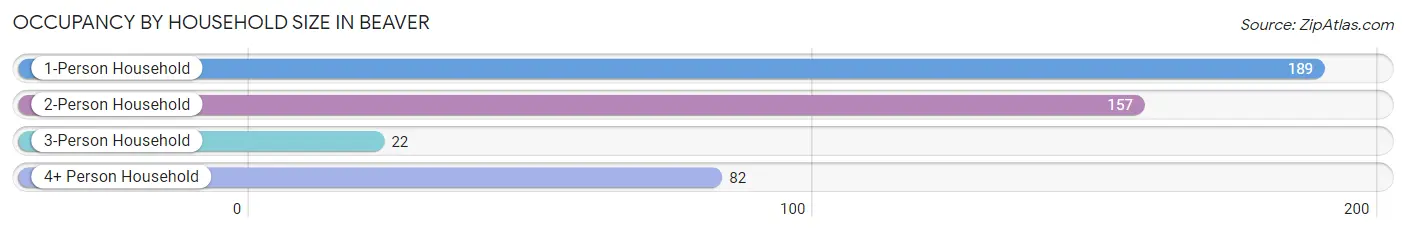
Occupancy by Household Size in Beaver
| Household Size | # Housing Units | % Housing Units |
| 1-Person Household | 189 | 42.0% |
| 2-Person Household | 157 | 34.9% |
| 3-Person Household | 22 | 4.9% |
| 4+ Person Household | 82 | 18.2% |
| Total Housing Units | 450 | 100.0% |
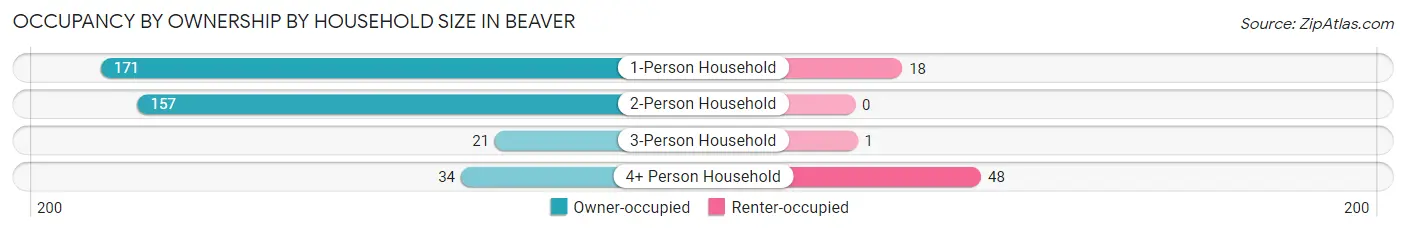
Occupancy by Ownership by Household Size in Beaver
| Household Size | Owner-occupied | Renter-occupied |
| 1-Person Household | 171 (90.5%) | 18 (9.5%) |
| 2-Person Household | 157 (100.0%) | 0 (0.0%) |
| 3-Person Household | 21 (95.5%) | 1 (4.5%) |
| 4+ Person Household | 34 (41.5%) | 48 (58.5%) |
| Total Housing Units | 383 (85.1%) | 67 (14.9%) |
Occupancy by Educational Attainment in Beaver
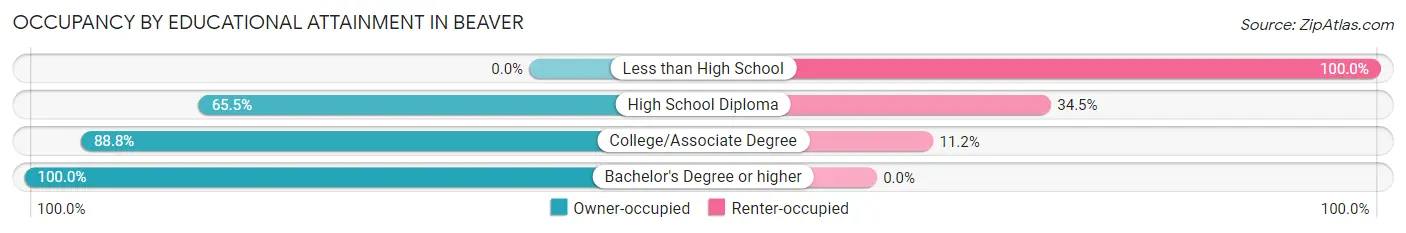
| Household Size | Owner-occupied | Renter-occupied |
| Less than High School | 0 (0.0%) | 1 (100.0%) |
| High School Diploma | 91 (65.5%) | 48 (34.5%) |
| College/Associate Degree | 143 (88.8%) | 18 (11.2%) |
| Bachelor's Degree or higher | 149 (100.0%) | 0 (0.0%) |
Occupancy by Age of Householder in Beaver
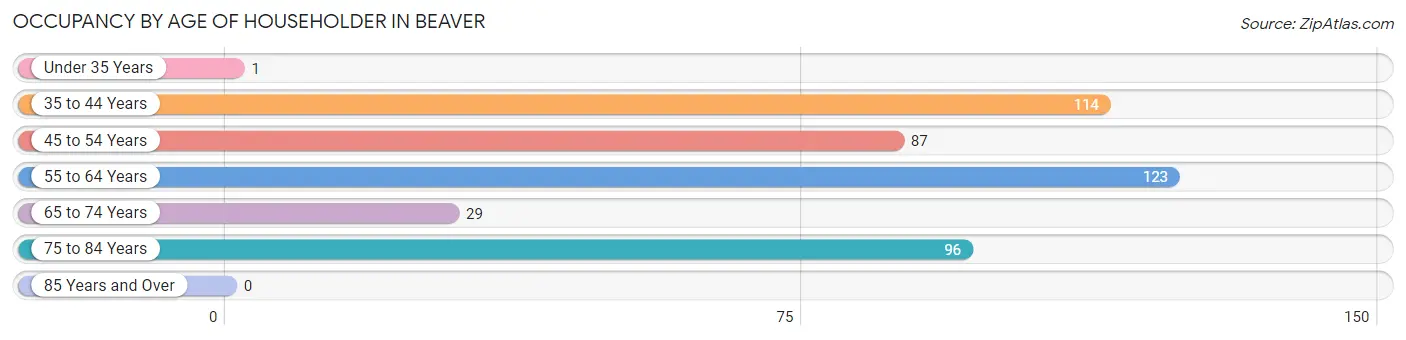
| Age Bracket | # Households | % Households |
| Under 35 Years | 1 | 0.2% |
| 35 to 44 Years | 114 | 25.3% |
| 45 to 54 Years | 87 | 19.3% |
| 55 to 64 Years | 123 | 27.3% |
| 65 to 74 Years | 29 | 6.4% |
| 75 to 84 Years | 96 | 21.3% |
| 85 Years and Over | 0 | 0.0% |
| Total | 450 | 100.0% |
Housing Finances in Beaver
Median Income by Occupancy in Beaver
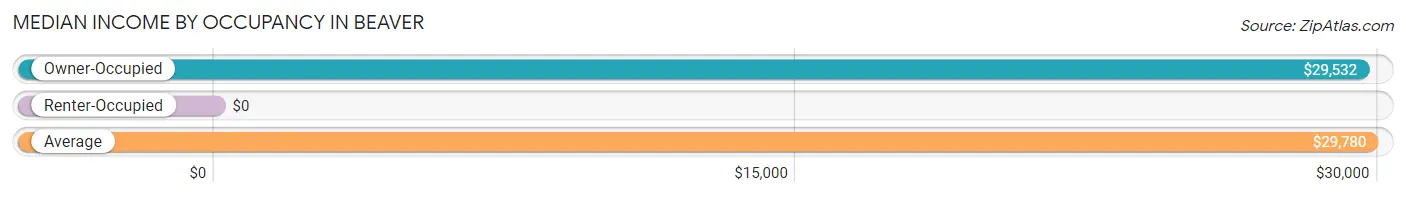
| Occupancy Type | # Households | Median Income |
| Owner-Occupied | 383 (85.1%) | $29,532 |
| Renter-Occupied | 67 (14.9%) | $0 |
| Average | 450 (100.0%) | $29,780 |
Occupancy by Householder Income Bracket in Beaver
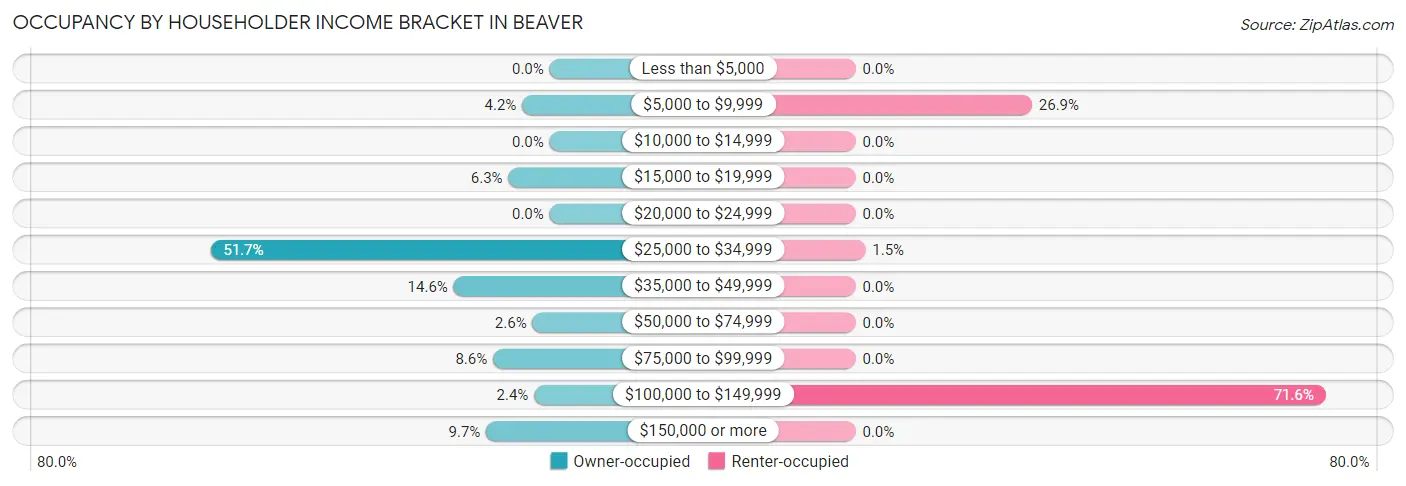
| Income Bracket | Owner-occupied | Renter-occupied |
| Less than $5,000 | 0 (0.0%) | 0 (0.0%) |
| $5,000 to $9,999 | 16 (4.2%) | 18 (26.9%) |
| $10,000 to $14,999 | 0 (0.0%) | 0 (0.0%) |
| $15,000 to $19,999 | 24 (6.3%) | 0 (0.0%) |
| $20,000 to $24,999 | 0 (0.0%) | 0 (0.0%) |
| $25,000 to $34,999 | 198 (51.7%) | 1 (1.5%) |
| $35,000 to $49,999 | 56 (14.6%) | 0 (0.0%) |
| $50,000 to $74,999 | 10 (2.6%) | 0 (0.0%) |
| $75,000 to $99,999 | 33 (8.6%) | 0 (0.0%) |
| $100,000 to $149,999 | 9 (2.4%) | 48 (71.6%) |
| $150,000 or more | 37 (9.7%) | 0 (0.0%) |
| Total | 383 (100.0%) | 67 (100.0%) |
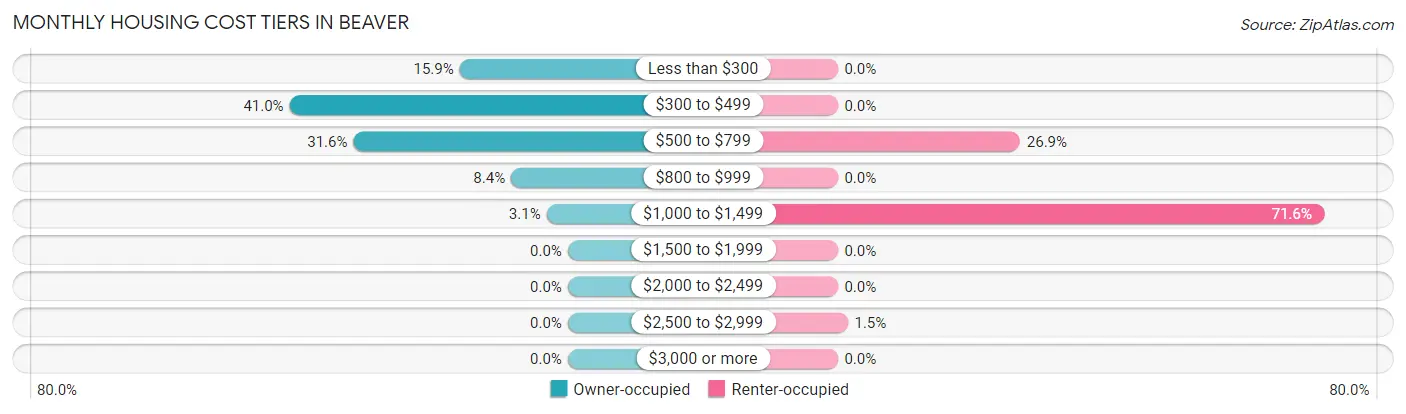
Monthly Housing Cost Tiers in Beaver
| Monthly Cost | Owner-occupied | Renter-occupied |
| Less than $300 | 61 (15.9%) | 0 (0.0%) |
| $300 to $499 | 157 (41.0%) | 0 (0.0%) |
| $500 to $799 | 121 (31.6%) | 18 (26.9%) |
| $800 to $999 | 32 (8.4%) | 0 (0.0%) |
| $1,000 to $1,499 | 12 (3.1%) | 48 (71.6%) |
| $1,500 to $1,999 | 0 (0.0%) | 0 (0.0%) |
| $2,000 to $2,499 | 0 (0.0%) | 0 (0.0%) |
| $2,500 to $2,999 | 0 (0.0%) | 1 (1.5%) |
| $3,000 or more | 0 (0.0%) | 0 (0.0%) |
| Total | 383 (100.0%) | 67 (100.0%) |
Physical Housing Characteristics in Beaver
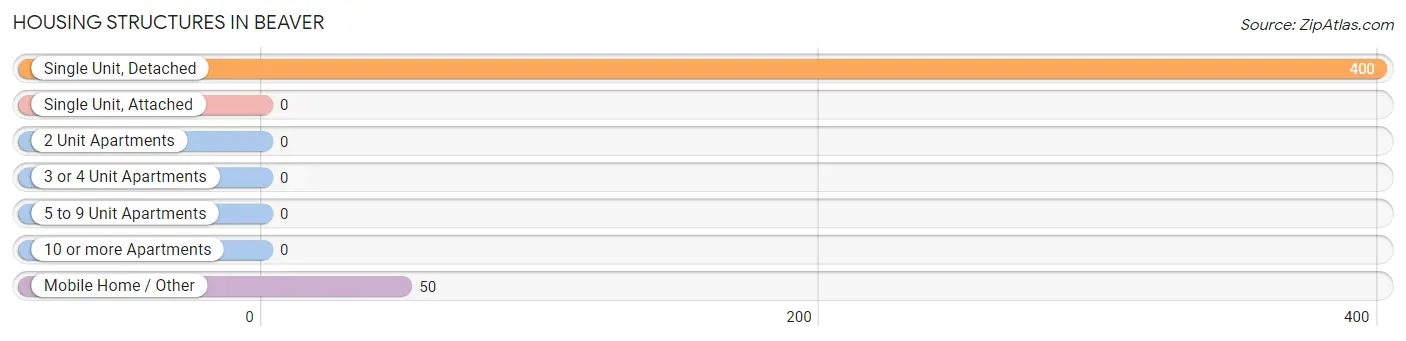
Housing Structures in Beaver
| Structure Type | # Housing Units | % Housing Units |
| Single Unit, Detached | 400 | 88.9% |
| Single Unit, Attached | 0 | 0.0% |
| 2 Unit Apartments | 0 | 0.0% |
| 3 or 4 Unit Apartments | 0 | 0.0% |
| 5 to 9 Unit Apartments | 0 | 0.0% |
| 10 or more Apartments | 0 | 0.0% |
| Mobile Home / Other | 50 | 11.1% |
| Total | 450 | 100.0% |
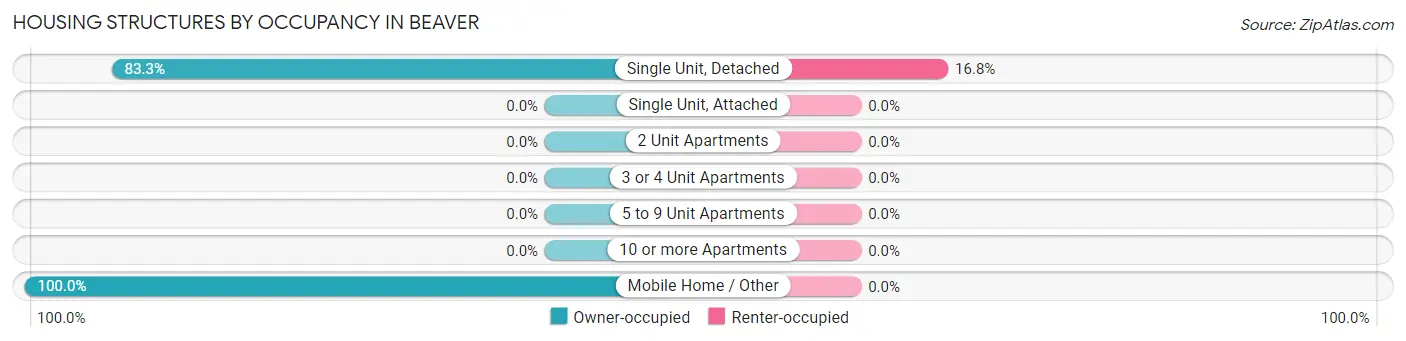
Housing Structures by Occupancy in Beaver
| Structure Type | Owner-occupied | Renter-occupied |
| Single Unit, Detached | 333 (83.3%) | 67 (16.8%) |
| Single Unit, Attached | 0 (0.0%) | 0 (0.0%) |
| 2 Unit Apartments | 0 (0.0%) | 0 (0.0%) |
| 3 or 4 Unit Apartments | 0 (0.0%) | 0 (0.0%) |
| 5 to 9 Unit Apartments | 0 (0.0%) | 0 (0.0%) |
| 10 or more Apartments | 0 (0.0%) | 0 (0.0%) |
| Mobile Home / Other | 50 (100.0%) | 0 (0.0%) |
| Total | 383 (85.1%) | 67 (14.9%) |
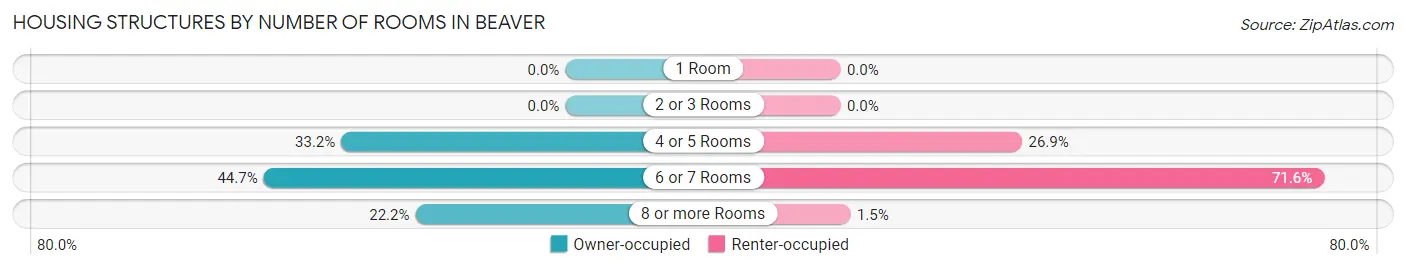
Housing Structures by Number of Rooms in Beaver
| Number of Rooms | Owner-occupied | Renter-occupied |
| 1 Room | 0 (0.0%) | 0 (0.0%) |
| 2 or 3 Rooms | 0 (0.0%) | 0 (0.0%) |
| 4 or 5 Rooms | 127 (33.2%) | 18 (26.9%) |
| 6 or 7 Rooms | 171 (44.7%) | 48 (71.6%) |
| 8 or more Rooms | 85 (22.2%) | 1 (1.5%) |
| Total | 383 (100.0%) | 67 (100.0%) |
Housing Structure by Heating Type in Beaver
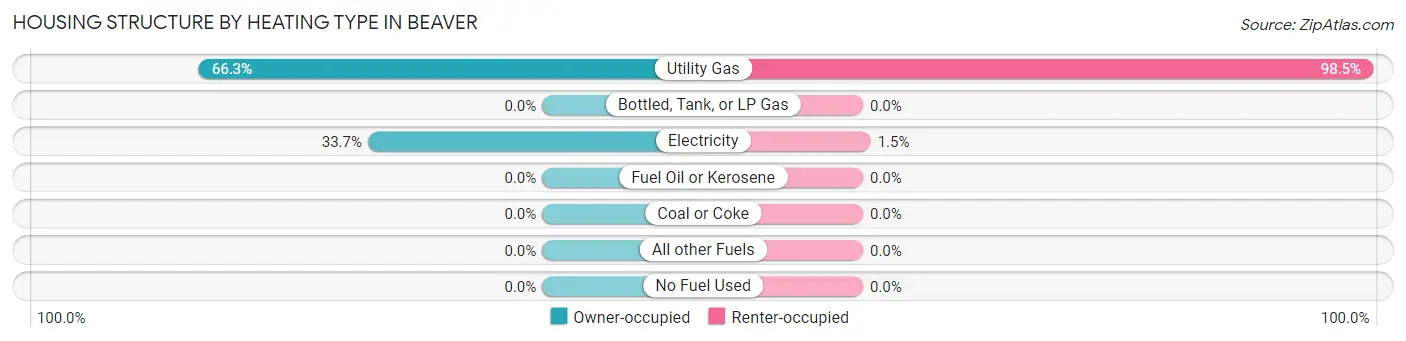
| Heating Type | Owner-occupied | Renter-occupied |
| Utility Gas | 254 (66.3%) | 66 (98.5%) |
| Bottled, Tank, or LP Gas | 0 (0.0%) | 0 (0.0%) |
| Electricity | 129 (33.7%) | 1 (1.5%) |
| Fuel Oil or Kerosene | 0 (0.0%) | 0 (0.0%) |
| Coal or Coke | 0 (0.0%) | 0 (0.0%) |
| All other Fuels | 0 (0.0%) | 0 (0.0%) |
| No Fuel Used | 0 (0.0%) | 0 (0.0%) |
| Total | 383 (100.0%) | 67 (100.0%) |
Household Vehicle Usage in Beaver
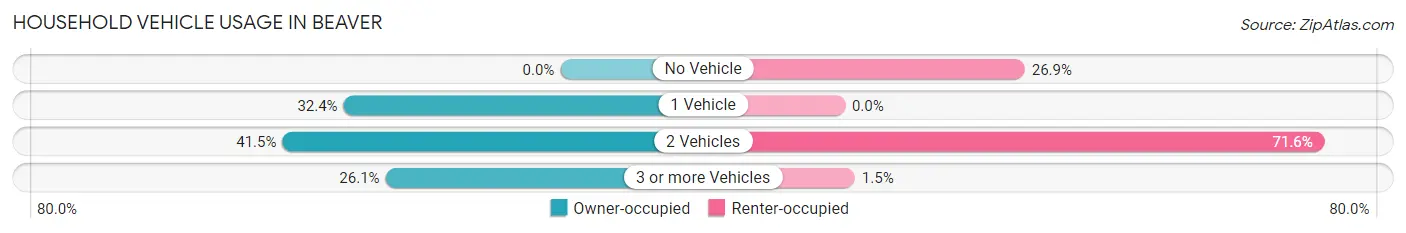
| Vehicles per Household | Owner-occupied | Renter-occupied |
| No Vehicle | 0 (0.0%) | 18 (26.9%) |
| 1 Vehicle | 124 (32.4%) | 0 (0.0%) |
| 2 Vehicles | 159 (41.5%) | 48 (71.6%) |
| 3 or more Vehicles | 100 (26.1%) | 1 (1.5%) |
| Total | 383 (100.0%) | 67 (100.0%) |
Real Estate & Mortgages in Beaver
Real Estate and Mortgage Overview in Beaver
| Characteristic | Without Mortgage | With Mortgage |
| Housing Units | 218 | 165 |
| Median Property Value | $68,900 | $116,400 |
| Median Household Income | $28,673 | $37 |
| Monthly Housing Costs | $332 | $0 |
| Real Estate Taxes | - | - |
Property Value by Mortgage Status in Beaver
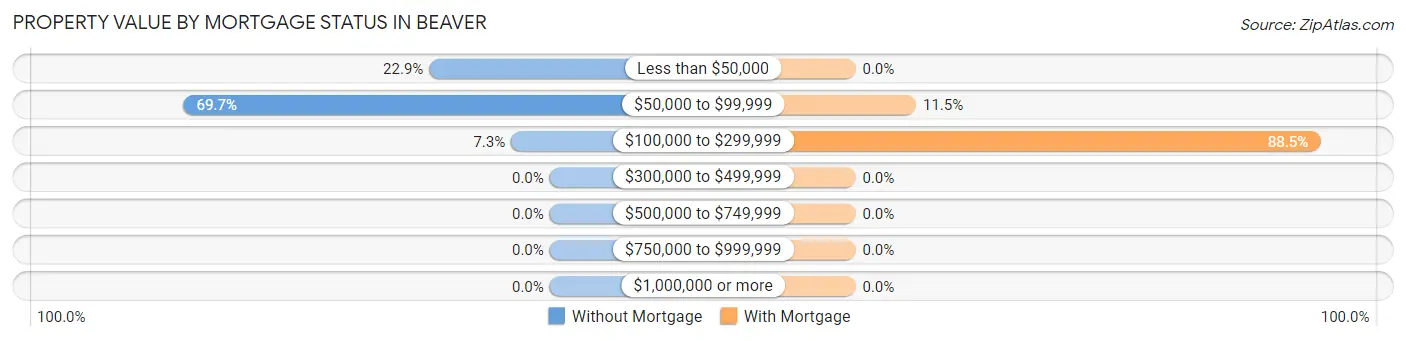
| Property Value | Without Mortgage | With Mortgage |
| Less than $50,000 | 50 (22.9%) | 0 (0.0%) |
| $50,000 to $99,999 | 152 (69.7%) | 19 (11.5%) |
| $100,000 to $299,999 | 16 (7.3%) | 146 (88.5%) |
| $300,000 to $499,999 | 0 (0.0%) | 0 (0.0%) |
| $500,000 to $749,999 | 0 (0.0%) | 0 (0.0%) |
| $750,000 to $999,999 | 0 (0.0%) | 0 (0.0%) |
| $1,000,000 or more | 0 (0.0%) | 0 (0.0%) |
| Total | 218 (100.0%) | 165 (100.0%) |
Household Income by Mortgage Status in Beaver
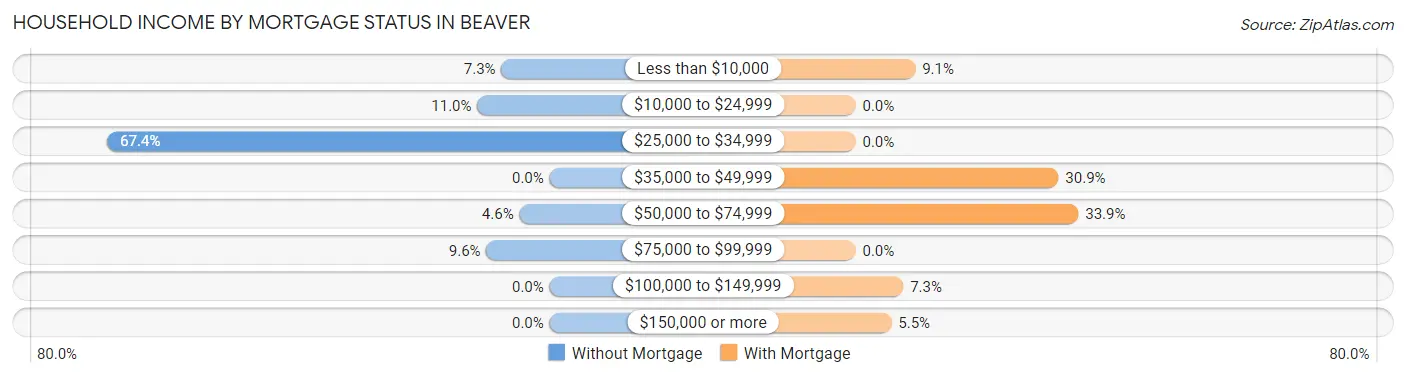
| Household Income | Without Mortgage | With Mortgage |
| Less than $10,000 | 16 (7.3%) | 15 (9.1%) |
| $10,000 to $24,999 | 24 (11.0%) | 0 (0.0%) |
| $25,000 to $34,999 | 147 (67.4%) | 0 (0.0%) |
| $35,000 to $49,999 | 0 (0.0%) | 51 (30.9%) |
| $50,000 to $74,999 | 10 (4.6%) | 56 (33.9%) |
| $75,000 to $99,999 | 21 (9.6%) | 0 (0.0%) |
| $100,000 to $149,999 | 0 (0.0%) | 12 (7.3%) |
| $150,000 or more | 0 (0.0%) | 9 (5.4%) |
| Total | 218 (100.0%) | 165 (100.0%) |
Property Value to Household Income Ratio in Beaver
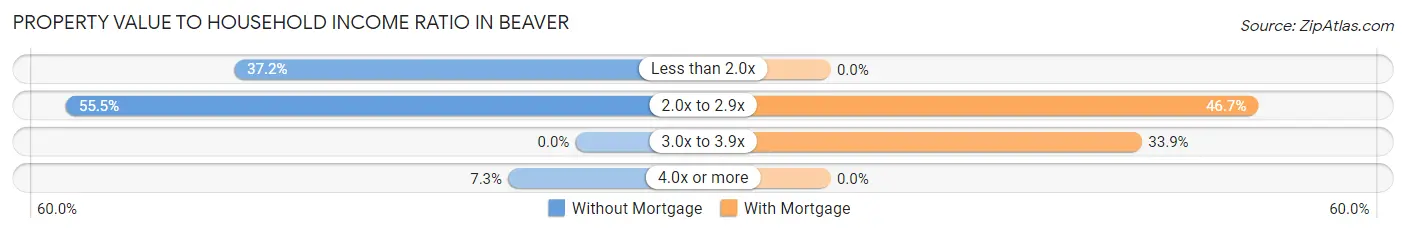
| Value-to-Income Ratio | Without Mortgage | With Mortgage |
| Less than 2.0x | 81 (37.2%) | 0 (0.0%) |
| 2.0x to 2.9x | 121 (55.5%) | 77 (46.7%) |
| 3.0x to 3.9x | 0 (0.0%) | 56 (33.9%) |
| 4.0x or more | 16 (7.3%) | 0 (0.0%) |
| Total | 218 (100.0%) | 165 (100.0%) |
Real Estate Taxes by Mortgage Status in Beaver
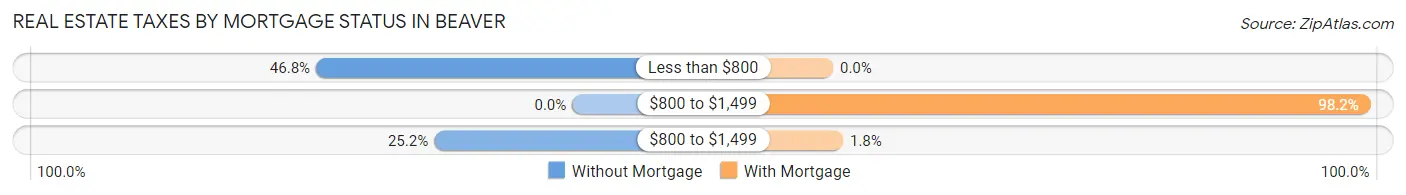
| Property Taxes | Without Mortgage | With Mortgage |
| Less than $800 | 102 (46.8%) | 0 (0.0%) |
| $800 to $1,499 | 0 (0.0%) | 162 (98.2%) |
| $800 to $1,499 | 55 (25.2%) | 3 (1.8%) |
| Total | 218 (100.0%) | 165 (100.0%) |
Health & Disability in Beaver
Health Insurance Coverage by Age in Beaver
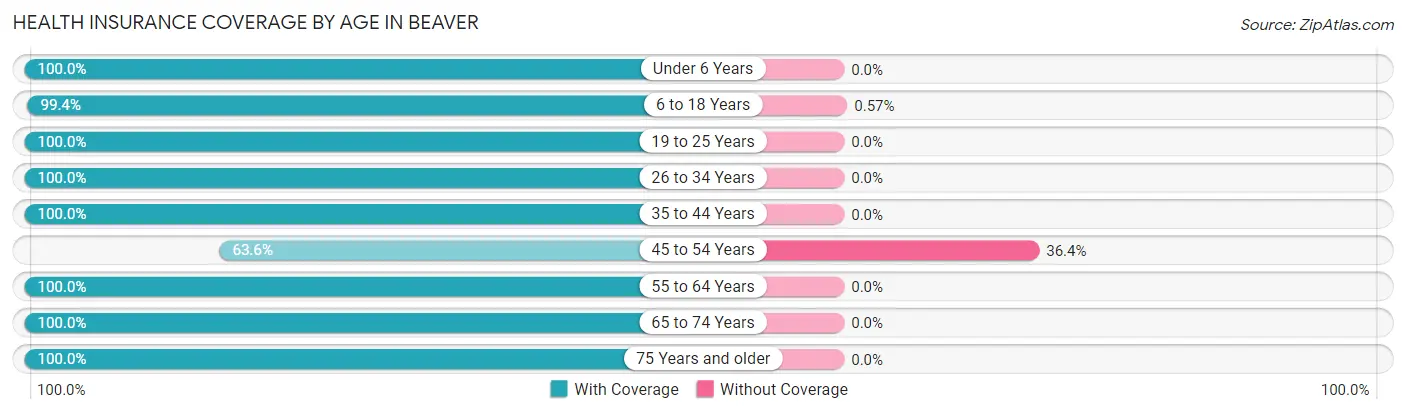
| Age Bracket | With Coverage | Without Coverage |
| Under 6 Years | 1 (100.0%) | 0 (0.0%) |
| 6 to 18 Years | 173 (99.4%) | 1 (0.6%) |
| 19 to 25 Years | 28 (100.0%) | 0 (0.0%) |
| 26 to 34 Years | 1 (100.0%) | 0 (0.0%) |
| 35 to 44 Years | 150 (100.0%) | 0 (0.0%) |
| 45 to 54 Years | 126 (63.6%) | 72 (36.4%) |
| 55 to 64 Years | 180 (100.0%) | 0 (0.0%) |
| 65 to 74 Years | 73 (100.0%) | 0 (0.0%) |
| 75 Years and older | 113 (100.0%) | 0 (0.0%) |
| Total | 845 (92.0%) | 73 (8.0%) |
Health Insurance Coverage by Citizenship Status in Beaver
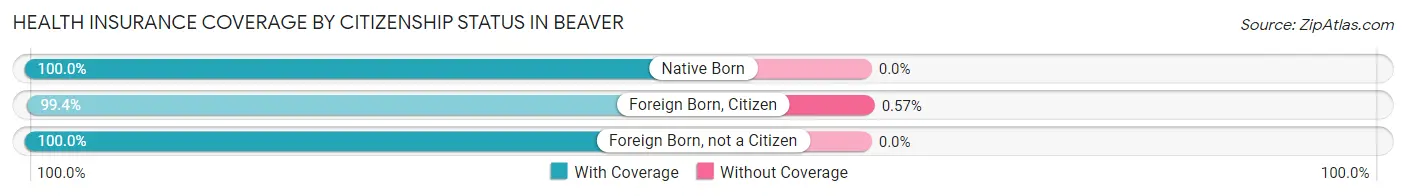
| Citizenship Status | With Coverage | Without Coverage |
| Native Born | 1 (100.0%) | 0 (0.0%) |
| Foreign Born, Citizen | 173 (99.4%) | 1 (0.6%) |
| Foreign Born, not a Citizen | 28 (100.0%) | 0 (0.0%) |
Health Insurance Coverage by Household Income in Beaver
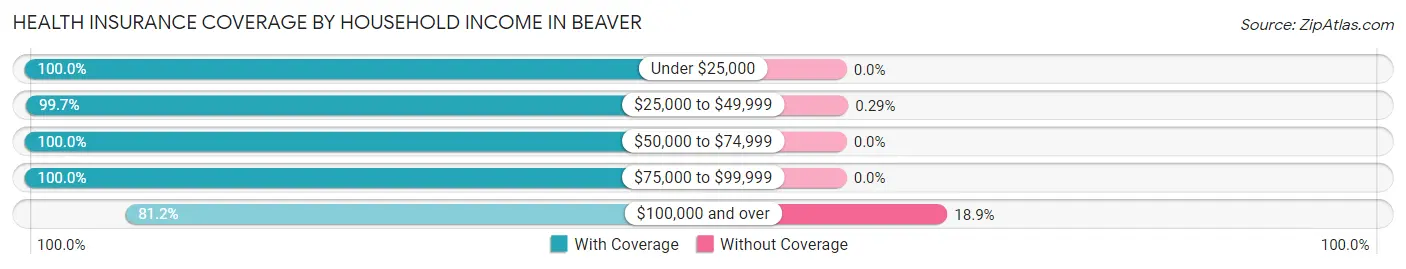
| Household Income | With Coverage | Without Coverage |
| Under $25,000 | 75 (100.0%) | 0 (0.0%) |
| $25,000 to $49,999 | 349 (99.7%) | 1 (0.3%) |
| $50,000 to $74,999 | 19 (100.0%) | 0 (0.0%) |
| $75,000 to $99,999 | 92 (100.0%) | 0 (0.0%) |
| $100,000 and over | 310 (81.1%) | 72 (18.9%) |
Public vs Private Health Insurance Coverage by Age in Beaver
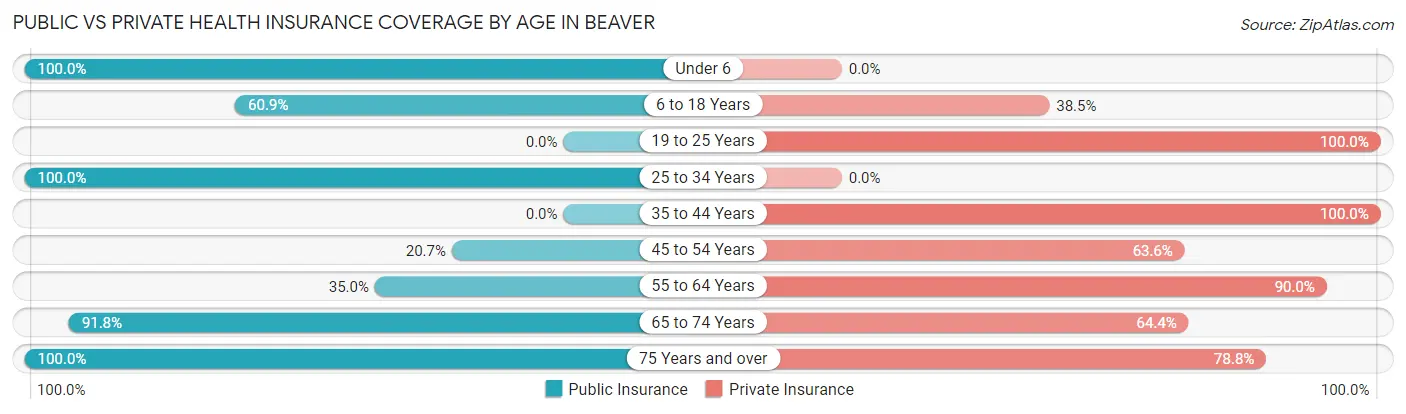
| Age Bracket | Public Insurance | Private Insurance |
| Under 6 | 1 (100.0%) | 0 (0.0%) |
| 6 to 18 Years | 106 (60.9%) | 67 (38.5%) |
| 19 to 25 Years | 0 (0.0%) | 28 (100.0%) |
| 25 to 34 Years | 1 (100.0%) | 0 (0.0%) |
| 35 to 44 Years | 0 (0.0%) | 150 (100.0%) |
| 45 to 54 Years | 41 (20.7%) | 126 (63.6%) |
| 55 to 64 Years | 63 (35.0%) | 162 (90.0%) |
| 65 to 74 Years | 67 (91.8%) | 47 (64.4%) |
| 75 Years and over | 113 (100.0%) | 89 (78.8%) |
| Total | 392 (42.7%) | 669 (72.9%) |
Disability Status by Sex by Age in Beaver
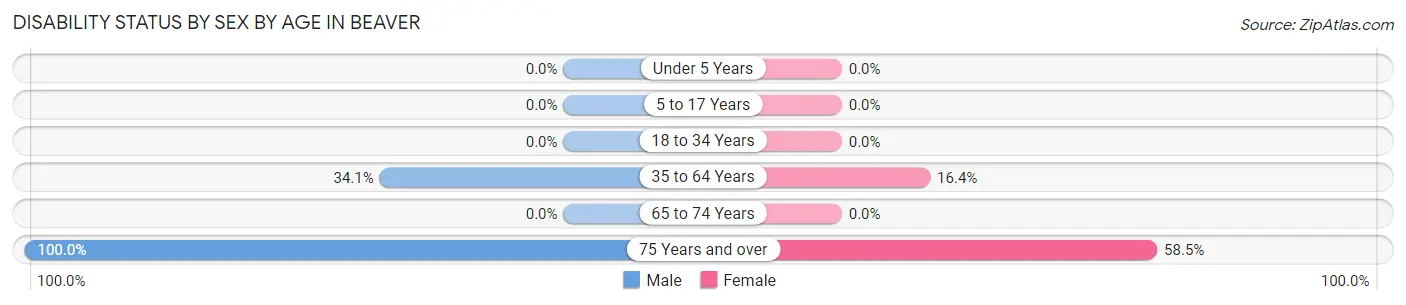
| Age Bracket | Male | Female |
| Under 5 Years | 0 (0.0%) | 0 (0.0%) |
| 5 to 17 Years | 0 (0.0%) | 0 (0.0%) |
| 18 to 34 Years | 0 (0.0%) | 0 (0.0%) |
| 35 to 64 Years | 72 (34.1%) | 52 (16.4%) |
| 65 to 74 Years | 0 (0.0%) | 0 (0.0%) |
| 75 Years and over | 72 (100.0%) | 24 (58.5%) |
Disability Class by Sex by Age in Beaver
Disability Class: Hearing Difficulty
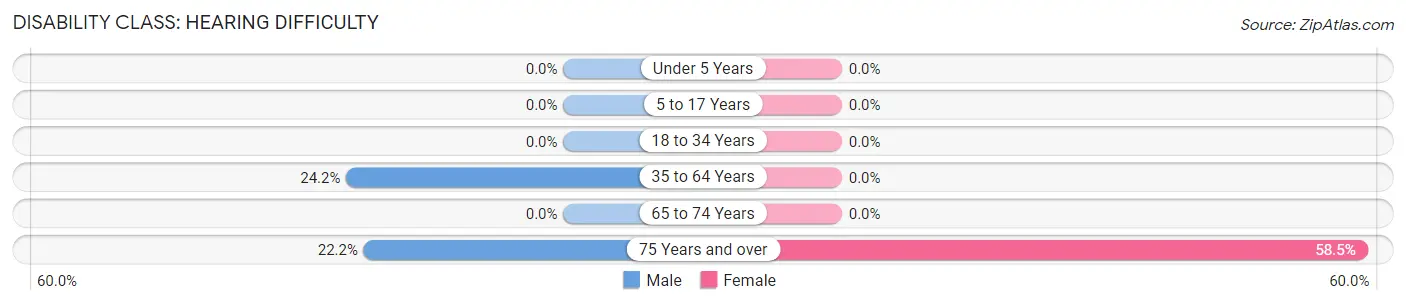
| Age Bracket | Male | Female |
| Under 5 Years | 0 (0.0%) | 0 (0.0%) |
| 5 to 17 Years | 0 (0.0%) | 0 (0.0%) |
| 18 to 34 Years | 0 (0.0%) | 0 (0.0%) |
| 35 to 64 Years | 51 (24.2%) | 0 (0.0%) |
| 65 to 74 Years | 0 (0.0%) | 0 (0.0%) |
| 75 Years and over | 16 (22.2%) | 24 (58.5%) |
Disability Class: Vision Difficulty
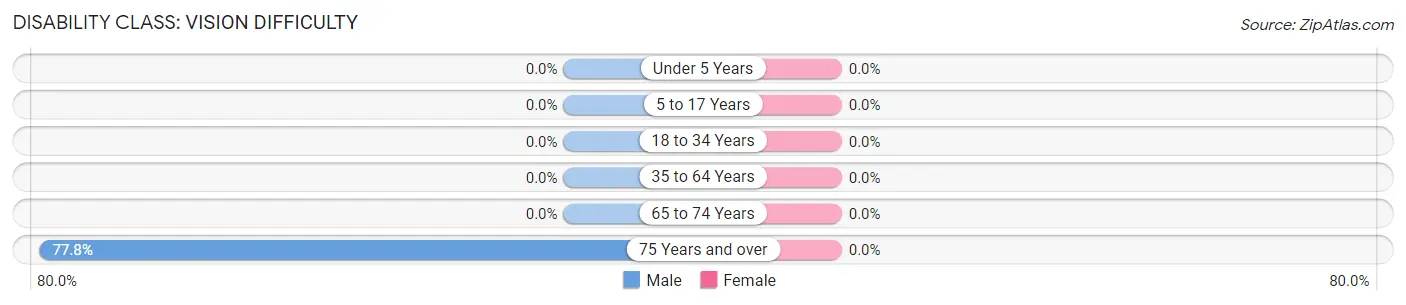
| Age Bracket | Male | Female |
| Under 5 Years | 0 (0.0%) | 0 (0.0%) |
| 5 to 17 Years | 0 (0.0%) | 0 (0.0%) |
| 18 to 34 Years | 0 (0.0%) | 0 (0.0%) |
| 35 to 64 Years | 0 (0.0%) | 0 (0.0%) |
| 65 to 74 Years | 0 (0.0%) | 0 (0.0%) |
| 75 Years and over | 56 (77.8%) | 0 (0.0%) |
Disability Class: Cognitive Difficulty
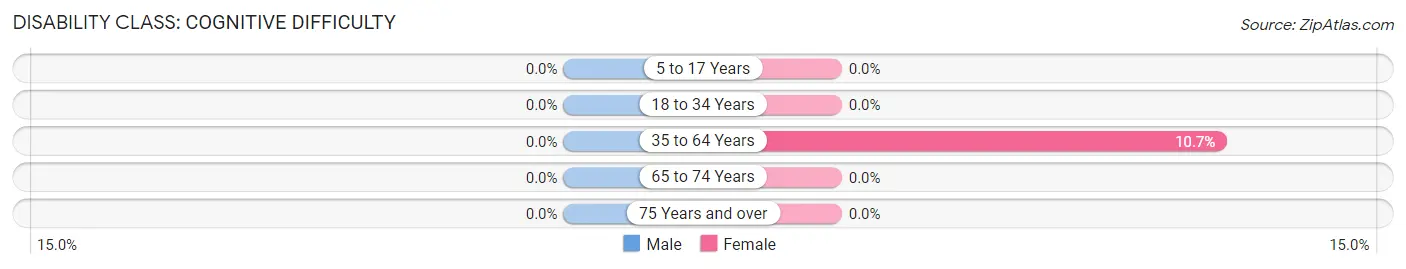
| Age Bracket | Male | Female |
| 5 to 17 Years | 0 (0.0%) | 0 (0.0%) |
| 18 to 34 Years | 0 (0.0%) | 0 (0.0%) |
| 35 to 64 Years | 0 (0.0%) | 34 (10.7%) |
| 65 to 74 Years | 0 (0.0%) | 0 (0.0%) |
| 75 Years and over | 0 (0.0%) | 0 (0.0%) |
Disability Class: Ambulatory Difficulty
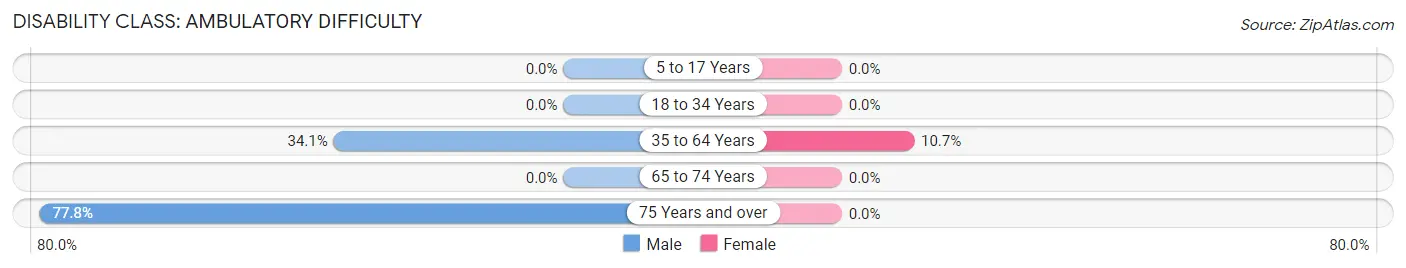
| Age Bracket | Male | Female |
| 5 to 17 Years | 0 (0.0%) | 0 (0.0%) |
| 18 to 34 Years | 0 (0.0%) | 0 (0.0%) |
| 35 to 64 Years | 72 (34.1%) | 34 (10.7%) |
| 65 to 74 Years | 0 (0.0%) | 0 (0.0%) |
| 75 Years and over | 56 (77.8%) | 0 (0.0%) |
Disability Class: Self-Care Difficulty
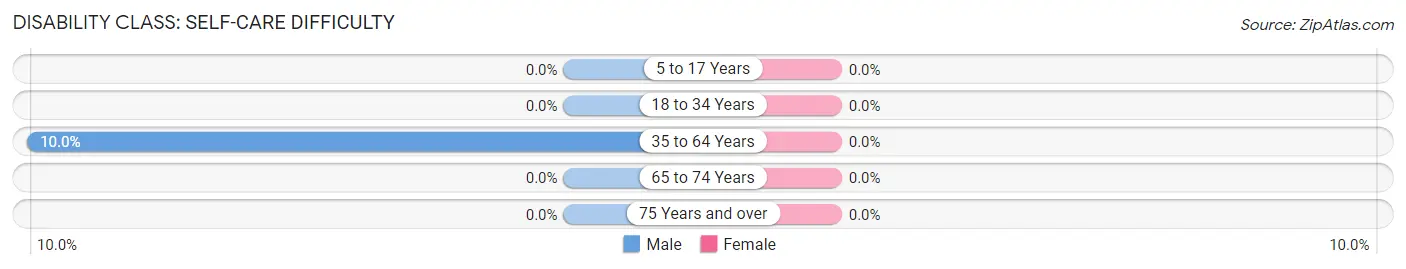
| Age Bracket | Male | Female |
| 5 to 17 Years | 0 (0.0%) | 0 (0.0%) |
| 18 to 34 Years | 0 (0.0%) | 0 (0.0%) |
| 35 to 64 Years | 21 (10.0%) | 0 (0.0%) |
| 65 to 74 Years | 0 (0.0%) | 0 (0.0%) |
| 75 Years and over | 0 (0.0%) | 0 (0.0%) |
Technology Access in Beaver
Computing Device Access in Beaver
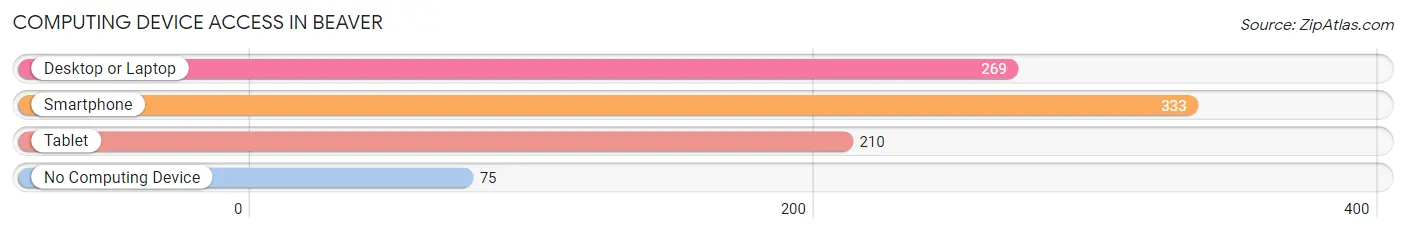
| Device Type | # Households | % Households |
| Desktop or Laptop | 269 | 59.8% |
| Smartphone | 333 | 74.0% |
| Tablet | 210 | 46.7% |
| No Computing Device | 75 | 16.7% |
| Total | 450 | 100.0% |
Internet Access in Beaver
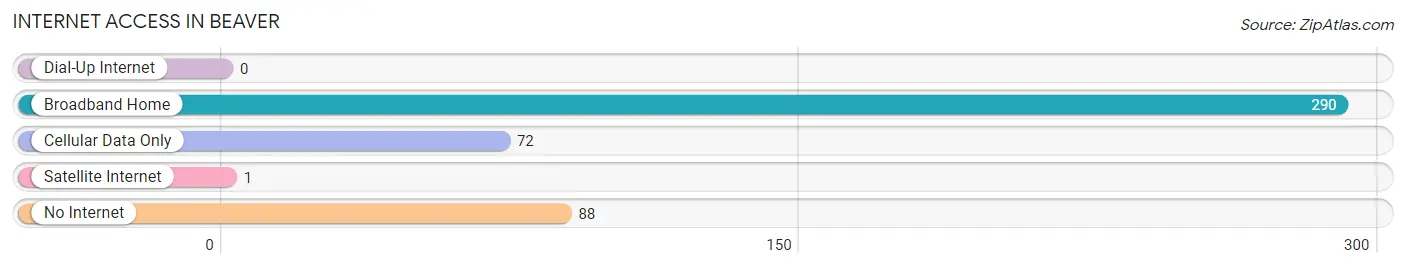
| Internet Type | # Households | % Households |
| Dial-Up Internet | 0 | 0.0% |
| Broadband Home | 290 | 64.4% |
| Cellular Data Only | 72 | 16.0% |
| Satellite Internet | 1 | 0.2% |
| No Internet | 88 | 19.6% |
| Total | 450 | 100.0% |
Beaver Summary
Beaver, West Virginia is a small town located in Raleigh County, West Virginia. It is situated in the Appalachian Mountains and is part of the Beckley-Raleigh County Metropolitan Statistical Area. The town has a population of approximately 1,000 people and is located near the New River Gorge National River.
History
Beaver, West Virginia was founded in 1883 by the Beaver Coal Company. The company was owned by the Beaver family, who had been in the coal business since the early 1800s. The town was named after the family and was originally known as Beaver Station. The town was incorporated in 1891 and was the first town in Raleigh County to be incorporated.
The town was a major coal mining center in the early 1900s. The coal industry was the main source of employment for the town's residents. The town also had a number of other businesses, including a hotel, a general store, a post office, and a bank.
In the 1950s, the coal industry began to decline and the town's population began to decline as well. The town's economy shifted to tourism and the town began to attract visitors from all over the country. The town is now a popular destination for outdoor recreation, such as hiking, camping, and fishing.
Geography
Beaver, West Virginia is located in the Appalachian Mountains in Raleigh County. The town is situated in the New River Gorge National River and is surrounded by the New River, the Bluestone River, and the Gauley River. The town is located at an elevation of 1,400 feet and has a total area of 0.7 square miles.
The town is located near the New River Gorge National River, which is a popular destination for outdoor recreation. The town is also located near the Bluestone National Scenic River, which is a popular destination for whitewater rafting and kayaking.
Economy
The economy of Beaver, West Virginia is largely based on tourism. The town is a popular destination for outdoor recreation, such as hiking, camping, and fishing. The town also has a number of businesses, including restaurants, hotels, and retail stores.
The town is also home to a number of coal mining companies, which provide employment for many of the town's residents. The coal industry is still an important part of the town's economy, although it is not as prominent as it once was.
Demographics
As of the 2010 census, the population of Beaver, West Virginia was 1,000. The town has a population density of 1,400 people per square mile. The median age of the town's residents is 44.7 years.
The town is predominantly white, with 95.2% of the population identifying as white. The town also has a small African American population, with 2.2% of the population identifying as African American. The town also has a small Hispanic population, with 1.2% of the population identifying as Hispanic or Latino.
The median household income in Beaver, West Virginia is $30,000. The town has a poverty rate of 17.2%, which is higher than the national average. The town also has a high unemployment rate, with 8.2% of the population unemployed.
Common Questions
What is Per Capita Income in Beaver?
Per Capita income in Beaver is $29,533.
What is the Median Family Income in Beaver?
Median Family Income in Beaver is $85,060.
What is the Median Household income in Beaver?
Median Household Income in Beaver is $29,780.
What is Income or Wage Gap in Beaver?
Income or Wage Gap in Beaver is 64.8%.
Women in Beaver earn 35.2 cents for every dollar earned by a man.
What is Inequality or Gini Index in Beaver?
Inequality or Gini Index in Beaver is 0.42.
What is the Total Population of Beaver?
Total Population of Beaver is 918.
What is the Total Male Population of Beaver?
Total Male Population of Beaver is 427.
What is the Total Female Population of Beaver?
Total Female Population of Beaver is 491.
What is the Ratio of Males per 100 Females in Beaver?
There are 86.97 Males per 100 Females in Beaver.
What is the Ratio of Females per 100 Males in Beaver?
There are 114.99 Females per 100 Males in Beaver.
What is the Median Population Age in Beaver?
Median Population Age in Beaver is 51.0 Years.
What is the Average Family Size in Beaver
Average Family Size in Beaver is 2.9 People.
What is the Average Household Size in Beaver
Average Household Size in Beaver is 2.0 People.
How Large is the Labor Force in Beaver?
There are 416 People in the Labor Forcein in Beaver.
What is the Percentage of People in the Labor Force in Beaver?
50.0% of People are in the Labor Force in Beaver.