Barboursville, WV Map & Demographics
Barboursville Map
Barboursville Overview
$28,248
PER CAPITA INCOME
$70,547
AVG FAMILY INCOME
$61,236
AVG HOUSEHOLD INCOME
33.0%
WAGE / INCOME GAP [ % ]
67.0¢/ $1
WAGE / INCOME GAP [ $ ]
0.43
INEQUALITY / GINI INDEX
4,394
TOTAL POPULATION
2,513
MALE POPULATION
1,881
FEMALE POPULATION
133.60
MALES / 100 FEMALES
74.85
FEMALES / 100 MALES
36.8
MEDIAN AGE
3.1
AVG FAMILY SIZE
2.1
AVG HOUSEHOLD SIZE
1,663
LABOR FORCE [ PEOPLE ]
45.7%
PERCENT IN LABOR FORCE
1.2%
UNEMPLOYMENT RATE
Barboursville Zip Codes
Barboursville Area Codes
Income in Barboursville
Income Overview in Barboursville
Per Capita Income in Barboursville is $28,248, while median incomes of families and households are $70,547 and $61,236 respectively.
| Characteristic | Number | Measure |
| Per Capita Income | 4,394 | $28,248 |
| Median Family Income | 815 | $70,547 |
| Mean Family Income | 815 | $96,279 |
| Median Household Income | 1,678 | $61,236 |
| Mean Household Income | 1,678 | $71,574 |
| Income Deficit | 815 | $0 |
| Wage / Income Gap (%) | 4,394 | 33.02% |
| Wage / Income Gap ($) | 4,394 | 66.98¢ per $1 |
| Gini / Inequality Index | 4,394 | 0.43 |
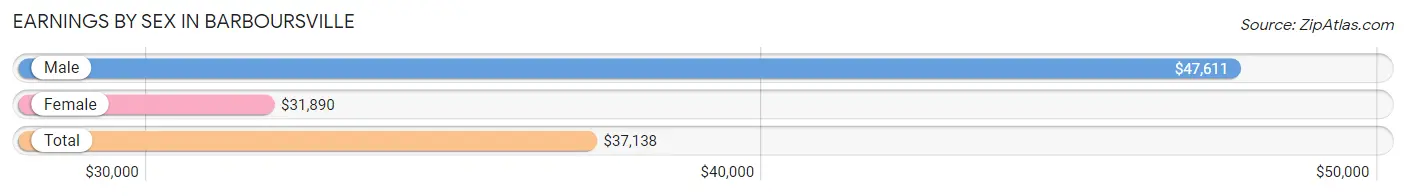
Earnings by Sex in Barboursville
Average Earnings in Barboursville are $37,138, $47,611 for men and $31,890 for women, a difference of 33.0%.
| Sex | Number | Average Earnings |
| Male | 994 (53.0%) | $47,611 |
| Female | 880 (47.0%) | $31,890 |
| Total | 1,874 (100.0%) | $37,138 |
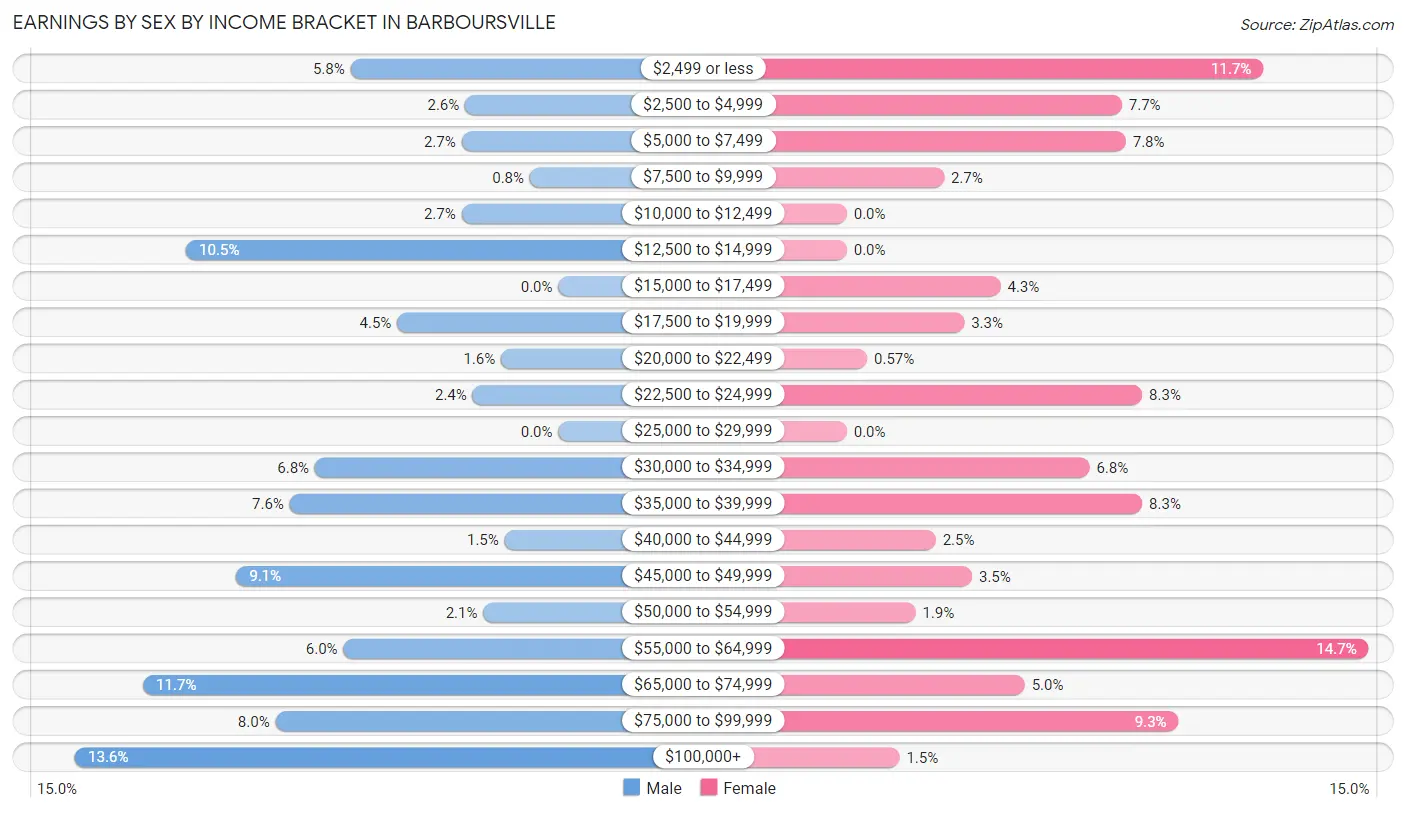
Earnings by Sex by Income Bracket in Barboursville
The most common earnings brackets in Barboursville are $100,000+ for men (135 | 13.6%) and $55,000 to $64,999 for women (129 | 14.7%).
| Income | Male | Female |
| $2,499 or less | 58 (5.8%) | 103 (11.7%) |
| $2,500 to $4,999 | 26 (2.6%) | 68 (7.7%) |
| $5,000 to $7,499 | 27 (2.7%) | 69 (7.8%) |
| $7,500 to $9,999 | 8 (0.8%) | 24 (2.7%) |
| $10,000 to $12,499 | 27 (2.7%) | 0 (0.0%) |
| $12,500 to $14,999 | 104 (10.5%) | 0 (0.0%) |
| $15,000 to $17,499 | 0 (0.0%) | 38 (4.3%) |
| $17,500 to $19,999 | 45 (4.5%) | 29 (3.3%) |
| $20,000 to $22,499 | 16 (1.6%) | 5 (0.6%) |
| $22,500 to $24,999 | 24 (2.4%) | 73 (8.3%) |
| $25,000 to $29,999 | 0 (0.0%) | 0 (0.0%) |
| $30,000 to $34,999 | 68 (6.8%) | 60 (6.8%) |
| $35,000 to $39,999 | 75 (7.5%) | 73 (8.3%) |
| $40,000 to $44,999 | 15 (1.5%) | 22 (2.5%) |
| $45,000 to $49,999 | 90 (9.0%) | 31 (3.5%) |
| $50,000 to $54,999 | 21 (2.1%) | 17 (1.9%) |
| $55,000 to $64,999 | 60 (6.0%) | 129 (14.7%) |
| $65,000 to $74,999 | 116 (11.7%) | 44 (5.0%) |
| $75,000 to $99,999 | 79 (8.0%) | 82 (9.3%) |
| $100,000+ | 135 (13.6%) | 13 (1.5%) |
| Total | 994 (100.0%) | 880 (100.0%) |
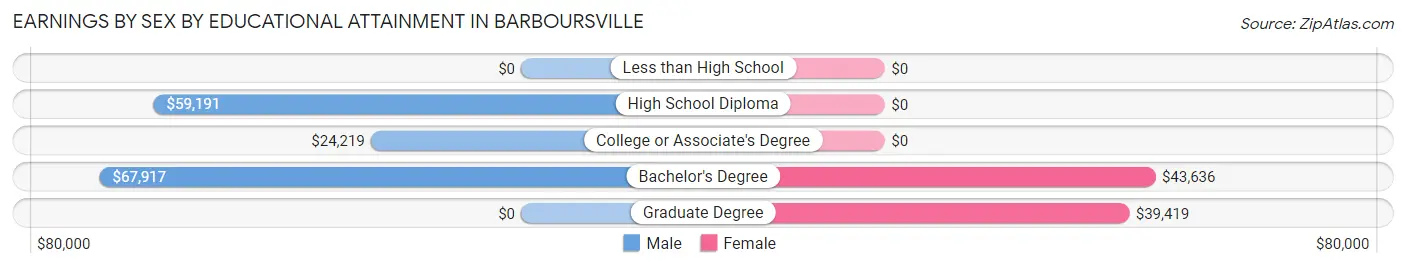
Earnings by Sex by Educational Attainment in Barboursville
Average earnings in Barboursville are $47,792 for men and $32,829 for women, a difference of 31.3%. Men with an educational attainment of bachelor's degree enjoy the highest average annual earnings of $67,917, while those with college or associate's degree education earn the least with $24,219. Women with an educational attainment of bachelor's degree earn the most with the average annual earnings of $43,636, while those with graduate degree education have the smallest earnings of $39,419.
| Educational Attainment | Male Income | Female Income |
| Less than High School | - | - |
| High School Diploma | $59,191 | $0 |
| College or Associate's Degree | $24,219 | $0 |
| Bachelor's Degree | $67,917 | $43,636 |
| Graduate Degree | - | - |
| Total | $47,792 | $32,829 |
Family Income in Barboursville
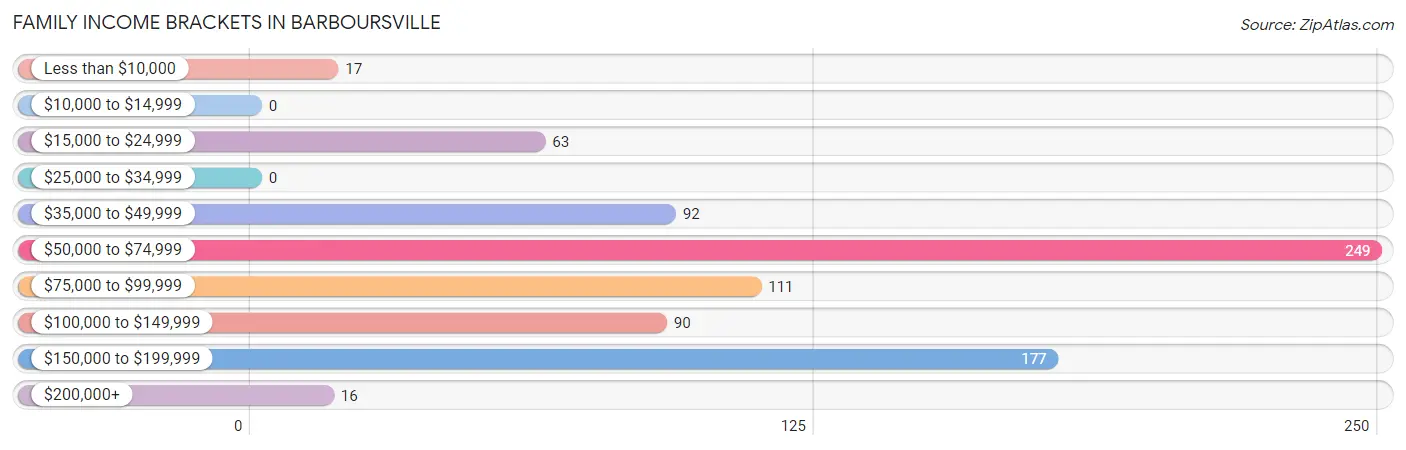
Family Income Brackets in Barboursville
According to the Barboursville family income data, there are 249 families falling into the $50,000 to $74,999 income range, which is the most common income bracket and makes up 30.5% of all families.
| Income Bracket | # Families | % Families |
| Less than $10,000 | 17 | 2.1% |
| $10,000 to $14,999 | 0 | 0.0% |
| $15,000 to $24,999 | 63 | 7.7% |
| $25,000 to $34,999 | 0 | 0.0% |
| $35,000 to $49,999 | 92 | 11.3% |
| $50,000 to $74,999 | 249 | 30.6% |
| $75,000 to $99,999 | 111 | 13.6% |
| $100,000 to $149,999 | 90 | 11.0% |
| $150,000 to $199,999 | 177 | 21.7% |
| $200,000+ | 16 | 2.0% |
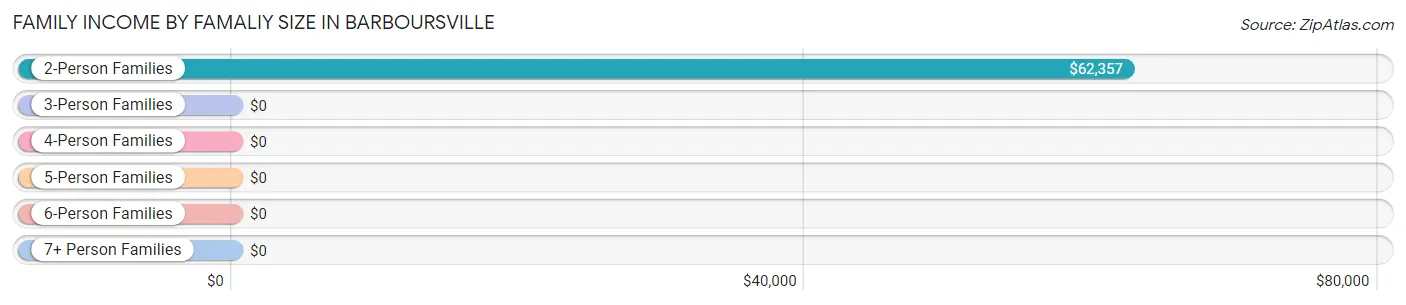
Family Income by Famaliy Size in Barboursville
2-person families (401 | 49.2%) account for the highest median family income in Barboursville with $62,357 per family, while 2-person families (401 | 49.2%) have the highest median income of $31,178 per family member.
| Income Bracket | # Families | Median Income |
| 2-Person Families | 401 (49.2%) | $62,357 |
| 3-Person Families | 208 (25.5%) | $0 |
| 4-Person Families | 158 (19.4%) | $0 |
| 5-Person Families | 47 (5.8%) | $0 |
| 6-Person Families | 0 (0.0%) | $0 |
| 7+ Person Families | 1 (0.1%) | $0 |
| Total | 815 (100.0%) | $70,547 |
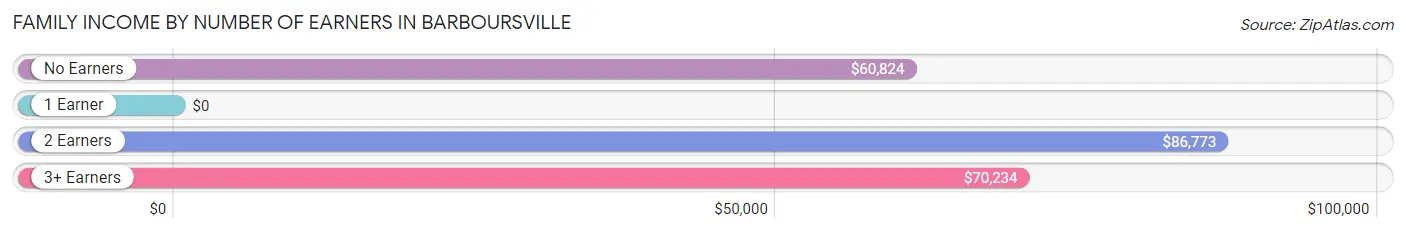
Family Income by Number of Earners in Barboursville
| Number of Earners | # Families | Median Income |
| No Earners | 213 (26.1%) | $60,824 |
| 1 Earner | 240 (29.4%) | $0 |
| 2 Earners | 331 (40.6%) | $86,773 |
| 3+ Earners | 31 (3.8%) | $70,234 |
| Total | 815 (100.0%) | $70,547 |
Household Income in Barboursville
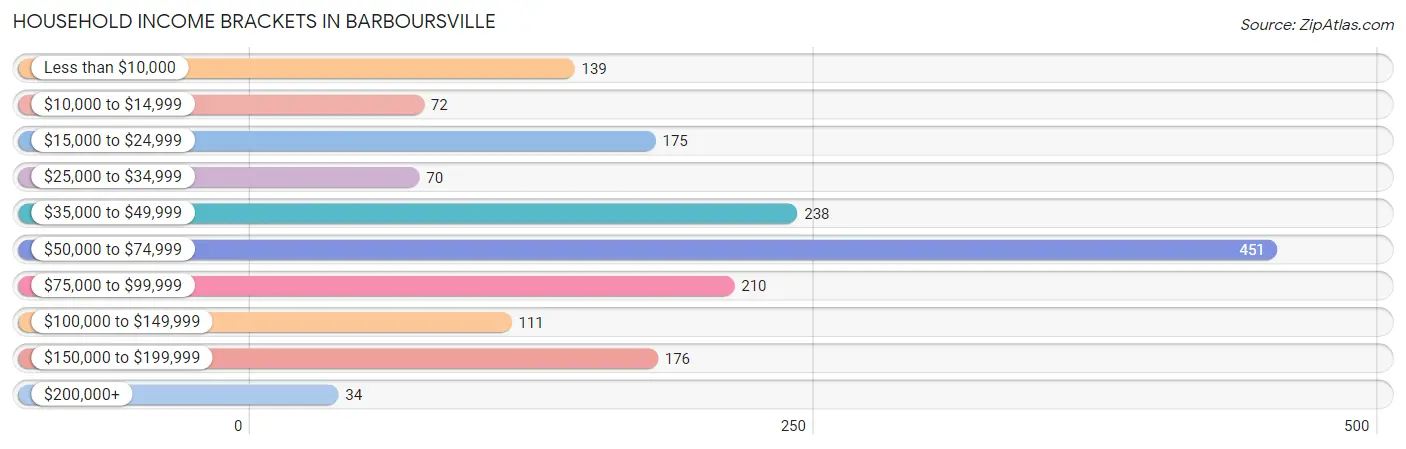
Household Income Brackets in Barboursville
With 451 households falling in the category, the $50,000 to $74,999 income range is the most frequent in Barboursville, accounting for 26.9% of all households. In contrast, only 34 households (2.0%) fall into the $200,000+ income bracket, making it the least populous group.
| Income Bracket | # Households | % Households |
| Less than $10,000 | 139 | 8.3% |
| $10,000 to $14,999 | 72 | 4.3% |
| $15,000 to $24,999 | 175 | 10.4% |
| $25,000 to $34,999 | 70 | 4.2% |
| $35,000 to $49,999 | 238 | 14.2% |
| $50,000 to $74,999 | 451 | 26.9% |
| $75,000 to $99,999 | 210 | 12.5% |
| $100,000 to $149,999 | 111 | 6.6% |
| $150,000 to $199,999 | 176 | 10.5% |
| $200,000+ | 34 | 2.0% |
Household Income by Householder Age in Barboursville
The median household income in Barboursville is $61,236, with the highest median household income of $65,727 found in the 25 to 44 years age bracket for the primary householder. A total of 632 households (37.7%) fall into this category. Meanwhile, the 15 to 24 years age bracket for the primary householder has the lowest median household income of $0, with 95 households (5.7%) in this group.
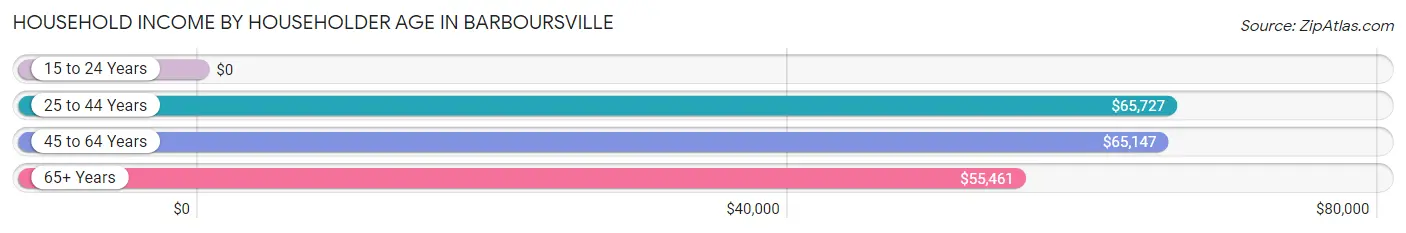
| Income Bracket | # Households | Median Income |
| 15 to 24 Years | 95 (5.7%) | $0 |
| 25 to 44 Years | 632 (37.7%) | $65,727 |
| 45 to 64 Years | 372 (22.2%) | $65,147 |
| 65+ Years | 579 (34.5%) | $55,461 |
| Total | 1,678 (100.0%) | $61,236 |
Poverty in Barboursville
Income Below Poverty by Sex and Age in Barboursville
With 11.5% poverty level for males and 11.6% for females among the residents of Barboursville, under 5 year old males and 18 to 24 year old females are the most vulnerable to poverty, with 48 males (30.0%) and 46 females (54.1%) in their respective age groups living below the poverty level.
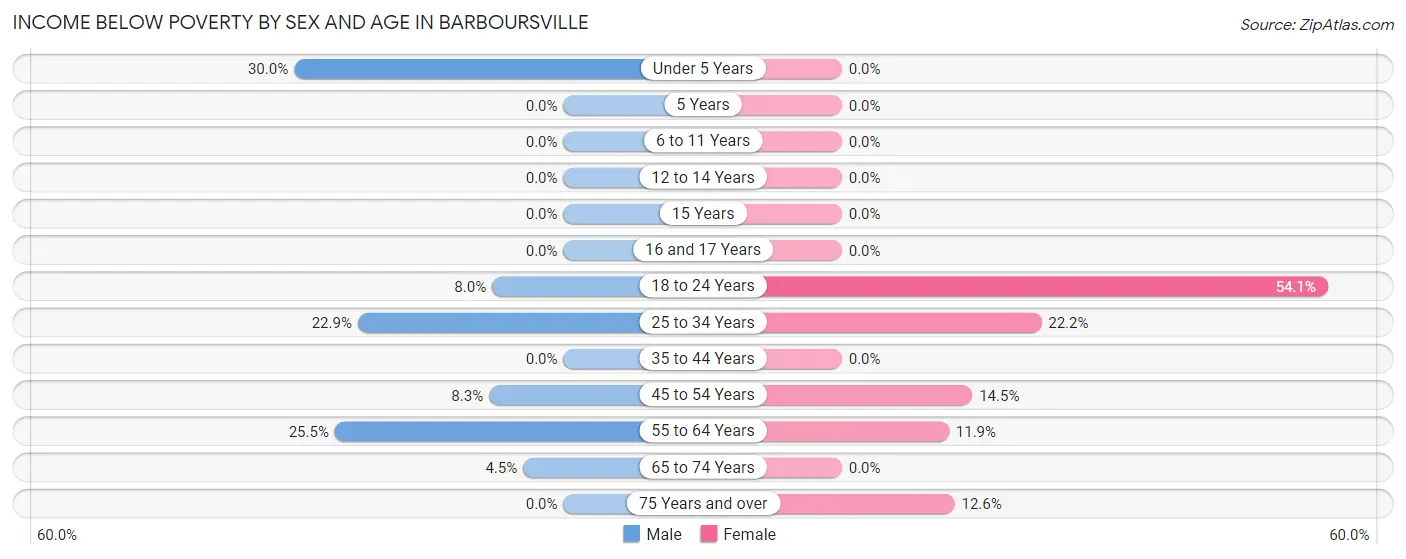
| Age Bracket | Male | Female |
| Under 5 Years | 48 (30.0%) | 0 (0.0%) |
| 5 Years | 0 (0.0%) | 0 (0.0%) |
| 6 to 11 Years | 0 (0.0%) | 0 (0.0%) |
| 12 to 14 Years | 0 (0.0%) | 0 (0.0%) |
| 15 Years | 0 (0.0%) | 0 (0.0%) |
| 16 and 17 Years | 0 (0.0%) | 0 (0.0%) |
| 18 to 24 Years | 7 (8.0%) | 46 (54.1%) |
| 25 to 34 Years | 71 (22.9%) | 86 (22.2%) |
| 35 to 44 Years | 0 (0.0%) | 0 (0.0%) |
| 45 to 54 Years | 13 (8.3%) | 25 (14.5%) |
| 55 to 64 Years | 69 (25.5%) | 18 (11.9%) |
| 65 to 74 Years | 4 (4.5%) | 0 (0.0%) |
| 75 Years and over | 0 (0.0%) | 27 (12.6%) |
| Total | 212 (11.5%) | 202 (11.6%) |
Income Above Poverty by Sex and Age in Barboursville
According to the poverty statistics in Barboursville, males aged 6 to 11 years and females aged under 5 years are the age groups that are most secure financially, with 100.0% of males and 100.0% of females in these age groups living above the poverty line.
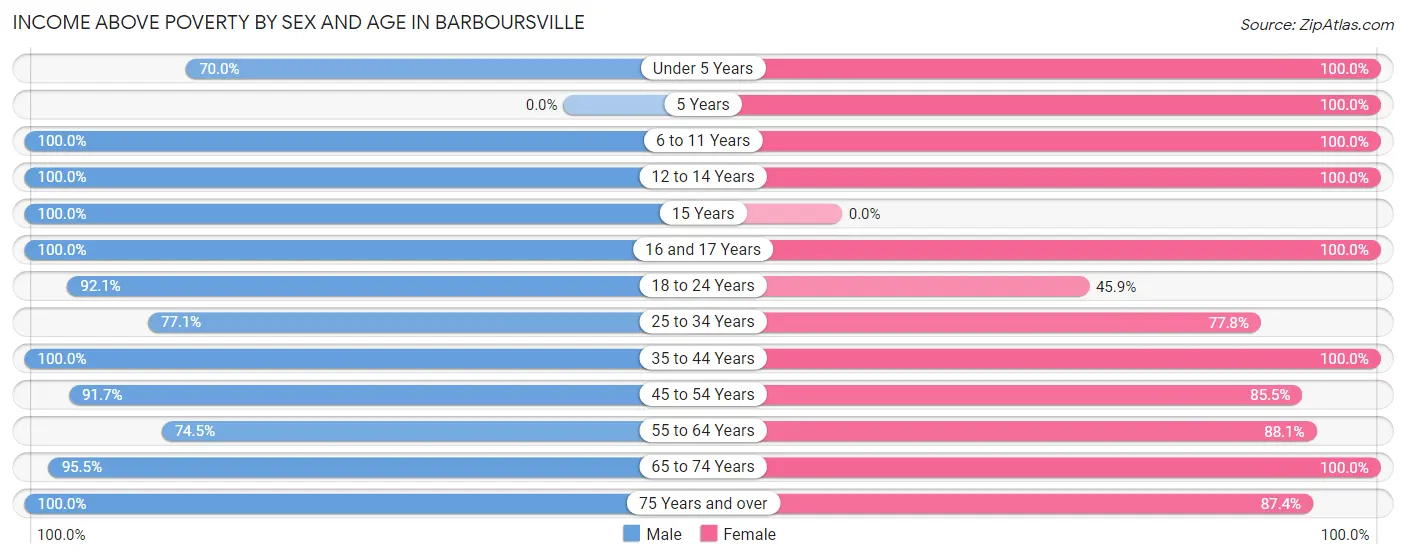
| Age Bracket | Male | Female |
| Under 5 Years | 112 (70.0%) | 183 (100.0%) |
| 5 Years | 0 (0.0%) | 6 (100.0%) |
| 6 to 11 Years | 157 (100.0%) | 114 (100.0%) |
| 12 to 14 Years | 68 (100.0%) | 6 (100.0%) |
| 15 Years | 62 (100.0%) | 0 (0.0%) |
| 16 and 17 Years | 49 (100.0%) | 3 (100.0%) |
| 18 to 24 Years | 81 (92.0%) | 39 (45.9%) |
| 25 to 34 Years | 239 (77.1%) | 301 (77.8%) |
| 35 to 44 Years | 216 (100.0%) | 151 (100.0%) |
| 45 to 54 Years | 144 (91.7%) | 147 (85.5%) |
| 55 to 64 Years | 202 (74.5%) | 133 (88.1%) |
| 65 to 74 Years | 85 (95.5%) | 263 (100.0%) |
| 75 Years and over | 210 (100.0%) | 188 (87.4%) |
| Total | 1,625 (88.5%) | 1,534 (88.4%) |
Income Below Poverty Among Married-Couple Families in Barboursville
The poverty statistics for married-couple families in Barboursville show that 3.4% or 24 of the total 716 families live below the poverty line. Families with 1 or 2 children have the highest poverty rate of 5.3%, comprising of 17 families. On the other hand, families with 3 or 4 children have the lowest poverty rate of 0.0%, which includes 0 families.
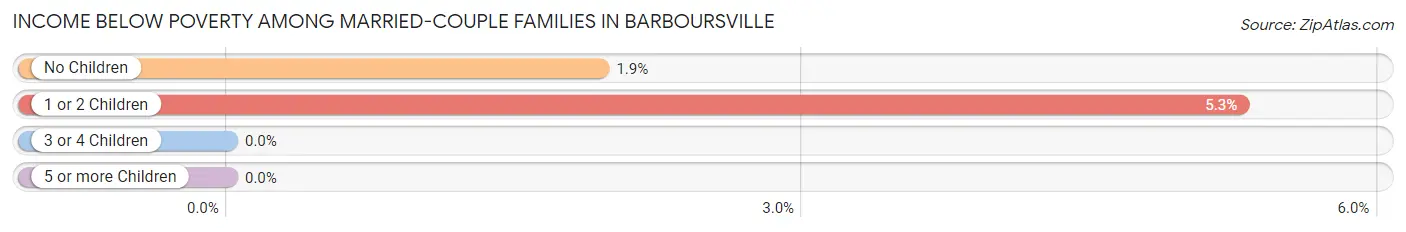
| Children | Above Poverty | Below Poverty |
| No Children | 354 (98.1%) | 7 (1.9%) |
| 1 or 2 Children | 305 (94.7%) | 17 (5.3%) |
| 3 or 4 Children | 33 (100.0%) | 0 (0.0%) |
| 5 or more Children | 0 (0.0%) | 0 (0.0%) |
| Total | 692 (96.7%) | 24 (3.4%) |
Income Below Poverty Among Single-Parent Households in Barboursville
| Children | Single Father | Single Mother |
| No Children | 0 (0.0%) | 0 (0.0%) |
| 1 or 2 Children | 0 (0.0%) | 0 (0.0%) |
| 3 or 4 Children | 0 (0.0%) | 0 (0.0%) |
| 5 or more Children | 0 (0.0%) | 0 (0.0%) |
| Total | 0 (0.0%) | 0 (0.0%) |
Income Below Poverty Among Married-Couple vs Single-Parent Households in Barboursville
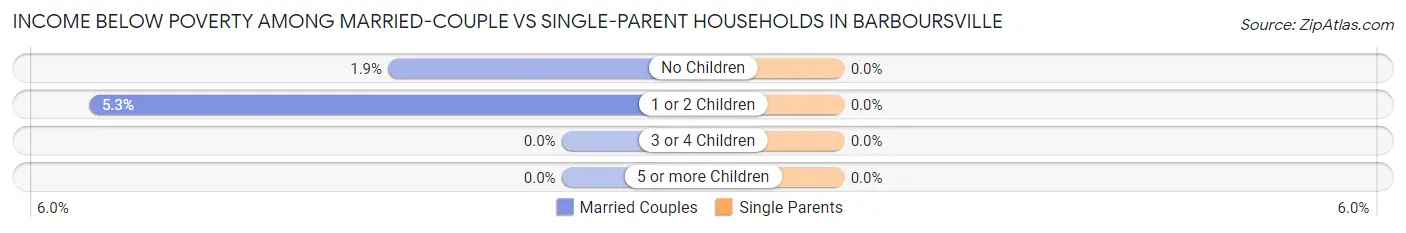
| Children | Married-Couple Families | Single-Parent Households |
| No Children | 7 (1.9%) | 0 (0.0%) |
| 1 or 2 Children | 17 (5.3%) | 0 (0.0%) |
| 3 or 4 Children | 0 (0.0%) | 0 (0.0%) |
| 5 or more Children | 0 (0.0%) | 0 (0.0%) |
| Total | 24 (3.4%) | 0 (0.0%) |
Race in Barboursville
The most populous races in Barboursville are White / Caucasian (3,965 | 90.2%), Black / African American (183 | 4.2%), and Asian (182 | 4.1%).
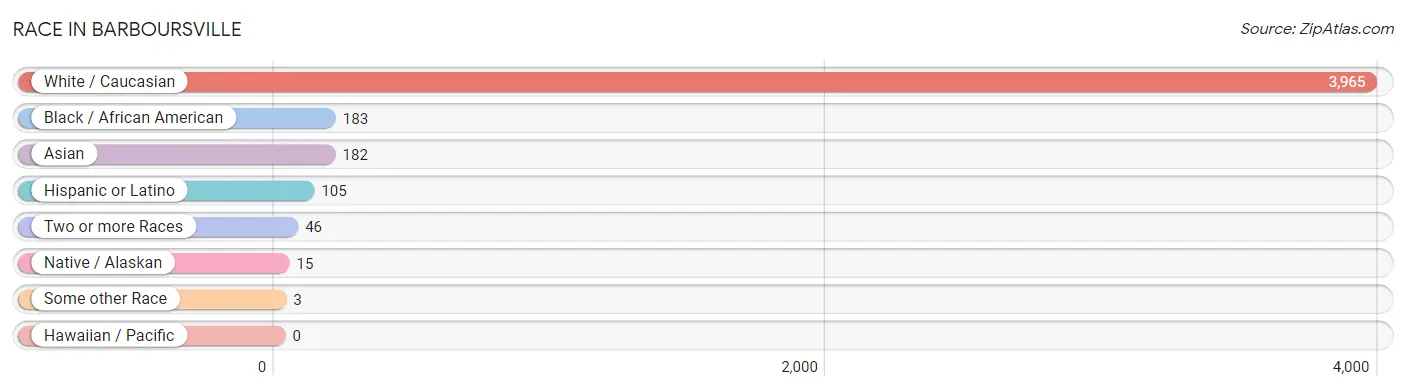
| Race | # Population | % Population |
| Asian | 182 | 4.1% |
| Black / African American | 183 | 4.2% |
| Hawaiian / Pacific | 0 | 0.0% |
| Hispanic or Latino | 105 | 2.4% |
| Native / Alaskan | 15 | 0.3% |
| White / Caucasian | 3,965 | 90.2% |
| Two or more Races | 46 | 1.1% |
| Some other Race | 3 | 0.1% |
| Total | 4,394 | 100.0% |
Ancestry in Barboursville
The most populous ancestries reported in Barboursville are English (946 | 21.5%), Irish (619 | 14.1%), German (375 | 8.5%), American (303 | 6.9%), and European (158 | 3.6%), together accounting for 54.6% of all Barboursville residents.
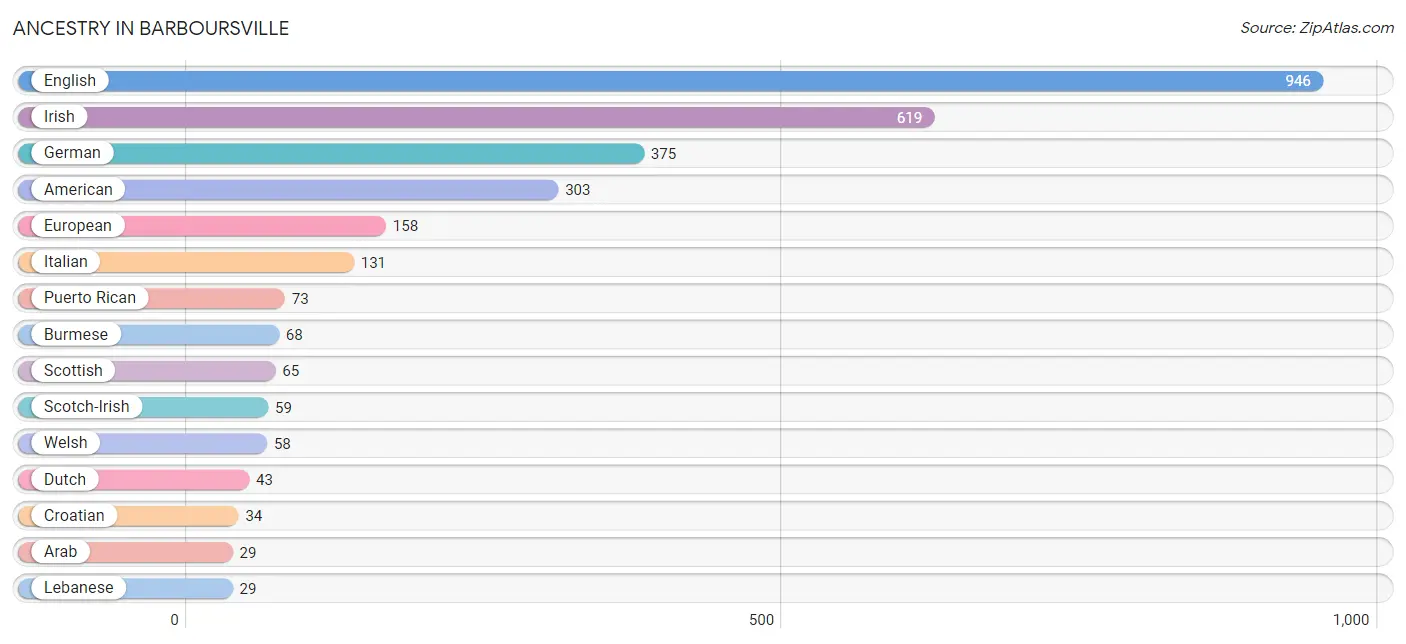
| Ancestry | # Population | % Population |
| American | 303 | 6.9% |
| Apache | 8 | 0.2% |
| Arab | 29 | 0.7% |
| Austrian | 10 | 0.2% |
| Bhutanese | 10 | 0.2% |
| Blackfeet | 15 | 0.3% |
| Burmese | 68 | 1.5% |
| Canadian | 26 | 0.6% |
| Central American | 3 | 0.1% |
| Cherokee | 8 | 0.2% |
| Croatian | 34 | 0.8% |
| Dutch | 43 | 1.0% |
| English | 946 | 21.5% |
| European | 158 | 3.6% |
| German | 375 | 8.5% |
| Hungarian | 3 | 0.1% |
| Irish | 619 | 14.1% |
| Iroquois | 9 | 0.2% |
| Italian | 131 | 3.0% |
| Jamaican | 8 | 0.2% |
| Korean | 6 | 0.1% |
| Lebanese | 29 | 0.7% |
| Mexican | 29 | 0.7% |
| Norwegian | 8 | 0.2% |
| Polish | 29 | 0.7% |
| Puerto Rican | 73 | 1.7% |
| Salvadoran | 3 | 0.1% |
| Scotch-Irish | 59 | 1.3% |
| Scottish | 65 | 1.5% |
| Sioux | 9 | 0.2% |
| Swiss | 22 | 0.5% |
| Welsh | 58 | 1.3% | View All 32 Rows |
Immigrants in Barboursville
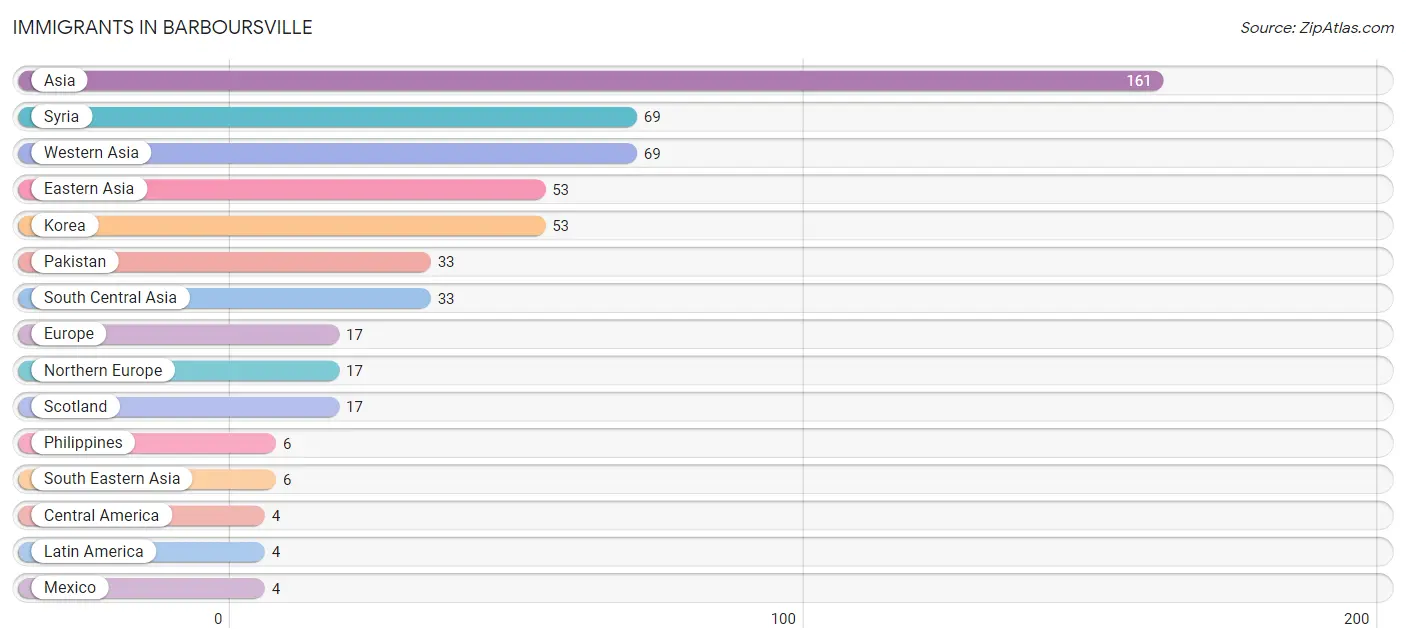
The most numerous immigrant groups reported in Barboursville came from Asia (161 | 3.7%), Syria (69 | 1.6%), Western Asia (69 | 1.6%), Eastern Asia (53 | 1.2%), and Korea (53 | 1.2%), together accounting for 9.2% of all Barboursville residents.
| Immigration Origin | # Population | % Population |
| Asia | 161 | 3.7% |
| Central America | 4 | 0.1% |
| Eastern Asia | 53 | 1.2% |
| Europe | 17 | 0.4% |
| Korea | 53 | 1.2% |
| Latin America | 4 | 0.1% |
| Mexico | 4 | 0.1% |
| Northern Europe | 17 | 0.4% |
| Pakistan | 33 | 0.7% |
| Philippines | 6 | 0.1% |
| Scotland | 17 | 0.4% |
| South Central Asia | 33 | 0.7% |
| South Eastern Asia | 6 | 0.1% |
| Syria | 69 | 1.6% |
| Western Asia | 69 | 1.6% | View All 15 Rows |
Sex and Age in Barboursville
Sex and Age in Barboursville
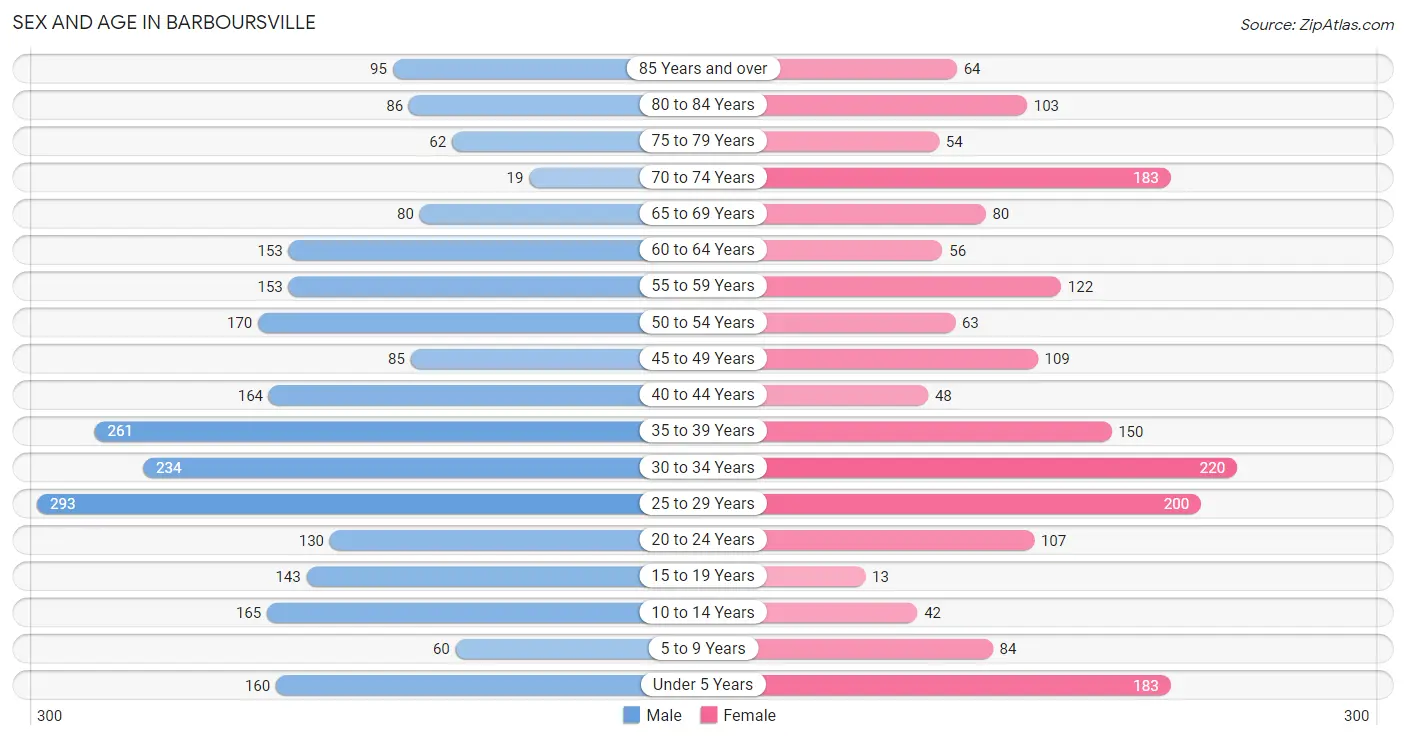
The most populous age groups in Barboursville are 25 to 29 Years (293 | 11.7%) for men and 30 to 34 Years (220 | 11.7%) for women.
| Age Bracket | Male | Female |
| Under 5 Years | 160 (6.4%) | 183 (9.7%) |
| 5 to 9 Years | 60 (2.4%) | 84 (4.5%) |
| 10 to 14 Years | 165 (6.6%) | 42 (2.2%) |
| 15 to 19 Years | 143 (5.7%) | 13 (0.7%) |
| 20 to 24 Years | 130 (5.2%) | 107 (5.7%) |
| 25 to 29 Years | 293 (11.7%) | 200 (10.6%) |
| 30 to 34 Years | 234 (9.3%) | 220 (11.7%) |
| 35 to 39 Years | 261 (10.4%) | 150 (8.0%) |
| 40 to 44 Years | 164 (6.5%) | 48 (2.5%) |
| 45 to 49 Years | 85 (3.4%) | 109 (5.8%) |
| 50 to 54 Years | 170 (6.8%) | 63 (3.4%) |
| 55 to 59 Years | 153 (6.1%) | 122 (6.5%) |
| 60 to 64 Years | 153 (6.1%) | 56 (3.0%) |
| 65 to 69 Years | 80 (3.2%) | 80 (4.3%) |
| 70 to 74 Years | 19 (0.8%) | 183 (9.7%) |
| 75 to 79 Years | 62 (2.5%) | 54 (2.9%) |
| 80 to 84 Years | 86 (3.4%) | 103 (5.5%) |
| 85 Years and over | 95 (3.8%) | 64 (3.4%) |
| Total | 2,513 (100.0%) | 1,881 (100.0%) |
Families and Households in Barboursville
Median Family Size in Barboursville
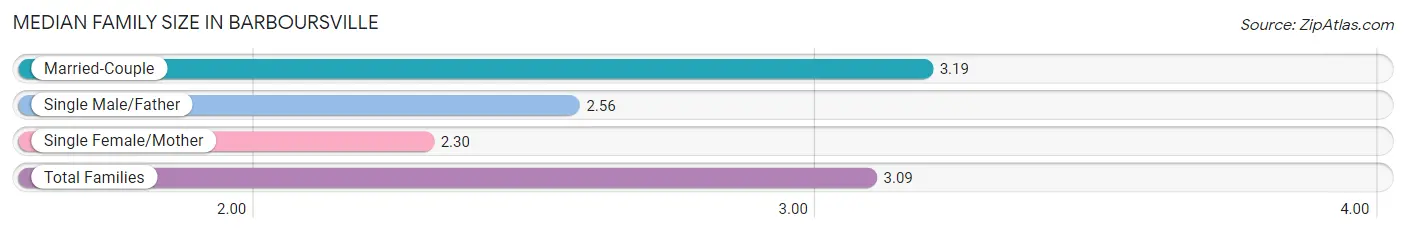
The median family size in Barboursville is 3.09 persons per family, with married-couple families (716 | 87.8%) accounting for the largest median family size of 3.19 persons per family. On the other hand, single female/mother families (83 | 10.2%) represent the smallest median family size with 2.30 persons per family.
| Family Type | # Families | Family Size |
| Married-Couple | 716 (87.8%) | 3.19 |
| Single Male/Father | 16 (2.0%) | 2.56 |
| Single Female/Mother | 83 (10.2%) | 2.30 |
| Total Families | 815 (100.0%) | 3.09 |
Median Household Size in Barboursville
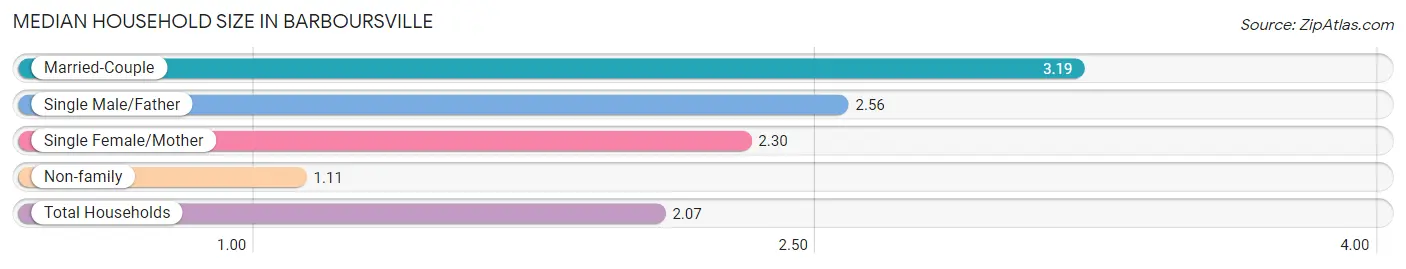
The median household size in Barboursville is 2.07 persons per household, with married-couple households (716 | 42.7%) accounting for the largest median household size of 3.19 persons per household. non-family households (863 | 51.4%) represent the smallest median household size with 1.11 persons per household.
| Household Type | # Households | Household Size |
| Married-Couple | 716 (42.7%) | 3.19 |
| Single Male/Father | 16 (0.9%) | 2.56 |
| Single Female/Mother | 83 (5.0%) | 2.30 |
| Non-family | 863 (51.4%) | 1.11 |
| Total Households | 1,678 (100.0%) | 2.07 |
Household Size by Marriage Status in Barboursville
Out of a total of 1,678 households in Barboursville, 815 (48.6%) are family households, while 863 (51.4%) are nonfamily households. The most numerous type of family households are 2-person households, comprising 401, and the most common type of nonfamily households are 1-person households, comprising 771.
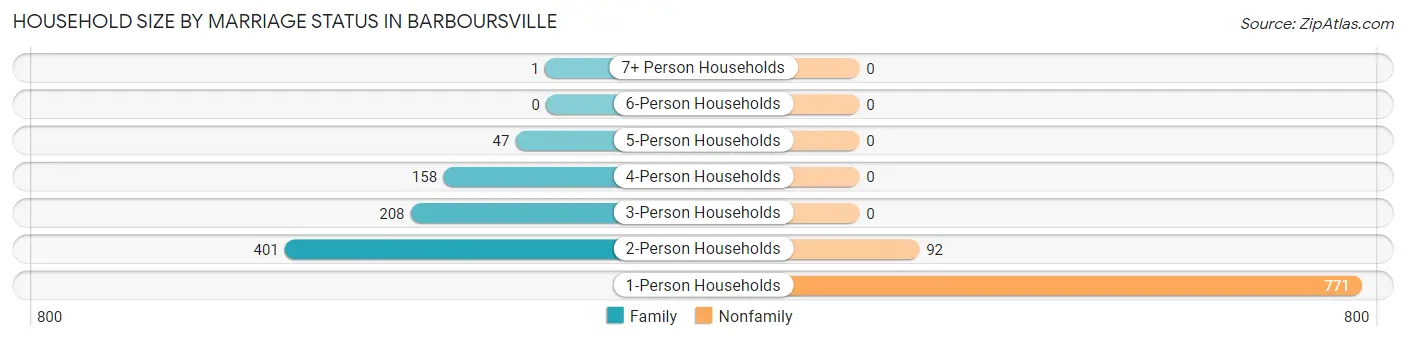
| Household Size | Family Households | Nonfamily Households |
| 1-Person Households | - | 771 (46.0%) |
| 2-Person Households | 401 (23.9%) | 92 (5.5%) |
| 3-Person Households | 208 (12.4%) | 0 (0.0%) |
| 4-Person Households | 158 (9.4%) | 0 (0.0%) |
| 5-Person Households | 47 (2.8%) | 0 (0.0%) |
| 6-Person Households | 0 (0.0%) | 0 (0.0%) |
| 7+ Person Households | 1 (0.1%) | 0 (0.0%) |
| Total | 815 (48.6%) | 863 (51.4%) |
Female Fertility in Barboursville
Fertility by Age in Barboursville
Average fertility rate in Barboursville is 73.0 births per 1,000 women. Women in the age bracket of 15 to 19 years have the highest fertility rate with 769.0 births per 1,000 women. Women in the age bracket of 20 to 34 years acount for 84.1% of all women with births.
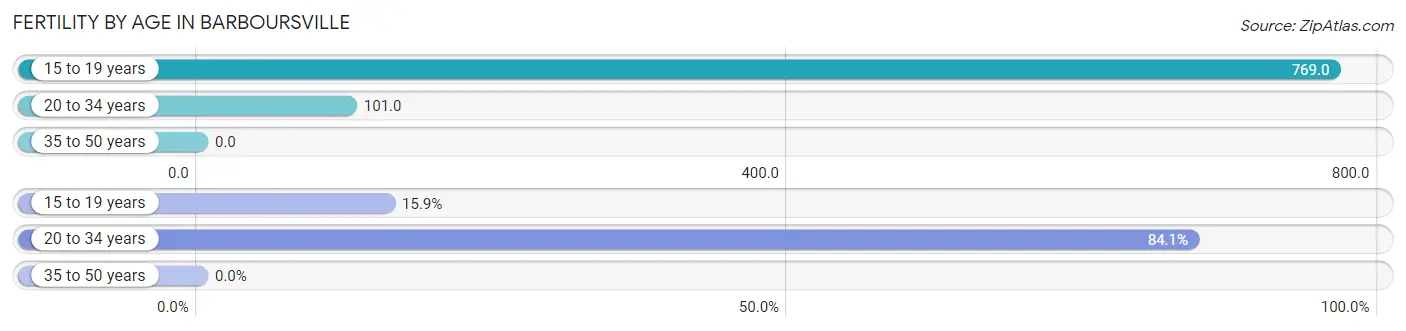
| Age Bracket | Women with Births | Births / 1,000 Women |
| 15 to 19 years | 10 (15.9%) | 769.0 |
| 20 to 34 years | 53 (84.1%) | 101.0 |
| 35 to 50 years | 0 (0.0%) | 0.0 |
| Total | 63 (100.0%) | 73.0 |
Fertility by Age by Marriage Status in Barboursville
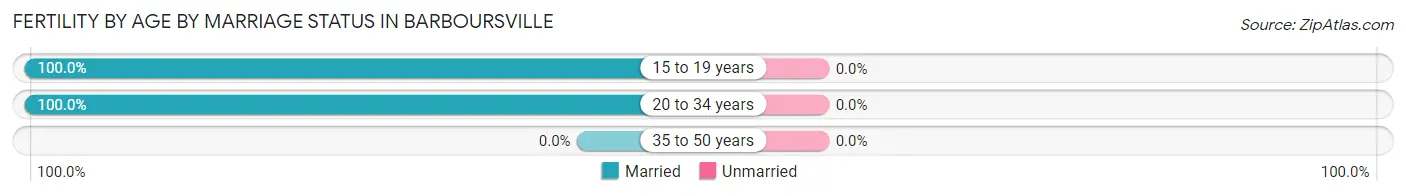
| Age Bracket | Married | Unmarried |
| 15 to 19 years | 10 (100.0%) | 0 (0.0%) |
| 20 to 34 years | 53 (100.0%) | 0 (0.0%) |
| 35 to 50 years | 0 (0.0%) | 0 (0.0%) |
| Total | 63 (100.0%) | 0 (0.0%) |
Fertility by Education in Barboursville
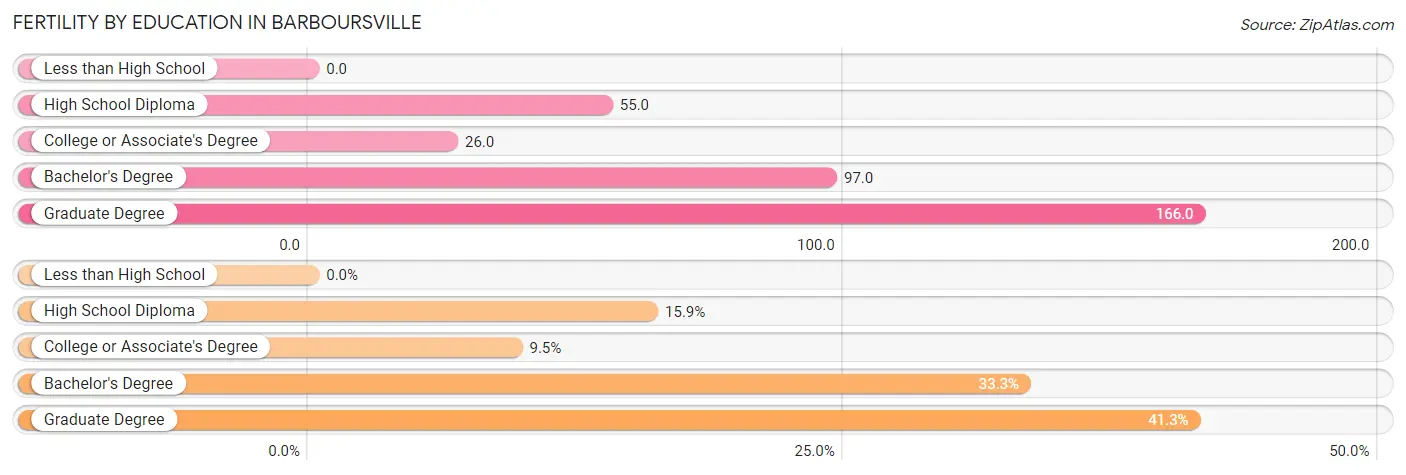
| Educational Attainment | Women with Births | Births / 1,000 Women |
| Less than High School | 0 (0.0%) | 0.0 |
| High School Diploma | 10 (15.9%) | 55.0 |
| College or Associate's Degree | 6 (9.5%) | 26.0 |
| Bachelor's Degree | 21 (33.3%) | 97.0 |
| Graduate Degree | 26 (41.3%) | 166.0 |
| Total | 63 (100.0%) | 73.0 |
Fertility by Education by Marriage Status in Barboursville
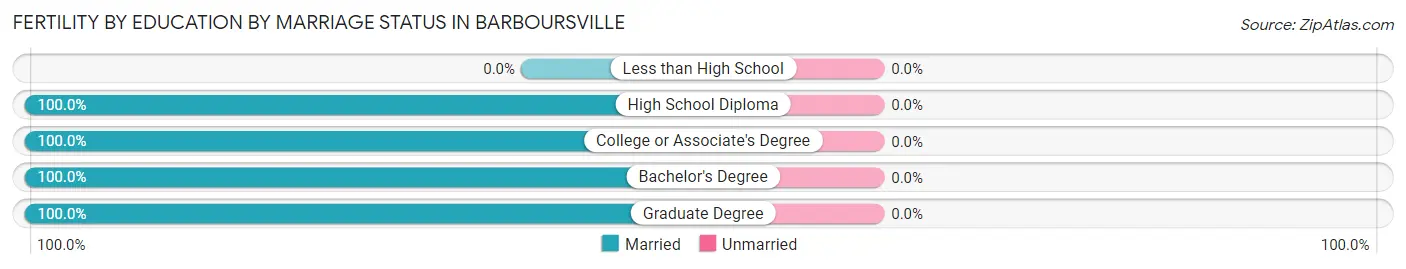
| Educational Attainment | Married | Unmarried |
| Less than High School | 0 (0.0%) | 0 (0.0%) |
| High School Diploma | 10 (100.0%) | 0 (0.0%) |
| College or Associate's Degree | 6 (100.0%) | 0 (0.0%) |
| Bachelor's Degree | 21 (100.0%) | 0 (0.0%) |
| Graduate Degree | 26 (100.0%) | 0 (0.0%) |
| Total | 63 (100.0%) | 0 (0.0%) |
Employment Characteristics in Barboursville
Employment by Class of Employer in Barboursville
Among the 1,638 employed individuals in Barboursville, private company employees (1,048 | 64.0%), not-for-profit organizations (222 | 13.6%), and federal government employees (120 | 7.3%) make up the most common classes of employment.
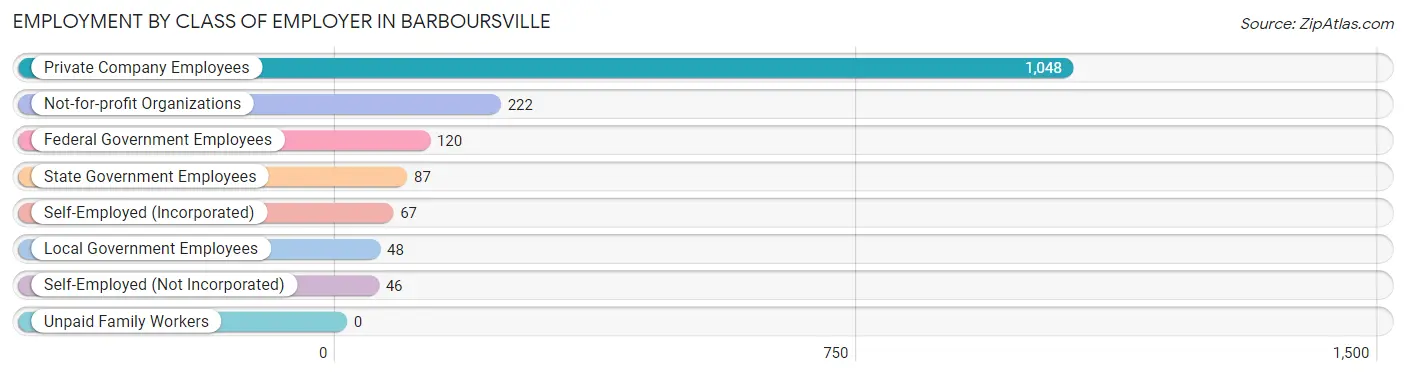
| Employer Class | # Employees | % Employees |
| Private Company Employees | 1,048 | 64.0% |
| Self-Employed (Incorporated) | 67 | 4.1% |
| Self-Employed (Not Incorporated) | 46 | 2.8% |
| Not-for-profit Organizations | 222 | 13.6% |
| Local Government Employees | 48 | 2.9% |
| State Government Employees | 87 | 5.3% |
| Federal Government Employees | 120 | 7.3% |
| Unpaid Family Workers | 0 | 0.0% |
| Total | 1,638 | 100.0% |
Employment Status by Age in Barboursville
According to the labor force statistics for Barboursville, out of the total population over 16 years of age (3,638), 45.7% or 1,663 individuals are in the labor force, with 1.2% or 20 of them unemployed. The age group with the highest labor force participation rate is 30 to 34 years, with 67.2% or 305 individuals in the labor force. Within the labor force, the 60 to 64 years age range has the highest percentage of unemployed individuals, with 18.9% or 18 of them being unemployed.
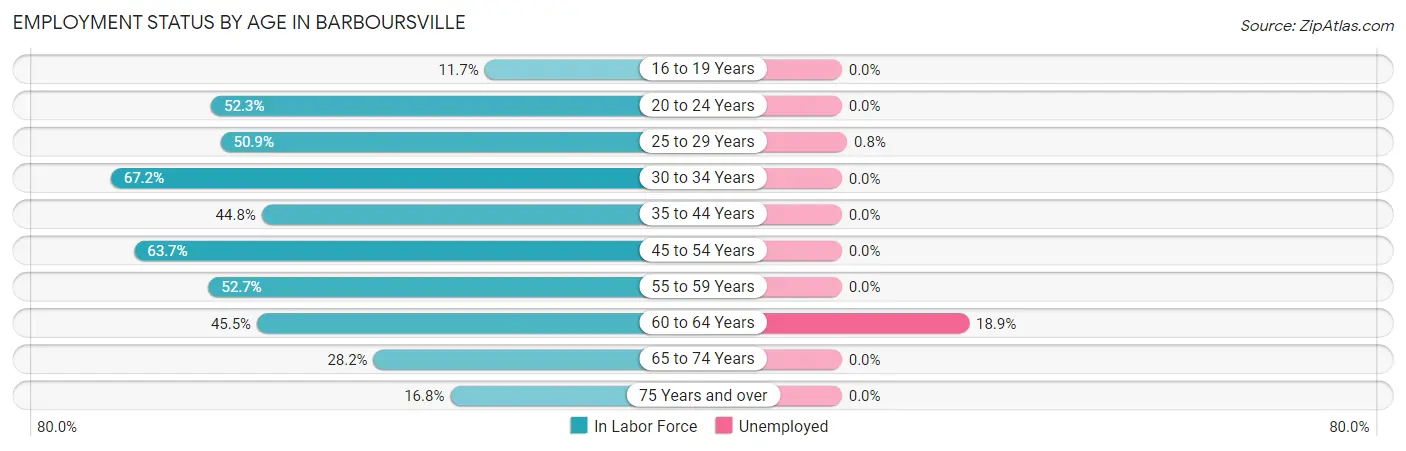
| Age Bracket | In Labor Force | Unemployed |
| 16 to 19 Years | 11 (11.7%) | 0 (0.0%) |
| 20 to 24 Years | 124 (52.3%) | 0 (0.0%) |
| 25 to 29 Years | 251 (50.9%) | 2 (0.8%) |
| 30 to 34 Years | 305 (67.2%) | 0 (0.0%) |
| 35 to 44 Years | 279 (44.8%) | 0 (0.0%) |
| 45 to 54 Years | 272 (63.7%) | 0 (0.0%) |
| 55 to 59 Years | 145 (52.7%) | 0 (0.0%) |
| 60 to 64 Years | 95 (45.5%) | 18 (18.9%) |
| 65 to 74 Years | 102 (28.2%) | 0 (0.0%) |
| 75 Years and over | 78 (16.8%) | 0 (0.0%) |
| Total | 1,663 (45.7%) | 20 (1.2%) |
Employment Status by Educational Attainment in Barboursville
According to labor force statistics for Barboursville, 54.3% of individuals (1,347) out of the total population between 25 and 64 years of age (2,481) are in the labor force, with 1.5% or 20 of them being unemployed. The group with the highest labor force participation rate are those with the educational attainment of bachelor's degree or higher, with 82.4% or 650 individuals in the labor force. Within the labor force, individuals with college / associate degree education have the highest percentage of unemployment, with 5.3% or 20 of them being unemployed.
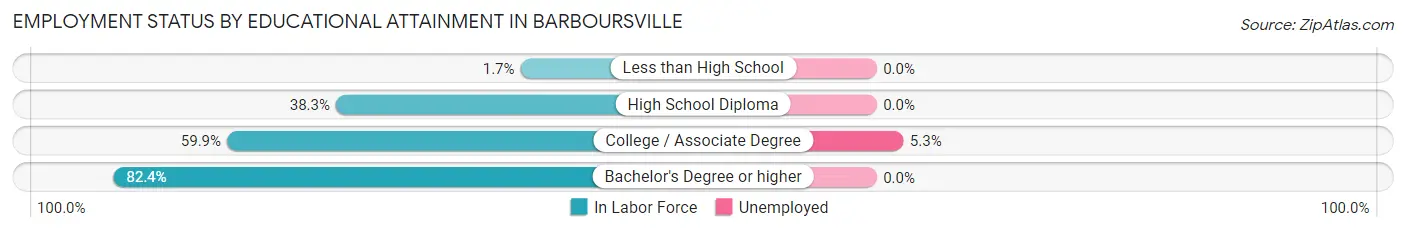
| Educational Attainment | In Labor Force | Unemployed |
| Less than High School | 4 (1.7%) | 0 (0.0%) |
| High School Diploma | 317 (38.3%) | 0 (0.0%) |
| College / Associate Degree | 376 (59.9%) | 33 (5.3%) |
| Bachelor's Degree or higher | 650 (82.4%) | 0 (0.0%) |
| Total | 1,347 (54.3%) | 37 (1.5%) |
Employment Occupations by Sex in Barboursville
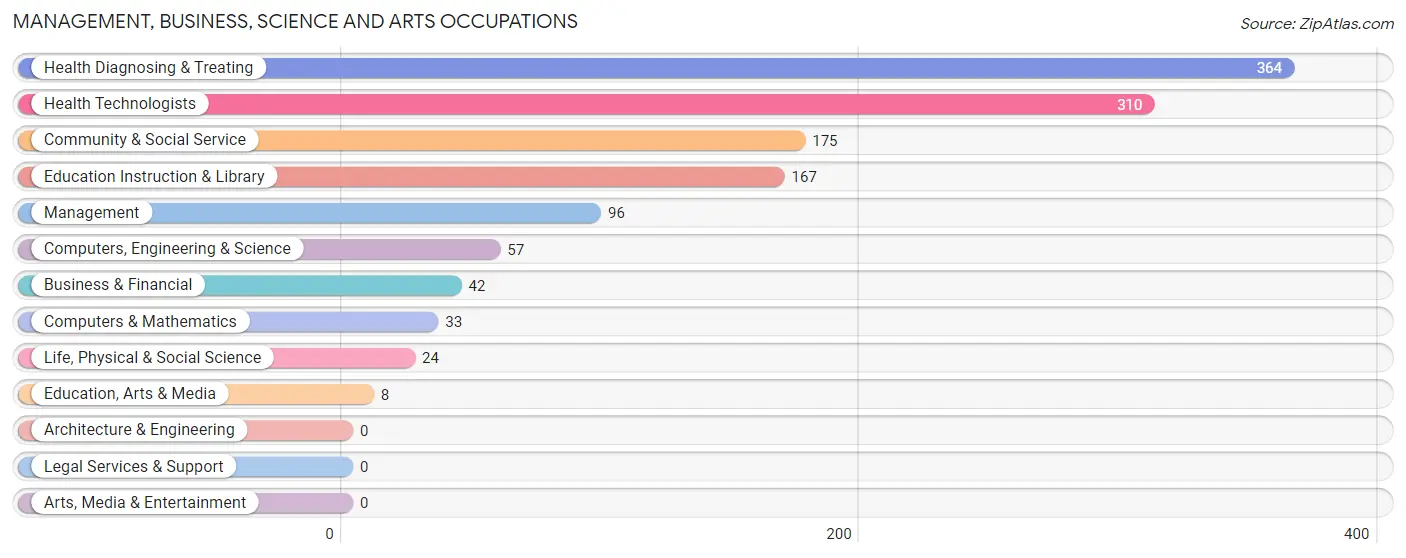
Management, Business, Science and Arts Occupations
The most common Management, Business, Science and Arts occupations in Barboursville are Health Diagnosing & Treating (364 | 22.2%), Health Technologists (310 | 18.9%), Community & Social Service (175 | 10.7%), Education Instruction & Library (167 | 10.2%), and Management (96 | 5.9%).
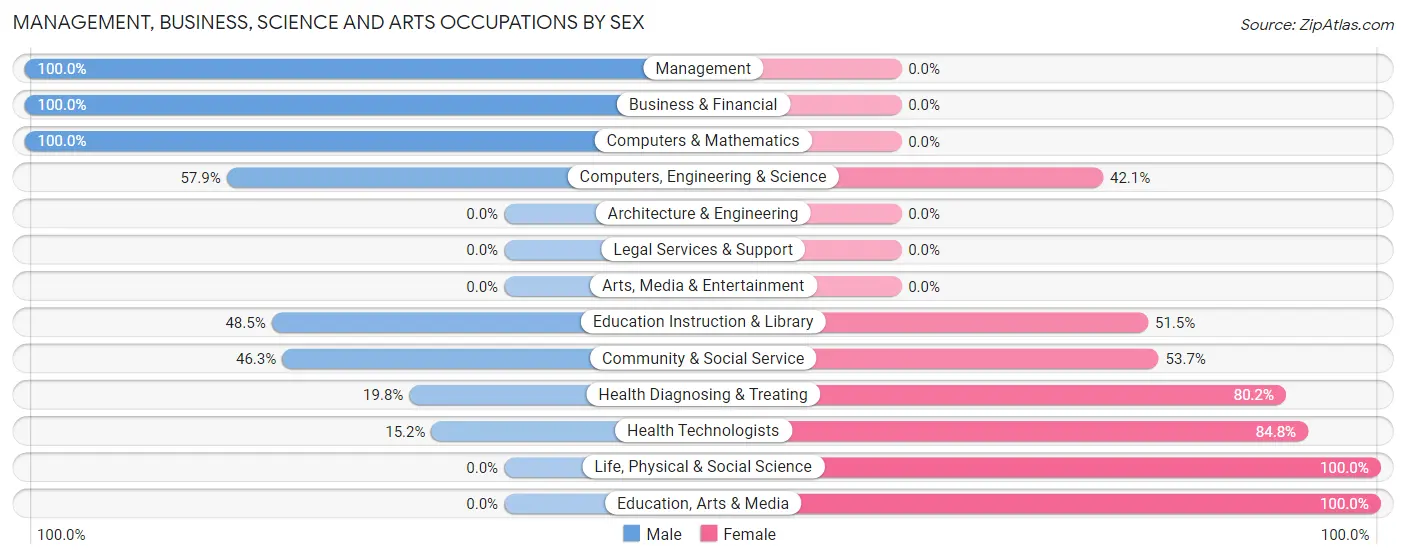
Management, Business, Science and Arts Occupations by Sex
Within the Management, Business, Science and Arts occupations in Barboursville, the most male-oriented occupations are Management (100.0%), Business & Financial (100.0%), and Computers & Mathematics (100.0%), while the most female-oriented occupations are Life, Physical & Social Science (100.0%), Education, Arts & Media (100.0%), and Health Technologists (84.8%).
| Occupation | Male | Female |
| Management | 96 (100.0%) | 0 (0.0%) |
| Business & Financial | 42 (100.0%) | 0 (0.0%) |
| Computers, Engineering & Science | 33 (57.9%) | 24 (42.1%) |
| Computers & Mathematics | 33 (100.0%) | 0 (0.0%) |
| Architecture & Engineering | 0 (0.0%) | 0 (0.0%) |
| Life, Physical & Social Science | 0 (0.0%) | 24 (100.0%) |
| Community & Social Service | 81 (46.3%) | 94 (53.7%) |
| Education, Arts & Media | 0 (0.0%) | 8 (100.0%) |
| Legal Services & Support | 0 (0.0%) | 0 (0.0%) |
| Education Instruction & Library | 81 (48.5%) | 86 (51.5%) |
| Arts, Media & Entertainment | 0 (0.0%) | 0 (0.0%) |
| Health Diagnosing & Treating | 72 (19.8%) | 292 (80.2%) |
| Health Technologists | 47 (15.2%) | 263 (84.8%) |
| Total (Category) | 324 (44.1%) | 410 (55.9%) |
| Total (Overall) | 873 (53.2%) | 769 (46.8%) |
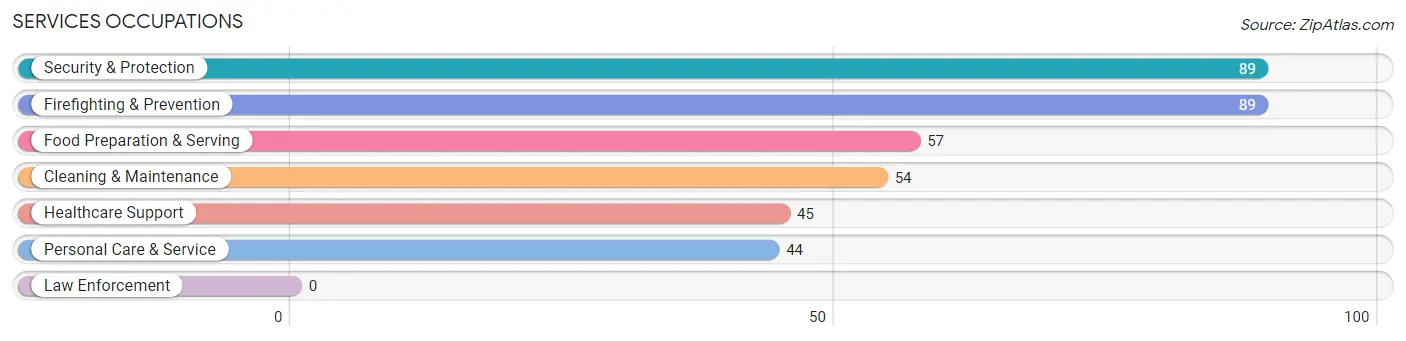
Services Occupations
The most common Services occupations in Barboursville are Security & Protection (89 | 5.4%), Firefighting & Prevention (89 | 5.4%), Food Preparation & Serving (57 | 3.5%), Cleaning & Maintenance (54 | 3.3%), and Healthcare Support (45 | 2.7%).
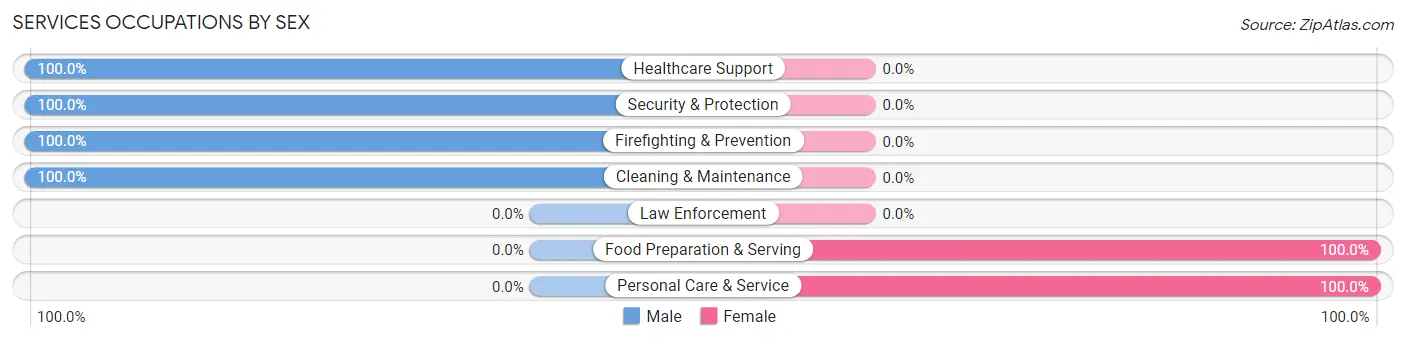
Services Occupations by Sex
Within the Services occupations in Barboursville, the most male-oriented occupations are Healthcare Support (100.0%), Security & Protection (100.0%), and Firefighting & Prevention (100.0%), while the most female-oriented occupations are Food Preparation & Serving (100.0%), and Personal Care & Service (100.0%).
| Occupation | Male | Female |
| Healthcare Support | 45 (100.0%) | 0 (0.0%) |
| Security & Protection | 89 (100.0%) | 0 (0.0%) |
| Firefighting & Prevention | 89 (100.0%) | 0 (0.0%) |
| Law Enforcement | 0 (0.0%) | 0 (0.0%) |
| Food Preparation & Serving | 0 (0.0%) | 57 (100.0%) |
| Cleaning & Maintenance | 54 (100.0%) | 0 (0.0%) |
| Personal Care & Service | 0 (0.0%) | 44 (100.0%) |
| Total (Category) | 188 (65.0%) | 101 (34.9%) |
| Total (Overall) | 873 (53.2%) | 769 (46.8%) |
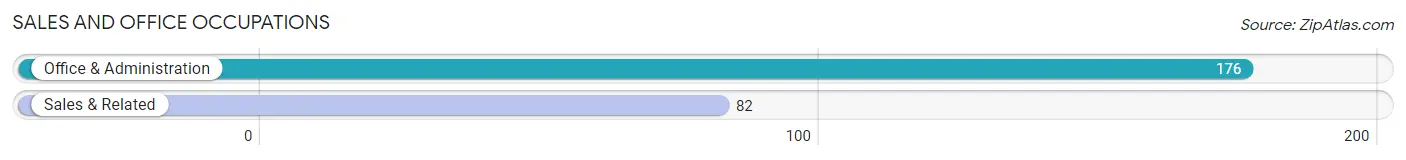
Sales and Office Occupations
The most common Sales and Office occupations in Barboursville are Office & Administration (176 | 10.7%), and Sales & Related (82 | 5.0%).
Sales and Office Occupations by Sex
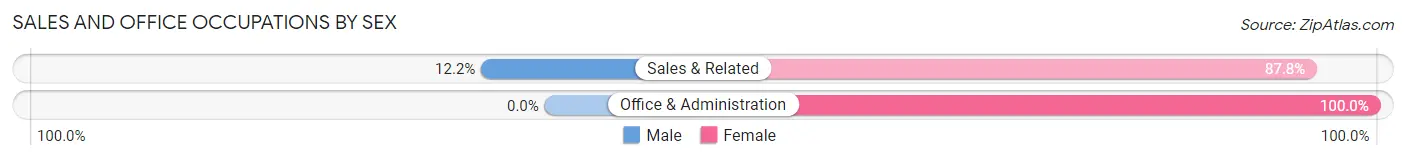
| Occupation | Male | Female |
| Sales & Related | 10 (12.2%) | 72 (87.8%) |
| Office & Administration | 0 (0.0%) | 176 (100.0%) |
| Total (Category) | 10 (3.9%) | 248 (96.1%) |
| Total (Overall) | 873 (53.2%) | 769 (46.8%) |
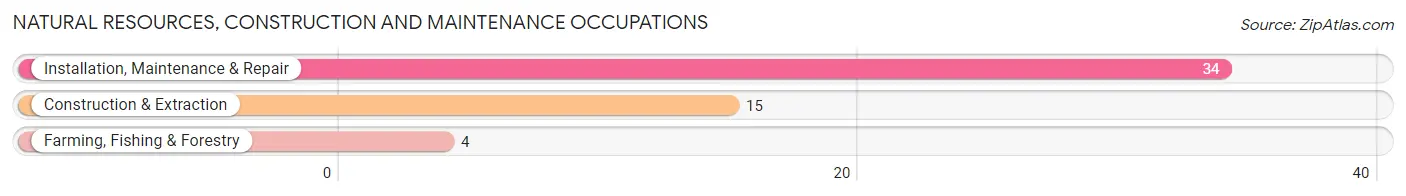
Natural Resources, Construction and Maintenance Occupations
The most common Natural Resources, Construction and Maintenance occupations in Barboursville are Installation, Maintenance & Repair (34 | 2.1%), Construction & Extraction (15 | 0.9%), and Farming, Fishing & Forestry (4 | 0.2%).
Natural Resources, Construction and Maintenance Occupations by Sex
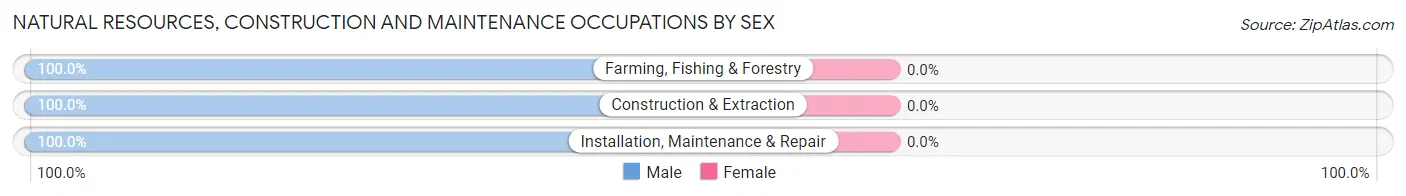
| Occupation | Male | Female |
| Farming, Fishing & Forestry | 4 (100.0%) | 0 (0.0%) |
| Construction & Extraction | 15 (100.0%) | 0 (0.0%) |
| Installation, Maintenance & Repair | 34 (100.0%) | 0 (0.0%) |
| Total (Category) | 53 (100.0%) | 0 (0.0%) |
| Total (Overall) | 873 (53.2%) | 769 (46.8%) |
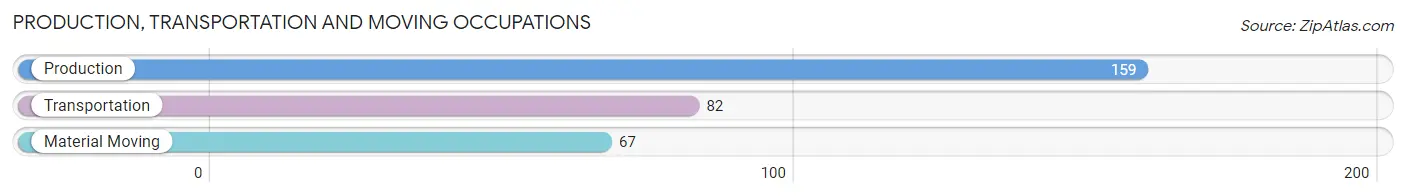
Production, Transportation and Moving Occupations
The most common Production, Transportation and Moving occupations in Barboursville are Production (159 | 9.7%), Transportation (82 | 5.0%), and Material Moving (67 | 4.1%).
Production, Transportation and Moving Occupations by Sex
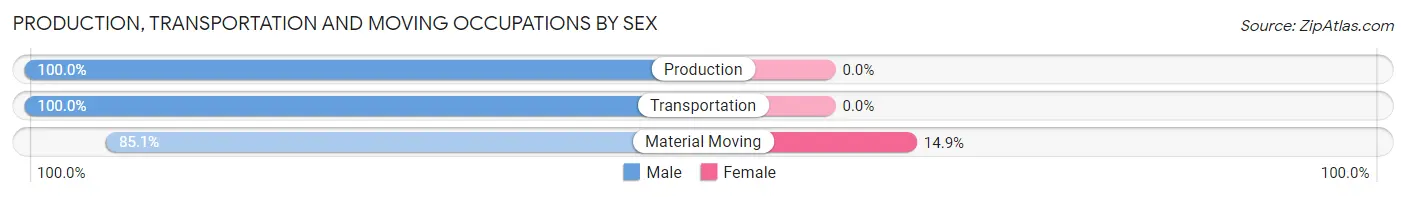
| Occupation | Male | Female |
| Production | 159 (100.0%) | 0 (0.0%) |
| Transportation | 82 (100.0%) | 0 (0.0%) |
| Material Moving | 57 (85.1%) | 10 (14.9%) |
| Total (Category) | 298 (96.8%) | 10 (3.3%) |
| Total (Overall) | 873 (53.2%) | 769 (46.8%) |
Employment Industries by Sex in Barboursville
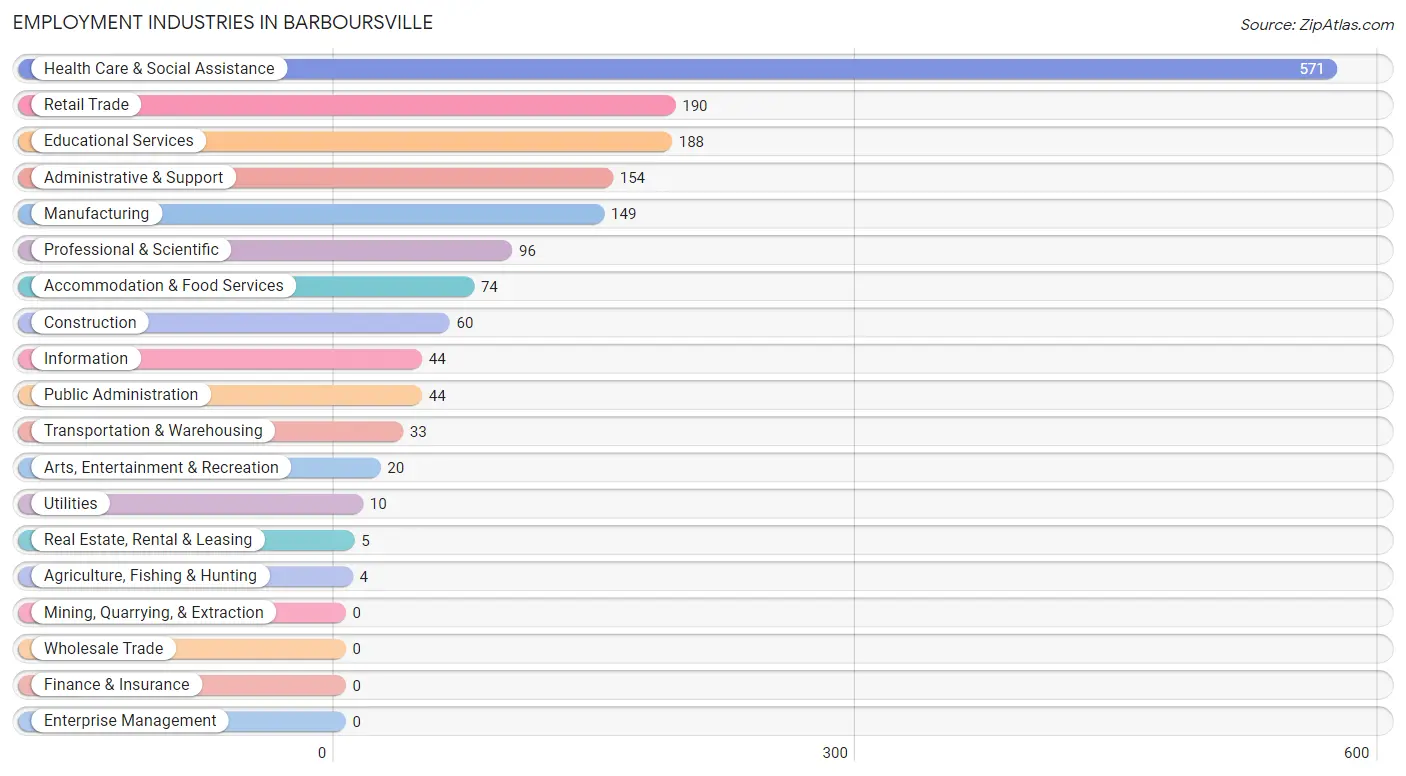
Employment Industries in Barboursville
The major employment industries in Barboursville include Health Care & Social Assistance (571 | 34.8%), Retail Trade (190 | 11.6%), Educational Services (188 | 11.5%), Administrative & Support (154 | 9.4%), and Manufacturing (149 | 9.1%).
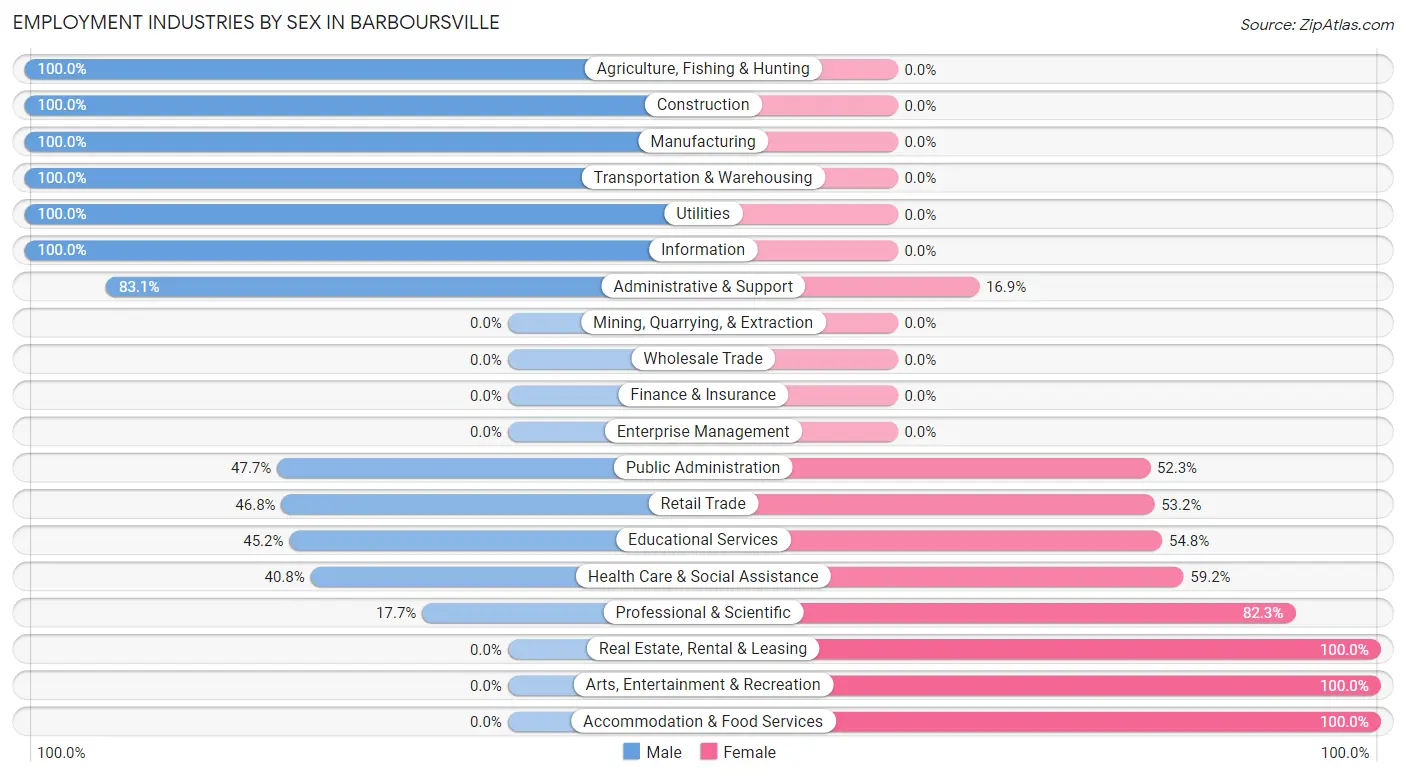
Employment Industries by Sex in Barboursville
The Barboursville industries that see more men than women are Agriculture, Fishing & Hunting (100.0%), Construction (100.0%), and Manufacturing (100.0%), whereas the industries that tend to have a higher number of women are Real Estate, Rental & Leasing (100.0%), Arts, Entertainment & Recreation (100.0%), and Accommodation & Food Services (100.0%).
| Industry | Male | Female |
| Agriculture, Fishing & Hunting | 4 (100.0%) | 0 (0.0%) |
| Mining, Quarrying, & Extraction | 0 (0.0%) | 0 (0.0%) |
| Construction | 60 (100.0%) | 0 (0.0%) |
| Manufacturing | 149 (100.0%) | 0 (0.0%) |
| Wholesale Trade | 0 (0.0%) | 0 (0.0%) |
| Retail Trade | 89 (46.8%) | 101 (53.2%) |
| Transportation & Warehousing | 33 (100.0%) | 0 (0.0%) |
| Utilities | 10 (100.0%) | 0 (0.0%) |
| Information | 44 (100.0%) | 0 (0.0%) |
| Finance & Insurance | 0 (0.0%) | 0 (0.0%) |
| Real Estate, Rental & Leasing | 0 (0.0%) | 5 (100.0%) |
| Professional & Scientific | 17 (17.7%) | 79 (82.3%) |
| Enterprise Management | 0 (0.0%) | 0 (0.0%) |
| Administrative & Support | 128 (83.1%) | 26 (16.9%) |
| Educational Services | 85 (45.2%) | 103 (54.8%) |
| Health Care & Social Assistance | 233 (40.8%) | 338 (59.2%) |
| Arts, Entertainment & Recreation | 0 (0.0%) | 20 (100.0%) |
| Accommodation & Food Services | 0 (0.0%) | 74 (100.0%) |
| Public Administration | 21 (47.7%) | 23 (52.3%) |
| Total | 873 (53.2%) | 769 (46.8%) |
Education in Barboursville
School Enrollment in Barboursville
The most common levels of schooling among the 730 students in Barboursville are middle school (195 | 26.7%), high school (155 | 21.2%), and graduate / professional (148 | 20.3%).
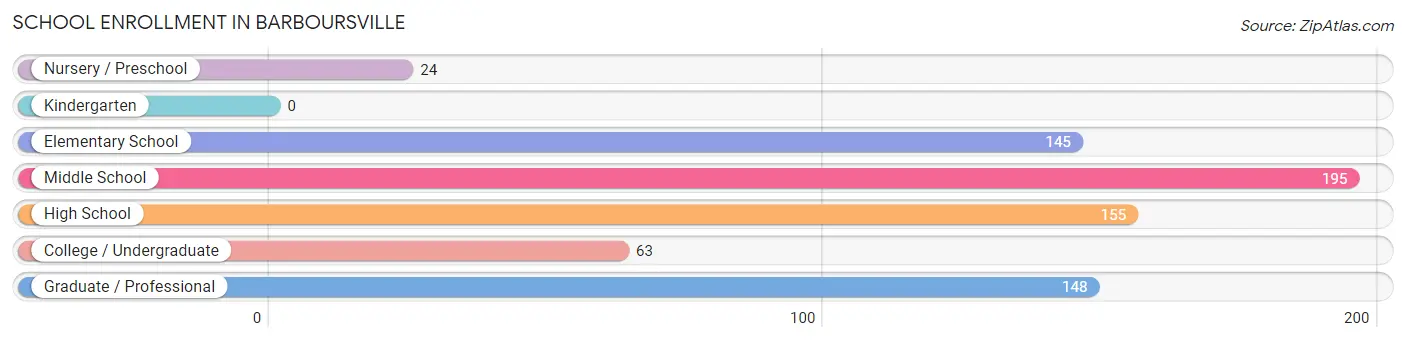
| School Level | # Students | % Students |
| Nursery / Preschool | 24 | 3.3% |
| Kindergarten | 0 | 0.0% |
| Elementary School | 145 | 19.9% |
| Middle School | 195 | 26.7% |
| High School | 155 | 21.2% |
| College / Undergraduate | 63 | 8.6% |
| Graduate / Professional | 148 | 20.3% |
| Total | 730 | 100.0% |
School Enrollment by Age by Funding Source in Barboursville
Out of a total of 730 students who are enrolled in schools in Barboursville, 67 (9.2%) attend a private institution, while the remaining 663 (90.8%) are enrolled in public schools. The age group of 3 to 4 year olds has the highest likelihood of being enrolled in private schools, with 18 (100.0% in the age bracket) enrolled. Conversely, the age group of 10 to 14 year olds has the lowest likelihood of being enrolled in a private school, with 207 (100.0% in the age bracket) attending a public institution.
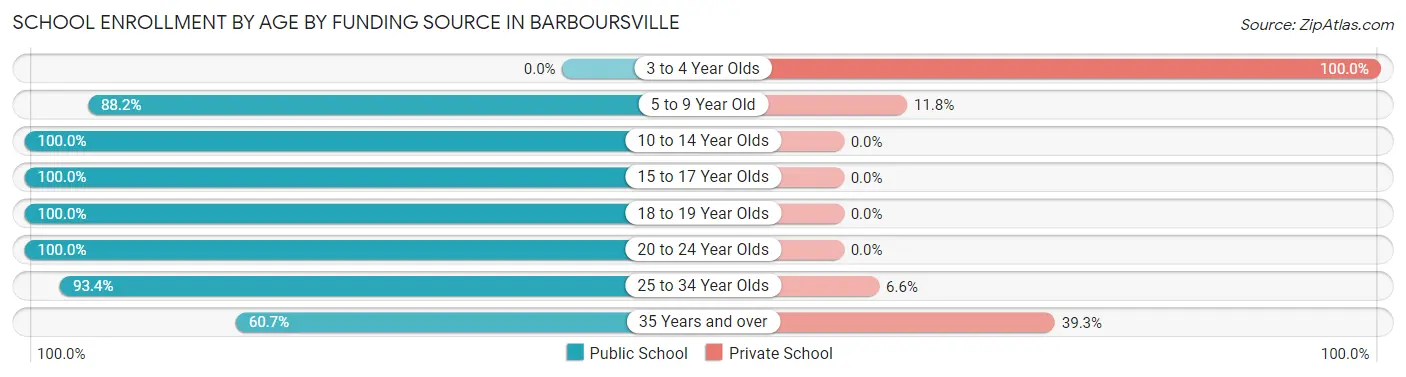
| Age Bracket | Public School | Private School |
| 3 to 4 Year Olds | 0 (0.0%) | 18 (100.0%) |
| 5 to 9 Year Old | 127 (88.2%) | 17 (11.8%) |
| 10 to 14 Year Olds | 207 (100.0%) | 0 (0.0%) |
| 15 to 17 Year Olds | 123 (100.0%) | 0 (0.0%) |
| 18 to 19 Year Olds | 3 (100.0%) | 0 (0.0%) |
| 20 to 24 Year Olds | 53 (100.0%) | 0 (0.0%) |
| 25 to 34 Year Olds | 113 (93.4%) | 8 (6.6%) |
| 35 Years and over | 37 (60.7%) | 24 (39.3%) |
| Total | 663 (90.8%) | 67 (9.2%) |
Educational Attainment by Field of Study in Barboursville
Education (388 | 30.7%), bio, nature & agricultural (169 | 13.4%), business (124 | 9.8%), science & technology (111 | 8.8%), and psychology (106 | 8.4%) are the most common fields of study among 1,263 individuals in Barboursville who have obtained a bachelor's degree or higher.
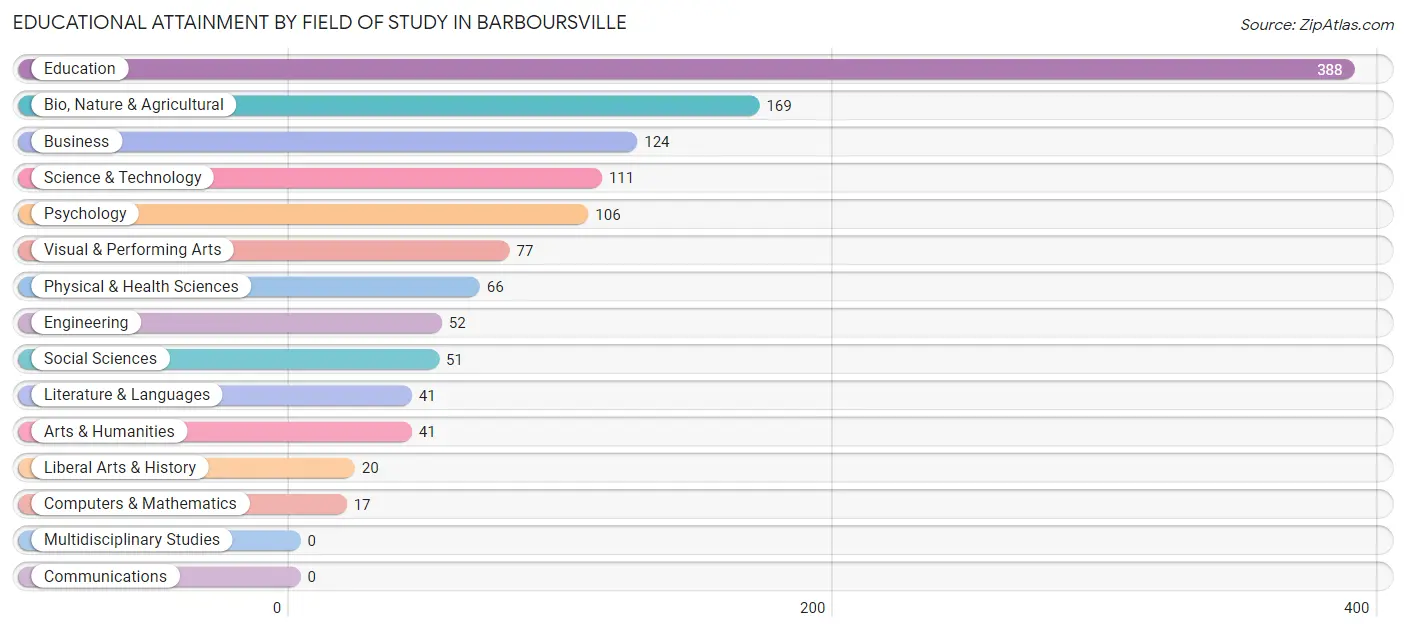
| Field of Study | # Graduates | % Graduates |
| Computers & Mathematics | 17 | 1.3% |
| Bio, Nature & Agricultural | 169 | 13.4% |
| Physical & Health Sciences | 66 | 5.2% |
| Psychology | 106 | 8.4% |
| Social Sciences | 51 | 4.0% |
| Engineering | 52 | 4.1% |
| Multidisciplinary Studies | 0 | 0.0% |
| Science & Technology | 111 | 8.8% |
| Business | 124 | 9.8% |
| Education | 388 | 30.7% |
| Literature & Languages | 41 | 3.3% |
| Liberal Arts & History | 20 | 1.6% |
| Visual & Performing Arts | 77 | 6.1% |
| Communications | 0 | 0.0% |
| Arts & Humanities | 41 | 3.3% |
| Total | 1,263 | 100.0% |
Transportation & Commute in Barboursville
Vehicle Availability by Sex in Barboursville
The most prevalent vehicle ownership categories in Barboursville are males with 2 vehicles (390, accounting for 44.9%) and females with 2 vehicles (261, making up 50.7%).
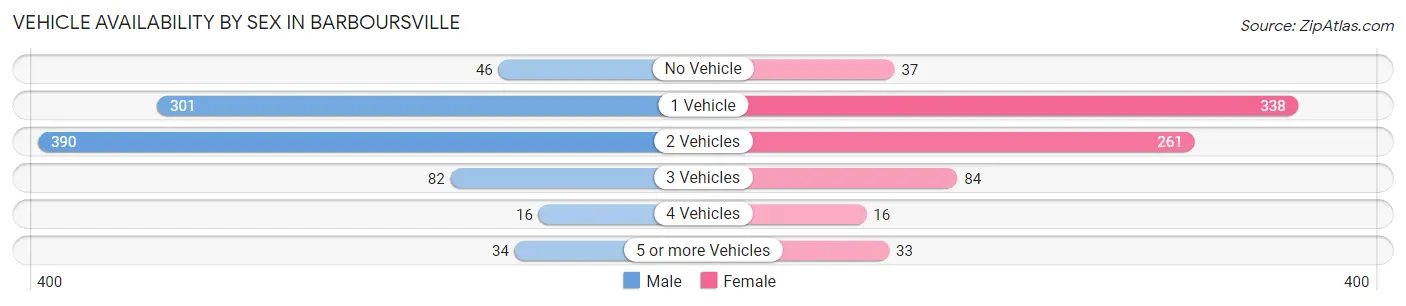
| Vehicles Available | Male | Female |
| No Vehicle | 46 (5.3%) | 37 (4.8%) |
| 1 Vehicle | 301 (34.6%) | 338 (44.0%) |
| 2 Vehicles | 390 (44.9%) | 261 (33.9%) |
| 3 Vehicles | 82 (9.4%) | 84 (10.9%) |
| 4 Vehicles | 16 (1.8%) | 16 (2.1%) |
| 5 or more Vehicles | 34 (3.9%) | 33 (4.3%) |
| Total | 869 (100.0%) | 769 (100.0%) |
Commute Time in Barboursville
The most frequently occuring commute durations in Barboursville are 15 to 19 minutes (356 commuters, 24.9%), 20 to 24 minutes (279 commuters, 19.5%), and 10 to 14 minutes (243 commuters, 17.0%).
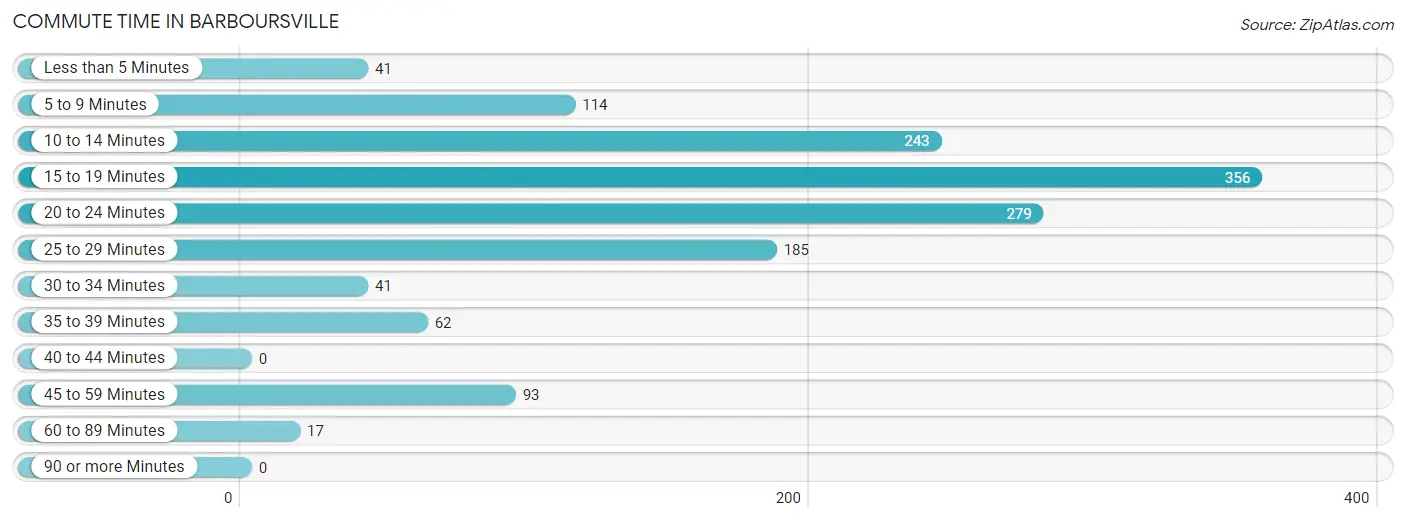
| Commute Time | # Commuters | % Commuters |
| Less than 5 Minutes | 41 | 2.9% |
| 5 to 9 Minutes | 114 | 8.0% |
| 10 to 14 Minutes | 243 | 17.0% |
| 15 to 19 Minutes | 356 | 24.9% |
| 20 to 24 Minutes | 279 | 19.5% |
| 25 to 29 Minutes | 185 | 12.9% |
| 30 to 34 Minutes | 41 | 2.9% |
| 35 to 39 Minutes | 62 | 4.3% |
| 40 to 44 Minutes | 0 | 0.0% |
| 45 to 59 Minutes | 93 | 6.5% |
| 60 to 89 Minutes | 17 | 1.2% |
| 90 or more Minutes | 0 | 0.0% |
Commute Time by Sex in Barboursville
The most common commute times in Barboursville are 15 to 19 minutes (216 commuters, 30.1%) for males and 20 to 24 minutes (206 commuters, 28.9%) for females.
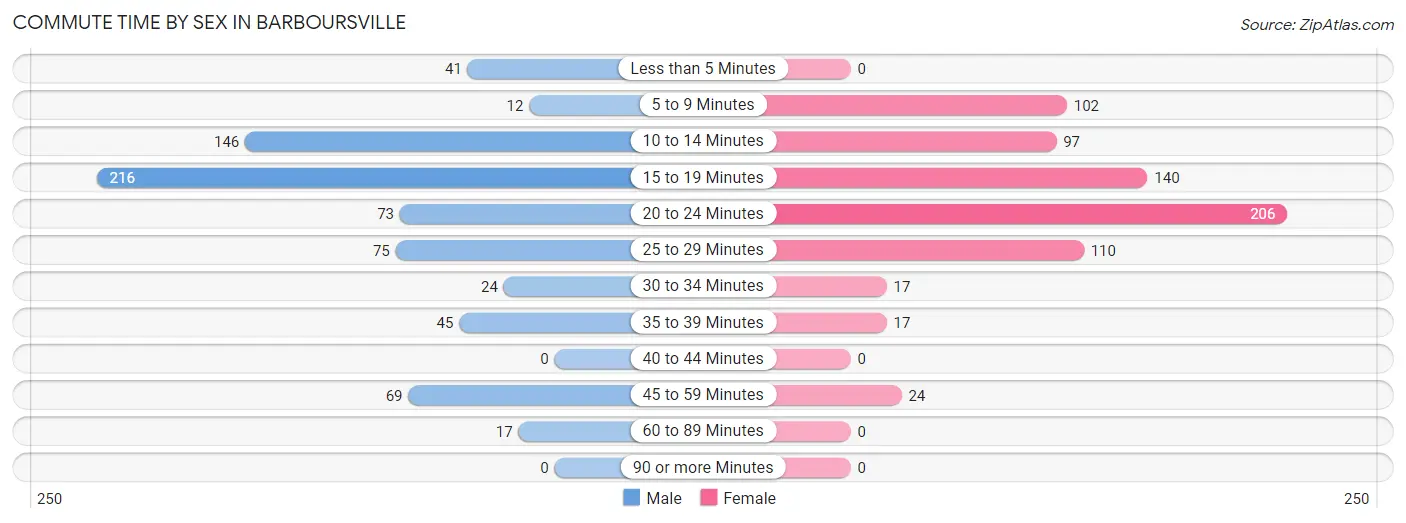
| Commute Time | Male | Female |
| Less than 5 Minutes | 41 (5.7%) | 0 (0.0%) |
| 5 to 9 Minutes | 12 (1.7%) | 102 (14.3%) |
| 10 to 14 Minutes | 146 (20.3%) | 97 (13.6%) |
| 15 to 19 Minutes | 216 (30.1%) | 140 (19.6%) |
| 20 to 24 Minutes | 73 (10.2%) | 206 (28.9%) |
| 25 to 29 Minutes | 75 (10.4%) | 110 (15.4%) |
| 30 to 34 Minutes | 24 (3.3%) | 17 (2.4%) |
| 35 to 39 Minutes | 45 (6.3%) | 17 (2.4%) |
| 40 to 44 Minutes | 0 (0.0%) | 0 (0.0%) |
| 45 to 59 Minutes | 69 (9.6%) | 24 (3.4%) |
| 60 to 89 Minutes | 17 (2.4%) | 0 (0.0%) |
| 90 or more Minutes | 0 (0.0%) | 0 (0.0%) |
Time of Departure to Work by Sex in Barboursville
The most frequent times of departure to work in Barboursville are 7:30 AM to 7:59 AM (121, 16.9%) for males and 6:00 AM to 6:29 AM (167, 23.4%) for females.
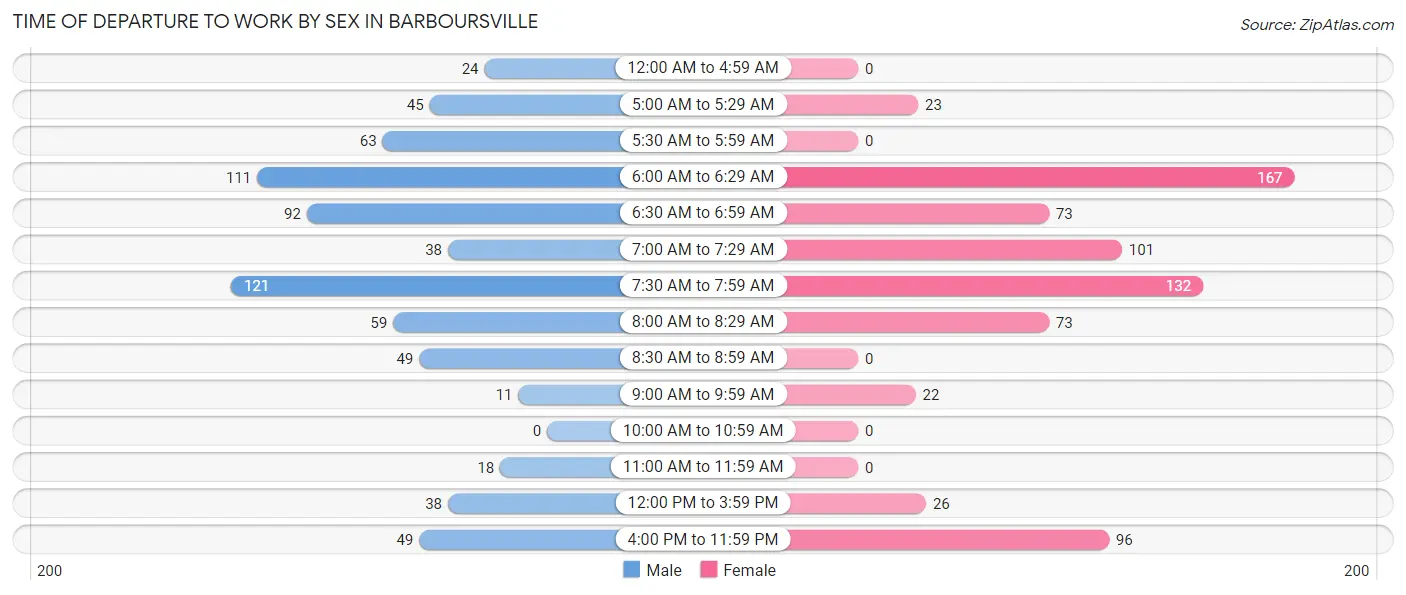
| Time of Departure | Male | Female |
| 12:00 AM to 4:59 AM | 24 (3.3%) | 0 (0.0%) |
| 5:00 AM to 5:29 AM | 45 (6.3%) | 23 (3.2%) |
| 5:30 AM to 5:59 AM | 63 (8.8%) | 0 (0.0%) |
| 6:00 AM to 6:29 AM | 111 (15.5%) | 167 (23.4%) |
| 6:30 AM to 6:59 AM | 92 (12.8%) | 73 (10.2%) |
| 7:00 AM to 7:29 AM | 38 (5.3%) | 101 (14.2%) |
| 7:30 AM to 7:59 AM | 121 (16.9%) | 132 (18.5%) |
| 8:00 AM to 8:29 AM | 59 (8.2%) | 73 (10.2%) |
| 8:30 AM to 8:59 AM | 49 (6.8%) | 0 (0.0%) |
| 9:00 AM to 9:59 AM | 11 (1.5%) | 22 (3.1%) |
| 10:00 AM to 10:59 AM | 0 (0.0%) | 0 (0.0%) |
| 11:00 AM to 11:59 AM | 18 (2.5%) | 0 (0.0%) |
| 12:00 PM to 3:59 PM | 38 (5.3%) | 26 (3.6%) |
| 4:00 PM to 11:59 PM | 49 (6.8%) | 96 (13.5%) |
| Total | 718 (100.0%) | 713 (100.0%) |
Housing Occupancy in Barboursville
Occupancy by Ownership in Barboursville
Of the total 1,678 dwellings in Barboursville, owner-occupied units account for 1,071 (63.8%), while renter-occupied units make up 607 (36.2%).
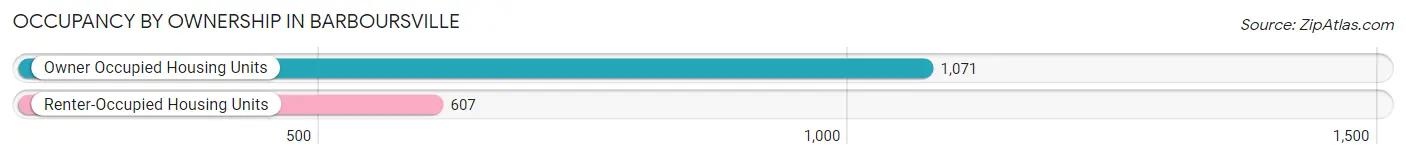
| Occupancy | # Housing Units | % Housing Units |
| Owner Occupied Housing Units | 1,071 | 63.8% |
| Renter-Occupied Housing Units | 607 | 36.2% |
| Total Occupied Housing Units | 1,678 | 100.0% |
Occupancy by Household Size in Barboursville
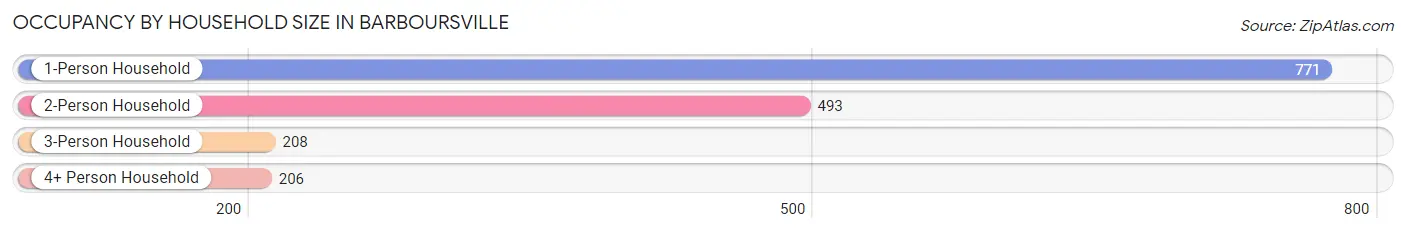
| Household Size | # Housing Units | % Housing Units |
| 1-Person Household | 771 | 46.0% |
| 2-Person Household | 493 | 29.4% |
| 3-Person Household | 208 | 12.4% |
| 4+ Person Household | 206 | 12.3% |
| Total Housing Units | 1,678 | 100.0% |
Occupancy by Ownership by Household Size in Barboursville
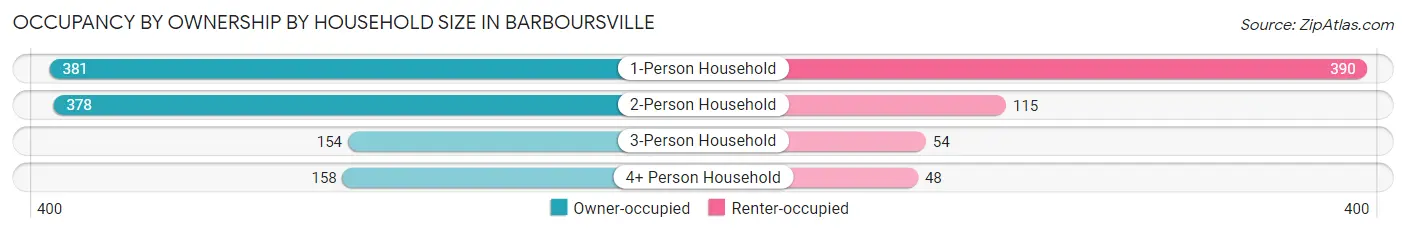
| Household Size | Owner-occupied | Renter-occupied |
| 1-Person Household | 381 (49.4%) | 390 (50.6%) |
| 2-Person Household | 378 (76.7%) | 115 (23.3%) |
| 3-Person Household | 154 (74.0%) | 54 (26.0%) |
| 4+ Person Household | 158 (76.7%) | 48 (23.3%) |
| Total Housing Units | 1,071 (63.8%) | 607 (36.2%) |
Occupancy by Educational Attainment in Barboursville
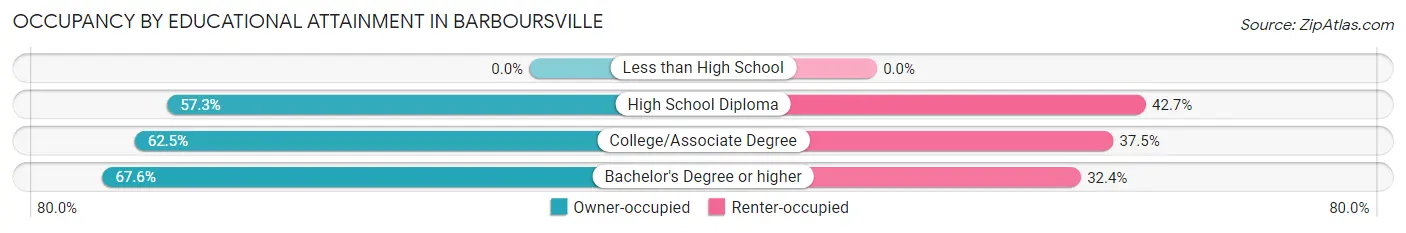
| Household Size | Owner-occupied | Renter-occupied |
| Less than High School | 0 (0.0%) | 0 (0.0%) |
| High School Diploma | 203 (57.3%) | 151 (42.7%) |
| College/Associate Degree | 337 (62.5%) | 202 (37.5%) |
| Bachelor's Degree or higher | 531 (67.6%) | 254 (32.4%) |
Occupancy by Age of Householder in Barboursville
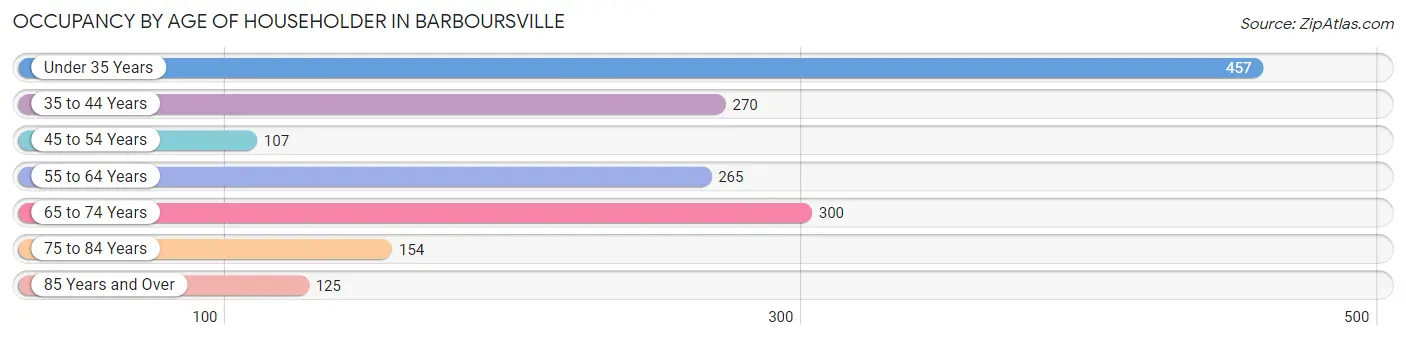
| Age Bracket | # Households | % Households |
| Under 35 Years | 457 | 27.2% |
| 35 to 44 Years | 270 | 16.1% |
| 45 to 54 Years | 107 | 6.4% |
| 55 to 64 Years | 265 | 15.8% |
| 65 to 74 Years | 300 | 17.9% |
| 75 to 84 Years | 154 | 9.2% |
| 85 Years and Over | 125 | 7.4% |
| Total | 1,678 | 100.0% |
Housing Finances in Barboursville
Median Income by Occupancy in Barboursville
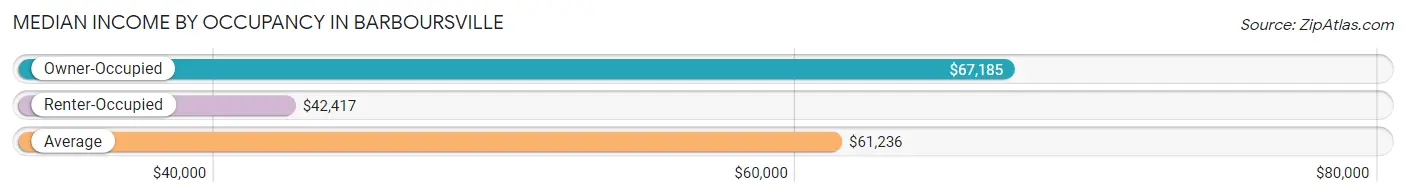
| Occupancy Type | # Households | Median Income |
| Owner-Occupied | 1,071 (63.8%) | $67,185 |
| Renter-Occupied | 607 (36.2%) | $42,417 |
| Average | 1,678 (100.0%) | $61,236 |
Occupancy by Householder Income Bracket in Barboursville
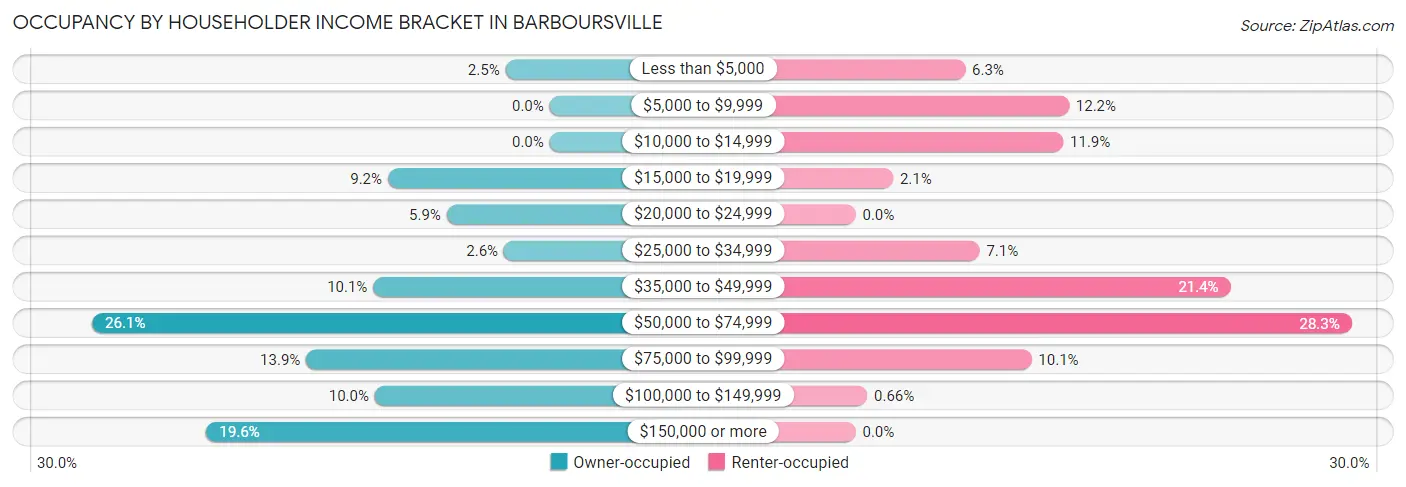
| Income Bracket | Owner-occupied | Renter-occupied |
| Less than $5,000 | 27 (2.5%) | 38 (6.3%) |
| $5,000 to $9,999 | 0 (0.0%) | 74 (12.2%) |
| $10,000 to $14,999 | 0 (0.0%) | 72 (11.9%) |
| $15,000 to $19,999 | 99 (9.2%) | 13 (2.1%) |
| $20,000 to $24,999 | 63 (5.9%) | 0 (0.0%) |
| $25,000 to $34,999 | 28 (2.6%) | 43 (7.1%) |
| $35,000 to $49,999 | 108 (10.1%) | 130 (21.4%) |
| $50,000 to $74,999 | 280 (26.1%) | 172 (28.3%) |
| $75,000 to $99,999 | 149 (13.9%) | 61 (10.1%) |
| $100,000 to $149,999 | 107 (10.0%) | 4 (0.7%) |
| $150,000 or more | 210 (19.6%) | 0 (0.0%) |
| Total | 1,071 (100.0%) | 607 (100.0%) |
Monthly Housing Cost Tiers in Barboursville
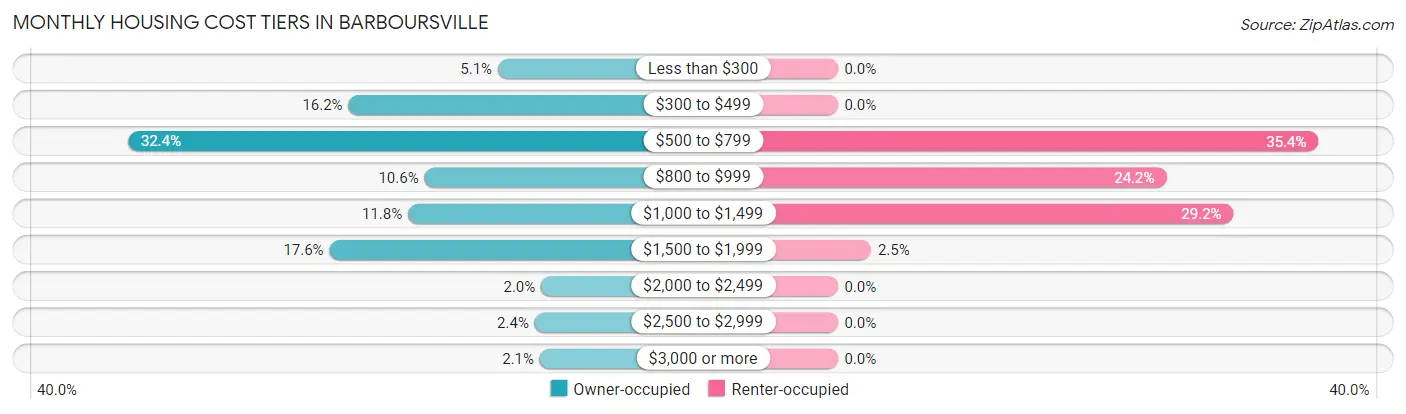
| Monthly Cost | Owner-occupied | Renter-occupied |
| Less than $300 | 55 (5.1%) | 0 (0.0%) |
| $300 to $499 | 173 (16.2%) | 0 (0.0%) |
| $500 to $799 | 347 (32.4%) | 215 (35.4%) |
| $800 to $999 | 113 (10.5%) | 147 (24.2%) |
| $1,000 to $1,499 | 126 (11.8%) | 177 (29.2%) |
| $1,500 to $1,999 | 188 (17.5%) | 15 (2.5%) |
| $2,000 to $2,499 | 21 (2.0%) | 0 (0.0%) |
| $2,500 to $2,999 | 26 (2.4%) | 0 (0.0%) |
| $3,000 or more | 22 (2.1%) | 0 (0.0%) |
| Total | 1,071 (100.0%) | 607 (100.0%) |
Physical Housing Characteristics in Barboursville
Housing Structures in Barboursville
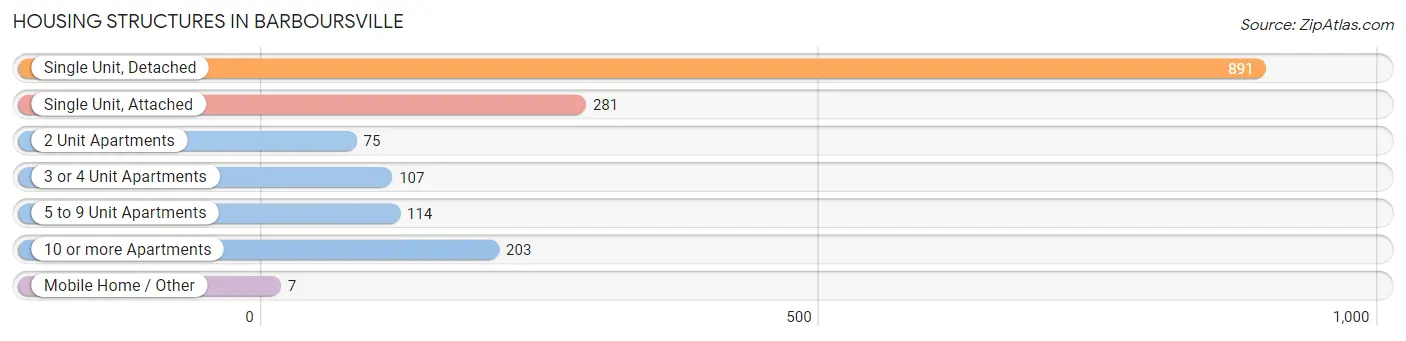
| Structure Type | # Housing Units | % Housing Units |
| Single Unit, Detached | 891 | 53.1% |
| Single Unit, Attached | 281 | 16.8% |
| 2 Unit Apartments | 75 | 4.5% |
| 3 or 4 Unit Apartments | 107 | 6.4% |
| 5 to 9 Unit Apartments | 114 | 6.8% |
| 10 or more Apartments | 203 | 12.1% |
| Mobile Home / Other | 7 | 0.4% |
| Total | 1,678 | 100.0% |
Housing Structures by Occupancy in Barboursville
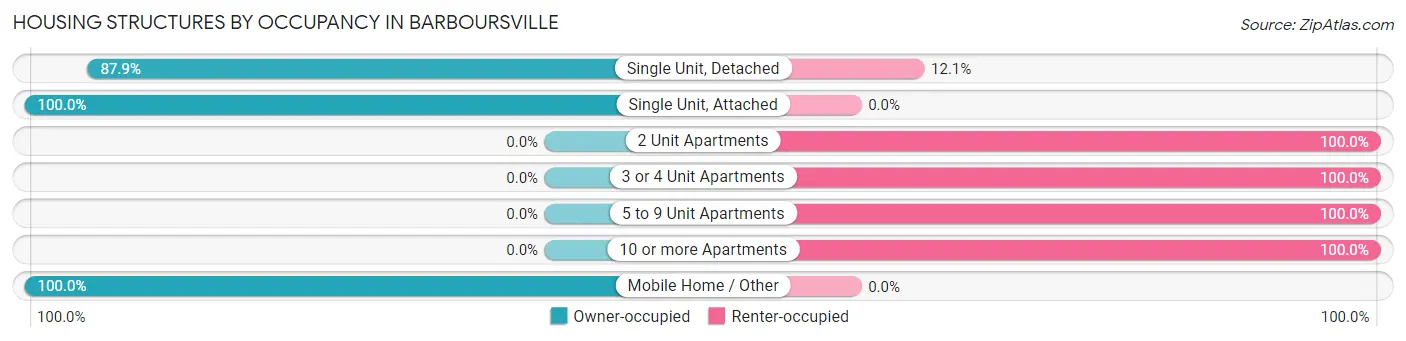
| Structure Type | Owner-occupied | Renter-occupied |
| Single Unit, Detached | 783 (87.9%) | 108 (12.1%) |
| Single Unit, Attached | 281 (100.0%) | 0 (0.0%) |
| 2 Unit Apartments | 0 (0.0%) | 75 (100.0%) |
| 3 or 4 Unit Apartments | 0 (0.0%) | 107 (100.0%) |
| 5 to 9 Unit Apartments | 0 (0.0%) | 114 (100.0%) |
| 10 or more Apartments | 0 (0.0%) | 203 (100.0%) |
| Mobile Home / Other | 7 (100.0%) | 0 (0.0%) |
| Total | 1,071 (63.8%) | 607 (36.2%) |
Housing Structures by Number of Rooms in Barboursville
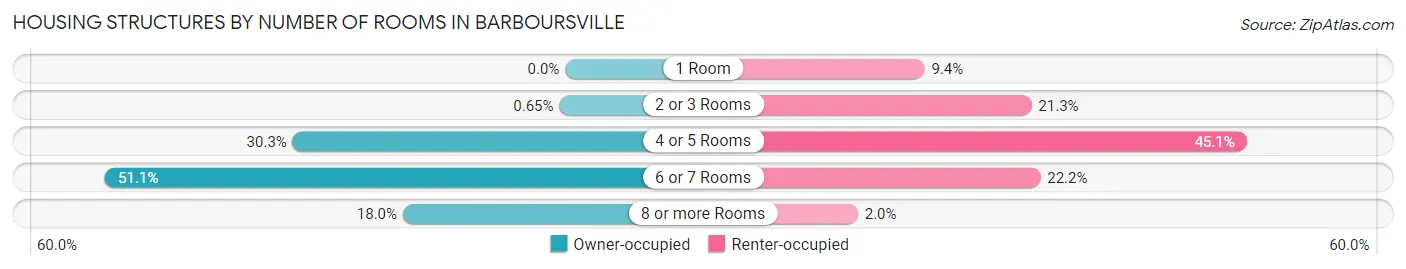
| Number of Rooms | Owner-occupied | Renter-occupied |
| 1 Room | 0 (0.0%) | 57 (9.4%) |
| 2 or 3 Rooms | 7 (0.6%) | 129 (21.2%) |
| 4 or 5 Rooms | 324 (30.2%) | 274 (45.1%) |
| 6 or 7 Rooms | 547 (51.1%) | 135 (22.2%) |
| 8 or more Rooms | 193 (18.0%) | 12 (2.0%) |
| Total | 1,071 (100.0%) | 607 (100.0%) |
Housing Structure by Heating Type in Barboursville
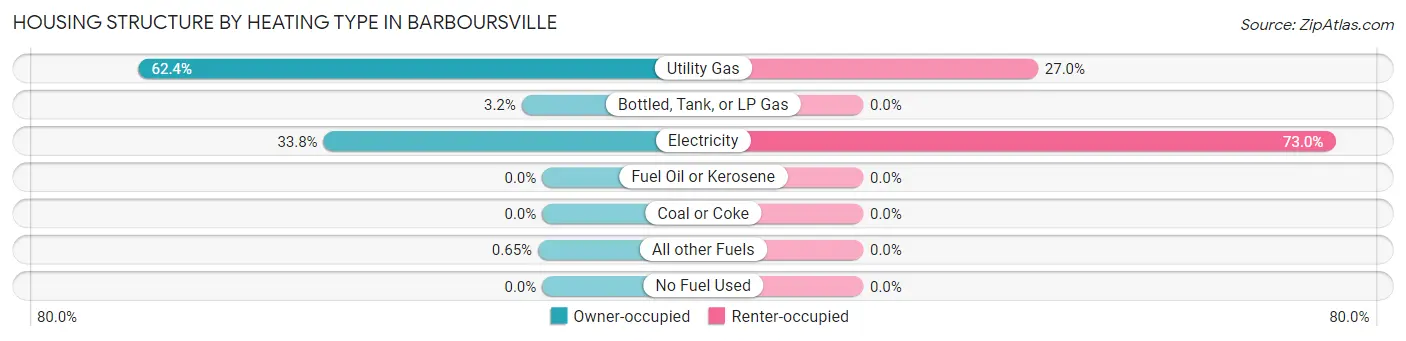
| Heating Type | Owner-occupied | Renter-occupied |
| Utility Gas | 668 (62.4%) | 164 (27.0%) |
| Bottled, Tank, or LP Gas | 34 (3.2%) | 0 (0.0%) |
| Electricity | 362 (33.8%) | 443 (73.0%) |
| Fuel Oil or Kerosene | 0 (0.0%) | 0 (0.0%) |
| Coal or Coke | 0 (0.0%) | 0 (0.0%) |
| All other Fuels | 7 (0.6%) | 0 (0.0%) |
| No Fuel Used | 0 (0.0%) | 0 (0.0%) |
| Total | 1,071 (100.0%) | 607 (100.0%) |
Household Vehicle Usage in Barboursville
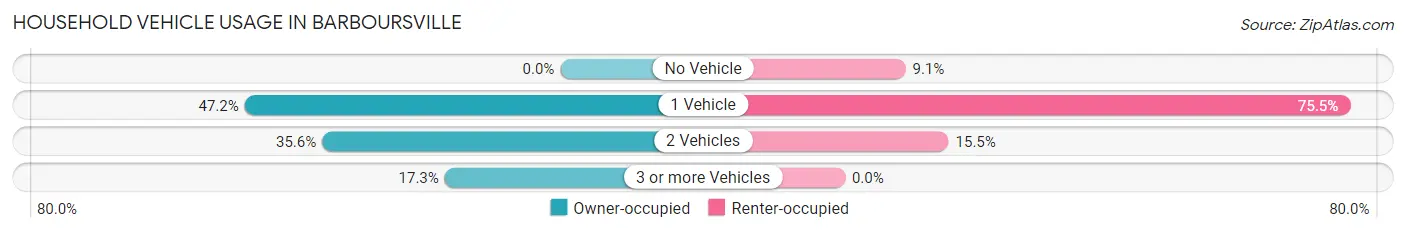
| Vehicles per Household | Owner-occupied | Renter-occupied |
| No Vehicle | 0 (0.0%) | 55 (9.1%) |
| 1 Vehicle | 505 (47.1%) | 458 (75.4%) |
| 2 Vehicles | 381 (35.6%) | 94 (15.5%) |
| 3 or more Vehicles | 185 (17.3%) | 0 (0.0%) |
| Total | 1,071 (100.0%) | 607 (100.0%) |
Real Estate & Mortgages in Barboursville
Real Estate and Mortgage Overview in Barboursville
| Characteristic | Without Mortgage | With Mortgage |
| Housing Units | 493 | 578 |
| Median Property Value | $221,100 | $175,900 |
| Median Household Income | $65,540 | $96 |
| Monthly Housing Costs | $530 | $22 |
| Real Estate Taxes | $1,154 | $0 |
Property Value by Mortgage Status in Barboursville
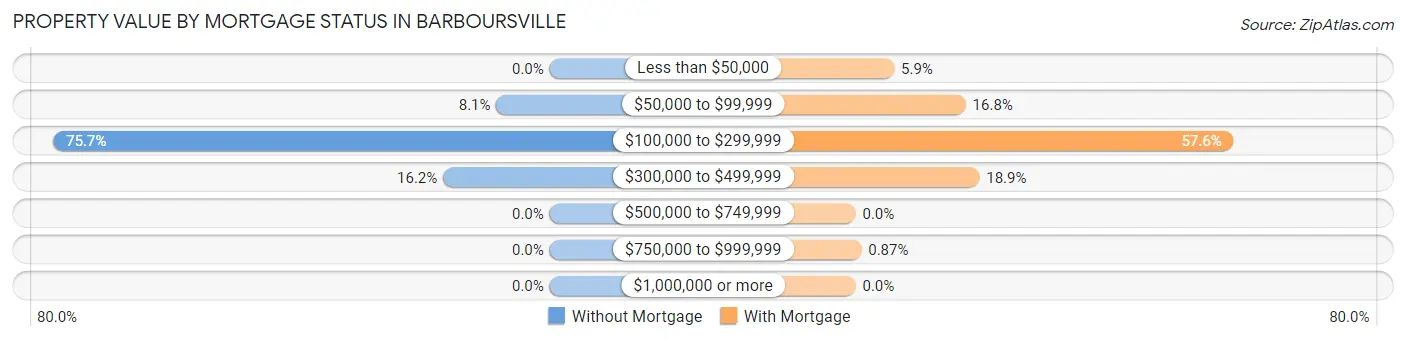
| Property Value | Without Mortgage | With Mortgage |
| Less than $50,000 | 0 (0.0%) | 34 (5.9%) |
| $50,000 to $99,999 | 40 (8.1%) | 97 (16.8%) |
| $100,000 to $299,999 | 373 (75.7%) | 333 (57.6%) |
| $300,000 to $499,999 | 80 (16.2%) | 109 (18.9%) |
| $500,000 to $749,999 | 0 (0.0%) | 0 (0.0%) |
| $750,000 to $999,999 | 0 (0.0%) | 5 (0.9%) |
| $1,000,000 or more | 0 (0.0%) | 0 (0.0%) |
| Total | 493 (100.0%) | 578 (100.0%) |
Household Income by Mortgage Status in Barboursville
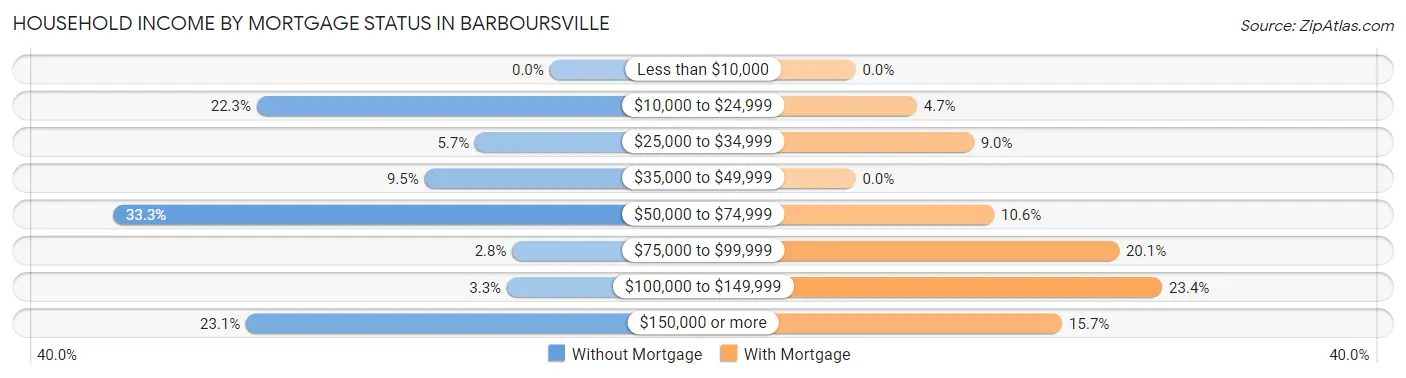
| Household Income | Without Mortgage | With Mortgage |
| Less than $10,000 | 0 (0.0%) | 0 (0.0%) |
| $10,000 to $24,999 | 110 (22.3%) | 27 (4.7%) |
| $25,000 to $34,999 | 28 (5.7%) | 52 (9.0%) |
| $35,000 to $49,999 | 47 (9.5%) | 0 (0.0%) |
| $50,000 to $74,999 | 164 (33.3%) | 61 (10.5%) |
| $75,000 to $99,999 | 14 (2.8%) | 116 (20.1%) |
| $100,000 to $149,999 | 16 (3.3%) | 135 (23.4%) |
| $150,000 or more | 114 (23.1%) | 91 (15.7%) |
| Total | 493 (100.0%) | 578 (100.0%) |
Property Value to Household Income Ratio in Barboursville
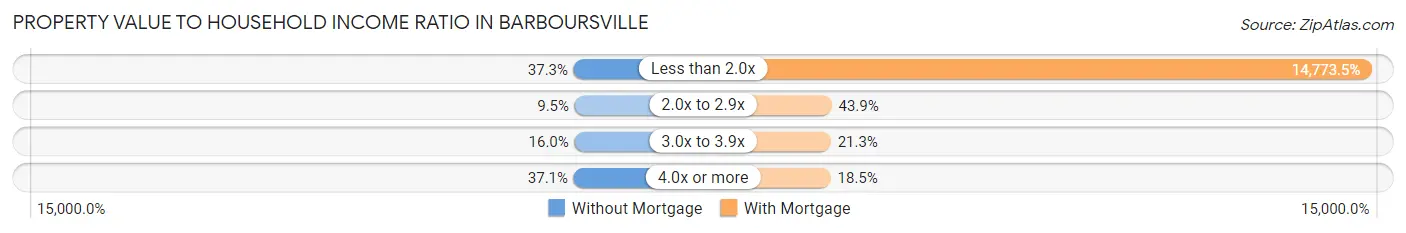
| Value-to-Income Ratio | Without Mortgage | With Mortgage |
| Less than 2.0x | 184 (37.3%) | 85,391 (14,773.5%) |
| 2.0x to 2.9x | 47 (9.5%) | 254 (43.9%) |
| 3.0x to 3.9x | 79 (16.0%) | 123 (21.3%) |
| 4.0x or more | 183 (37.1%) | 107 (18.5%) |
| Total | 493 (100.0%) | 578 (100.0%) |
Real Estate Taxes by Mortgage Status in Barboursville
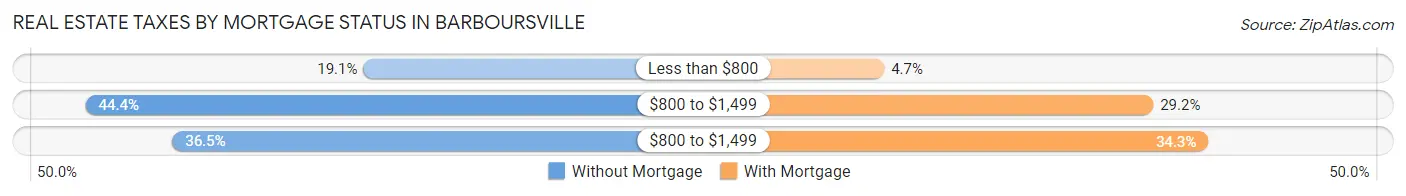
| Property Taxes | Without Mortgage | With Mortgage |
| Less than $800 | 94 (19.1%) | 27 (4.7%) |
| $800 to $1,499 | 219 (44.4%) | 169 (29.2%) |
| $800 to $1,499 | 180 (36.5%) | 198 (34.3%) |
| Total | 493 (100.0%) | 578 (100.0%) |
Health & Disability in Barboursville
Health Insurance Coverage by Age in Barboursville
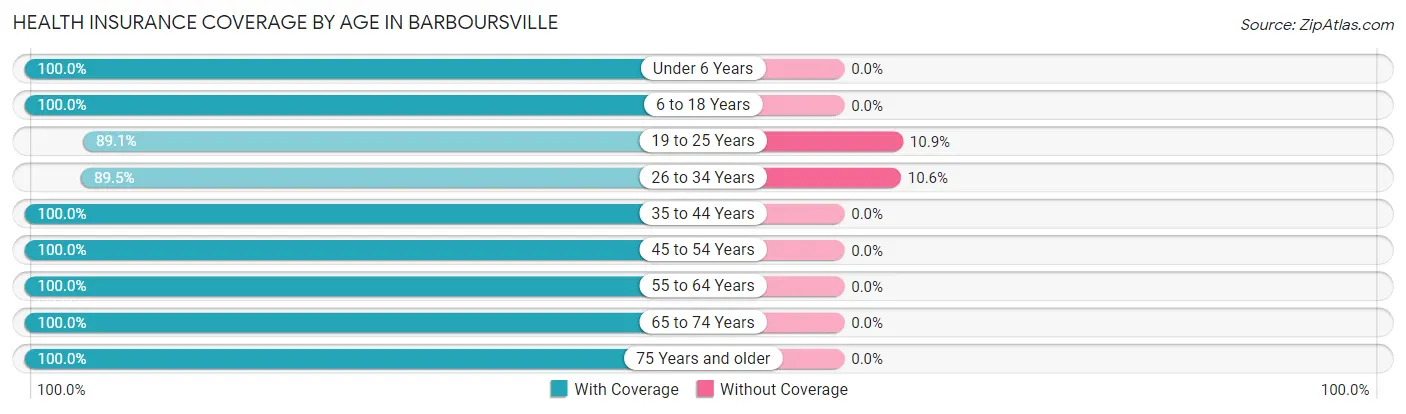
| Age Bracket | With Coverage | Without Coverage |
| Under 6 Years | 349 (100.0%) | 0 (0.0%) |
| 6 to 18 Years | 459 (100.0%) | 0 (0.0%) |
| 19 to 25 Years | 277 (89.1%) | 34 (10.9%) |
| 26 to 34 Years | 500 (89.4%) | 59 (10.5%) |
| 35 to 44 Years | 367 (100.0%) | 0 (0.0%) |
| 45 to 54 Years | 329 (100.0%) | 0 (0.0%) |
| 55 to 64 Years | 422 (100.0%) | 0 (0.0%) |
| 65 to 74 Years | 352 (100.0%) | 0 (0.0%) |
| 75 Years and older | 425 (100.0%) | 0 (0.0%) |
| Total | 3,480 (97.4%) | 93 (2.6%) |
Health Insurance Coverage by Citizenship Status in Barboursville
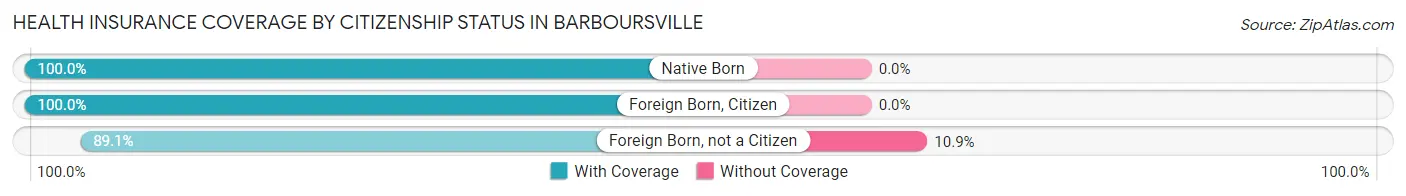
| Citizenship Status | With Coverage | Without Coverage |
| Native Born | 349 (100.0%) | 0 (0.0%) |
| Foreign Born, Citizen | 459 (100.0%) | 0 (0.0%) |
| Foreign Born, not a Citizen | 277 (89.1%) | 34 (10.9%) |
Health Insurance Coverage by Household Income in Barboursville
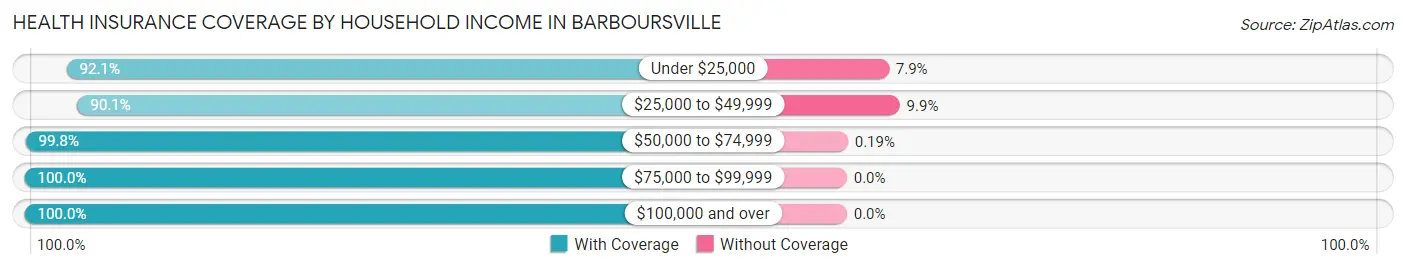
| Household Income | With Coverage | Without Coverage |
| Under $25,000 | 503 (92.1%) | 43 (7.9%) |
| $25,000 to $49,999 | 437 (90.1%) | 48 (9.9%) |
| $50,000 to $74,999 | 1,048 (99.8%) | 2 (0.2%) |
| $75,000 to $99,999 | 460 (100.0%) | 0 (0.0%) |
| $100,000 and over | 934 (100.0%) | 0 (0.0%) |
Public vs Private Health Insurance Coverage by Age in Barboursville
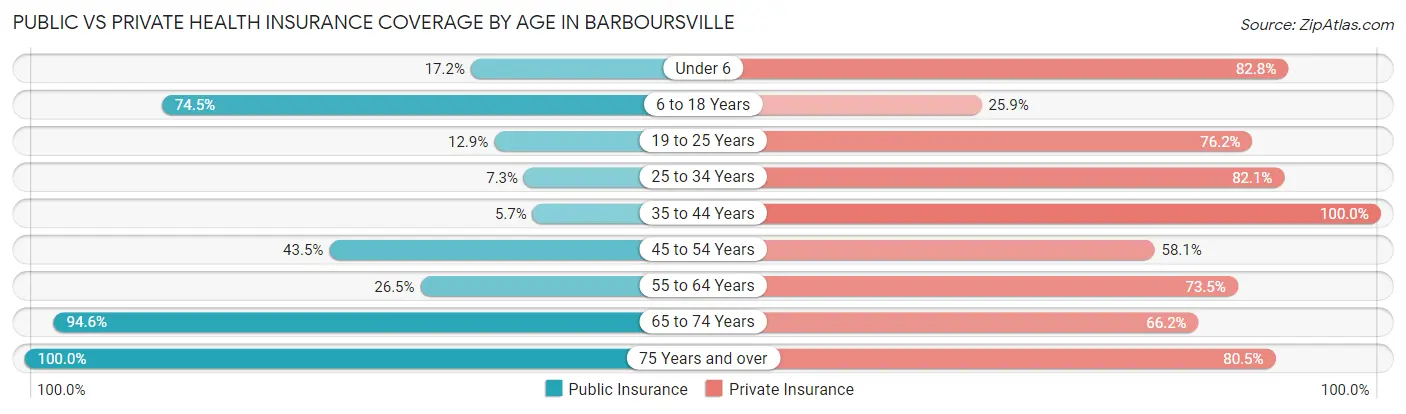
| Age Bracket | Public Insurance | Private Insurance |
| Under 6 | 60 (17.2%) | 289 (82.8%) |
| 6 to 18 Years | 342 (74.5%) | 119 (25.9%) |
| 19 to 25 Years | 40 (12.9%) | 237 (76.2%) |
| 25 to 34 Years | 41 (7.3%) | 459 (82.1%) |
| 35 to 44 Years | 21 (5.7%) | 367 (100.0%) |
| 45 to 54 Years | 143 (43.5%) | 191 (58.1%) |
| 55 to 64 Years | 112 (26.5%) | 310 (73.5%) |
| 65 to 74 Years | 333 (94.6%) | 233 (66.2%) |
| 75 Years and over | 425 (100.0%) | 342 (80.5%) |
| Total | 1,517 (42.5%) | 2,547 (71.3%) |
Disability Status by Sex by Age in Barboursville
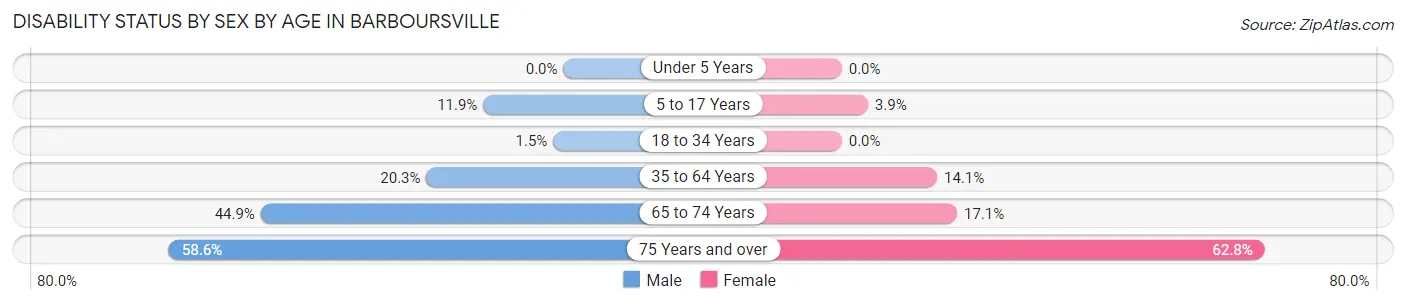
| Age Bracket | Male | Female |
| Under 5 Years | 0 (0.0%) | 0 (0.0%) |
| 5 to 17 Years | 40 (11.9%) | 5 (3.9%) |
| 18 to 34 Years | 6 (1.5%) | 0 (0.0%) |
| 35 to 64 Years | 131 (20.3%) | 67 (14.1%) |
| 65 to 74 Years | 40 (44.9%) | 45 (17.1%) |
| 75 Years and over | 123 (58.6%) | 135 (62.8%) |
Disability Class by Sex by Age in Barboursville
Disability Class: Hearing Difficulty
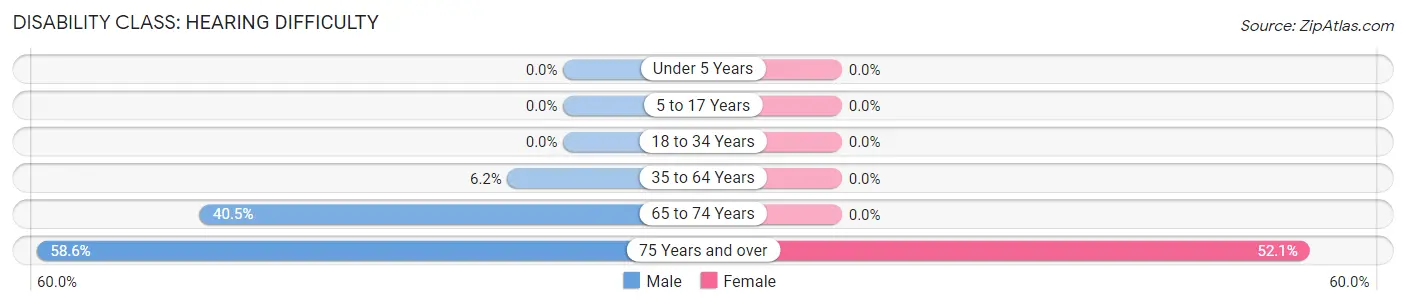
| Age Bracket | Male | Female |
| Under 5 Years | 0 (0.0%) | 0 (0.0%) |
| 5 to 17 Years | 0 (0.0%) | 0 (0.0%) |
| 18 to 34 Years | 0 (0.0%) | 0 (0.0%) |
| 35 to 64 Years | 40 (6.2%) | 0 (0.0%) |
| 65 to 74 Years | 36 (40.5%) | 0 (0.0%) |
| 75 Years and over | 123 (58.6%) | 112 (52.1%) |
Disability Class: Vision Difficulty
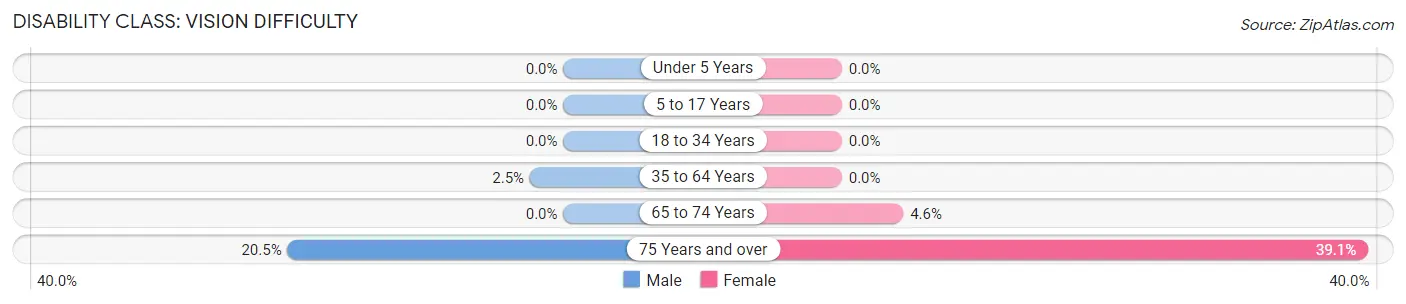
| Age Bracket | Male | Female |
| Under 5 Years | 0 (0.0%) | 0 (0.0%) |
| 5 to 17 Years | 0 (0.0%) | 0 (0.0%) |
| 18 to 34 Years | 0 (0.0%) | 0 (0.0%) |
| 35 to 64 Years | 16 (2.5%) | 0 (0.0%) |
| 65 to 74 Years | 0 (0.0%) | 12 (4.6%) |
| 75 Years and over | 43 (20.5%) | 84 (39.1%) |
Disability Class: Cognitive Difficulty
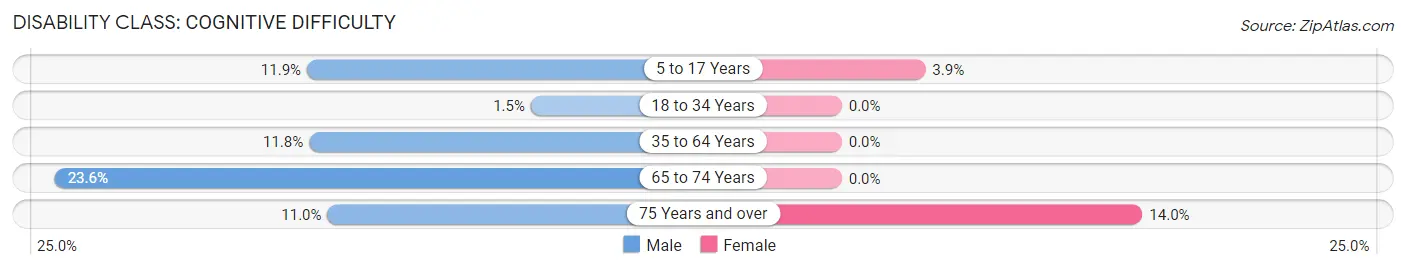
| Age Bracket | Male | Female |
| 5 to 17 Years | 40 (11.9%) | 5 (3.9%) |
| 18 to 34 Years | 6 (1.5%) | 0 (0.0%) |
| 35 to 64 Years | 76 (11.8%) | 0 (0.0%) |
| 65 to 74 Years | 21 (23.6%) | 0 (0.0%) |
| 75 Years and over | 23 (11.0%) | 30 (14.0%) |
Disability Class: Ambulatory Difficulty
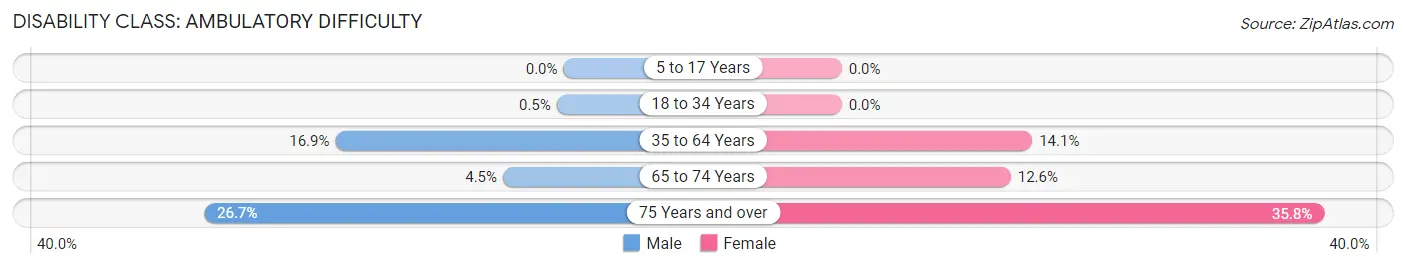
| Age Bracket | Male | Female |
| 5 to 17 Years | 0 (0.0%) | 0 (0.0%) |
| 18 to 34 Years | 2 (0.5%) | 0 (0.0%) |
| 35 to 64 Years | 109 (16.9%) | 67 (14.1%) |
| 65 to 74 Years | 4 (4.5%) | 33 (12.6%) |
| 75 Years and over | 56 (26.7%) | 77 (35.8%) |
Disability Class: Self-Care Difficulty
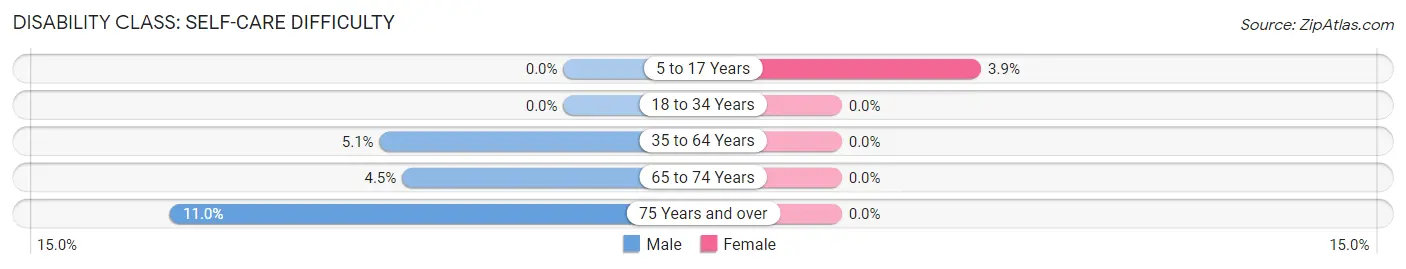
| Age Bracket | Male | Female |
| 5 to 17 Years | 0 (0.0%) | 5 (3.9%) |
| 18 to 34 Years | 0 (0.0%) | 0 (0.0%) |
| 35 to 64 Years | 33 (5.1%) | 0 (0.0%) |
| 65 to 74 Years | 4 (4.5%) | 0 (0.0%) |
| 75 Years and over | 23 (11.0%) | 0 (0.0%) |
Technology Access in Barboursville
Computing Device Access in Barboursville
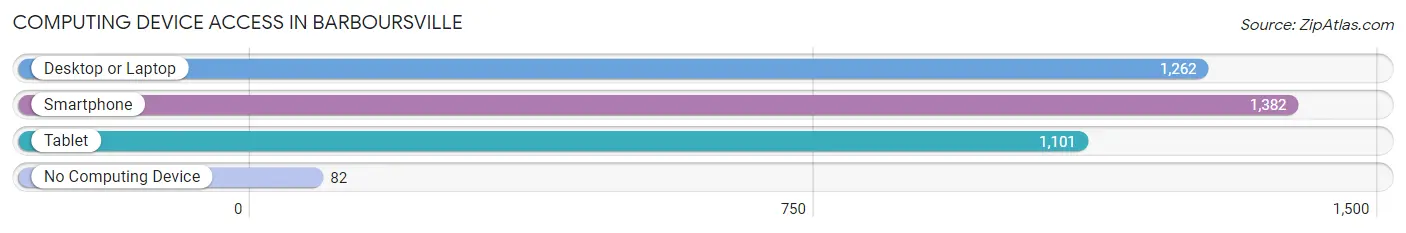
| Device Type | # Households | % Households |
| Desktop or Laptop | 1,262 | 75.2% |
| Smartphone | 1,382 | 82.4% |
| Tablet | 1,101 | 65.6% |
| No Computing Device | 82 | 4.9% |
| Total | 1,678 | 100.0% |
Internet Access in Barboursville
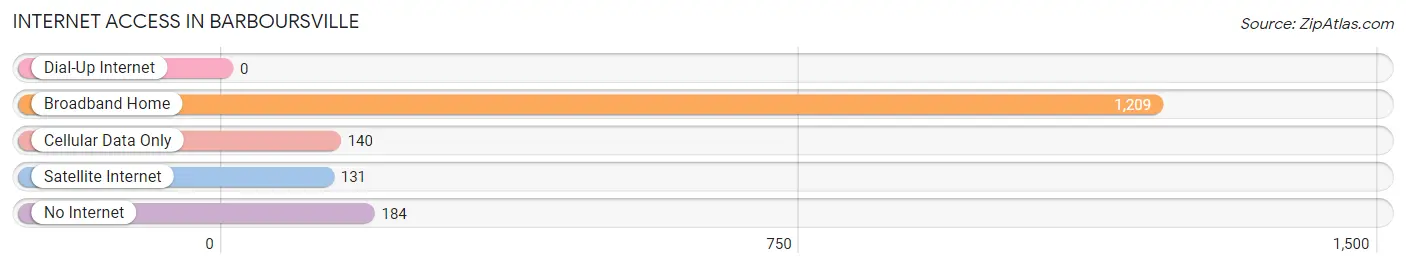
| Internet Type | # Households | % Households |
| Dial-Up Internet | 0 | 0.0% |
| Broadband Home | 1,209 | 72.1% |
| Cellular Data Only | 140 | 8.3% |
| Satellite Internet | 131 | 7.8% |
| No Internet | 184 | 11.0% |
| Total | 1,678 | 100.0% |
Barboursville Summary
Barboursville is a small town located in Cabell County, West Virginia, United States. It is situated along the banks of the Guyandotte River, approximately 10 miles east of Huntington. The town was founded in 1813 and named after James Barbour, the Governor of Virginia at the time. As of the 2010 census, the population of Barboursville was 3,964.
History
Barboursville was founded in 1813 by James Barbour, the Governor of Virginia at the time. The town was originally known as Barboursville, but was later changed to Barboursville in 1891. The town was incorporated in 1891 and has remained a small, rural community ever since.
The town was originally a farming community, but in the late 19th century, the railroad came to Barboursville, bringing with it new industry and economic growth. The railroad allowed for the transportation of goods and people, and the town began to grow.
In the early 20th century, Barboursville experienced a period of growth and prosperity. The town was home to several businesses, including a flour mill, a sawmill, a brickyard, and a furniture factory. The town also had a hotel, a bank, and several churches.
In the late 20th century, Barboursville experienced a period of decline. The railroad was abandoned, and many of the businesses closed. The town's population decreased, and the economy suffered.
Geography
Barboursville is located in Cabell County, West Virginia, approximately 10 miles east of Huntington. The town is situated along the banks of the Guyandotte River. The town has a total area of 1.7 square miles, all of which is land.
The town is located in the Appalachian Mountains, and the terrain is mostly hilly. The climate is humid subtropical, with hot, humid summers and cold, wet winters.
Economy
Barboursville's economy is largely based on agriculture and tourism. The town is home to several farms, and the surrounding area is known for its apple orchards. The town is also home to several tourist attractions, including the Barboursville Vineyards, the Barboursville Historic District, and the Barboursville Park.
The town is also home to several small businesses, including restaurants, retail stores, and service providers. The town is also home to several manufacturing companies, including a furniture factory and a brickyard.
Demographics
As of the 2010 census, the population of Barboursville was 3,964. The racial makeup of the town was 95.3% White, 1.7% African American, 0.3% Native American, 0.7% Asian, 0.1% Pacific Islander, 0.7% from other races, and 1.2% from two or more races. Hispanic or Latino of any race were 1.7% of the population.
The median household income in Barboursville was $37,917, and the median family income was $45,938. The per capita income was $19,945. About 11.2% of families and 14.2% of the population were below the poverty line, including 19.2% of those under age 18 and 8.2% of those age 65 or over.
Common Questions
What is Per Capita Income in Barboursville?
Per Capita income in Barboursville is $28,248.
What is the Median Family Income in Barboursville?
Median Family Income in Barboursville is $70,547.
What is the Median Household income in Barboursville?
Median Household Income in Barboursville is $61,236.
What is Income or Wage Gap in Barboursville?
Income or Wage Gap in Barboursville is 33.0%.
Women in Barboursville earn 67.0 cents for every dollar earned by a man.
What is Inequality or Gini Index in Barboursville?
Inequality or Gini Index in Barboursville is 0.43.
What is the Total Population of Barboursville?
Total Population of Barboursville is 4,394.
What is the Total Male Population of Barboursville?
Total Male Population of Barboursville is 2,513.
What is the Total Female Population of Barboursville?
Total Female Population of Barboursville is 1,881.
What is the Ratio of Males per 100 Females in Barboursville?
There are 133.60 Males per 100 Females in Barboursville.
What is the Ratio of Females per 100 Males in Barboursville?
There are 74.85 Females per 100 Males in Barboursville.
What is the Median Population Age in Barboursville?
Median Population Age in Barboursville is 36.8 Years.
What is the Average Family Size in Barboursville
Average Family Size in Barboursville is 3.1 People.
What is the Average Household Size in Barboursville
Average Household Size in Barboursville is 2.1 People.
How Large is the Labor Force in Barboursville?
There are 1,663 People in the Labor Forcein in Barboursville.
What is the Percentage of People in the Labor Force in Barboursville?
45.7% of People are in the Labor Force in Barboursville.
What is the Unemployment Rate in Barboursville?
Unemployment Rate in Barboursville is 1.2%.