Aurora, WV Map & Demographics
Aurora Map
Aurora Overview
$25,547
PER CAPITA INCOME
$53,603
AVG FAMILY INCOME
$52,978
AVG HOUSEHOLD INCOME
0.43
INEQUALITY / GINI INDEX
250
TOTAL POPULATION
140
MALE POPULATION
110
FEMALE POPULATION
127.27
MALES / 100 FEMALES
78.57
FEMALES / 100 MALES
37.5
MEDIAN AGE
2.6
AVG FAMILY SIZE
2.3
AVG HOUSEHOLD SIZE
93
LABOR FORCE [ PEOPLE ]
49.2%
PERCENT IN LABOR FORCE
Aurora Zip Codes
Aurora Area Codes
Income in Aurora
Income Overview in Aurora
Per Capita Income in Aurora is $25,547, while median incomes of families and households are $53,603 and $52,978 respectively.
| Characteristic | Number | Measure |
| Per Capita Income | 250 | $25,547 |
| Median Family Income | 90 | $53,603 |
| Mean Family Income | 90 | $69,993 |
| Median Household Income | 107 | $52,978 |
| Mean Household Income | 107 | $61,495 |
| Income Deficit | 90 | $0 |
| Wage / Income Gap (%) | 250 | 0.00% |
| Wage / Income Gap ($) | 250 | 100.00¢ per $1 |
| Gini / Inequality Index | 250 | 0.43 |
Earnings by Sex in Aurora
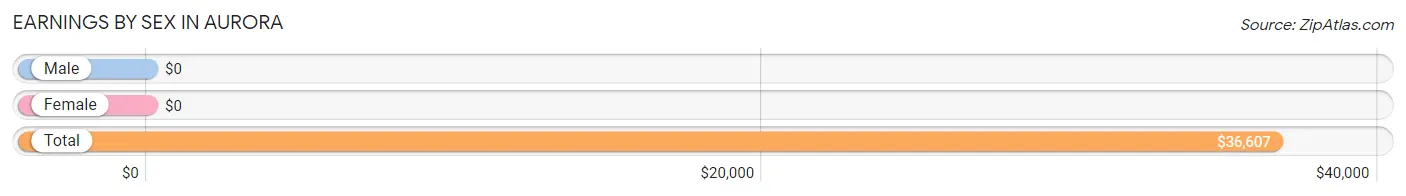
| Sex | Number | Average Earnings |
| Male | 66 (71.0%) | $0 |
| Female | 27 (29.0%) | $0 |
| Total | 93 (100.0%) | $36,607 |
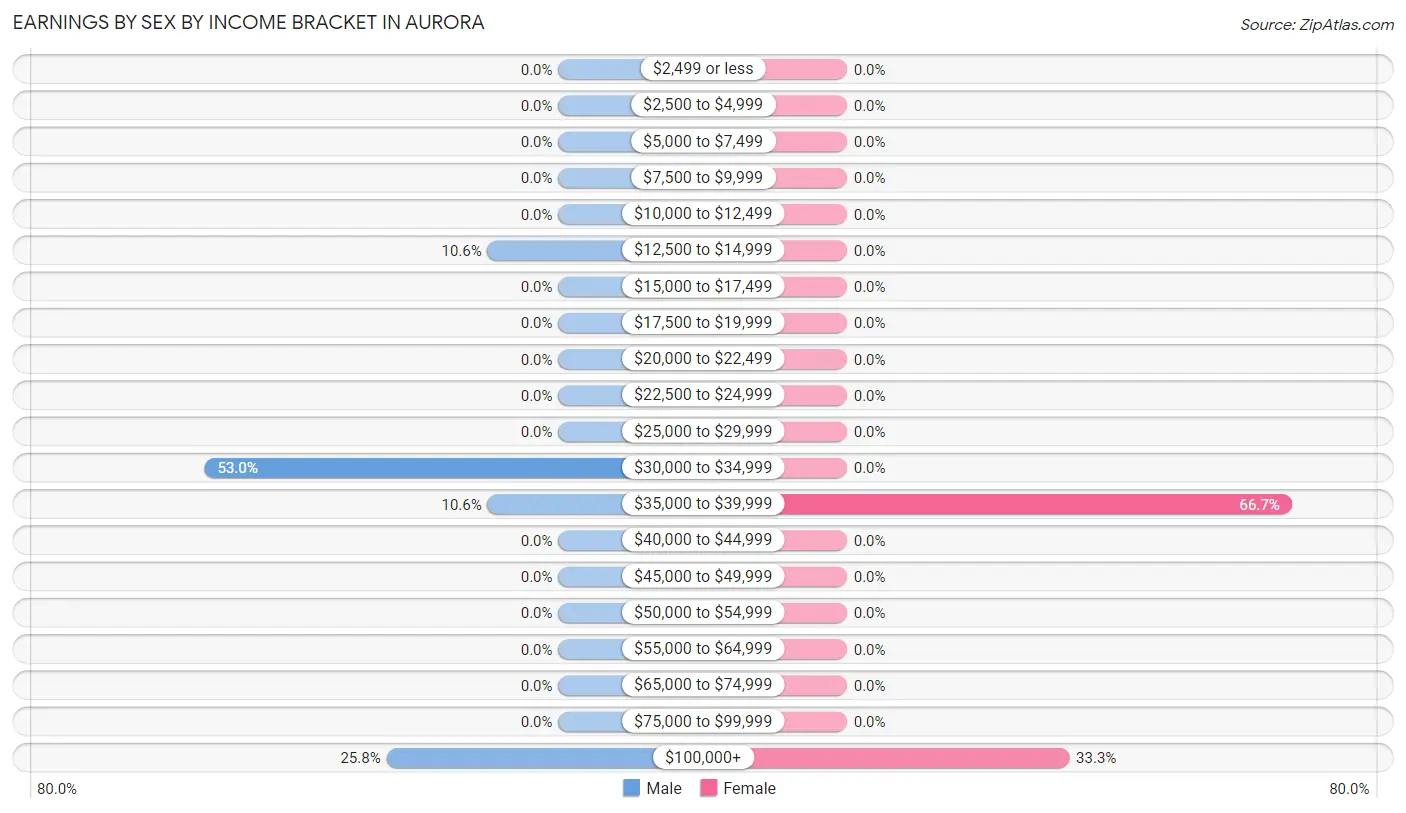
Earnings by Sex by Income Bracket in Aurora
The most common earnings brackets in Aurora are $30,000 to $34,999 for men (35 | 53.0%) and $35,000 to $39,999 for women (18 | 66.7%).
| Income | Male | Female |
| $2,499 or less | 0 (0.0%) | 0 (0.0%) |
| $2,500 to $4,999 | 0 (0.0%) | 0 (0.0%) |
| $5,000 to $7,499 | 0 (0.0%) | 0 (0.0%) |
| $7,500 to $9,999 | 0 (0.0%) | 0 (0.0%) |
| $10,000 to $12,499 | 0 (0.0%) | 0 (0.0%) |
| $12,500 to $14,999 | 7 (10.6%) | 0 (0.0%) |
| $15,000 to $17,499 | 0 (0.0%) | 0 (0.0%) |
| $17,500 to $19,999 | 0 (0.0%) | 0 (0.0%) |
| $20,000 to $22,499 | 0 (0.0%) | 0 (0.0%) |
| $22,500 to $24,999 | 0 (0.0%) | 0 (0.0%) |
| $25,000 to $29,999 | 0 (0.0%) | 0 (0.0%) |
| $30,000 to $34,999 | 35 (53.0%) | 0 (0.0%) |
| $35,000 to $39,999 | 7 (10.6%) | 18 (66.7%) |
| $40,000 to $44,999 | 0 (0.0%) | 0 (0.0%) |
| $45,000 to $49,999 | 0 (0.0%) | 0 (0.0%) |
| $50,000 to $54,999 | 0 (0.0%) | 0 (0.0%) |
| $55,000 to $64,999 | 0 (0.0%) | 0 (0.0%) |
| $65,000 to $74,999 | 0 (0.0%) | 0 (0.0%) |
| $75,000 to $99,999 | 0 (0.0%) | 0 (0.0%) |
| $100,000+ | 17 (25.8%) | 9 (33.3%) |
| Total | 66 (100.0%) | 27 (100.0%) |
Earnings by Sex by Educational Attainment in Aurora
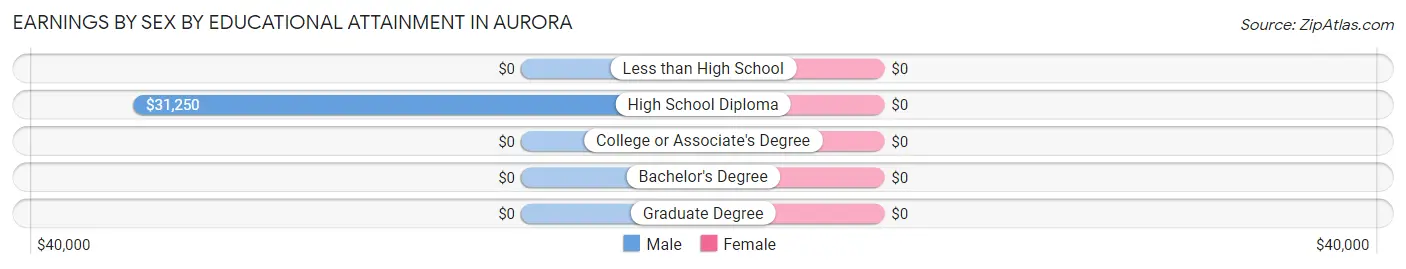
| Educational Attainment | Male Income | Female Income |
| Less than High School | - | - |
| High School Diploma | $31,250 | $0 |
| College or Associate's Degree | - | - |
| Bachelor's Degree | - | - |
| Graduate Degree | - | - |
| Total | - | - |
Family Income in Aurora
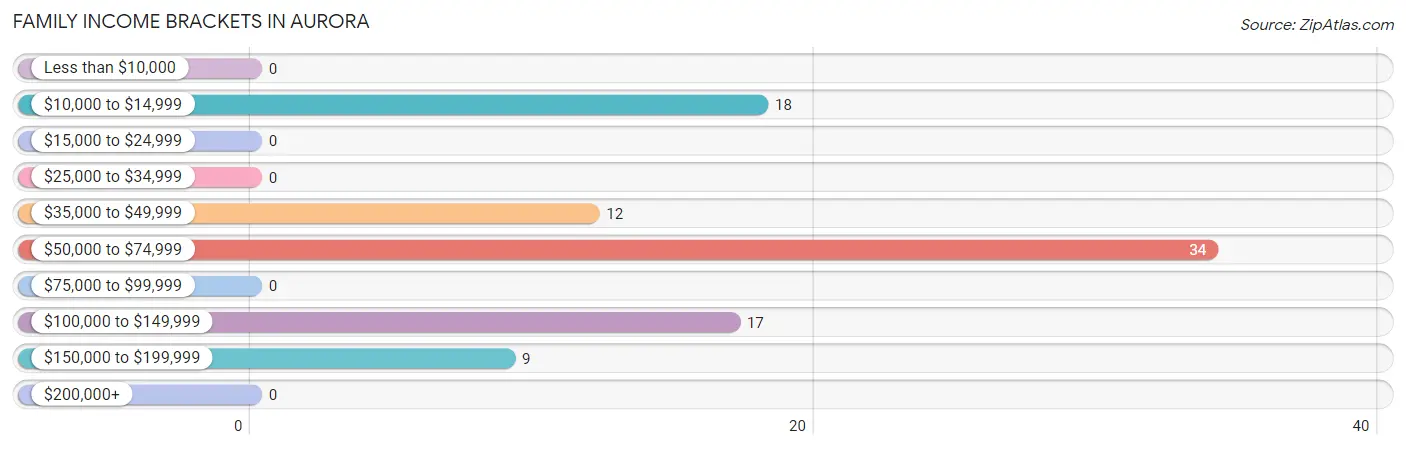
Family Income Brackets in Aurora
According to the Aurora family income data, there are 34 families falling into the $50,000 to $74,999 income range, which is the most common income bracket and makes up 37.8% of all families.
| Income Bracket | # Families | % Families |
| Less than $10,000 | 0 | 0.0% |
| $10,000 to $14,999 | 18 | 20.0% |
| $15,000 to $24,999 | 0 | 0.0% |
| $25,000 to $34,999 | 0 | 0.0% |
| $35,000 to $49,999 | 12 | 13.3% |
| $50,000 to $74,999 | 34 | 37.8% |
| $75,000 to $99,999 | 0 | 0.0% |
| $100,000 to $149,999 | 17 | 18.9% |
| $150,000 to $199,999 | 9 | 10.0% |
| $200,000+ | 0 | 0.0% |
Family Income by Famaliy Size in Aurora
| Income Bracket | # Families | Median Income |
| 2-Person Families | 52 (57.8%) | $0 |
| 3-Person Families | 12 (13.3%) | $0 |
| 4-Person Families | 26 (28.9%) | $0 |
| 5-Person Families | 0 (0.0%) | $0 |
| 6-Person Families | 0 (0.0%) | $0 |
| 7+ Person Families | 0 (0.0%) | $0 |
| Total | 90 (100.0%) | $53,603 |
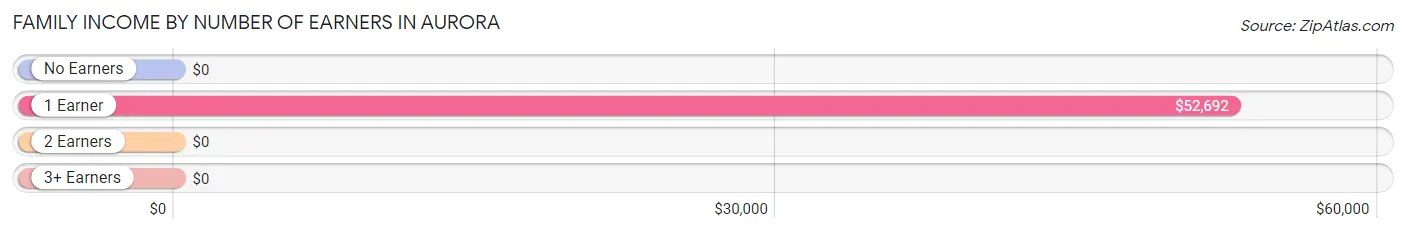
Family Income by Number of Earners in Aurora
| Number of Earners | # Families | Median Income |
| No Earners | 16 (17.8%) | $0 |
| 1 Earner | 48 (53.3%) | $52,692 |
| 2 Earners | 26 (28.9%) | $0 |
| 3+ Earners | 0 (0.0%) | $0 |
| Total | 90 (100.0%) | $53,603 |
Household Income in Aurora
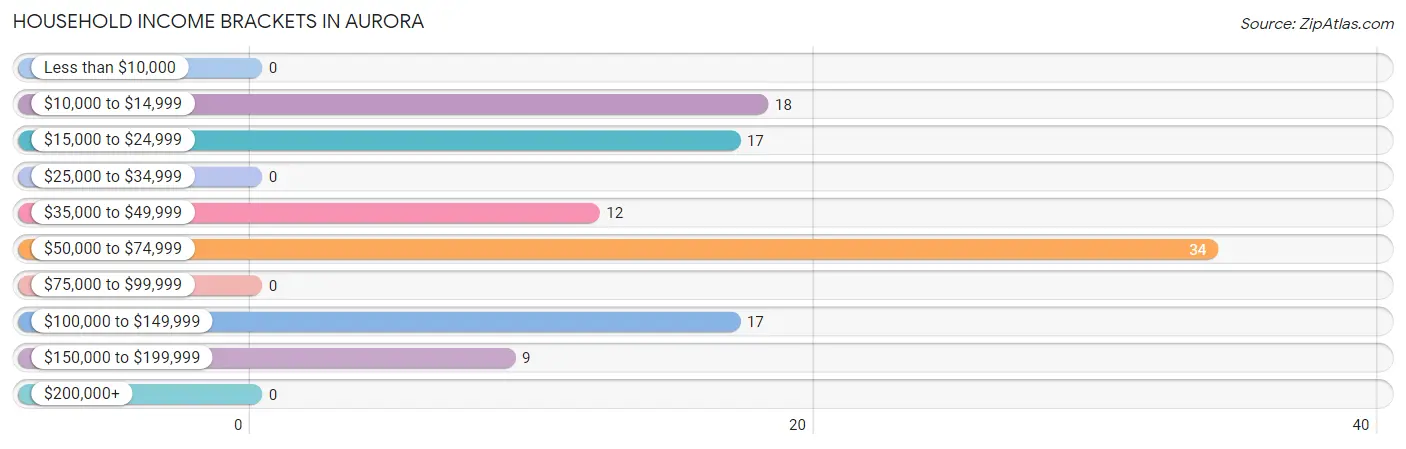
Household Income Brackets in Aurora
With 34 households falling in the category, the $50,000 to $74,999 income range is the most frequent in Aurora, accounting for 31.8% of all households.
| Income Bracket | # Households | % Households |
| Less than $10,000 | 0 | 0.0% |
| $10,000 to $14,999 | 18 | 16.8% |
| $15,000 to $24,999 | 17 | 15.9% |
| $25,000 to $34,999 | 0 | 0.0% |
| $35,000 to $49,999 | 12 | 11.2% |
| $50,000 to $74,999 | 34 | 31.8% |
| $75,000 to $99,999 | 0 | 0.0% |
| $100,000 to $149,999 | 17 | 15.9% |
| $150,000 to $199,999 | 9 | 8.4% |
| $200,000+ | 0 | 0.0% |
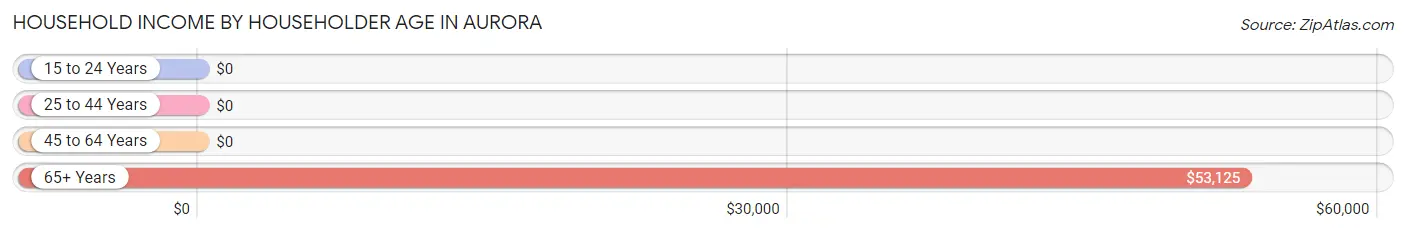
Household Income by Householder Age in Aurora
The median household income in Aurora is $52,978, with the highest median household income of $53,125 found in the 65+ years age bracket for the primary householder. A total of 51 households (47.7%) fall into this category.
| Income Bracket | # Households | Median Income |
| 15 to 24 Years | 0 (0.0%) | $0 |
| 25 to 44 Years | 48 (44.9%) | $0 |
| 45 to 64 Years | 8 (7.5%) | $0 |
| 65+ Years | 51 (47.7%) | $53,125 |
| Total | 107 (100.0%) | $52,978 |
Poverty in Aurora
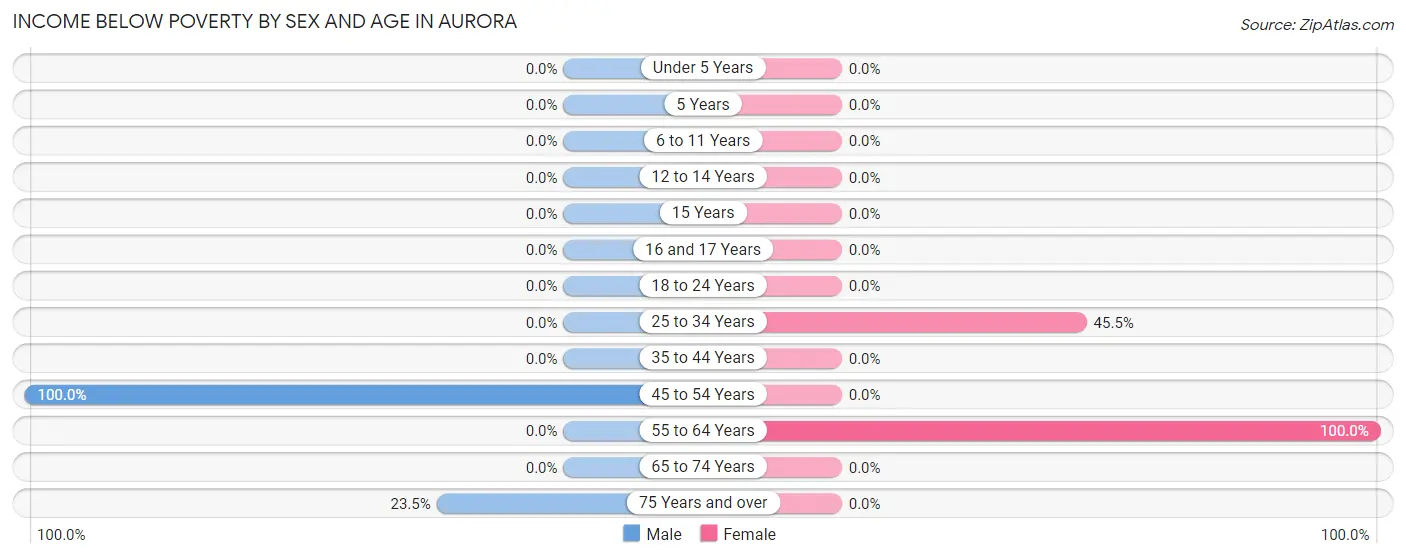
Income Below Poverty by Sex and Age in Aurora
With 10.7% poverty level for males and 16.4% for females among the residents of Aurora, 45 to 54 year old males and 55 to 64 year old females are the most vulnerable to poverty, with 7 males (100.0%) and 8 females (100.0%) in their respective age groups living below the poverty level.
| Age Bracket | Male | Female |
| Under 5 Years | 0 (0.0%) | 0 (0.0%) |
| 5 Years | 0 (0.0%) | 0 (0.0%) |
| 6 to 11 Years | 0 (0.0%) | 0 (0.0%) |
| 12 to 14 Years | 0 (0.0%) | 0 (0.0%) |
| 15 Years | 0 (0.0%) | 0 (0.0%) |
| 16 and 17 Years | 0 (0.0%) | 0 (0.0%) |
| 18 to 24 Years | 0 (0.0%) | 0 (0.0%) |
| 25 to 34 Years | 0 (0.0%) | 10 (45.5%) |
| 35 to 44 Years | 0 (0.0%) | 0 (0.0%) |
| 45 to 54 Years | 7 (100.0%) | 0 (0.0%) |
| 55 to 64 Years | 0 (0.0%) | 8 (100.0%) |
| 65 to 74 Years | 0 (0.0%) | 0 (0.0%) |
| 75 Years and over | 8 (23.5%) | 0 (0.0%) |
| Total | 15 (10.7%) | 18 (16.4%) |
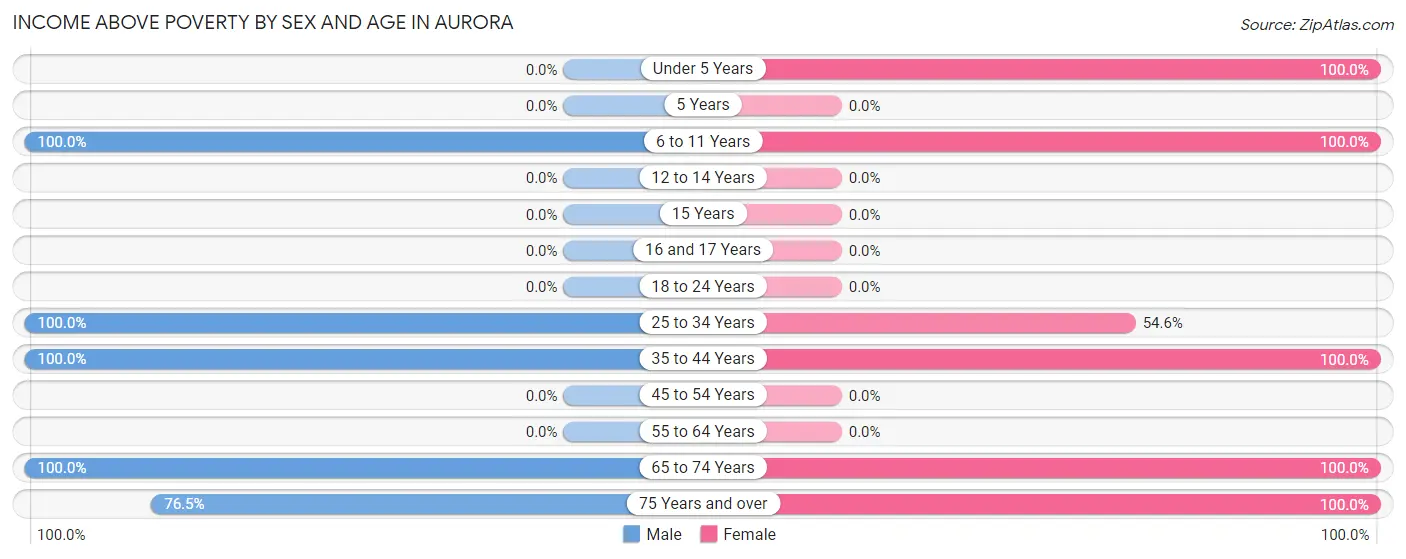
Income Above Poverty by Sex and Age in Aurora
According to the poverty statistics in Aurora, males aged 6 to 11 years and females aged under 5 years are the age groups that are most secure financially, with 100.0% of males and 100.0% of females in these age groups living above the poverty line.
| Age Bracket | Male | Female |
| Under 5 Years | 0 (0.0%) | 21 (100.0%) |
| 5 Years | 0 (0.0%) | 0 (0.0%) |
| 6 to 11 Years | 32 (100.0%) | 8 (100.0%) |
| 12 to 14 Years | 0 (0.0%) | 0 (0.0%) |
| 15 Years | 0 (0.0%) | 0 (0.0%) |
| 16 and 17 Years | 0 (0.0%) | 0 (0.0%) |
| 18 to 24 Years | 0 (0.0%) | 0 (0.0%) |
| 25 to 34 Years | 7 (100.0%) | 12 (54.5%) |
| 35 to 44 Years | 52 (100.0%) | 27 (100.0%) |
| 45 to 54 Years | 0 (0.0%) | 0 (0.0%) |
| 55 to 64 Years | 0 (0.0%) | 0 (0.0%) |
| 65 to 74 Years | 8 (100.0%) | 17 (100.0%) |
| 75 Years and over | 26 (76.5%) | 7 (100.0%) |
| Total | 125 (89.3%) | 92 (83.6%) |
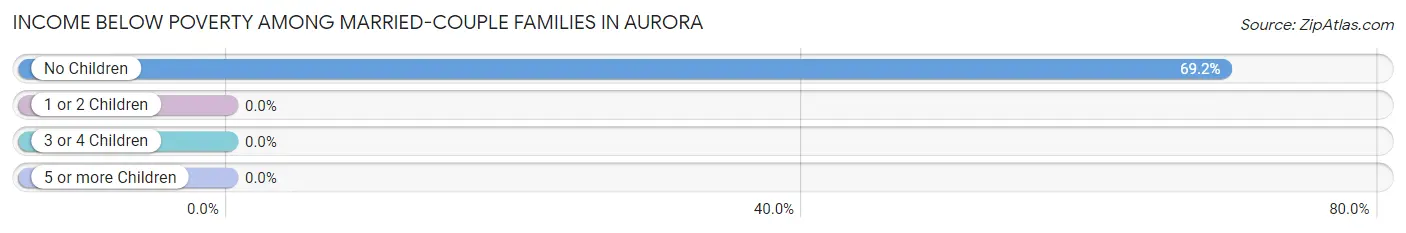
Income Below Poverty Among Married-Couple Families in Aurora
The poverty statistics for married-couple families in Aurora show that 28.1% or 18 of the total 64 families live below the poverty line. Families with no children have the highest poverty rate of 69.2%, comprising of 18 families. On the other hand, families with 1 or 2 children have the lowest poverty rate of 0.0%, which includes 0 families.
| Children | Above Poverty | Below Poverty |
| No Children | 8 (30.8%) | 18 (69.2%) |
| 1 or 2 Children | 38 (100.0%) | 0 (0.0%) |
| 3 or 4 Children | 0 (0.0%) | 0 (0.0%) |
| 5 or more Children | 0 (0.0%) | 0 (0.0%) |
| Total | 46 (71.9%) | 18 (28.1%) |
Income Below Poverty Among Single-Parent Households in Aurora
| Children | Single Father | Single Mother |
| No Children | 0 (0.0%) | 0 (0.0%) |
| 1 or 2 Children | 0 (0.0%) | 0 (0.0%) |
| 3 or 4 Children | 0 (0.0%) | 0 (0.0%) |
| 5 or more Children | 0 (0.0%) | 0 (0.0%) |
| Total | 0 (0.0%) | 0 (0.0%) |
Income Below Poverty Among Married-Couple vs Single-Parent Households in Aurora
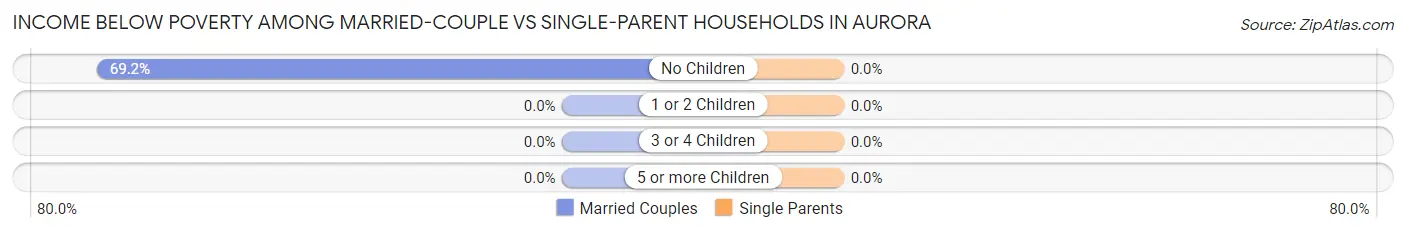
| Children | Married-Couple Families | Single-Parent Households |
| No Children | 18 (69.2%) | 0 (0.0%) |
| 1 or 2 Children | 0 (0.0%) | 0 (0.0%) |
| 3 or 4 Children | 0 (0.0%) | 0 (0.0%) |
| 5 or more Children | 0 (0.0%) | 0 (0.0%) |
| Total | 18 (28.1%) | 0 (0.0%) |
Race in Aurora
The most populous races in Aurora are , and White / Caucasian (250 | 100.0%).
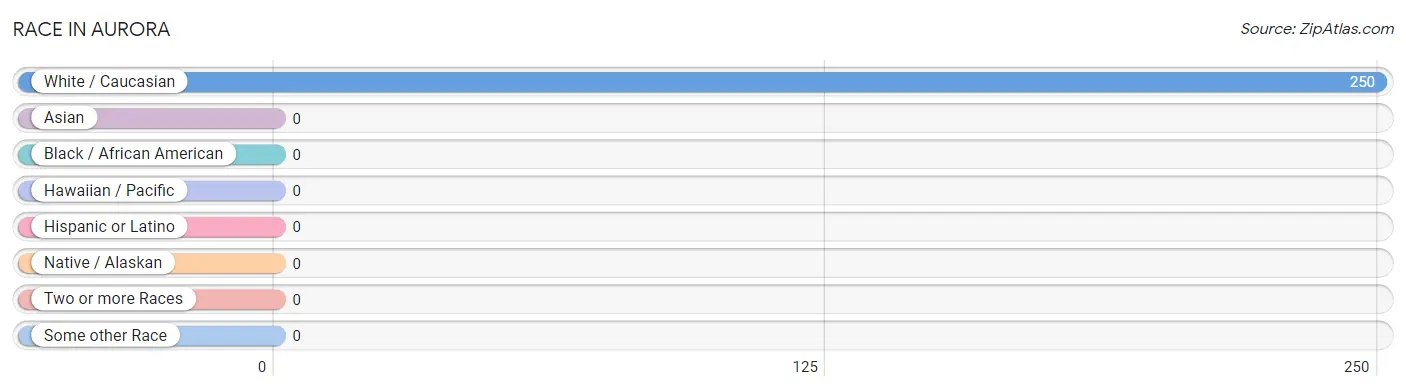
| Race | # Population | % Population |
| Asian | 0 | 0.0% |
| Black / African American | 0 | 0.0% |
| Hawaiian / Pacific | 0 | 0.0% |
| Hispanic or Latino | 0 | 0.0% |
| Native / Alaskan | 0 | 0.0% |
| White / Caucasian | 250 | 100.0% |
| Two or more Races | 0 | 0.0% |
| Some other Race | 0 | 0.0% |
| Total | 250 | 100.0% |
Ancestry in Aurora
The most populous ancestries reported in Aurora are German (84 | 33.6%), English (83 | 33.2%), and American (12 | 4.8%), together accounting for 71.6% of all Aurora residents.
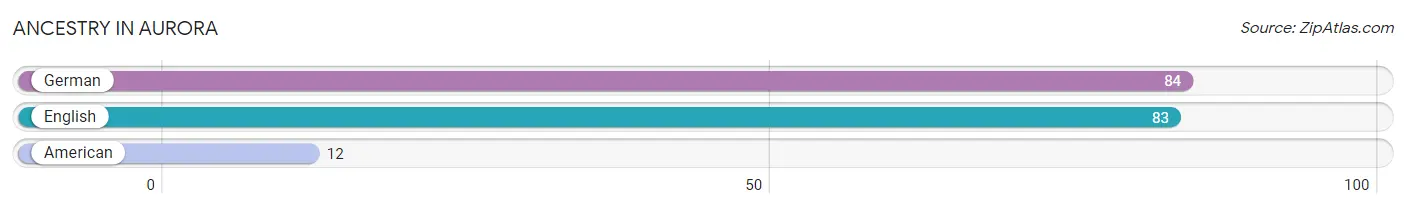
| Ancestry | # Population | % Population |
| American | 12 | 4.8% |
| English | 83 | 33.2% |
| German | 84 | 33.6% | View All 3 Rows |
Immigrants in Aurora

| Immigration Origin | # Population | % Population | View All 0 Rows |
Sex and Age in Aurora
Sex and Age in Aurora
The most populous age groups in Aurora are 35 to 39 Years (42 | 30.0%) for men and 35 to 39 Years (27 | 24.5%) for women.
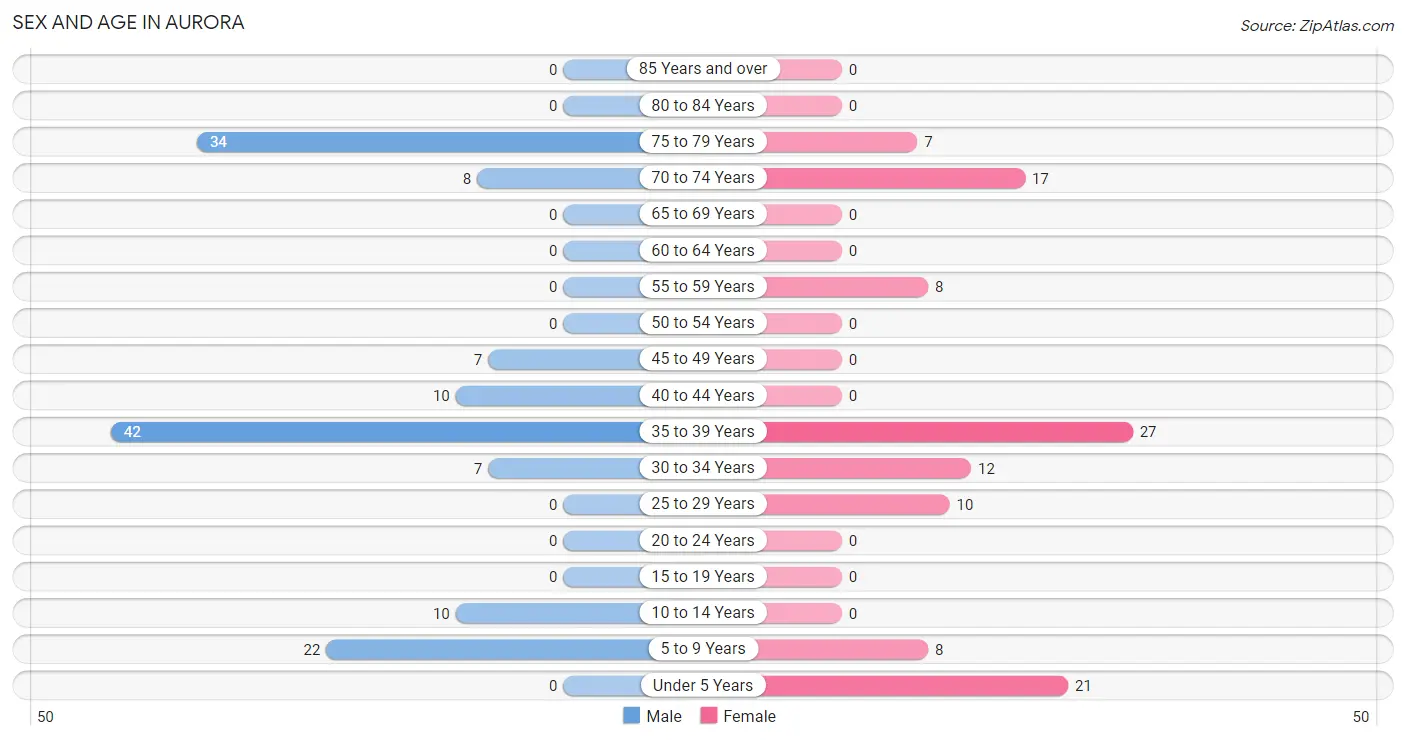
| Age Bracket | Male | Female |
| Under 5 Years | 0 (0.0%) | 21 (19.1%) |
| 5 to 9 Years | 22 (15.7%) | 8 (7.3%) |
| 10 to 14 Years | 10 (7.1%) | 0 (0.0%) |
| 15 to 19 Years | 0 (0.0%) | 0 (0.0%) |
| 20 to 24 Years | 0 (0.0%) | 0 (0.0%) |
| 25 to 29 Years | 0 (0.0%) | 10 (9.1%) |
| 30 to 34 Years | 7 (5.0%) | 12 (10.9%) |
| 35 to 39 Years | 42 (30.0%) | 27 (24.5%) |
| 40 to 44 Years | 10 (7.1%) | 0 (0.0%) |
| 45 to 49 Years | 7 (5.0%) | 0 (0.0%) |
| 50 to 54 Years | 0 (0.0%) | 0 (0.0%) |
| 55 to 59 Years | 0 (0.0%) | 8 (7.3%) |
| 60 to 64 Years | 0 (0.0%) | 0 (0.0%) |
| 65 to 69 Years | 0 (0.0%) | 0 (0.0%) |
| 70 to 74 Years | 8 (5.7%) | 17 (15.4%) |
| 75 to 79 Years | 34 (24.3%) | 7 (6.4%) |
| 80 to 84 Years | 0 (0.0%) | 0 (0.0%) |
| 85 Years and over | 0 (0.0%) | 0 (0.0%) |
| Total | 140 (100.0%) | 110 (100.0%) |
Families and Households in Aurora
Median Family Size in Aurora
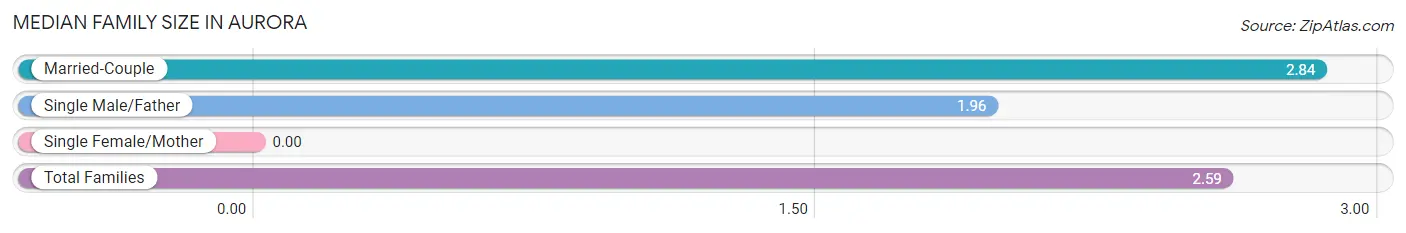
| Family Type | # Families | Family Size |
| Married-Couple | 64 (71.1%) | 2.84 |
| Single Male/Father | 26 (28.9%) | 1.96 |
| Single Female/Mother | 0 (0.0%) | - |
| Total Families | 90 (100.0%) | 2.59 |
Median Household Size in Aurora
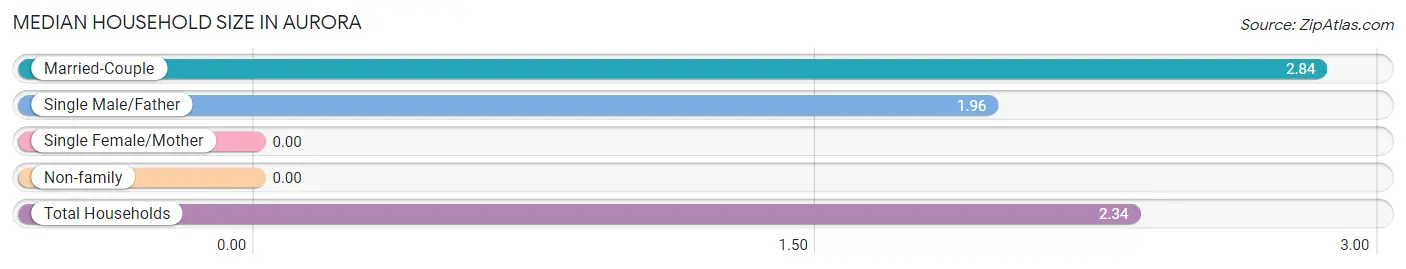
| Household Type | # Households | Household Size |
| Married-Couple | 64 (59.8%) | 2.84 |
| Single Male/Father | 26 (24.3%) | 1.96 |
| Single Female/Mother | 0 (0.0%) | - |
| Non-family | 17 (15.9%) | - |
| Total Households | 107 (100.0%) | 2.34 |
Household Size by Marriage Status in Aurora
Out of a total of 107 households in Aurora, 90 (84.1%) are family households, while 17 (15.9%) are nonfamily households. The most numerous type of family households are 2-person households, comprising 52, and the most common type of nonfamily households are 1-person households, comprising 17.
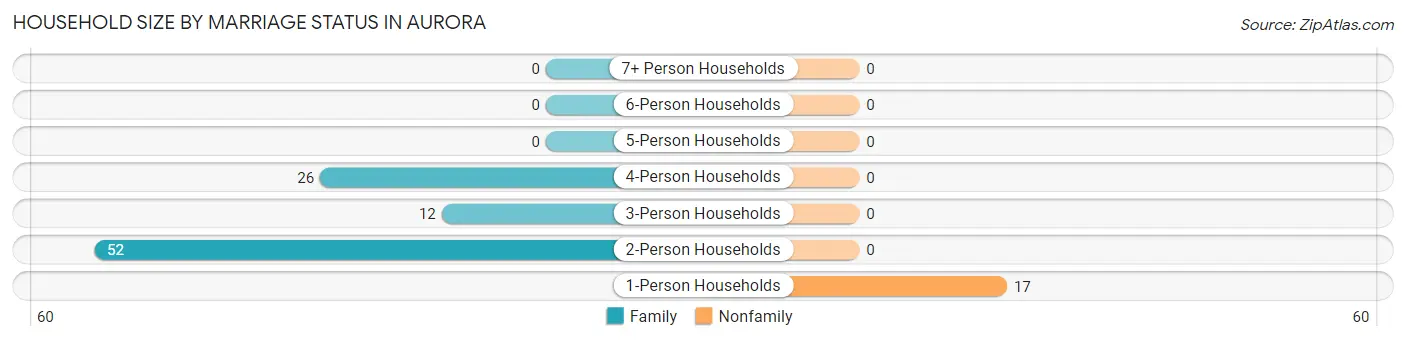
| Household Size | Family Households | Nonfamily Households |
| 1-Person Households | - | 17 (15.9%) |
| 2-Person Households | 52 (48.6%) | 0 (0.0%) |
| 3-Person Households | 12 (11.2%) | 0 (0.0%) |
| 4-Person Households | 26 (24.3%) | 0 (0.0%) |
| 5-Person Households | 0 (0.0%) | 0 (0.0%) |
| 6-Person Households | 0 (0.0%) | 0 (0.0%) |
| 7+ Person Households | 0 (0.0%) | 0 (0.0%) |
| Total | 90 (84.1%) | 17 (15.9%) |
Female Fertility in Aurora
Fertility by Age in Aurora
| Age Bracket | Women with Births | Births / 1,000 Women |
| 15 to 19 years | 0 (0.0%) | 0.0 |
| 20 to 34 years | 0 (0.0%) | 0.0 |
| 35 to 50 years | 0 (0.0%) | 0.0 |
| Total | 0 (0.0%) | 0.0 |
Fertility by Age by Marriage Status in Aurora
| Age Bracket | Married | Unmarried |
| 15 to 19 years | 0 (0.0%) | 0 (0.0%) |
| 20 to 34 years | 0 (0.0%) | 0 (0.0%) |
| 35 to 50 years | 0 (0.0%) | 0 (0.0%) |
| Total | 0 (0.0%) | 0 (0.0%) |
Fertility by Education in Aurora
| Educational Attainment | Women with Births | Births / 1,000 Women |
| Less than High School | 0 (0.0%) | 0.0 |
| High School Diploma | 0 (0.0%) | 0.0 |
| College or Associate's Degree | 0 (0.0%) | 0.0 |
| Bachelor's Degree | 0 (0.0%) | 0.0 |
| Graduate Degree | 0 (0.0%) | 0.0 |
| Total | 0 (0.0%) | 0.0 |
Fertility by Education by Marriage Status in Aurora
| Educational Attainment | Married | Unmarried |
| Less than High School | 0 (0.0%) | 0 (0.0%) |
| High School Diploma | 0 (0.0%) | 0 (0.0%) |
| College or Associate's Degree | 0 (0.0%) | 0 (0.0%) |
| Bachelor's Degree | 0 (0.0%) | 0 (0.0%) |
| Graduate Degree | 0 (0.0%) | 0 (0.0%) |
| Total | 0 (0.0%) | 0 (0.0%) |
Employment Characteristics in Aurora
Employment by Class of Employer in Aurora
Among the 93 employed individuals in Aurora, private company employees (65 | 69.9%), local government employees (18 | 19.4%), and not-for-profit organizations (10 | 10.7%) make up the most common classes of employment.
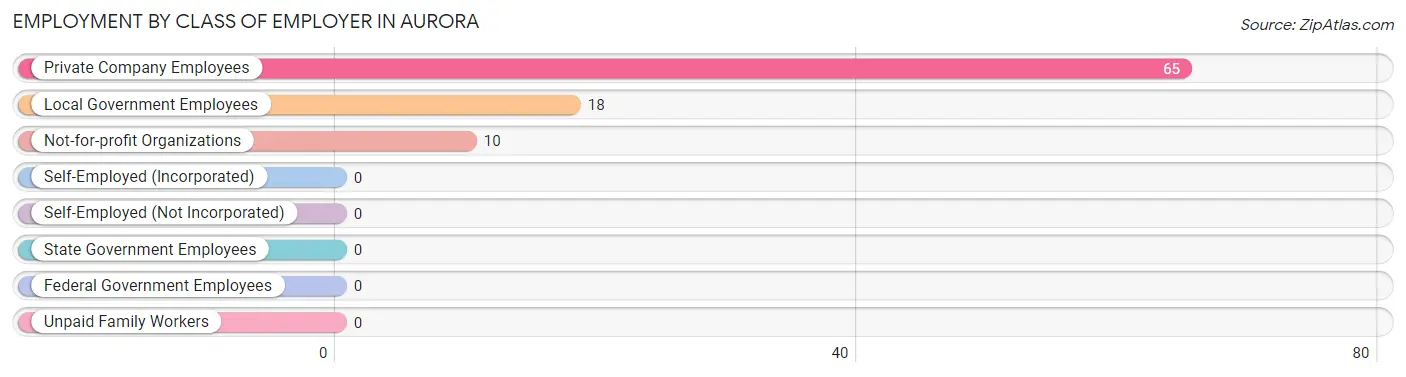
| Employer Class | # Employees | % Employees |
| Private Company Employees | 65 | 69.9% |
| Self-Employed (Incorporated) | 0 | 0.0% |
| Self-Employed (Not Incorporated) | 0 | 0.0% |
| Not-for-profit Organizations | 10 | 10.7% |
| Local Government Employees | 18 | 19.4% |
| State Government Employees | 0 | 0.0% |
| Federal Government Employees | 0 | 0.0% |
| Unpaid Family Workers | 0 | 0.0% |
| Total | 93 | 100.0% |
Employment Status by Age in Aurora
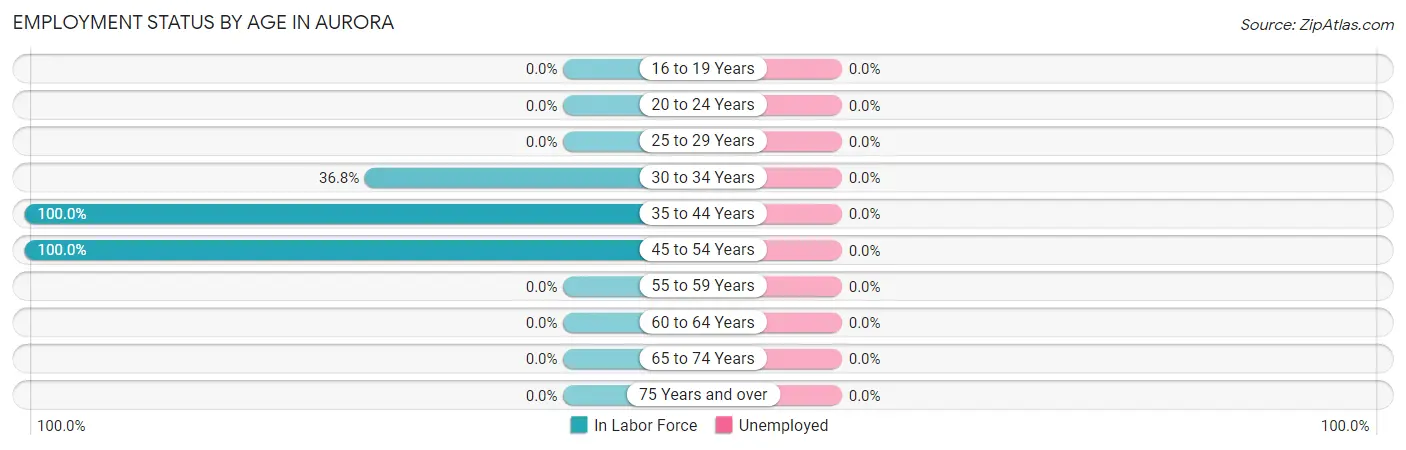
| Age Bracket | In Labor Force | Unemployed |
| 16 to 19 Years | 0 (0.0%) | 0 (0.0%) |
| 20 to 24 Years | 0 (0.0%) | 0 (0.0%) |
| 25 to 29 Years | 0 (0.0%) | 0 (0.0%) |
| 30 to 34 Years | 7 (36.8%) | 0 (0.0%) |
| 35 to 44 Years | 79 (100.0%) | 0 (0.0%) |
| 45 to 54 Years | 7 (100.0%) | 0 (0.0%) |
| 55 to 59 Years | 0 (0.0%) | 0 (0.0%) |
| 60 to 64 Years | 0 (0.0%) | 0 (0.0%) |
| 65 to 74 Years | 0 (0.0%) | 0 (0.0%) |
| 75 Years and over | 0 (0.0%) | 0 (0.0%) |
| Total | 93 (49.2%) | 0 (0.0%) |
Employment Status by Educational Attainment in Aurora
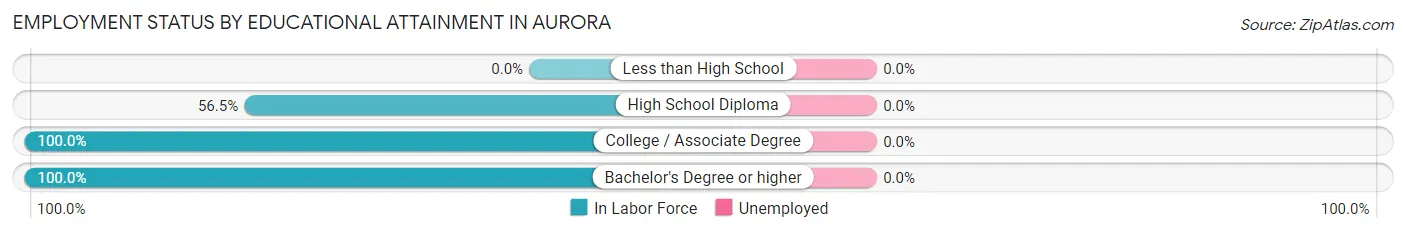
| Educational Attainment | In Labor Force | Unemployed |
| Less than High School | 0 (0.0%) | 0 (0.0%) |
| High School Diploma | 39 (56.5%) | 0 (0.0%) |
| College / Associate Degree | 27 (100.0%) | 0 (0.0%) |
| Bachelor's Degree or higher | 27 (100.0%) | 0 (0.0%) |
| Total | 93 (75.6%) | 0 (0.0%) |
Employment Occupations by Sex in Aurora
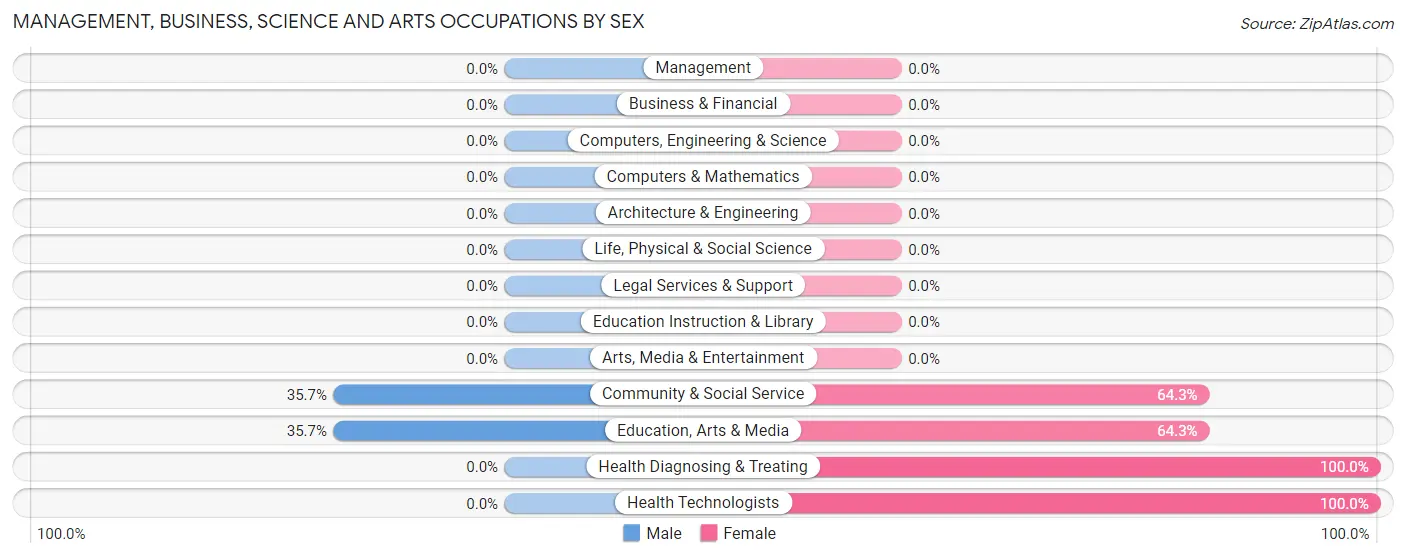
Management, Business, Science and Arts Occupations
The most common Management, Business, Science and Arts occupations in Aurora are Community & Social Service (28 | 30.1%), Education, Arts & Media (28 | 30.1%), Health Diagnosing & Treating (9 | 9.7%), and Health Technologists (9 | 9.7%).
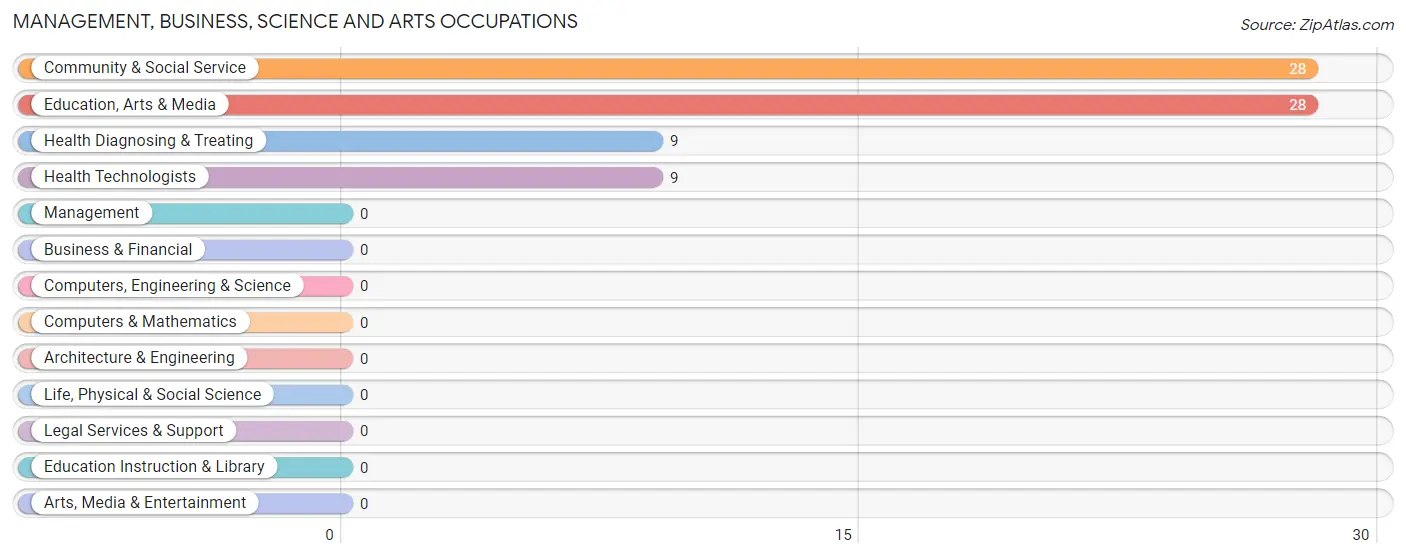
Management, Business, Science and Arts Occupations by Sex
Within the Management, Business, Science and Arts occupations in Aurora, the most male-oriented occupations are Community & Social Service (35.7%), and Education, Arts & Media (35.7%), while the most female-oriented occupations are Health Diagnosing & Treating (100.0%), Health Technologists (100.0%), and Community & Social Service (64.3%).
| Occupation | Male | Female |
| Management | 0 (0.0%) | 0 (0.0%) |
| Business & Financial | 0 (0.0%) | 0 (0.0%) |
| Computers, Engineering & Science | 0 (0.0%) | 0 (0.0%) |
| Computers & Mathematics | 0 (0.0%) | 0 (0.0%) |
| Architecture & Engineering | 0 (0.0%) | 0 (0.0%) |
| Life, Physical & Social Science | 0 (0.0%) | 0 (0.0%) |
| Community & Social Service | 10 (35.7%) | 18 (64.3%) |
| Education, Arts & Media | 10 (35.7%) | 18 (64.3%) |
| Legal Services & Support | 0 (0.0%) | 0 (0.0%) |
| Education Instruction & Library | 0 (0.0%) | 0 (0.0%) |
| Arts, Media & Entertainment | 0 (0.0%) | 0 (0.0%) |
| Health Diagnosing & Treating | 0 (0.0%) | 9 (100.0%) |
| Health Technologists | 0 (0.0%) | 9 (100.0%) |
| Total (Category) | 10 (27.0%) | 27 (73.0%) |
| Total (Overall) | 66 (71.0%) | 27 (29.0%) |
Services Occupations
Services Occupations by Sex
| Occupation | Male | Female |
| Healthcare Support | 0 (0.0%) | 0 (0.0%) |
| Security & Protection | 0 (0.0%) | 0 (0.0%) |
| Firefighting & Prevention | 0 (0.0%) | 0 (0.0%) |
| Law Enforcement | 0 (0.0%) | 0 (0.0%) |
| Food Preparation & Serving | 0 (0.0%) | 0 (0.0%) |
| Cleaning & Maintenance | 0 (0.0%) | 0 (0.0%) |
| Personal Care & Service | 0 (0.0%) | 0 (0.0%) |
| Total (Category) | 0 (0.0%) | 0 (0.0%) |
| Total (Overall) | 66 (71.0%) | 27 (29.0%) |
Sales and Office Occupations
Sales and Office Occupations by Sex
| Occupation | Male | Female |
| Sales & Related | 0 (0.0%) | 0 (0.0%) |
| Office & Administration | 0 (0.0%) | 0 (0.0%) |
| Total (Category) | 0 (0.0%) | 0 (0.0%) |
| Total (Overall) | 66 (71.0%) | 27 (29.0%) |
Natural Resources, Construction and Maintenance Occupations
Natural Resources, Construction and Maintenance Occupations by Sex
| Occupation | Male | Female |
| Farming, Fishing & Forestry | 0 (0.0%) | 0 (0.0%) |
| Construction & Extraction | 0 (0.0%) | 0 (0.0%) |
| Installation, Maintenance & Repair | 0 (0.0%) | 0 (0.0%) |
| Total (Category) | 0 (0.0%) | 0 (0.0%) |
| Total (Overall) | 66 (71.0%) | 27 (29.0%) |
Production, Transportation and Moving Occupations
The most common Production, Transportation and Moving occupations in Aurora are Production (32 | 34.4%), Transportation (17 | 18.3%), and Material Moving (7 | 7.5%).
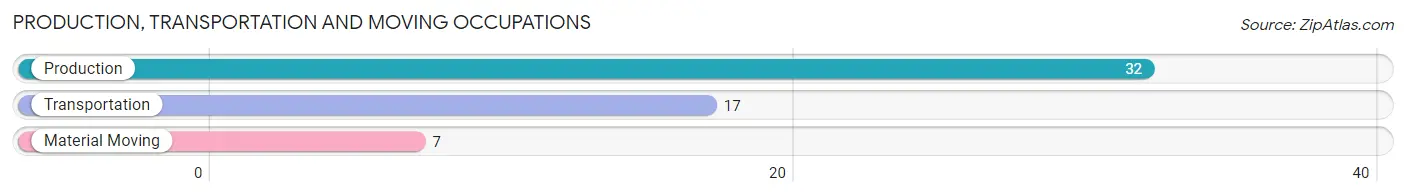
Production, Transportation and Moving Occupations by Sex
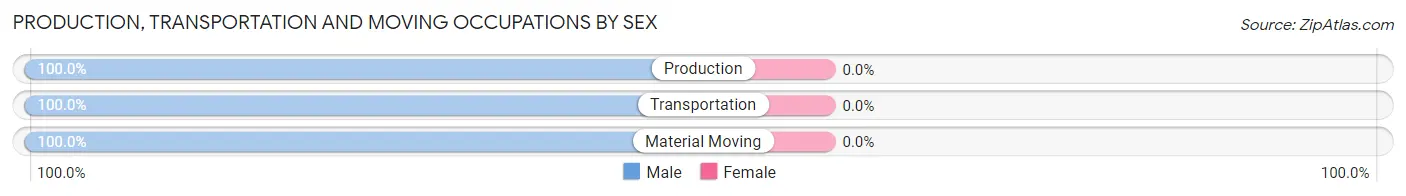
| Occupation | Male | Female |
| Production | 32 (100.0%) | 0 (0.0%) |
| Transportation | 17 (100.0%) | 0 (0.0%) |
| Material Moving | 7 (100.0%) | 0 (0.0%) |
| Total (Category) | 56 (100.0%) | 0 (0.0%) |
| Total (Overall) | 66 (71.0%) | 27 (29.0%) |
Employment Industries by Sex in Aurora
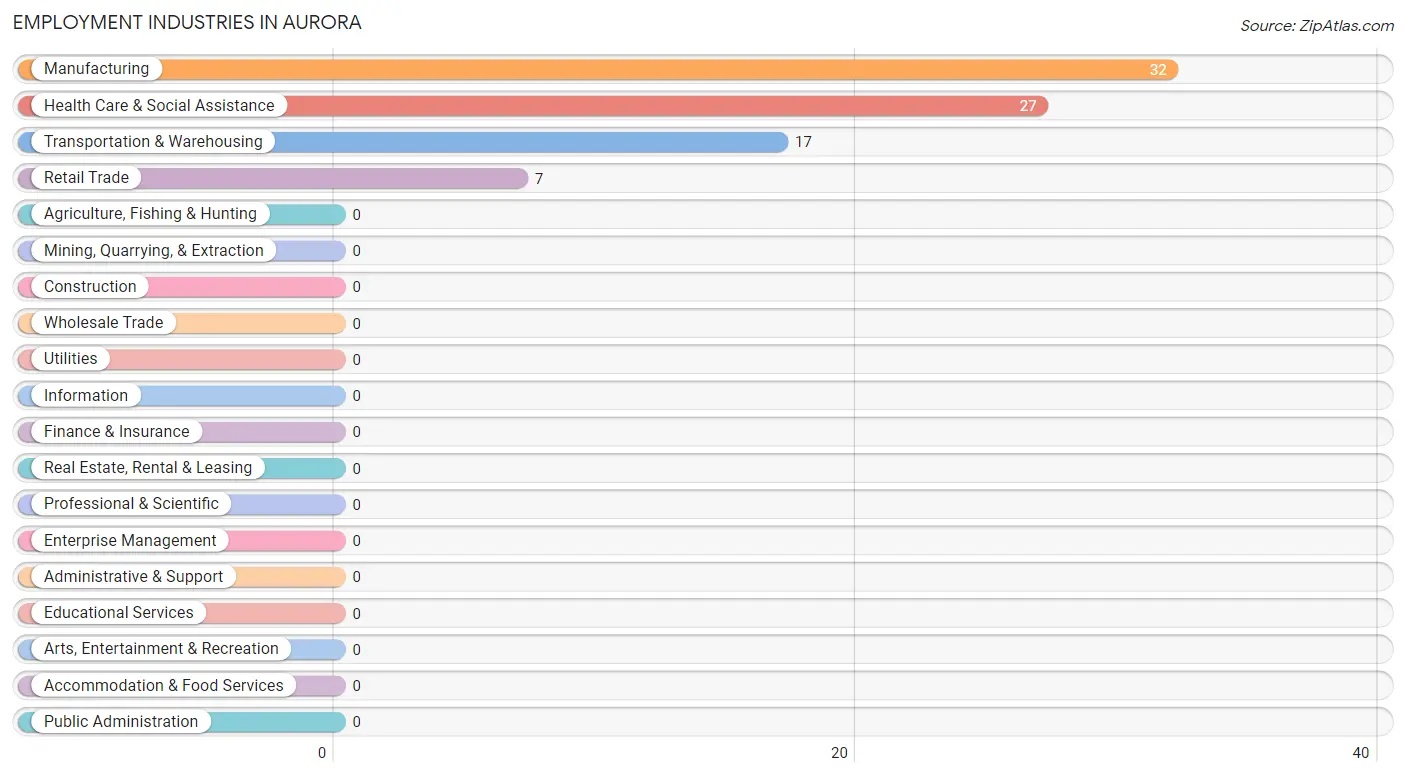
Employment Industries in Aurora
The major employment industries in Aurora include Manufacturing (32 | 34.4%), Health Care & Social Assistance (27 | 29.0%), Transportation & Warehousing (17 | 18.3%), and Retail Trade (7 | 7.5%).
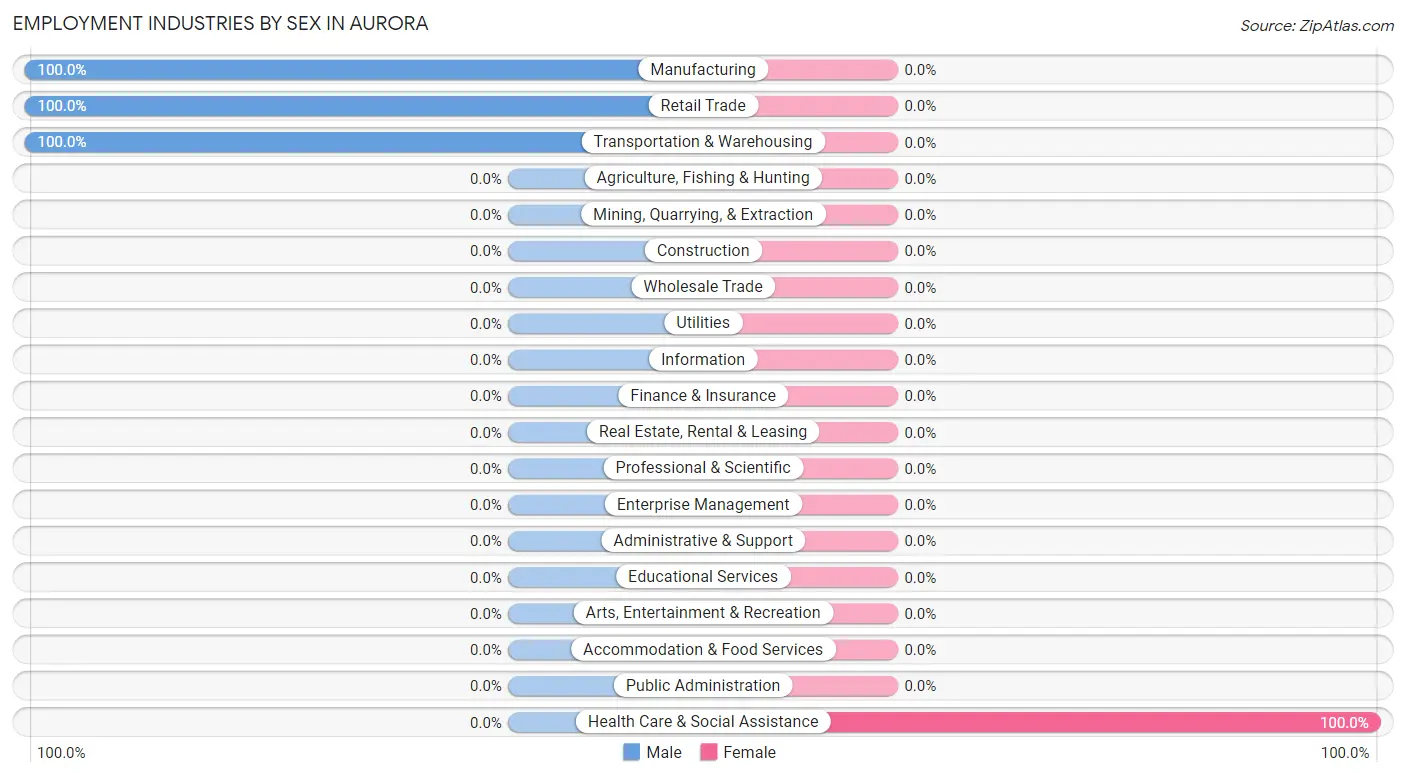
Employment Industries by Sex in Aurora
| Industry | Male | Female |
| Agriculture, Fishing & Hunting | 0 (0.0%) | 0 (0.0%) |
| Mining, Quarrying, & Extraction | 0 (0.0%) | 0 (0.0%) |
| Construction | 0 (0.0%) | 0 (0.0%) |
| Manufacturing | 32 (100.0%) | 0 (0.0%) |
| Wholesale Trade | 0 (0.0%) | 0 (0.0%) |
| Retail Trade | 7 (100.0%) | 0 (0.0%) |
| Transportation & Warehousing | 17 (100.0%) | 0 (0.0%) |
| Utilities | 0 (0.0%) | 0 (0.0%) |
| Information | 0 (0.0%) | 0 (0.0%) |
| Finance & Insurance | 0 (0.0%) | 0 (0.0%) |
| Real Estate, Rental & Leasing | 0 (0.0%) | 0 (0.0%) |
| Professional & Scientific | 0 (0.0%) | 0 (0.0%) |
| Enterprise Management | 0 (0.0%) | 0 (0.0%) |
| Administrative & Support | 0 (0.0%) | 0 (0.0%) |
| Educational Services | 0 (0.0%) | 0 (0.0%) |
| Health Care & Social Assistance | 0 (0.0%) | 27 (100.0%) |
| Arts, Entertainment & Recreation | 0 (0.0%) | 0 (0.0%) |
| Accommodation & Food Services | 0 (0.0%) | 0 (0.0%) |
| Public Administration | 0 (0.0%) | 0 (0.0%) |
| Total | 66 (71.0%) | 27 (29.0%) |
Education in Aurora
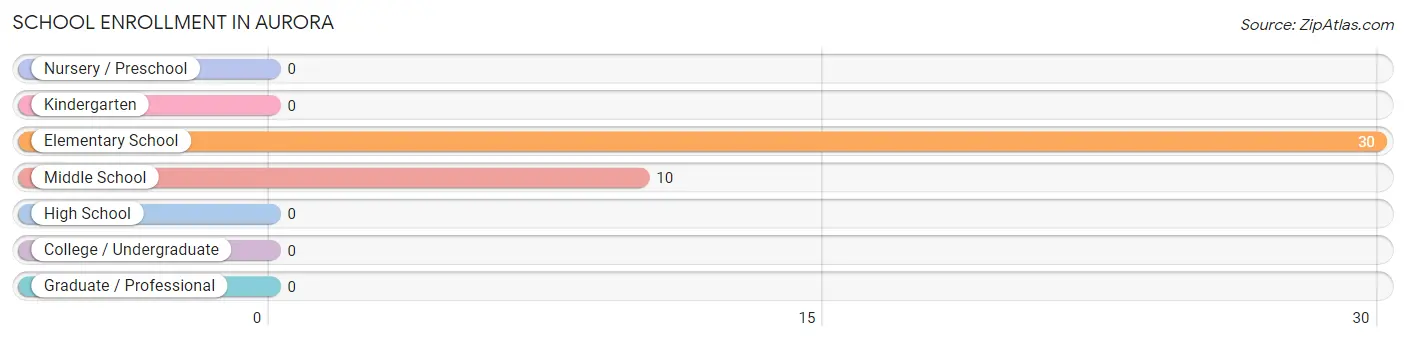
School Enrollment in Aurora
The most common levels of schooling among the 40 students in Aurora are elementary school (30 | 75.0%), and middle school (10 | 25.0%).
| School Level | # Students | % Students |
| Nursery / Preschool | 0 | 0.0% |
| Kindergarten | 0 | 0.0% |
| Elementary School | 30 | 75.0% |
| Middle School | 10 | 25.0% |
| High School | 0 | 0.0% |
| College / Undergraduate | 0 | 0.0% |
| Graduate / Professional | 0 | 0.0% |
| Total | 40 | 100.0% |
School Enrollment by Age by Funding Source in Aurora
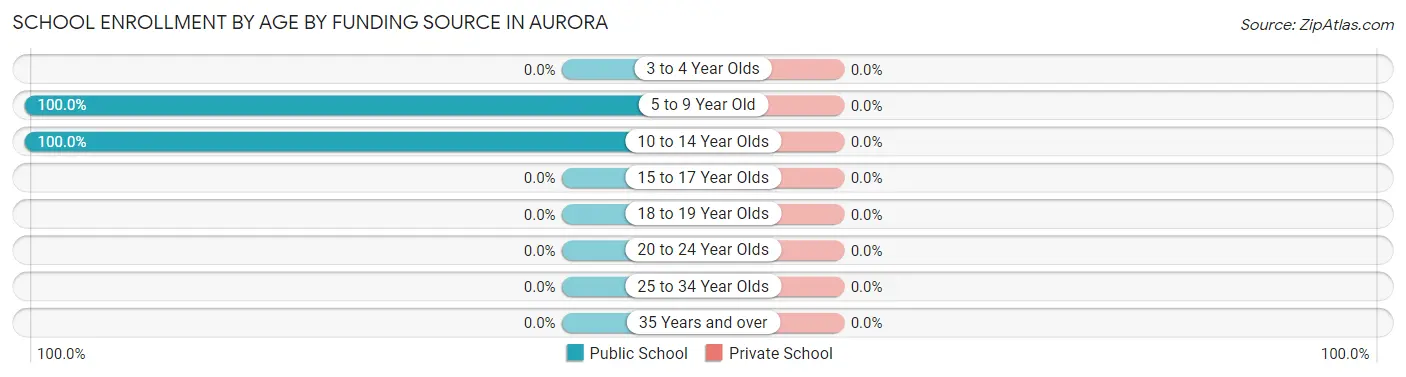
| Age Bracket | Public School | Private School |
| 3 to 4 Year Olds | 0 (0.0%) | 0 (0.0%) |
| 5 to 9 Year Old | 30 (100.0%) | 0 (0.0%) |
| 10 to 14 Year Olds | 10 (100.0%) | 0 (0.0%) |
| 15 to 17 Year Olds | 0 (0.0%) | 0 (0.0%) |
| 18 to 19 Year Olds | 0 (0.0%) | 0 (0.0%) |
| 20 to 24 Year Olds | 0 (0.0%) | 0 (0.0%) |
| 25 to 34 Year Olds | 0 (0.0%) | 0 (0.0%) |
| 35 Years and over | 0 (0.0%) | 0 (0.0%) |
| Total | 40 (100.0%) | 0 (0.0%) |
Educational Attainment by Field of Study in Aurora
Business (18 | 66.7%), and psychology (9 | 33.3%) are the most common fields of study among 27 individuals in Aurora who have obtained a bachelor's degree or higher.
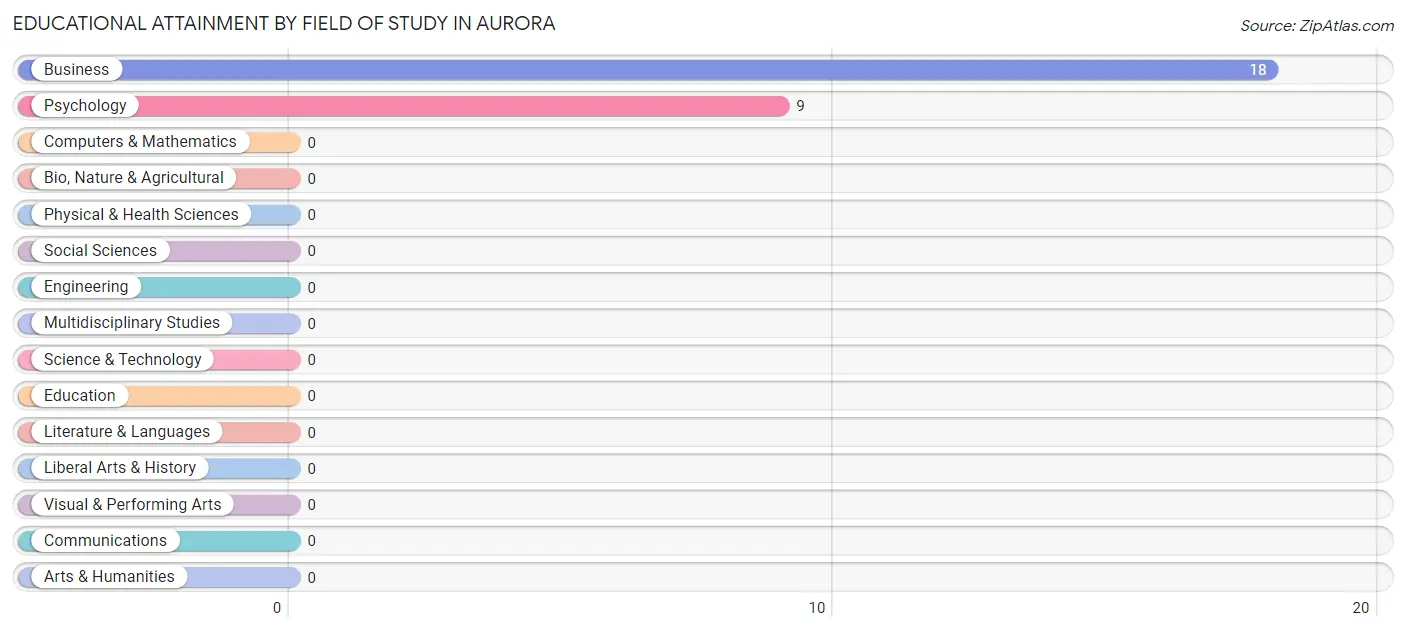
| Field of Study | # Graduates | % Graduates |
| Computers & Mathematics | 0 | 0.0% |
| Bio, Nature & Agricultural | 0 | 0.0% |
| Physical & Health Sciences | 0 | 0.0% |
| Psychology | 9 | 33.3% |
| Social Sciences | 0 | 0.0% |
| Engineering | 0 | 0.0% |
| Multidisciplinary Studies | 0 | 0.0% |
| Science & Technology | 0 | 0.0% |
| Business | 18 | 66.7% |
| Education | 0 | 0.0% |
| Literature & Languages | 0 | 0.0% |
| Liberal Arts & History | 0 | 0.0% |
| Visual & Performing Arts | 0 | 0.0% |
| Communications | 0 | 0.0% |
| Arts & Humanities | 0 | 0.0% |
| Total | 27 | 100.0% |
Transportation & Commute in Aurora
Vehicle Availability by Sex in Aurora
The most prevalent vehicle ownership categories in Aurora are males with 1 vehicle (25, accounting for 37.9%) and females with 1 vehicle (0, making up 92.6%).
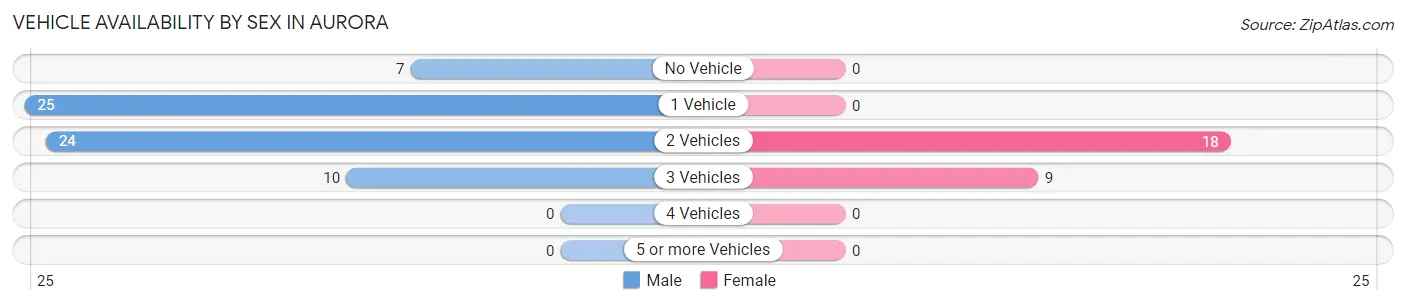
| Vehicles Available | Male | Female |
| No Vehicle | 7 (10.6%) | 0 (0.0%) |
| 1 Vehicle | 25 (37.9%) | 0 (0.0%) |
| 2 Vehicles | 24 (36.4%) | 18 (66.7%) |
| 3 Vehicles | 10 (15.1%) | 9 (33.3%) |
| 4 Vehicles | 0 (0.0%) | 0 (0.0%) |
| 5 or more Vehicles | 0 (0.0%) | 0 (0.0%) |
| Total | 66 (100.0%) | 27 (100.0%) |
Commute Time in Aurora
The most frequently occuring commute durations in Aurora are 30 to 34 minutes (25 commuters, 26.9%), 45 to 59 minutes (24 commuters, 25.8%), and 25 to 29 minutes (18 commuters, 19.4%).
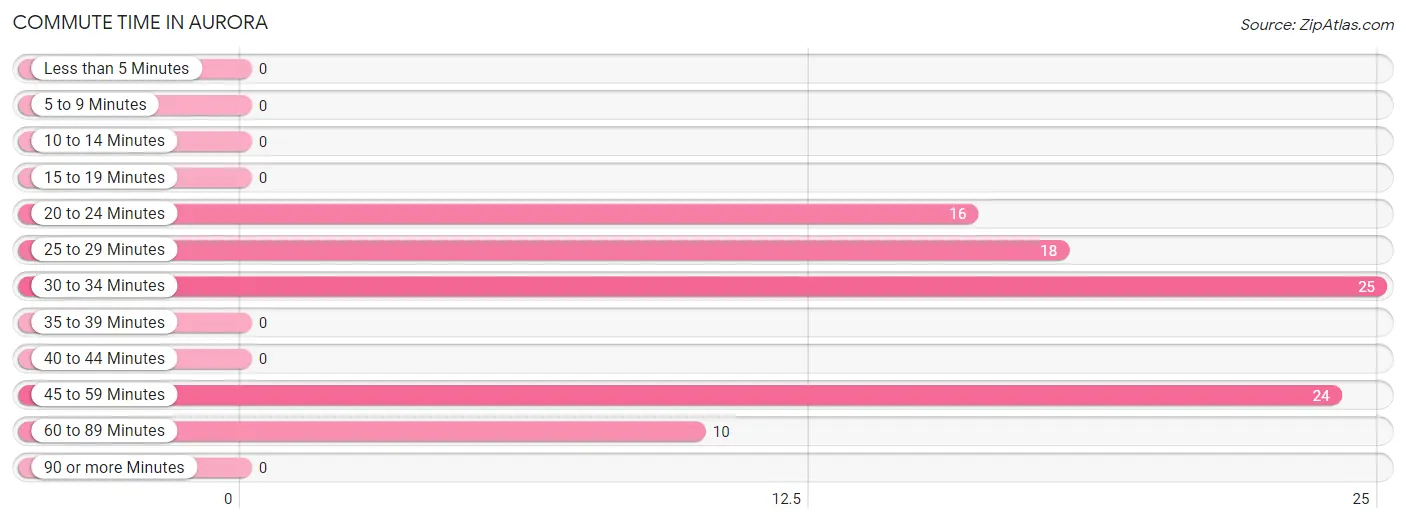
| Commute Time | # Commuters | % Commuters |
| Less than 5 Minutes | 0 | 0.0% |
| 5 to 9 Minutes | 0 | 0.0% |
| 10 to 14 Minutes | 0 | 0.0% |
| 15 to 19 Minutes | 0 | 0.0% |
| 20 to 24 Minutes | 16 | 17.2% |
| 25 to 29 Minutes | 18 | 19.4% |
| 30 to 34 Minutes | 25 | 26.9% |
| 35 to 39 Minutes | 0 | 0.0% |
| 40 to 44 Minutes | 0 | 0.0% |
| 45 to 59 Minutes | 24 | 25.8% |
| 60 to 89 Minutes | 10 | 10.7% |
| 90 or more Minutes | 0 | 0.0% |
Commute Time by Sex in Aurora
The most common commute times in Aurora are 30 to 34 minutes (25 commuters, 37.9%) for males and 25 to 29 minutes (18 commuters, 66.7%) for females.
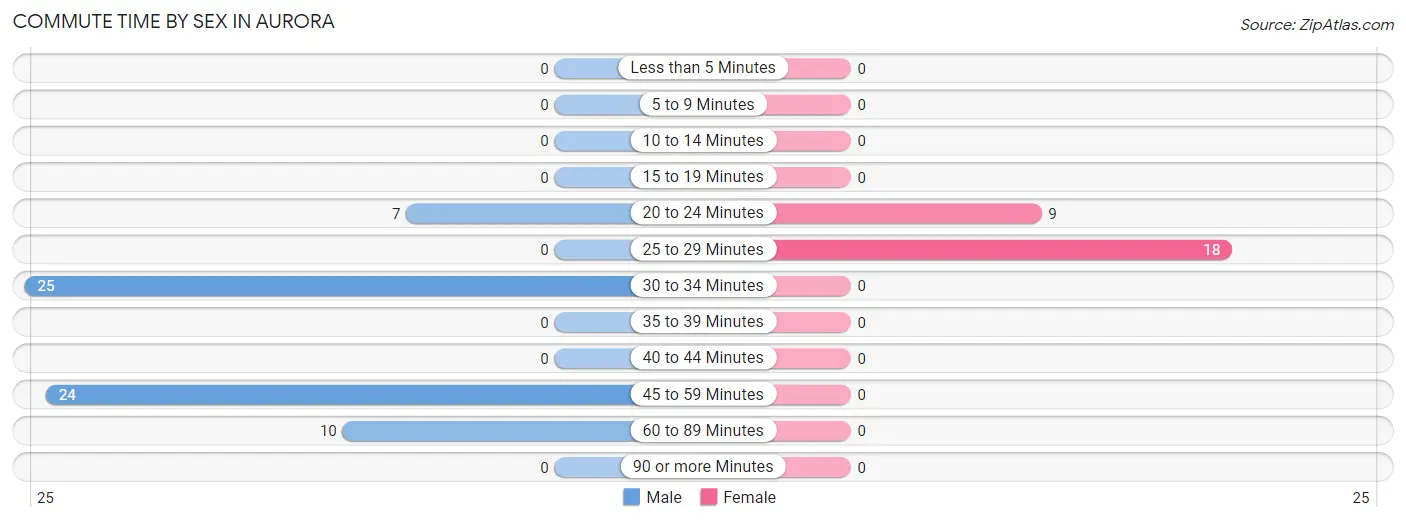
| Commute Time | Male | Female |
| Less than 5 Minutes | 0 (0.0%) | 0 (0.0%) |
| 5 to 9 Minutes | 0 (0.0%) | 0 (0.0%) |
| 10 to 14 Minutes | 0 (0.0%) | 0 (0.0%) |
| 15 to 19 Minutes | 0 (0.0%) | 0 (0.0%) |
| 20 to 24 Minutes | 7 (10.6%) | 9 (33.3%) |
| 25 to 29 Minutes | 0 (0.0%) | 18 (66.7%) |
| 30 to 34 Minutes | 25 (37.9%) | 0 (0.0%) |
| 35 to 39 Minutes | 0 (0.0%) | 0 (0.0%) |
| 40 to 44 Minutes | 0 (0.0%) | 0 (0.0%) |
| 45 to 59 Minutes | 24 (36.4%) | 0 (0.0%) |
| 60 to 89 Minutes | 10 (15.1%) | 0 (0.0%) |
| 90 or more Minutes | 0 (0.0%) | 0 (0.0%) |
Time of Departure to Work by Sex in Aurora
The most frequent times of departure to work in Aurora are 5:30 AM to 5:59 AM (25, 37.9%) for males and 8:00 AM to 8:29 AM (18, 66.7%) for females.
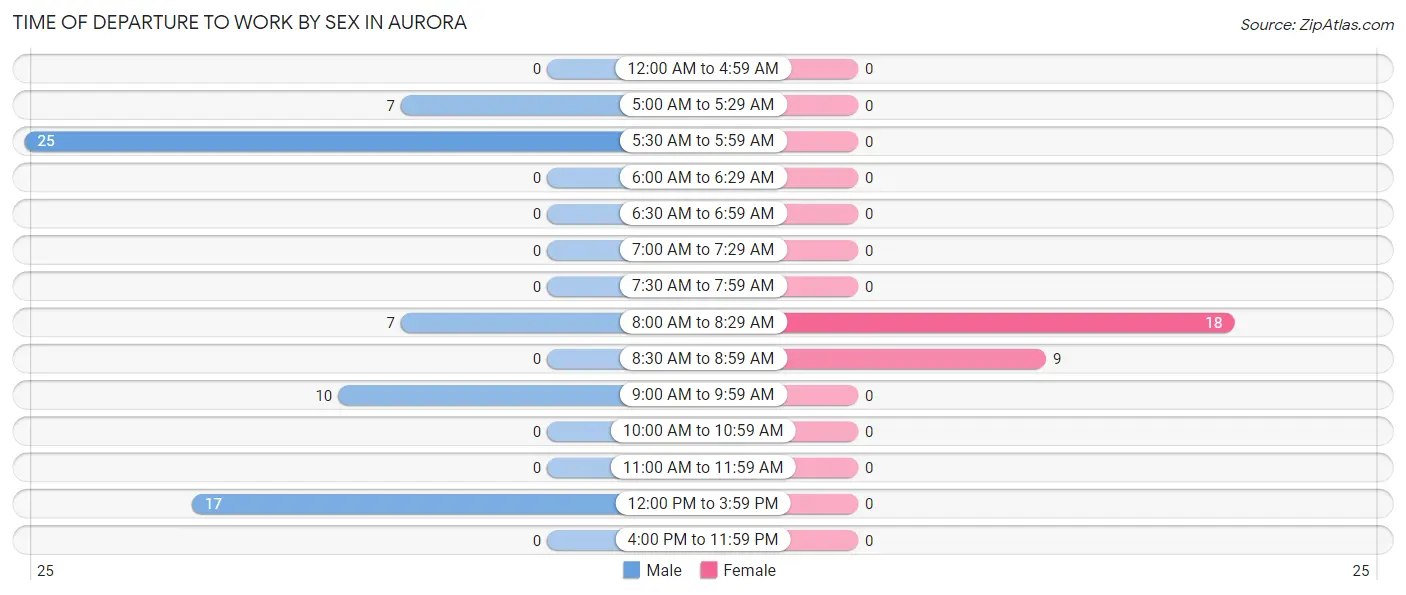
| Time of Departure | Male | Female |
| 12:00 AM to 4:59 AM | 0 (0.0%) | 0 (0.0%) |
| 5:00 AM to 5:29 AM | 7 (10.6%) | 0 (0.0%) |
| 5:30 AM to 5:59 AM | 25 (37.9%) | 0 (0.0%) |
| 6:00 AM to 6:29 AM | 0 (0.0%) | 0 (0.0%) |
| 6:30 AM to 6:59 AM | 0 (0.0%) | 0 (0.0%) |
| 7:00 AM to 7:29 AM | 0 (0.0%) | 0 (0.0%) |
| 7:30 AM to 7:59 AM | 0 (0.0%) | 0 (0.0%) |
| 8:00 AM to 8:29 AM | 7 (10.6%) | 18 (66.7%) |
| 8:30 AM to 8:59 AM | 0 (0.0%) | 9 (33.3%) |
| 9:00 AM to 9:59 AM | 10 (15.1%) | 0 (0.0%) |
| 10:00 AM to 10:59 AM | 0 (0.0%) | 0 (0.0%) |
| 11:00 AM to 11:59 AM | 0 (0.0%) | 0 (0.0%) |
| 12:00 PM to 3:59 PM | 17 (25.8%) | 0 (0.0%) |
| 4:00 PM to 11:59 PM | 0 (0.0%) | 0 (0.0%) |
| Total | 66 (100.0%) | 27 (100.0%) |
Housing Occupancy in Aurora
Occupancy by Ownership in Aurora
Of the total 107 dwellings in Aurora, owner-occupied units account for 56 (52.3%), while renter-occupied units make up 51 (47.7%).
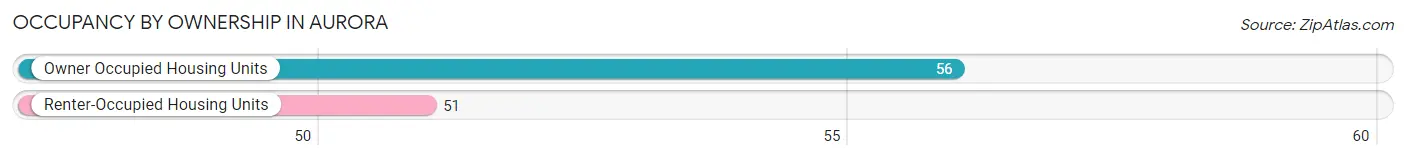
| Occupancy | # Housing Units | % Housing Units |
| Owner Occupied Housing Units | 56 | 52.3% |
| Renter-Occupied Housing Units | 51 | 47.7% |
| Total Occupied Housing Units | 107 | 100.0% |
Occupancy by Household Size in Aurora
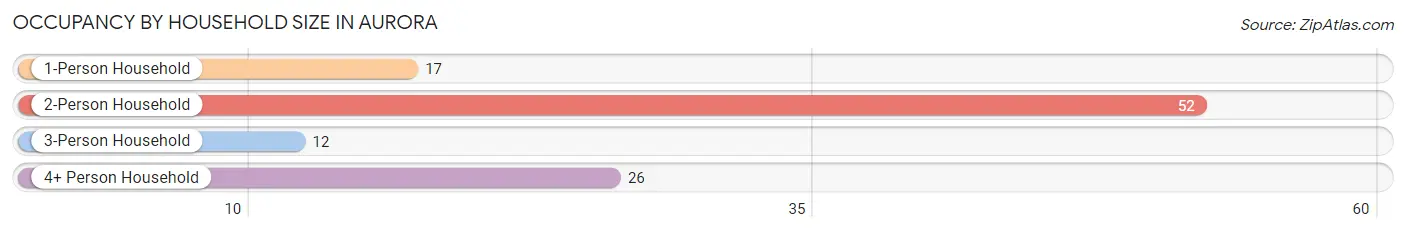
| Household Size | # Housing Units | % Housing Units |
| 1-Person Household | 17 | 15.9% |
| 2-Person Household | 52 | 48.6% |
| 3-Person Household | 12 | 11.2% |
| 4+ Person Household | 26 | 24.3% |
| Total Housing Units | 107 | 100.0% |
Occupancy by Ownership by Household Size in Aurora
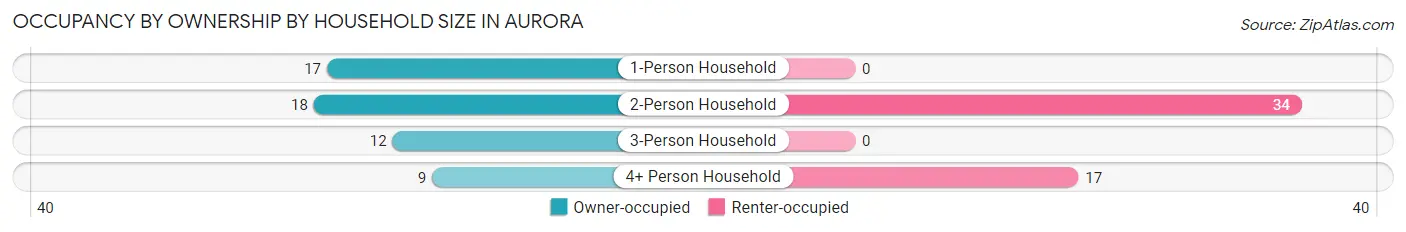
| Household Size | Owner-occupied | Renter-occupied |
| 1-Person Household | 17 (100.0%) | 0 (0.0%) |
| 2-Person Household | 18 (34.6%) | 34 (65.4%) |
| 3-Person Household | 12 (100.0%) | 0 (0.0%) |
| 4+ Person Household | 9 (34.6%) | 17 (65.4%) |
| Total Housing Units | 56 (52.3%) | 51 (47.7%) |
Occupancy by Educational Attainment in Aurora
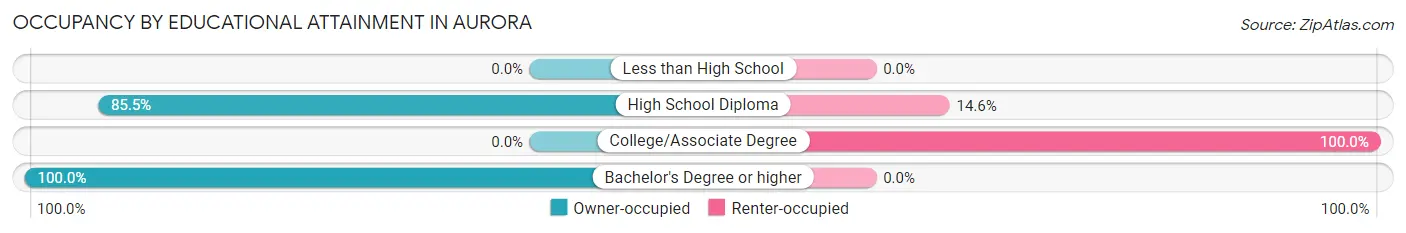
| Household Size | Owner-occupied | Renter-occupied |
| Less than High School | 0 (0.0%) | 0 (0.0%) |
| High School Diploma | 47 (85.5%) | 8 (14.5%) |
| College/Associate Degree | 0 (0.0%) | 43 (100.0%) |
| Bachelor's Degree or higher | 9 (100.0%) | 0 (0.0%) |
Occupancy by Age of Householder in Aurora
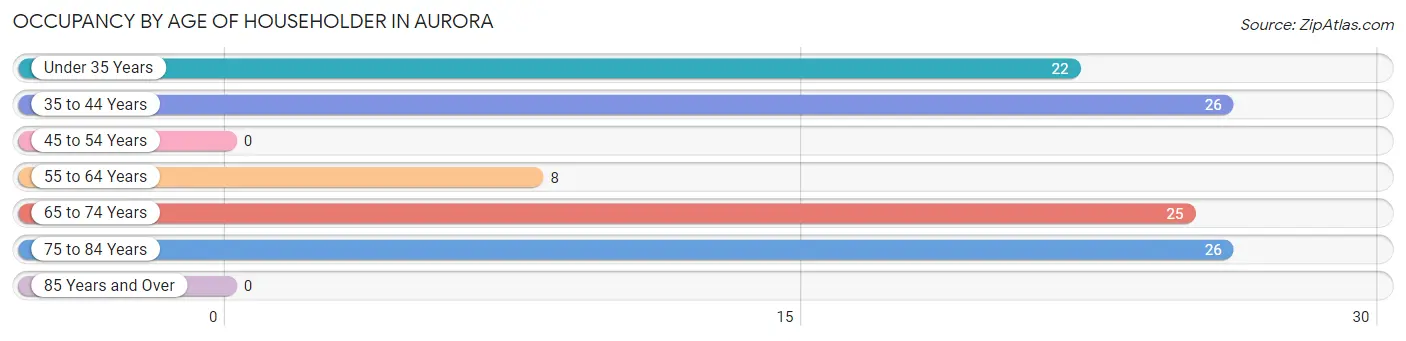
| Age Bracket | # Households | % Households |
| Under 35 Years | 22 | 20.6% |
| 35 to 44 Years | 26 | 24.3% |
| 45 to 54 Years | 0 | 0.0% |
| 55 to 64 Years | 8 | 7.5% |
| 65 to 74 Years | 25 | 23.4% |
| 75 to 84 Years | 26 | 24.3% |
| 85 Years and Over | 0 | 0.0% |
| Total | 107 | 100.0% |
Housing Finances in Aurora
Median Income by Occupancy in Aurora
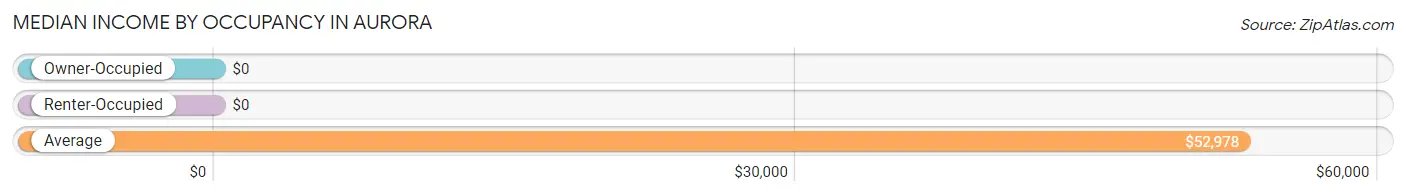
| Occupancy Type | # Households | Median Income |
| Owner-Occupied | 56 (52.3%) | $0 |
| Renter-Occupied | 51 (47.7%) | $0 |
| Average | 107 (100.0%) | $52,978 |
Occupancy by Householder Income Bracket in Aurora
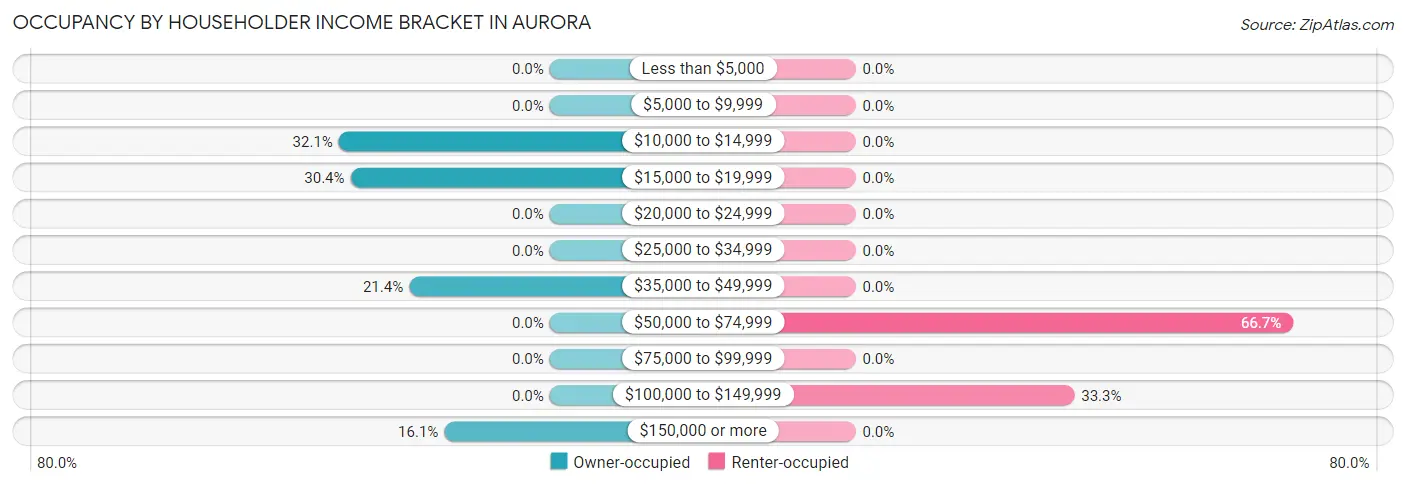
| Income Bracket | Owner-occupied | Renter-occupied |
| Less than $5,000 | 0 (0.0%) | 0 (0.0%) |
| $5,000 to $9,999 | 0 (0.0%) | 0 (0.0%) |
| $10,000 to $14,999 | 18 (32.1%) | 0 (0.0%) |
| $15,000 to $19,999 | 17 (30.4%) | 0 (0.0%) |
| $20,000 to $24,999 | 0 (0.0%) | 0 (0.0%) |
| $25,000 to $34,999 | 0 (0.0%) | 0 (0.0%) |
| $35,000 to $49,999 | 12 (21.4%) | 0 (0.0%) |
| $50,000 to $74,999 | 0 (0.0%) | 34 (66.7%) |
| $75,000 to $99,999 | 0 (0.0%) | 0 (0.0%) |
| $100,000 to $149,999 | 0 (0.0%) | 17 (33.3%) |
| $150,000 or more | 9 (16.1%) | 0 (0.0%) |
| Total | 56 (100.0%) | 51 (100.0%) |
Monthly Housing Cost Tiers in Aurora
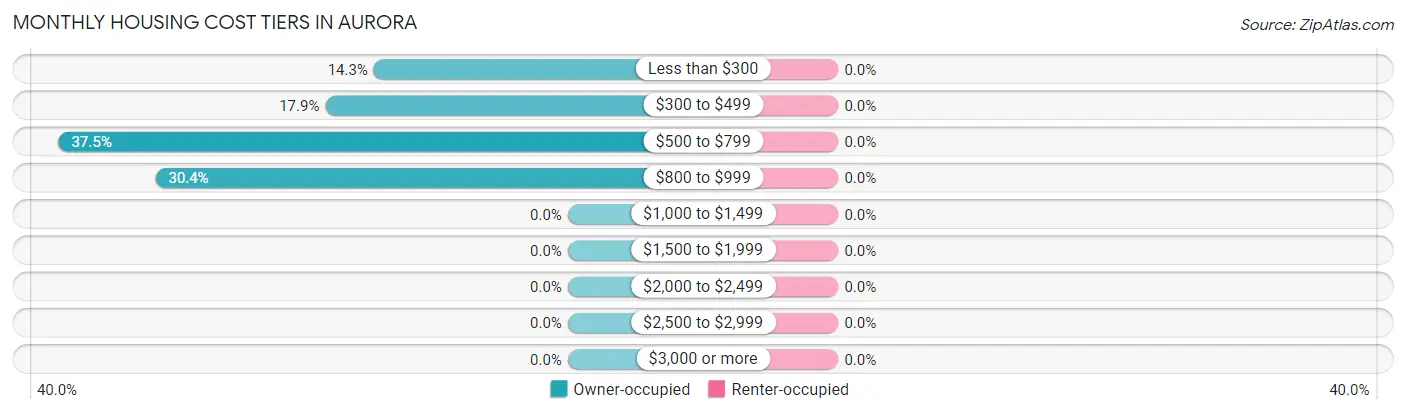
| Monthly Cost | Owner-occupied | Renter-occupied |
| Less than $300 | 8 (14.3%) | 0 (0.0%) |
| $300 to $499 | 10 (17.9%) | 0 (0.0%) |
| $500 to $799 | 21 (37.5%) | 0 (0.0%) |
| $800 to $999 | 17 (30.4%) | 0 (0.0%) |
| $1,000 to $1,499 | 0 (0.0%) | 0 (0.0%) |
| $1,500 to $1,999 | 0 (0.0%) | 0 (0.0%) |
| $2,000 to $2,499 | 0 (0.0%) | 0 (0.0%) |
| $2,500 to $2,999 | 0 (0.0%) | 0 (0.0%) |
| $3,000 or more | 0 (0.0%) | 0 (0.0%) |
| Total | 56 (100.0%) | 51 (100.0%) |
Physical Housing Characteristics in Aurora
Housing Structures in Aurora
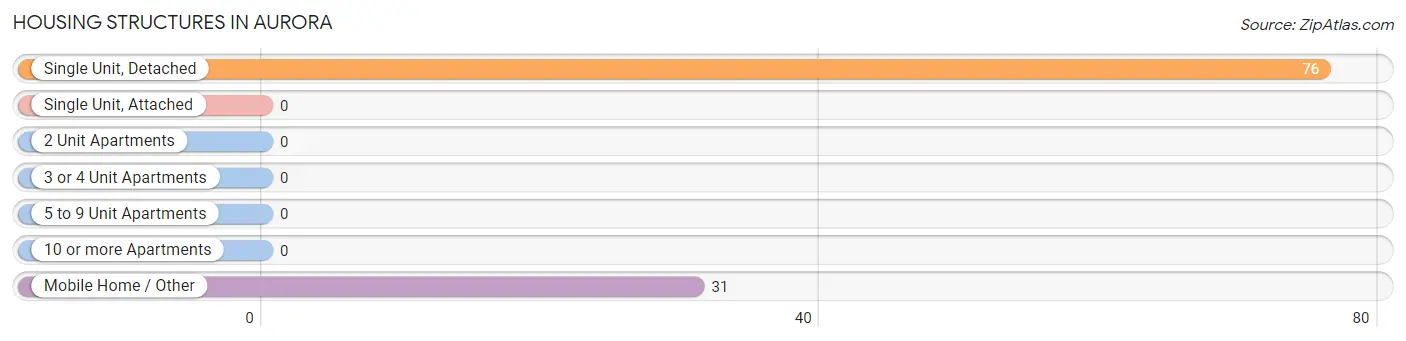
| Structure Type | # Housing Units | % Housing Units |
| Single Unit, Detached | 76 | 71.0% |
| Single Unit, Attached | 0 | 0.0% |
| 2 Unit Apartments | 0 | 0.0% |
| 3 or 4 Unit Apartments | 0 | 0.0% |
| 5 to 9 Unit Apartments | 0 | 0.0% |
| 10 or more Apartments | 0 | 0.0% |
| Mobile Home / Other | 31 | 29.0% |
| Total | 107 | 100.0% |
Housing Structures by Occupancy in Aurora
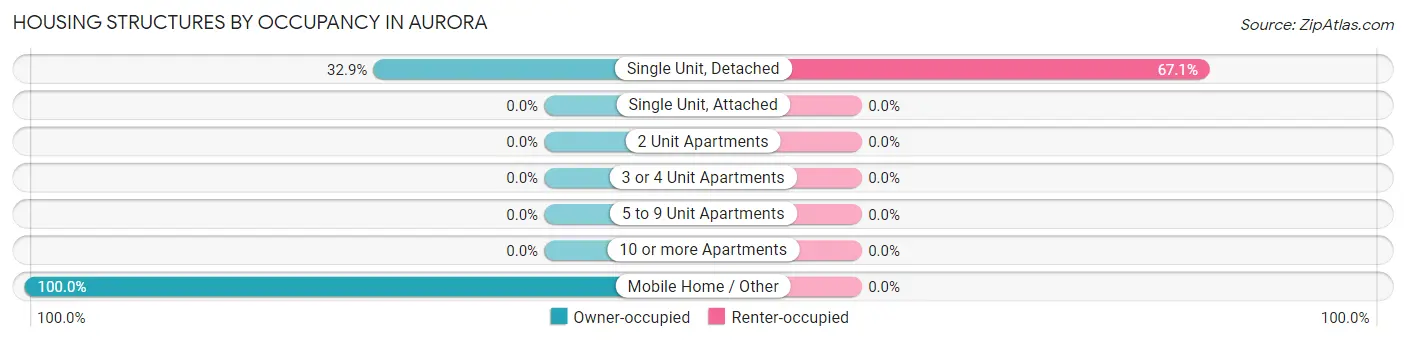
| Structure Type | Owner-occupied | Renter-occupied |
| Single Unit, Detached | 25 (32.9%) | 51 (67.1%) |
| Single Unit, Attached | 0 (0.0%) | 0 (0.0%) |
| 2 Unit Apartments | 0 (0.0%) | 0 (0.0%) |
| 3 or 4 Unit Apartments | 0 (0.0%) | 0 (0.0%) |
| 5 to 9 Unit Apartments | 0 (0.0%) | 0 (0.0%) |
| 10 or more Apartments | 0 (0.0%) | 0 (0.0%) |
| Mobile Home / Other | 31 (100.0%) | 0 (0.0%) |
| Total | 56 (52.3%) | 51 (47.7%) |
Housing Structures by Number of Rooms in Aurora
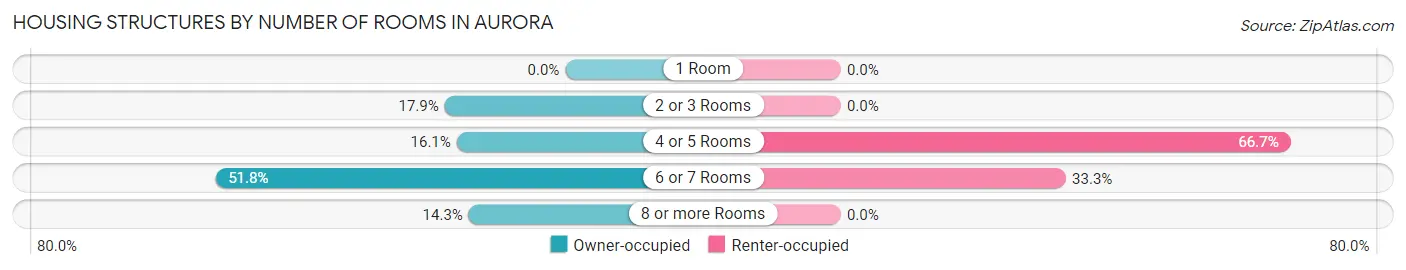
| Number of Rooms | Owner-occupied | Renter-occupied |
| 1 Room | 0 (0.0%) | 0 (0.0%) |
| 2 or 3 Rooms | 10 (17.9%) | 0 (0.0%) |
| 4 or 5 Rooms | 9 (16.1%) | 34 (66.7%) |
| 6 or 7 Rooms | 29 (51.8%) | 17 (33.3%) |
| 8 or more Rooms | 8 (14.3%) | 0 (0.0%) |
| Total | 56 (100.0%) | 51 (100.0%) |
Housing Structure by Heating Type in Aurora
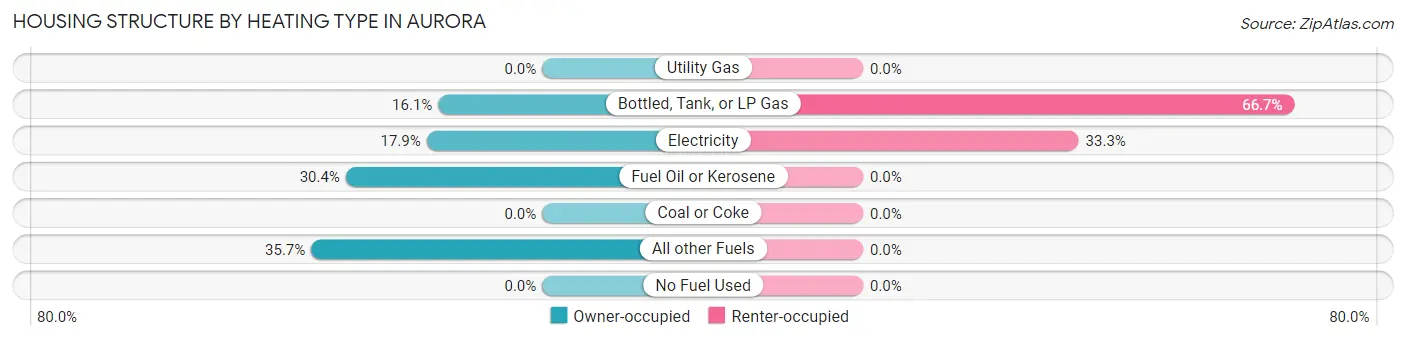
| Heating Type | Owner-occupied | Renter-occupied |
| Utility Gas | 0 (0.0%) | 0 (0.0%) |
| Bottled, Tank, or LP Gas | 9 (16.1%) | 34 (66.7%) |
| Electricity | 10 (17.9%) | 17 (33.3%) |
| Fuel Oil or Kerosene | 17 (30.4%) | 0 (0.0%) |
| Coal or Coke | 0 (0.0%) | 0 (0.0%) |
| All other Fuels | 20 (35.7%) | 0 (0.0%) |
| No Fuel Used | 0 (0.0%) | 0 (0.0%) |
| Total | 56 (100.0%) | 51 (100.0%) |
Household Vehicle Usage in Aurora
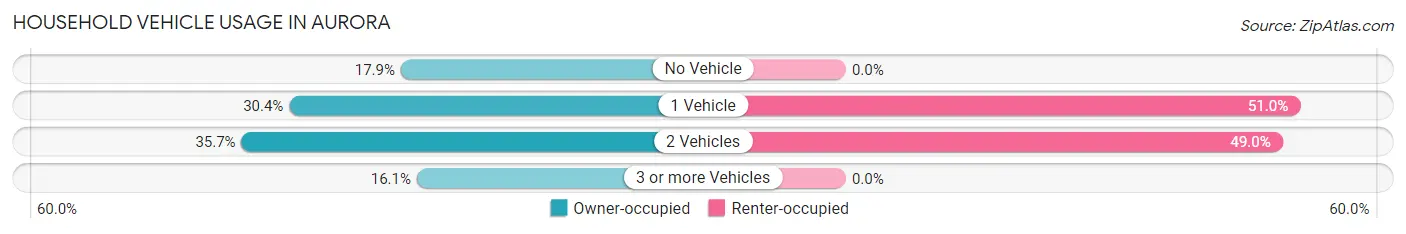
| Vehicles per Household | Owner-occupied | Renter-occupied |
| No Vehicle | 10 (17.9%) | 0 (0.0%) |
| 1 Vehicle | 17 (30.4%) | 26 (51.0%) |
| 2 Vehicles | 20 (35.7%) | 25 (49.0%) |
| 3 or more Vehicles | 9 (16.1%) | 0 (0.0%) |
| Total | 56 (100.0%) | 51 (100.0%) |
Real Estate & Mortgages in Aurora
Real Estate and Mortgage Overview in Aurora
| Characteristic | Without Mortgage | With Mortgage |
| Housing Units | 8 | 48 |
| Median Property Value | - | - |
| Median Household Income | - | - |
| Monthly Housing Costs | - | - |
| Real Estate Taxes | - | - |
Property Value by Mortgage Status in Aurora
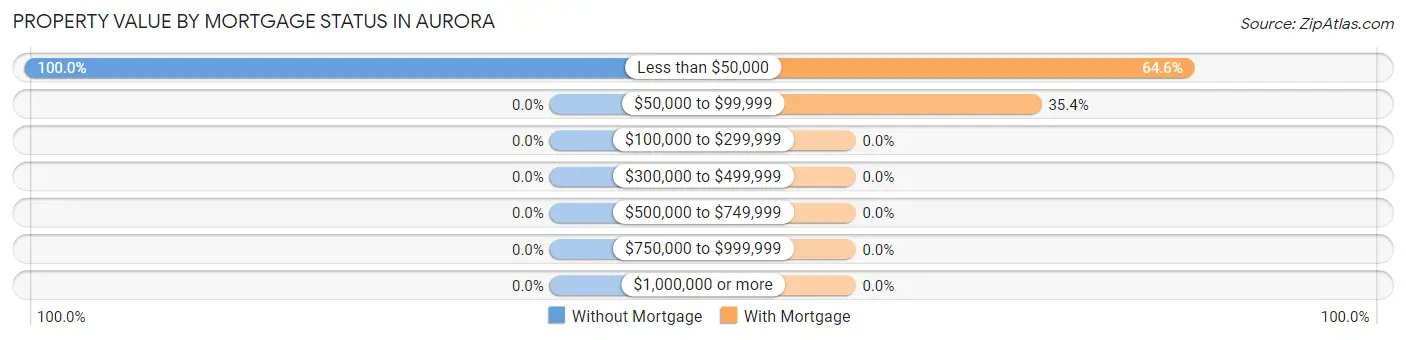
| Property Value | Without Mortgage | With Mortgage |
| Less than $50,000 | 8 (100.0%) | 31 (64.6%) |
| $50,000 to $99,999 | 0 (0.0%) | 17 (35.4%) |
| $100,000 to $299,999 | 0 (0.0%) | 0 (0.0%) |
| $300,000 to $499,999 | 0 (0.0%) | 0 (0.0%) |
| $500,000 to $749,999 | 0 (0.0%) | 0 (0.0%) |
| $750,000 to $999,999 | 0 (0.0%) | 0 (0.0%) |
| $1,000,000 or more | 0 (0.0%) | 0 (0.0%) |
| Total | 8 (100.0%) | 48 (100.0%) |
Household Income by Mortgage Status in Aurora
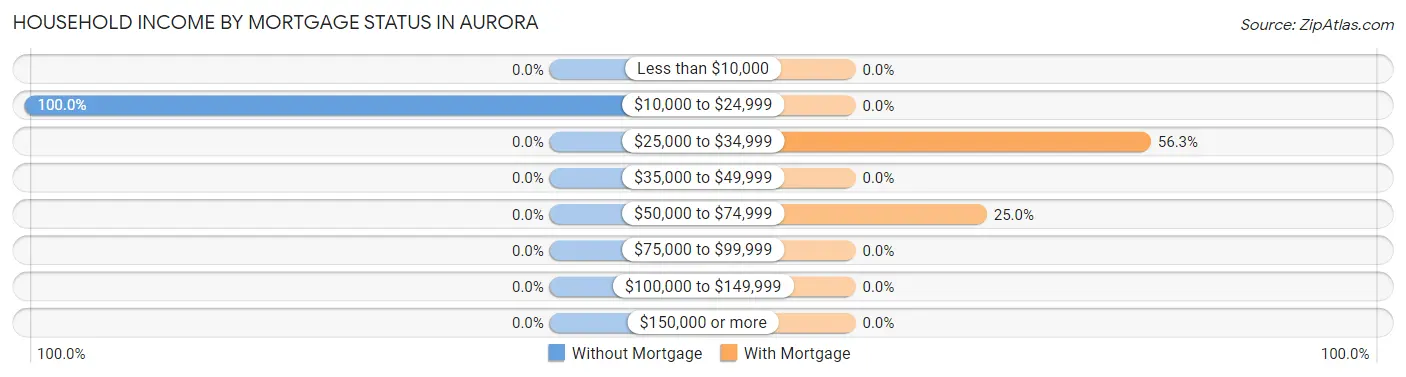
| Household Income | Without Mortgage | With Mortgage |
| Less than $10,000 | 0 (0.0%) | 0 (0.0%) |
| $10,000 to $24,999 | 8 (100.0%) | 0 (0.0%) |
| $25,000 to $34,999 | 0 (0.0%) | 27 (56.2%) |
| $35,000 to $49,999 | 0 (0.0%) | 0 (0.0%) |
| $50,000 to $74,999 | 0 (0.0%) | 12 (25.0%) |
| $75,000 to $99,999 | 0 (0.0%) | 0 (0.0%) |
| $100,000 to $149,999 | 0 (0.0%) | 0 (0.0%) |
| $150,000 or more | 0 (0.0%) | 0 (0.0%) |
| Total | 8 (100.0%) | 48 (100.0%) |
Property Value to Household Income Ratio in Aurora
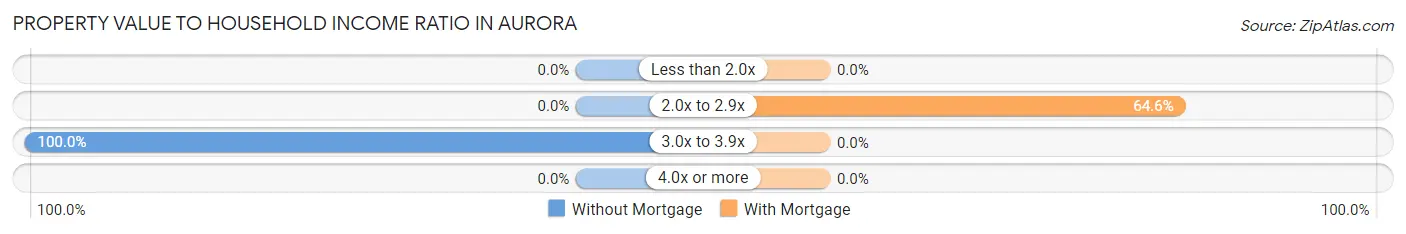
| Value-to-Income Ratio | Without Mortgage | With Mortgage |
| Less than 2.0x | 0 (0.0%) | 0 (0.0%) |
| 2.0x to 2.9x | 0 (0.0%) | 31 (64.6%) |
| 3.0x to 3.9x | 8 (100.0%) | 0 (0.0%) |
| 4.0x or more | 0 (0.0%) | 0 (0.0%) |
| Total | 8 (100.0%) | 48 (100.0%) |
Real Estate Taxes by Mortgage Status in Aurora
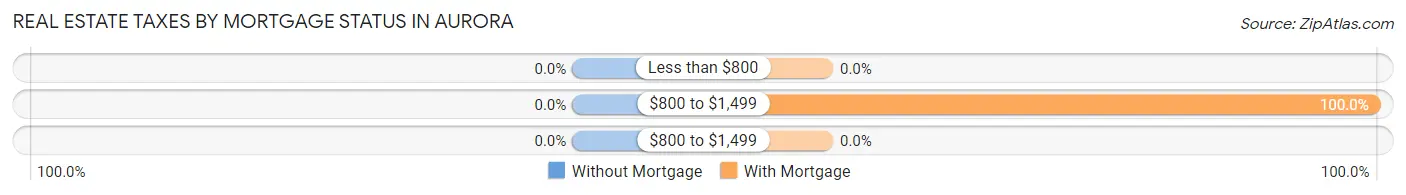
| Property Taxes | Without Mortgage | With Mortgage |
| Less than $800 | 0 (0.0%) | 0 (0.0%) |
| $800 to $1,499 | 0 (0.0%) | 48 (100.0%) |
| $800 to $1,499 | 0 (0.0%) | 0 (0.0%) |
| Total | 8 (100.0%) | 48 (100.0%) |
Health & Disability in Aurora
Health Insurance Coverage by Age in Aurora
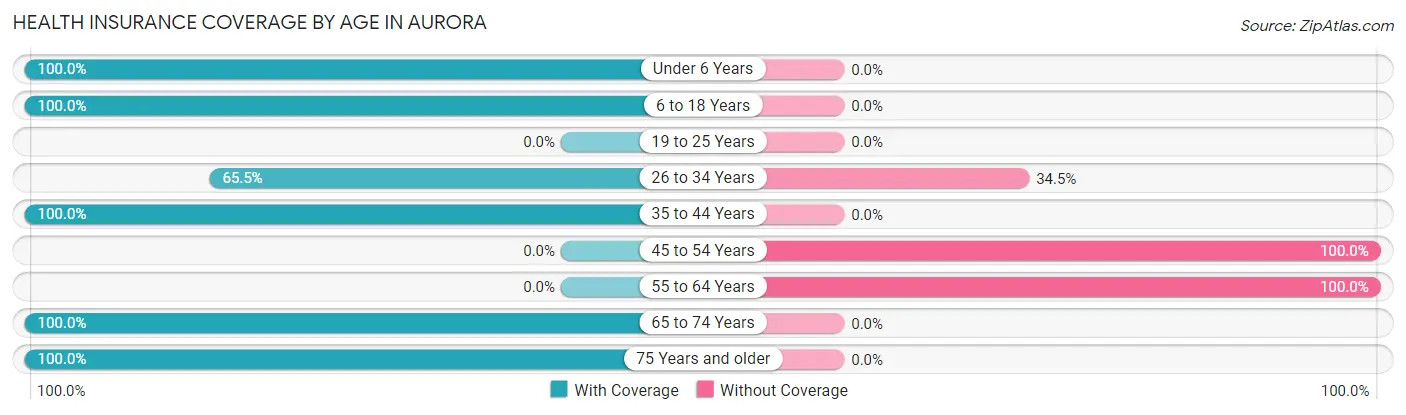
| Age Bracket | With Coverage | Without Coverage |
| Under 6 Years | 21 (100.0%) | 0 (0.0%) |
| 6 to 18 Years | 40 (100.0%) | 0 (0.0%) |
| 19 to 25 Years | 0 (0.0%) | 0 (0.0%) |
| 26 to 34 Years | 19 (65.5%) | 10 (34.5%) |
| 35 to 44 Years | 79 (100.0%) | 0 (0.0%) |
| 45 to 54 Years | 0 (0.0%) | 7 (100.0%) |
| 55 to 64 Years | 0 (0.0%) | 8 (100.0%) |
| 65 to 74 Years | 25 (100.0%) | 0 (0.0%) |
| 75 Years and older | 41 (100.0%) | 0 (0.0%) |
| Total | 225 (90.0%) | 25 (10.0%) |
Health Insurance Coverage by Citizenship Status in Aurora
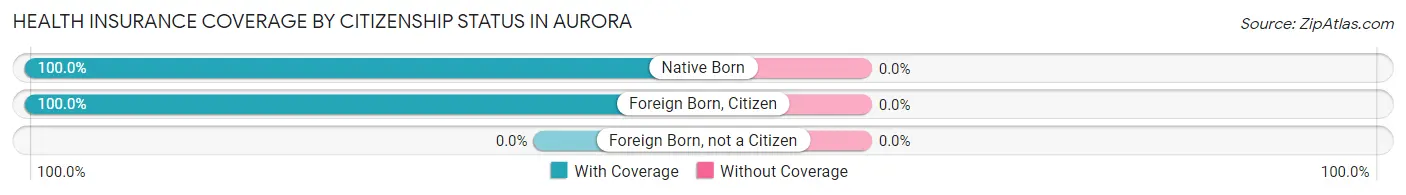
| Citizenship Status | With Coverage | Without Coverage |
| Native Born | 21 (100.0%) | 0 (0.0%) |
| Foreign Born, Citizen | 40 (100.0%) | 0 (0.0%) |
| Foreign Born, not a Citizen | 0 (0.0%) | 0 (0.0%) |
Health Insurance Coverage by Household Income in Aurora
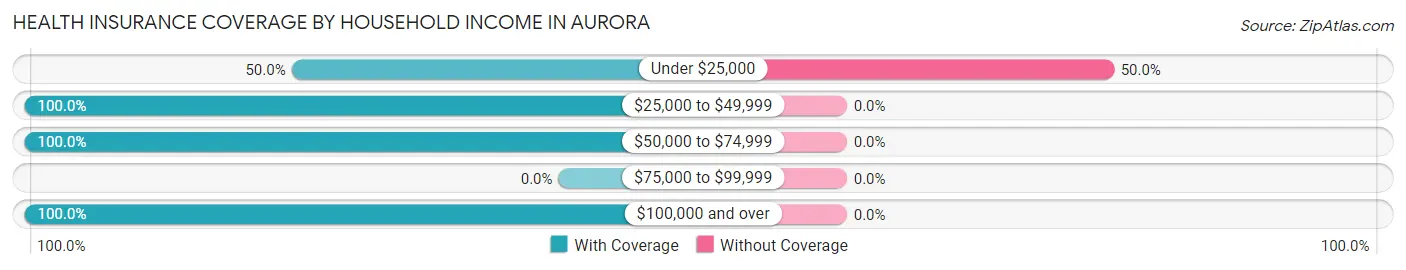
| Household Income | With Coverage | Without Coverage |
| Under $25,000 | 25 (50.0%) | 25 (50.0%) |
| $25,000 to $49,999 | 27 (100.0%) | 0 (0.0%) |
| $50,000 to $74,999 | 66 (100.0%) | 0 (0.0%) |
| $75,000 to $99,999 | 0 (0.0%) | 0 (0.0%) |
| $100,000 and over | 107 (100.0%) | 0 (0.0%) |
Public vs Private Health Insurance Coverage by Age in Aurora
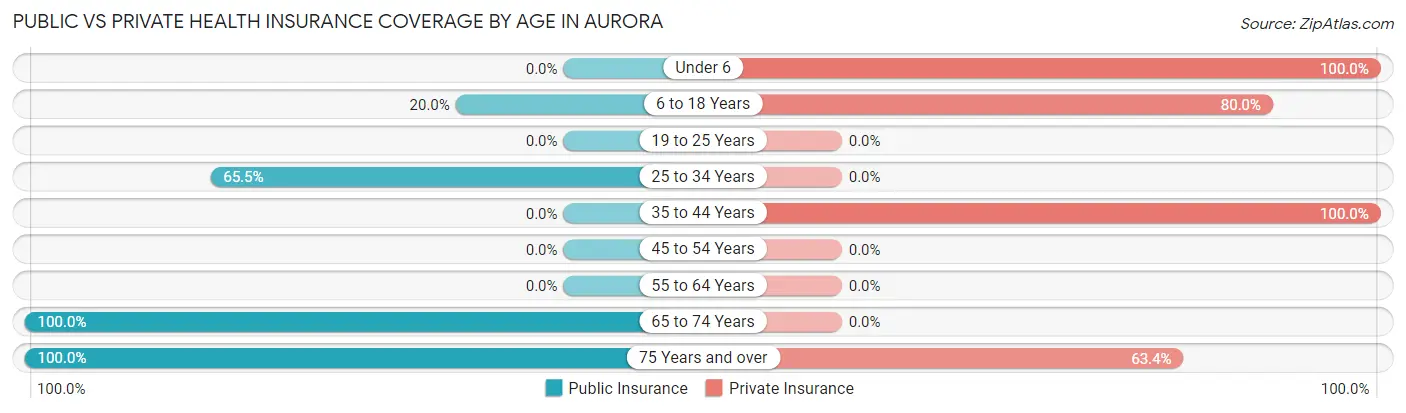
| Age Bracket | Public Insurance | Private Insurance |
| Under 6 | 0 (0.0%) | 21 (100.0%) |
| 6 to 18 Years | 8 (20.0%) | 32 (80.0%) |
| 19 to 25 Years | 0 (0.0%) | 0 (0.0%) |
| 25 to 34 Years | 19 (65.5%) | 0 (0.0%) |
| 35 to 44 Years | 0 (0.0%) | 79 (100.0%) |
| 45 to 54 Years | 0 (0.0%) | 0 (0.0%) |
| 55 to 64 Years | 0 (0.0%) | 0 (0.0%) |
| 65 to 74 Years | 25 (100.0%) | 0 (0.0%) |
| 75 Years and over | 41 (100.0%) | 26 (63.4%) |
| Total | 93 (37.2%) | 158 (63.2%) |
Disability Status by Sex by Age in Aurora
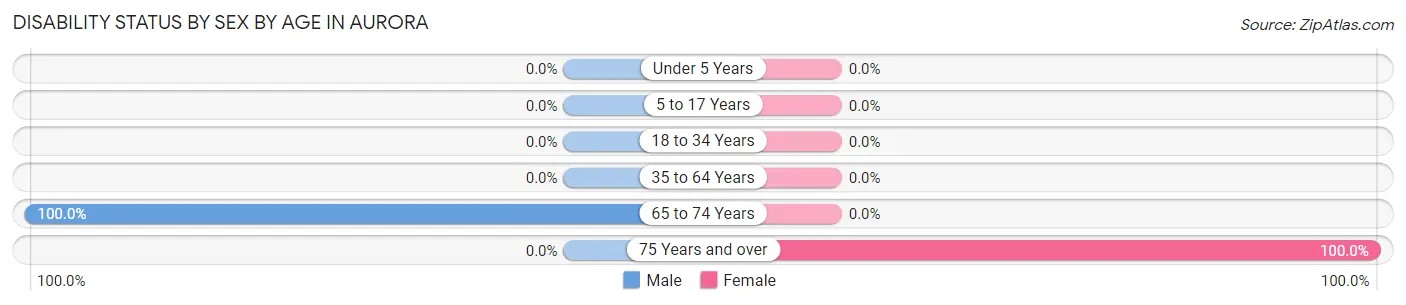
| Age Bracket | Male | Female |
| Under 5 Years | 0 (0.0%) | 0 (0.0%) |
| 5 to 17 Years | 0 (0.0%) | 0 (0.0%) |
| 18 to 34 Years | 0 (0.0%) | 0 (0.0%) |
| 35 to 64 Years | 0 (0.0%) | 0 (0.0%) |
| 65 to 74 Years | 8 (100.0%) | 0 (0.0%) |
| 75 Years and over | 0 (0.0%) | 7 (100.0%) |
Disability Class by Sex by Age in Aurora
Disability Class: Hearing Difficulty

| Age Bracket | Male | Female |
| Under 5 Years | 0 (0.0%) | 0 (0.0%) |
| 5 to 17 Years | 0 (0.0%) | 0 (0.0%) |
| 18 to 34 Years | 0 (0.0%) | 0 (0.0%) |
| 35 to 64 Years | 0 (0.0%) | 0 (0.0%) |
| 65 to 74 Years | 8 (100.0%) | 0 (0.0%) |
| 75 Years and over | 0 (0.0%) | 0 (0.0%) |
Disability Class: Vision Difficulty
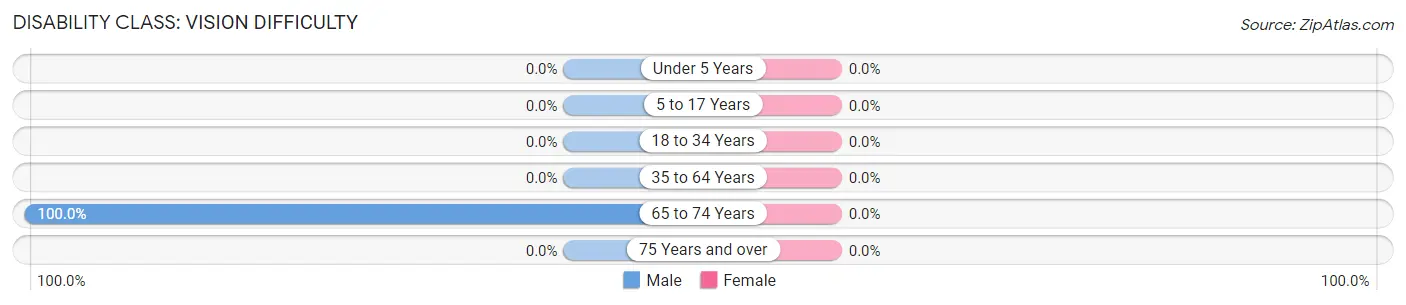
| Age Bracket | Male | Female |
| Under 5 Years | 0 (0.0%) | 0 (0.0%) |
| 5 to 17 Years | 0 (0.0%) | 0 (0.0%) |
| 18 to 34 Years | 0 (0.0%) | 0 (0.0%) |
| 35 to 64 Years | 0 (0.0%) | 0 (0.0%) |
| 65 to 74 Years | 8 (100.0%) | 0 (0.0%) |
| 75 Years and over | 0 (0.0%) | 0 (0.0%) |
Disability Class: Cognitive Difficulty
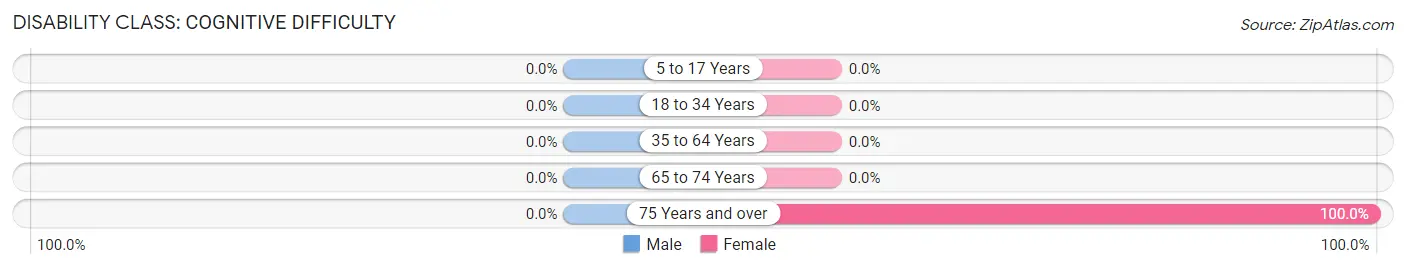
| Age Bracket | Male | Female |
| 5 to 17 Years | 0 (0.0%) | 0 (0.0%) |
| 18 to 34 Years | 0 (0.0%) | 0 (0.0%) |
| 35 to 64 Years | 0 (0.0%) | 0 (0.0%) |
| 65 to 74 Years | 0 (0.0%) | 0 (0.0%) |
| 75 Years and over | 0 (0.0%) | 7 (100.0%) |
Disability Class: Ambulatory Difficulty
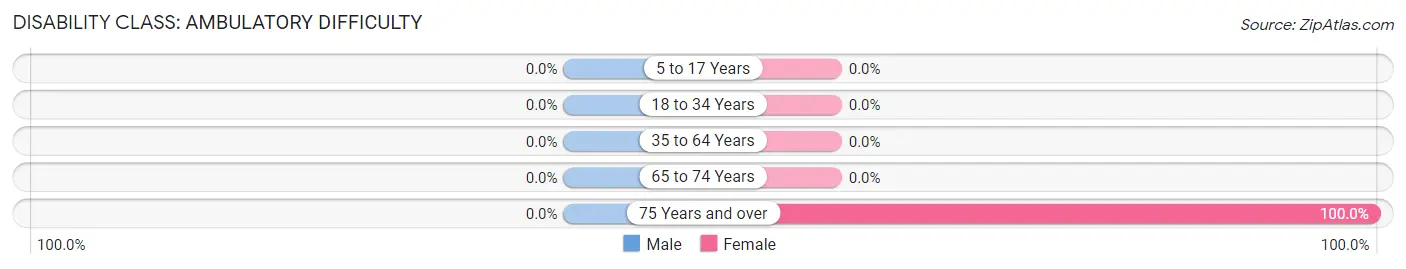
| Age Bracket | Male | Female |
| 5 to 17 Years | 0 (0.0%) | 0 (0.0%) |
| 18 to 34 Years | 0 (0.0%) | 0 (0.0%) |
| 35 to 64 Years | 0 (0.0%) | 0 (0.0%) |
| 65 to 74 Years | 0 (0.0%) | 0 (0.0%) |
| 75 Years and over | 0 (0.0%) | 7 (100.0%) |
Disability Class: Self-Care Difficulty
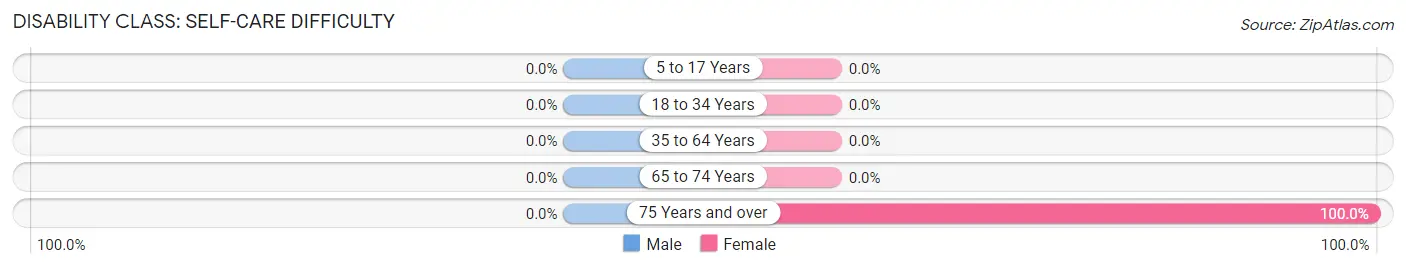
| Age Bracket | Male | Female |
| 5 to 17 Years | 0 (0.0%) | 0 (0.0%) |
| 18 to 34 Years | 0 (0.0%) | 0 (0.0%) |
| 35 to 64 Years | 0 (0.0%) | 0 (0.0%) |
| 65 to 74 Years | 0 (0.0%) | 0 (0.0%) |
| 75 Years and over | 0 (0.0%) | 7 (100.0%) |
Technology Access in Aurora
Computing Device Access in Aurora
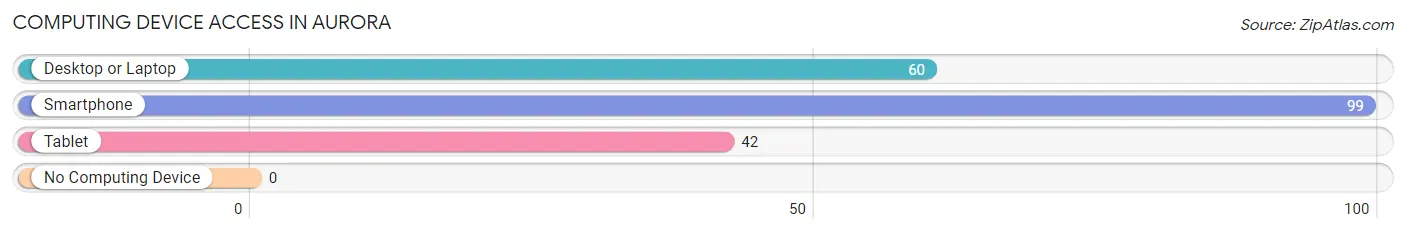
| Device Type | # Households | % Households |
| Desktop or Laptop | 60 | 56.1% |
| Smartphone | 99 | 92.5% |
| Tablet | 42 | 39.3% |
| No Computing Device | 0 | 0.0% |
| Total | 107 | 100.0% |
Internet Access in Aurora
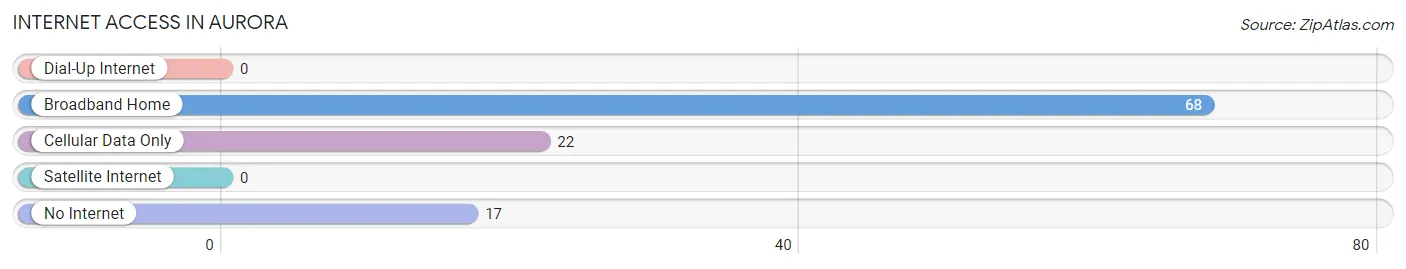
| Internet Type | # Households | % Households |
| Dial-Up Internet | 0 | 0.0% |
| Broadband Home | 68 | 63.5% |
| Cellular Data Only | 22 | 20.6% |
| Satellite Internet | 0 | 0.0% |
| No Internet | 17 | 15.9% |
| Total | 107 | 100.0% |
Aurora Summary
Aurora, West Virginia is a small town located in Preston County, West Virginia. It is situated in the Appalachian Mountains and is part of the Morgantown Metropolitan Statistical Area. The town has a population of approximately 1,000 people and is known for its rural charm and scenic beauty.
Geography
Aurora is located in the northern part of Preston County, West Virginia, in the Appalachian Mountains. It is situated at an elevation of 1,890 feet above sea level. The town is surrounded by the Cheat River to the north, the Monongahela River to the east, and the Tygart Valley River to the south. The town is located approximately 30 miles south of Morgantown, West Virginia, and is accessible by US Route 50.
Climate
Aurora has a humid continental climate, with cold winters and hot summers. The average annual temperature is 52°F, with an average high of 73°F in the summer and an average low of 32°F in the winter. The average annual precipitation is 40 inches, with an average of 4 inches of snowfall per year.
Demographics
As of the 2010 census, Aurora had a population of 1,000 people. The racial makeup of the town was 97.2% White, 0.7% African American, 0.2% Native American, 0.2% Asian, 0.2% from other races, and 1.7% from two or more races. Hispanic or Latino of any race were 0.7% of the population.
Economy
Aurora’s economy is largely based on agriculture and tourism. The town is home to several small businesses, including a grocery store, a hardware store, and a few restaurants. The town also has a few small manufacturing companies, including a furniture factory and a woodworking shop.
The town is also home to several tourist attractions, including the Aurora Fossil Museum, the Aurora Historical Society, and the Aurora Railroad Museum. The town is also home to several outdoor recreation areas, including the Aurora State Park and the Aurora Wildlife Management Area.
History
Aurora was founded in 1817 by a group of settlers from Pennsylvania. The town was named after Aurora, the Roman goddess of the dawn. The town was originally a farming community, but it soon became a center for the timber and coal industries. The town was also home to several glass factories, which produced glassware for the local market.
In the late 19th century, the town began to decline as the coal and timber industries moved away. The town was revitalized in the early 20th century with the arrival of the railroad. The railroad brought new industry and jobs to the town, and it also allowed for the development of tourism in the area.
Today, Aurora is a small town with a population of approximately 1,000 people. The town is known for its rural charm and scenic beauty, and it is a popular destination for tourists and outdoor enthusiasts.
Common Questions
What is Per Capita Income in Aurora?
Per Capita income in Aurora is $25,547.
What is the Median Family Income in Aurora?
Median Family Income in Aurora is $53,603.
What is the Median Household income in Aurora?
Median Household Income in Aurora is $52,978.
What is Inequality or Gini Index in Aurora?
Inequality or Gini Index in Aurora is 0.43.
What is the Total Population of Aurora?
Total Population of Aurora is 250.
What is the Total Male Population of Aurora?
Total Male Population of Aurora is 140.
What is the Total Female Population of Aurora?
Total Female Population of Aurora is 110.
What is the Ratio of Males per 100 Females in Aurora?
There are 127.27 Males per 100 Females in Aurora.
What is the Ratio of Females per 100 Males in Aurora?
There are 78.57 Females per 100 Males in Aurora.
What is the Median Population Age in Aurora?
Median Population Age in Aurora is 37.5 Years.
What is the Average Family Size in Aurora
Average Family Size in Aurora is 2.6 People.
What is the Average Household Size in Aurora
Average Household Size in Aurora is 2.3 People.
How Large is the Labor Force in Aurora?
There are 93 People in the Labor Forcein in Aurora.
What is the Percentage of People in the Labor Force in Aurora?
49.2% of People are in the Labor Force in Aurora.