Athens, WV Map & Demographics
Athens Map
Athens Overview
$20,639
PER CAPITA INCOME
$66,250
AVG FAMILY INCOME
$61,667
AVG HOUSEHOLD INCOME
0.37
INEQUALITY / GINI INDEX
1,146
TOTAL POPULATION
544
MALE POPULATION
602
FEMALE POPULATION
90.37
MALES / 100 FEMALES
110.66
FEMALES / 100 MALES
24.5
MEDIAN AGE
3.4
AVG FAMILY SIZE
3.4
AVG HOUSEHOLD SIZE
451
LABOR FORCE [ PEOPLE ]
48.2%
PERCENT IN LABOR FORCE
10.2%
UNEMPLOYMENT RATE
Athens Zip Codes
Athens Area Codes
Income in Athens
Income Overview in Athens
Per Capita Income in Athens is $20,639, while median incomes of families and households are $66,250 and $61,667 respectively.
| Characteristic | Number | Measure |
| Per Capita Income | 1,146 | $20,639 |
| Median Family Income | 220 | $66,250 |
| Mean Family Income | 220 | $75,632 |
| Median Household Income | 276 | $61,667 |
| Mean Household Income | 276 | $80,697 |
| Income Deficit | 220 | $0 |
| Wage / Income Gap (%) | 1,146 | 0.00% |
| Wage / Income Gap ($) | 1,146 | 100.00¢ per $1 |
| Gini / Inequality Index | 1,146 | 0.37 |
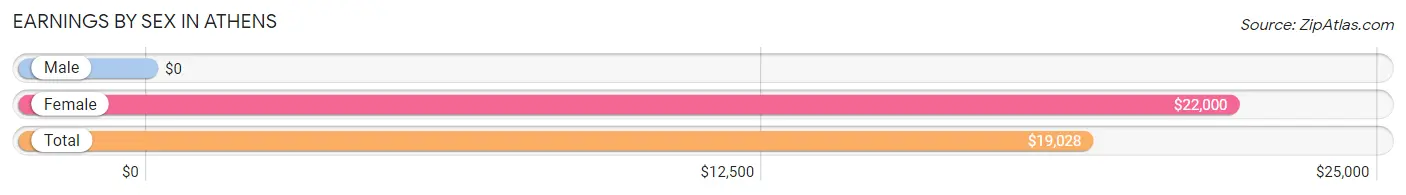
Earnings by Sex in Athens
| Sex | Number | Average Earnings |
| Male | 283 (55.2%) | $0 |
| Female | 230 (44.8%) | $22,000 |
| Total | 513 (100.0%) | $19,028 |
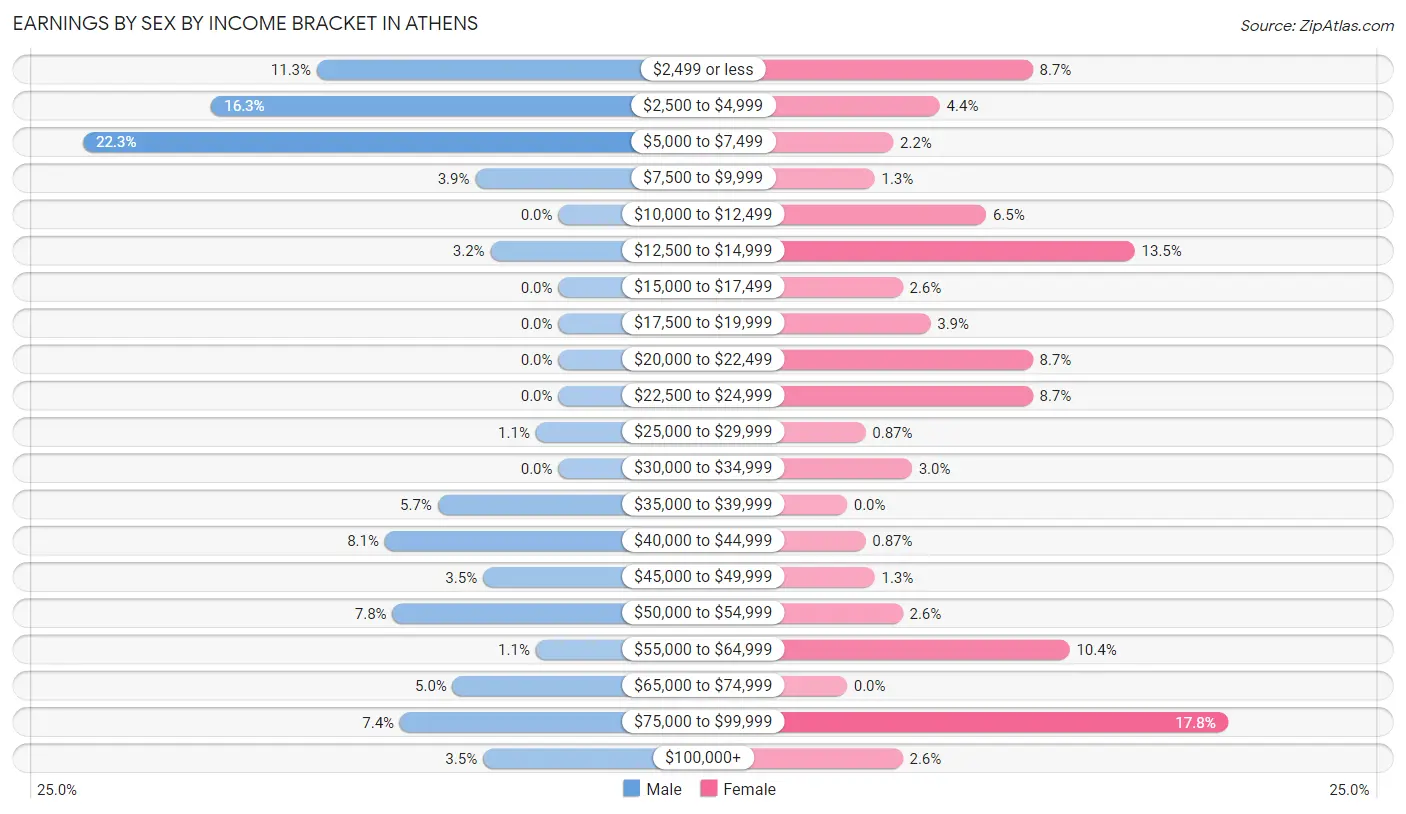
Earnings by Sex by Income Bracket in Athens
The most common earnings brackets in Athens are $5,000 to $7,499 for men (63 | 22.3%) and $75,000 to $99,999 for women (41 | 17.8%).
| Income | Male | Female |
| $2,499 or less | 32 (11.3%) | 20 (8.7%) |
| $2,500 to $4,999 | 46 (16.3%) | 10 (4.3%) |
| $5,000 to $7,499 | 63 (22.3%) | 5 (2.2%) |
| $7,500 to $9,999 | 11 (3.9%) | 3 (1.3%) |
| $10,000 to $12,499 | 0 (0.0%) | 15 (6.5%) |
| $12,500 to $14,999 | 9 (3.2%) | 31 (13.5%) |
| $15,000 to $17,499 | 0 (0.0%) | 6 (2.6%) |
| $17,500 to $19,999 | 0 (0.0%) | 9 (3.9%) |
| $20,000 to $22,499 | 0 (0.0%) | 20 (8.7%) |
| $22,500 to $24,999 | 0 (0.0%) | 20 (8.7%) |
| $25,000 to $29,999 | 3 (1.1%) | 2 (0.9%) |
| $30,000 to $34,999 | 0 (0.0%) | 7 (3.0%) |
| $35,000 to $39,999 | 16 (5.7%) | 0 (0.0%) |
| $40,000 to $44,999 | 23 (8.1%) | 2 (0.9%) |
| $45,000 to $49,999 | 10 (3.5%) | 3 (1.3%) |
| $50,000 to $54,999 | 22 (7.8%) | 6 (2.6%) |
| $55,000 to $64,999 | 3 (1.1%) | 24 (10.4%) |
| $65,000 to $74,999 | 14 (5.0%) | 0 (0.0%) |
| $75,000 to $99,999 | 21 (7.4%) | 41 (17.8%) |
| $100,000+ | 10 (3.5%) | 6 (2.6%) |
| Total | 283 (100.0%) | 230 (100.0%) |
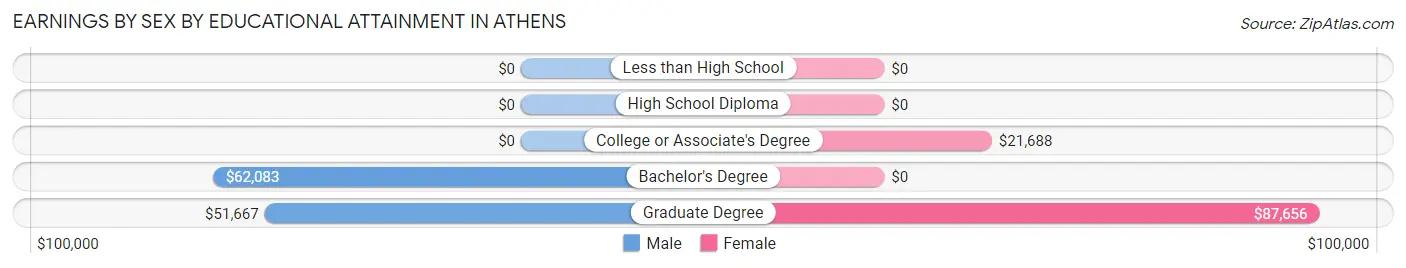
Earnings by Sex by Educational Attainment in Athens
| Educational Attainment | Male Income | Female Income |
| Less than High School | - | - |
| High School Diploma | - | - |
| College or Associate's Degree | - | - |
| Bachelor's Degree | $62,083 | $0 |
| Graduate Degree | $51,667 | $87,656 |
| Total | $43,472 | $0 |
Family Income in Athens
Family Income Brackets in Athens
According to the Athens family income data, there are 64 families falling into the $100,000 to $149,999 income range, which is the most common income bracket and makes up 29.1% of all families.
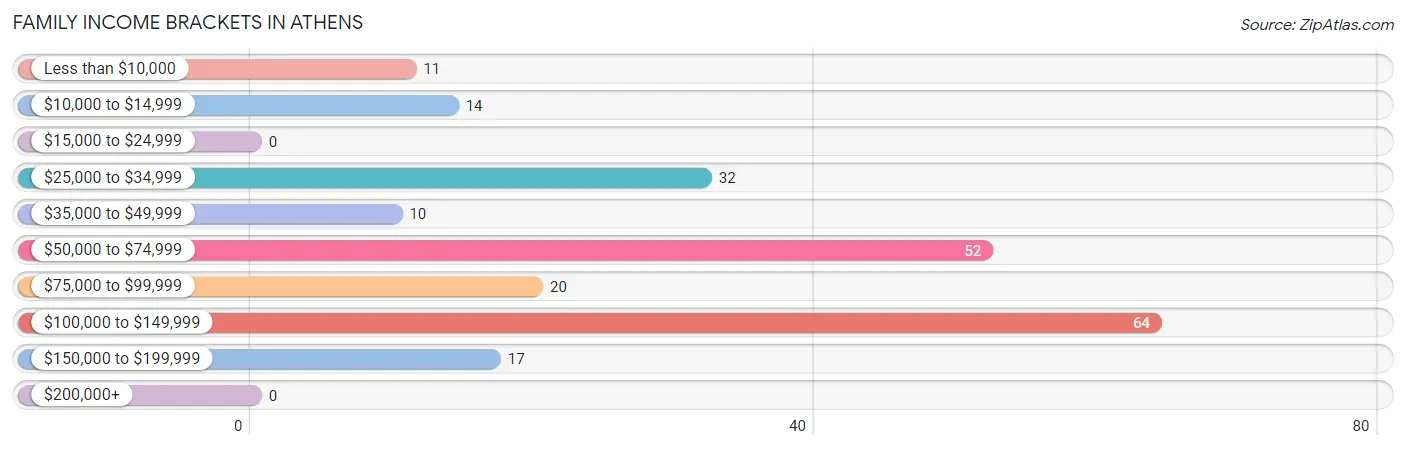
| Income Bracket | # Families | % Families |
| Less than $10,000 | 11 | 5.0% |
| $10,000 to $14,999 | 14 | 6.4% |
| $15,000 to $24,999 | 0 | 0.0% |
| $25,000 to $34,999 | 32 | 14.5% |
| $35,000 to $49,999 | 10 | 4.5% |
| $50,000 to $74,999 | 52 | 23.6% |
| $75,000 to $99,999 | 20 | 9.1% |
| $100,000 to $149,999 | 64 | 29.1% |
| $150,000 to $199,999 | 17 | 7.7% |
| $200,000+ | 0 | 0.0% |
Family Income by Famaliy Size in Athens
2-person families (121 | 55.0%) account for the highest median family income in Athens with $78,036 per family, while 2-person families (121 | 55.0%) have the highest median income of $39,018 per family member.
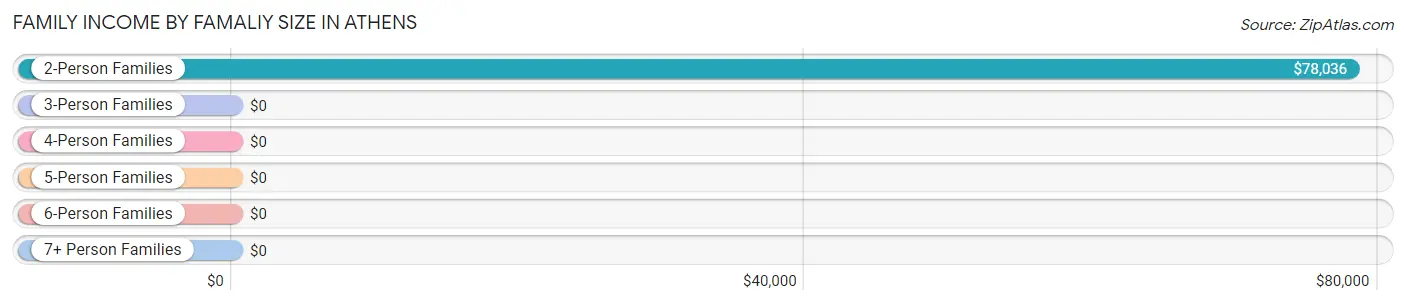
| Income Bracket | # Families | Median Income |
| 2-Person Families | 121 (55.0%) | $78,036 |
| 3-Person Families | 32 (14.5%) | $0 |
| 4-Person Families | 33 (15.0%) | $0 |
| 5-Person Families | 15 (6.8%) | $0 |
| 6-Person Families | 19 (8.6%) | $0 |
| 7+ Person Families | 0 (0.0%) | $0 |
| Total | 220 (100.0%) | $66,250 |
Family Income by Number of Earners in Athens
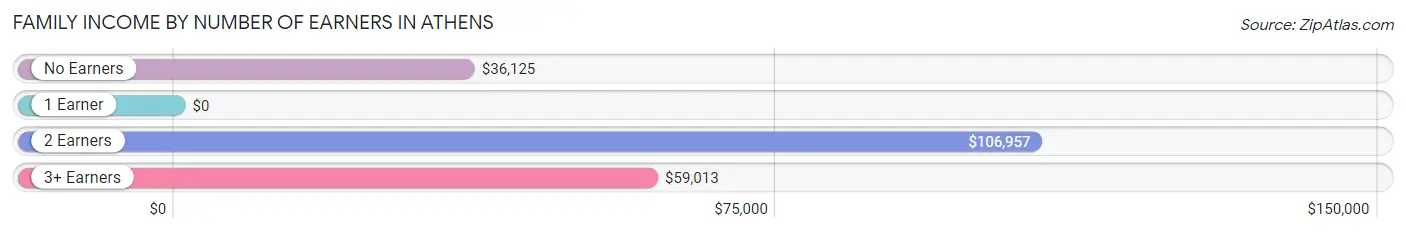
| Number of Earners | # Families | Median Income |
| No Earners | 39 (17.7%) | $36,125 |
| 1 Earner | 82 (37.3%) | $0 |
| 2 Earners | 76 (34.5%) | $106,957 |
| 3+ Earners | 23 (10.4%) | $59,013 |
| Total | 220 (100.0%) | $66,250 |
Household Income in Athens
Household Income Brackets in Athens
With 68 households falling in the category, the $100,000 to $149,999 income range is the most frequent in Athens, accounting for 24.6% of all households. In contrast, only 2 households (0.7%) fall into the $15,000 to $24,999 income bracket, making it the least populous group.
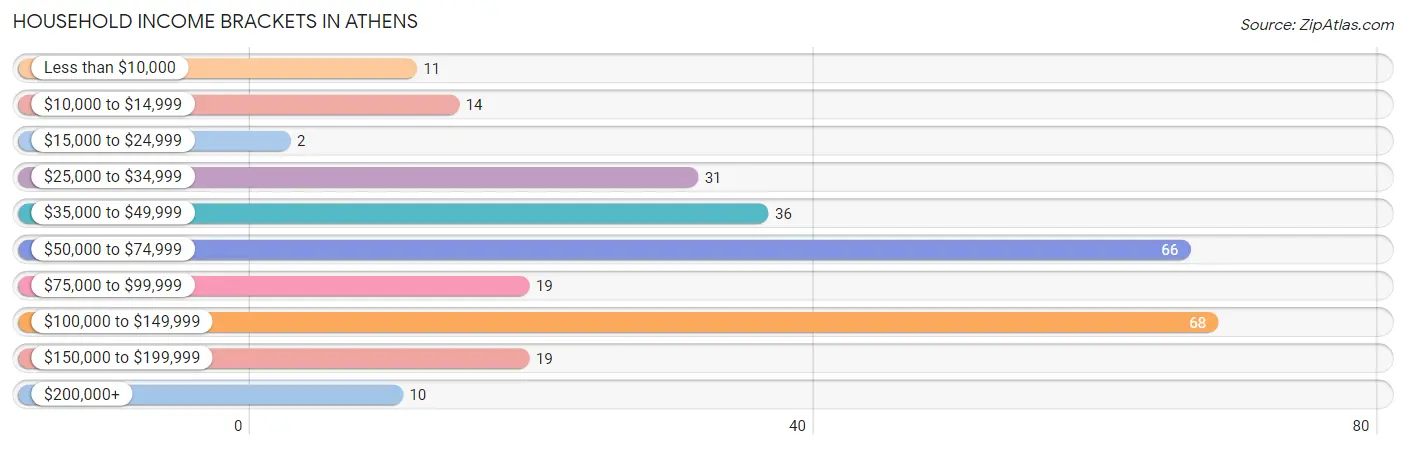
| Income Bracket | # Households | % Households |
| Less than $10,000 | 11 | 4.0% |
| $10,000 to $14,999 | 14 | 5.1% |
| $15,000 to $24,999 | 2 | 0.7% |
| $25,000 to $34,999 | 31 | 11.2% |
| $35,000 to $49,999 | 36 | 13.0% |
| $50,000 to $74,999 | 66 | 23.9% |
| $75,000 to $99,999 | 19 | 6.9% |
| $100,000 to $149,999 | 68 | 24.6% |
| $150,000 to $199,999 | 19 | 6.9% |
| $200,000+ | 10 | 3.6% |
Household Income by Householder Age in Athens
The median household income in Athens is $61,667, with the highest median household income of $106,346 found in the 45 to 64 years age bracket for the primary householder. A total of 126 households (45.7%) fall into this category. Meanwhile, the 15 to 24 years age bracket for the primary householder has the lowest median household income of $0, with 13 households (4.7%) in this group.
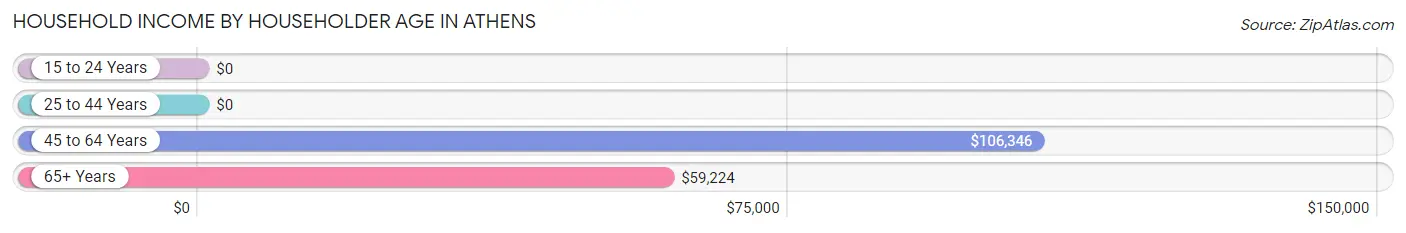
| Income Bracket | # Households | Median Income |
| 15 to 24 Years | 13 (4.7%) | $0 |
| 25 to 44 Years | 51 (18.5%) | $0 |
| 45 to 64 Years | 126 (45.7%) | $106,346 |
| 65+ Years | 86 (31.2%) | $59,224 |
| Total | 276 (100.0%) | $61,667 |
Poverty in Athens
Income Below Poverty by Sex and Age in Athens
With 14.0% poverty level for males and 9.7% for females among the residents of Athens, 16 and 17 year old males and 15 year old females are the most vulnerable to poverty, with 7 males (100.0%) and 3 females (100.0%) in their respective age groups living below the poverty level.
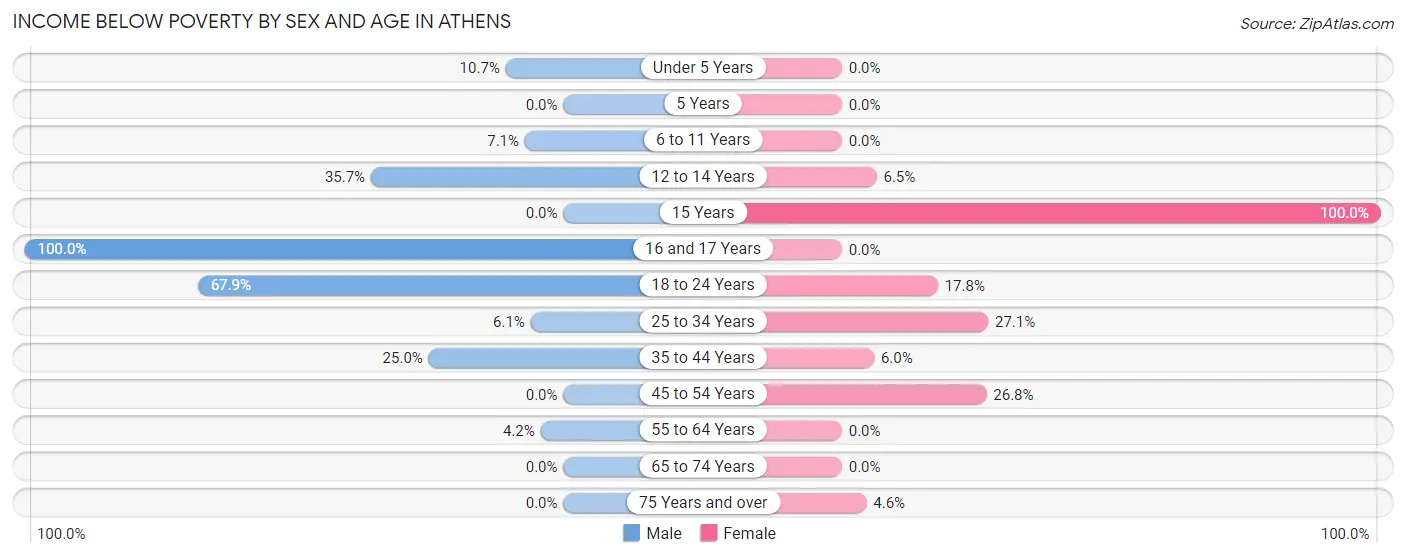
| Age Bracket | Male | Female |
| Under 5 Years | 3 (10.7%) | 0 (0.0%) |
| 5 Years | 0 (0.0%) | 0 (0.0%) |
| 6 to 11 Years | 2 (7.1%) | 0 (0.0%) |
| 12 to 14 Years | 5 (35.7%) | 4 (6.5%) |
| 15 Years | 0 (0.0%) | 3 (100.0%) |
| 16 and 17 Years | 7 (100.0%) | 0 (0.0%) |
| 18 to 24 Years | 19 (67.9%) | 13 (17.8%) |
| 25 to 34 Years | 2 (6.1%) | 19 (27.1%) |
| 35 to 44 Years | 5 (25.0%) | 4 (6.0%) |
| 45 to 54 Years | 0 (0.0%) | 11 (26.8%) |
| 55 to 64 Years | 3 (4.2%) | 0 (0.0%) |
| 65 to 74 Years | 0 (0.0%) | 0 (0.0%) |
| 75 Years and over | 0 (0.0%) | 2 (4.5%) |
| Total | 46 (14.0%) | 56 (9.7%) |
Income Above Poverty by Sex and Age in Athens
According to the poverty statistics in Athens, males aged 45 to 54 years and females aged under 5 years are the age groups that are most secure financially, with 100.0% of males and 100.0% of females in these age groups living above the poverty line.
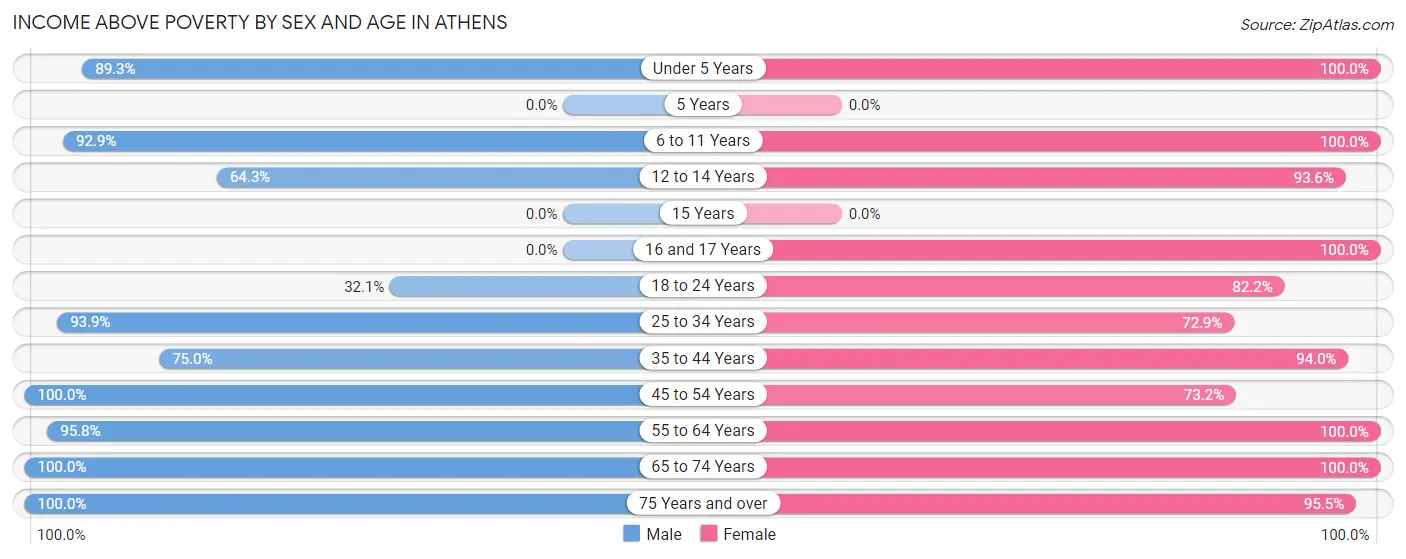
| Age Bracket | Male | Female |
| Under 5 Years | 25 (89.3%) | 14 (100.0%) |
| 5 Years | 0 (0.0%) | 0 (0.0%) |
| 6 to 11 Years | 26 (92.9%) | 23 (100.0%) |
| 12 to 14 Years | 9 (64.3%) | 58 (93.5%) |
| 15 Years | 0 (0.0%) | 0 (0.0%) |
| 16 and 17 Years | 0 (0.0%) | 55 (100.0%) |
| 18 to 24 Years | 9 (32.1%) | 60 (82.2%) |
| 25 to 34 Years | 31 (93.9%) | 51 (72.9%) |
| 35 to 44 Years | 15 (75.0%) | 63 (94.0%) |
| 45 to 54 Years | 49 (100.0%) | 30 (73.2%) |
| 55 to 64 Years | 68 (95.8%) | 55 (100.0%) |
| 65 to 74 Years | 29 (100.0%) | 70 (100.0%) |
| 75 Years and over | 22 (100.0%) | 42 (95.5%) |
| Total | 283 (86.0%) | 521 (90.3%) |
Income Below Poverty Among Married-Couple Families in Athens
The poverty statistics for married-couple families in Athens show that 4.2% or 6 of the total 144 families live below the poverty line. Families with 3 or 4 children have the highest poverty rate of 100.0%, comprising of 6 families. On the other hand, families with no children have the lowest poverty rate of 0.0%, which includes 0 families.
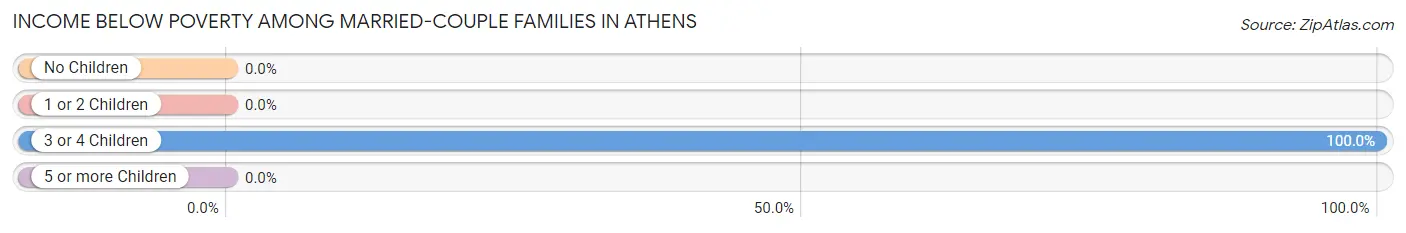
| Children | Above Poverty | Below Poverty |
| No Children | 93 (100.0%) | 0 (0.0%) |
| 1 or 2 Children | 45 (100.0%) | 0 (0.0%) |
| 3 or 4 Children | 0 (0.0%) | 6 (100.0%) |
| 5 or more Children | 0 (0.0%) | 0 (0.0%) |
| Total | 138 (95.8%) | 6 (4.2%) |
Income Below Poverty Among Single-Parent Households in Athens
According to the poverty data in Athens, 30.0% or 6 single-father households and 23.2% or 13 single-mother households are living below the poverty line. Among single-father households, those with no children have the highest poverty rate, with 6 households (75.0%) experiencing poverty. Likewise, among single-mother households, those with no children have the highest poverty rate, with 10 households (29.4%) falling below the poverty line.
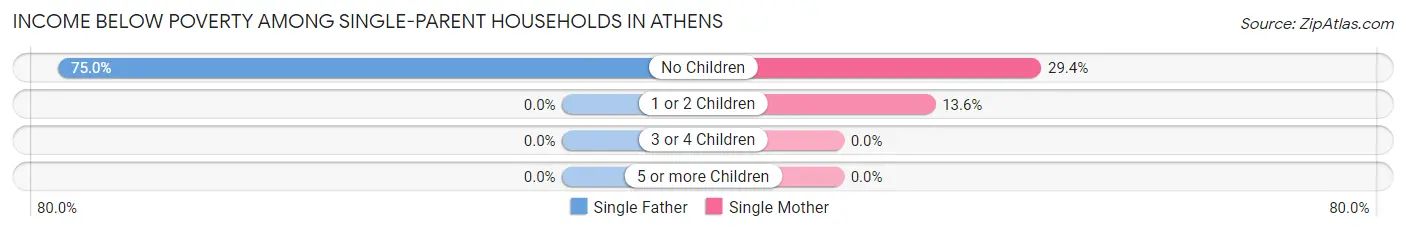
| Children | Single Father | Single Mother |
| No Children | 6 (75.0%) | 10 (29.4%) |
| 1 or 2 Children | 0 (0.0%) | 3 (13.6%) |
| 3 or 4 Children | 0 (0.0%) | 0 (0.0%) |
| 5 or more Children | 0 (0.0%) | 0 (0.0%) |
| Total | 6 (30.0%) | 13 (23.2%) |
Income Below Poverty Among Married-Couple vs Single-Parent Households in Athens
The poverty data for Athens shows that 6 of the married-couple family households (4.2%) and 19 of the single-parent households (25.0%) are living below the poverty level. Within the married-couple family households, those with 3 or 4 children have the highest poverty rate, with 6 households (100.0%) falling below the poverty line. Among the single-parent households, those with no children have the highest poverty rate, with 16 household (38.1%) living below poverty.
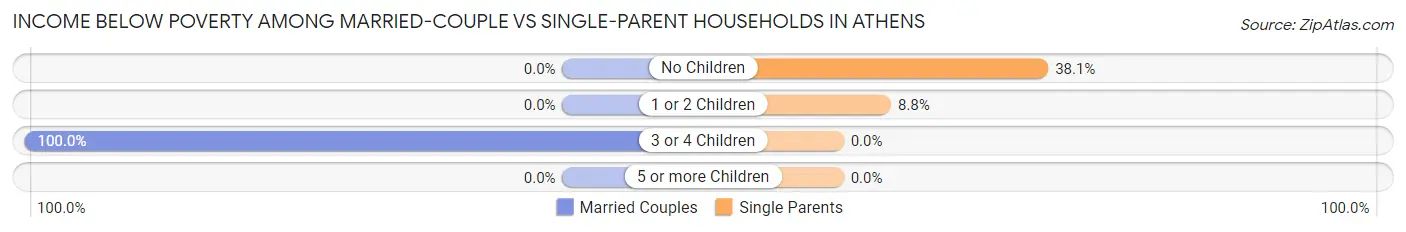
| Children | Married-Couple Families | Single-Parent Households |
| No Children | 0 (0.0%) | 16 (38.1%) |
| 1 or 2 Children | 0 (0.0%) | 3 (8.8%) |
| 3 or 4 Children | 6 (100.0%) | 0 (0.0%) |
| 5 or more Children | 0 (0.0%) | 0 (0.0%) |
| Total | 6 (4.2%) | 19 (25.0%) |
Race in Athens
The most populous races in Athens are White / Caucasian (1,021 | 89.1%), Black / African American (71 | 6.2%), and Hispanic or Latino (31 | 2.7%).
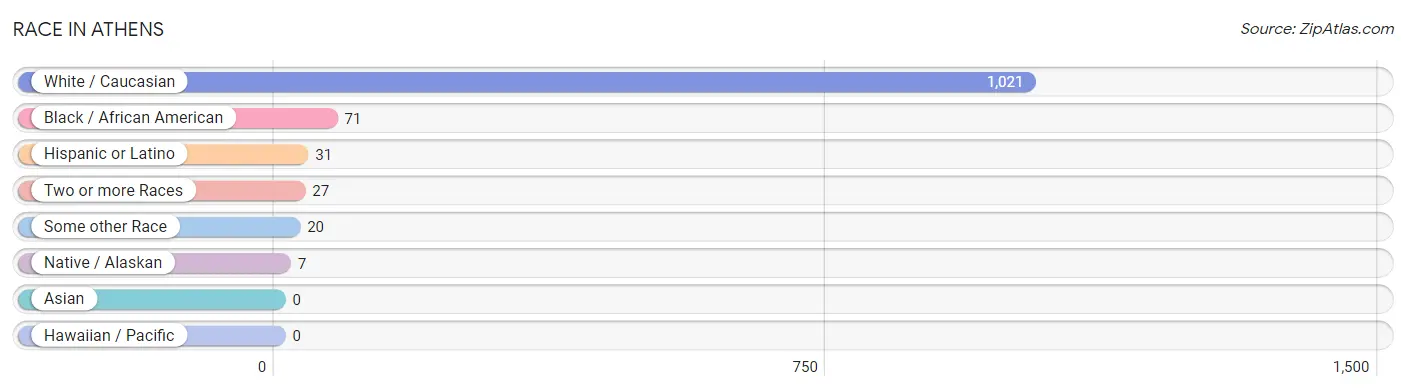
| Race | # Population | % Population |
| Asian | 0 | 0.0% |
| Black / African American | 71 | 6.2% |
| Hawaiian / Pacific | 0 | 0.0% |
| Hispanic or Latino | 31 | 2.7% |
| Native / Alaskan | 7 | 0.6% |
| White / Caucasian | 1,021 | 89.1% |
| Two or more Races | 27 | 2.4% |
| Some other Race | 20 | 1.8% |
| Total | 1,146 | 100.0% |
Ancestry in Athens
The most populous ancestries reported in Athens are English (375 | 32.7%), German (123 | 10.7%), Irish (110 | 9.6%), American (58 | 5.1%), and Italian (42 | 3.7%), together accounting for 61.8% of all Athens residents.
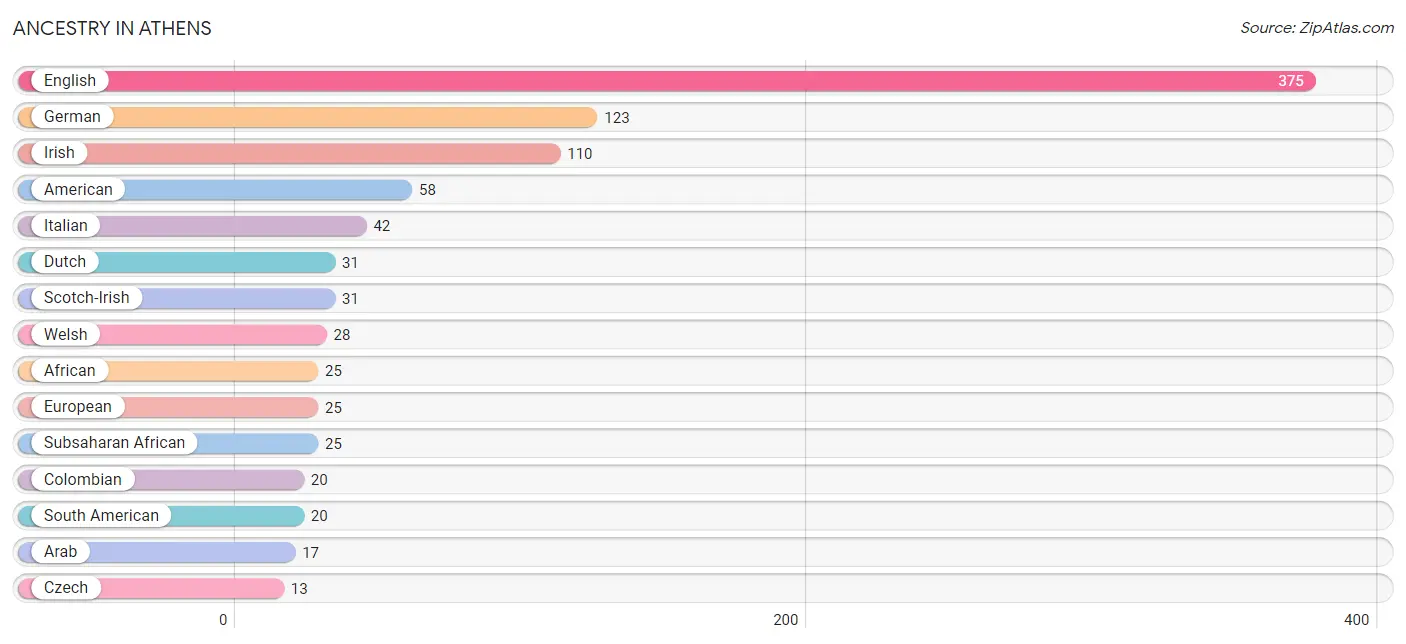
| Ancestry | # Population | % Population |
| African | 25 | 2.2% |
| American | 58 | 5.1% |
| Arab | 17 | 1.5% |
| Colombian | 20 | 1.8% |
| Cuban | 4 | 0.4% |
| Czech | 13 | 1.1% |
| Dutch | 31 | 2.7% |
| Eastern European | 2 | 0.2% |
| Egyptian | 9 | 0.8% |
| English | 375 | 32.7% |
| European | 25 | 2.2% |
| French | 3 | 0.3% |
| German | 123 | 10.7% |
| Hungarian | 2 | 0.2% |
| Irish | 110 | 9.6% |
| Italian | 42 | 3.7% |
| Moroccan | 8 | 0.7% |
| Northern European | 3 | 0.3% |
| Puerto Rican | 7 | 0.6% |
| Russian | 6 | 0.5% |
| Scotch-Irish | 31 | 2.7% |
| Scottish | 2 | 0.2% |
| Serbian | 8 | 0.7% |
| South American | 20 | 1.8% |
| Subsaharan African | 25 | 2.2% |
| Turkish | 9 | 0.8% |
| Welsh | 28 | 2.4% | View All 27 Rows |
Immigrants in Athens
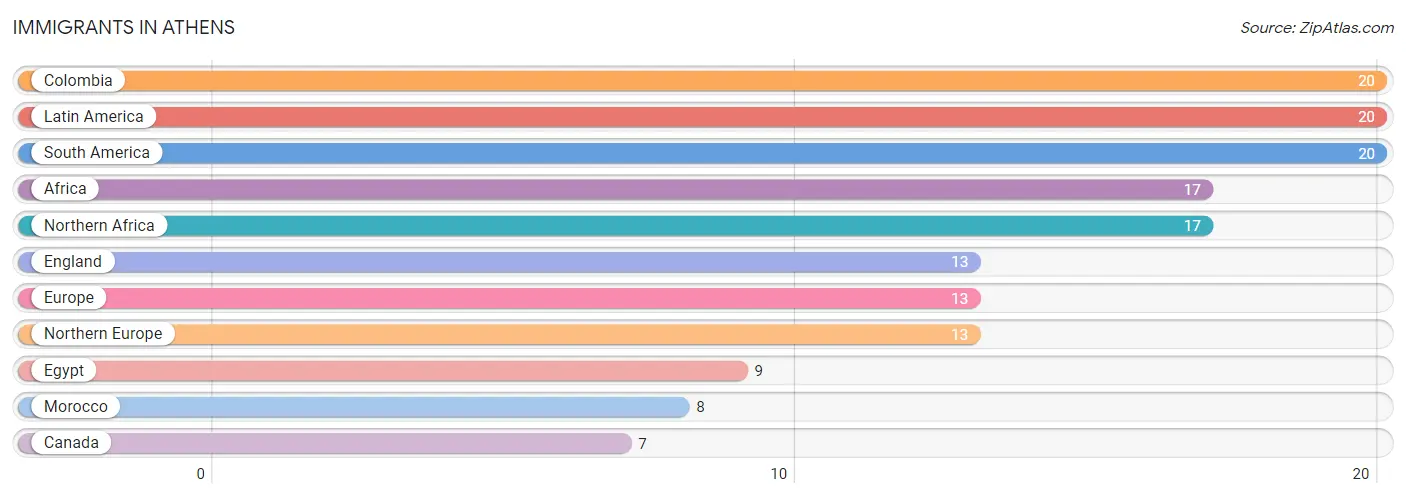
The most numerous immigrant groups reported in Athens came from Colombia (20 | 1.8%), Latin America (20 | 1.8%), South America (20 | 1.8%), Africa (17 | 1.5%), and Northern Africa (17 | 1.5%), together accounting for 8.2% of all Athens residents.
| Immigration Origin | # Population | % Population |
| Africa | 17 | 1.5% |
| Canada | 7 | 0.6% |
| Colombia | 20 | 1.8% |
| Egypt | 9 | 0.8% |
| England | 13 | 1.1% |
| Europe | 13 | 1.1% |
| Latin America | 20 | 1.8% |
| Morocco | 8 | 0.7% |
| Northern Africa | 17 | 1.5% |
| Northern Europe | 13 | 1.1% |
| South America | 20 | 1.8% | View All 11 Rows |
Sex and Age in Athens
Sex and Age in Athens
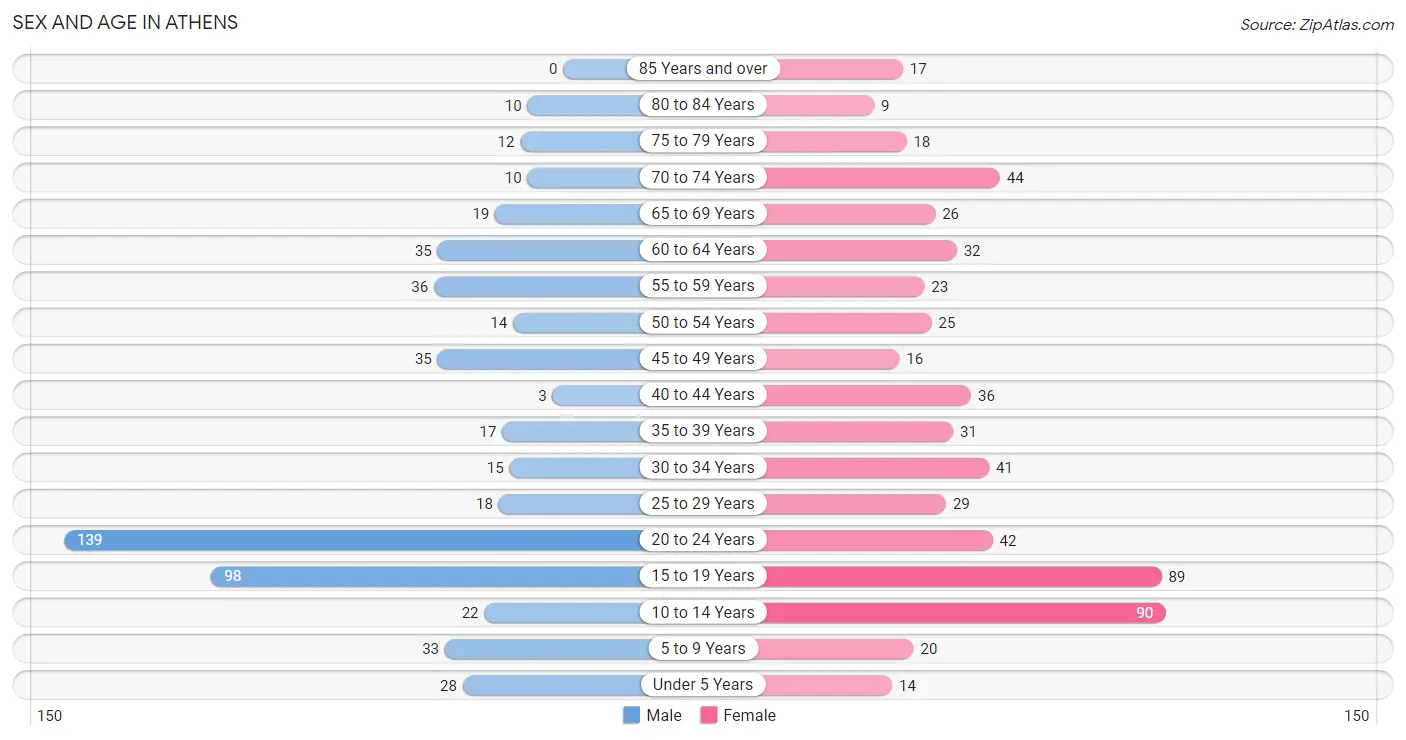
The most populous age groups in Athens are 20 to 24 Years (139 | 25.6%) for men and 10 to 14 Years (90 | 14.9%) for women.
| Age Bracket | Male | Female |
| Under 5 Years | 28 (5.1%) | 14 (2.3%) |
| 5 to 9 Years | 33 (6.1%) | 20 (3.3%) |
| 10 to 14 Years | 22 (4.0%) | 90 (14.9%) |
| 15 to 19 Years | 98 (18.0%) | 89 (14.8%) |
| 20 to 24 Years | 139 (25.6%) | 42 (7.0%) |
| 25 to 29 Years | 18 (3.3%) | 29 (4.8%) |
| 30 to 34 Years | 15 (2.8%) | 41 (6.8%) |
| 35 to 39 Years | 17 (3.1%) | 31 (5.1%) |
| 40 to 44 Years | 3 (0.5%) | 36 (6.0%) |
| 45 to 49 Years | 35 (6.4%) | 16 (2.7%) |
| 50 to 54 Years | 14 (2.6%) | 25 (4.2%) |
| 55 to 59 Years | 36 (6.6%) | 23 (3.8%) |
| 60 to 64 Years | 35 (6.4%) | 32 (5.3%) |
| 65 to 69 Years | 19 (3.5%) | 26 (4.3%) |
| 70 to 74 Years | 10 (1.8%) | 44 (7.3%) |
| 75 to 79 Years | 12 (2.2%) | 18 (3.0%) |
| 80 to 84 Years | 10 (1.8%) | 9 (1.5%) |
| 85 Years and over | 0 (0.0%) | 17 (2.8%) |
| Total | 544 (100.0%) | 602 (100.0%) |
Families and Households in Athens
Median Family Size in Athens
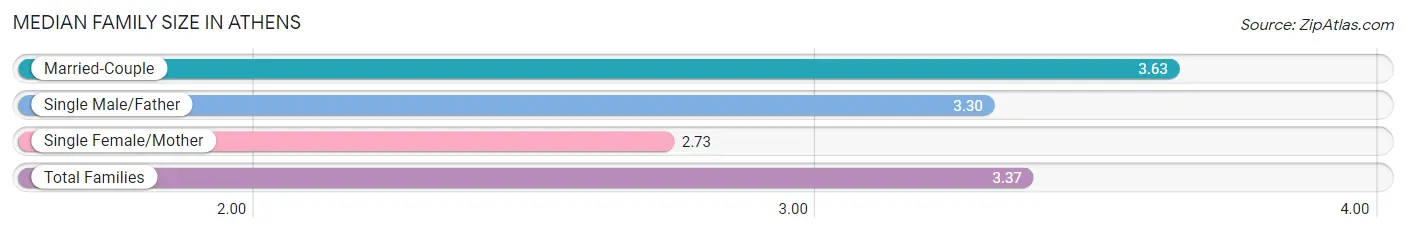
The median family size in Athens is 3.37 persons per family, with married-couple families (144 | 65.4%) accounting for the largest median family size of 3.63 persons per family. On the other hand, single female/mother families (56 | 25.5%) represent the smallest median family size with 2.73 persons per family.
| Family Type | # Families | Family Size |
| Married-Couple | 144 (65.4%) | 3.63 |
| Single Male/Father | 20 (9.1%) | 3.30 |
| Single Female/Mother | 56 (25.5%) | 2.73 |
| Total Families | 220 (100.0%) | 3.37 |
Median Household Size in Athens
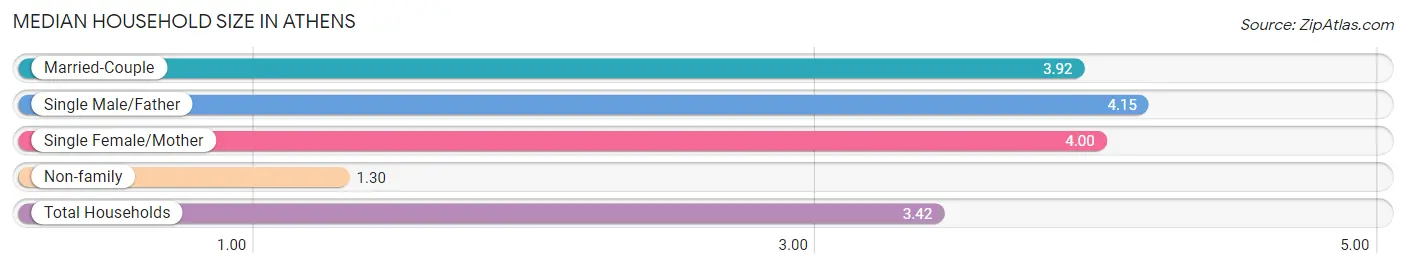
The median household size in Athens is 3.42 persons per household, with single male/father households (20 | 7.2%) accounting for the largest median household size of 4.15 persons per household. non-family households (56 | 20.3%) represent the smallest median household size with 1.30 persons per household.
| Household Type | # Households | Household Size |
| Married-Couple | 144 (52.2%) | 3.92 |
| Single Male/Father | 20 (7.2%) | 4.15 |
| Single Female/Mother | 56 (20.3%) | 4.00 |
| Non-family | 56 (20.3%) | 1.30 |
| Total Households | 276 (100.0%) | 3.42 |
Household Size by Marriage Status in Athens
Out of a total of 276 households in Athens, 220 (79.7%) are family households, while 56 (20.3%) are nonfamily households. The most numerous type of family households are 2-person households, comprising 90, and the most common type of nonfamily households are 1-person households, comprising 46.
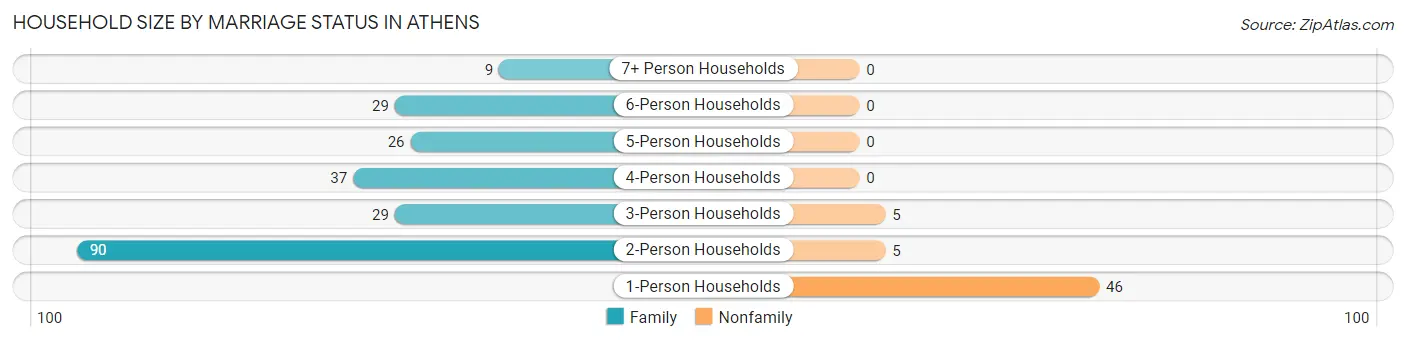
| Household Size | Family Households | Nonfamily Households |
| 1-Person Households | - | 46 (16.7%) |
| 2-Person Households | 90 (32.6%) | 5 (1.8%) |
| 3-Person Households | 29 (10.5%) | 5 (1.8%) |
| 4-Person Households | 37 (13.4%) | 0 (0.0%) |
| 5-Person Households | 26 (9.4%) | 0 (0.0%) |
| 6-Person Households | 29 (10.5%) | 0 (0.0%) |
| 7+ Person Households | 9 (3.3%) | 0 (0.0%) |
| Total | 220 (79.7%) | 56 (20.3%) |
Female Fertility in Athens
Fertility by Age in Athens
Average fertility rate in Athens is 35.0 births per 1,000 women. Women in the age bracket of 15 to 19 years have the highest fertility rate with 79.0 births per 1,000 women. Women in the age bracket of 15 to 19 years acount for 70.0% of all women with births.
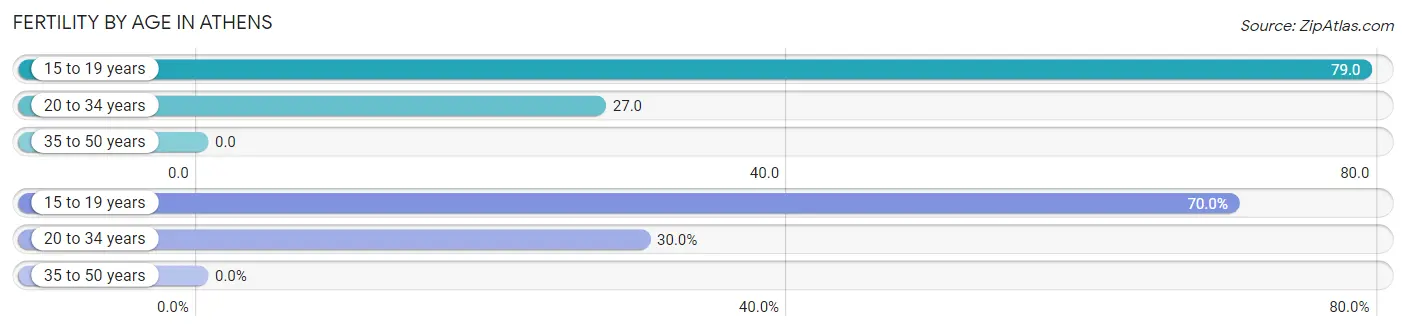
| Age Bracket | Women with Births | Births / 1,000 Women |
| 15 to 19 years | 7 (70.0%) | 79.0 |
| 20 to 34 years | 3 (30.0%) | 27.0 |
| 35 to 50 years | 0 (0.0%) | 0.0 |
| Total | 10 (100.0%) | 35.0 |
Fertility by Age by Marriage Status in Athens
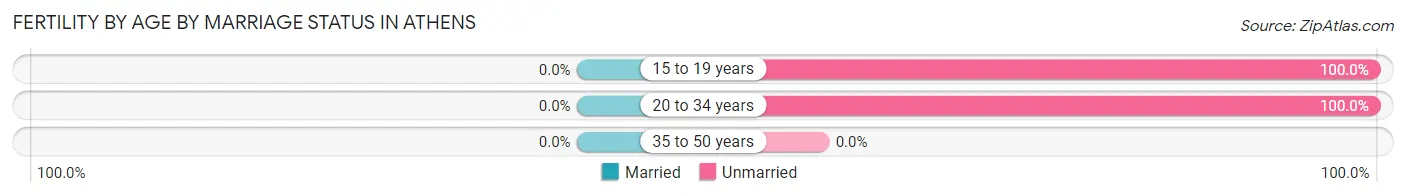
| Age Bracket | Married | Unmarried |
| 15 to 19 years | 0 (0.0%) | 7 (100.0%) |
| 20 to 34 years | 0 (0.0%) | 3 (100.0%) |
| 35 to 50 years | 0 (0.0%) | 0 (0.0%) |
| Total | 0 (0.0%) | 10 (100.0%) |
Fertility by Education in Athens
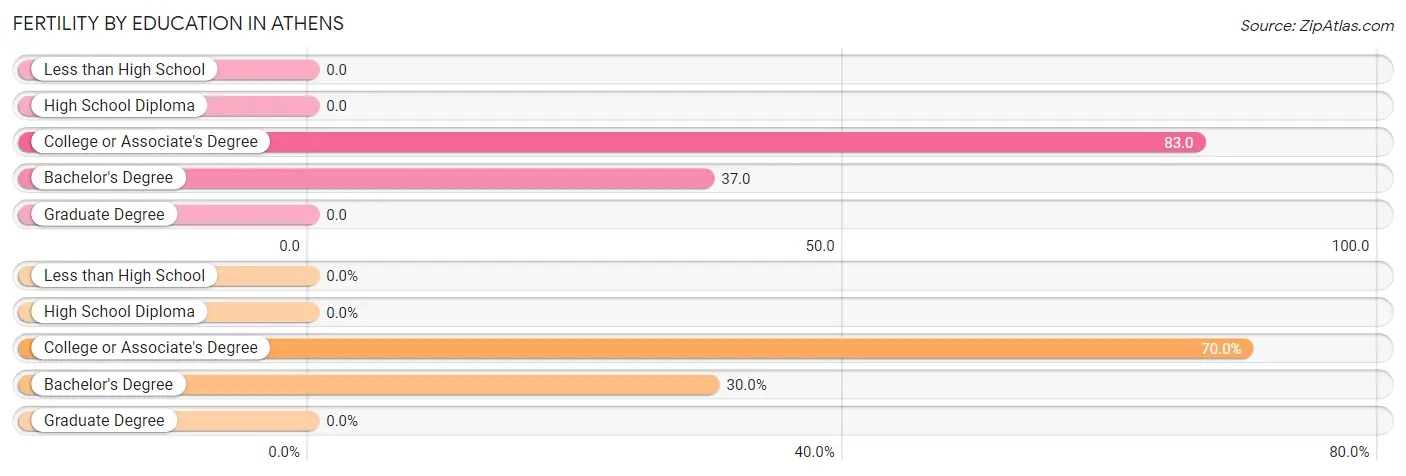
| Educational Attainment | Women with Births | Births / 1,000 Women |
| Less than High School | 0 (0.0%) | 0.0 |
| High School Diploma | 0 (0.0%) | 0.0 |
| College or Associate's Degree | 7 (70.0%) | 83.0 |
| Bachelor's Degree | 3 (30.0%) | 37.0 |
| Graduate Degree | 0 (0.0%) | 0.0 |
| Total | 10 (100.0%) | 35.0 |
Fertility by Education by Marriage Status in Athens
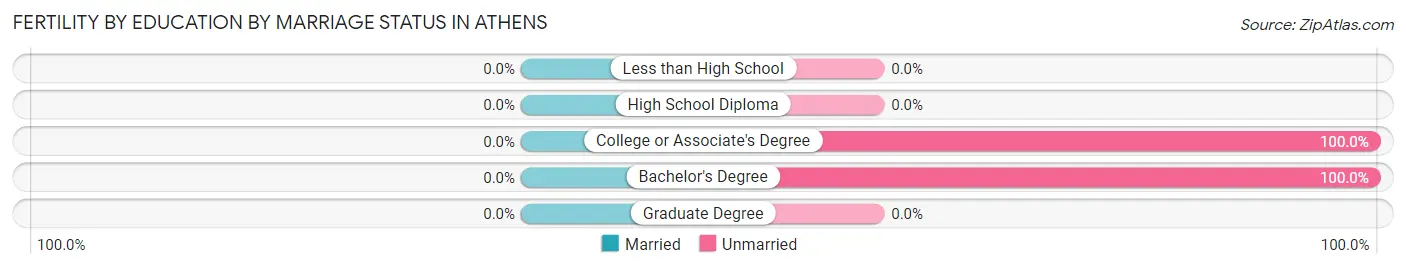
| Educational Attainment | Married | Unmarried |
| Less than High School | 0 (0.0%) | 0 (0.0%) |
| High School Diploma | 0 (0.0%) | 0 (0.0%) |
| College or Associate's Degree | 0 (0.0%) | 7 (100.0%) |
| Bachelor's Degree | 0 (0.0%) | 3 (100.0%) |
| Graduate Degree | 0 (0.0%) | 0 (0.0%) |
| Total | 0 (0.0%) | 10 (100.0%) |
Employment Characteristics in Athens
Employment by Class of Employer in Athens
Among the 386 employed individuals in Athens, private company employees (184 | 47.7%), state government employees (100 | 25.9%), and not-for-profit organizations (38 | 9.8%) make up the most common classes of employment.
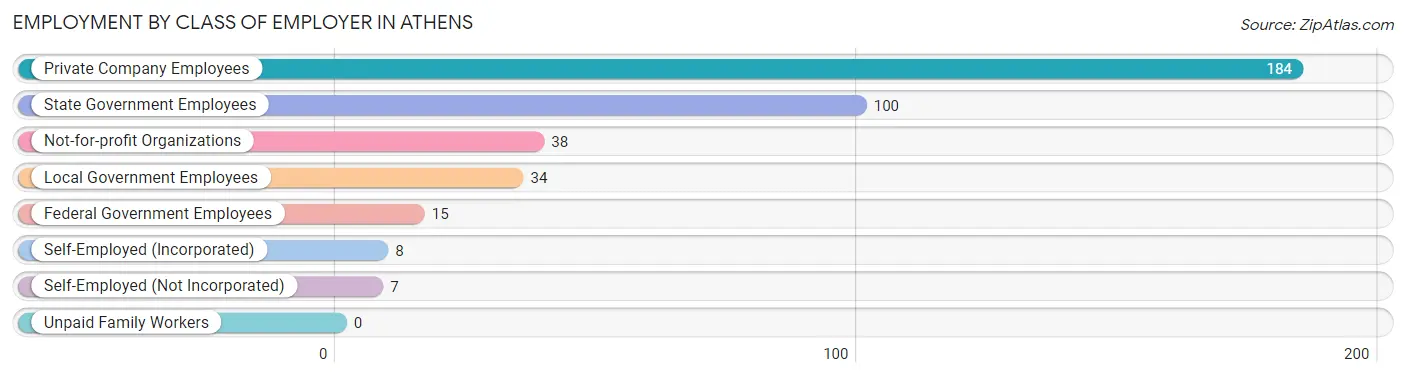
| Employer Class | # Employees | % Employees |
| Private Company Employees | 184 | 47.7% |
| Self-Employed (Incorporated) | 8 | 2.1% |
| Self-Employed (Not Incorporated) | 7 | 1.8% |
| Not-for-profit Organizations | 38 | 9.8% |
| Local Government Employees | 34 | 8.8% |
| State Government Employees | 100 | 25.9% |
| Federal Government Employees | 15 | 3.9% |
| Unpaid Family Workers | 0 | 0.0% |
| Total | 386 | 100.0% |
Employment Status by Age in Athens
According to the labor force statistics for Athens, out of the total population over 16 years of age (936), 48.2% or 451 individuals are in the labor force, with 10.2% or 46 of them unemployed. The age group with the highest labor force participation rate is 30 to 34 years, with 89.3% or 50 individuals in the labor force. Within the labor force, the 16 to 19 years age range has the highest percentage of unemployed individuals, with 35.9% or 23 of them being unemployed.
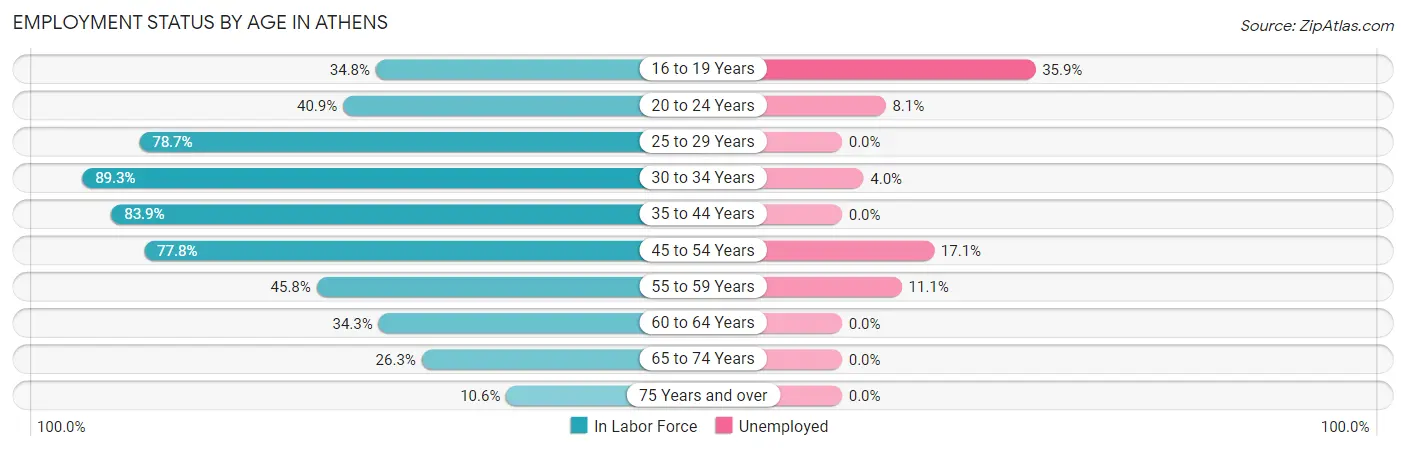
| Age Bracket | In Labor Force | Unemployed |
| 16 to 19 Years | 64 (34.8%) | 23 (35.9%) |
| 20 to 24 Years | 74 (40.9%) | 6 (8.1%) |
| 25 to 29 Years | 37 (78.7%) | 0 (0.0%) |
| 30 to 34 Years | 50 (89.3%) | 2 (4.0%) |
| 35 to 44 Years | 73 (83.9%) | 0 (0.0%) |
| 45 to 54 Years | 70 (77.8%) | 12 (17.1%) |
| 55 to 59 Years | 27 (45.8%) | 3 (11.1%) |
| 60 to 64 Years | 23 (34.3%) | 0 (0.0%) |
| 65 to 74 Years | 26 (26.3%) | 0 (0.0%) |
| 75 Years and over | 7 (10.6%) | 0 (0.0%) |
| Total | 451 (48.2%) | 46 (10.2%) |
Employment Status by Educational Attainment in Athens
According to labor force statistics for Athens, 69.0% of individuals (280) out of the total population between 25 and 64 years of age (406) are in the labor force, with 6.1% or 17 of them being unemployed. The group with the highest labor force participation rate are those with the educational attainment of bachelor's degree or higher, with 81.9% or 195 individuals in the labor force. Within the labor force, individuals with less than high school education have the highest percentage of unemployment, with 100.0% or 3 of them being unemployed.
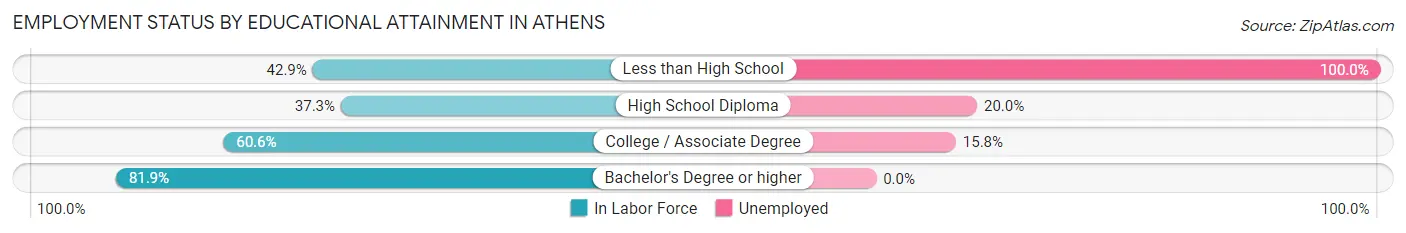
| Educational Attainment | In Labor Force | Unemployed |
| Less than High School | 3 (42.9%) | 7 (100.0%) |
| High School Diploma | 25 (37.3%) | 13 (20.0%) |
| College / Associate Degree | 57 (60.6%) | 15 (15.8%) |
| Bachelor's Degree or higher | 195 (81.9%) | 0 (0.0%) |
| Total | 280 (69.0%) | 25 (6.1%) |
Employment Occupations by Sex in Athens
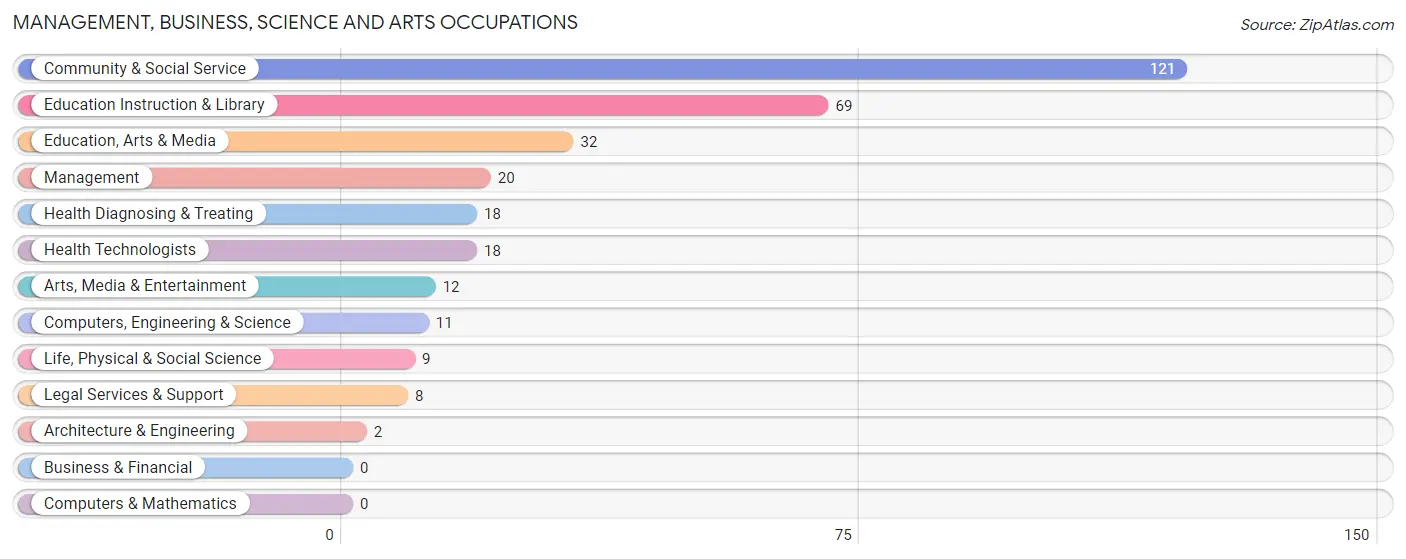
Management, Business, Science and Arts Occupations
The most common Management, Business, Science and Arts occupations in Athens are Community & Social Service (121 | 29.9%), Education Instruction & Library (69 | 17.0%), Education, Arts & Media (32 | 7.9%), Management (20 | 4.9%), and Health Diagnosing & Treating (18 | 4.4%).
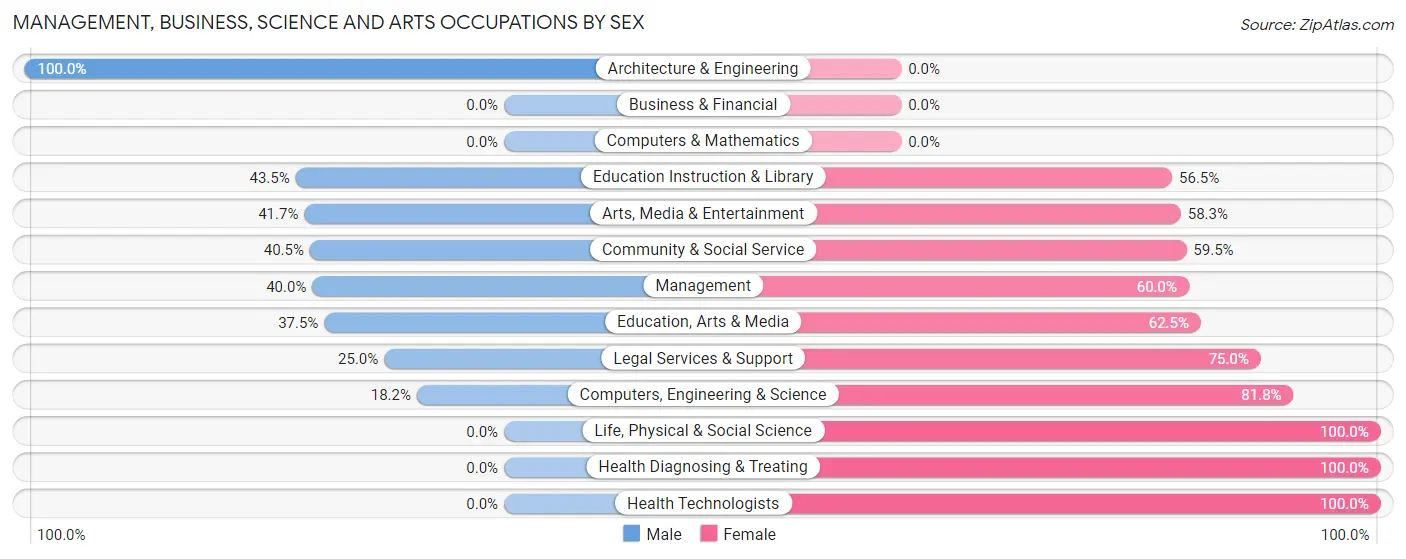
Management, Business, Science and Arts Occupations by Sex
Within the Management, Business, Science and Arts occupations in Athens, the most male-oriented occupations are Architecture & Engineering (100.0%), Education Instruction & Library (43.5%), and Arts, Media & Entertainment (41.7%), while the most female-oriented occupations are Life, Physical & Social Science (100.0%), Health Diagnosing & Treating (100.0%), and Health Technologists (100.0%).
| Occupation | Male | Female |
| Management | 8 (40.0%) | 12 (60.0%) |
| Business & Financial | 0 (0.0%) | 0 (0.0%) |
| Computers, Engineering & Science | 2 (18.2%) | 9 (81.8%) |
| Computers & Mathematics | 0 (0.0%) | 0 (0.0%) |
| Architecture & Engineering | 2 (100.0%) | 0 (0.0%) |
| Life, Physical & Social Science | 0 (0.0%) | 9 (100.0%) |
| Community & Social Service | 49 (40.5%) | 72 (59.5%) |
| Education, Arts & Media | 12 (37.5%) | 20 (62.5%) |
| Legal Services & Support | 2 (25.0%) | 6 (75.0%) |
| Education Instruction & Library | 30 (43.5%) | 39 (56.5%) |
| Arts, Media & Entertainment | 5 (41.7%) | 7 (58.3%) |
| Health Diagnosing & Treating | 0 (0.0%) | 18 (100.0%) |
| Health Technologists | 0 (0.0%) | 18 (100.0%) |
| Total (Category) | 59 (34.7%) | 111 (65.3%) |
| Total (Overall) | 214 (52.8%) | 191 (47.2%) |
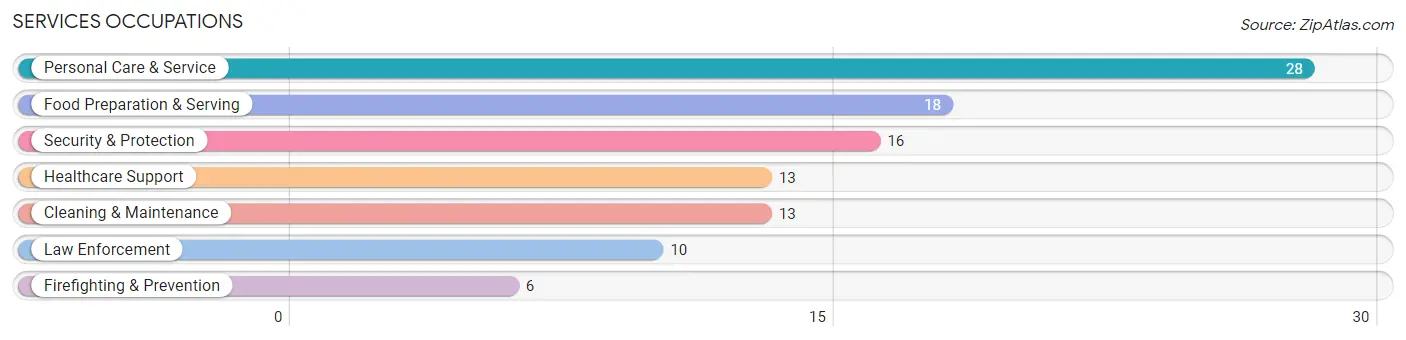
Services Occupations
The most common Services occupations in Athens are Personal Care & Service (28 | 6.9%), Food Preparation & Serving (18 | 4.4%), Security & Protection (16 | 4.0%), Healthcare Support (13 | 3.2%), and Cleaning & Maintenance (13 | 3.2%).
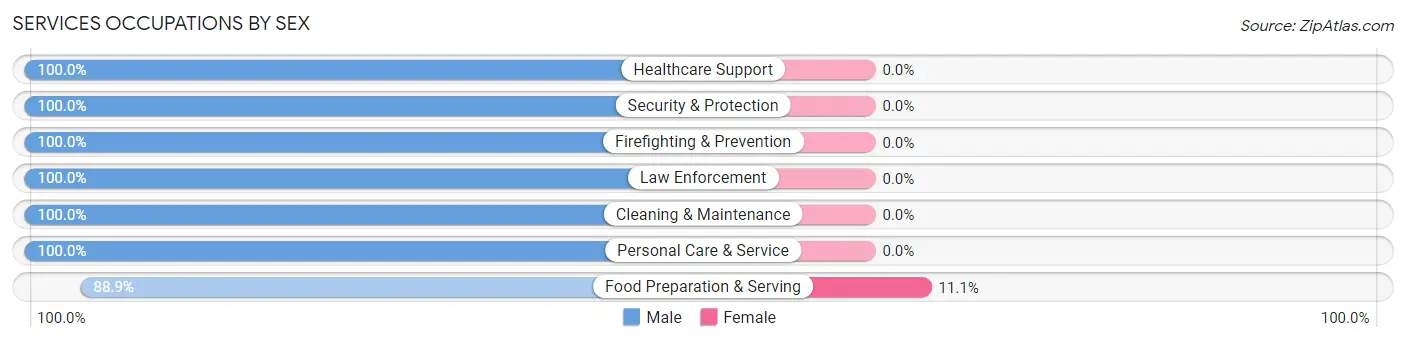
Services Occupations by Sex
| Occupation | Male | Female |
| Healthcare Support | 13 (100.0%) | 0 (0.0%) |
| Security & Protection | 16 (100.0%) | 0 (0.0%) |
| Firefighting & Prevention | 6 (100.0%) | 0 (0.0%) |
| Law Enforcement | 10 (100.0%) | 0 (0.0%) |
| Food Preparation & Serving | 16 (88.9%) | 2 (11.1%) |
| Cleaning & Maintenance | 13 (100.0%) | 0 (0.0%) |
| Personal Care & Service | 28 (100.0%) | 0 (0.0%) |
| Total (Category) | 86 (97.7%) | 2 (2.3%) |
| Total (Overall) | 214 (52.8%) | 191 (47.2%) |
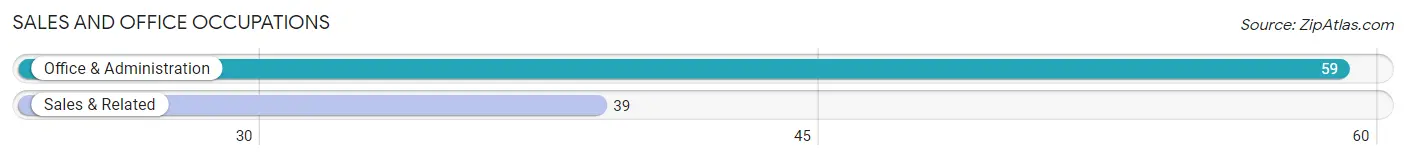
Sales and Office Occupations
The most common Sales and Office occupations in Athens are Office & Administration (59 | 14.6%), and Sales & Related (39 | 9.6%).
Sales and Office Occupations by Sex
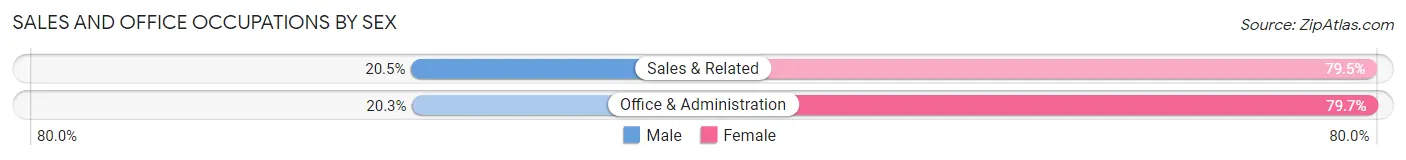
| Occupation | Male | Female |
| Sales & Related | 8 (20.5%) | 31 (79.5%) |
| Office & Administration | 12 (20.3%) | 47 (79.7%) |
| Total (Category) | 20 (20.4%) | 78 (79.6%) |
| Total (Overall) | 214 (52.8%) | 191 (47.2%) |
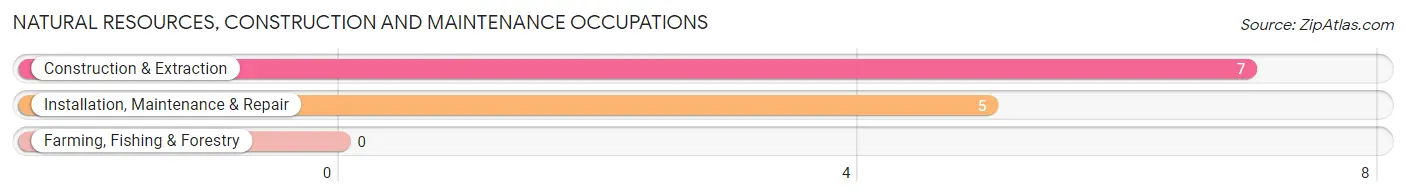
Natural Resources, Construction and Maintenance Occupations
The most common Natural Resources, Construction and Maintenance occupations in Athens are Construction & Extraction (7 | 1.7%), and Installation, Maintenance & Repair (5 | 1.2%).
Natural Resources, Construction and Maintenance Occupations by Sex
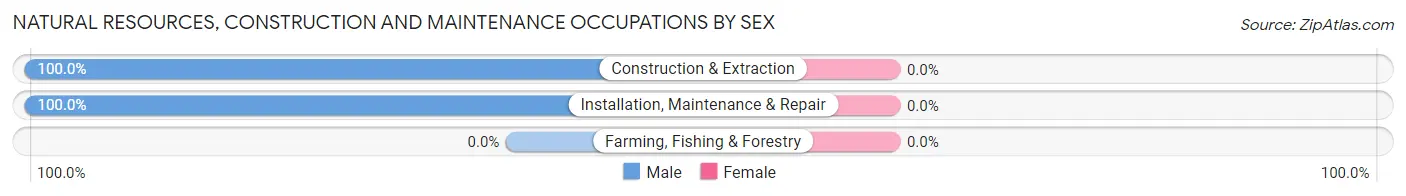
| Occupation | Male | Female |
| Farming, Fishing & Forestry | 0 (0.0%) | 0 (0.0%) |
| Construction & Extraction | 7 (100.0%) | 0 (0.0%) |
| Installation, Maintenance & Repair | 5 (100.0%) | 0 (0.0%) |
| Total (Category) | 12 (100.0%) | 0 (0.0%) |
| Total (Overall) | 214 (52.8%) | 191 (47.2%) |
Production, Transportation and Moving Occupations
The most common Production, Transportation and Moving occupations in Athens are Production (22 | 5.4%), Transportation (9 | 2.2%), and Material Moving (6 | 1.5%).
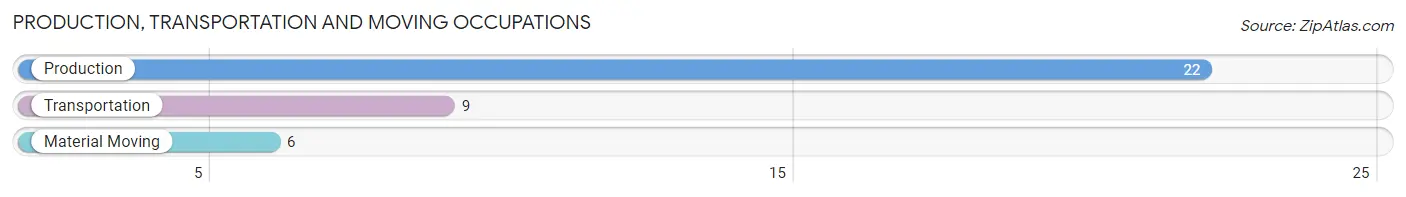
Production, Transportation and Moving Occupations by Sex
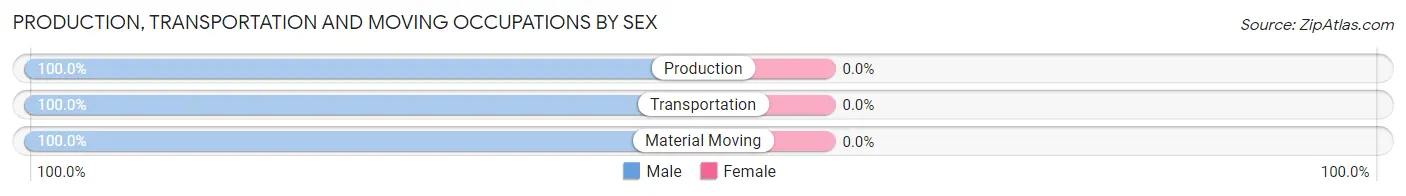
| Occupation | Male | Female |
| Production | 22 (100.0%) | 0 (0.0%) |
| Transportation | 9 (100.0%) | 0 (0.0%) |
| Material Moving | 6 (100.0%) | 0 (0.0%) |
| Total (Category) | 37 (100.0%) | 0 (0.0%) |
| Total (Overall) | 214 (52.8%) | 191 (47.2%) |
Employment Industries by Sex in Athens
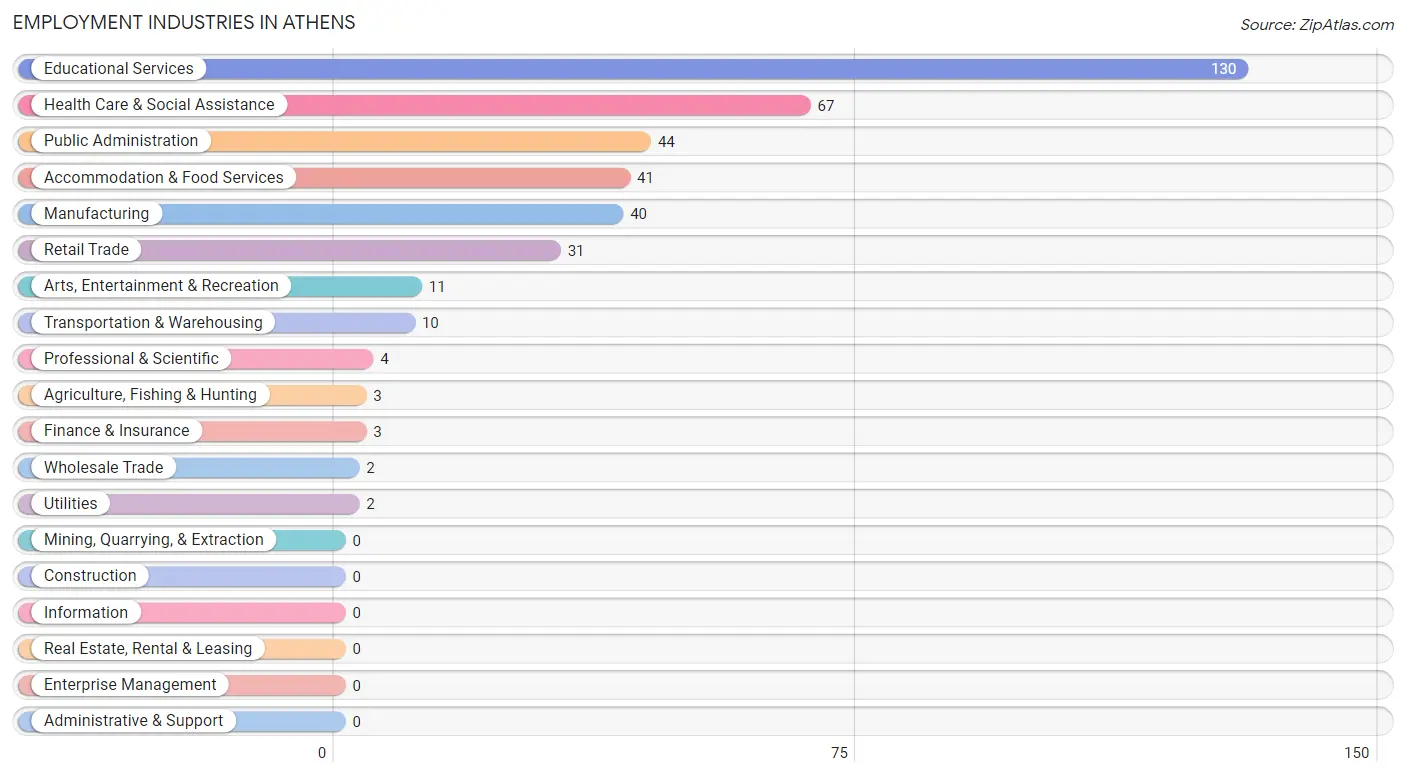
Employment Industries in Athens
The major employment industries in Athens include Educational Services (130 | 32.1%), Health Care & Social Assistance (67 | 16.5%), Public Administration (44 | 10.9%), Accommodation & Food Services (41 | 10.1%), and Manufacturing (40 | 9.9%).
Employment Industries by Sex in Athens
The Athens industries that see more men than women are Agriculture, Fishing & Hunting (100.0%), Manufacturing (100.0%), and Wholesale Trade (100.0%), whereas the industries that tend to have a higher number of women are Retail Trade (80.6%), Health Care & Social Assistance (73.1%), and Arts, Entertainment & Recreation (63.6%).
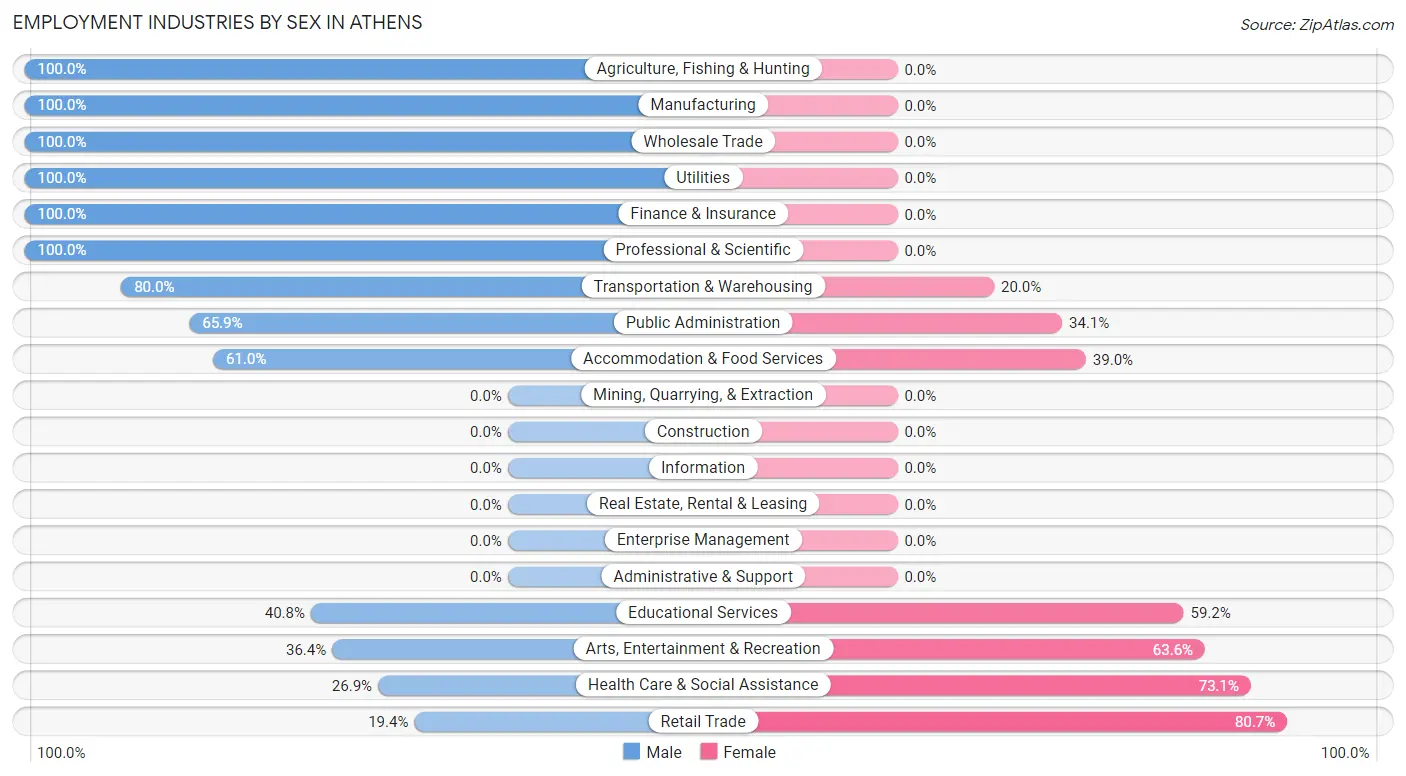
| Industry | Male | Female |
| Agriculture, Fishing & Hunting | 3 (100.0%) | 0 (0.0%) |
| Mining, Quarrying, & Extraction | 0 (0.0%) | 0 (0.0%) |
| Construction | 0 (0.0%) | 0 (0.0%) |
| Manufacturing | 40 (100.0%) | 0 (0.0%) |
| Wholesale Trade | 2 (100.0%) | 0 (0.0%) |
| Retail Trade | 6 (19.4%) | 25 (80.6%) |
| Transportation & Warehousing | 8 (80.0%) | 2 (20.0%) |
| Utilities | 2 (100.0%) | 0 (0.0%) |
| Information | 0 (0.0%) | 0 (0.0%) |
| Finance & Insurance | 3 (100.0%) | 0 (0.0%) |
| Real Estate, Rental & Leasing | 0 (0.0%) | 0 (0.0%) |
| Professional & Scientific | 4 (100.0%) | 0 (0.0%) |
| Enterprise Management | 0 (0.0%) | 0 (0.0%) |
| Administrative & Support | 0 (0.0%) | 0 (0.0%) |
| Educational Services | 53 (40.8%) | 77 (59.2%) |
| Health Care & Social Assistance | 18 (26.9%) | 49 (73.1%) |
| Arts, Entertainment & Recreation | 4 (36.4%) | 7 (63.6%) |
| Accommodation & Food Services | 25 (61.0%) | 16 (39.0%) |
| Public Administration | 29 (65.9%) | 15 (34.1%) |
| Total | 214 (52.8%) | 191 (47.2%) |
Education in Athens
School Enrollment in Athens
The most common levels of schooling among the 560 students in Athens are college / undergraduate (311 | 55.5%), middle school (96 | 17.1%), and high school (83 | 14.8%).
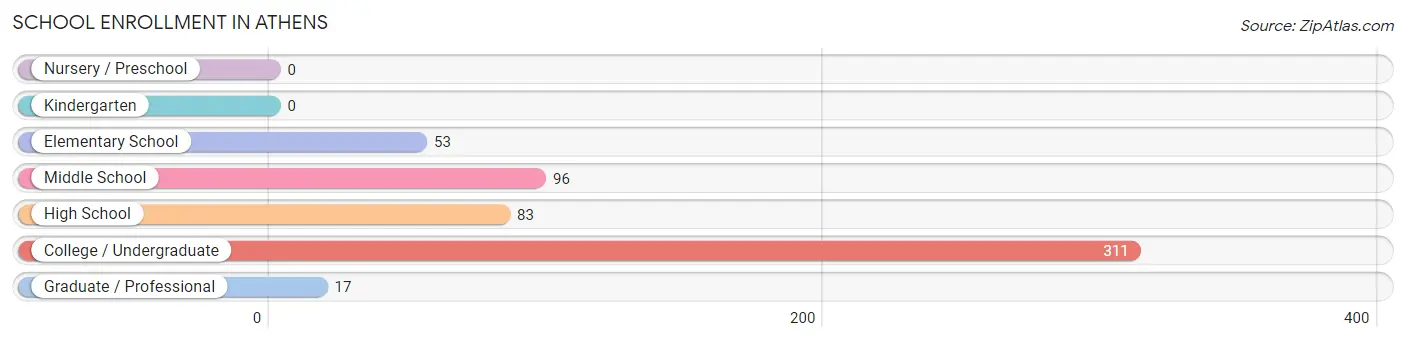
| School Level | # Students | % Students |
| Nursery / Preschool | 0 | 0.0% |
| Kindergarten | 0 | 0.0% |
| Elementary School | 53 | 9.5% |
| Middle School | 96 | 17.1% |
| High School | 83 | 14.8% |
| College / Undergraduate | 311 | 55.5% |
| Graduate / Professional | 17 | 3.0% |
| Total | 560 | 100.0% |
School Enrollment by Age by Funding Source in Athens
Out of a total of 560 students who are enrolled in schools in Athens, 78 (13.9%) attend a private institution, while the remaining 482 (86.1%) are enrolled in public schools. The age group of 25 to 34 year olds has the highest likelihood of being enrolled in private schools, with 29 (82.9% in the age bracket) enrolled. Conversely, the age group of 5 to 9 year old has the lowest likelihood of being enrolled in a private school, with 53 (100.0% in the age bracket) attending a public institution.
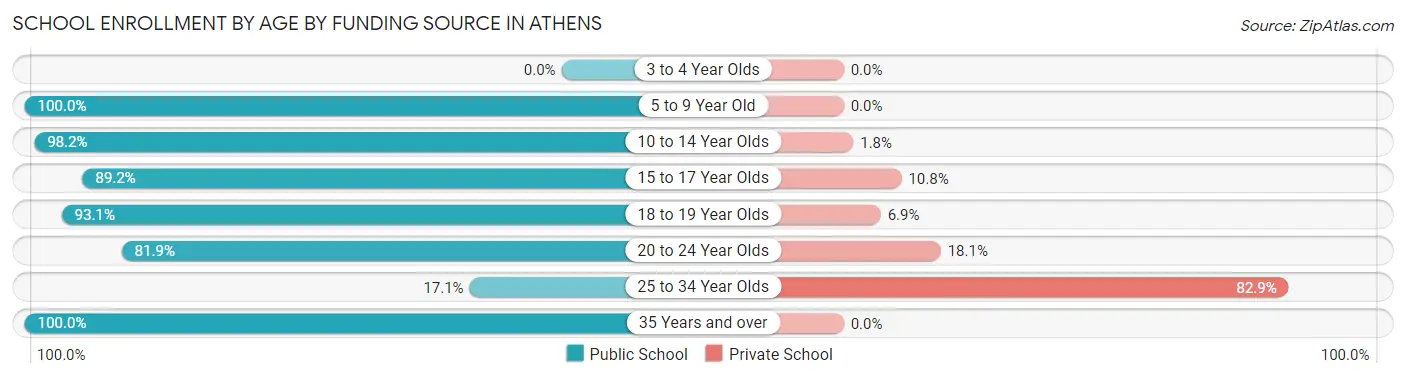
| Age Bracket | Public School | Private School |
| 3 to 4 Year Olds | 0 (0.0%) | 0 (0.0%) |
| 5 to 9 Year Old | 53 (100.0%) | 0 (0.0%) |
| 10 to 14 Year Olds | 110 (98.2%) | 2 (1.8%) |
| 15 to 17 Year Olds | 58 (89.2%) | 7 (10.8%) |
| 18 to 19 Year Olds | 108 (93.1%) | 8 (6.9%) |
| 20 to 24 Year Olds | 145 (81.9%) | 32 (18.1%) |
| 25 to 34 Year Olds | 6 (17.1%) | 29 (82.9%) |
| 35 Years and over | 2 (100.0%) | 0 (0.0%) |
| Total | 482 (86.1%) | 78 (13.9%) |
Educational Attainment by Field of Study in Athens
Education (86 | 29.8%), physical & health sciences (31 | 10.7%), liberal arts & history (30 | 10.4%), science & technology (28 | 9.7%), and psychology (27 | 9.3%) are the most common fields of study among 289 individuals in Athens who have obtained a bachelor's degree or higher.
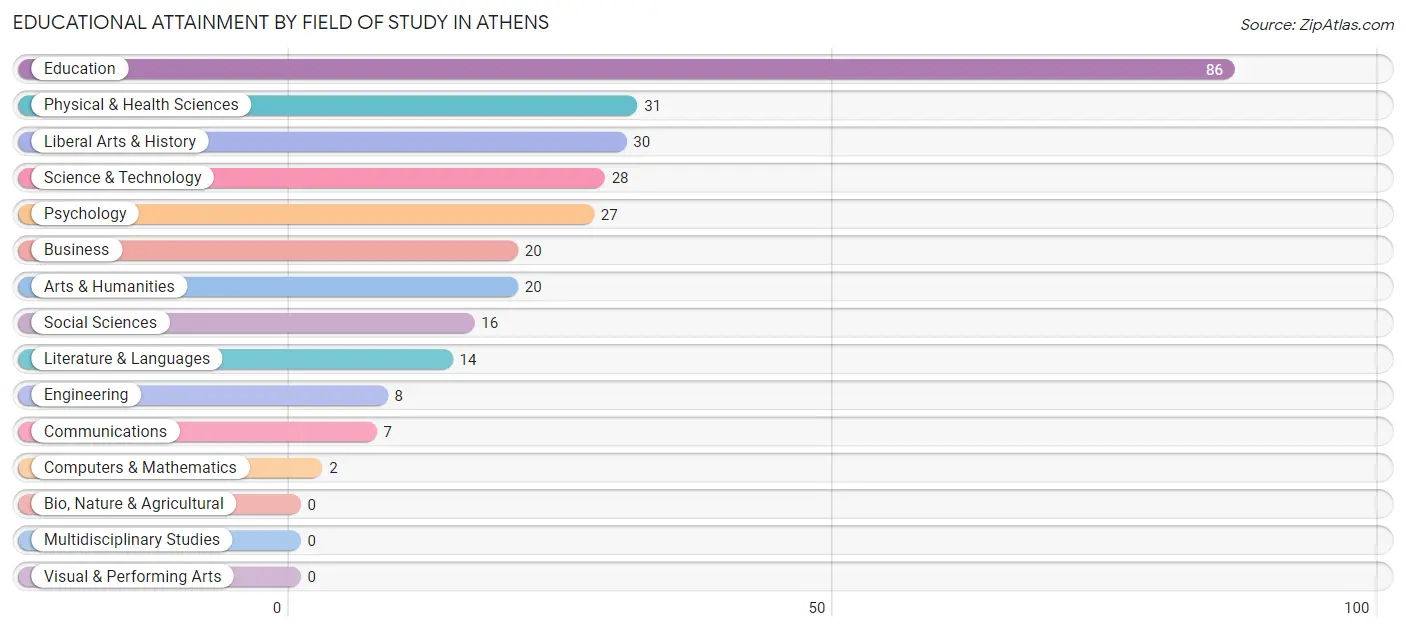
| Field of Study | # Graduates | % Graduates |
| Computers & Mathematics | 2 | 0.7% |
| Bio, Nature & Agricultural | 0 | 0.0% |
| Physical & Health Sciences | 31 | 10.7% |
| Psychology | 27 | 9.3% |
| Social Sciences | 16 | 5.5% |
| Engineering | 8 | 2.8% |
| Multidisciplinary Studies | 0 | 0.0% |
| Science & Technology | 28 | 9.7% |
| Business | 20 | 6.9% |
| Education | 86 | 29.8% |
| Literature & Languages | 14 | 4.8% |
| Liberal Arts & History | 30 | 10.4% |
| Visual & Performing Arts | 0 | 0.0% |
| Communications | 7 | 2.4% |
| Arts & Humanities | 20 | 6.9% |
| Total | 289 | 100.0% |
Transportation & Commute in Athens
Vehicle Availability by Sex in Athens
The most prevalent vehicle ownership categories in Athens are males with 2 vehicles (53, accounting for 35.3%) and females with 2 vehicles (62, making up 27.8%).
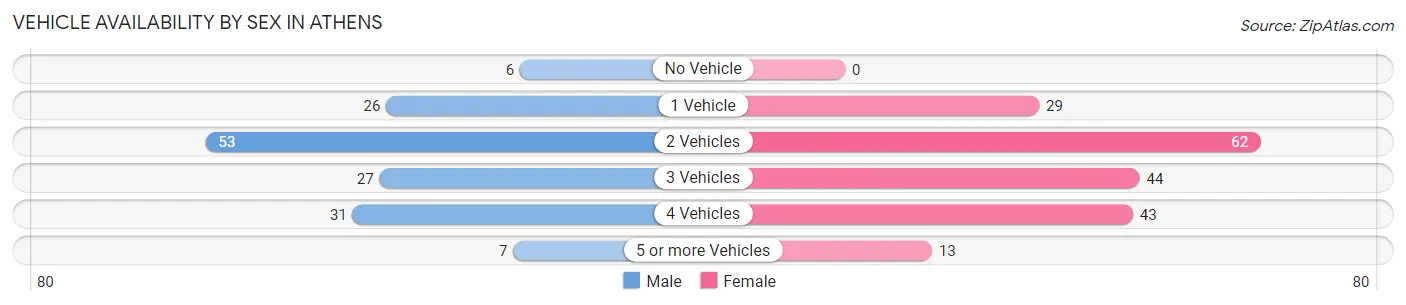
| Vehicles Available | Male | Female |
| No Vehicle | 6 (4.0%) | 0 (0.0%) |
| 1 Vehicle | 26 (17.3%) | 29 (15.2%) |
| 2 Vehicles | 53 (35.3%) | 62 (32.5%) |
| 3 Vehicles | 27 (18.0%) | 44 (23.0%) |
| 4 Vehicles | 31 (20.7%) | 43 (22.5%) |
| 5 or more Vehicles | 7 (4.7%) | 13 (6.8%) |
| Total | 150 (100.0%) | 191 (100.0%) |
Commute Time in Athens
The most frequently occuring commute durations in Athens are 5 to 9 minutes (67 commuters, 20.7%), 15 to 19 minutes (50 commuters, 15.5%), and less than 5 minutes (42 commuters, 13.0%).
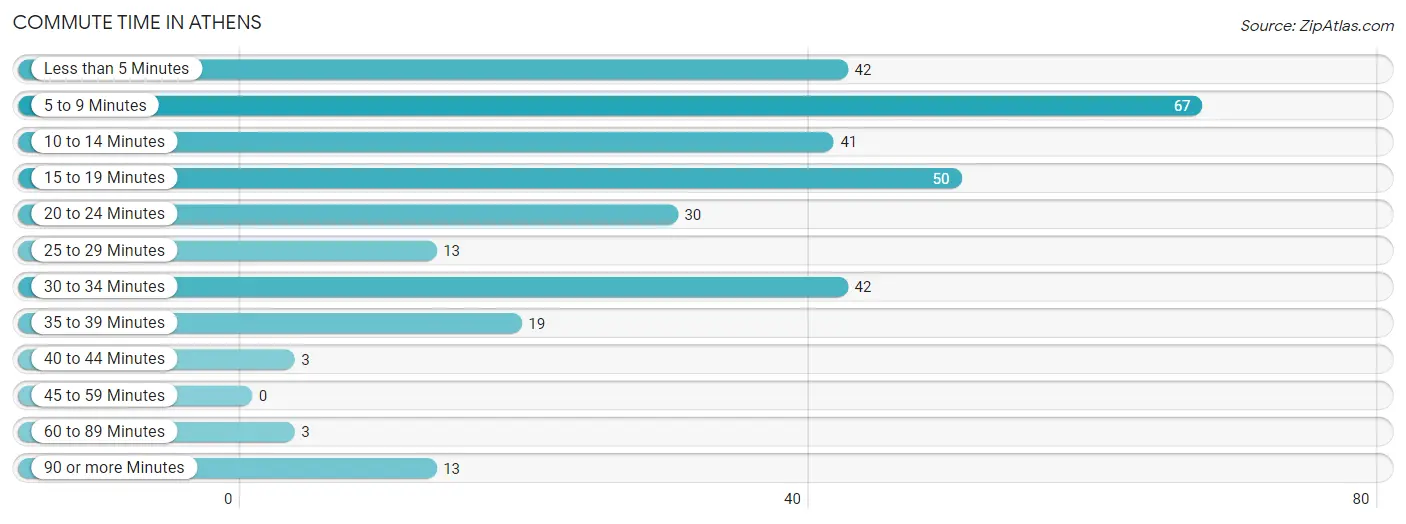
| Commute Time | # Commuters | % Commuters |
| Less than 5 Minutes | 42 | 13.0% |
| 5 to 9 Minutes | 67 | 20.7% |
| 10 to 14 Minutes | 41 | 12.7% |
| 15 to 19 Minutes | 50 | 15.5% |
| 20 to 24 Minutes | 30 | 9.3% |
| 25 to 29 Minutes | 13 | 4.0% |
| 30 to 34 Minutes | 42 | 13.0% |
| 35 to 39 Minutes | 19 | 5.9% |
| 40 to 44 Minutes | 3 | 0.9% |
| 45 to 59 Minutes | 0 | 0.0% |
| 60 to 89 Minutes | 3 | 0.9% |
| 90 or more Minutes | 13 | 4.0% |
Commute Time by Sex in Athens
The most common commute times in Athens are 15 to 19 minutes (42 commuters, 30.9%) for males and less than 5 minutes (42 commuters, 22.5%) for females.
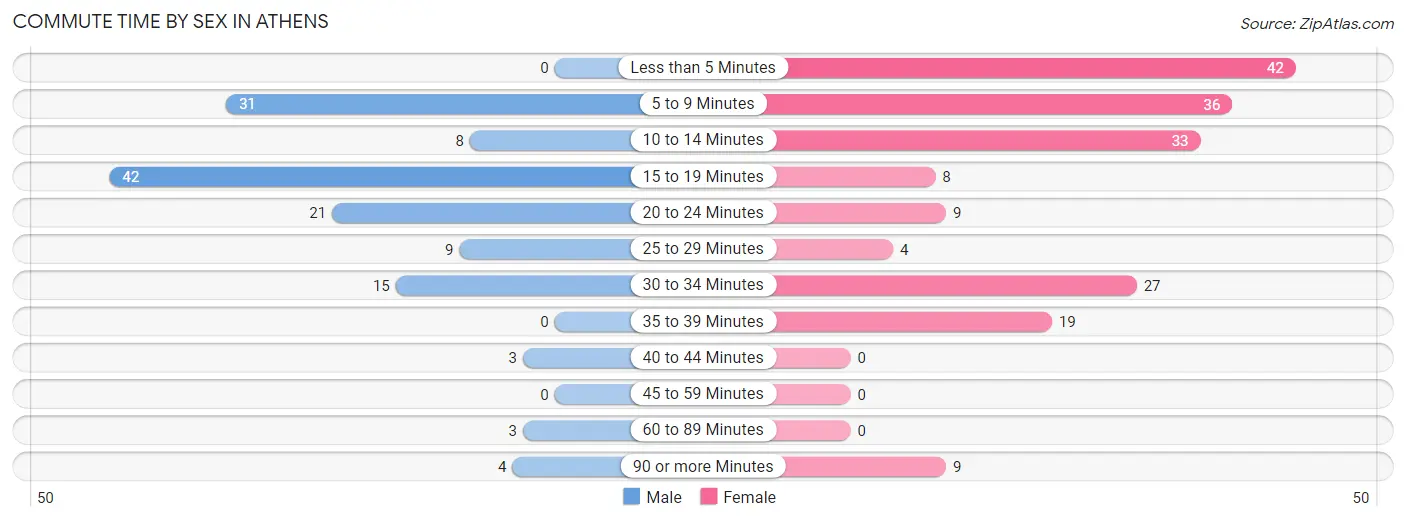
| Commute Time | Male | Female |
| Less than 5 Minutes | 0 (0.0%) | 42 (22.5%) |
| 5 to 9 Minutes | 31 (22.8%) | 36 (19.3%) |
| 10 to 14 Minutes | 8 (5.9%) | 33 (17.6%) |
| 15 to 19 Minutes | 42 (30.9%) | 8 (4.3%) |
| 20 to 24 Minutes | 21 (15.4%) | 9 (4.8%) |
| 25 to 29 Minutes | 9 (6.6%) | 4 (2.1%) |
| 30 to 34 Minutes | 15 (11.0%) | 27 (14.4%) |
| 35 to 39 Minutes | 0 (0.0%) | 19 (10.2%) |
| 40 to 44 Minutes | 3 (2.2%) | 0 (0.0%) |
| 45 to 59 Minutes | 0 (0.0%) | 0 (0.0%) |
| 60 to 89 Minutes | 3 (2.2%) | 0 (0.0%) |
| 90 or more Minutes | 4 (2.9%) | 9 (4.8%) |
Time of Departure to Work by Sex in Athens
The most frequent times of departure to work in Athens are 12:00 PM to 3:59 PM (46, 33.8%) for males and 8:00 AM to 8:29 AM (48, 25.7%) for females.
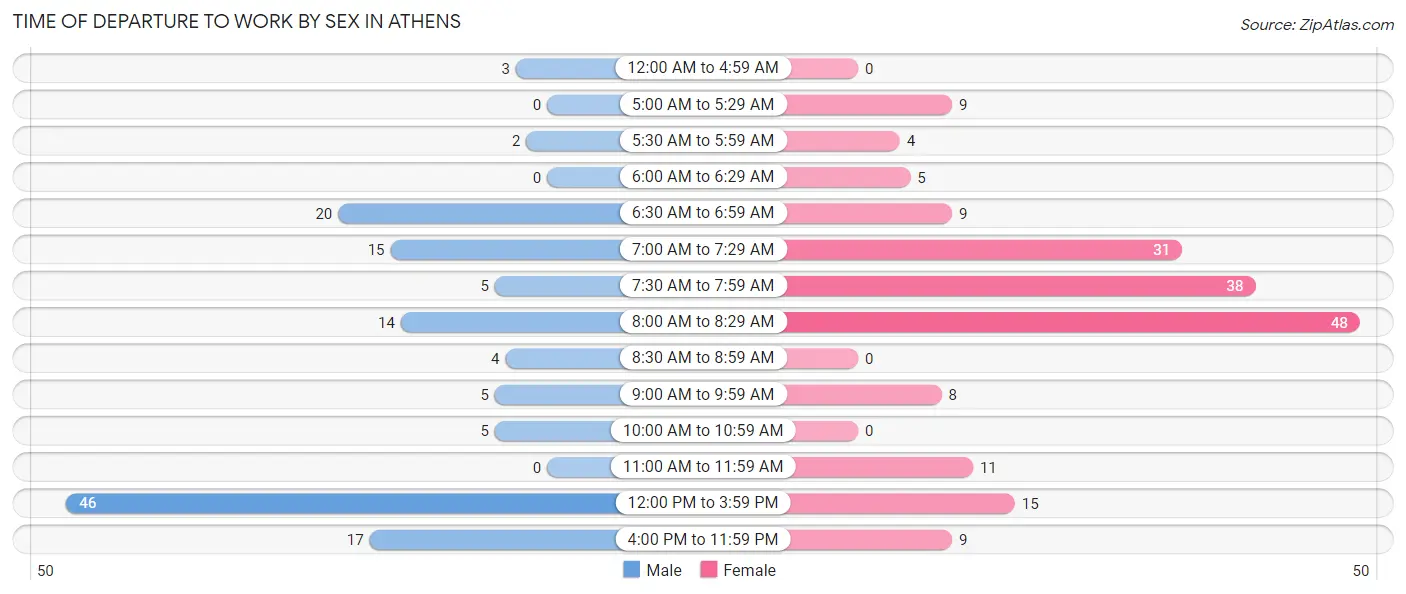
| Time of Departure | Male | Female |
| 12:00 AM to 4:59 AM | 3 (2.2%) | 0 (0.0%) |
| 5:00 AM to 5:29 AM | 0 (0.0%) | 9 (4.8%) |
| 5:30 AM to 5:59 AM | 2 (1.5%) | 4 (2.1%) |
| 6:00 AM to 6:29 AM | 0 (0.0%) | 5 (2.7%) |
| 6:30 AM to 6:59 AM | 20 (14.7%) | 9 (4.8%) |
| 7:00 AM to 7:29 AM | 15 (11.0%) | 31 (16.6%) |
| 7:30 AM to 7:59 AM | 5 (3.7%) | 38 (20.3%) |
| 8:00 AM to 8:29 AM | 14 (10.3%) | 48 (25.7%) |
| 8:30 AM to 8:59 AM | 4 (2.9%) | 0 (0.0%) |
| 9:00 AM to 9:59 AM | 5 (3.7%) | 8 (4.3%) |
| 10:00 AM to 10:59 AM | 5 (3.7%) | 0 (0.0%) |
| 11:00 AM to 11:59 AM | 0 (0.0%) | 11 (5.9%) |
| 12:00 PM to 3:59 PM | 46 (33.8%) | 15 (8.0%) |
| 4:00 PM to 11:59 PM | 17 (12.5%) | 9 (4.8%) |
| Total | 136 (100.0%) | 187 (100.0%) |
Housing Occupancy in Athens
Occupancy by Ownership in Athens
Of the total 276 dwellings in Athens, owner-occupied units account for 194 (70.3%), while renter-occupied units make up 82 (29.7%).
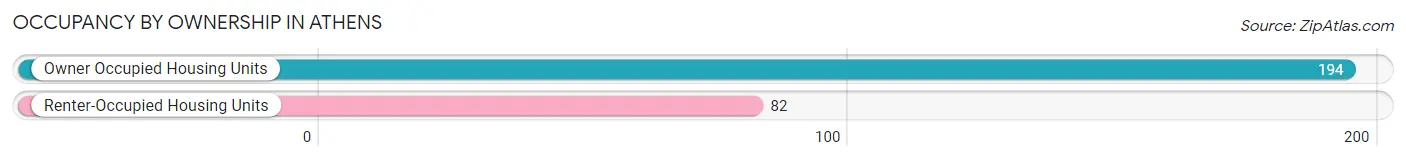
| Occupancy | # Housing Units | % Housing Units |
| Owner Occupied Housing Units | 194 | 70.3% |
| Renter-Occupied Housing Units | 82 | 29.7% |
| Total Occupied Housing Units | 276 | 100.0% |
Occupancy by Household Size in Athens
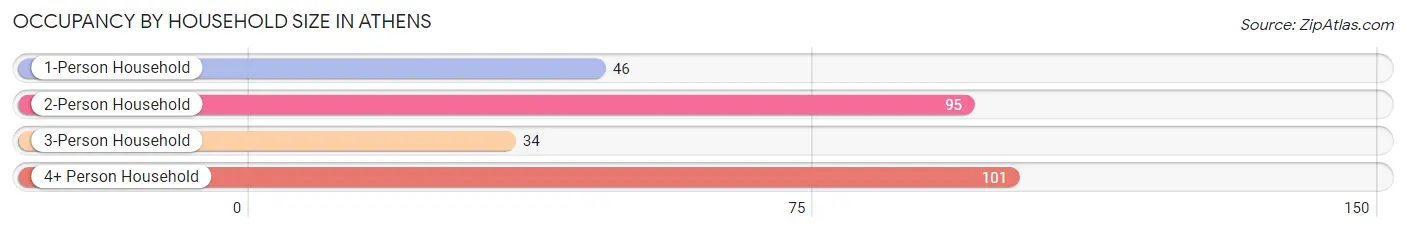
| Household Size | # Housing Units | % Housing Units |
| 1-Person Household | 46 | 16.7% |
| 2-Person Household | 95 | 34.4% |
| 3-Person Household | 34 | 12.3% |
| 4+ Person Household | 101 | 36.6% |
| Total Housing Units | 276 | 100.0% |
Occupancy by Ownership by Household Size in Athens
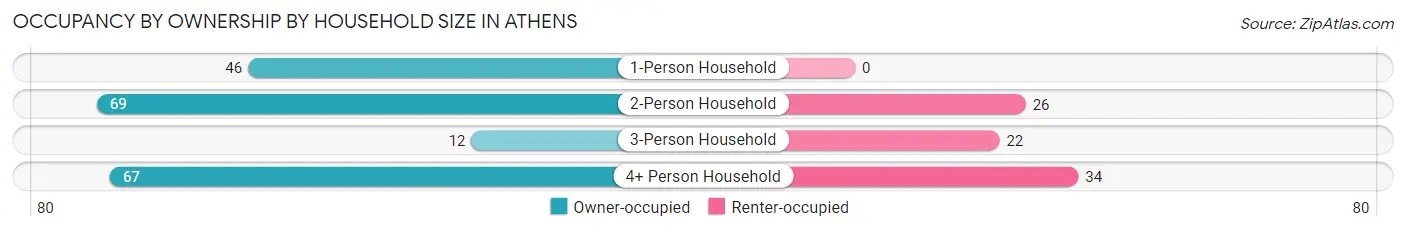
| Household Size | Owner-occupied | Renter-occupied |
| 1-Person Household | 46 (100.0%) | 0 (0.0%) |
| 2-Person Household | 69 (72.6%) | 26 (27.4%) |
| 3-Person Household | 12 (35.3%) | 22 (64.7%) |
| 4+ Person Household | 67 (66.3%) | 34 (33.7%) |
| Total Housing Units | 194 (70.3%) | 82 (29.7%) |
Occupancy by Educational Attainment in Athens
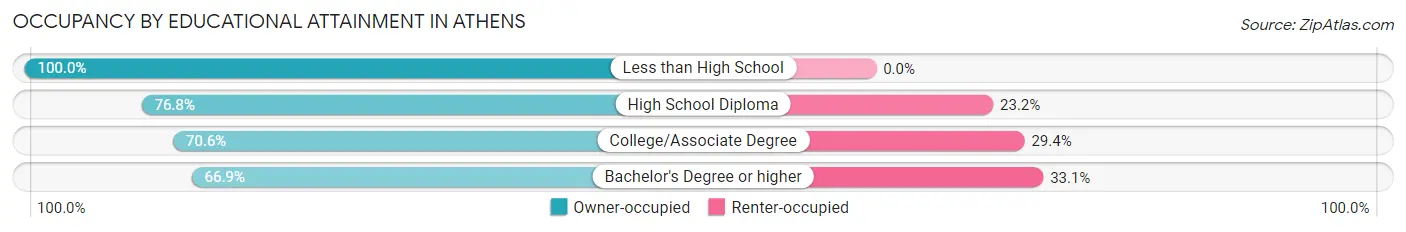
| Household Size | Owner-occupied | Renter-occupied |
| Less than High School | 2 (100.0%) | 0 (0.0%) |
| High School Diploma | 53 (76.8%) | 16 (23.2%) |
| College/Associate Degree | 36 (70.6%) | 15 (29.4%) |
| Bachelor's Degree or higher | 103 (66.9%) | 51 (33.1%) |
Occupancy by Age of Householder in Athens
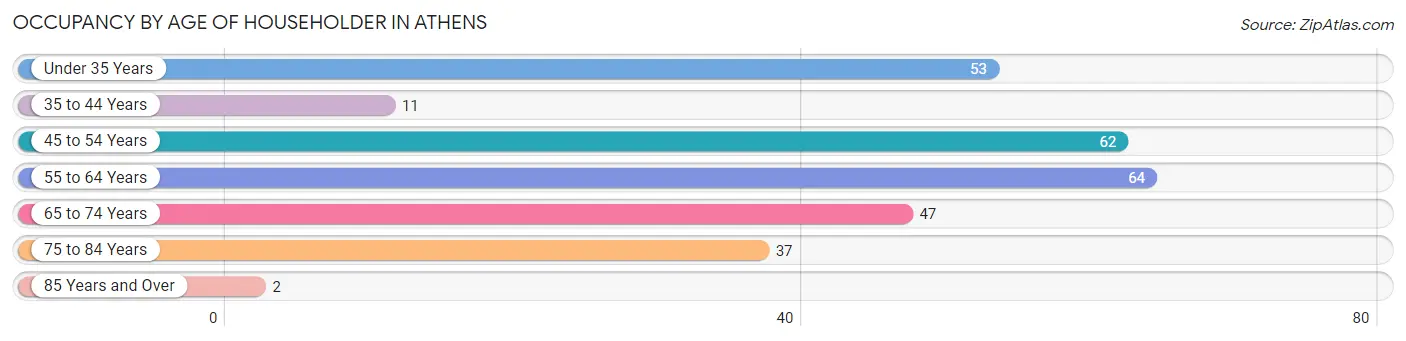
| Age Bracket | # Households | % Households |
| Under 35 Years | 53 | 19.2% |
| 35 to 44 Years | 11 | 4.0% |
| 45 to 54 Years | 62 | 22.5% |
| 55 to 64 Years | 64 | 23.2% |
| 65 to 74 Years | 47 | 17.0% |
| 75 to 84 Years | 37 | 13.4% |
| 85 Years and Over | 2 | 0.7% |
| Total | 276 | 100.0% |
Housing Finances in Athens
Median Income by Occupancy in Athens
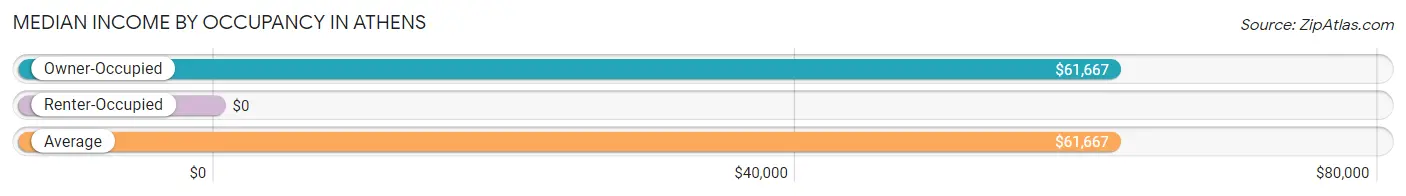
| Occupancy Type | # Households | Median Income |
| Owner-Occupied | 194 (70.3%) | $61,667 |
| Renter-Occupied | 82 (29.7%) | $0 |
| Average | 276 (100.0%) | $61,667 |
Occupancy by Householder Income Bracket in Athens
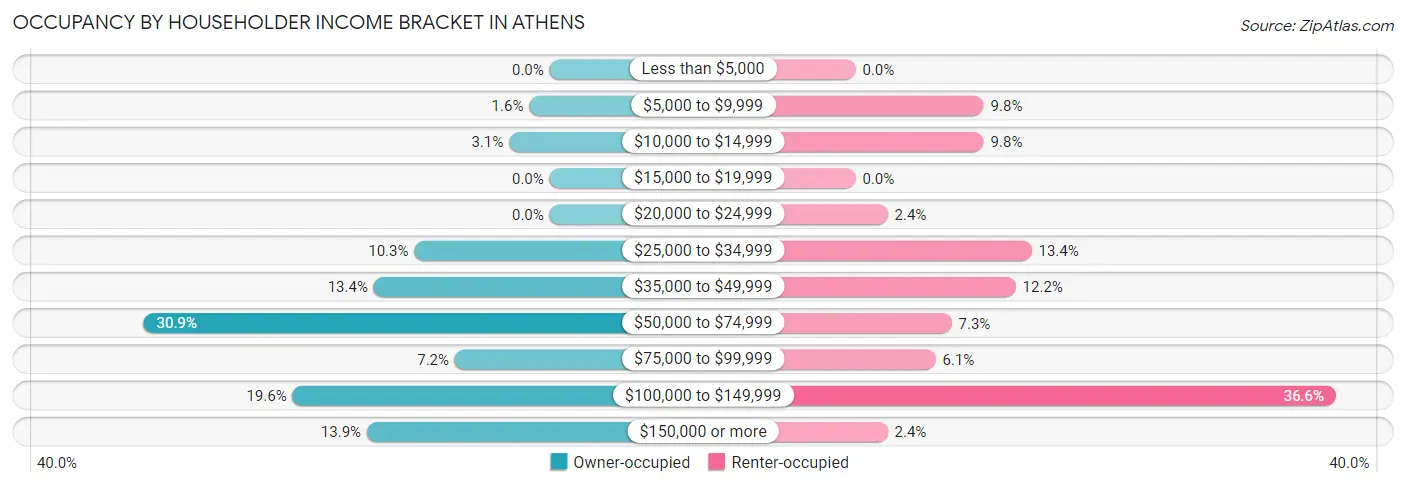
| Income Bracket | Owner-occupied | Renter-occupied |
| Less than $5,000 | 0 (0.0%) | 0 (0.0%) |
| $5,000 to $9,999 | 3 (1.5%) | 8 (9.8%) |
| $10,000 to $14,999 | 6 (3.1%) | 8 (9.8%) |
| $15,000 to $19,999 | 0 (0.0%) | 0 (0.0%) |
| $20,000 to $24,999 | 0 (0.0%) | 2 (2.4%) |
| $25,000 to $34,999 | 20 (10.3%) | 11 (13.4%) |
| $35,000 to $49,999 | 26 (13.4%) | 10 (12.2%) |
| $50,000 to $74,999 | 60 (30.9%) | 6 (7.3%) |
| $75,000 to $99,999 | 14 (7.2%) | 5 (6.1%) |
| $100,000 to $149,999 | 38 (19.6%) | 30 (36.6%) |
| $150,000 or more | 27 (13.9%) | 2 (2.4%) |
| Total | 194 (100.0%) | 82 (100.0%) |
Monthly Housing Cost Tiers in Athens
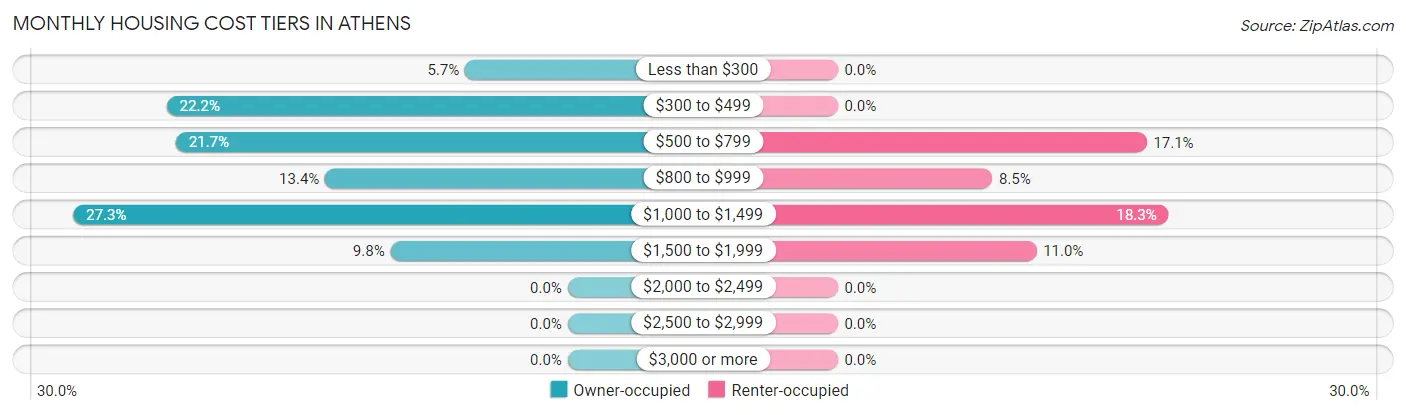
| Monthly Cost | Owner-occupied | Renter-occupied |
| Less than $300 | 11 (5.7%) | 0 (0.0%) |
| $300 to $499 | 43 (22.2%) | 0 (0.0%) |
| $500 to $799 | 42 (21.6%) | 14 (17.1%) |
| $800 to $999 | 26 (13.4%) | 7 (8.5%) |
| $1,000 to $1,499 | 53 (27.3%) | 15 (18.3%) |
| $1,500 to $1,999 | 19 (9.8%) | 9 (11.0%) |
| $2,000 to $2,499 | 0 (0.0%) | 0 (0.0%) |
| $2,500 to $2,999 | 0 (0.0%) | 0 (0.0%) |
| $3,000 or more | 0 (0.0%) | 0 (0.0%) |
| Total | 194 (100.0%) | 82 (100.0%) |
Physical Housing Characteristics in Athens
Housing Structures in Athens
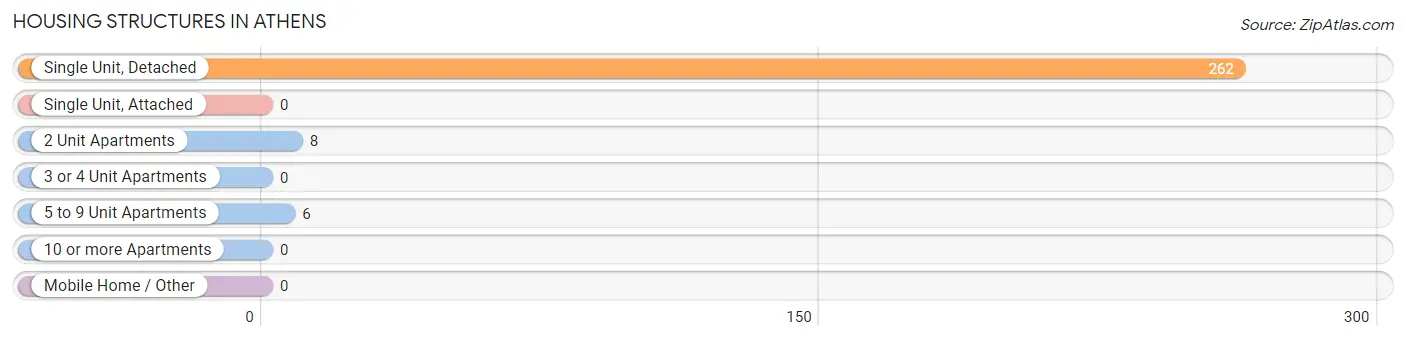
| Structure Type | # Housing Units | % Housing Units |
| Single Unit, Detached | 262 | 94.9% |
| Single Unit, Attached | 0 | 0.0% |
| 2 Unit Apartments | 8 | 2.9% |
| 3 or 4 Unit Apartments | 0 | 0.0% |
| 5 to 9 Unit Apartments | 6 | 2.2% |
| 10 or more Apartments | 0 | 0.0% |
| Mobile Home / Other | 0 | 0.0% |
| Total | 276 | 100.0% |
Housing Structures by Occupancy in Athens
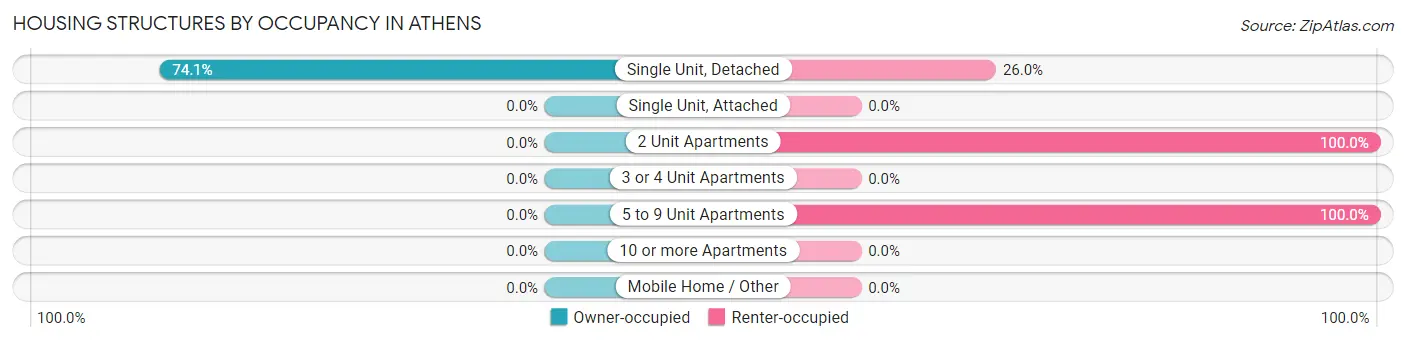
| Structure Type | Owner-occupied | Renter-occupied |
| Single Unit, Detached | 194 (74.1%) | 68 (26.0%) |
| Single Unit, Attached | 0 (0.0%) | 0 (0.0%) |
| 2 Unit Apartments | 0 (0.0%) | 8 (100.0%) |
| 3 or 4 Unit Apartments | 0 (0.0%) | 0 (0.0%) |
| 5 to 9 Unit Apartments | 0 (0.0%) | 6 (100.0%) |
| 10 or more Apartments | 0 (0.0%) | 0 (0.0%) |
| Mobile Home / Other | 0 (0.0%) | 0 (0.0%) |
| Total | 194 (70.3%) | 82 (29.7%) |
Housing Structures by Number of Rooms in Athens
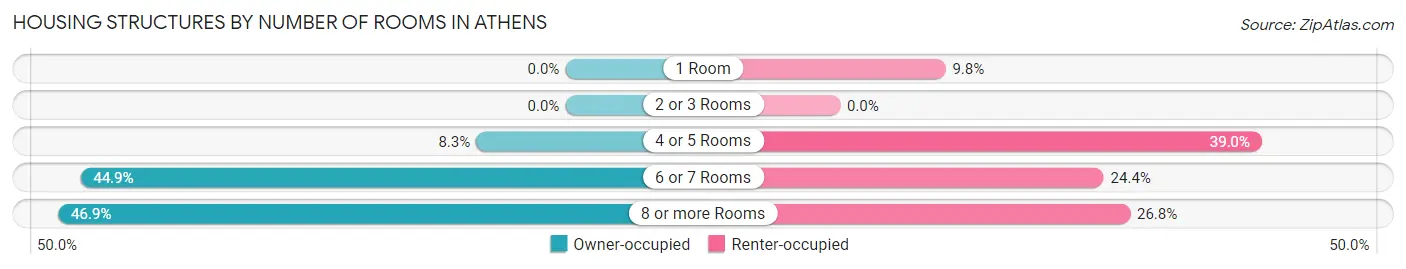
| Number of Rooms | Owner-occupied | Renter-occupied |
| 1 Room | 0 (0.0%) | 8 (9.8%) |
| 2 or 3 Rooms | 0 (0.0%) | 0 (0.0%) |
| 4 or 5 Rooms | 16 (8.3%) | 32 (39.0%) |
| 6 or 7 Rooms | 87 (44.9%) | 20 (24.4%) |
| 8 or more Rooms | 91 (46.9%) | 22 (26.8%) |
| Total | 194 (100.0%) | 82 (100.0%) |
Housing Structure by Heating Type in Athens
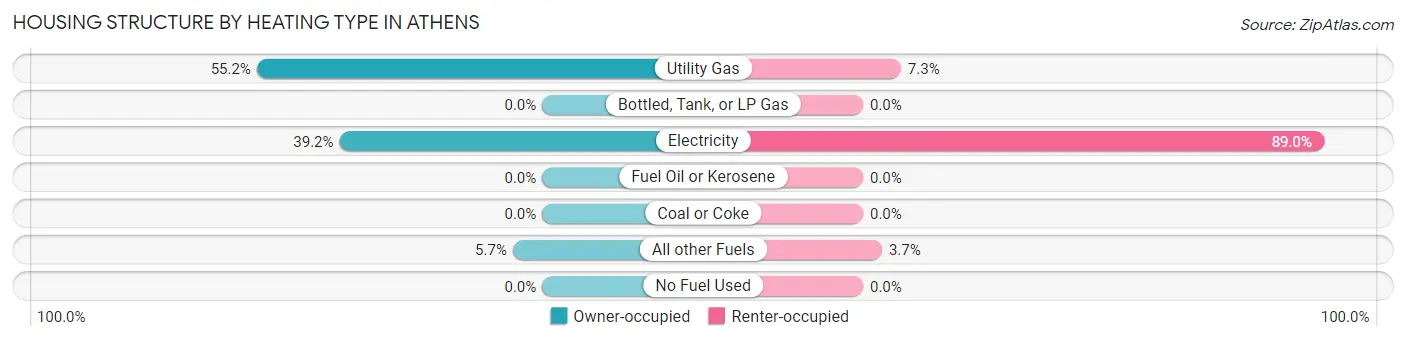
| Heating Type | Owner-occupied | Renter-occupied |
| Utility Gas | 107 (55.1%) | 6 (7.3%) |
| Bottled, Tank, or LP Gas | 0 (0.0%) | 0 (0.0%) |
| Electricity | 76 (39.2%) | 73 (89.0%) |
| Fuel Oil or Kerosene | 0 (0.0%) | 0 (0.0%) |
| Coal or Coke | 0 (0.0%) | 0 (0.0%) |
| All other Fuels | 11 (5.7%) | 3 (3.7%) |
| No Fuel Used | 0 (0.0%) | 0 (0.0%) |
| Total | 194 (100.0%) | 82 (100.0%) |
Household Vehicle Usage in Athens
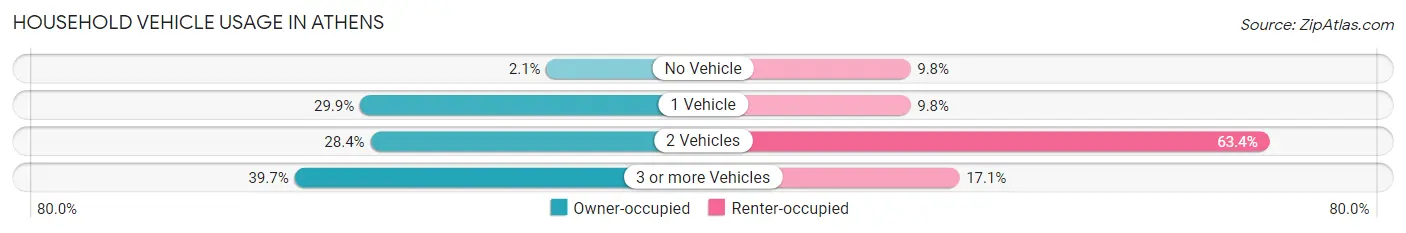
| Vehicles per Household | Owner-occupied | Renter-occupied |
| No Vehicle | 4 (2.1%) | 8 (9.8%) |
| 1 Vehicle | 58 (29.9%) | 8 (9.8%) |
| 2 Vehicles | 55 (28.3%) | 52 (63.4%) |
| 3 or more Vehicles | 77 (39.7%) | 14 (17.1%) |
| Total | 194 (100.0%) | 82 (100.0%) |
Real Estate & Mortgages in Athens
Real Estate and Mortgage Overview in Athens
| Characteristic | Without Mortgage | With Mortgage |
| Housing Units | 114 | 80 |
| Median Property Value | $176,400 | $185,700 |
| Median Household Income | $68,750 | $6 |
| Monthly Housing Costs | $520 | $0 |
| Real Estate Taxes | $829 | $3 |
Property Value by Mortgage Status in Athens
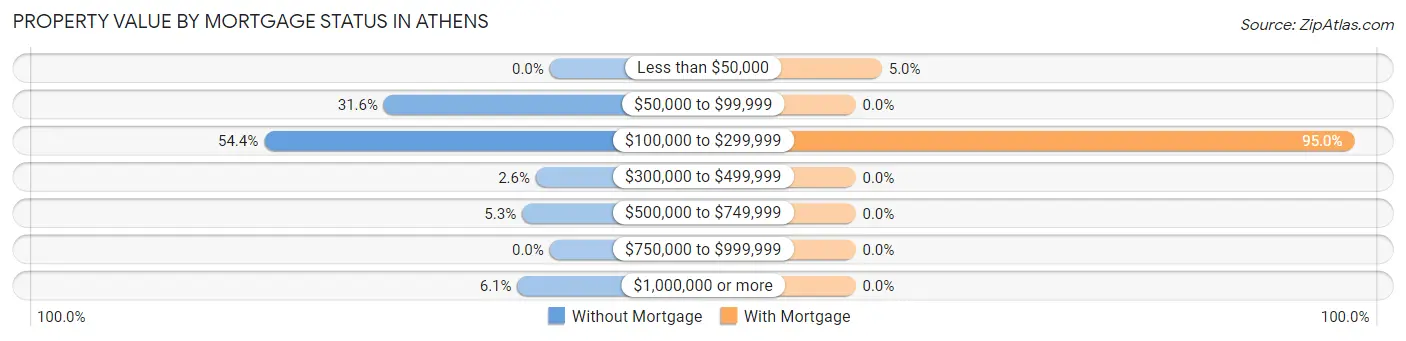
| Property Value | Without Mortgage | With Mortgage |
| Less than $50,000 | 0 (0.0%) | 4 (5.0%) |
| $50,000 to $99,999 | 36 (31.6%) | 0 (0.0%) |
| $100,000 to $299,999 | 62 (54.4%) | 76 (95.0%) |
| $300,000 to $499,999 | 3 (2.6%) | 0 (0.0%) |
| $500,000 to $749,999 | 6 (5.3%) | 0 (0.0%) |
| $750,000 to $999,999 | 0 (0.0%) | 0 (0.0%) |
| $1,000,000 or more | 7 (6.1%) | 0 (0.0%) |
| Total | 114 (100.0%) | 80 (100.0%) |
Household Income by Mortgage Status in Athens
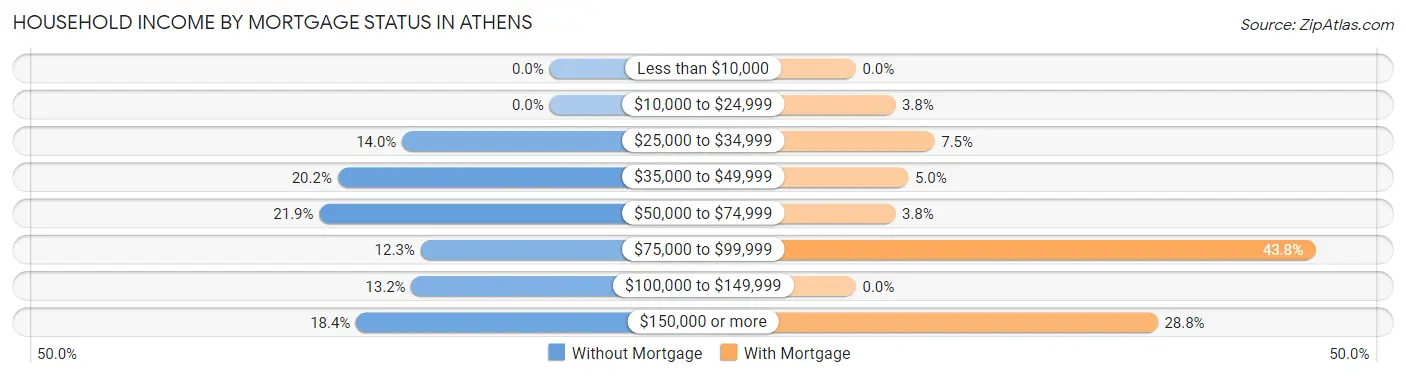
| Household Income | Without Mortgage | With Mortgage |
| Less than $10,000 | 0 (0.0%) | 0 (0.0%) |
| $10,000 to $24,999 | 0 (0.0%) | 3 (3.7%) |
| $25,000 to $34,999 | 16 (14.0%) | 6 (7.5%) |
| $35,000 to $49,999 | 23 (20.2%) | 4 (5.0%) |
| $50,000 to $74,999 | 25 (21.9%) | 3 (3.7%) |
| $75,000 to $99,999 | 14 (12.3%) | 35 (43.8%) |
| $100,000 to $149,999 | 15 (13.2%) | 0 (0.0%) |
| $150,000 or more | 21 (18.4%) | 23 (28.7%) |
| Total | 114 (100.0%) | 80 (100.0%) |
Property Value to Household Income Ratio in Athens
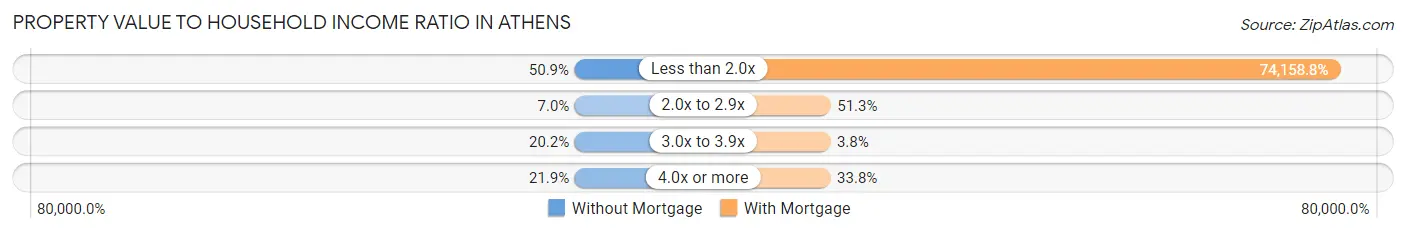
| Value-to-Income Ratio | Without Mortgage | With Mortgage |
| Less than 2.0x | 58 (50.9%) | 59,327 (74,158.7%) |
| 2.0x to 2.9x | 8 (7.0%) | 41 (51.2%) |
| 3.0x to 3.9x | 23 (20.2%) | 3 (3.7%) |
| 4.0x or more | 25 (21.9%) | 27 (33.8%) |
| Total | 114 (100.0%) | 80 (100.0%) |
Real Estate Taxes by Mortgage Status in Athens
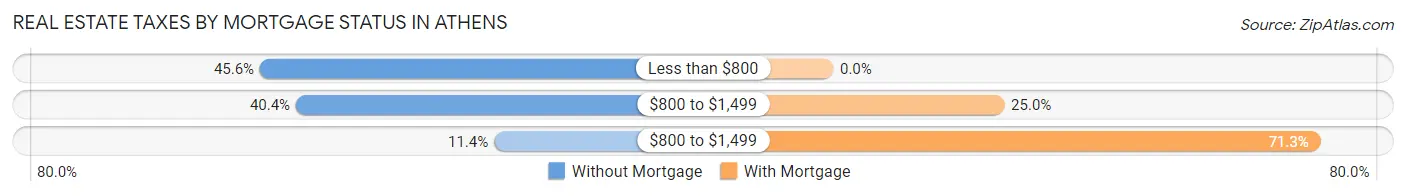
| Property Taxes | Without Mortgage | With Mortgage |
| Less than $800 | 52 (45.6%) | 0 (0.0%) |
| $800 to $1,499 | 46 (40.4%) | 20 (25.0%) |
| $800 to $1,499 | 13 (11.4%) | 57 (71.3%) |
| Total | 114 (100.0%) | 80 (100.0%) |
Health & Disability in Athens
Health Insurance Coverage by Age in Athens
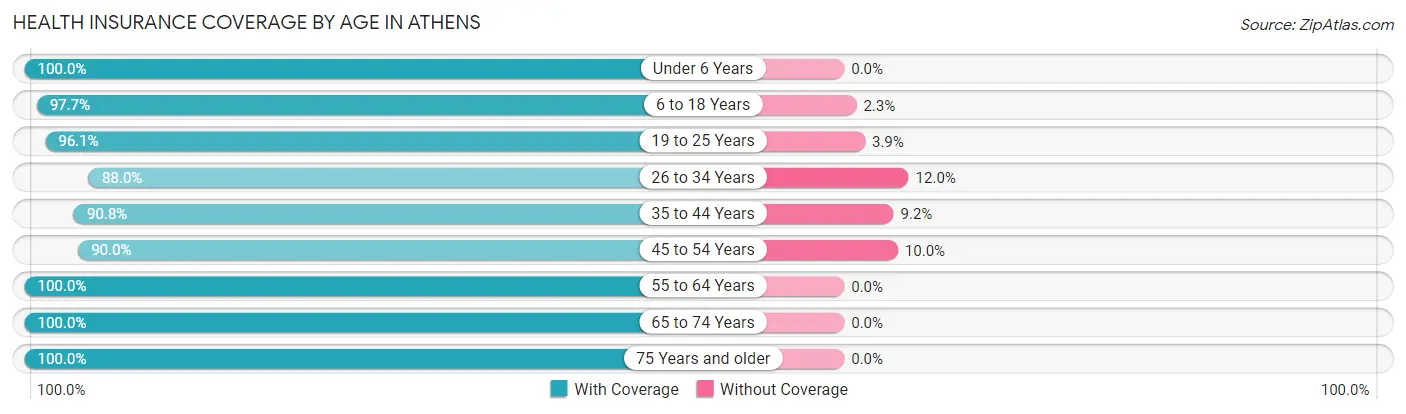
| Age Bracket | With Coverage | Without Coverage |
| Under 6 Years | 55 (100.0%) | 0 (0.0%) |
| 6 to 18 Years | 258 (97.7%) | 6 (2.3%) |
| 19 to 25 Years | 249 (96.1%) | 10 (3.9%) |
| 26 to 34 Years | 88 (88.0%) | 12 (12.0%) |
| 35 to 44 Years | 79 (90.8%) | 8 (9.2%) |
| 45 to 54 Years | 81 (90.0%) | 9 (10.0%) |
| 55 to 64 Years | 126 (100.0%) | 0 (0.0%) |
| 65 to 74 Years | 99 (100.0%) | 0 (0.0%) |
| 75 Years and older | 66 (100.0%) | 0 (0.0%) |
| Total | 1,101 (96.1%) | 45 (3.9%) |
Health Insurance Coverage by Citizenship Status in Athens
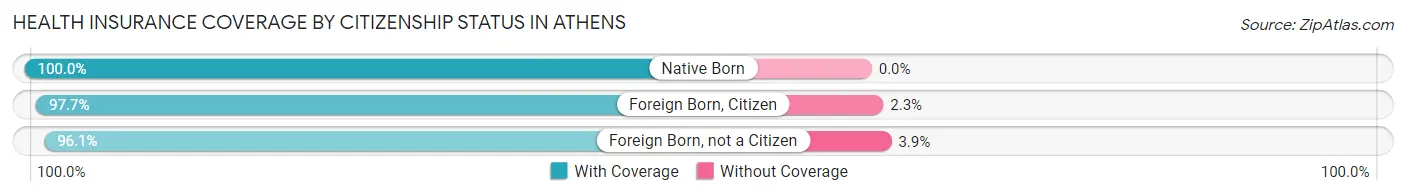
| Citizenship Status | With Coverage | Without Coverage |
| Native Born | 55 (100.0%) | 0 (0.0%) |
| Foreign Born, Citizen | 258 (97.7%) | 6 (2.3%) |
| Foreign Born, not a Citizen | 249 (96.1%) | 10 (3.9%) |
Health Insurance Coverage by Household Income in Athens
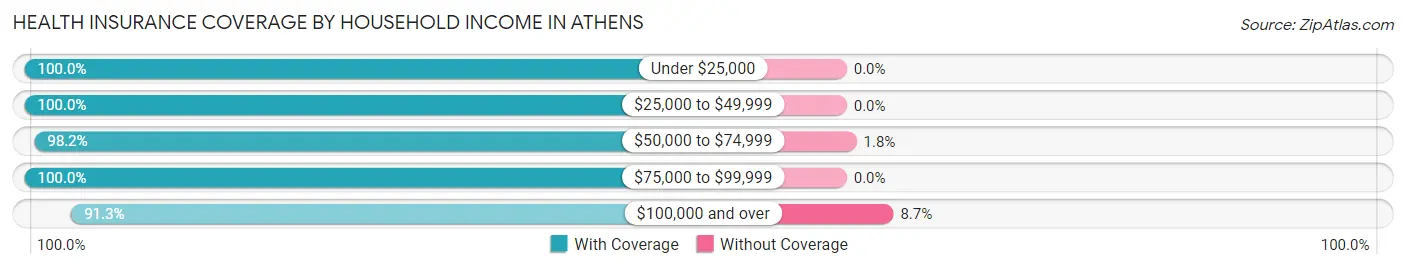
| Household Income | With Coverage | Without Coverage |
| Under $25,000 | 79 (100.0%) | 0 (0.0%) |
| $25,000 to $49,999 | 130 (100.0%) | 0 (0.0%) |
| $50,000 to $74,999 | 320 (98.2%) | 6 (1.8%) |
| $75,000 to $99,999 | 43 (100.0%) | 0 (0.0%) |
| $100,000 and over | 334 (91.3%) | 32 (8.7%) |
Public vs Private Health Insurance Coverage by Age in Athens
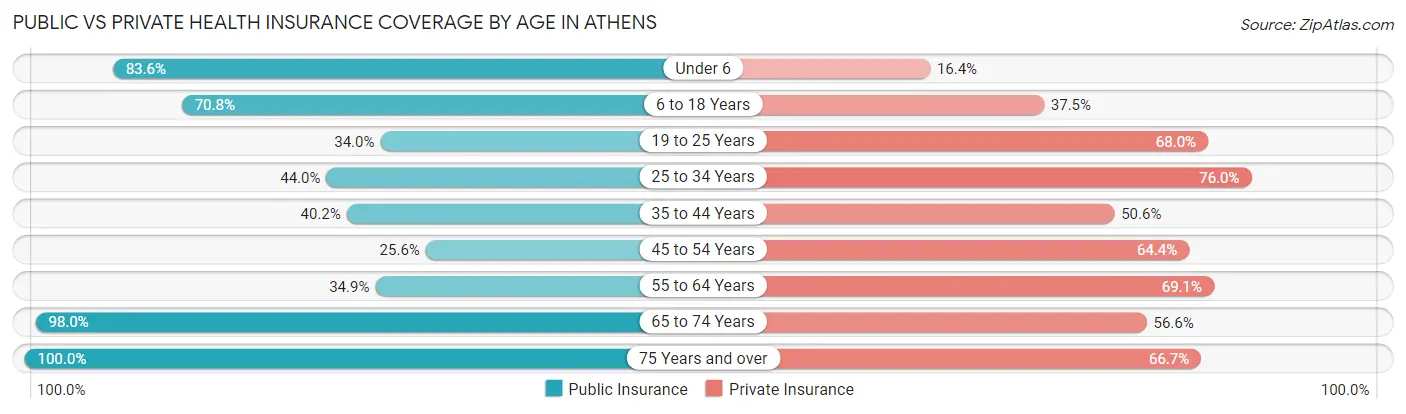
| Age Bracket | Public Insurance | Private Insurance |
| Under 6 | 46 (83.6%) | 9 (16.4%) |
| 6 to 18 Years | 187 (70.8%) | 99 (37.5%) |
| 19 to 25 Years | 88 (34.0%) | 176 (67.9%) |
| 25 to 34 Years | 44 (44.0%) | 76 (76.0%) |
| 35 to 44 Years | 35 (40.2%) | 44 (50.6%) |
| 45 to 54 Years | 23 (25.6%) | 58 (64.4%) |
| 55 to 64 Years | 44 (34.9%) | 87 (69.1%) |
| 65 to 74 Years | 97 (98.0%) | 56 (56.6%) |
| 75 Years and over | 66 (100.0%) | 44 (66.7%) |
| Total | 630 (55.0%) | 649 (56.6%) |
Disability Status by Sex by Age in Athens
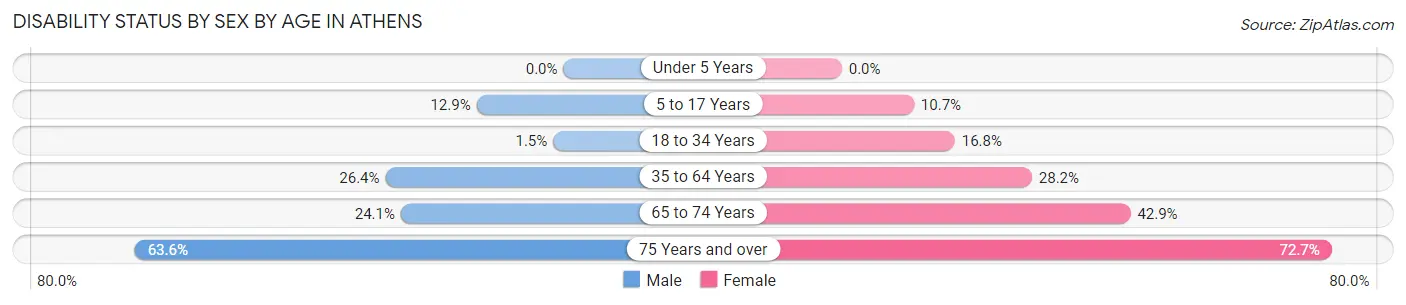
| Age Bracket | Male | Female |
| Under 5 Years | 0 (0.0%) | 0 (0.0%) |
| 5 to 17 Years | 8 (12.9%) | 18 (10.7%) |
| 18 to 34 Years | 4 (1.5%) | 24 (16.8%) |
| 35 to 64 Years | 37 (26.4%) | 46 (28.2%) |
| 65 to 74 Years | 7 (24.1%) | 30 (42.9%) |
| 75 Years and over | 14 (63.6%) | 32 (72.7%) |
Disability Class by Sex by Age in Athens
Disability Class: Hearing Difficulty
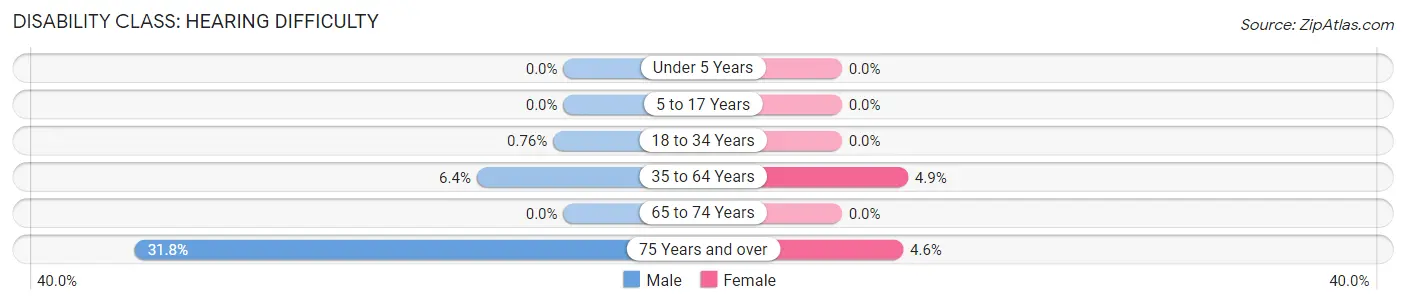
| Age Bracket | Male | Female |
| Under 5 Years | 0 (0.0%) | 0 (0.0%) |
| 5 to 17 Years | 0 (0.0%) | 0 (0.0%) |
| 18 to 34 Years | 2 (0.8%) | 0 (0.0%) |
| 35 to 64 Years | 9 (6.4%) | 8 (4.9%) |
| 65 to 74 Years | 0 (0.0%) | 0 (0.0%) |
| 75 Years and over | 7 (31.8%) | 2 (4.5%) |
Disability Class: Vision Difficulty
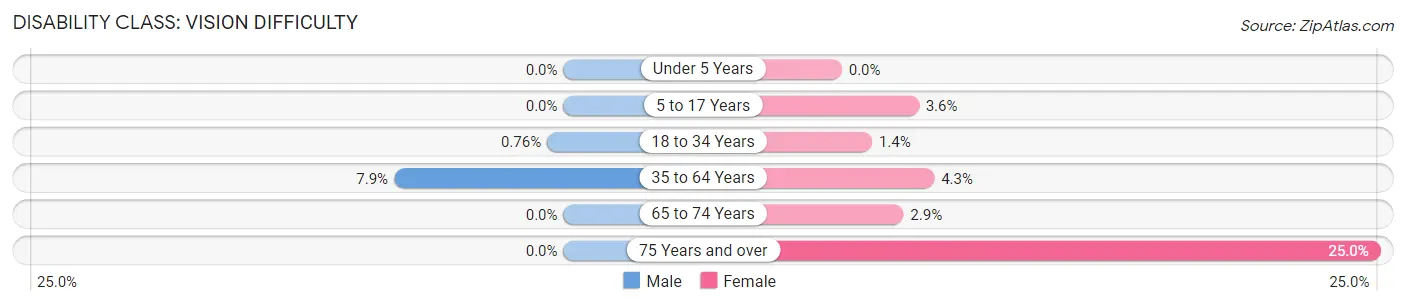
| Age Bracket | Male | Female |
| Under 5 Years | 0 (0.0%) | 0 (0.0%) |
| 5 to 17 Years | 0 (0.0%) | 6 (3.6%) |
| 18 to 34 Years | 2 (0.8%) | 2 (1.4%) |
| 35 to 64 Years | 11 (7.9%) | 7 (4.3%) |
| 65 to 74 Years | 0 (0.0%) | 2 (2.9%) |
| 75 Years and over | 0 (0.0%) | 11 (25.0%) |
Disability Class: Cognitive Difficulty
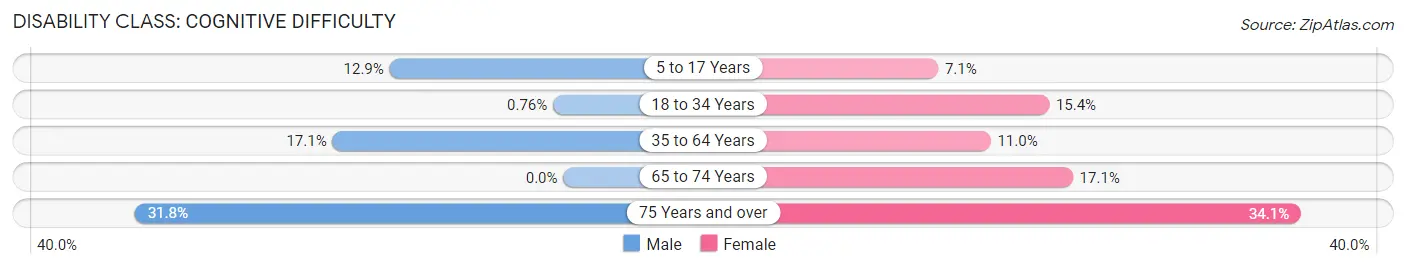
| Age Bracket | Male | Female |
| 5 to 17 Years | 8 (12.9%) | 12 (7.1%) |
| 18 to 34 Years | 2 (0.8%) | 22 (15.4%) |
| 35 to 64 Years | 24 (17.1%) | 18 (11.0%) |
| 65 to 74 Years | 0 (0.0%) | 12 (17.1%) |
| 75 Years and over | 7 (31.8%) | 15 (34.1%) |
Disability Class: Ambulatory Difficulty
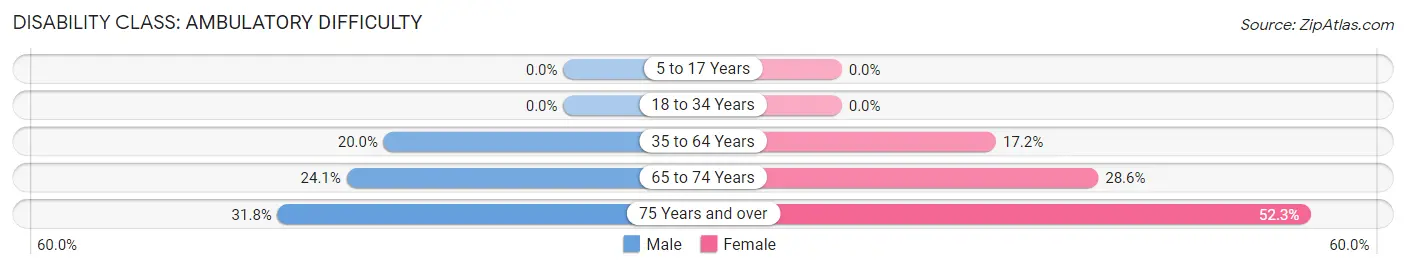
| Age Bracket | Male | Female |
| 5 to 17 Years | 0 (0.0%) | 0 (0.0%) |
| 18 to 34 Years | 0 (0.0%) | 0 (0.0%) |
| 35 to 64 Years | 28 (20.0%) | 28 (17.2%) |
| 65 to 74 Years | 7 (24.1%) | 20 (28.6%) |
| 75 Years and over | 7 (31.8%) | 23 (52.3%) |
Disability Class: Self-Care Difficulty
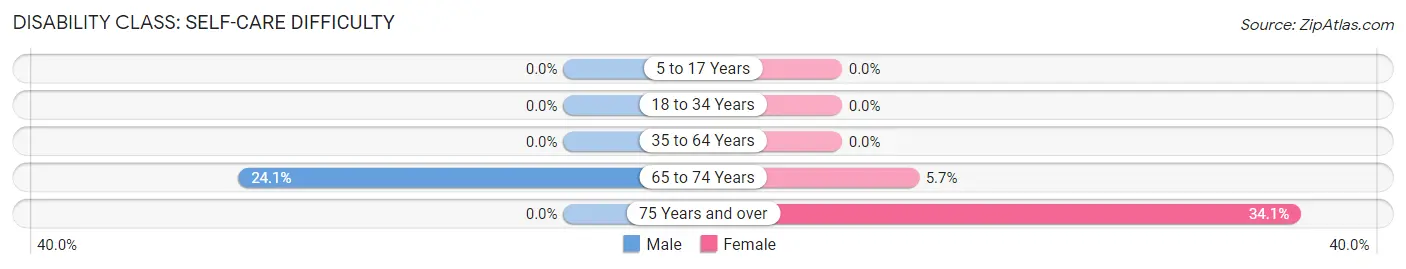
| Age Bracket | Male | Female |
| 5 to 17 Years | 0 (0.0%) | 0 (0.0%) |
| 18 to 34 Years | 0 (0.0%) | 0 (0.0%) |
| 35 to 64 Years | 0 (0.0%) | 0 (0.0%) |
| 65 to 74 Years | 7 (24.1%) | 4 (5.7%) |
| 75 Years and over | 0 (0.0%) | 15 (34.1%) |
Technology Access in Athens
Computing Device Access in Athens
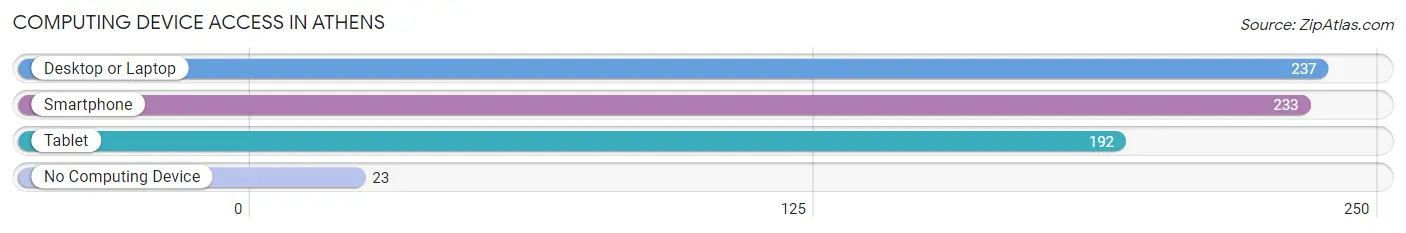
| Device Type | # Households | % Households |
| Desktop or Laptop | 237 | 85.9% |
| Smartphone | 233 | 84.4% |
| Tablet | 192 | 69.6% |
| No Computing Device | 23 | 8.3% |
| Total | 276 | 100.0% |
Internet Access in Athens
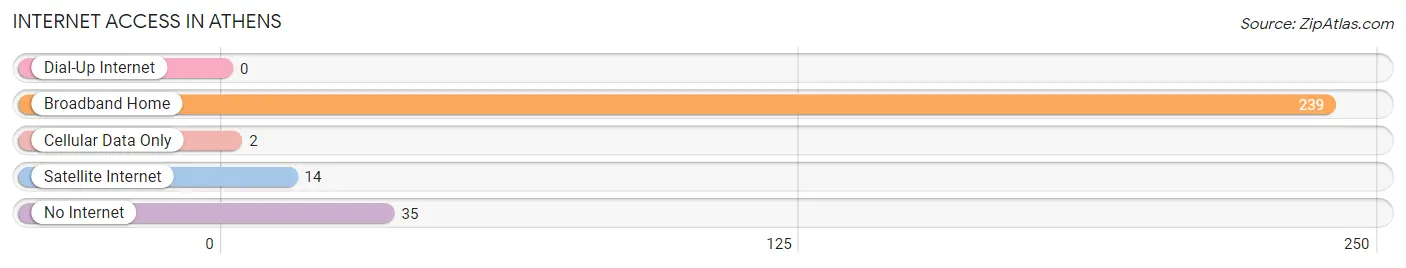
| Internet Type | # Households | % Households |
| Dial-Up Internet | 0 | 0.0% |
| Broadband Home | 239 | 86.6% |
| Cellular Data Only | 2 | 0.7% |
| Satellite Internet | 14 | 5.1% |
| No Internet | 35 | 12.7% |
| Total | 276 | 100.0% |
Athens Summary
Athens, West Virginia is a small town located in Mercer County, West Virginia. It is situated in the Appalachian Mountains and is part of the Bluefield, WV-VA Metropolitan Statistical Area. The town has a population of 1,845 people, according to the 2010 census.
Geography
Athens is located in the Appalachian Mountains of West Virginia. It is situated in the Bluefield, WV-VA Metropolitan Statistical Area. The town is located at the intersection of US Route 19 and West Virginia Route 20. The town is surrounded by the Bluestone River, which is a tributary of the New River. The town is located at an elevation of 1,845 feet above sea level.
History
Athens was founded in 1883 by the Mercer County Coal and Iron Company. The town was named after Athens, Greece, and was originally intended to be a coal mining town. The town was incorporated in 1891.
Athens was a major coal mining town in the early 20th century. The town was home to several coal mines, including the Mercer County Coal and Iron Company, the Athens Coal Company, and the Athens Coal and Coke Company. The town was also home to several other industries, including a sawmill, a brickyard, and a tannery.
Athens was also home to several educational institutions, including the Athens Academy, the Athens High School, and the Athens Normal School. The town was also home to several churches, including the First Baptist Church, the First Methodist Church, and the First Presbyterian Church.
Economy
Athens is a small town with a limited economy. The town is home to several small businesses, including a grocery store, a hardware store, and a restaurant. The town is also home to several small manufacturing companies, including a furniture manufacturer and a woodworking company.
The town is also home to several coal mines, including the Mercer County Coal and Iron Company, the Athens Coal Company, and the Athens Coal and Coke Company. The town is also home to several other industries, including a sawmill, a brickyard, and a tannery.
Demographics
Athens has a population of 1,845 people, according to the 2010 census. The town has a median age of 43.7 years, and a median household income of $30,938. The town is predominantly white, with 92.3% of the population identifying as white. The town is also home to a small African American population, with 4.2% of the population identifying as African American.
Conclusion
Athens, West Virginia is a small town located in Mercer County, West Virginia. It is situated in the Appalachian Mountains and is part of the Bluefield, WV-VA Metropolitan Statistical Area. The town has a population of 1,845 people, according to the 2010 census. Athens was founded in 1883 by the Mercer County Coal and Iron Company and was originally intended to be a coal mining town. The town is home to several small businesses, including a grocery store, a hardware store, and a restaurant. The town is also home to several coal mines, including the Mercer County Coal and Iron Company, the Athens Coal Company, and the Athens Coal and Coke Company. The town is predominantly white, with 92.3% of the population identifying as white. The town is also home to a small African American population, with 4.2% of the population identifying as African American.
Common Questions
What is Per Capita Income in Athens?
Per Capita income in Athens is $20,639.
What is the Median Family Income in Athens?
Median Family Income in Athens is $66,250.
What is the Median Household income in Athens?
Median Household Income in Athens is $61,667.
What is Inequality or Gini Index in Athens?
Inequality or Gini Index in Athens is 0.37.
What is the Total Population of Athens?
Total Population of Athens is 1,146.
What is the Total Male Population of Athens?
Total Male Population of Athens is 544.
What is the Total Female Population of Athens?
Total Female Population of Athens is 602.
What is the Ratio of Males per 100 Females in Athens?
There are 90.37 Males per 100 Females in Athens.
What is the Ratio of Females per 100 Males in Athens?
There are 110.66 Females per 100 Males in Athens.
What is the Median Population Age in Athens?
Median Population Age in Athens is 24.5 Years.
What is the Average Family Size in Athens
Average Family Size in Athens is 3.4 People.
What is the Average Household Size in Athens
Average Household Size in Athens is 3.4 People.
How Large is the Labor Force in Athens?
There are 451 People in the Labor Forcein in Athens.
What is the Percentage of People in the Labor Force in Athens?
48.2% of People are in the Labor Force in Athens.
What is the Unemployment Rate in Athens?
Unemployment Rate in Athens is 10.2%.