Arbovale, WV Map & Demographics
Arbovale Map
Arbovale Overview
$38,913
PER CAPITA INCOME
$52,692
AVG HOUSEHOLD INCOME
0.35
INEQUALITY / GINI INDEX
160
TOTAL POPULATION
66
MALE POPULATION
94
FEMALE POPULATION
70.21
MALES / 100 FEMALES
142.42
FEMALES / 100 MALES
51.4
MEDIAN AGE
2.6
AVG FAMILY SIZE
2.2
AVG HOUSEHOLD SIZE
70
LABOR FORCE [ PEOPLE ]
50.7%
PERCENT IN LABOR FORCE
Arbovale Zip Codes
Income in Arbovale
Income Overview in Arbovale
| Characteristic | Number | Measure |
| Per Capita Income | 160 | $38,913 |
| Median Family Income | 27 | $0 |
| Mean Family Income | 27 | $68,000 |
| Median Household Income | 74 | $52,692 |
| Mean Household Income | 74 | $83,178 |
| Income Deficit | 27 | $0 |
| Wage / Income Gap (%) | 160 | 0.00% |
| Wage / Income Gap ($) | 160 | 100.00¢ per $1 |
| Gini / Inequality Index | 160 | 0.35 |
Earnings by Sex in Arbovale
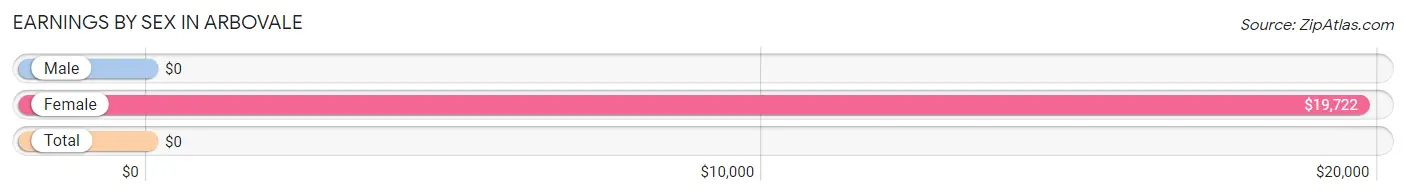
| Sex | Number | Average Earnings |
| Male | 14 (17.9%) | $0 |
| Female | 64 (82.1%) | $19,722 |
| Total | 78 (100.0%) | $0 |
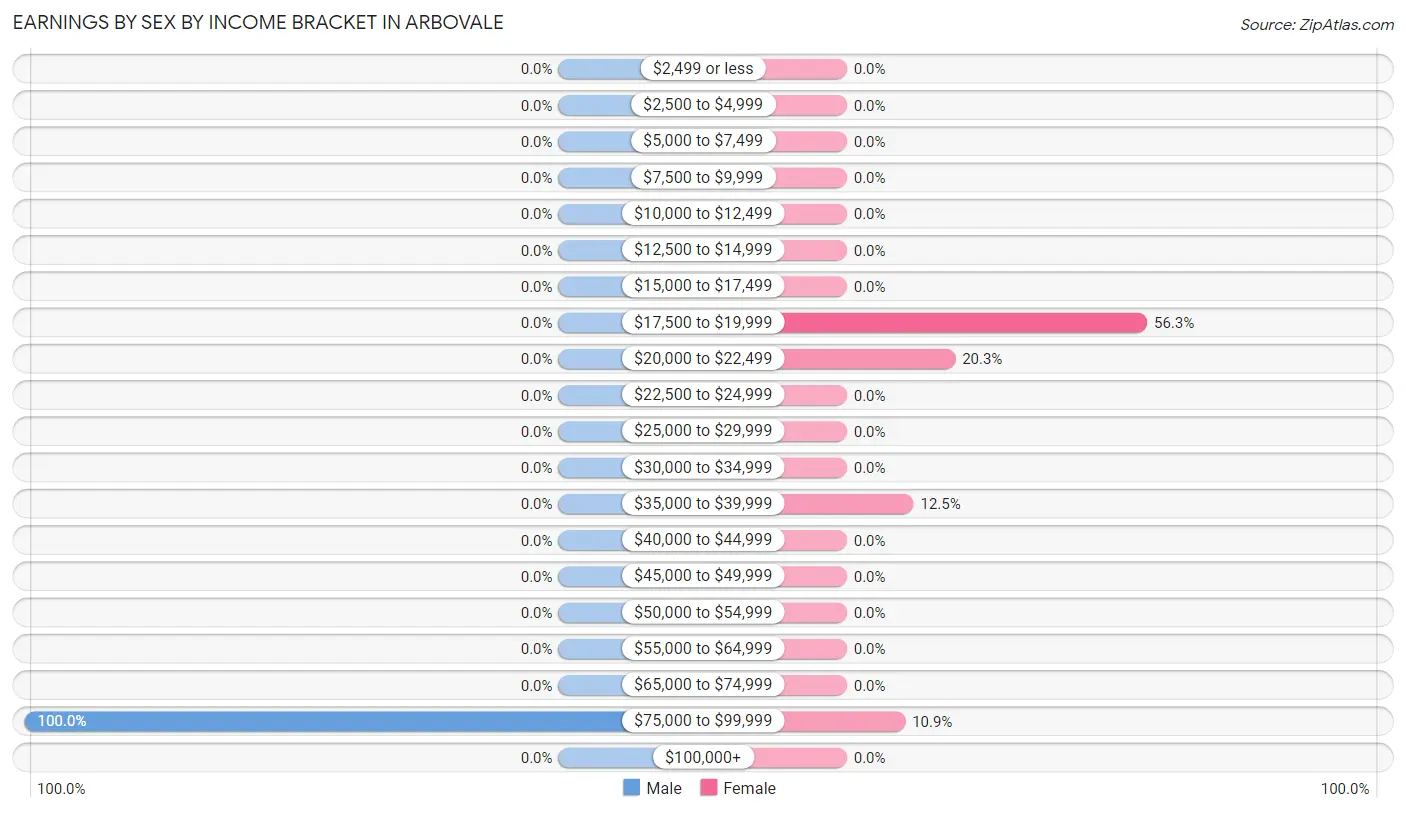
Earnings by Sex by Income Bracket in Arbovale
The most common earnings brackets in Arbovale are $75,000 to $99,999 for men (14 | 100.0%) and $17,500 to $19,999 for women (36 | 56.2%).
| Income | Male | Female |
| $2,499 or less | 0 (0.0%) | 0 (0.0%) |
| $2,500 to $4,999 | 0 (0.0%) | 0 (0.0%) |
| $5,000 to $7,499 | 0 (0.0%) | 0 (0.0%) |
| $7,500 to $9,999 | 0 (0.0%) | 0 (0.0%) |
| $10,000 to $12,499 | 0 (0.0%) | 0 (0.0%) |
| $12,500 to $14,999 | 0 (0.0%) | 0 (0.0%) |
| $15,000 to $17,499 | 0 (0.0%) | 0 (0.0%) |
| $17,500 to $19,999 | 0 (0.0%) | 36 (56.2%) |
| $20,000 to $22,499 | 0 (0.0%) | 13 (20.3%) |
| $22,500 to $24,999 | 0 (0.0%) | 0 (0.0%) |
| $25,000 to $29,999 | 0 (0.0%) | 0 (0.0%) |
| $30,000 to $34,999 | 0 (0.0%) | 0 (0.0%) |
| $35,000 to $39,999 | 0 (0.0%) | 8 (12.5%) |
| $40,000 to $44,999 | 0 (0.0%) | 0 (0.0%) |
| $45,000 to $49,999 | 0 (0.0%) | 0 (0.0%) |
| $50,000 to $54,999 | 0 (0.0%) | 0 (0.0%) |
| $55,000 to $64,999 | 0 (0.0%) | 0 (0.0%) |
| $65,000 to $74,999 | 0 (0.0%) | 0 (0.0%) |
| $75,000 to $99,999 | 14 (100.0%) | 7 (10.9%) |
| $100,000+ | 0 (0.0%) | 0 (0.0%) |
| Total | 14 (100.0%) | 64 (100.0%) |
Earnings by Sex by Educational Attainment in Arbovale
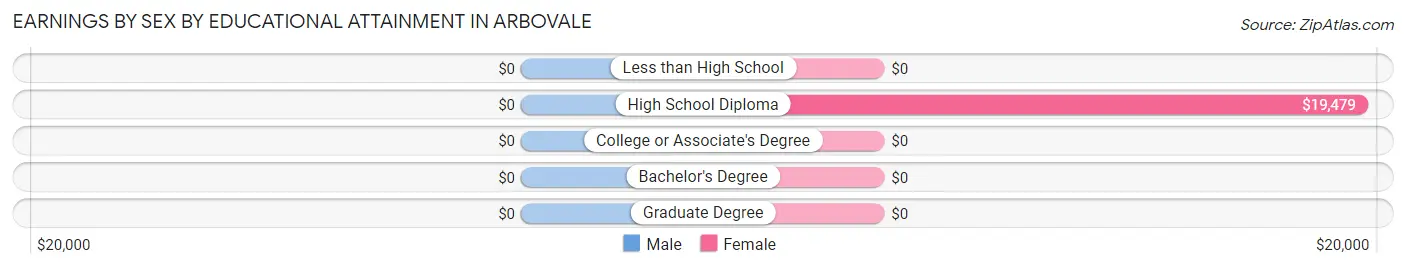
| Educational Attainment | Male Income | Female Income |
| Less than High School | - | - |
| High School Diploma | - | - |
| College or Associate's Degree | - | - |
| Bachelor's Degree | - | - |
| Graduate Degree | - | - |
| Total | - | - |
Family Income in Arbovale
Family Income Brackets in Arbovale
According to the Arbovale family income data, there are 13 families falling into the $15,000 to $24,999 income range, which is the most common income bracket and makes up 48.1% of all families.
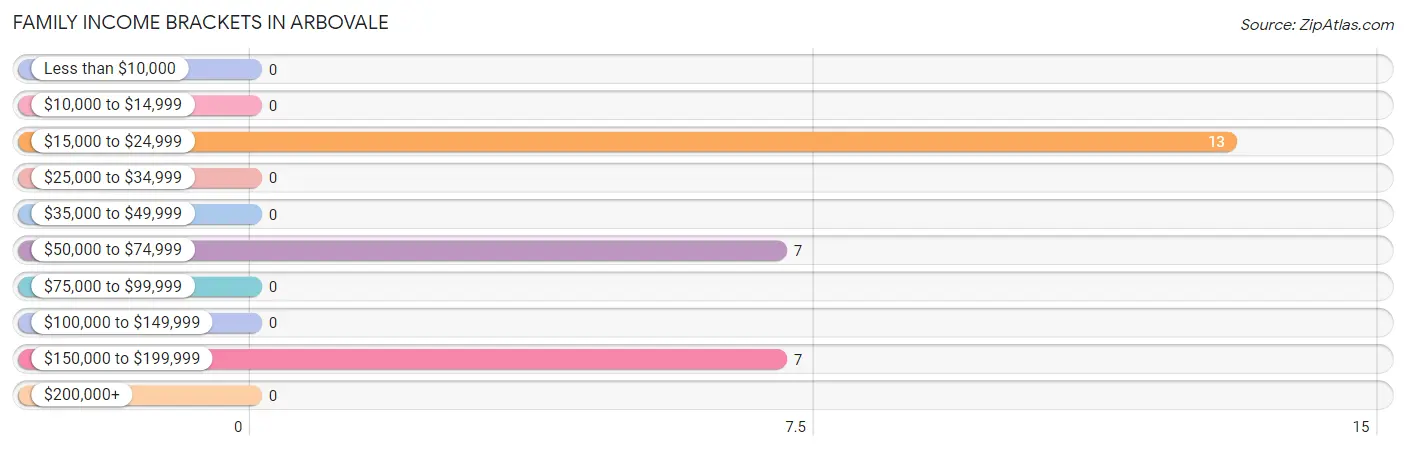
| Income Bracket | # Families | % Families |
| Less than $10,000 | 0 | 0.0% |
| $10,000 to $14,999 | 0 | 0.0% |
| $15,000 to $24,999 | 13 | 48.1% |
| $25,000 to $34,999 | 0 | 0.0% |
| $35,000 to $49,999 | 0 | 0.0% |
| $50,000 to $74,999 | 7 | 25.9% |
| $75,000 to $99,999 | 0 | 0.0% |
| $100,000 to $149,999 | 0 | 0.0% |
| $150,000 to $199,999 | 7 | 25.9% |
| $200,000+ | 0 | 0.0% |
Family Income by Famaliy Size in Arbovale
| Income Bracket | # Families | Median Income |
| 2-Person Families | 20 (74.1%) | $0 |
| 3-Person Families | 7 (25.9%) | $0 |
| 4-Person Families | 0 (0.0%) | $0 |
| 5-Person Families | 0 (0.0%) | $0 |
| 6-Person Families | 0 (0.0%) | $0 |
| 7+ Person Families | 0 (0.0%) | $0 |
| Total | 27 (100.0%) | $0 |
Family Income by Number of Earners in Arbovale
| Number of Earners | # Families | Median Income |
| No Earners | 0 (0.0%) | $0 |
| 1 Earner | 20 (74.1%) | $0 |
| 2 Earners | 7 (25.9%) | $0 |
| 3+ Earners | 0 (0.0%) | $0 |
| Total | 27 (100.0%) | $0 |
Household Income in Arbovale
Household Income Brackets in Arbovale
With 36 households falling in the category, the $35,000 to $49,999 income range is the most frequent in Arbovale, accounting for 48.6% of all households.
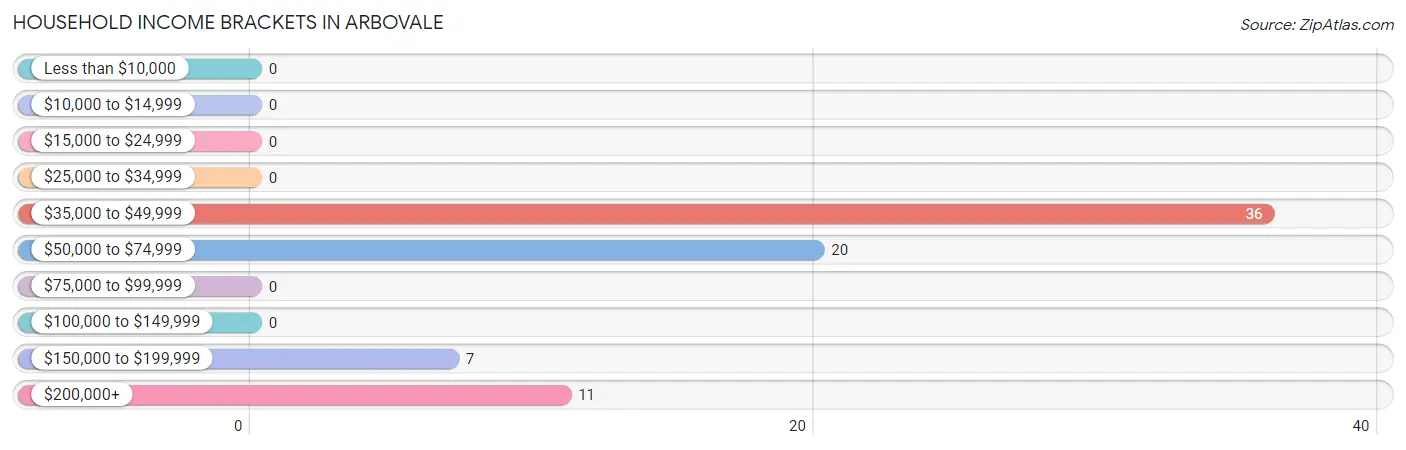
| Income Bracket | # Households | % Households |
| Less than $10,000 | 0 | 0.0% |
| $10,000 to $14,999 | 0 | 0.0% |
| $15,000 to $24,999 | 0 | 0.0% |
| $25,000 to $34,999 | 0 | 0.0% |
| $35,000 to $49,999 | 36 | 48.6% |
| $50,000 to $74,999 | 20 | 27.0% |
| $75,000 to $99,999 | 0 | 0.0% |
| $100,000 to $149,999 | 0 | 0.0% |
| $150,000 to $199,999 | 7 | 9.5% |
| $200,000+ | 11 | 14.9% |
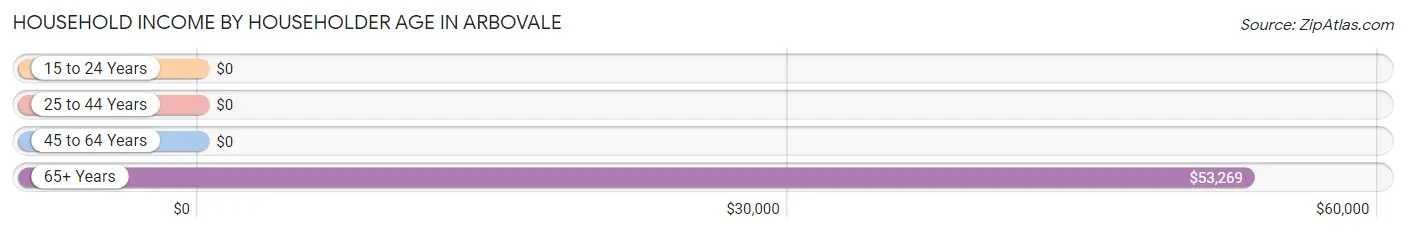
Household Income by Householder Age in Arbovale
The median household income in Arbovale is $52,692, with the highest median household income of $53,269 found in the 65+ years age bracket for the primary householder. A total of 54 households (73.0%) fall into this category.
| Income Bracket | # Households | Median Income |
| 15 to 24 Years | 0 (0.0%) | $0 |
| 25 to 44 Years | 0 (0.0%) | $0 |
| 45 to 64 Years | 20 (27.0%) | $0 |
| 65+ Years | 54 (73.0%) | $53,269 |
| Total | 74 (100.0%) | $52,692 |
Poverty in Arbovale
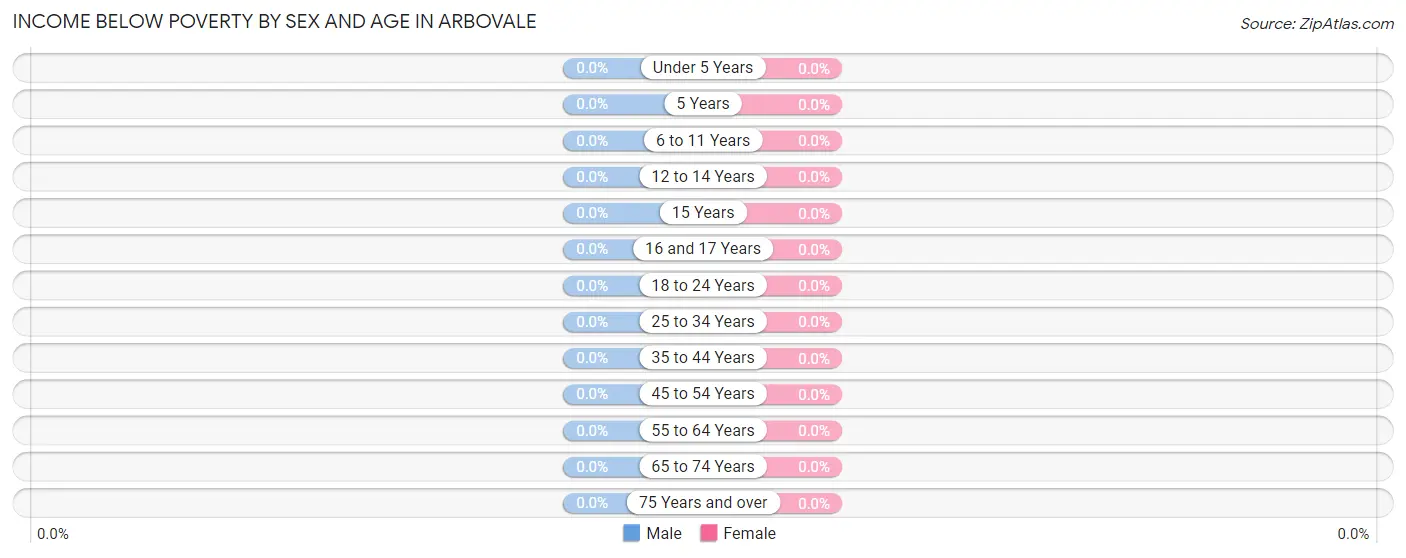
Income Below Poverty by Sex and Age in Arbovale
| Age Bracket | Male | Female |
| Under 5 Years | 0 (0.0%) | 0 (0.0%) |
| 5 Years | 0 (0.0%) | 0 (0.0%) |
| 6 to 11 Years | 0 (0.0%) | 0 (0.0%) |
| 12 to 14 Years | 0 (0.0%) | 0 (0.0%) |
| 15 Years | 0 (0.0%) | 0 (0.0%) |
| 16 and 17 Years | 0 (0.0%) | 0 (0.0%) |
| 18 to 24 Years | 0 (0.0%) | 0 (0.0%) |
| 25 to 34 Years | 0 (0.0%) | 0 (0.0%) |
| 35 to 44 Years | 0 (0.0%) | 0 (0.0%) |
| 45 to 54 Years | 0 (0.0%) | 0 (0.0%) |
| 55 to 64 Years | 0 (0.0%) | 0 (0.0%) |
| 65 to 74 Years | 0 (0.0%) | 0 (0.0%) |
| 75 Years and over | 0 (0.0%) | 0 (0.0%) |
| Total | 0 (0.0%) | 0 (0.0%) |
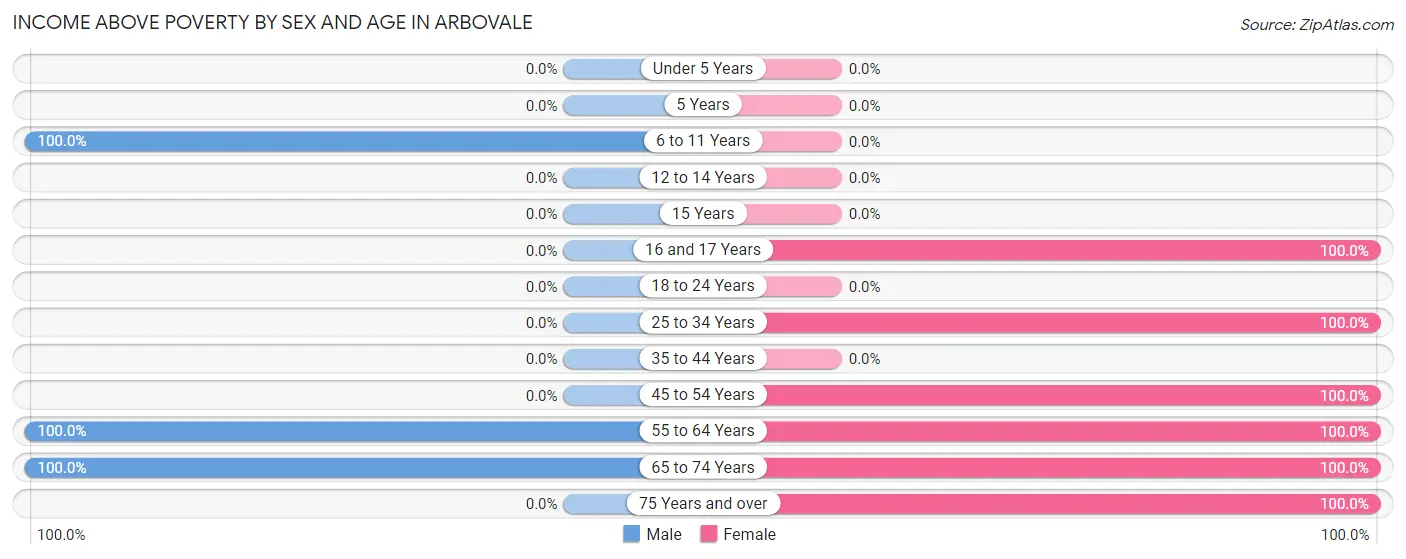
Income Above Poverty by Sex and Age in Arbovale
According to the poverty statistics in Arbovale, males aged 6 to 11 years and females aged 16 and 17 years are the age groups that are most secure financially, with 100.0% of males and 100.0% of females in these age groups living above the poverty line.
| Age Bracket | Male | Female |
| Under 5 Years | 0 (0.0%) | 0 (0.0%) |
| 5 Years | 0 (0.0%) | 0 (0.0%) |
| 6 to 11 Years | 22 (100.0%) | 0 (0.0%) |
| 12 to 14 Years | 0 (0.0%) | 0 (0.0%) |
| 15 Years | 0 (0.0%) | 0 (0.0%) |
| 16 and 17 Years | 0 (0.0%) | 6 (100.0%) |
| 18 to 24 Years | 0 (0.0%) | 0 (0.0%) |
| 25 to 34 Years | 0 (0.0%) | 36 (100.0%) |
| 35 to 44 Years | 0 (0.0%) | 0 (0.0%) |
| 45 to 54 Years | 0 (0.0%) | 20 (100.0%) |
| 55 to 64 Years | 6 (100.0%) | 8 (100.0%) |
| 65 to 74 Years | 38 (100.0%) | 11 (100.0%) |
| 75 Years and over | 0 (0.0%) | 13 (100.0%) |
| Total | 66 (100.0%) | 94 (100.0%) |
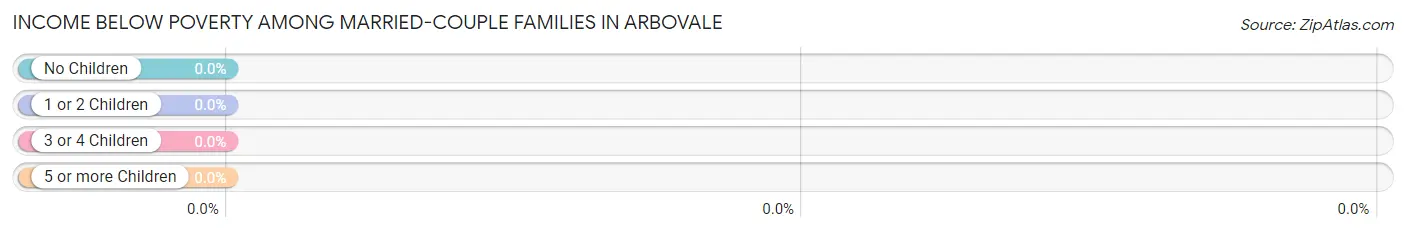
Income Below Poverty Among Married-Couple Families in Arbovale
| Children | Above Poverty | Below Poverty |
| No Children | 7 (100.0%) | 0 (0.0%) |
| 1 or 2 Children | 7 (100.0%) | 0 (0.0%) |
| 3 or 4 Children | 0 (0.0%) | 0 (0.0%) |
| 5 or more Children | 0 (0.0%) | 0 (0.0%) |
| Total | 14 (100.0%) | 0 (0.0%) |
Income Below Poverty Among Single-Parent Households in Arbovale
| Children | Single Father | Single Mother |
| No Children | 0 (0.0%) | 0 (0.0%) |
| 1 or 2 Children | 0 (0.0%) | 0 (0.0%) |
| 3 or 4 Children | 0 (0.0%) | 0 (0.0%) |
| 5 or more Children | 0 (0.0%) | 0 (0.0%) |
| Total | 0 (0.0%) | 0 (0.0%) |
Income Below Poverty Among Married-Couple vs Single-Parent Households in Arbovale
| Children | Married-Couple Families | Single-Parent Households |
| No Children | 0 (0.0%) | 0 (0.0%) |
| 1 or 2 Children | 0 (0.0%) | 0 (0.0%) |
| 3 or 4 Children | 0 (0.0%) | 0 (0.0%) |
| 5 or more Children | 0 (0.0%) | 0 (0.0%) |
| Total | 0 (0.0%) | 0 (0.0%) |
Race in Arbovale
The most populous races in Arbovale are , and White / Caucasian (160 | 100.0%).
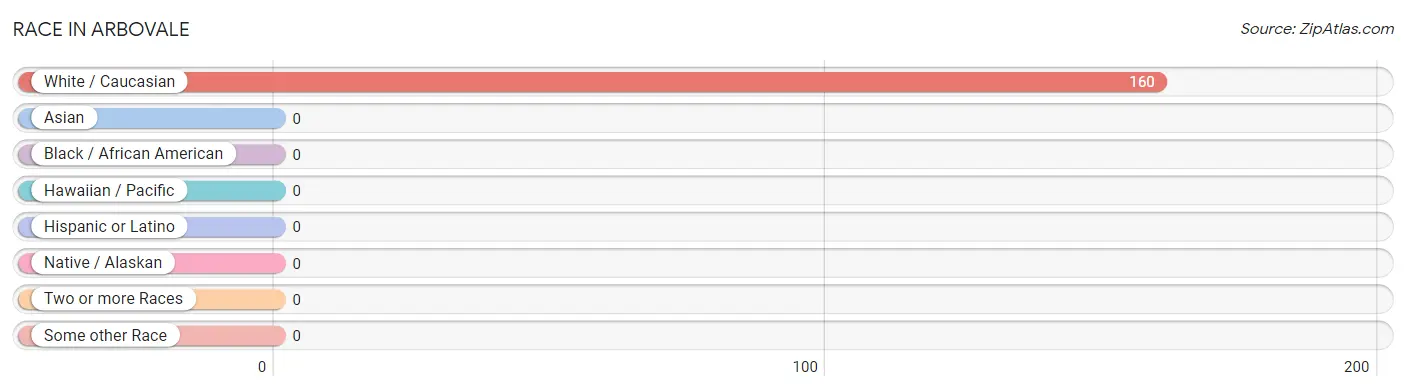
| Race | # Population | % Population |
| Asian | 0 | 0.0% |
| Black / African American | 0 | 0.0% |
| Hawaiian / Pacific | 0 | 0.0% |
| Hispanic or Latino | 0 | 0.0% |
| Native / Alaskan | 0 | 0.0% |
| White / Caucasian | 160 | 100.0% |
| Two or more Races | 0 | 0.0% |
| Some other Race | 0 | 0.0% |
| Total | 160 | 100.0% |
Ancestry in Arbovale
The most populous ancestries reported in Arbovale are German (71 | 44.4%), English (23 | 14.4%), Italian (13 | 8.1%), American (7 | 4.4%), and Dutch (7 | 4.4%), together accounting for 75.6% of all Arbovale residents.
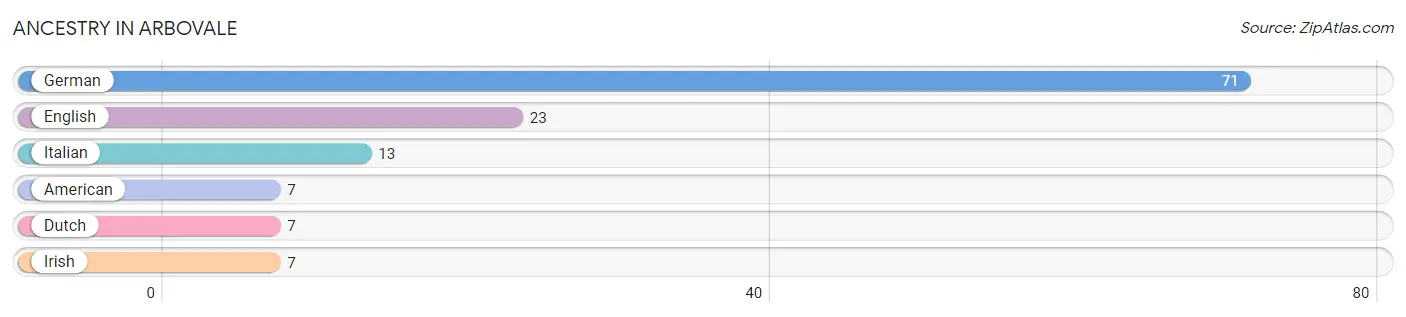
| Ancestry | # Population | % Population |
| American | 7 | 4.4% |
| Dutch | 7 | 4.4% |
| English | 23 | 14.4% |
| German | 71 | 44.4% |
| Irish | 7 | 4.4% |
| Italian | 13 | 8.1% | View All 6 Rows |
Immigrants in Arbovale

| Immigration Origin | # Population | % Population | View All 0 Rows |
Sex and Age in Arbovale
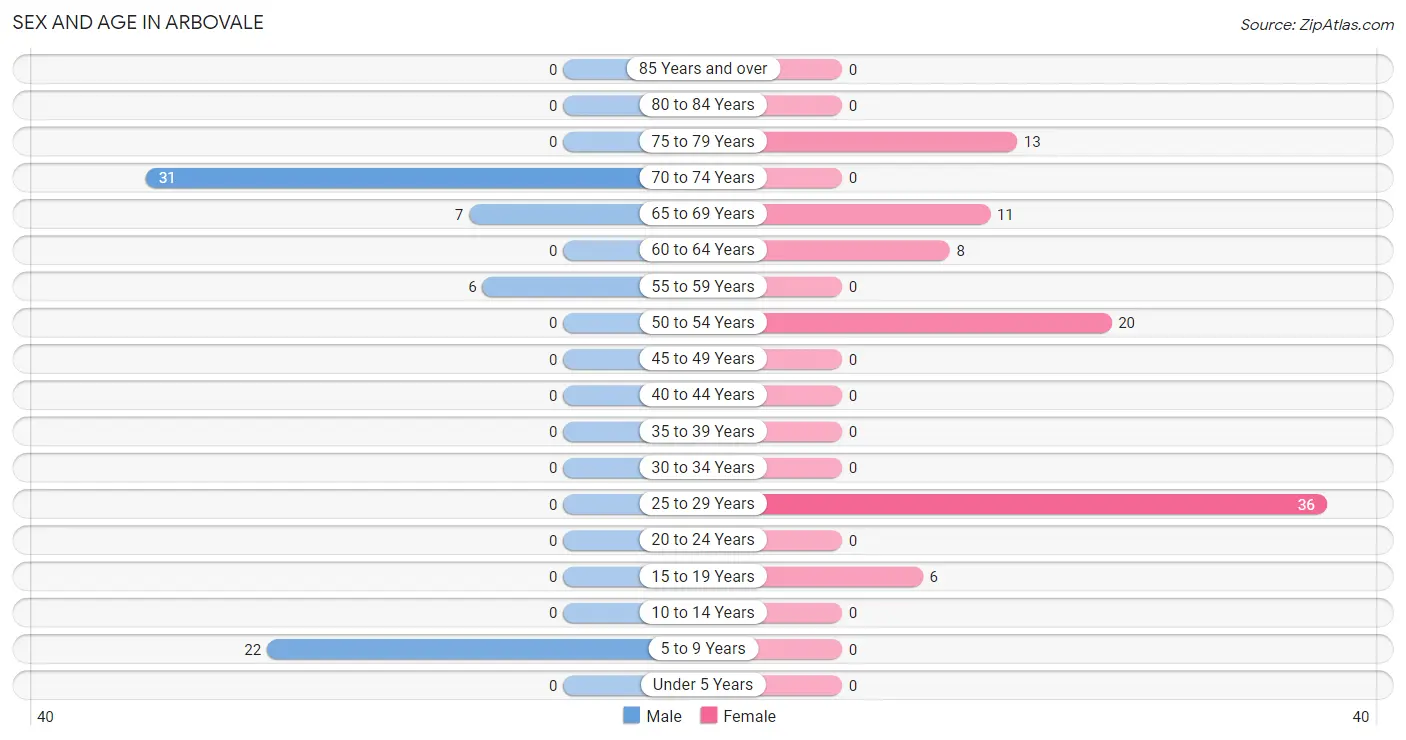
Sex and Age in Arbovale
The most populous age groups in Arbovale are 70 to 74 Years (31 | 47.0%) for men and 25 to 29 Years (36 | 38.3%) for women.
| Age Bracket | Male | Female |
| Under 5 Years | 0 (0.0%) | 0 (0.0%) |
| 5 to 9 Years | 22 (33.3%) | 0 (0.0%) |
| 10 to 14 Years | 0 (0.0%) | 0 (0.0%) |
| 15 to 19 Years | 0 (0.0%) | 6 (6.4%) |
| 20 to 24 Years | 0 (0.0%) | 0 (0.0%) |
| 25 to 29 Years | 0 (0.0%) | 36 (38.3%) |
| 30 to 34 Years | 0 (0.0%) | 0 (0.0%) |
| 35 to 39 Years | 0 (0.0%) | 0 (0.0%) |
| 40 to 44 Years | 0 (0.0%) | 0 (0.0%) |
| 45 to 49 Years | 0 (0.0%) | 0 (0.0%) |
| 50 to 54 Years | 0 (0.0%) | 20 (21.3%) |
| 55 to 59 Years | 6 (9.1%) | 0 (0.0%) |
| 60 to 64 Years | 0 (0.0%) | 8 (8.5%) |
| 65 to 69 Years | 7 (10.6%) | 11 (11.7%) |
| 70 to 74 Years | 31 (47.0%) | 0 (0.0%) |
| 75 to 79 Years | 0 (0.0%) | 13 (13.8%) |
| 80 to 84 Years | 0 (0.0%) | 0 (0.0%) |
| 85 Years and over | 0 (0.0%) | 0 (0.0%) |
| Total | 66 (100.0%) | 94 (100.0%) |
Families and Households in Arbovale
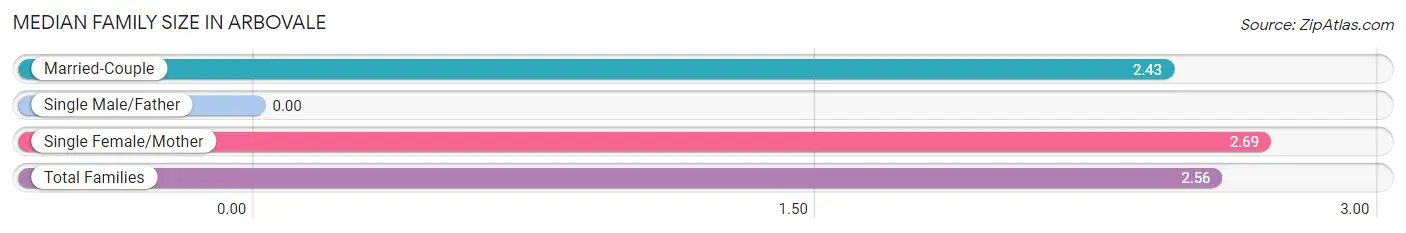
Median Family Size in Arbovale
| Family Type | # Families | Family Size |
| Married-Couple | 14 (51.8%) | 2.43 |
| Single Male/Father | 0 (0.0%) | - |
| Single Female/Mother | 13 (48.1%) | 2.69 |
| Total Families | 27 (100.0%) | 2.56 |
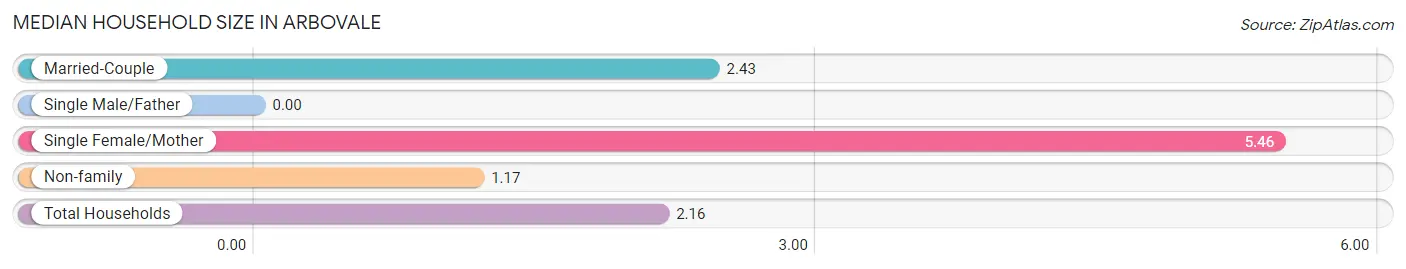
Median Household Size in Arbovale
| Household Type | # Households | Household Size |
| Married-Couple | 14 (18.9%) | 2.43 |
| Single Male/Father | 0 (0.0%) | - |
| Single Female/Mother | 13 (17.6%) | 5.46 |
| Non-family | 47 (63.5%) | 1.17 |
| Total Households | 74 (100.0%) | 2.16 |
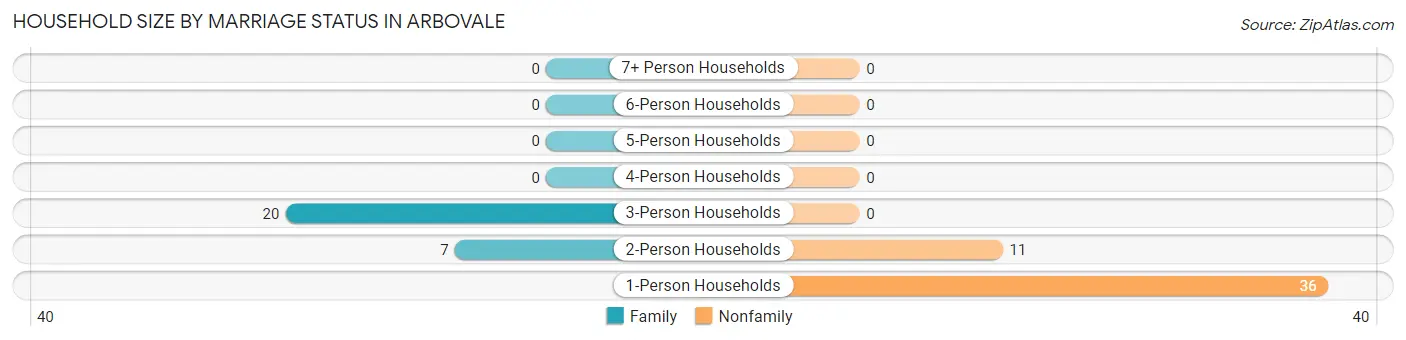
Household Size by Marriage Status in Arbovale
Out of a total of 74 households in Arbovale, 27 (36.5%) are family households, while 47 (63.5%) are nonfamily households. The most numerous type of family households are 3-person households, comprising 20, and the most common type of nonfamily households are 1-person households, comprising 36.
| Household Size | Family Households | Nonfamily Households |
| 1-Person Households | - | 36 (48.6%) |
| 2-Person Households | 7 (9.5%) | 11 (14.9%) |
| 3-Person Households | 20 (27.0%) | 0 (0.0%) |
| 4-Person Households | 0 (0.0%) | 0 (0.0%) |
| 5-Person Households | 0 (0.0%) | 0 (0.0%) |
| 6-Person Households | 0 (0.0%) | 0 (0.0%) |
| 7+ Person Households | 0 (0.0%) | 0 (0.0%) |
| Total | 27 (36.5%) | 47 (63.5%) |
Female Fertility in Arbovale
Fertility by Age in Arbovale
| Age Bracket | Women with Births | Births / 1,000 Women |
| 15 to 19 years | 0 (0.0%) | 0.0 |
| 20 to 34 years | 0 (0.0%) | 0.0 |
| 35 to 50 years | 0 (0.0%) | 0.0 |
| Total | 0 (0.0%) | 0.0 |
Fertility by Age by Marriage Status in Arbovale
| Age Bracket | Married | Unmarried |
| 15 to 19 years | 0 (0.0%) | 0 (0.0%) |
| 20 to 34 years | 0 (0.0%) | 0 (0.0%) |
| 35 to 50 years | 0 (0.0%) | 0 (0.0%) |
| Total | 0 (0.0%) | 0 (0.0%) |
Fertility by Education in Arbovale
| Educational Attainment | Women with Births | Births / 1,000 Women |
| Less than High School | 0 (0.0%) | 0.0 |
| High School Diploma | 0 (0.0%) | 0.0 |
| College or Associate's Degree | 0 (0.0%) | 0.0 |
| Bachelor's Degree | 0 (0.0%) | 0.0 |
| Graduate Degree | 0 (0.0%) | 0.0 |
| Total | 0 (0.0%) | 0.0 |
Fertility by Education by Marriage Status in Arbovale
| Educational Attainment | Married | Unmarried |
| Less than High School | 0 (0.0%) | 0 (0.0%) |
| High School Diploma | 0 (0.0%) | 0 (0.0%) |
| College or Associate's Degree | 0 (0.0%) | 0 (0.0%) |
| Bachelor's Degree | 0 (0.0%) | 0 (0.0%) |
| Graduate Degree | 0 (0.0%) | 0 (0.0%) |
| Total | 0 (0.0%) | 0 (0.0%) |
Employment Characteristics in Arbovale
Employment by Class of Employer in Arbovale
Among the 70 employed individuals in Arbovale, private company employees (36 | 51.4%), not-for-profit organizations (21 | 30.0%), and federal government employees (13 | 18.6%) make up the most common classes of employment.
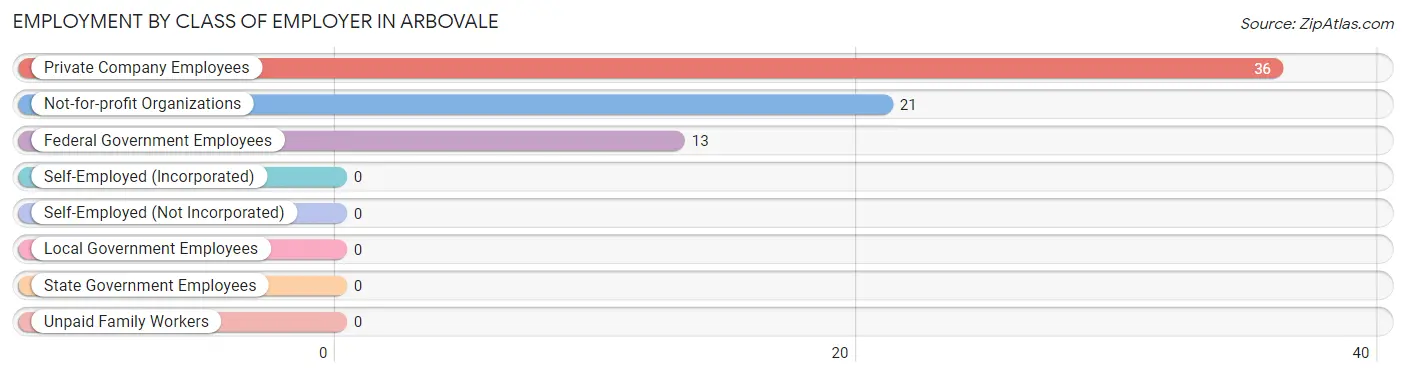
| Employer Class | # Employees | % Employees |
| Private Company Employees | 36 | 51.4% |
| Self-Employed (Incorporated) | 0 | 0.0% |
| Self-Employed (Not Incorporated) | 0 | 0.0% |
| Not-for-profit Organizations | 21 | 30.0% |
| Local Government Employees | 0 | 0.0% |
| State Government Employees | 0 | 0.0% |
| Federal Government Employees | 13 | 18.6% |
| Unpaid Family Workers | 0 | 0.0% |
| Total | 70 | 100.0% |
Employment Status by Age in Arbovale
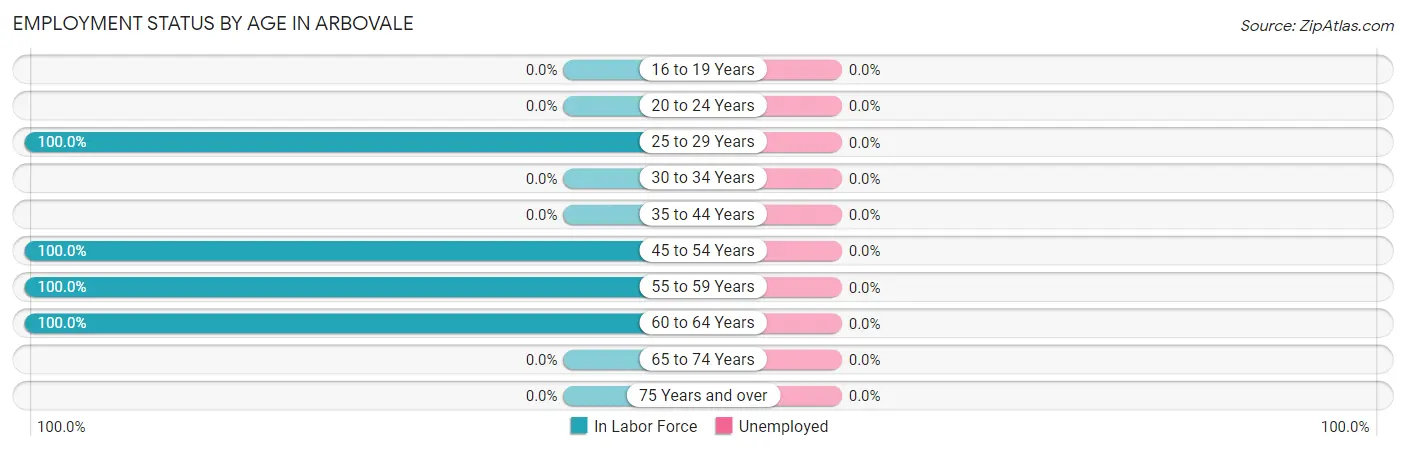
| Age Bracket | In Labor Force | Unemployed |
| 16 to 19 Years | 0 (0.0%) | 0 (0.0%) |
| 20 to 24 Years | 0 (0.0%) | 0 (0.0%) |
| 25 to 29 Years | 36 (100.0%) | 0 (0.0%) |
| 30 to 34 Years | 0 (0.0%) | 0 (0.0%) |
| 35 to 44 Years | 0 (0.0%) | 0 (0.0%) |
| 45 to 54 Years | 20 (100.0%) | 0 (0.0%) |
| 55 to 59 Years | 6 (100.0%) | 0 (0.0%) |
| 60 to 64 Years | 8 (100.0%) | 0 (0.0%) |
| 65 to 74 Years | 0 (0.0%) | 0 (0.0%) |
| 75 Years and over | 0 (0.0%) | 0 (0.0%) |
| Total | 70 (50.7%) | 0 (0.0%) |
Employment Status by Educational Attainment in Arbovale
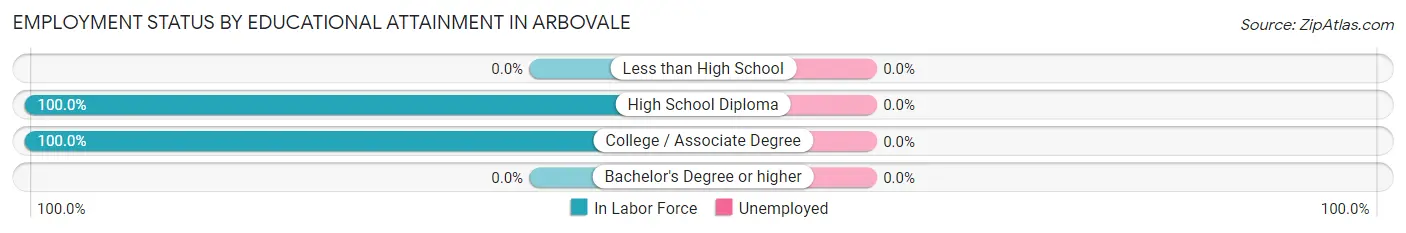
| Educational Attainment | In Labor Force | Unemployed |
| Less than High School | 0 (0.0%) | 0 (0.0%) |
| High School Diploma | 57 (100.0%) | 0 (0.0%) |
| College / Associate Degree | 13 (100.0%) | 0 (0.0%) |
| Bachelor's Degree or higher | 0 (0.0%) | 0 (0.0%) |
| Total | 70 (100.0%) | 0 (0.0%) |
Employment Occupations by Sex in Arbovale
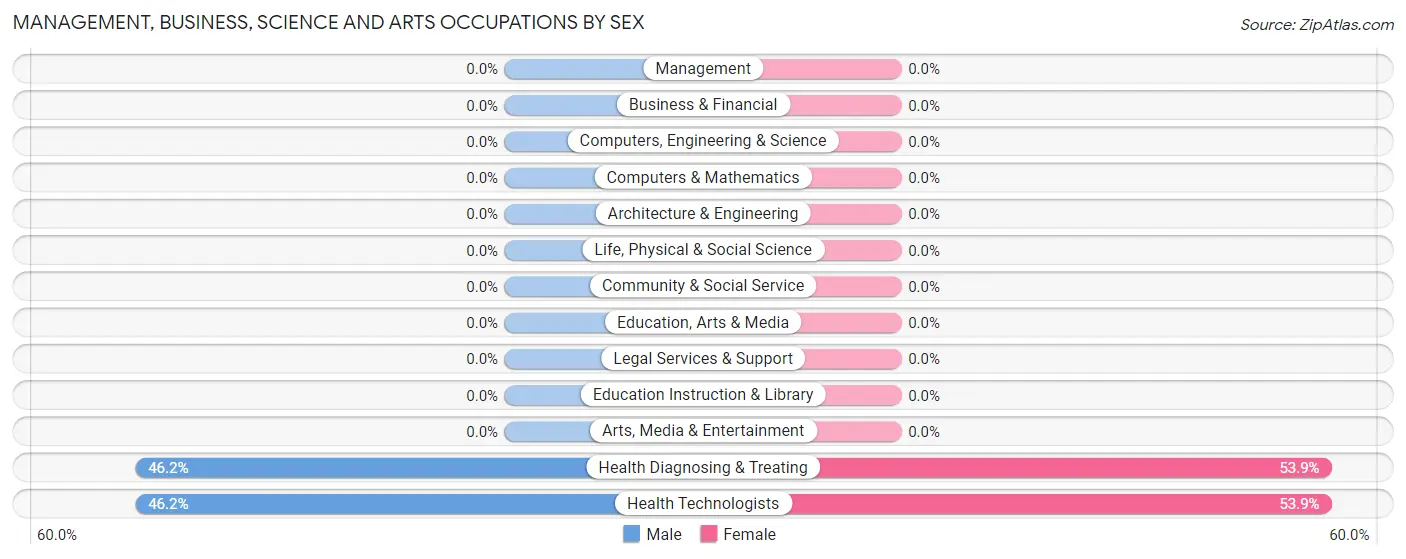
Management, Business, Science and Arts Occupations
The most common Management, Business, Science and Arts occupations in Arbovale are Health Diagnosing & Treating (13 | 18.6%), and Health Technologists (13 | 18.6%).
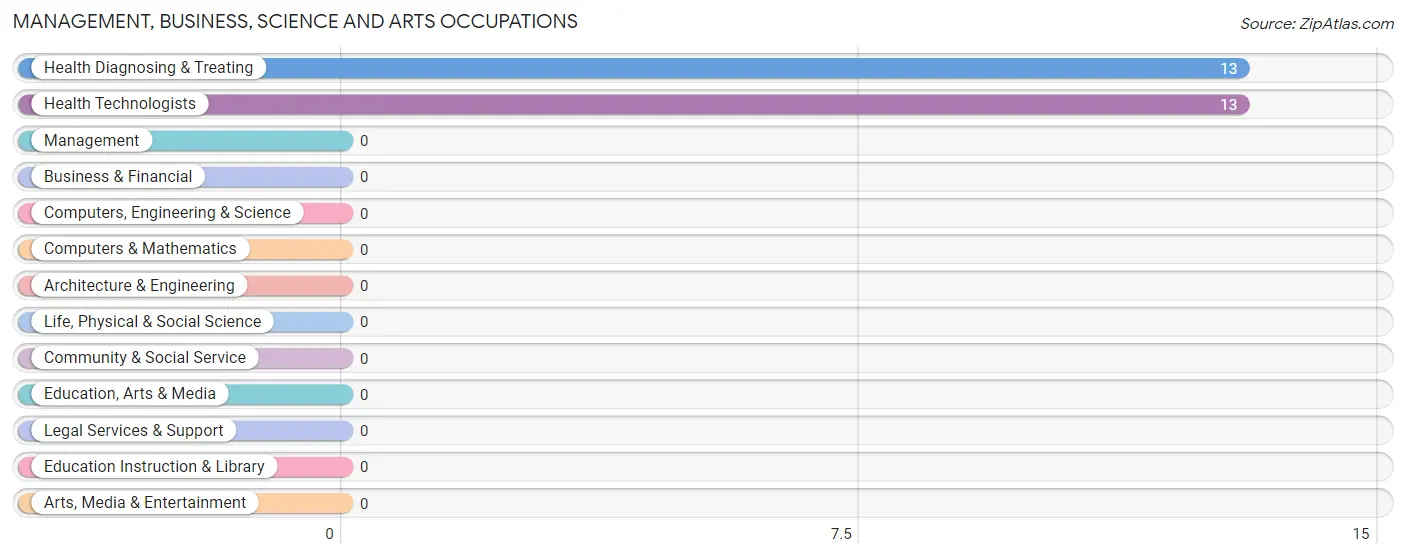
Management, Business, Science and Arts Occupations by Sex
Within the Management, Business, Science and Arts occupations in Arbovale, the most male-oriented occupations are Health Diagnosing & Treating (46.2%), and Health Technologists (46.2%), while the most female-oriented occupations are Health Diagnosing & Treating (53.8%), and Health Technologists (53.8%).
| Occupation | Male | Female |
| Management | 0 (0.0%) | 0 (0.0%) |
| Business & Financial | 0 (0.0%) | 0 (0.0%) |
| Computers, Engineering & Science | 0 (0.0%) | 0 (0.0%) |
| Computers & Mathematics | 0 (0.0%) | 0 (0.0%) |
| Architecture & Engineering | 0 (0.0%) | 0 (0.0%) |
| Life, Physical & Social Science | 0 (0.0%) | 0 (0.0%) |
| Community & Social Service | 0 (0.0%) | 0 (0.0%) |
| Education, Arts & Media | 0 (0.0%) | 0 (0.0%) |
| Legal Services & Support | 0 (0.0%) | 0 (0.0%) |
| Education Instruction & Library | 0 (0.0%) | 0 (0.0%) |
| Arts, Media & Entertainment | 0 (0.0%) | 0 (0.0%) |
| Health Diagnosing & Treating | 6 (46.2%) | 7 (53.8%) |
| Health Technologists | 6 (46.2%) | 7 (53.8%) |
| Total (Category) | 6 (46.2%) | 7 (53.8%) |
| Total (Overall) | 6 (8.6%) | 64 (91.4%) |
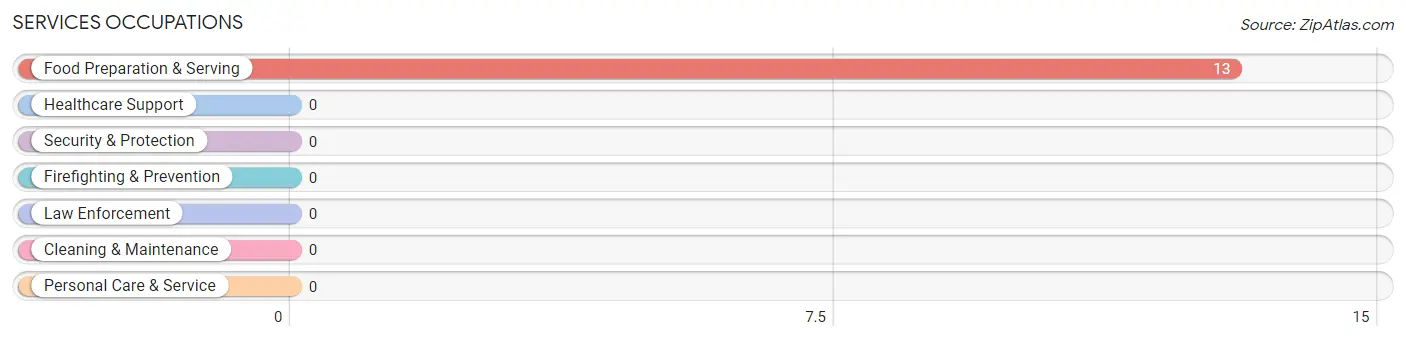
Services Occupations
The most common Services occupations in Arbovale are , and Food Preparation & Serving (13 | 18.6%).
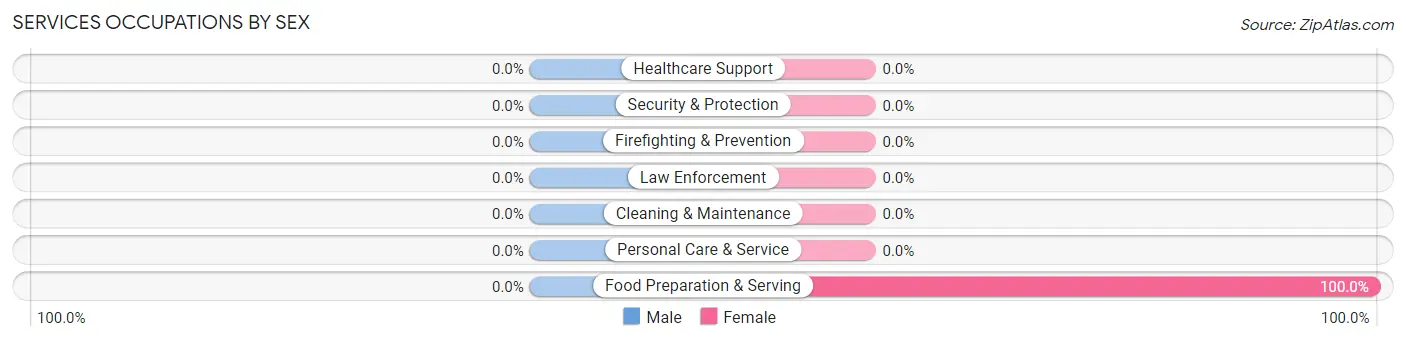
Services Occupations by Sex
| Occupation | Male | Female |
| Healthcare Support | 0 (0.0%) | 0 (0.0%) |
| Security & Protection | 0 (0.0%) | 0 (0.0%) |
| Firefighting & Prevention | 0 (0.0%) | 0 (0.0%) |
| Law Enforcement | 0 (0.0%) | 0 (0.0%) |
| Food Preparation & Serving | 0 (0.0%) | 13 (100.0%) |
| Cleaning & Maintenance | 0 (0.0%) | 0 (0.0%) |
| Personal Care & Service | 0 (0.0%) | 0 (0.0%) |
| Total (Category) | 0 (0.0%) | 13 (100.0%) |
| Total (Overall) | 6 (8.6%) | 64 (91.4%) |
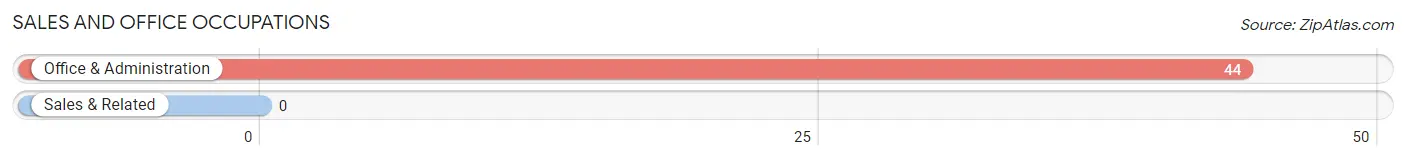
Sales and Office Occupations
The most common Sales and Office occupations in Arbovale are , and Office & Administration (44 | 62.9%).
Sales and Office Occupations by Sex
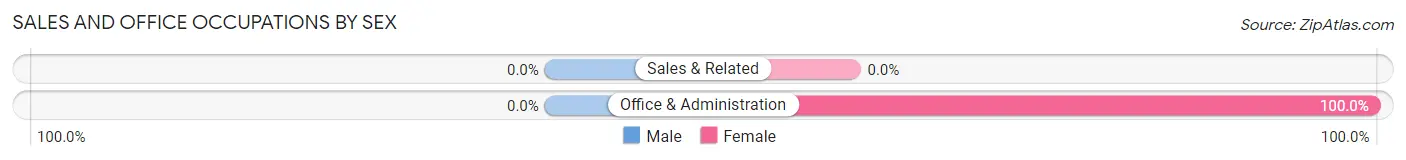
| Occupation | Male | Female |
| Sales & Related | 0 (0.0%) | 0 (0.0%) |
| Office & Administration | 0 (0.0%) | 44 (100.0%) |
| Total (Category) | 0 (0.0%) | 44 (100.0%) |
| Total (Overall) | 6 (8.6%) | 64 (91.4%) |
Natural Resources, Construction and Maintenance Occupations
Natural Resources, Construction and Maintenance Occupations by Sex
| Occupation | Male | Female |
| Farming, Fishing & Forestry | 0 (0.0%) | 0 (0.0%) |
| Construction & Extraction | 0 (0.0%) | 0 (0.0%) |
| Installation, Maintenance & Repair | 0 (0.0%) | 0 (0.0%) |
| Total (Category) | 0 (0.0%) | 0 (0.0%) |
| Total (Overall) | 6 (8.6%) | 64 (91.4%) |
Production, Transportation and Moving Occupations
Production, Transportation and Moving Occupations by Sex
| Occupation | Male | Female |
| Production | 0 (0.0%) | 0 (0.0%) |
| Transportation | 0 (0.0%) | 0 (0.0%) |
| Material Moving | 0 (0.0%) | 0 (0.0%) |
| Total (Category) | 0 (0.0%) | 0 (0.0%) |
| Total (Overall) | 6 (8.6%) | 64 (91.4%) |
Employment Industries by Sex in Arbovale
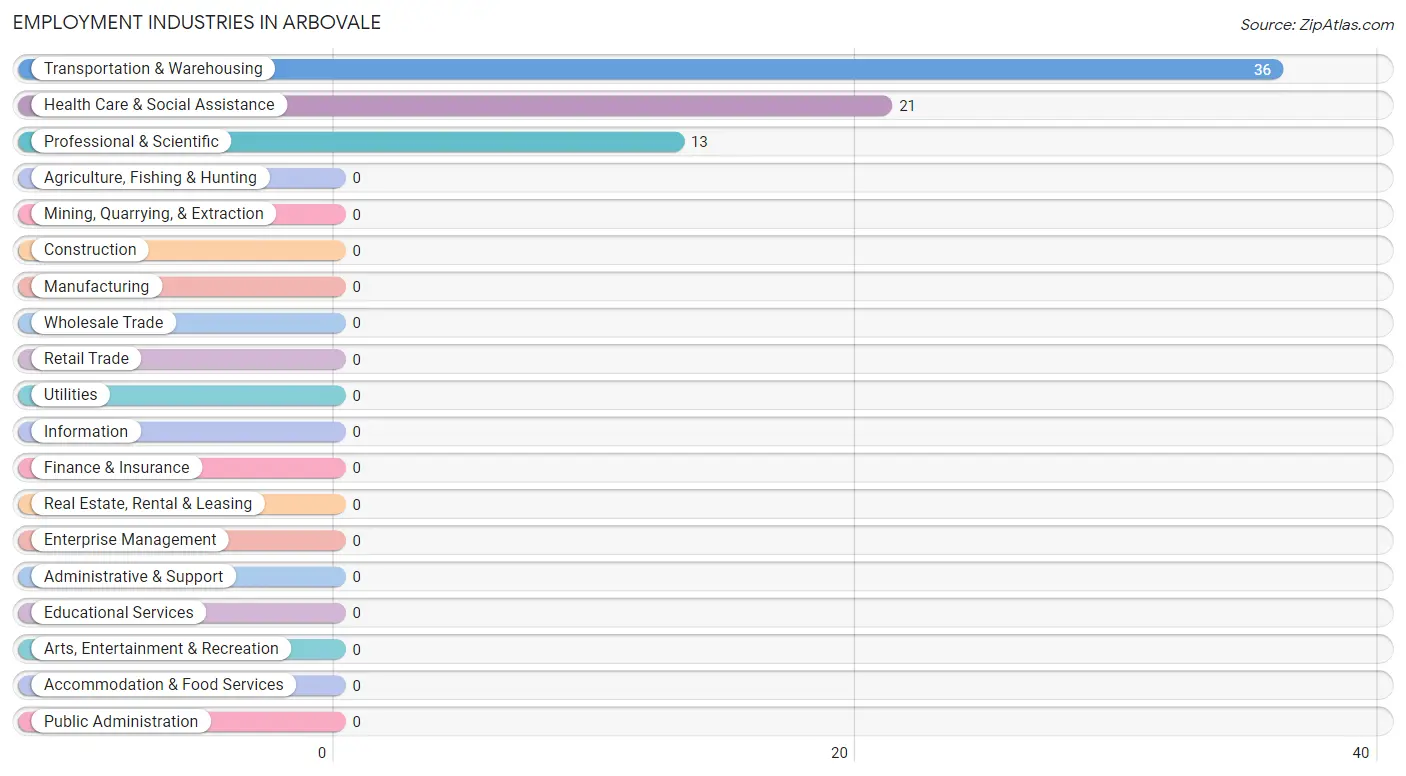
Employment Industries in Arbovale
The major employment industries in Arbovale include Transportation & Warehousing (36 | 51.4%), Health Care & Social Assistance (21 | 30.0%), and Professional & Scientific (13 | 18.6%).
Employment Industries by Sex in Arbovale
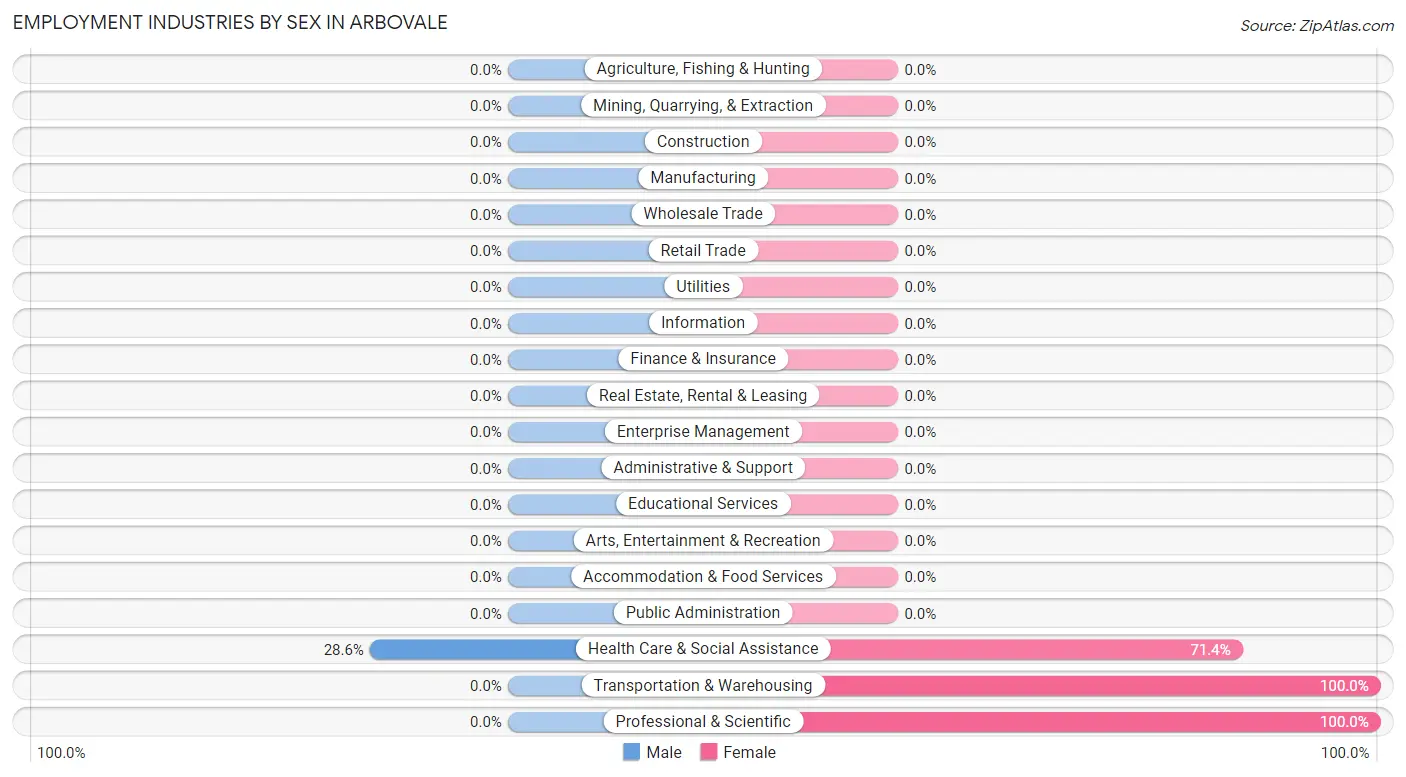
| Industry | Male | Female |
| Agriculture, Fishing & Hunting | 0 (0.0%) | 0 (0.0%) |
| Mining, Quarrying, & Extraction | 0 (0.0%) | 0 (0.0%) |
| Construction | 0 (0.0%) | 0 (0.0%) |
| Manufacturing | 0 (0.0%) | 0 (0.0%) |
| Wholesale Trade | 0 (0.0%) | 0 (0.0%) |
| Retail Trade | 0 (0.0%) | 0 (0.0%) |
| Transportation & Warehousing | 0 (0.0%) | 36 (100.0%) |
| Utilities | 0 (0.0%) | 0 (0.0%) |
| Information | 0 (0.0%) | 0 (0.0%) |
| Finance & Insurance | 0 (0.0%) | 0 (0.0%) |
| Real Estate, Rental & Leasing | 0 (0.0%) | 0 (0.0%) |
| Professional & Scientific | 0 (0.0%) | 13 (100.0%) |
| Enterprise Management | 0 (0.0%) | 0 (0.0%) |
| Administrative & Support | 0 (0.0%) | 0 (0.0%) |
| Educational Services | 0 (0.0%) | 0 (0.0%) |
| Health Care & Social Assistance | 6 (28.6%) | 15 (71.4%) |
| Arts, Entertainment & Recreation | 0 (0.0%) | 0 (0.0%) |
| Accommodation & Food Services | 0 (0.0%) | 0 (0.0%) |
| Public Administration | 0 (0.0%) | 0 (0.0%) |
| Total | 6 (8.6%) | 64 (91.4%) |
Education in Arbovale
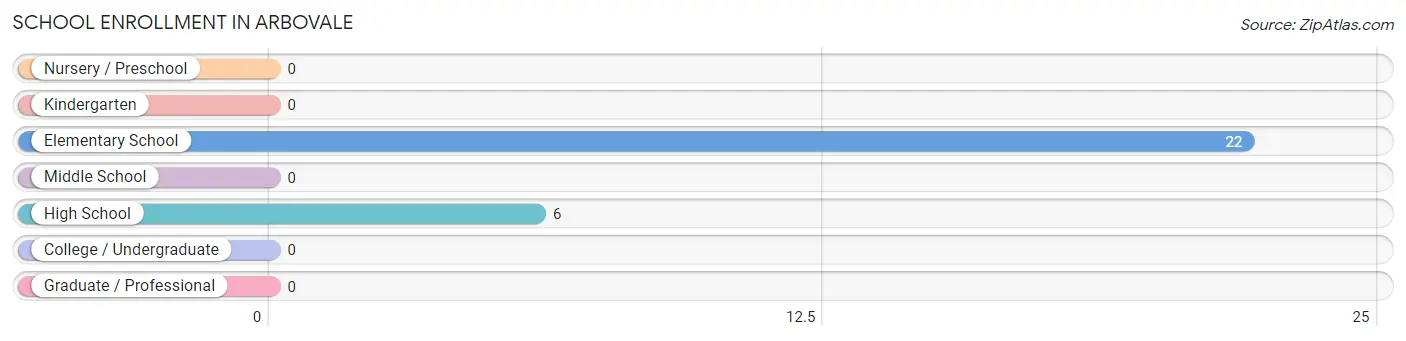
School Enrollment in Arbovale
The most common levels of schooling among the 28 students in Arbovale are elementary school (22 | 78.6%), and high school (6 | 21.4%).
| School Level | # Students | % Students |
| Nursery / Preschool | 0 | 0.0% |
| Kindergarten | 0 | 0.0% |
| Elementary School | 22 | 78.6% |
| Middle School | 0 | 0.0% |
| High School | 6 | 21.4% |
| College / Undergraduate | 0 | 0.0% |
| Graduate / Professional | 0 | 0.0% |
| Total | 28 | 100.0% |
School Enrollment by Age by Funding Source in Arbovale
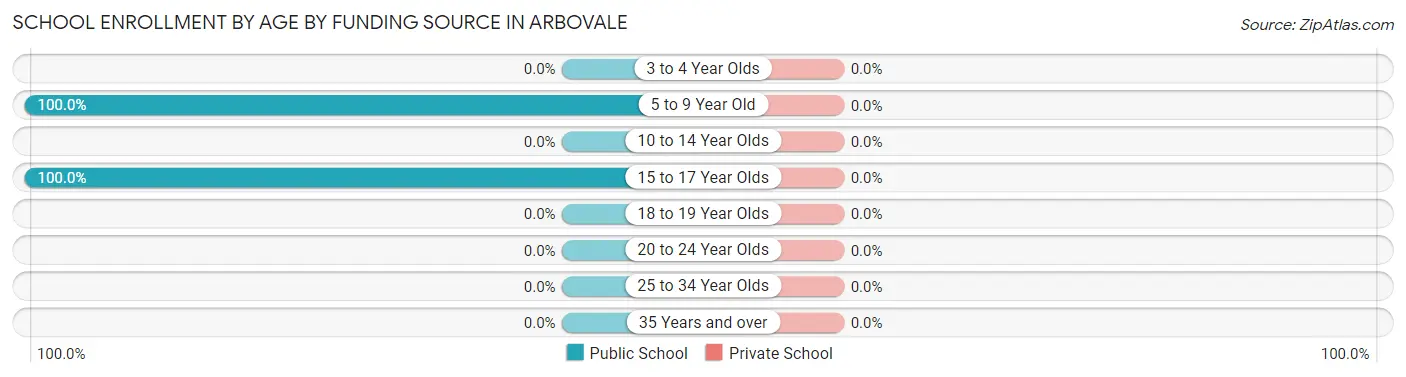
| Age Bracket | Public School | Private School |
| 3 to 4 Year Olds | 0 (0.0%) | 0 (0.0%) |
| 5 to 9 Year Old | 22 (100.0%) | 0 (0.0%) |
| 10 to 14 Year Olds | 0 (0.0%) | 0 (0.0%) |
| 15 to 17 Year Olds | 6 (100.0%) | 0 (0.0%) |
| 18 to 19 Year Olds | 0 (0.0%) | 0 (0.0%) |
| 20 to 24 Year Olds | 0 (0.0%) | 0 (0.0%) |
| 25 to 34 Year Olds | 0 (0.0%) | 0 (0.0%) |
| 35 Years and over | 0 (0.0%) | 0 (0.0%) |
| Total | 28 (100.0%) | 0 (0.0%) |
Educational Attainment by Field of Study in Arbovale
Science & technology (11 | 57.9%), and education (8 | 42.1%) are the most common fields of study among 19 individuals in Arbovale who have obtained a bachelor's degree or higher.
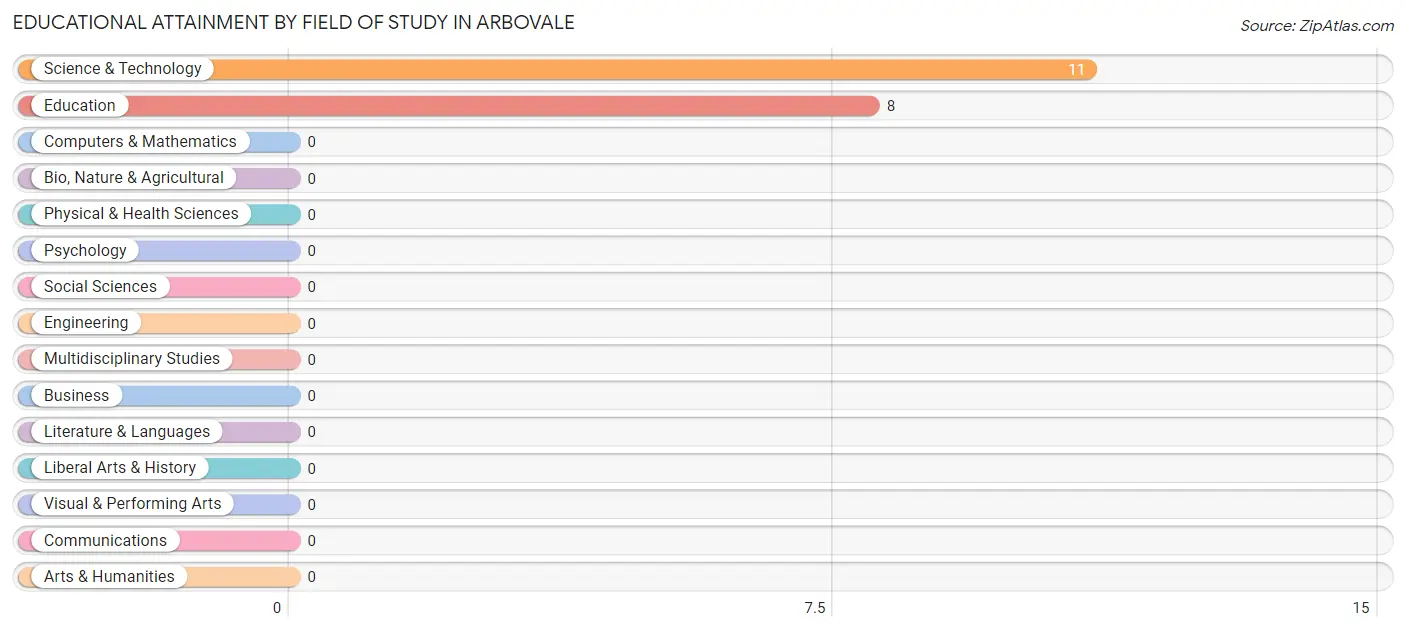
| Field of Study | # Graduates | % Graduates |
| Computers & Mathematics | 0 | 0.0% |
| Bio, Nature & Agricultural | 0 | 0.0% |
| Physical & Health Sciences | 0 | 0.0% |
| Psychology | 0 | 0.0% |
| Social Sciences | 0 | 0.0% |
| Engineering | 0 | 0.0% |
| Multidisciplinary Studies | 0 | 0.0% |
| Science & Technology | 11 | 57.9% |
| Business | 0 | 0.0% |
| Education | 8 | 42.1% |
| Literature & Languages | 0 | 0.0% |
| Liberal Arts & History | 0 | 0.0% |
| Visual & Performing Arts | 0 | 0.0% |
| Communications | 0 | 0.0% |
| Arts & Humanities | 0 | 0.0% |
| Total | 19 | 100.0% |
Transportation & Commute in Arbovale
Vehicle Availability by Sex in Arbovale
The most prevalent vehicle ownership categories in Arbovale are males with 2 vehicles (6, accounting for 100.0%) and females with 2 vehicles (7, making up 9.4%).
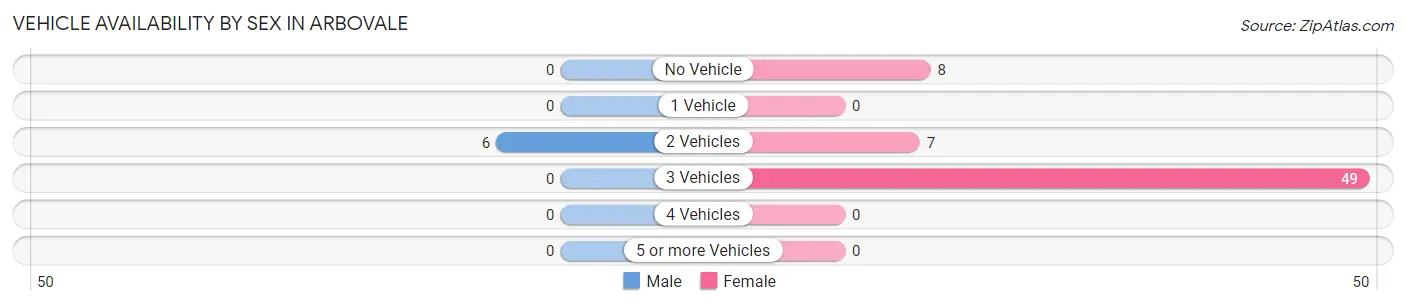
| Vehicles Available | Male | Female |
| No Vehicle | 0 (0.0%) | 8 (12.5%) |
| 1 Vehicle | 0 (0.0%) | 0 (0.0%) |
| 2 Vehicles | 6 (100.0%) | 7 (10.9%) |
| 3 Vehicles | 0 (0.0%) | 49 (76.6%) |
| 4 Vehicles | 0 (0.0%) | 0 (0.0%) |
| 5 or more Vehicles | 0 (0.0%) | 0 (0.0%) |
| Total | 6 (100.0%) | 64 (100.0%) |
Commute Time in Arbovale
The most frequently occuring commute durations in Arbovale are 5 to 9 minutes (44 commuters, 62.9%), less than 5 minutes (13 commuters, 18.6%), and 45 to 59 minutes (13 commuters, 18.6%).
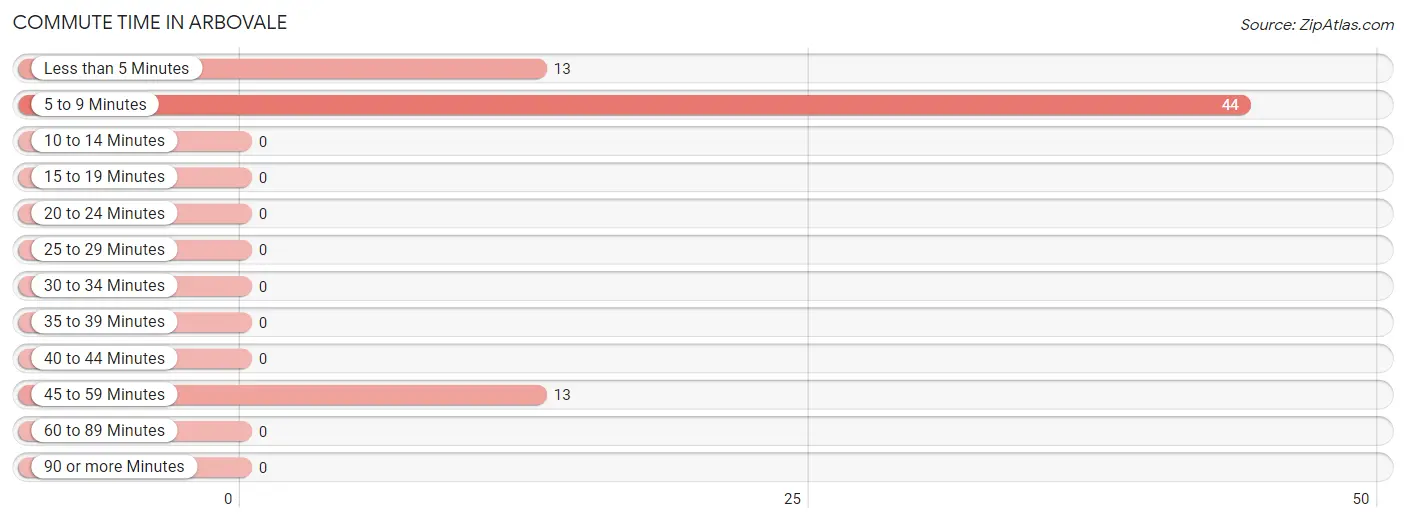
| Commute Time | # Commuters | % Commuters |
| Less than 5 Minutes | 13 | 18.6% |
| 5 to 9 Minutes | 44 | 62.9% |
| 10 to 14 Minutes | 0 | 0.0% |
| 15 to 19 Minutes | 0 | 0.0% |
| 20 to 24 Minutes | 0 | 0.0% |
| 25 to 29 Minutes | 0 | 0.0% |
| 30 to 34 Minutes | 0 | 0.0% |
| 35 to 39 Minutes | 0 | 0.0% |
| 40 to 44 Minutes | 0 | 0.0% |
| 45 to 59 Minutes | 13 | 18.6% |
| 60 to 89 Minutes | 0 | 0.0% |
| 90 or more Minutes | 0 | 0.0% |
Commute Time by Sex in Arbovale
The most common commute times in Arbovale are 45 to 59 minutes (6 commuters, 100.0%) for males and 5 to 9 minutes (44 commuters, 68.8%) for females.
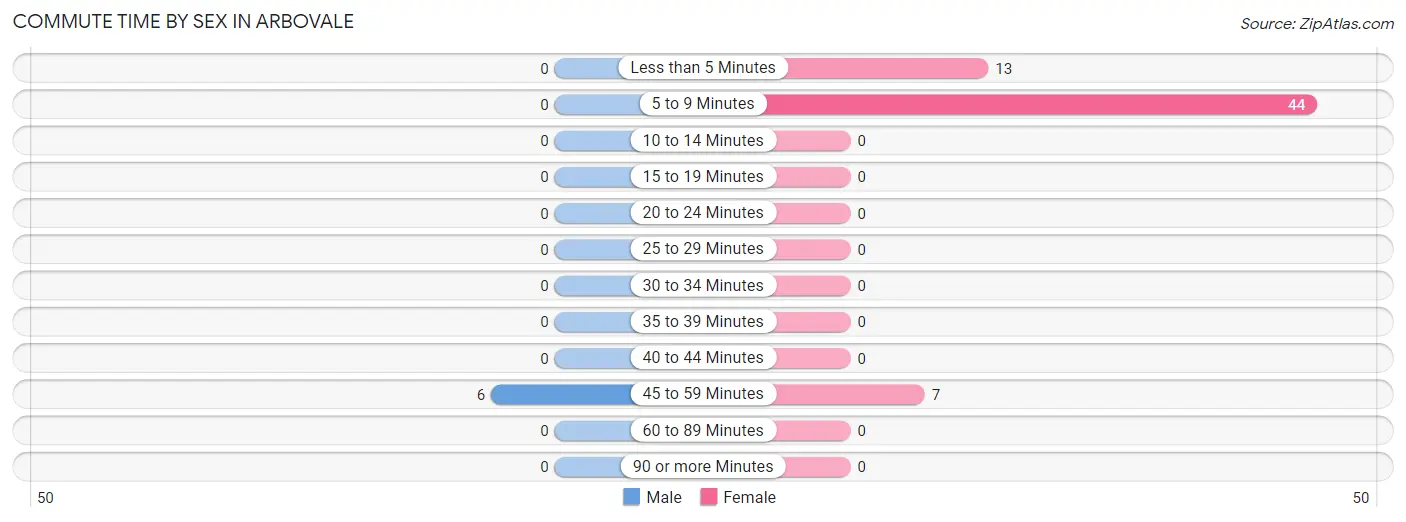
| Commute Time | Male | Female |
| Less than 5 Minutes | 0 (0.0%) | 13 (20.3%) |
| 5 to 9 Minutes | 0 (0.0%) | 44 (68.8%) |
| 10 to 14 Minutes | 0 (0.0%) | 0 (0.0%) |
| 15 to 19 Minutes | 0 (0.0%) | 0 (0.0%) |
| 20 to 24 Minutes | 0 (0.0%) | 0 (0.0%) |
| 25 to 29 Minutes | 0 (0.0%) | 0 (0.0%) |
| 30 to 34 Minutes | 0 (0.0%) | 0 (0.0%) |
| 35 to 39 Minutes | 0 (0.0%) | 0 (0.0%) |
| 40 to 44 Minutes | 0 (0.0%) | 0 (0.0%) |
| 45 to 59 Minutes | 6 (100.0%) | 7 (10.9%) |
| 60 to 89 Minutes | 0 (0.0%) | 0 (0.0%) |
| 90 or more Minutes | 0 (0.0%) | 0 (0.0%) |
Time of Departure to Work by Sex in Arbovale
The most frequent times of departure to work in Arbovale are 5:00 AM to 5:29 AM (6, 100.0%) for males and 8:30 AM to 8:59 AM (36, 56.2%) for females.
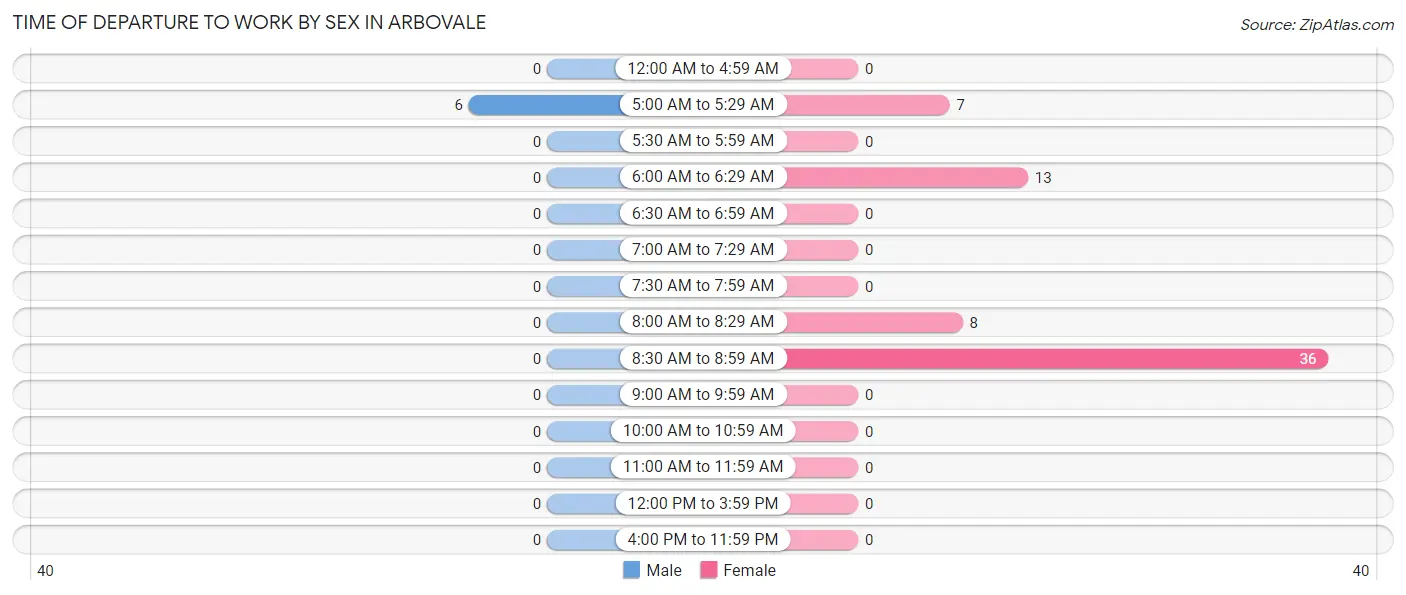
| Time of Departure | Male | Female |
| 12:00 AM to 4:59 AM | 0 (0.0%) | 0 (0.0%) |
| 5:00 AM to 5:29 AM | 6 (100.0%) | 7 (10.9%) |
| 5:30 AM to 5:59 AM | 0 (0.0%) | 0 (0.0%) |
| 6:00 AM to 6:29 AM | 0 (0.0%) | 13 (20.3%) |
| 6:30 AM to 6:59 AM | 0 (0.0%) | 0 (0.0%) |
| 7:00 AM to 7:29 AM | 0 (0.0%) | 0 (0.0%) |
| 7:30 AM to 7:59 AM | 0 (0.0%) | 0 (0.0%) |
| 8:00 AM to 8:29 AM | 0 (0.0%) | 8 (12.5%) |
| 8:30 AM to 8:59 AM | 0 (0.0%) | 36 (56.2%) |
| 9:00 AM to 9:59 AM | 0 (0.0%) | 0 (0.0%) |
| 10:00 AM to 10:59 AM | 0 (0.0%) | 0 (0.0%) |
| 11:00 AM to 11:59 AM | 0 (0.0%) | 0 (0.0%) |
| 12:00 PM to 3:59 PM | 0 (0.0%) | 0 (0.0%) |
| 4:00 PM to 11:59 PM | 0 (0.0%) | 0 (0.0%) |
| Total | 6 (100.0%) | 64 (100.0%) |
Housing Occupancy in Arbovale
Occupancy by Ownership in Arbovale
Of the total 74 dwellings in Arbovale, owner-occupied units account for 61 (82.4%), while renter-occupied units make up 13 (17.6%).
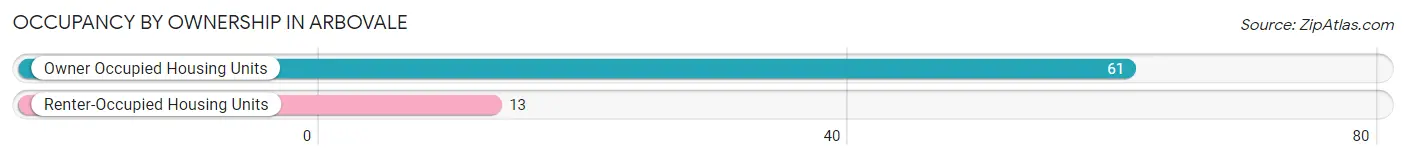
| Occupancy | # Housing Units | % Housing Units |
| Owner Occupied Housing Units | 61 | 82.4% |
| Renter-Occupied Housing Units | 13 | 17.6% |
| Total Occupied Housing Units | 74 | 100.0% |
Occupancy by Household Size in Arbovale
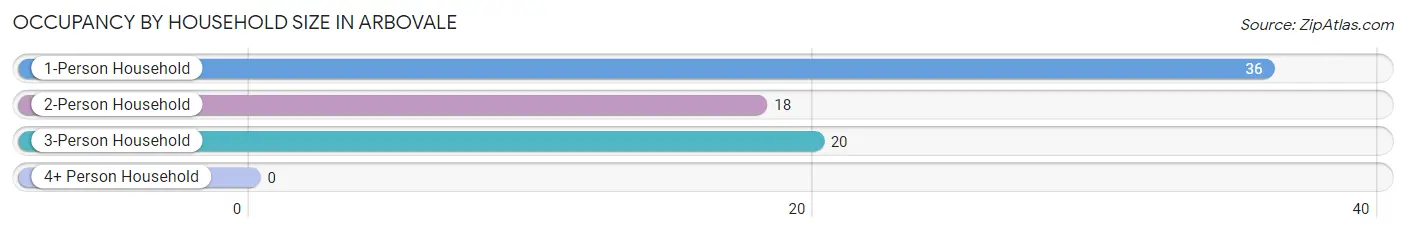
| Household Size | # Housing Units | % Housing Units |
| 1-Person Household | 36 | 48.6% |
| 2-Person Household | 18 | 24.3% |
| 3-Person Household | 20 | 27.0% |
| 4+ Person Household | 0 | 0.0% |
| Total Housing Units | 74 | 100.0% |
Occupancy by Ownership by Household Size in Arbovale
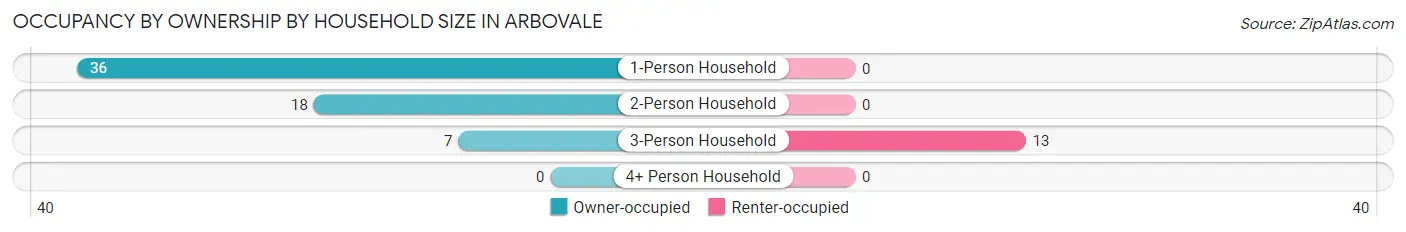
| Household Size | Owner-occupied | Renter-occupied |
| 1-Person Household | 36 (100.0%) | 0 (0.0%) |
| 2-Person Household | 18 (100.0%) | 0 (0.0%) |
| 3-Person Household | 7 (35.0%) | 13 (65.0%) |
| 4+ Person Household | 0 (0.0%) | 0 (0.0%) |
| Total Housing Units | 61 (82.4%) | 13 (17.6%) |
Occupancy by Educational Attainment in Arbovale
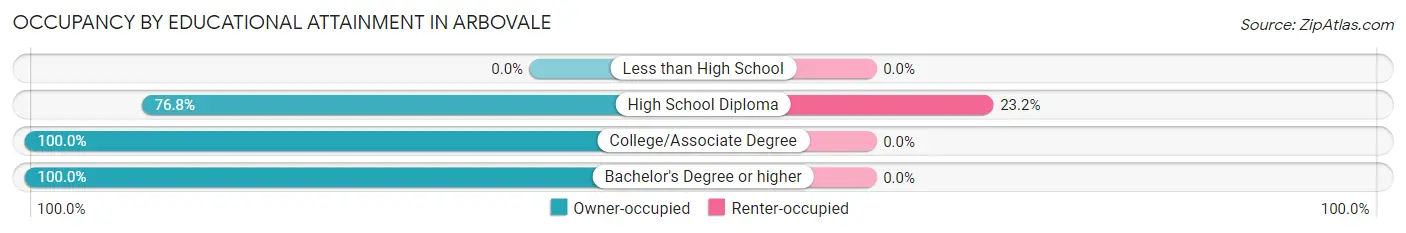
| Household Size | Owner-occupied | Renter-occupied |
| Less than High School | 0 (0.0%) | 0 (0.0%) |
| High School Diploma | 43 (76.8%) | 13 (23.2%) |
| College/Associate Degree | 7 (100.0%) | 0 (0.0%) |
| Bachelor's Degree or higher | 11 (100.0%) | 0 (0.0%) |
Occupancy by Age of Householder in Arbovale
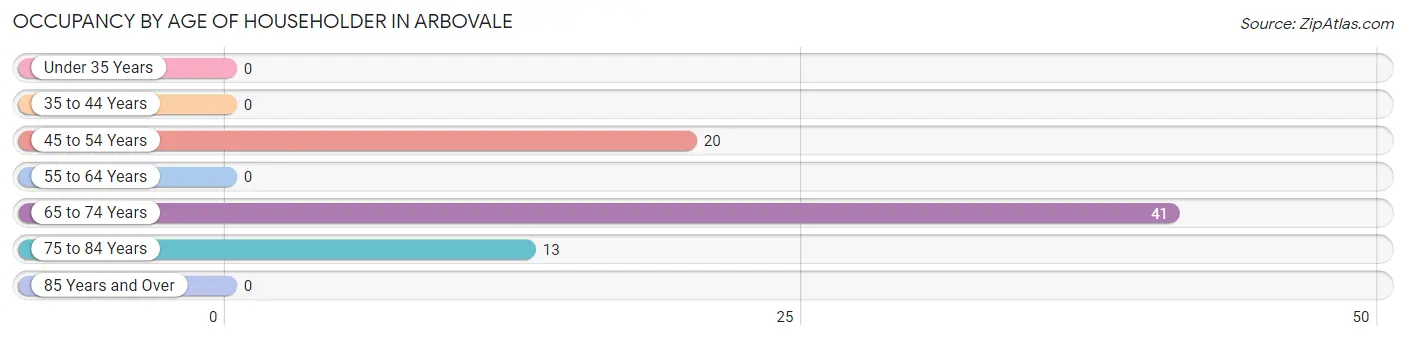
| Age Bracket | # Households | % Households |
| Under 35 Years | 0 | 0.0% |
| 35 to 44 Years | 0 | 0.0% |
| 45 to 54 Years | 20 | 27.0% |
| 55 to 64 Years | 0 | 0.0% |
| 65 to 74 Years | 41 | 55.4% |
| 75 to 84 Years | 13 | 17.6% |
| 85 Years and Over | 0 | 0.0% |
| Total | 74 | 100.0% |
Housing Finances in Arbovale
Median Income by Occupancy in Arbovale
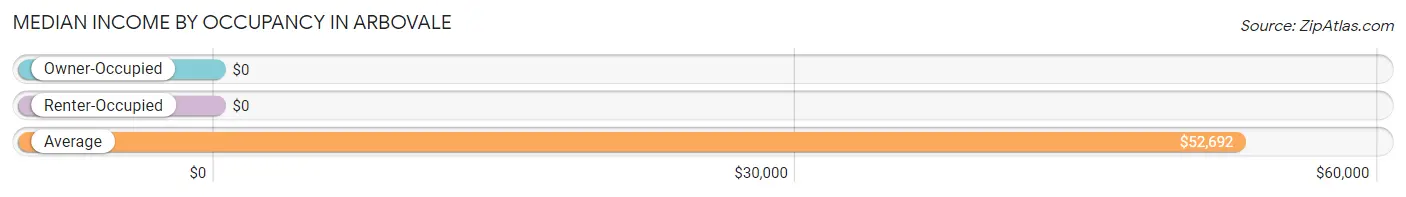
| Occupancy Type | # Households | Median Income |
| Owner-Occupied | 61 (82.4%) | $0 |
| Renter-Occupied | 13 (17.6%) | $0 |
| Average | 74 (100.0%) | $52,692 |
Occupancy by Householder Income Bracket in Arbovale
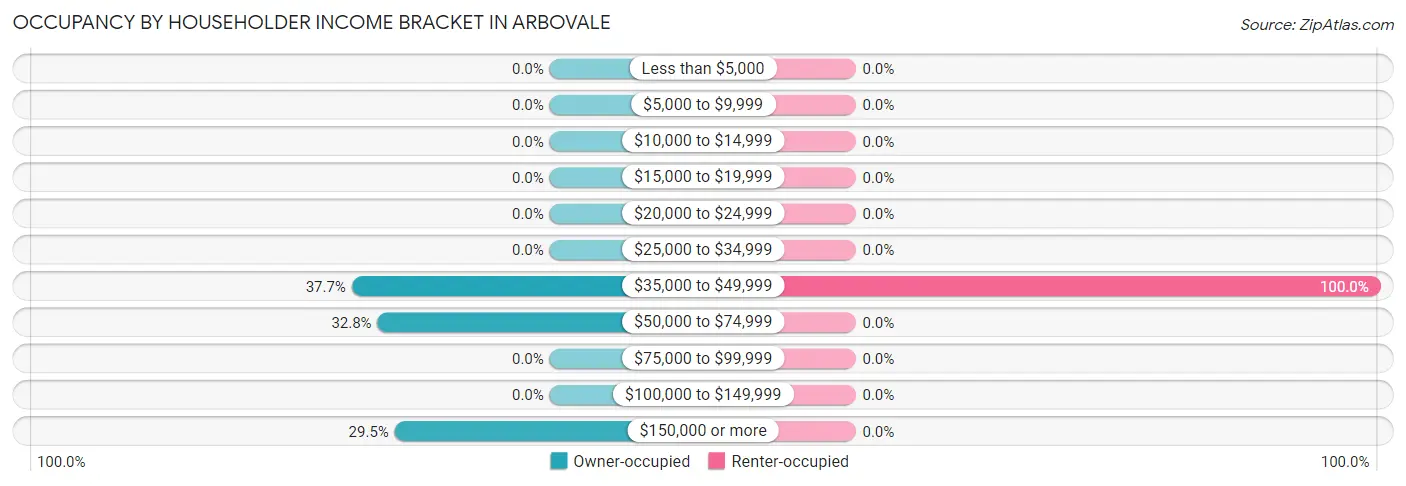
| Income Bracket | Owner-occupied | Renter-occupied |
| Less than $5,000 | 0 (0.0%) | 0 (0.0%) |
| $5,000 to $9,999 | 0 (0.0%) | 0 (0.0%) |
| $10,000 to $14,999 | 0 (0.0%) | 0 (0.0%) |
| $15,000 to $19,999 | 0 (0.0%) | 0 (0.0%) |
| $20,000 to $24,999 | 0 (0.0%) | 0 (0.0%) |
| $25,000 to $34,999 | 0 (0.0%) | 0 (0.0%) |
| $35,000 to $49,999 | 23 (37.7%) | 13 (100.0%) |
| $50,000 to $74,999 | 20 (32.8%) | 0 (0.0%) |
| $75,000 to $99,999 | 0 (0.0%) | 0 (0.0%) |
| $100,000 to $149,999 | 0 (0.0%) | 0 (0.0%) |
| $150,000 or more | 18 (29.5%) | 0 (0.0%) |
| Total | 61 (100.0%) | 13 (100.0%) |
Monthly Housing Cost Tiers in Arbovale
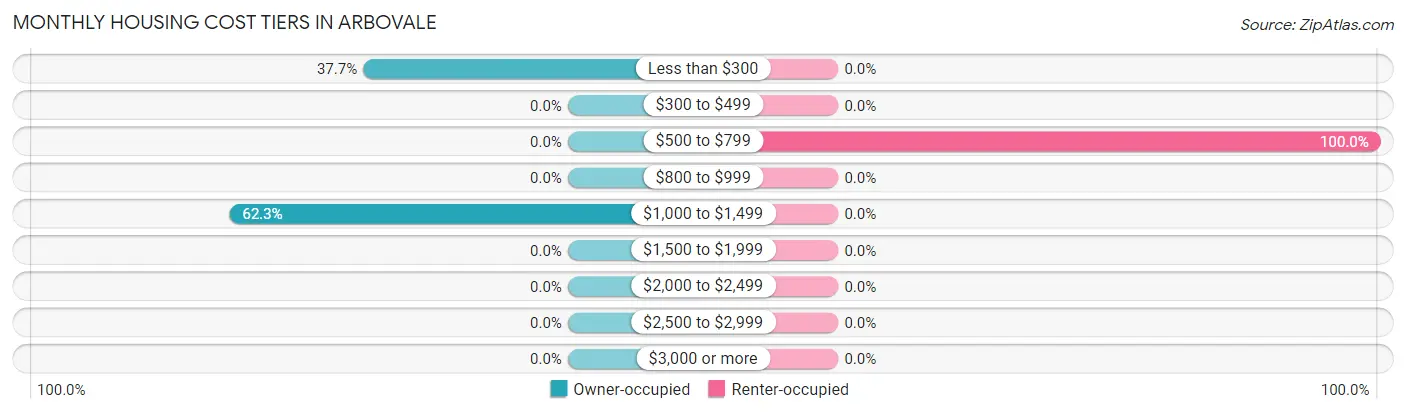
| Monthly Cost | Owner-occupied | Renter-occupied |
| Less than $300 | 23 (37.7%) | 0 (0.0%) |
| $300 to $499 | 0 (0.0%) | 0 (0.0%) |
| $500 to $799 | 0 (0.0%) | 13 (100.0%) |
| $800 to $999 | 0 (0.0%) | 0 (0.0%) |
| $1,000 to $1,499 | 38 (62.3%) | 0 (0.0%) |
| $1,500 to $1,999 | 0 (0.0%) | 0 (0.0%) |
| $2,000 to $2,499 | 0 (0.0%) | 0 (0.0%) |
| $2,500 to $2,999 | 0 (0.0%) | 0 (0.0%) |
| $3,000 or more | 0 (0.0%) | 0 (0.0%) |
| Total | 61 (100.0%) | 13 (100.0%) |
Physical Housing Characteristics in Arbovale
Housing Structures in Arbovale
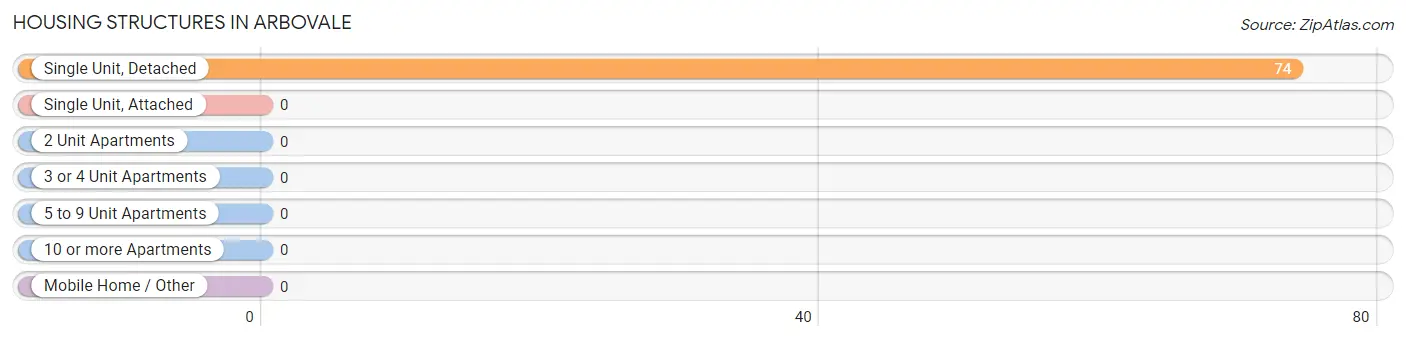
| Structure Type | # Housing Units | % Housing Units |
| Single Unit, Detached | 74 | 100.0% |
| Single Unit, Attached | 0 | 0.0% |
| 2 Unit Apartments | 0 | 0.0% |
| 3 or 4 Unit Apartments | 0 | 0.0% |
| 5 to 9 Unit Apartments | 0 | 0.0% |
| 10 or more Apartments | 0 | 0.0% |
| Mobile Home / Other | 0 | 0.0% |
| Total | 74 | 100.0% |
Housing Structures by Occupancy in Arbovale
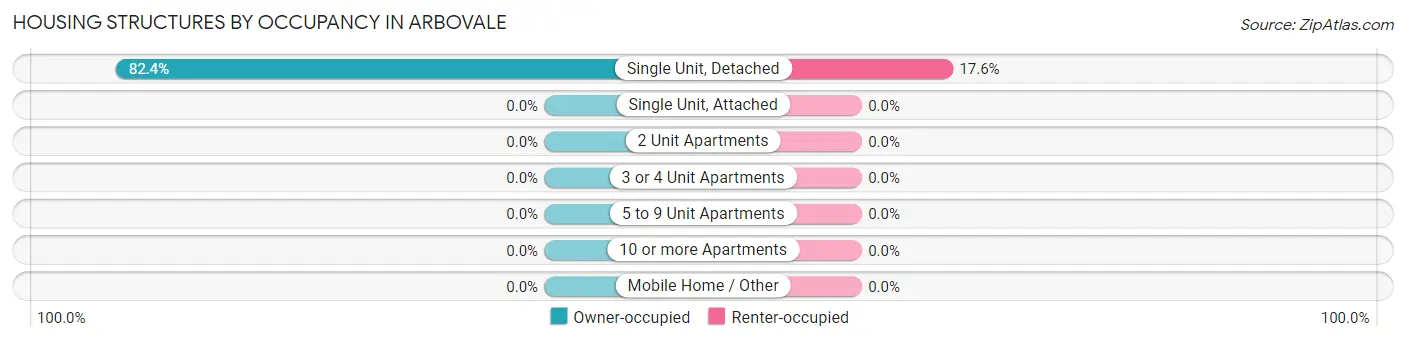
| Structure Type | Owner-occupied | Renter-occupied |
| Single Unit, Detached | 61 (82.4%) | 13 (17.6%) |
| Single Unit, Attached | 0 (0.0%) | 0 (0.0%) |
| 2 Unit Apartments | 0 (0.0%) | 0 (0.0%) |
| 3 or 4 Unit Apartments | 0 (0.0%) | 0 (0.0%) |
| 5 to 9 Unit Apartments | 0 (0.0%) | 0 (0.0%) |
| 10 or more Apartments | 0 (0.0%) | 0 (0.0%) |
| Mobile Home / Other | 0 (0.0%) | 0 (0.0%) |
| Total | 61 (82.4%) | 13 (17.6%) |
Housing Structures by Number of Rooms in Arbovale
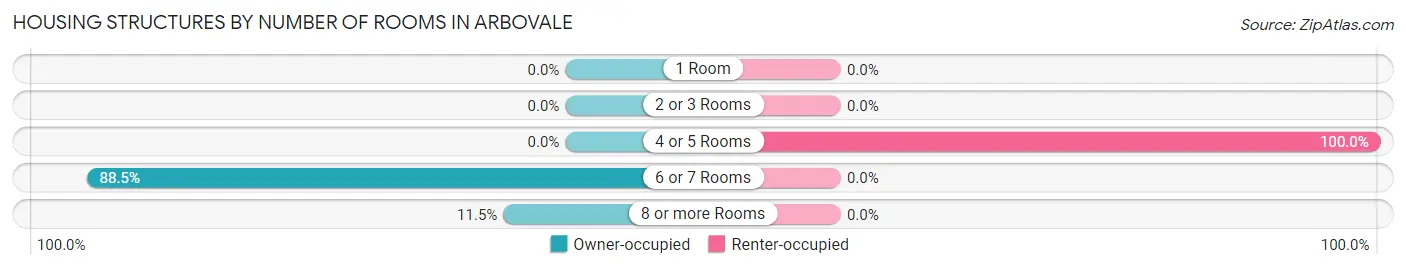
| Number of Rooms | Owner-occupied | Renter-occupied |
| 1 Room | 0 (0.0%) | 0 (0.0%) |
| 2 or 3 Rooms | 0 (0.0%) | 0 (0.0%) |
| 4 or 5 Rooms | 0 (0.0%) | 13 (100.0%) |
| 6 or 7 Rooms | 54 (88.5%) | 0 (0.0%) |
| 8 or more Rooms | 7 (11.5%) | 0 (0.0%) |
| Total | 61 (100.0%) | 13 (100.0%) |
Housing Structure by Heating Type in Arbovale
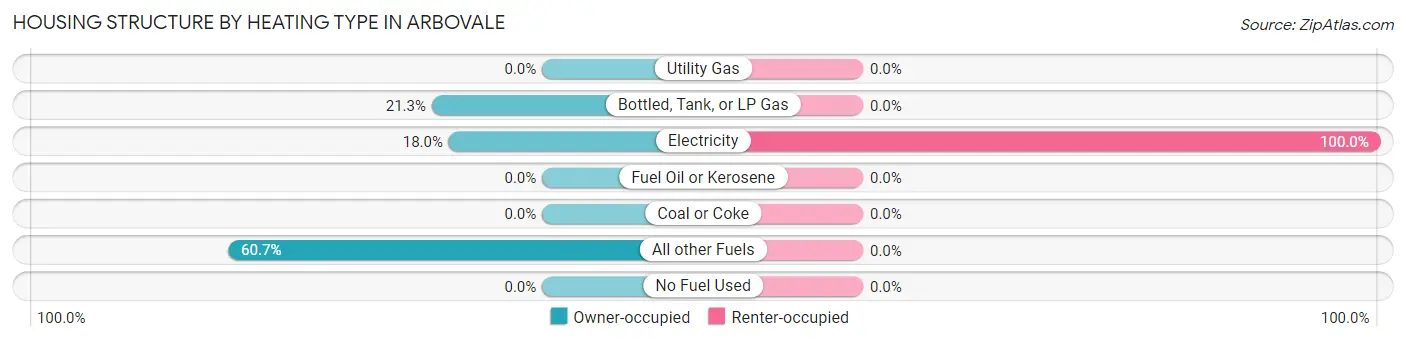
| Heating Type | Owner-occupied | Renter-occupied |
| Utility Gas | 0 (0.0%) | 0 (0.0%) |
| Bottled, Tank, or LP Gas | 13 (21.3%) | 0 (0.0%) |
| Electricity | 11 (18.0%) | 13 (100.0%) |
| Fuel Oil or Kerosene | 0 (0.0%) | 0 (0.0%) |
| Coal or Coke | 0 (0.0%) | 0 (0.0%) |
| All other Fuels | 37 (60.7%) | 0 (0.0%) |
| No Fuel Used | 0 (0.0%) | 0 (0.0%) |
| Total | 61 (100.0%) | 13 (100.0%) |
Household Vehicle Usage in Arbovale
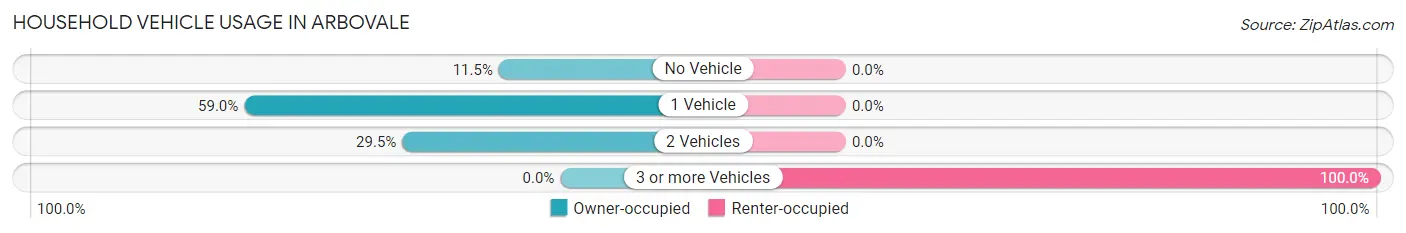
| Vehicles per Household | Owner-occupied | Renter-occupied |
| No Vehicle | 7 (11.5%) | 0 (0.0%) |
| 1 Vehicle | 36 (59.0%) | 0 (0.0%) |
| 2 Vehicles | 18 (29.5%) | 0 (0.0%) |
| 3 or more Vehicles | 0 (0.0%) | 13 (100.0%) |
| Total | 61 (100.0%) | 13 (100.0%) |
Real Estate & Mortgages in Arbovale
Real Estate and Mortgage Overview in Arbovale
| Characteristic | Without Mortgage | With Mortgage |
| Housing Units | 23 | 38 |
| Median Property Value | - | - |
| Median Household Income | - | - |
| Monthly Housing Costs | - | - |
| Real Estate Taxes | - | - |
Property Value by Mortgage Status in Arbovale
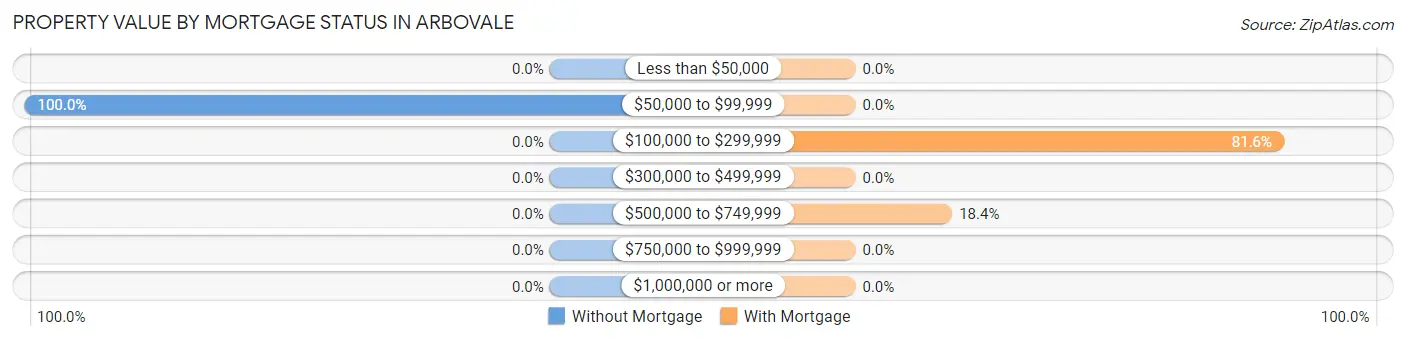
| Property Value | Without Mortgage | With Mortgage |
| Less than $50,000 | 0 (0.0%) | 0 (0.0%) |
| $50,000 to $99,999 | 23 (100.0%) | 0 (0.0%) |
| $100,000 to $299,999 | 0 (0.0%) | 31 (81.6%) |
| $300,000 to $499,999 | 0 (0.0%) | 0 (0.0%) |
| $500,000 to $749,999 | 0 (0.0%) | 7 (18.4%) |
| $750,000 to $999,999 | 0 (0.0%) | 0 (0.0%) |
| $1,000,000 or more | 0 (0.0%) | 0 (0.0%) |
| Total | 23 (100.0%) | 38 (100.0%) |
Household Income by Mortgage Status in Arbovale
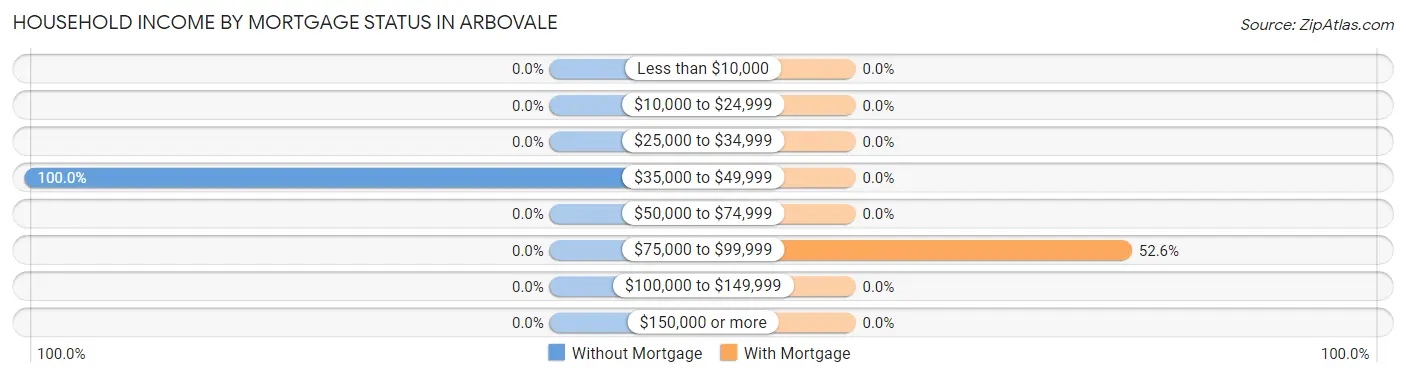
| Household Income | Without Mortgage | With Mortgage |
| Less than $10,000 | 0 (0.0%) | 0 (0.0%) |
| $10,000 to $24,999 | 0 (0.0%) | 0 (0.0%) |
| $25,000 to $34,999 | 0 (0.0%) | 0 (0.0%) |
| $35,000 to $49,999 | 23 (100.0%) | 0 (0.0%) |
| $50,000 to $74,999 | 0 (0.0%) | 0 (0.0%) |
| $75,000 to $99,999 | 0 (0.0%) | 20 (52.6%) |
| $100,000 to $149,999 | 0 (0.0%) | 0 (0.0%) |
| $150,000 or more | 0 (0.0%) | 0 (0.0%) |
| Total | 23 (100.0%) | 38 (100.0%) |
Property Value to Household Income Ratio in Arbovale
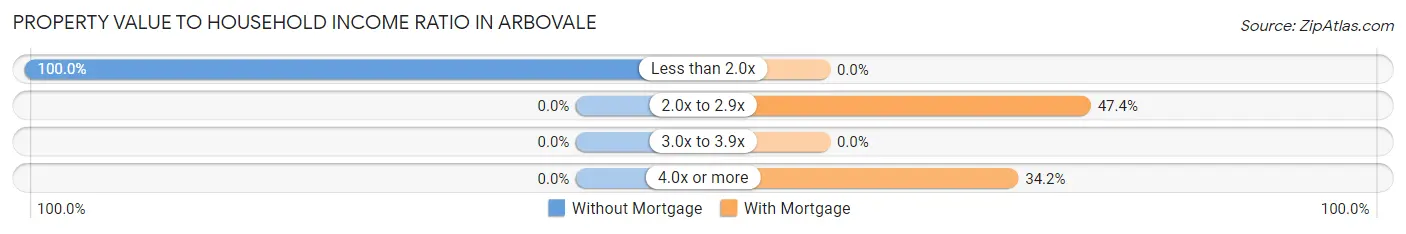
| Value-to-Income Ratio | Without Mortgage | With Mortgage |
| Less than 2.0x | 23 (100.0%) | 0 (0.0%) |
| 2.0x to 2.9x | 0 (0.0%) | 18 (47.4%) |
| 3.0x to 3.9x | 0 (0.0%) | 0 (0.0%) |
| 4.0x or more | 0 (0.0%) | 13 (34.2%) |
| Total | 23 (100.0%) | 38 (100.0%) |
Real Estate Taxes by Mortgage Status in Arbovale
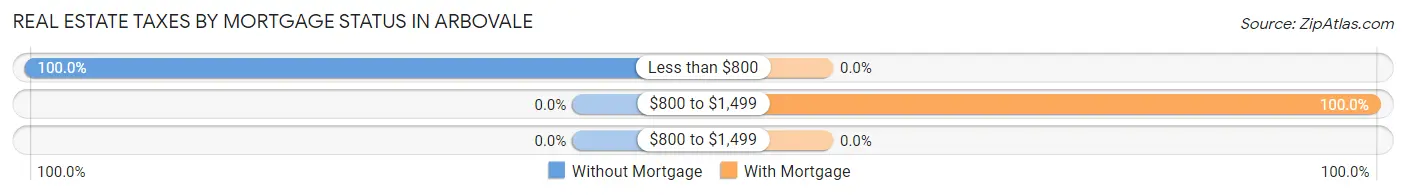
| Property Taxes | Without Mortgage | With Mortgage |
| Less than $800 | 23 (100.0%) | 0 (0.0%) |
| $800 to $1,499 | 0 (0.0%) | 38 (100.0%) |
| $800 to $1,499 | 0 (0.0%) | 0 (0.0%) |
| Total | 23 (100.0%) | 38 (100.0%) |
Health & Disability in Arbovale
Health Insurance Coverage by Age in Arbovale
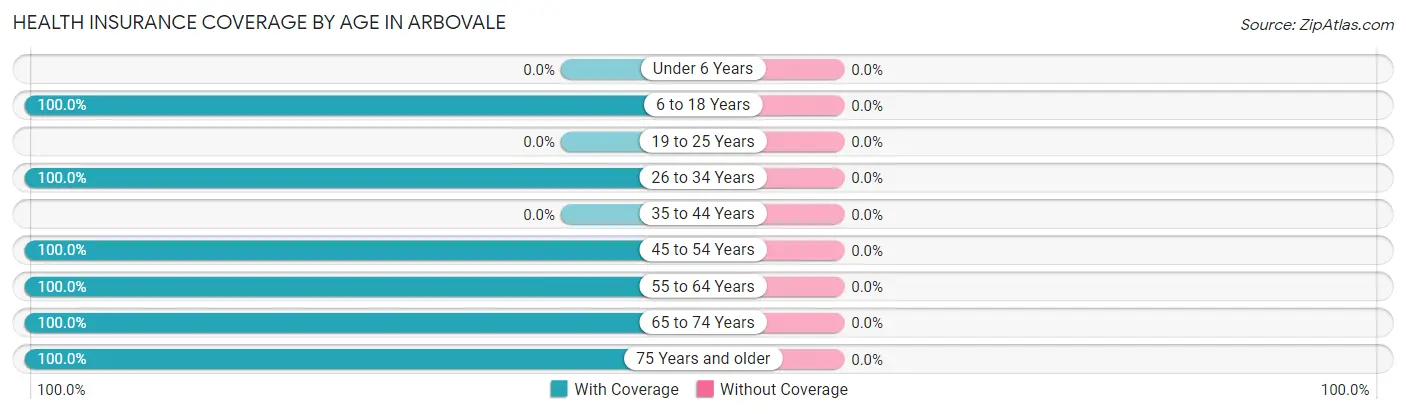
| Age Bracket | With Coverage | Without Coverage |
| Under 6 Years | 0 (0.0%) | 0 (0.0%) |
| 6 to 18 Years | 28 (100.0%) | 0 (0.0%) |
| 19 to 25 Years | 0 (0.0%) | 0 (0.0%) |
| 26 to 34 Years | 36 (100.0%) | 0 (0.0%) |
| 35 to 44 Years | 0 (0.0%) | 0 (0.0%) |
| 45 to 54 Years | 20 (100.0%) | 0 (0.0%) |
| 55 to 64 Years | 14 (100.0%) | 0 (0.0%) |
| 65 to 74 Years | 49 (100.0%) | 0 (0.0%) |
| 75 Years and older | 13 (100.0%) | 0 (0.0%) |
| Total | 160 (100.0%) | 0 (0.0%) |
Health Insurance Coverage by Citizenship Status in Arbovale
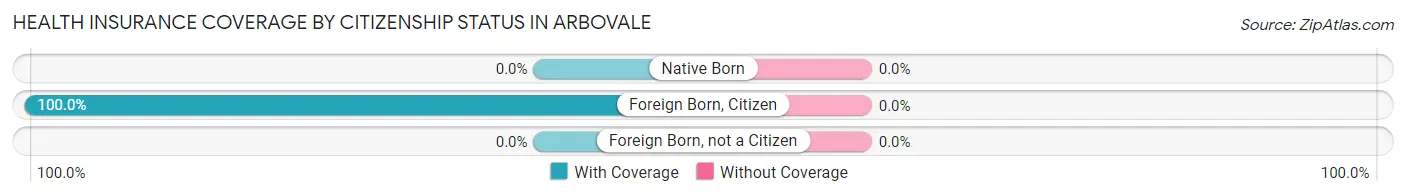
| Citizenship Status | With Coverage | Without Coverage |
| Native Born | 0 (0.0%) | 0 (0.0%) |
| Foreign Born, Citizen | 28 (100.0%) | 0 (0.0%) |
| Foreign Born, not a Citizen | 0 (0.0%) | 0 (0.0%) |
Health Insurance Coverage by Household Income in Arbovale
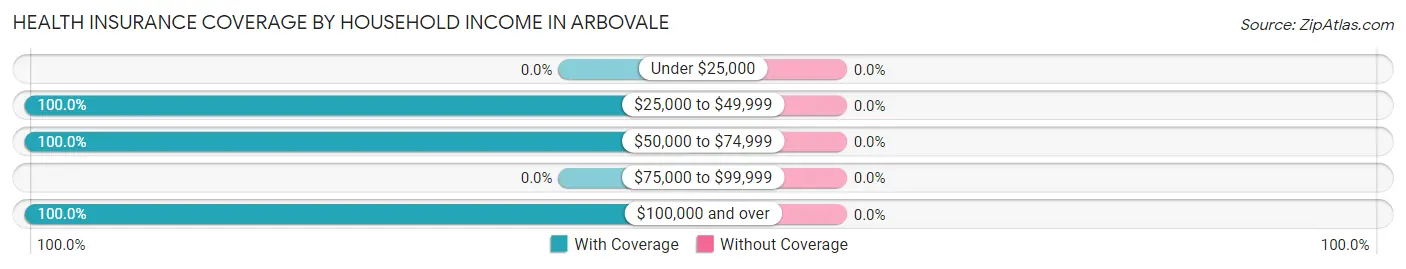
| Household Income | With Coverage | Without Coverage |
| Under $25,000 | 0 (0.0%) | 0 (0.0%) |
| $25,000 to $49,999 | 94 (100.0%) | 0 (0.0%) |
| $50,000 to $74,999 | 28 (100.0%) | 0 (0.0%) |
| $75,000 to $99,999 | 0 (0.0%) | 0 (0.0%) |
| $100,000 and over | 38 (100.0%) | 0 (0.0%) |
Public vs Private Health Insurance Coverage by Age in Arbovale
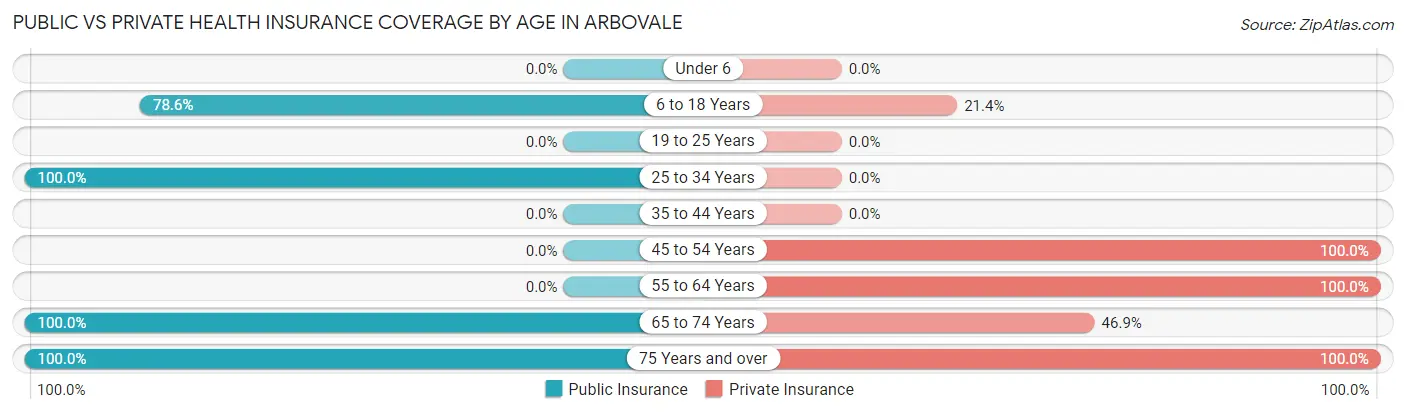
| Age Bracket | Public Insurance | Private Insurance |
| Under 6 | 0 (0.0%) | 0 (0.0%) |
| 6 to 18 Years | 22 (78.6%) | 6 (21.4%) |
| 19 to 25 Years | 0 (0.0%) | 0 (0.0%) |
| 25 to 34 Years | 36 (100.0%) | 0 (0.0%) |
| 35 to 44 Years | 0 (0.0%) | 0 (0.0%) |
| 45 to 54 Years | 0 (0.0%) | 20 (100.0%) |
| 55 to 64 Years | 0 (0.0%) | 14 (100.0%) |
| 65 to 74 Years | 49 (100.0%) | 23 (46.9%) |
| 75 Years and over | 13 (100.0%) | 13 (100.0%) |
| Total | 120 (75.0%) | 76 (47.5%) |
Disability Status by Sex by Age in Arbovale
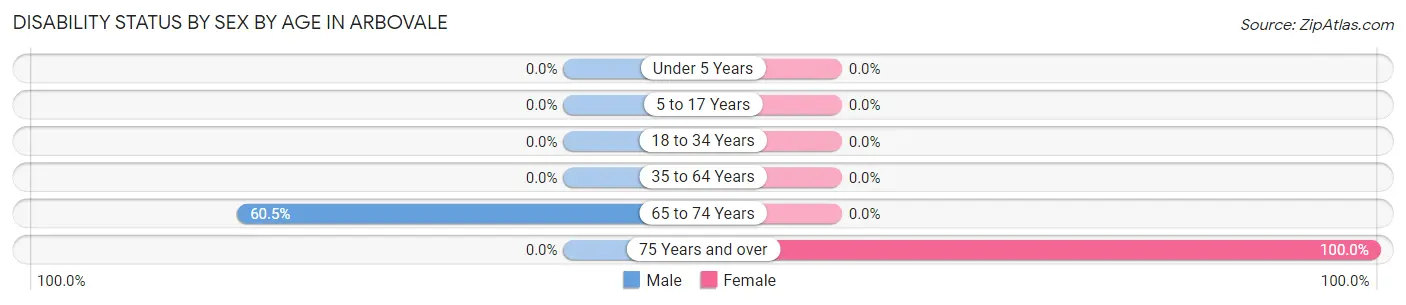
| Age Bracket | Male | Female |
| Under 5 Years | 0 (0.0%) | 0 (0.0%) |
| 5 to 17 Years | 0 (0.0%) | 0 (0.0%) |
| 18 to 34 Years | 0 (0.0%) | 0 (0.0%) |
| 35 to 64 Years | 0 (0.0%) | 0 (0.0%) |
| 65 to 74 Years | 23 (60.5%) | 0 (0.0%) |
| 75 Years and over | 0 (0.0%) | 13 (100.0%) |
Disability Class by Sex by Age in Arbovale
Disability Class: Hearing Difficulty
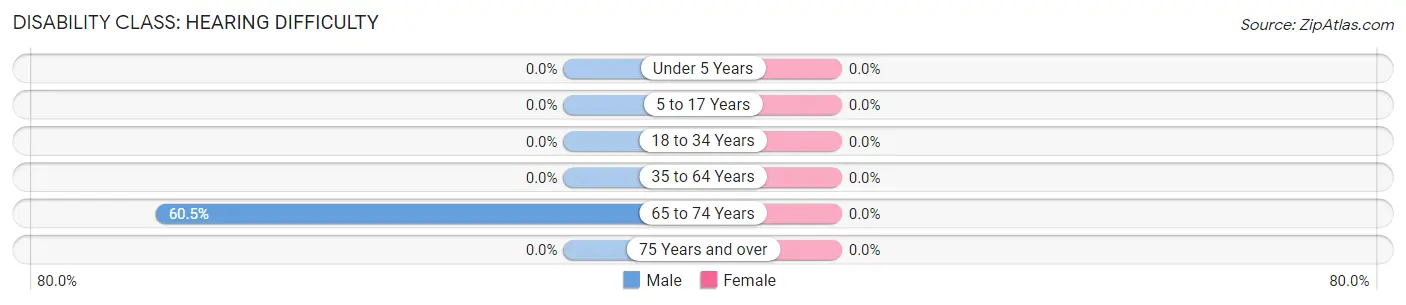
| Age Bracket | Male | Female |
| Under 5 Years | 0 (0.0%) | 0 (0.0%) |
| 5 to 17 Years | 0 (0.0%) | 0 (0.0%) |
| 18 to 34 Years | 0 (0.0%) | 0 (0.0%) |
| 35 to 64 Years | 0 (0.0%) | 0 (0.0%) |
| 65 to 74 Years | 23 (60.5%) | 0 (0.0%) |
| 75 Years and over | 0 (0.0%) | 0 (0.0%) |
Disability Class: Vision Difficulty
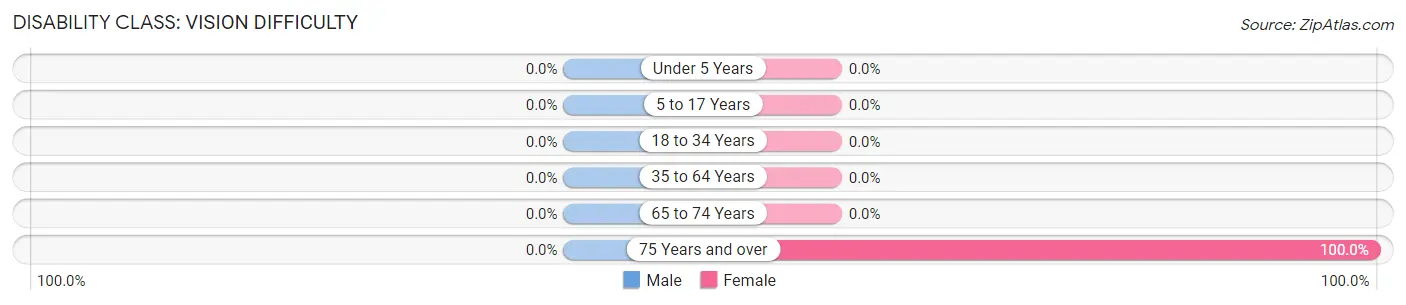
| Age Bracket | Male | Female |
| Under 5 Years | 0 (0.0%) | 0 (0.0%) |
| 5 to 17 Years | 0 (0.0%) | 0 (0.0%) |
| 18 to 34 Years | 0 (0.0%) | 0 (0.0%) |
| 35 to 64 Years | 0 (0.0%) | 0 (0.0%) |
| 65 to 74 Years | 0 (0.0%) | 0 (0.0%) |
| 75 Years and over | 0 (0.0%) | 13 (100.0%) |
Disability Class: Cognitive Difficulty
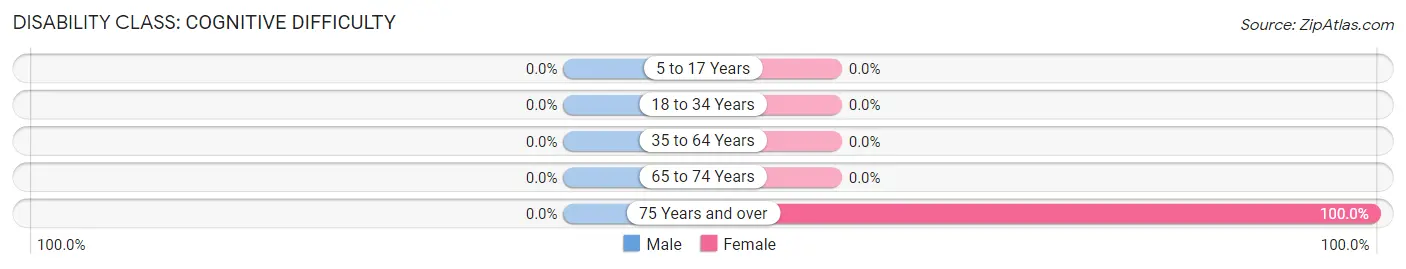
| Age Bracket | Male | Female |
| 5 to 17 Years | 0 (0.0%) | 0 (0.0%) |
| 18 to 34 Years | 0 (0.0%) | 0 (0.0%) |
| 35 to 64 Years | 0 (0.0%) | 0 (0.0%) |
| 65 to 74 Years | 0 (0.0%) | 0 (0.0%) |
| 75 Years and over | 0 (0.0%) | 13 (100.0%) |
Disability Class: Ambulatory Difficulty
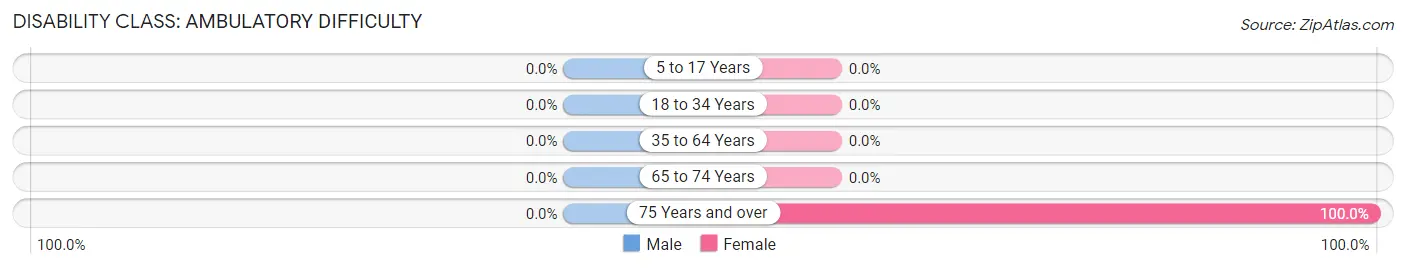
| Age Bracket | Male | Female |
| 5 to 17 Years | 0 (0.0%) | 0 (0.0%) |
| 18 to 34 Years | 0 (0.0%) | 0 (0.0%) |
| 35 to 64 Years | 0 (0.0%) | 0 (0.0%) |
| 65 to 74 Years | 0 (0.0%) | 0 (0.0%) |
| 75 Years and over | 0 (0.0%) | 13 (100.0%) |
Disability Class: Self-Care Difficulty
| Age Bracket | Male | Female |
| 5 to 17 Years | 0 (0.0%) | 0 (0.0%) |
| 18 to 34 Years | 0 (0.0%) | 0 (0.0%) |
| 35 to 64 Years | 0 (0.0%) | 0 (0.0%) |
| 65 to 74 Years | 0 (0.0%) | 0 (0.0%) |
| 75 Years and over | 0 (0.0%) | 0 (0.0%) |
Technology Access in Arbovale
Computing Device Access in Arbovale
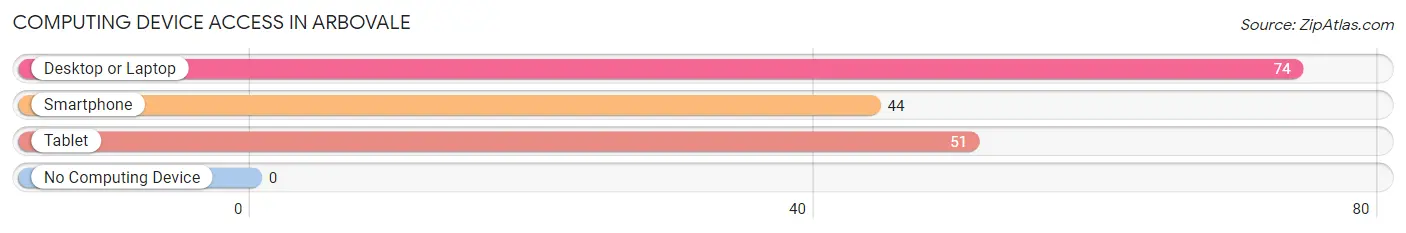
| Device Type | # Households | % Households |
| Desktop or Laptop | 74 | 100.0% |
| Smartphone | 44 | 59.5% |
| Tablet | 51 | 68.9% |
| No Computing Device | 0 | 0.0% |
| Total | 74 | 100.0% |
Internet Access in Arbovale
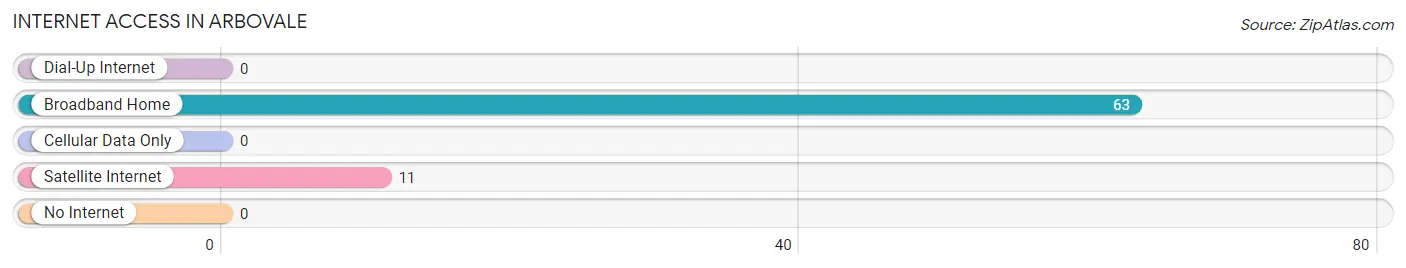
| Internet Type | # Households | % Households |
| Dial-Up Internet | 0 | 0.0% |
| Broadband Home | 63 | 85.1% |
| Cellular Data Only | 0 | 0.0% |
| Satellite Internet | 11 | 14.9% |
| No Internet | 0 | 0.0% |
| Total | 74 | 100.0% |
Arbovale Summary
Arbovale is a small unincorporated community located in Pocahontas County, West Virginia. It is situated in the Allegheny Mountains, approximately 10 miles south of the county seat of Marlinton. The community is located along the Greenbrier River and is home to a population of approximately 500 people.
History
Arbovale was first settled in the late 1700s by a group of settlers from Pennsylvania. The community was originally known as “Arbo”, a name derived from the local Native American word for “river”. The name was later changed to Arbovale when the post office was established in 1883.
The area was primarily a farming community until the early 1900s when the timber industry began to take off. The timber industry provided jobs for many of the local residents and helped to spur the growth of the community.
In the early 1900s, the Chesapeake and Ohio Railway (C&O) built a line through the area, connecting Arbovale to the larger cities of Marlinton and White Sulphur Springs. This allowed for the easy transportation of goods and people, and helped to further spur the growth of the community.
Geography
Arbovale is located in the Allegheny Mountains of Pocahontas County, West Virginia. The community is situated along the Greenbrier River and is surrounded by the Monongahela National Forest. The area is known for its scenic beauty and is a popular destination for outdoor recreation.
The climate in Arbovale is classified as humid continental, with hot summers and cold winters. The average annual temperature is around 50 degrees Fahrenheit, with an average annual precipitation of around 40 inches.
Economy
The economy of Arbovale is primarily based on tourism and outdoor recreation. The area is known for its scenic beauty and is a popular destination for fishing, hunting, camping, and other outdoor activities.
The timber industry is also an important part of the local economy. The area is home to several sawmills and lumber companies, which provide jobs for many of the local residents.
Demographics
As of the 2010 census, the population of Arbovale was 498. The racial makeup of the community was 97.2% White, 0.2% African American, 0.2% Native American, 0.2% Asian, 0.2% from other races, and 1.8% from two or more races.
The median household income in Arbovale was $30,000, and the median family income was $35,000. The per capita income was $17,000. Approximately 15.2% of the population was below the poverty line.
Conclusion
Arbovale is a small unincorporated community located in Pocahontas County, West Virginia. It is situated in the Allegheny Mountains, along the Greenbrier River, and is home to a population of approximately 500 people. The economy of Arbovale is primarily based on tourism and outdoor recreation, as well as the timber industry. The area is known for its scenic beauty and is a popular destination for fishing, hunting, camping, and other outdoor activities.
Common Questions
What is Per Capita Income in Arbovale?
Per Capita income in Arbovale is $38,913.
What is the Median Household income in Arbovale?
Median Household Income in Arbovale is $52,692.
What is Inequality or Gini Index in Arbovale?
Inequality or Gini Index in Arbovale is 0.35.
What is the Total Population of Arbovale?
Total Population of Arbovale is 160.
What is the Total Male Population of Arbovale?
Total Male Population of Arbovale is 66.
What is the Total Female Population of Arbovale?
Total Female Population of Arbovale is 94.
What is the Ratio of Males per 100 Females in Arbovale?
There are 70.21 Males per 100 Females in Arbovale.
What is the Ratio of Females per 100 Males in Arbovale?
There are 142.42 Females per 100 Males in Arbovale.
What is the Median Population Age in Arbovale?
Median Population Age in Arbovale is 51.4 Years.
What is the Average Family Size in Arbovale
Average Family Size in Arbovale is 2.6 People.
What is the Average Household Size in Arbovale
Average Household Size in Arbovale is 2.2 People.
How Large is the Labor Force in Arbovale?
There are 70 People in the Labor Forcein in Arbovale.
What is the Percentage of People in the Labor Force in Arbovale?
50.7% of People are in the Labor Force in Arbovale.