Ansted, WV Map & Demographics
Ansted Map
Ansted Overview
$24,440
PER CAPITA INCOME
$72,879
AVG FAMILY INCOME
$55,404
AVG HOUSEHOLD INCOME
6.2%
WAGE / INCOME GAP [ % ]
93.8¢/ $1
WAGE / INCOME GAP [ $ ]
0.41
INEQUALITY / GINI INDEX
1,276
TOTAL POPULATION
709
MALE POPULATION
567
FEMALE POPULATION
125.04
MALES / 100 FEMALES
79.97
FEMALES / 100 MALES
39.9
MEDIAN AGE
3.2
AVG FAMILY SIZE
2.7
AVG HOUSEHOLD SIZE
651
LABOR FORCE [ PEOPLE ]
60.3%
PERCENT IN LABOR FORCE
8.6%
UNEMPLOYMENT RATE
Ansted Zip Codes
Ansted Area Codes
Income in Ansted
Income Overview in Ansted
Per Capita Income in Ansted is $24,440, while median incomes of families and households are $72,879 and $55,404 respectively.
| Characteristic | Number | Measure |
| Per Capita Income | 1,276 | $24,440 |
| Median Family Income | 314 | $72,879 |
| Mean Family Income | 314 | $66,985 |
| Median Household Income | 467 | $55,404 |
| Mean Household Income | 467 | $60,677 |
| Income Deficit | 314 | $0 |
| Wage / Income Gap (%) | 1,276 | 6.20% |
| Wage / Income Gap ($) | 1,276 | 93.80¢ per $1 |
| Gini / Inequality Index | 1,276 | 0.41 |
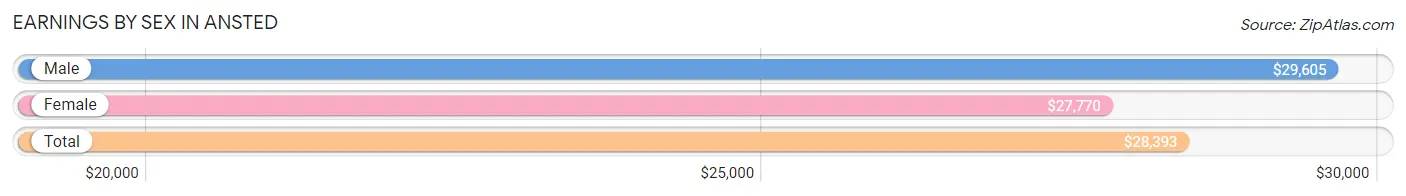
Earnings by Sex in Ansted
Average Earnings in Ansted are $28,393, $29,605 for men and $27,770 for women, a difference of 6.2%.
| Sex | Number | Average Earnings |
| Male | 384 (59.6%) | $29,605 |
| Female | 260 (40.4%) | $27,770 |
| Total | 644 (100.0%) | $28,393 |
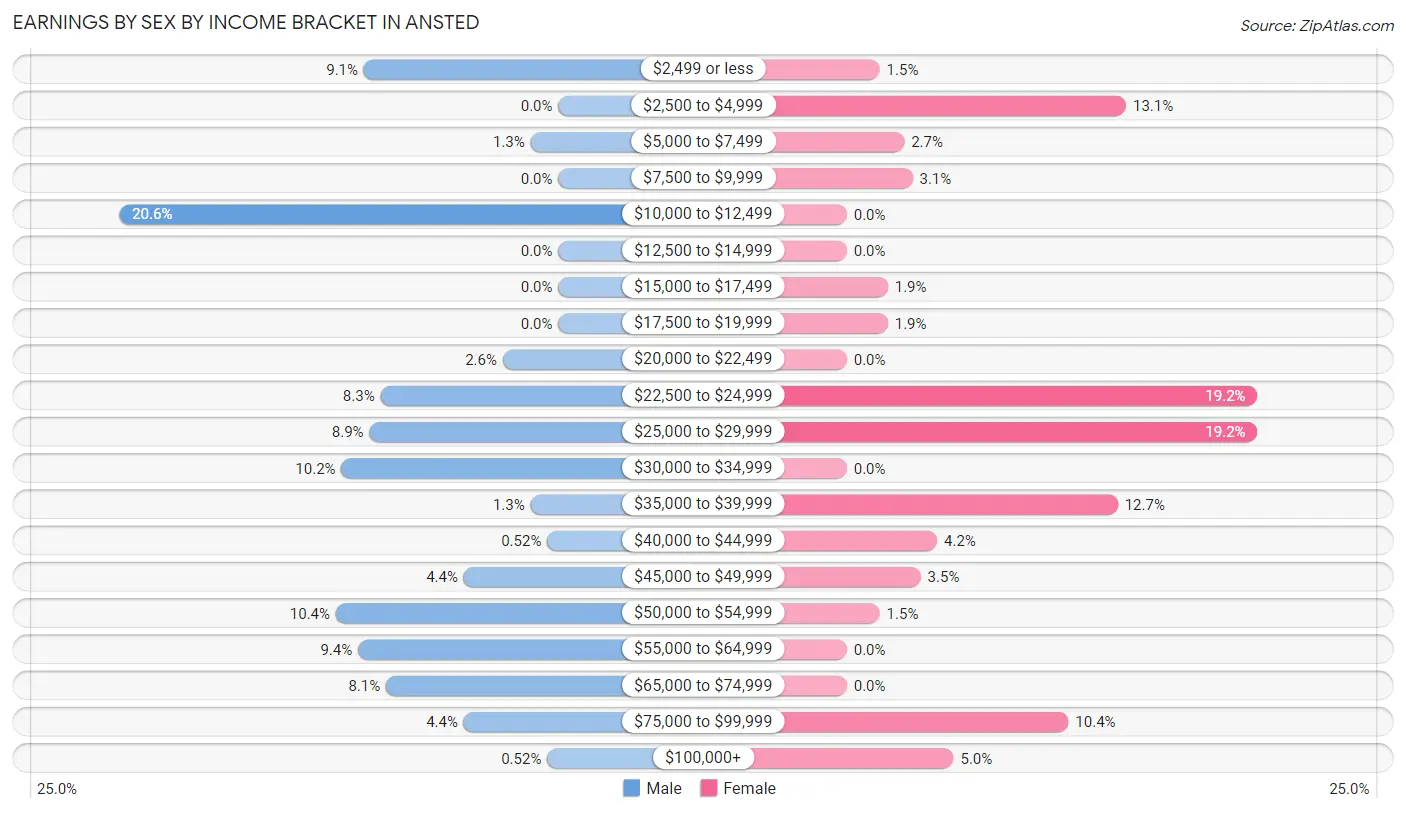
Earnings by Sex by Income Bracket in Ansted
The most common earnings brackets in Ansted are $10,000 to $12,499 for men (79 | 20.6%) and $22,500 to $24,999 for women (50 | 19.2%).
| Income | Male | Female |
| $2,499 or less | 35 (9.1%) | 4 (1.5%) |
| $2,500 to $4,999 | 0 (0.0%) | 34 (13.1%) |
| $5,000 to $7,499 | 5 (1.3%) | 7 (2.7%) |
| $7,500 to $9,999 | 0 (0.0%) | 8 (3.1%) |
| $10,000 to $12,499 | 79 (20.6%) | 0 (0.0%) |
| $12,500 to $14,999 | 0 (0.0%) | 0 (0.0%) |
| $15,000 to $17,499 | 0 (0.0%) | 5 (1.9%) |
| $17,500 to $19,999 | 0 (0.0%) | 5 (1.9%) |
| $20,000 to $22,499 | 10 (2.6%) | 0 (0.0%) |
| $22,500 to $24,999 | 32 (8.3%) | 50 (19.2%) |
| $25,000 to $29,999 | 34 (8.8%) | 50 (19.2%) |
| $30,000 to $34,999 | 39 (10.2%) | 0 (0.0%) |
| $35,000 to $39,999 | 5 (1.3%) | 33 (12.7%) |
| $40,000 to $44,999 | 2 (0.5%) | 11 (4.2%) |
| $45,000 to $49,999 | 17 (4.4%) | 9 (3.5%) |
| $50,000 to $54,999 | 40 (10.4%) | 4 (1.5%) |
| $55,000 to $64,999 | 36 (9.4%) | 0 (0.0%) |
| $65,000 to $74,999 | 31 (8.1%) | 0 (0.0%) |
| $75,000 to $99,999 | 17 (4.4%) | 27 (10.4%) |
| $100,000+ | 2 (0.5%) | 13 (5.0%) |
| Total | 384 (100.0%) | 260 (100.0%) |
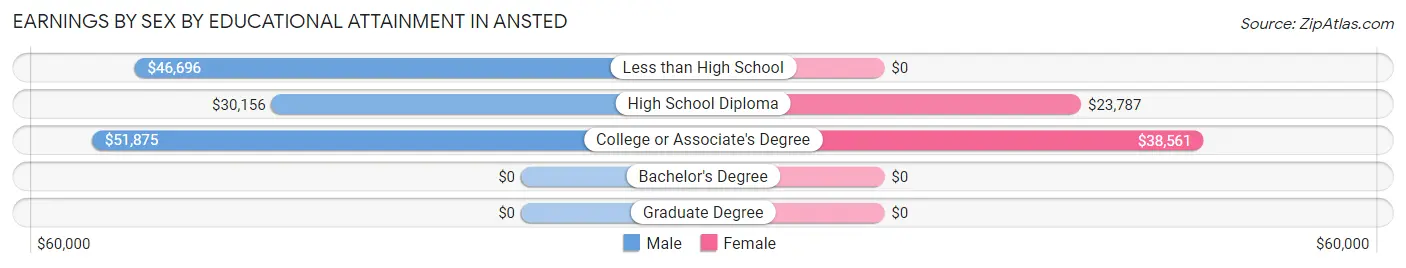
Earnings by Sex by Educational Attainment in Ansted
Average earnings in Ansted are $50,563 for men and $29,189 for women, a difference of 42.3%. Men with an educational attainment of college or associate's degree enjoy the highest average annual earnings of $51,875, while those with high school diploma education earn the least with $30,156. Women with an educational attainment of college or associate's degree earn the most with the average annual earnings of $38,561, while those with high school diploma education have the smallest earnings of $23,787.
| Educational Attainment | Male Income | Female Income |
| Less than High School | $46,696 | $0 |
| High School Diploma | $30,156 | $23,787 |
| College or Associate's Degree | $51,875 | $38,561 |
| Bachelor's Degree | - | - |
| Graduate Degree | - | - |
| Total | $50,563 | $29,189 |
Family Income in Ansted
Family Income Brackets in Ansted
According to the Ansted family income data, there are 69 families falling into the $75,000 to $99,999 income range, which is the most common income bracket and makes up 22.0% of all families.
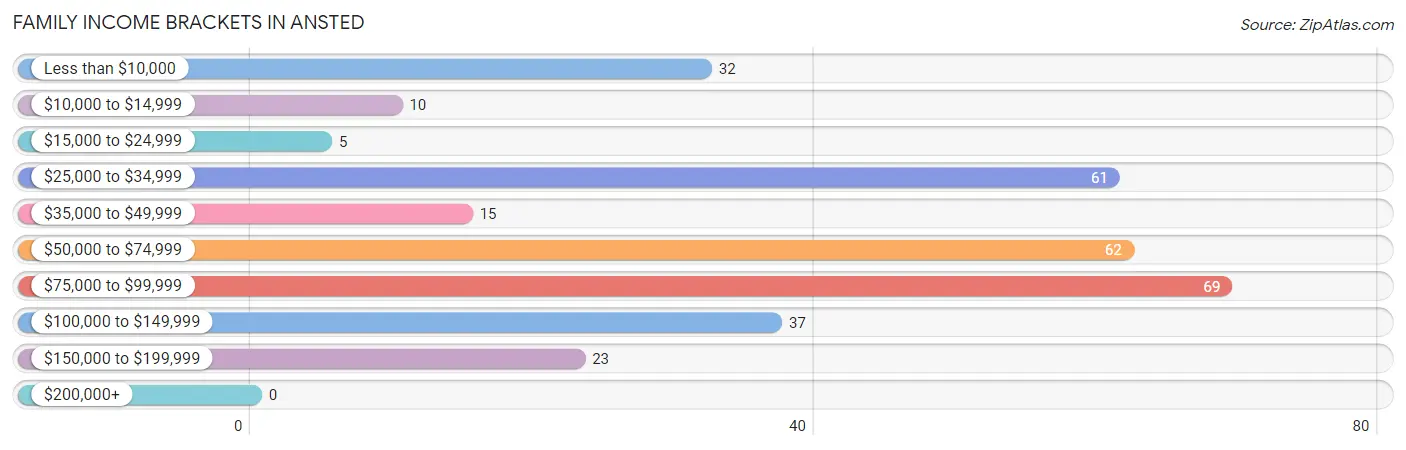
| Income Bracket | # Families | % Families |
| Less than $10,000 | 32 | 10.2% |
| $10,000 to $14,999 | 10 | 3.2% |
| $15,000 to $24,999 | 5 | 1.6% |
| $25,000 to $34,999 | 61 | 19.4% |
| $35,000 to $49,999 | 15 | 4.8% |
| $50,000 to $74,999 | 62 | 19.7% |
| $75,000 to $99,999 | 69 | 22.0% |
| $100,000 to $149,999 | 37 | 11.8% |
| $150,000 to $199,999 | 23 | 7.3% |
| $200,000+ | 0 | 0.0% |
Family Income by Famaliy Size in Ansted
3-person families (68 | 21.7%) account for the highest median family income in Ansted with $78,333 per family, while 2-person families (187 | 59.6%) have the highest median income of $36,487 per family member.
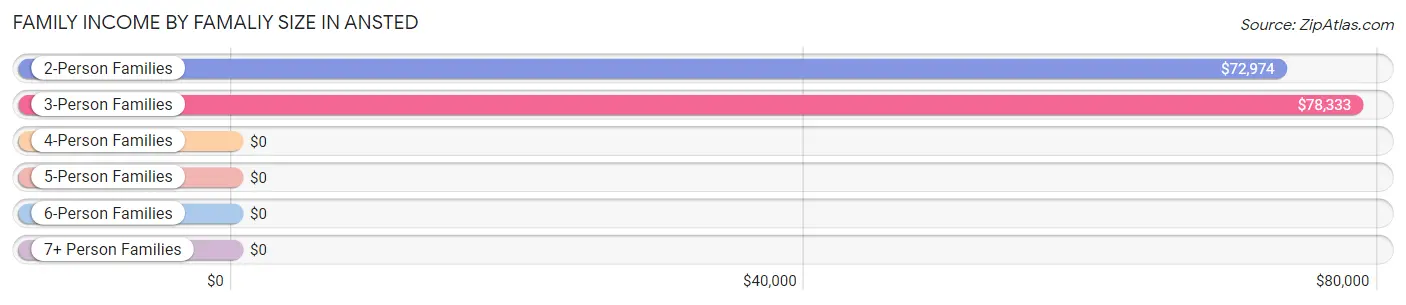
| Income Bracket | # Families | Median Income |
| 2-Person Families | 187 (59.6%) | $72,974 |
| 3-Person Families | 68 (21.7%) | $78,333 |
| 4-Person Families | 38 (12.1%) | $0 |
| 5-Person Families | 14 (4.5%) | $0 |
| 6-Person Families | 0 (0.0%) | $0 |
| 7+ Person Families | 7 (2.2%) | $0 |
| Total | 314 (100.0%) | $72,879 |
Family Income by Number of Earners in Ansted
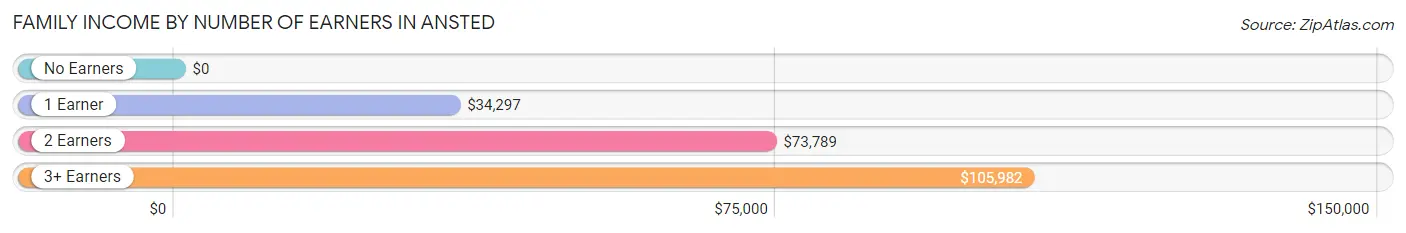
| Number of Earners | # Families | Median Income |
| No Earners | 63 (20.1%) | $0 |
| 1 Earner | 57 (18.1%) | $34,297 |
| 2 Earners | 169 (53.8%) | $73,789 |
| 3+ Earners | 25 (8.0%) | $105,982 |
| Total | 314 (100.0%) | $72,879 |
Household Income in Ansted
Household Income Brackets in Ansted
With 89 households falling in the category, the $50,000 to $74,999 income range is the most frequent in Ansted, accounting for 19.1% of all households.
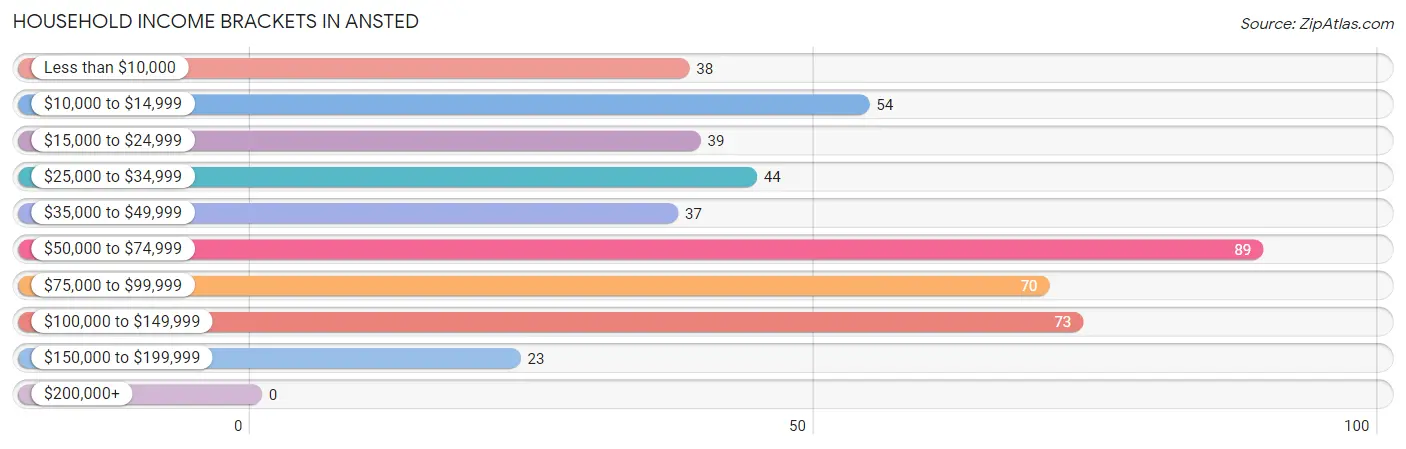
| Income Bracket | # Households | % Households |
| Less than $10,000 | 38 | 8.1% |
| $10,000 to $14,999 | 54 | 11.6% |
| $15,000 to $24,999 | 39 | 8.4% |
| $25,000 to $34,999 | 44 | 9.4% |
| $35,000 to $49,999 | 37 | 7.9% |
| $50,000 to $74,999 | 89 | 19.1% |
| $75,000 to $99,999 | 70 | 15.0% |
| $100,000 to $149,999 | 73 | 15.6% |
| $150,000 to $199,999 | 23 | 4.9% |
| $200,000+ | 0 | 0.0% |
Household Income by Householder Age in Ansted
The median household income in Ansted is $55,404, with the highest median household income of $74,732 found in the 25 to 44 years age bracket for the primary householder. A total of 112 households (24.0%) fall into this category. Meanwhile, the 15 to 24 years age bracket for the primary householder has the lowest median household income of $0, with 25 households (5.3%) in this group.
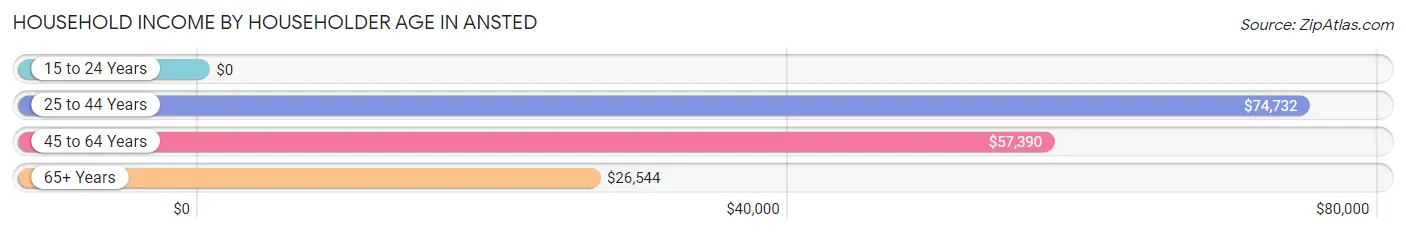
| Income Bracket | # Households | Median Income |
| 15 to 24 Years | 25 (5.3%) | $0 |
| 25 to 44 Years | 112 (24.0%) | $74,732 |
| 45 to 64 Years | 141 (30.2%) | $57,390 |
| 65+ Years | 189 (40.5%) | $26,544 |
| Total | 467 (100.0%) | $55,404 |
Poverty in Ansted
Income Below Poverty by Sex and Age in Ansted
With 24.9% poverty level for males and 18.5% for females among the residents of Ansted, 5 year old males and 18 to 24 year old females are the most vulnerable to poverty, with 14 males (100.0%) and 26 females (37.7%) in their respective age groups living below the poverty level.
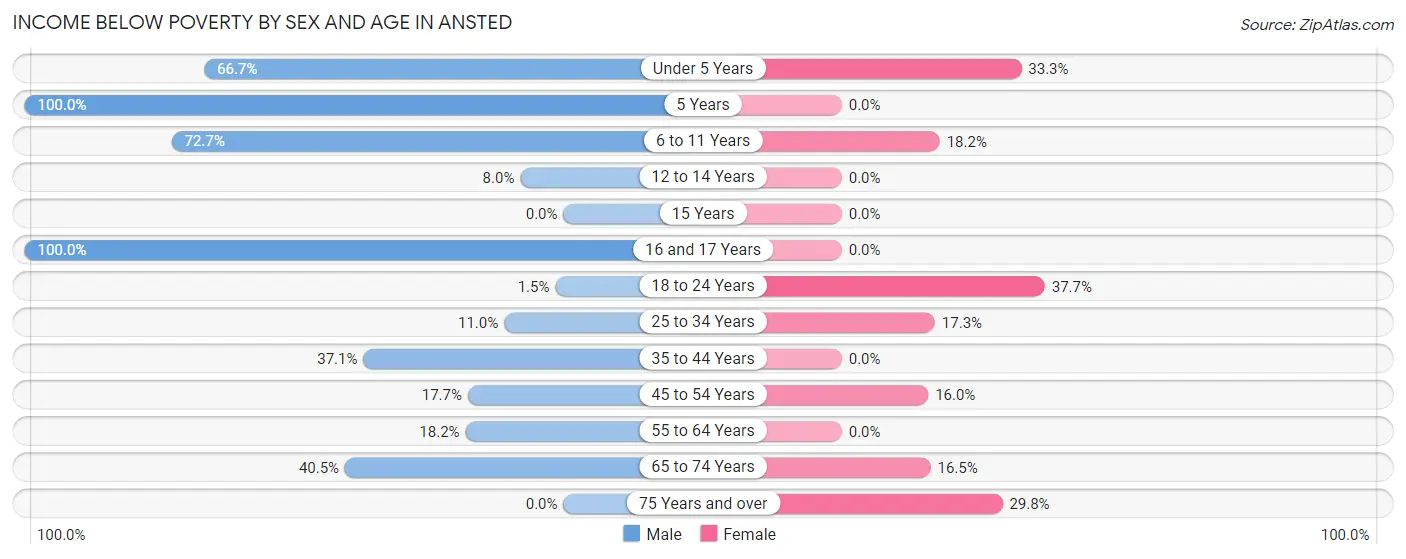
| Age Bracket | Male | Female |
| Under 5 Years | 12 (66.7%) | 14 (33.3%) |
| 5 Years | 14 (100.0%) | 0 (0.0%) |
| 6 to 11 Years | 24 (72.7%) | 2 (18.2%) |
| 12 to 14 Years | 4 (8.0%) | 0 (0.0%) |
| 15 Years | 0 (0.0%) | 0 (0.0%) |
| 16 and 17 Years | 18 (100.0%) | 0 (0.0%) |
| 18 to 24 Years | 2 (1.5%) | 26 (37.7%) |
| 25 to 34 Years | 11 (11.0%) | 14 (17.3%) |
| 35 to 44 Years | 13 (37.1%) | 0 (0.0%) |
| 45 to 54 Years | 11 (17.7%) | 17 (16.0%) |
| 55 to 64 Years | 20 (18.2%) | 0 (0.0%) |
| 65 to 74 Years | 45 (40.5%) | 15 (16.5%) |
| 75 Years and over | 0 (0.0%) | 17 (29.8%) |
| Total | 174 (24.9%) | 105 (18.5%) |
Income Above Poverty by Sex and Age in Ansted
According to the poverty statistics in Ansted, males aged 15 years and females aged 12 to 14 years are the age groups that are most secure financially, with 100.0% of males and 100.0% of females in these age groups living above the poverty line.
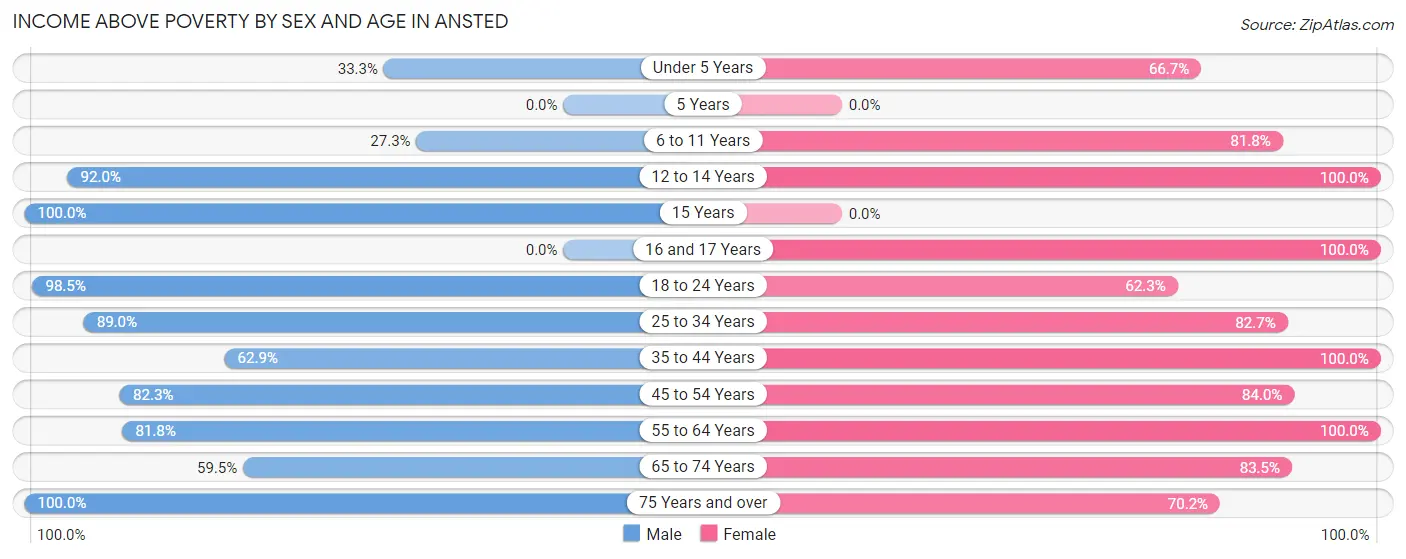
| Age Bracket | Male | Female |
| Under 5 Years | 6 (33.3%) | 28 (66.7%) |
| 5 Years | 0 (0.0%) | 0 (0.0%) |
| 6 to 11 Years | 9 (27.3%) | 9 (81.8%) |
| 12 to 14 Years | 46 (92.0%) | 18 (100.0%) |
| 15 Years | 10 (100.0%) | 0 (0.0%) |
| 16 and 17 Years | 0 (0.0%) | 19 (100.0%) |
| 18 to 24 Years | 132 (98.5%) | 43 (62.3%) |
| 25 to 34 Years | 89 (89.0%) | 67 (82.7%) |
| 35 to 44 Years | 22 (62.9%) | 31 (100.0%) |
| 45 to 54 Years | 51 (82.3%) | 89 (84.0%) |
| 55 to 64 Years | 90 (81.8%) | 42 (100.0%) |
| 65 to 74 Years | 66 (59.5%) | 76 (83.5%) |
| 75 Years and over | 3 (100.0%) | 40 (70.2%) |
| Total | 524 (75.1%) | 462 (81.5%) |
Income Below Poverty Among Married-Couple Families in Ansted
The poverty statistics for married-couple families in Ansted show that 9.1% or 17 of the total 187 families live below the poverty line. Families with 3 or 4 children have the highest poverty rate of 100.0%, comprising of 11 families. On the other hand, families with 5 or more children have the lowest poverty rate of 0.0%, which includes 0 families.
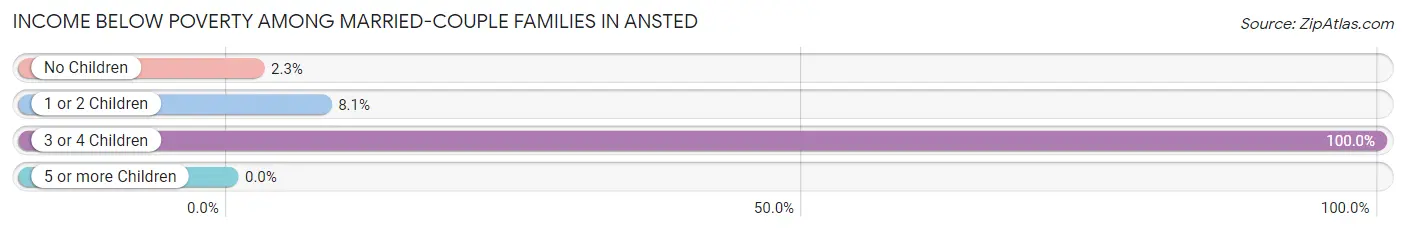
| Children | Above Poverty | Below Poverty |
| No Children | 129 (97.7%) | 3 (2.3%) |
| 1 or 2 Children | 34 (91.9%) | 3 (8.1%) |
| 3 or 4 Children | 0 (0.0%) | 11 (100.0%) |
| 5 or more Children | 7 (100.0%) | 0 (0.0%) |
| Total | 170 (90.9%) | 17 (9.1%) |
Income Below Poverty Among Single-Parent Households in Ansted
According to the poverty data in Ansted, 50.0% or 10 single-father households and 21.5% or 23 single-mother households are living below the poverty line. Among single-father households, those with no children have the highest poverty rate, with 10 households (50.0%) experiencing poverty. Likewise, among single-mother households, those with 1 or 2 children have the highest poverty rate, with 21 households (100.0%) falling below the poverty line.
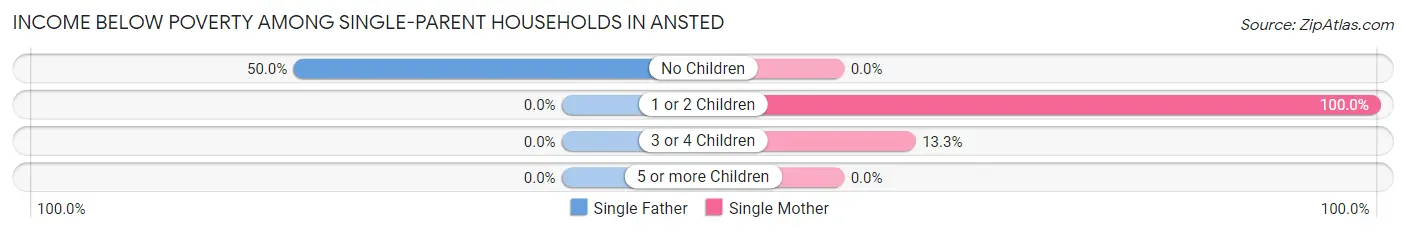
| Children | Single Father | Single Mother |
| No Children | 10 (50.0%) | 0 (0.0%) |
| 1 or 2 Children | 0 (0.0%) | 21 (100.0%) |
| 3 or 4 Children | 0 (0.0%) | 2 (13.3%) |
| 5 or more Children | 0 (0.0%) | 0 (0.0%) |
| Total | 10 (50.0%) | 23 (21.5%) |
Income Below Poverty Among Married-Couple vs Single-Parent Households in Ansted
The poverty data for Ansted shows that 17 of the married-couple family households (9.1%) and 33 of the single-parent households (26.0%) are living below the poverty level. Within the married-couple family households, those with 3 or 4 children have the highest poverty rate, with 11 households (100.0%) falling below the poverty line. Among the single-parent households, those with 1 or 2 children have the highest poverty rate, with 21 household (100.0%) living below poverty.
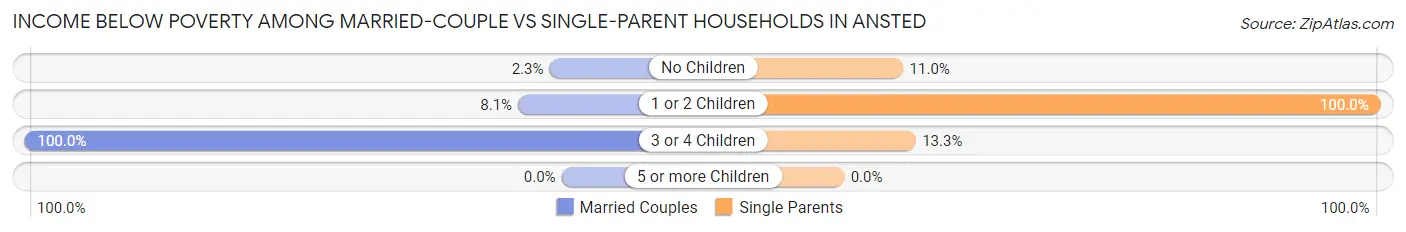
| Children | Married-Couple Families | Single-Parent Households |
| No Children | 3 (2.3%) | 10 (11.0%) |
| 1 or 2 Children | 3 (8.1%) | 21 (100.0%) |
| 3 or 4 Children | 11 (100.0%) | 2 (13.3%) |
| 5 or more Children | 0 (0.0%) | 0 (0.0%) |
| Total | 17 (9.1%) | 33 (26.0%) |
Race in Ansted
The most populous races in Ansted are White / Caucasian (1,262 | 98.9%), and Two or more Races (14 | 1.1%).
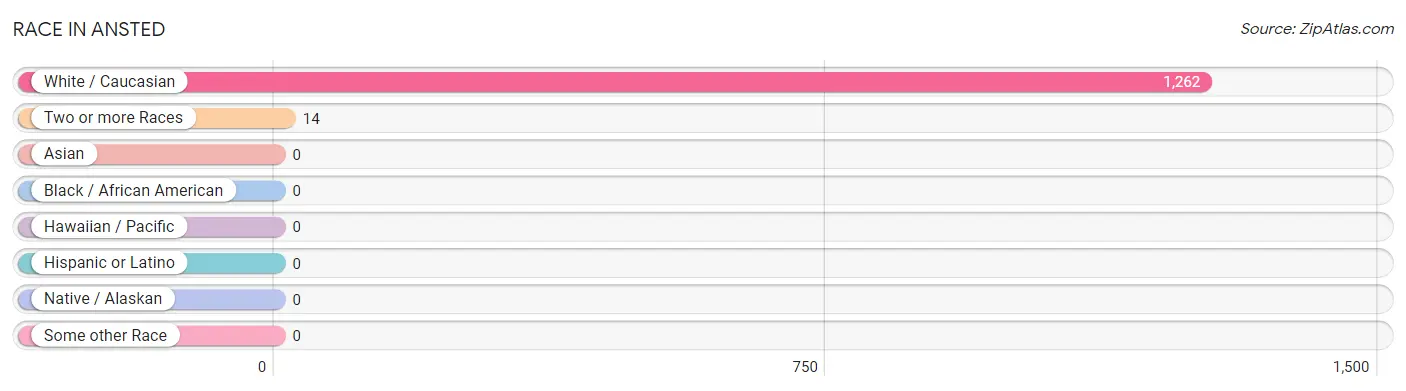
| Race | # Population | % Population |
| Asian | 0 | 0.0% |
| Black / African American | 0 | 0.0% |
| Hawaiian / Pacific | 0 | 0.0% |
| Hispanic or Latino | 0 | 0.0% |
| Native / Alaskan | 0 | 0.0% |
| White / Caucasian | 1,262 | 98.9% |
| Two or more Races | 14 | 1.1% |
| Some other Race | 0 | 0.0% |
| Total | 1,276 | 100.0% |
Ancestry in Ansted
The most populous ancestries reported in Ansted are Irish (186 | 14.6%), English (185 | 14.5%), German (160 | 12.5%), American (94 | 7.4%), and Dutch (71 | 5.6%), together accounting for 54.5% of all Ansted residents.
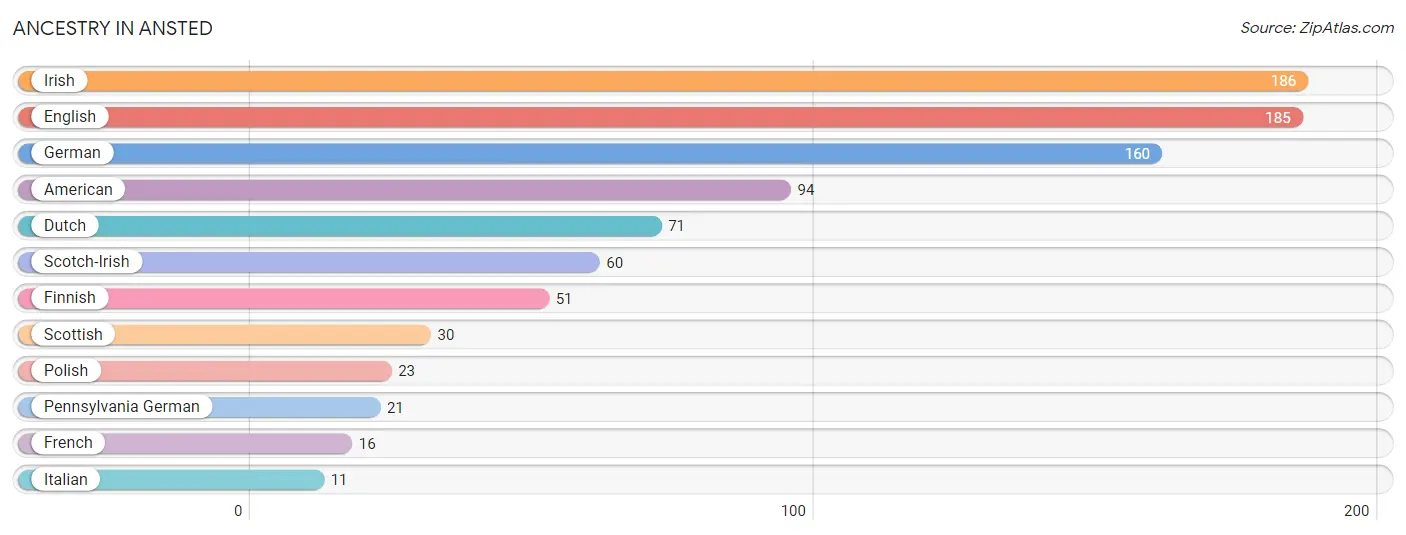
| Ancestry | # Population | % Population |
| American | 94 | 7.4% |
| Dutch | 71 | 5.6% |
| English | 185 | 14.5% |
| Finnish | 51 | 4.0% |
| French | 16 | 1.3% |
| German | 160 | 12.5% |
| Irish | 186 | 14.6% |
| Italian | 11 | 0.9% |
| Pennsylvania German | 21 | 1.7% |
| Polish | 23 | 1.8% |
| Scotch-Irish | 60 | 4.7% |
| Scottish | 30 | 2.4% | View All 12 Rows |
Immigrants in Ansted

| Immigration Origin | # Population | % Population | View All 0 Rows |
Sex and Age in Ansted
Sex and Age in Ansted
The most populous age groups in Ansted are 20 to 24 Years (132 | 18.6%) for men and 20 to 24 Years (65 | 11.5%) for women.
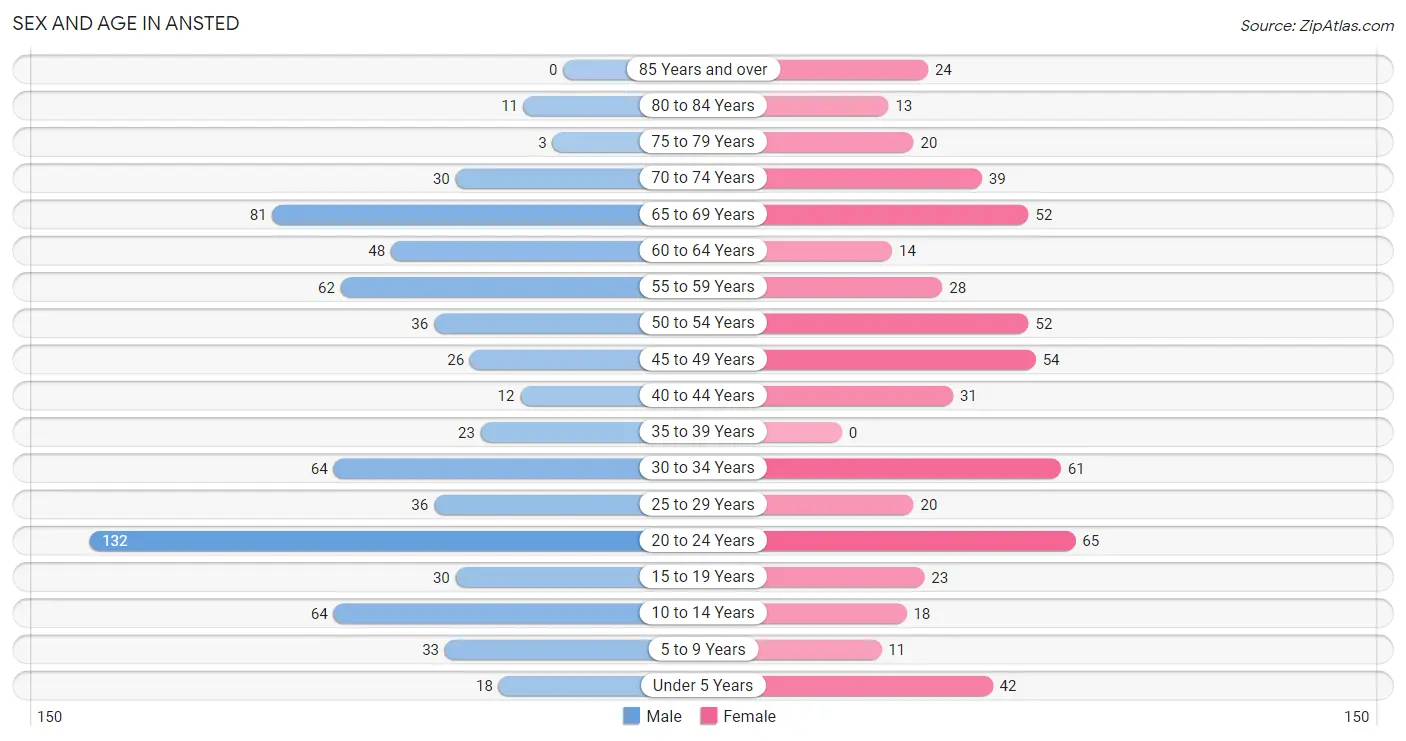
| Age Bracket | Male | Female |
| Under 5 Years | 18 (2.5%) | 42 (7.4%) |
| 5 to 9 Years | 33 (4.6%) | 11 (1.9%) |
| 10 to 14 Years | 64 (9.0%) | 18 (3.2%) |
| 15 to 19 Years | 30 (4.2%) | 23 (4.1%) |
| 20 to 24 Years | 132 (18.6%) | 65 (11.5%) |
| 25 to 29 Years | 36 (5.1%) | 20 (3.5%) |
| 30 to 34 Years | 64 (9.0%) | 61 (10.8%) |
| 35 to 39 Years | 23 (3.2%) | 0 (0.0%) |
| 40 to 44 Years | 12 (1.7%) | 31 (5.5%) |
| 45 to 49 Years | 26 (3.7%) | 54 (9.5%) |
| 50 to 54 Years | 36 (5.1%) | 52 (9.2%) |
| 55 to 59 Years | 62 (8.7%) | 28 (4.9%) |
| 60 to 64 Years | 48 (6.8%) | 14 (2.5%) |
| 65 to 69 Years | 81 (11.4%) | 52 (9.2%) |
| 70 to 74 Years | 30 (4.2%) | 39 (6.9%) |
| 75 to 79 Years | 3 (0.4%) | 20 (3.5%) |
| 80 to 84 Years | 11 (1.5%) | 13 (2.3%) |
| 85 Years and over | 0 (0.0%) | 24 (4.2%) |
| Total | 709 (100.0%) | 567 (100.0%) |
Families and Households in Ansted
Median Family Size in Ansted
The median family size in Ansted is 3.18 persons per family, with married-couple families (187 | 59.6%) accounting for the largest median family size of 3.24 persons per family. On the other hand, single male/father families (20 | 6.4%) represent the smallest median family size with 2.55 persons per family.
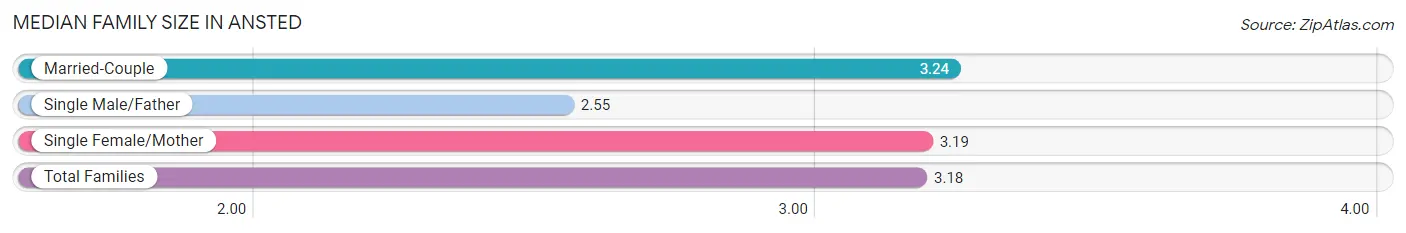
| Family Type | # Families | Family Size |
| Married-Couple | 187 (59.6%) | 3.24 |
| Single Male/Father | 20 (6.4%) | 2.55 |
| Single Female/Mother | 107 (34.1%) | 3.19 |
| Total Families | 314 (100.0%) | 3.18 |
Median Household Size in Ansted
The median household size in Ansted is 2.71 persons per household, with single female/mother households (107 | 22.9%) accounting for the largest median household size of 3.89 persons per household. non-family households (153 | 32.8%) represent the smallest median household size with 1.19 persons per household.
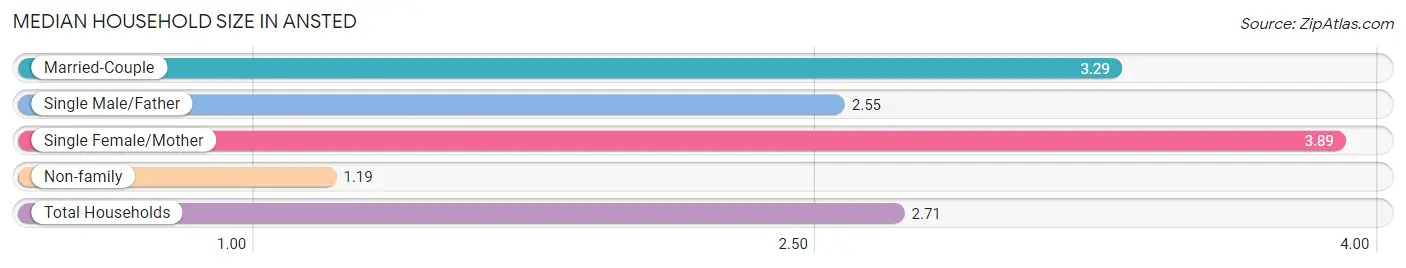
| Household Type | # Households | Household Size |
| Married-Couple | 187 (40.0%) | 3.29 |
| Single Male/Father | 20 (4.3%) | 2.55 |
| Single Female/Mother | 107 (22.9%) | 3.89 |
| Non-family | 153 (32.8%) | 1.19 |
| Total Households | 467 (100.0%) | 2.71 |
Household Size by Marriage Status in Ansted
Out of a total of 467 households in Ansted, 314 (67.2%) are family households, while 153 (32.8%) are nonfamily households. The most numerous type of family households are 2-person households, comprising 141, and the most common type of nonfamily households are 1-person households, comprising 123.
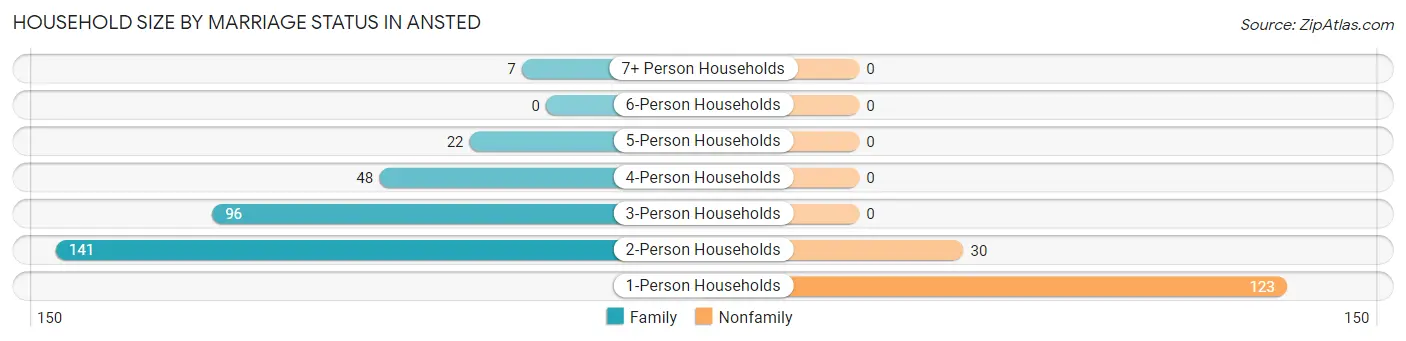
| Household Size | Family Households | Nonfamily Households |
| 1-Person Households | - | 123 (26.3%) |
| 2-Person Households | 141 (30.2%) | 30 (6.4%) |
| 3-Person Households | 96 (20.6%) | 0 (0.0%) |
| 4-Person Households | 48 (10.3%) | 0 (0.0%) |
| 5-Person Households | 22 (4.7%) | 0 (0.0%) |
| 6-Person Households | 0 (0.0%) | 0 (0.0%) |
| 7+ Person Households | 7 (1.5%) | 0 (0.0%) |
| Total | 314 (67.2%) | 153 (32.8%) |
Female Fertility in Ansted
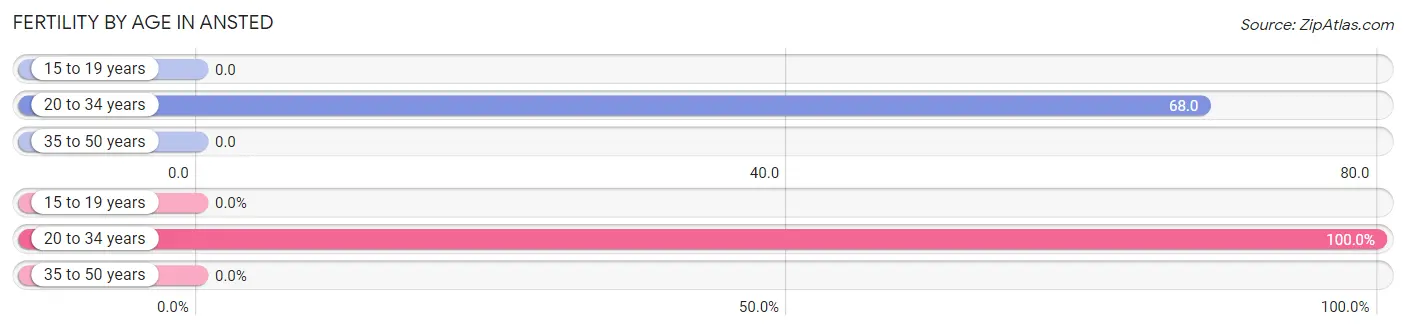
Fertility by Age in Ansted
Average fertility rate in Ansted is 39.0 births per 1,000 women. Women in the age bracket of 20 to 34 years have the highest fertility rate with 68.0 births per 1,000 women. Women in the age bracket of 20 to 34 years acount for 100.0% of all women with births.
| Age Bracket | Women with Births | Births / 1,000 Women |
| 15 to 19 years | 0 (0.0%) | 0.0 |
| 20 to 34 years | 10 (100.0%) | 68.0 |
| 35 to 50 years | 0 (0.0%) | 0.0 |
| Total | 10 (100.0%) | 39.0 |
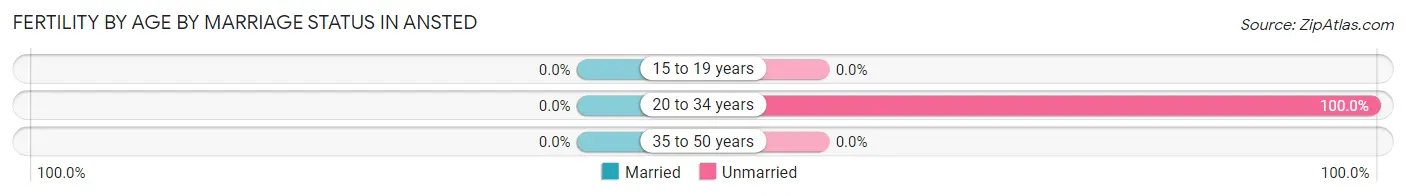
Fertility by Age by Marriage Status in Ansted
| Age Bracket | Married | Unmarried |
| 15 to 19 years | 0 (0.0%) | 0 (0.0%) |
| 20 to 34 years | 0 (0.0%) | 10 (100.0%) |
| 35 to 50 years | 0 (0.0%) | 0 (0.0%) |
| Total | 0 (0.0%) | 10 (100.0%) |
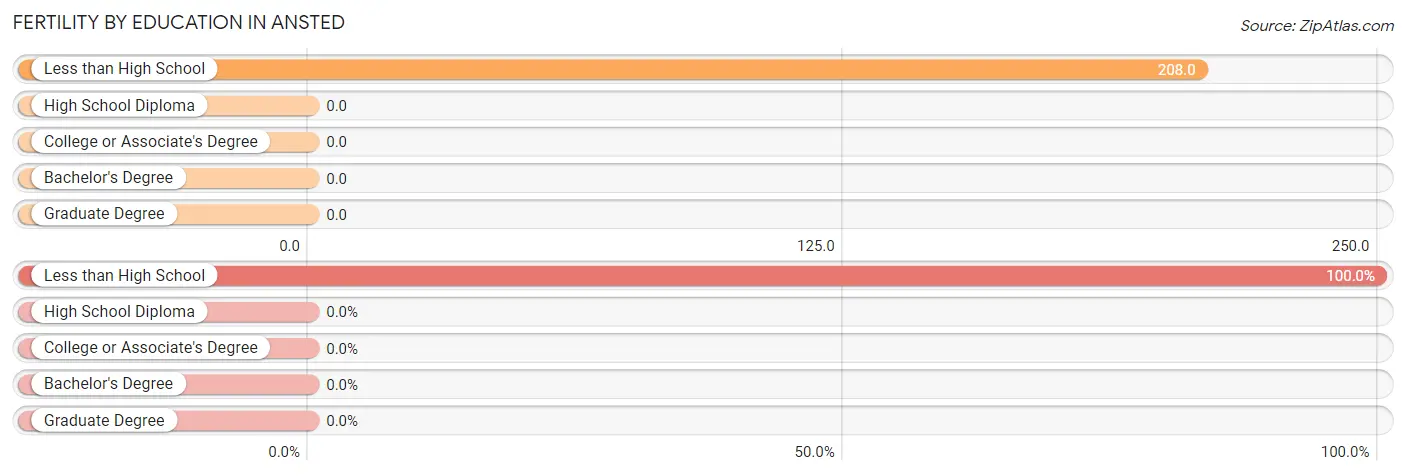
Fertility by Education in Ansted
| Educational Attainment | Women with Births | Births / 1,000 Women |
| Less than High School | 10 (100.0%) | 208.0 |
| High School Diploma | 0 (0.0%) | 0.0 |
| College or Associate's Degree | 0 (0.0%) | 0.0 |
| Bachelor's Degree | 0 (0.0%) | 0.0 |
| Graduate Degree | 0 (0.0%) | 0.0 |
| Total | 10 (100.0%) | 39.0 |
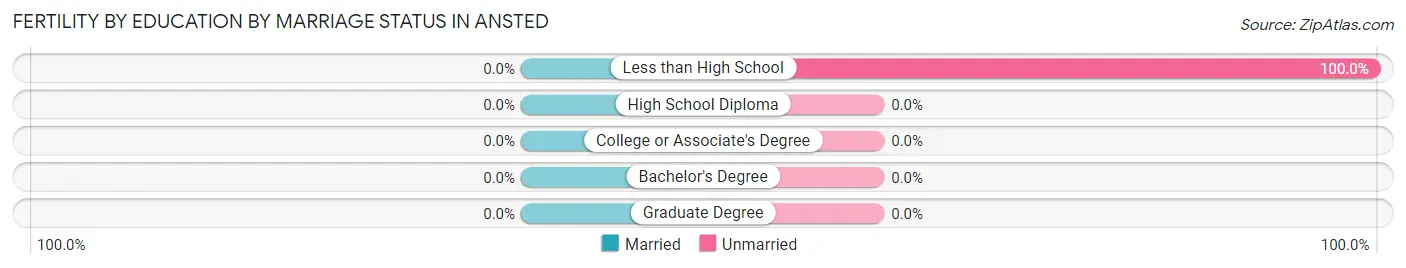
Fertility by Education by Marriage Status in Ansted
| Educational Attainment | Married | Unmarried |
| Less than High School | 0 (0.0%) | 10 (100.0%) |
| High School Diploma | 0 (0.0%) | 0 (0.0%) |
| College or Associate's Degree | 0 (0.0%) | 0 (0.0%) |
| Bachelor's Degree | 0 (0.0%) | 0 (0.0%) |
| Graduate Degree | 0 (0.0%) | 0 (0.0%) |
| Total | 0 (0.0%) | 10 (100.0%) |
Employment Characteristics in Ansted
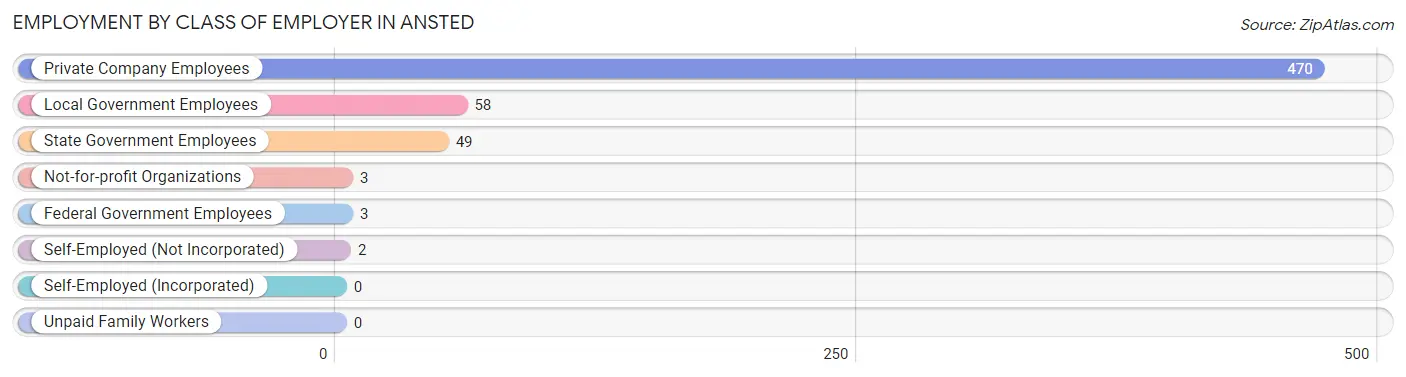
Employment by Class of Employer in Ansted
Among the 585 employed individuals in Ansted, private company employees (470 | 80.3%), local government employees (58 | 9.9%), and state government employees (49 | 8.4%) make up the most common classes of employment.
| Employer Class | # Employees | % Employees |
| Private Company Employees | 470 | 80.3% |
| Self-Employed (Incorporated) | 0 | 0.0% |
| Self-Employed (Not Incorporated) | 2 | 0.3% |
| Not-for-profit Organizations | 3 | 0.5% |
| Local Government Employees | 58 | 9.9% |
| State Government Employees | 49 | 8.4% |
| Federal Government Employees | 3 | 0.5% |
| Unpaid Family Workers | 0 | 0.0% |
| Total | 585 | 100.0% |
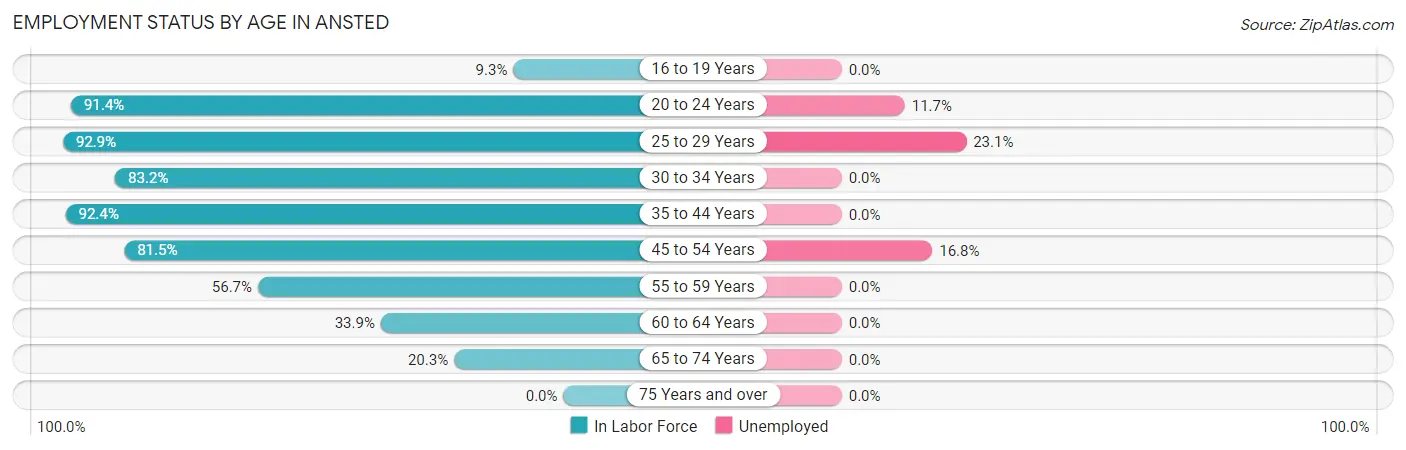
Employment Status by Age in Ansted
According to the labor force statistics for Ansted, out of the total population over 16 years of age (1,080), 60.3% or 651 individuals are in the labor force, with 8.6% or 56 of them unemployed. The age group with the highest labor force participation rate is 25 to 29 years, with 92.9% or 52 individuals in the labor force. Within the labor force, the 25 to 29 years age range has the highest percentage of unemployed individuals, with 23.1% or 12 of them being unemployed.
| Age Bracket | In Labor Force | Unemployed |
| 16 to 19 Years | 4 (9.3%) | 0 (0.0%) |
| 20 to 24 Years | 180 (91.4%) | 21 (11.7%) |
| 25 to 29 Years | 52 (92.9%) | 12 (23.1%) |
| 30 to 34 Years | 104 (83.2%) | 0 (0.0%) |
| 35 to 44 Years | 61 (92.4%) | 0 (0.0%) |
| 45 to 54 Years | 137 (81.5%) | 23 (16.8%) |
| 55 to 59 Years | 51 (56.7%) | 0 (0.0%) |
| 60 to 64 Years | 21 (33.9%) | 0 (0.0%) |
| 65 to 74 Years | 41 (20.3%) | 0 (0.0%) |
| 75 Years and over | 0 (0.0%) | 0 (0.0%) |
| Total | 651 (60.3%) | 56 (8.6%) |
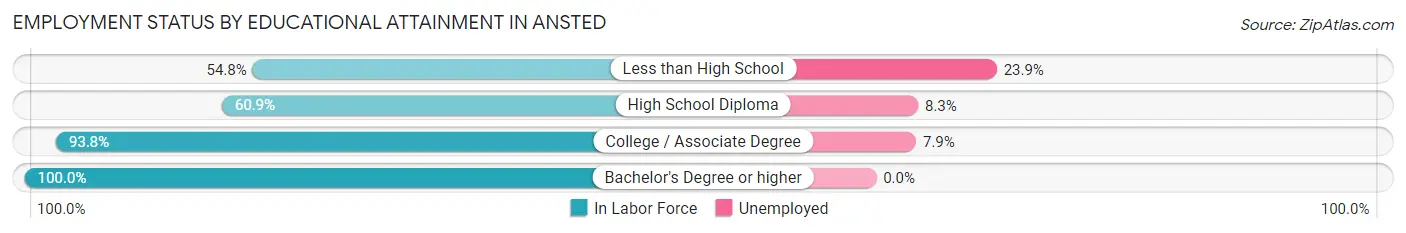
Employment Status by Educational Attainment in Ansted
According to labor force statistics for Ansted, 75.1% of individuals (426) out of the total population between 25 and 64 years of age (567) are in the labor force, with 8.2% or 35 of them being unemployed. The group with the highest labor force participation rate are those with the educational attainment of bachelor's degree or higher, with 100.0% or 84 individuals in the labor force. Within the labor force, individuals with less than high school education have the highest percentage of unemployment, with 23.9% or 11 of them being unemployed.
| Educational Attainment | In Labor Force | Unemployed |
| Less than High School | 46 (54.8%) | 20 (23.9%) |
| High School Diploma | 145 (60.9%) | 20 (8.3%) |
| College / Associate Degree | 151 (93.8%) | 13 (7.9%) |
| Bachelor's Degree or higher | 84 (100.0%) | 0 (0.0%) |
| Total | 426 (75.1%) | 46 (8.2%) |
Employment Occupations by Sex in Ansted
Management, Business, Science and Arts Occupations
The most common Management, Business, Science and Arts occupations in Ansted are Community & Social Service (69 | 11.6%), Education Instruction & Library (52 | 8.7%), Health Diagnosing & Treating (40 | 6.7%), Health Technologists (40 | 6.7%), and Business & Financial (23 | 3.9%).
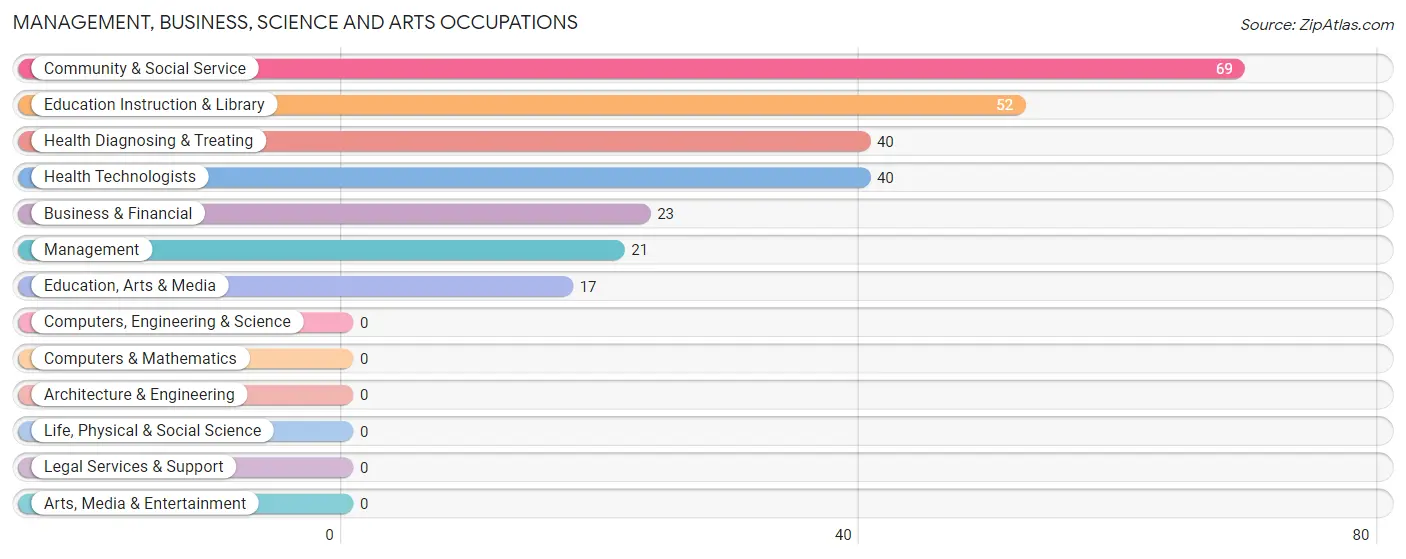
Management, Business, Science and Arts Occupations by Sex
Within the Management, Business, Science and Arts occupations in Ansted, the most male-oriented occupations are Management (100.0%), Education, Arts & Media (100.0%), and Community & Social Service (84.1%), while the most female-oriented occupations are Business & Financial (100.0%), Health Diagnosing & Treating (100.0%), and Health Technologists (100.0%).
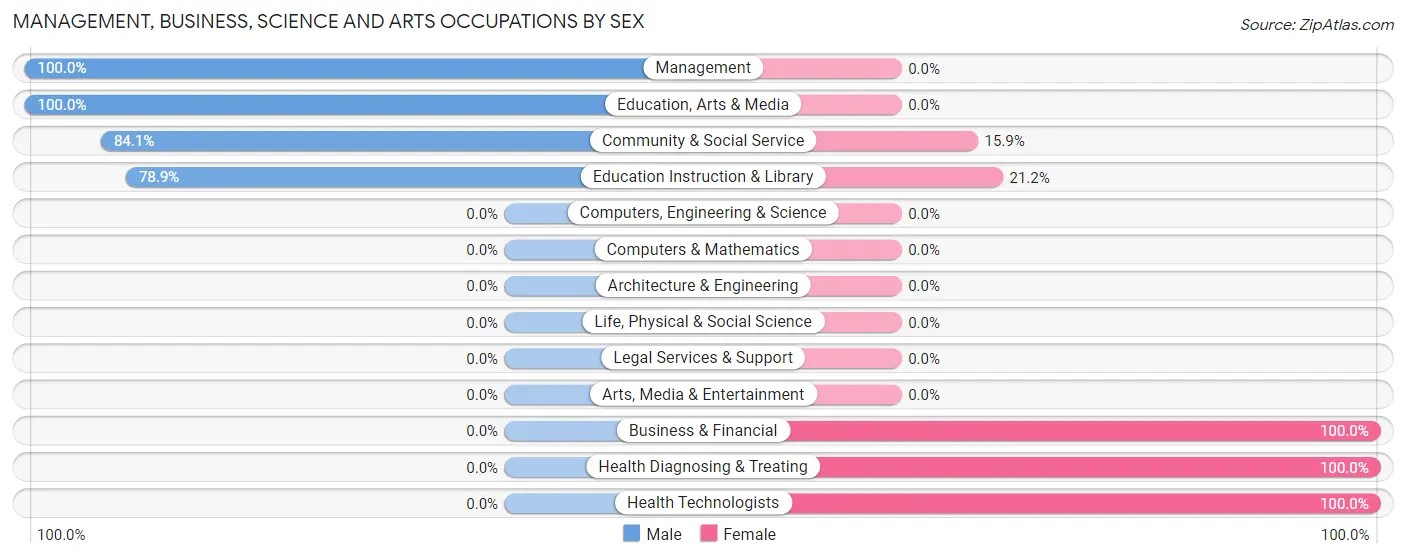
| Occupation | Male | Female |
| Management | 21 (100.0%) | 0 (0.0%) |
| Business & Financial | 0 (0.0%) | 23 (100.0%) |
| Computers, Engineering & Science | 0 (0.0%) | 0 (0.0%) |
| Computers & Mathematics | 0 (0.0%) | 0 (0.0%) |
| Architecture & Engineering | 0 (0.0%) | 0 (0.0%) |
| Life, Physical & Social Science | 0 (0.0%) | 0 (0.0%) |
| Community & Social Service | 58 (84.1%) | 11 (15.9%) |
| Education, Arts & Media | 17 (100.0%) | 0 (0.0%) |
| Legal Services & Support | 0 (0.0%) | 0 (0.0%) |
| Education Instruction & Library | 41 (78.8%) | 11 (21.1%) |
| Arts, Media & Entertainment | 0 (0.0%) | 0 (0.0%) |
| Health Diagnosing & Treating | 0 (0.0%) | 40 (100.0%) |
| Health Technologists | 0 (0.0%) | 40 (100.0%) |
| Total (Category) | 79 (51.6%) | 74 (48.4%) |
| Total (Overall) | 357 (60.0%) | 238 (40.0%) |
Services Occupations
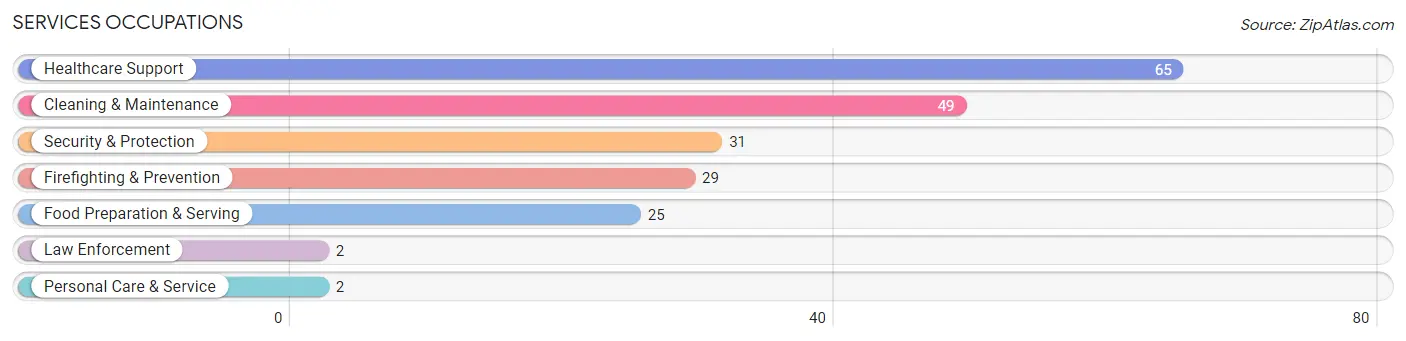
The most common Services occupations in Ansted are Healthcare Support (65 | 10.9%), Cleaning & Maintenance (49 | 8.2%), Security & Protection (31 | 5.2%), Firefighting & Prevention (29 | 4.9%), and Food Preparation & Serving (25 | 4.2%).
Services Occupations by Sex
Within the Services occupations in Ansted, the most male-oriented occupations are Security & Protection (100.0%), Firefighting & Prevention (100.0%), and Law Enforcement (100.0%), while the most female-oriented occupations are Personal Care & Service (100.0%), Healthcare Support (75.4%), and Food Preparation & Serving (72.0%).
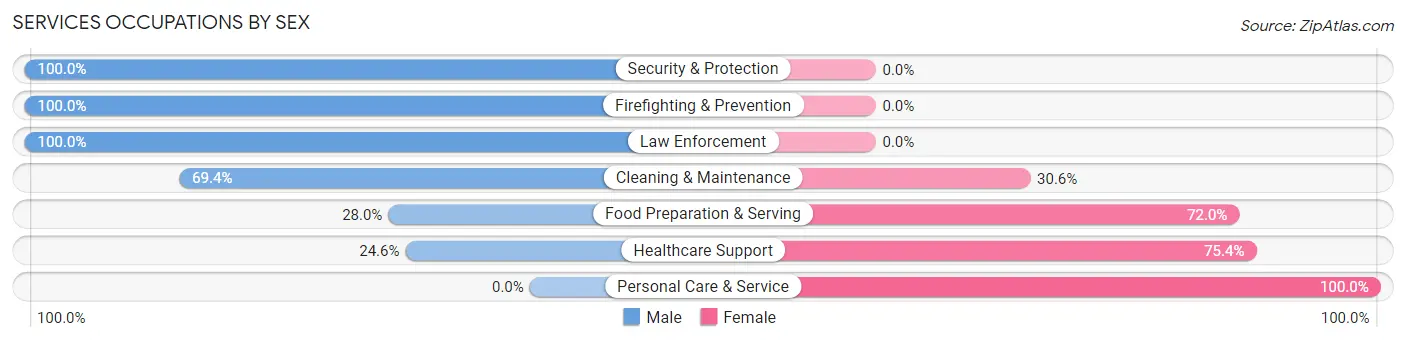
| Occupation | Male | Female |
| Healthcare Support | 16 (24.6%) | 49 (75.4%) |
| Security & Protection | 31 (100.0%) | 0 (0.0%) |
| Firefighting & Prevention | 29 (100.0%) | 0 (0.0%) |
| Law Enforcement | 2 (100.0%) | 0 (0.0%) |
| Food Preparation & Serving | 7 (28.0%) | 18 (72.0%) |
| Cleaning & Maintenance | 34 (69.4%) | 15 (30.6%) |
| Personal Care & Service | 0 (0.0%) | 2 (100.0%) |
| Total (Category) | 88 (51.2%) | 84 (48.8%) |
| Total (Overall) | 357 (60.0%) | 238 (40.0%) |
Sales and Office Occupations
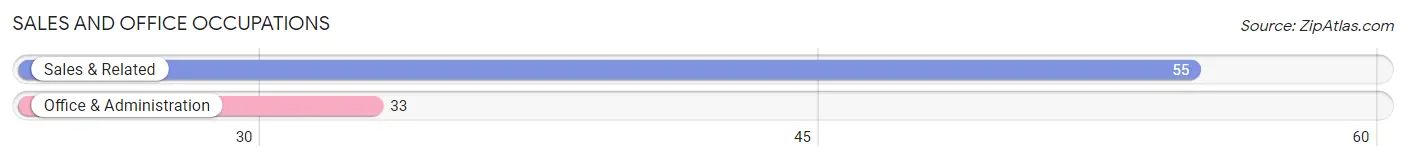
The most common Sales and Office occupations in Ansted are Sales & Related (55 | 9.2%), and Office & Administration (33 | 5.6%).
Sales and Office Occupations by Sex
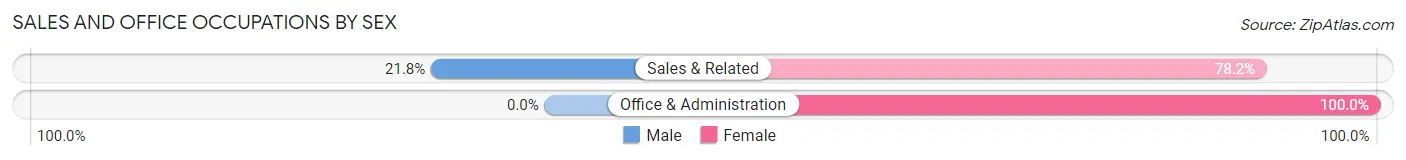
| Occupation | Male | Female |
| Sales & Related | 12 (21.8%) | 43 (78.2%) |
| Office & Administration | 0 (0.0%) | 33 (100.0%) |
| Total (Category) | 12 (13.6%) | 76 (86.4%) |
| Total (Overall) | 357 (60.0%) | 238 (40.0%) |
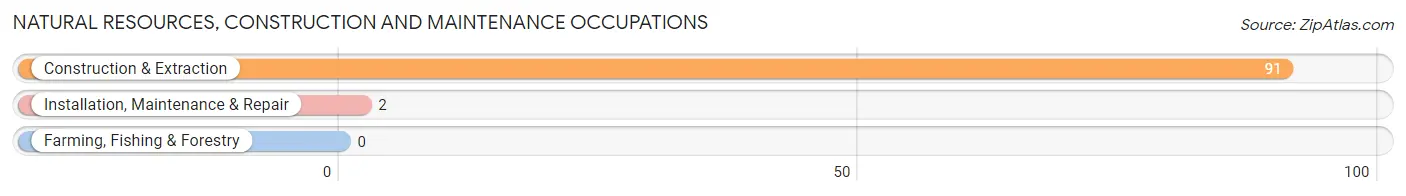
Natural Resources, Construction and Maintenance Occupations
The most common Natural Resources, Construction and Maintenance occupations in Ansted are Construction & Extraction (91 | 15.3%), and Installation, Maintenance & Repair (2 | 0.3%).
Natural Resources, Construction and Maintenance Occupations by Sex
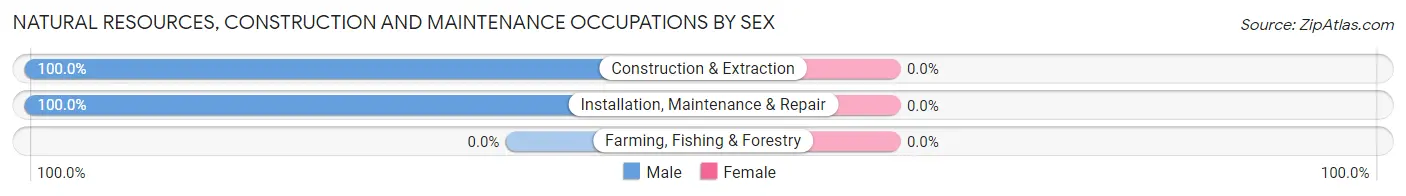
| Occupation | Male | Female |
| Farming, Fishing & Forestry | 0 (0.0%) | 0 (0.0%) |
| Construction & Extraction | 91 (100.0%) | 0 (0.0%) |
| Installation, Maintenance & Repair | 2 (100.0%) | 0 (0.0%) |
| Total (Category) | 93 (100.0%) | 0 (0.0%) |
| Total (Overall) | 357 (60.0%) | 238 (40.0%) |
Production, Transportation and Moving Occupations
The most common Production, Transportation and Moving occupations in Ansted are Production (40 | 6.7%), Transportation (36 | 6.0%), and Material Moving (13 | 2.2%).
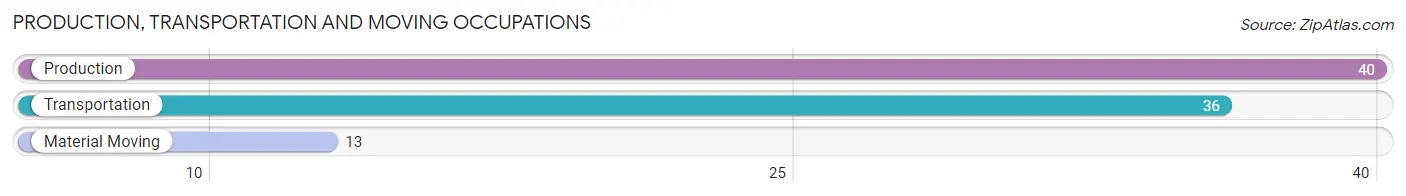
Production, Transportation and Moving Occupations by Sex
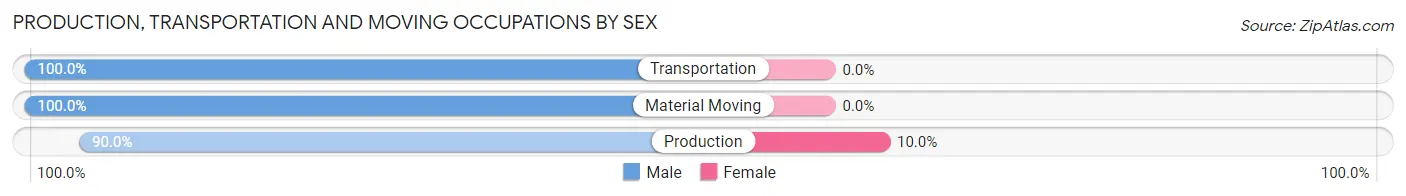
| Occupation | Male | Female |
| Production | 36 (90.0%) | 4 (10.0%) |
| Transportation | 36 (100.0%) | 0 (0.0%) |
| Material Moving | 13 (100.0%) | 0 (0.0%) |
| Total (Category) | 85 (95.5%) | 4 (4.5%) |
| Total (Overall) | 357 (60.0%) | 238 (40.0%) |
Employment Industries by Sex in Ansted
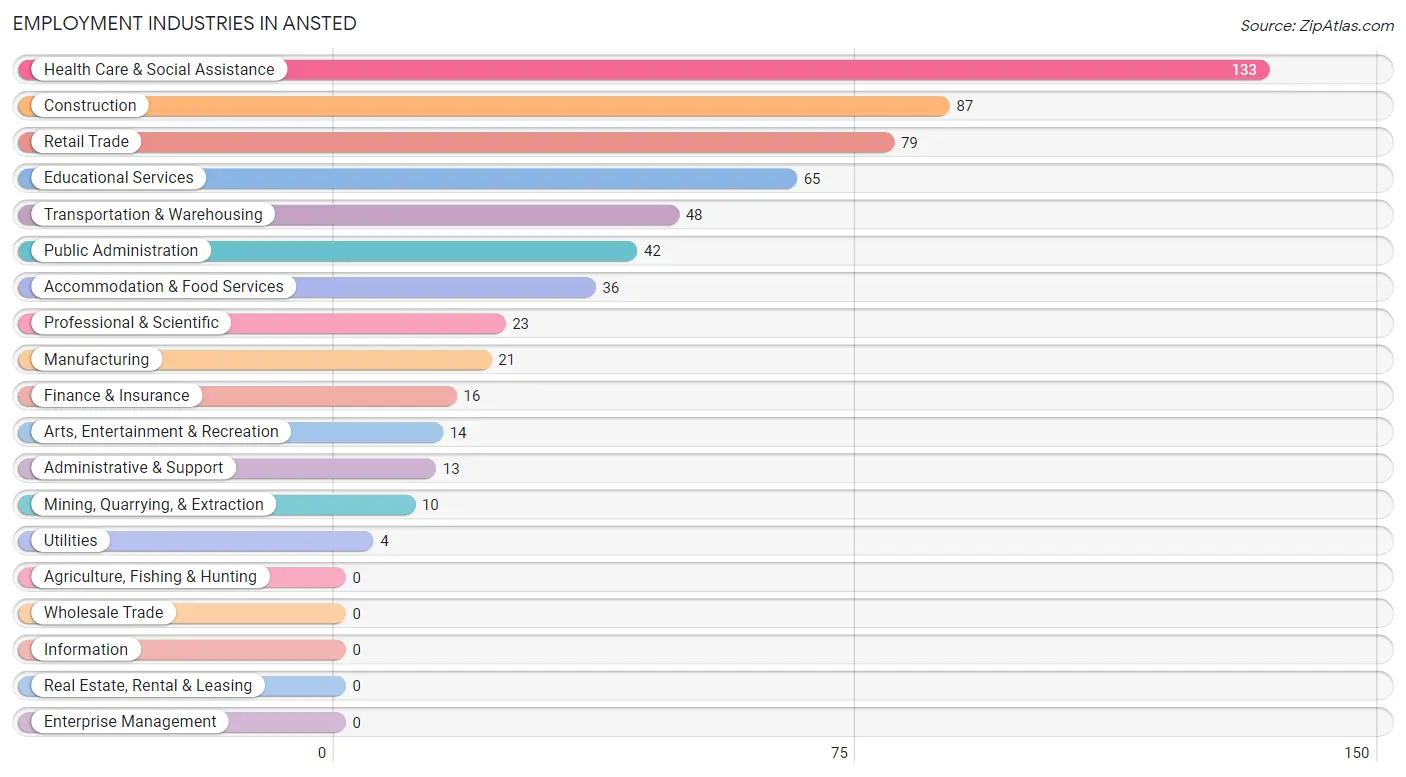
Employment Industries in Ansted
The major employment industries in Ansted include Health Care & Social Assistance (133 | 22.4%), Construction (87 | 14.6%), Retail Trade (79 | 13.3%), Educational Services (65 | 10.9%), and Transportation & Warehousing (48 | 8.1%).
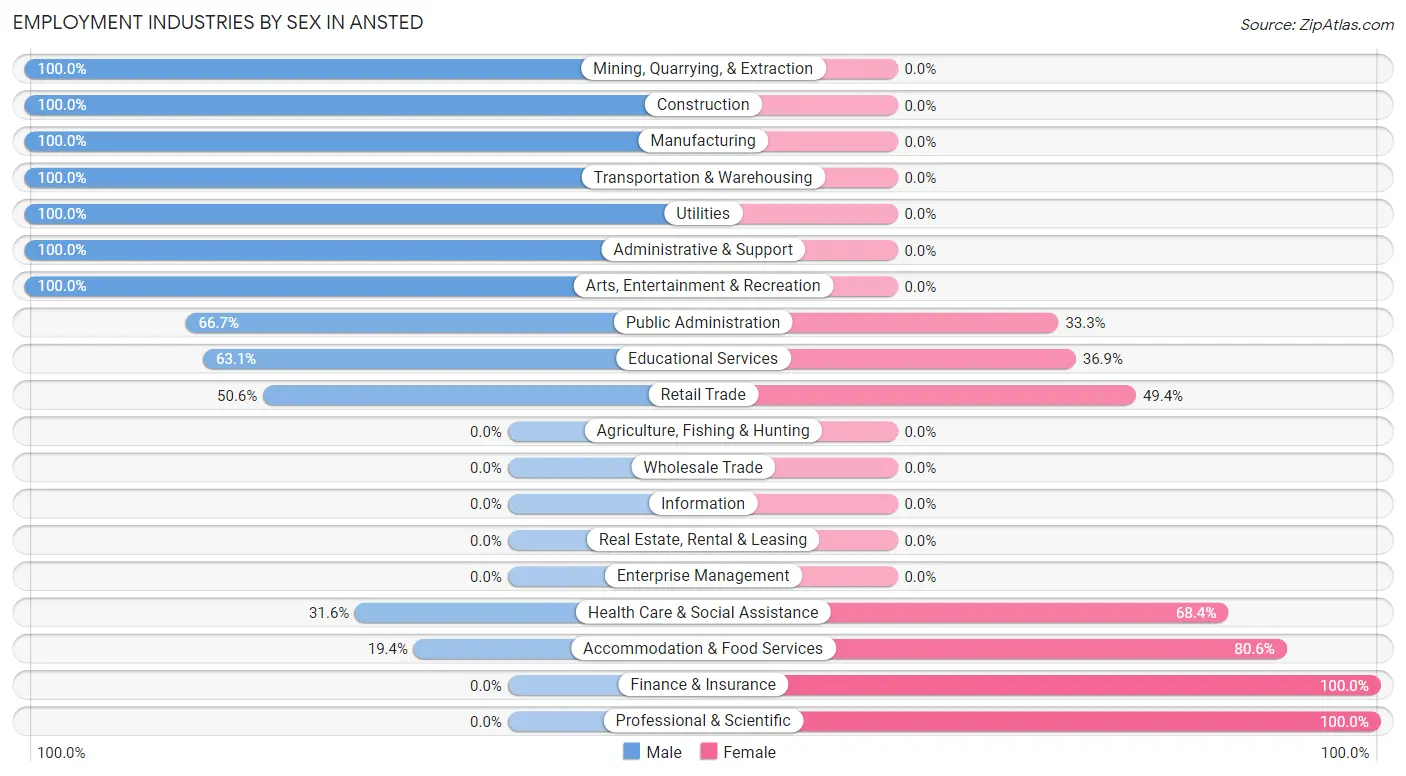
Employment Industries by Sex in Ansted
The Ansted industries that see more men than women are Mining, Quarrying, & Extraction (100.0%), Construction (100.0%), and Manufacturing (100.0%), whereas the industries that tend to have a higher number of women are Finance & Insurance (100.0%), Professional & Scientific (100.0%), and Accommodation & Food Services (80.6%).
| Industry | Male | Female |
| Agriculture, Fishing & Hunting | 0 (0.0%) | 0 (0.0%) |
| Mining, Quarrying, & Extraction | 10 (100.0%) | 0 (0.0%) |
| Construction | 87 (100.0%) | 0 (0.0%) |
| Manufacturing | 21 (100.0%) | 0 (0.0%) |
| Wholesale Trade | 0 (0.0%) | 0 (0.0%) |
| Retail Trade | 40 (50.6%) | 39 (49.4%) |
| Transportation & Warehousing | 48 (100.0%) | 0 (0.0%) |
| Utilities | 4 (100.0%) | 0 (0.0%) |
| Information | 0 (0.0%) | 0 (0.0%) |
| Finance & Insurance | 0 (0.0%) | 16 (100.0%) |
| Real Estate, Rental & Leasing | 0 (0.0%) | 0 (0.0%) |
| Professional & Scientific | 0 (0.0%) | 23 (100.0%) |
| Enterprise Management | 0 (0.0%) | 0 (0.0%) |
| Administrative & Support | 13 (100.0%) | 0 (0.0%) |
| Educational Services | 41 (63.1%) | 24 (36.9%) |
| Health Care & Social Assistance | 42 (31.6%) | 91 (68.4%) |
| Arts, Entertainment & Recreation | 14 (100.0%) | 0 (0.0%) |
| Accommodation & Food Services | 7 (19.4%) | 29 (80.6%) |
| Public Administration | 28 (66.7%) | 14 (33.3%) |
| Total | 357 (60.0%) | 238 (40.0%) |
Education in Ansted
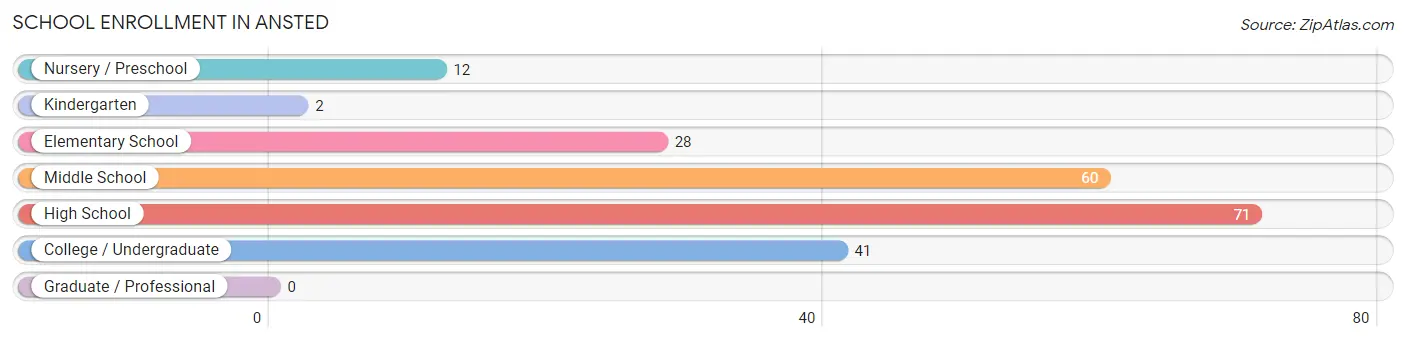
School Enrollment in Ansted
The most common levels of schooling among the 214 students in Ansted are high school (71 | 33.2%), middle school (60 | 28.0%), and college / undergraduate (41 | 19.2%).
| School Level | # Students | % Students |
| Nursery / Preschool | 12 | 5.6% |
| Kindergarten | 2 | 0.9% |
| Elementary School | 28 | 13.1% |
| Middle School | 60 | 28.0% |
| High School | 71 | 33.2% |
| College / Undergraduate | 41 | 19.2% |
| Graduate / Professional | 0 | 0.0% |
| Total | 214 | 100.0% |
School Enrollment by Age by Funding Source in Ansted
Out of a total of 214 students who are enrolled in schools in Ansted, 11 (5.1%) attend a private institution, while the remaining 203 (94.9%) are enrolled in public schools. The age group of 20 to 24 year olds has the highest likelihood of being enrolled in private schools, with 11 (29.7% in the age bracket) enrolled. Conversely, the age group of 3 to 4 year olds has the lowest likelihood of being enrolled in a private school, with 12 (100.0% in the age bracket) attending a public institution.
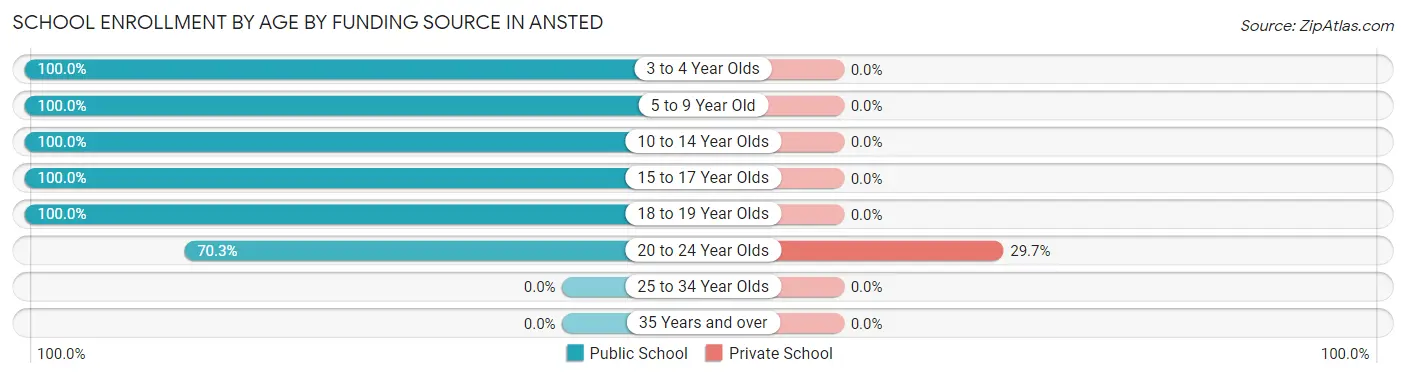
| Age Bracket | Public School | Private School |
| 3 to 4 Year Olds | 12 (100.0%) | 0 (0.0%) |
| 5 to 9 Year Old | 30 (100.0%) | 0 (0.0%) |
| 10 to 14 Year Olds | 82 (100.0%) | 0 (0.0%) |
| 15 to 17 Year Olds | 47 (100.0%) | 0 (0.0%) |
| 18 to 19 Year Olds | 6 (100.0%) | 0 (0.0%) |
| 20 to 24 Year Olds | 26 (70.3%) | 11 (29.7%) |
| 25 to 34 Year Olds | 0 (0.0%) | 0 (0.0%) |
| 35 Years and over | 0 (0.0%) | 0 (0.0%) |
| Total | 203 (94.9%) | 11 (5.1%) |
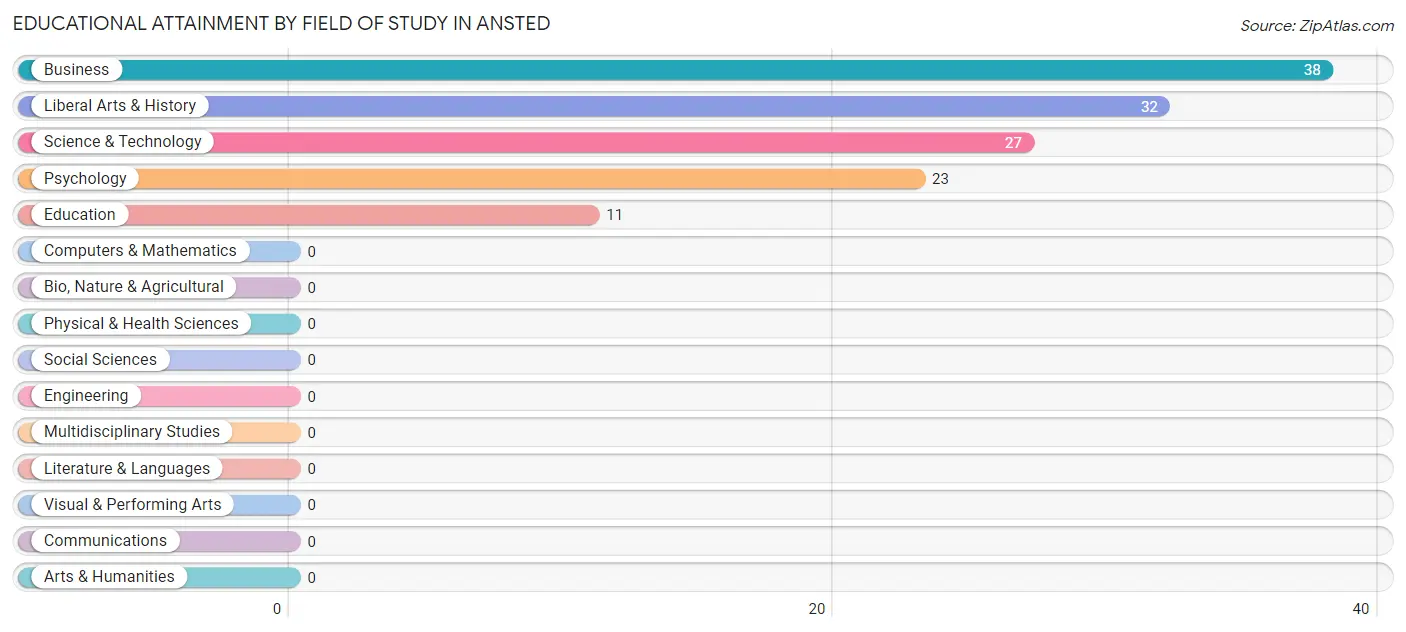
Educational Attainment by Field of Study in Ansted
Business (38 | 29.0%), liberal arts & history (32 | 24.4%), science & technology (27 | 20.6%), psychology (23 | 17.6%), and education (11 | 8.4%) are the most common fields of study among 131 individuals in Ansted who have obtained a bachelor's degree or higher.
| Field of Study | # Graduates | % Graduates |
| Computers & Mathematics | 0 | 0.0% |
| Bio, Nature & Agricultural | 0 | 0.0% |
| Physical & Health Sciences | 0 | 0.0% |
| Psychology | 23 | 17.6% |
| Social Sciences | 0 | 0.0% |
| Engineering | 0 | 0.0% |
| Multidisciplinary Studies | 0 | 0.0% |
| Science & Technology | 27 | 20.6% |
| Business | 38 | 29.0% |
| Education | 11 | 8.4% |
| Literature & Languages | 0 | 0.0% |
| Liberal Arts & History | 32 | 24.4% |
| Visual & Performing Arts | 0 | 0.0% |
| Communications | 0 | 0.0% |
| Arts & Humanities | 0 | 0.0% |
| Total | 131 | 100.0% |
Transportation & Commute in Ansted
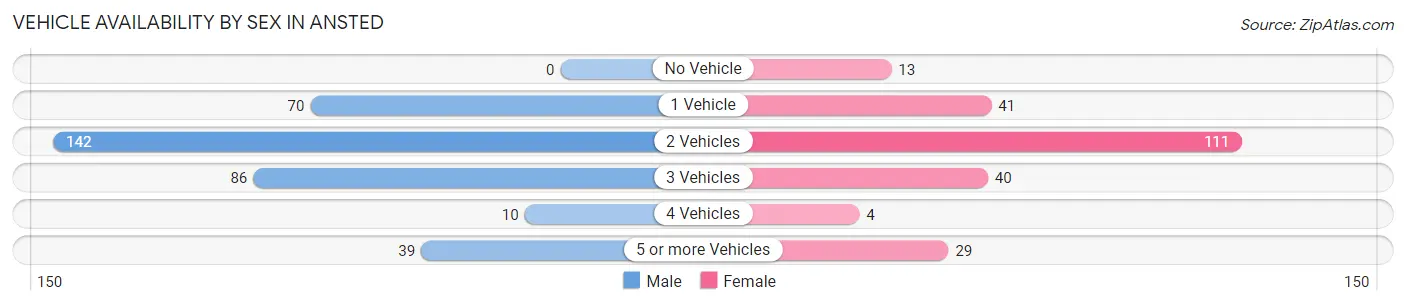
Vehicle Availability by Sex in Ansted
The most prevalent vehicle ownership categories in Ansted are males with 2 vehicles (142, accounting for 40.9%) and females with 2 vehicles (111, making up 59.7%).
| Vehicles Available | Male | Female |
| No Vehicle | 0 (0.0%) | 13 (5.5%) |
| 1 Vehicle | 70 (20.2%) | 41 (17.2%) |
| 2 Vehicles | 142 (40.9%) | 111 (46.6%) |
| 3 Vehicles | 86 (24.8%) | 40 (16.8%) |
| 4 Vehicles | 10 (2.9%) | 4 (1.7%) |
| 5 or more Vehicles | 39 (11.2%) | 29 (12.2%) |
| Total | 347 (100.0%) | 238 (100.0%) |
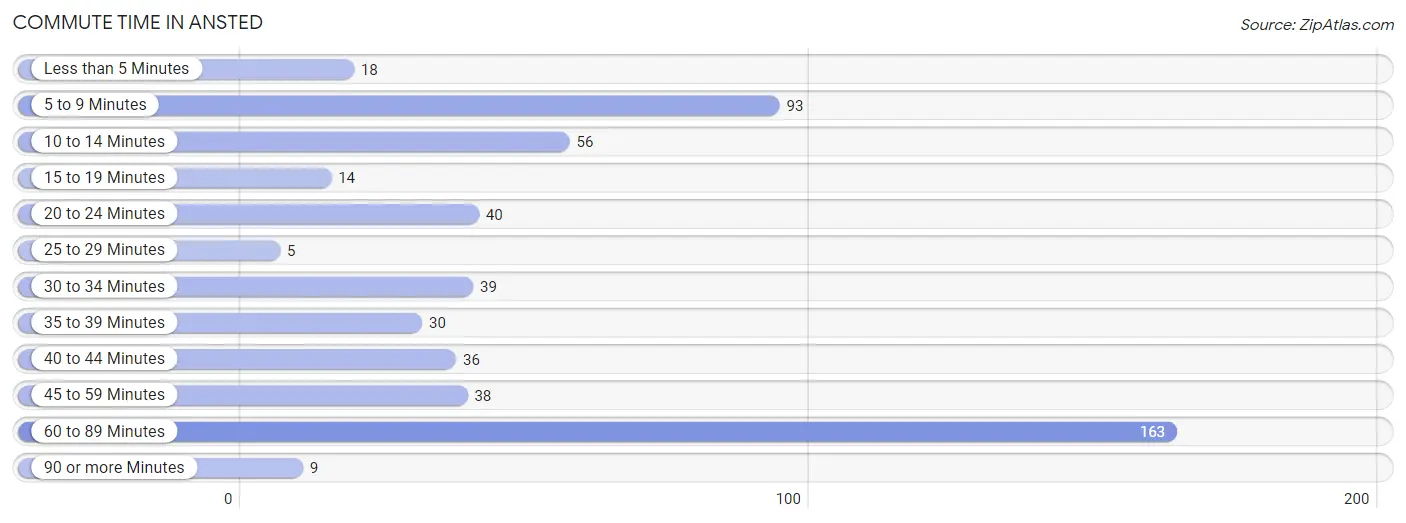
Commute Time in Ansted
The most frequently occuring commute durations in Ansted are 60 to 89 minutes (163 commuters, 30.1%), 5 to 9 minutes (93 commuters, 17.2%), and 10 to 14 minutes (56 commuters, 10.3%).
| Commute Time | # Commuters | % Commuters |
| Less than 5 Minutes | 18 | 3.3% |
| 5 to 9 Minutes | 93 | 17.2% |
| 10 to 14 Minutes | 56 | 10.3% |
| 15 to 19 Minutes | 14 | 2.6% |
| 20 to 24 Minutes | 40 | 7.4% |
| 25 to 29 Minutes | 5 | 0.9% |
| 30 to 34 Minutes | 39 | 7.2% |
| 35 to 39 Minutes | 30 | 5.6% |
| 40 to 44 Minutes | 36 | 6.7% |
| 45 to 59 Minutes | 38 | 7.0% |
| 60 to 89 Minutes | 163 | 30.1% |
| 90 or more Minutes | 9 | 1.7% |
Commute Time by Sex in Ansted
The most common commute times in Ansted are 60 to 89 minutes (112 commuters, 35.6%) for males and 5 to 9 minutes (63 commuters, 27.9%) for females.
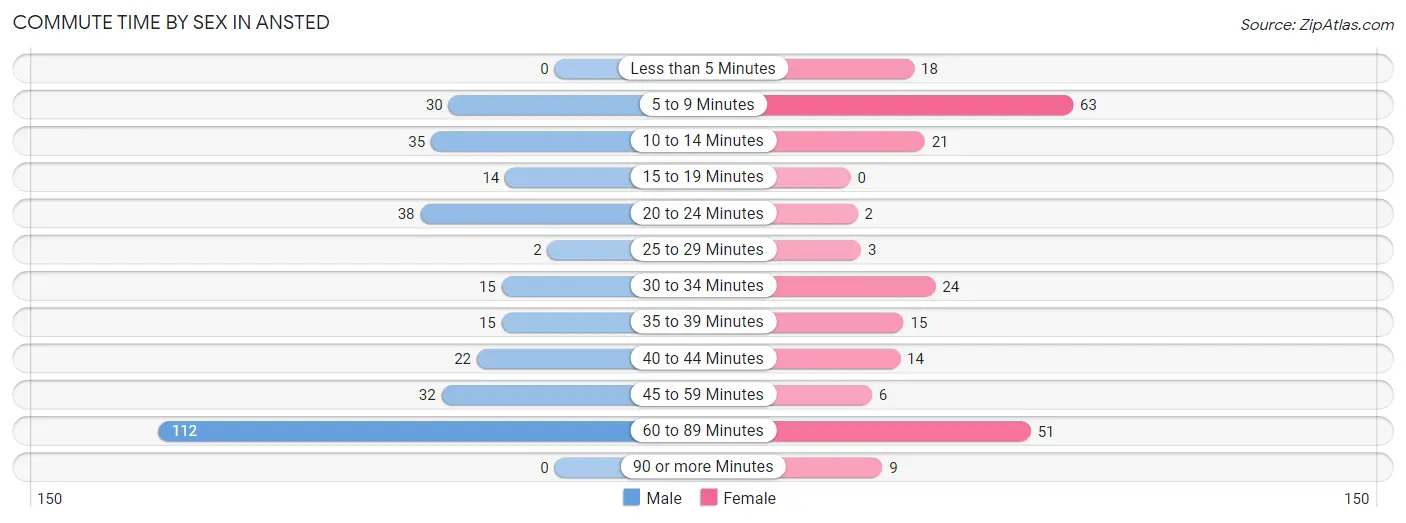
| Commute Time | Male | Female |
| Less than 5 Minutes | 0 (0.0%) | 18 (8.0%) |
| 5 to 9 Minutes | 30 (9.5%) | 63 (27.9%) |
| 10 to 14 Minutes | 35 (11.1%) | 21 (9.3%) |
| 15 to 19 Minutes | 14 (4.4%) | 0 (0.0%) |
| 20 to 24 Minutes | 38 (12.1%) | 2 (0.9%) |
| 25 to 29 Minutes | 2 (0.6%) | 3 (1.3%) |
| 30 to 34 Minutes | 15 (4.8%) | 24 (10.6%) |
| 35 to 39 Minutes | 15 (4.8%) | 15 (6.6%) |
| 40 to 44 Minutes | 22 (7.0%) | 14 (6.2%) |
| 45 to 59 Minutes | 32 (10.2%) | 6 (2.6%) |
| 60 to 89 Minutes | 112 (35.6%) | 51 (22.6%) |
| 90 or more Minutes | 0 (0.0%) | 9 (4.0%) |
Time of Departure to Work by Sex in Ansted
The most frequent times of departure to work in Ansted are 8:00 AM to 8:29 AM (73, 23.2%) for males and 12:00 PM to 3:59 PM (40, 17.7%) for females.
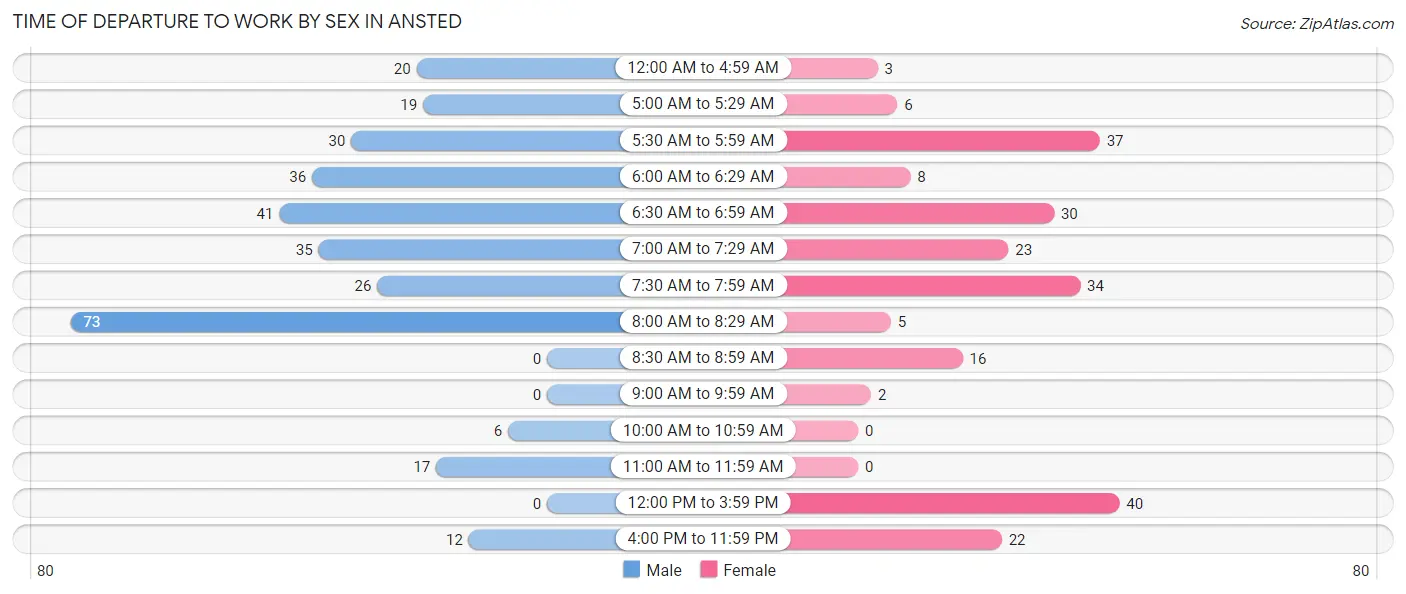
| Time of Departure | Male | Female |
| 12:00 AM to 4:59 AM | 20 (6.4%) | 3 (1.3%) |
| 5:00 AM to 5:29 AM | 19 (6.0%) | 6 (2.6%) |
| 5:30 AM to 5:59 AM | 30 (9.5%) | 37 (16.4%) |
| 6:00 AM to 6:29 AM | 36 (11.4%) | 8 (3.5%) |
| 6:30 AM to 6:59 AM | 41 (13.0%) | 30 (13.3%) |
| 7:00 AM to 7:29 AM | 35 (11.1%) | 23 (10.2%) |
| 7:30 AM to 7:59 AM | 26 (8.3%) | 34 (15.0%) |
| 8:00 AM to 8:29 AM | 73 (23.2%) | 5 (2.2%) |
| 8:30 AM to 8:59 AM | 0 (0.0%) | 16 (7.1%) |
| 9:00 AM to 9:59 AM | 0 (0.0%) | 2 (0.9%) |
| 10:00 AM to 10:59 AM | 6 (1.9%) | 0 (0.0%) |
| 11:00 AM to 11:59 AM | 17 (5.4%) | 0 (0.0%) |
| 12:00 PM to 3:59 PM | 0 (0.0%) | 40 (17.7%) |
| 4:00 PM to 11:59 PM | 12 (3.8%) | 22 (9.7%) |
| Total | 315 (100.0%) | 226 (100.0%) |
Housing Occupancy in Ansted
Occupancy by Ownership in Ansted
Of the total 467 dwellings in Ansted, owner-occupied units account for 336 (72.0%), while renter-occupied units make up 131 (28.1%).
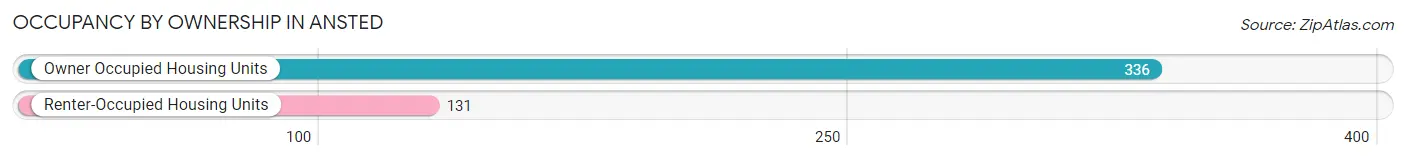
| Occupancy | # Housing Units | % Housing Units |
| Owner Occupied Housing Units | 336 | 72.0% |
| Renter-Occupied Housing Units | 131 | 28.1% |
| Total Occupied Housing Units | 467 | 100.0% |
Occupancy by Household Size in Ansted
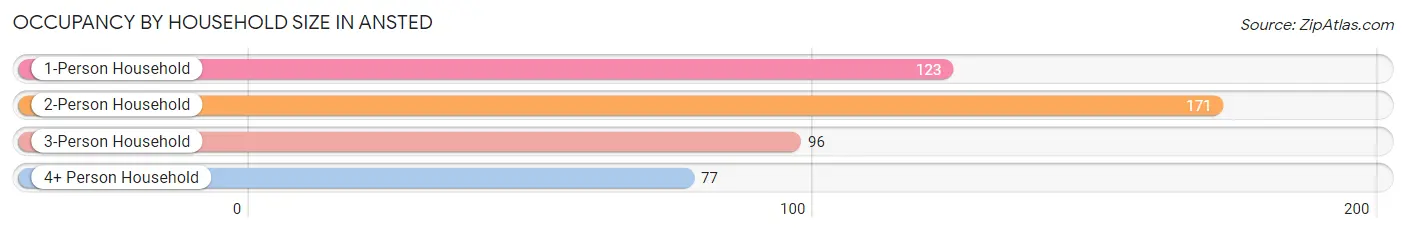
| Household Size | # Housing Units | % Housing Units |
| 1-Person Household | 123 | 26.3% |
| 2-Person Household | 171 | 36.6% |
| 3-Person Household | 96 | 20.6% |
| 4+ Person Household | 77 | 16.5% |
| Total Housing Units | 467 | 100.0% |
Occupancy by Ownership by Household Size in Ansted
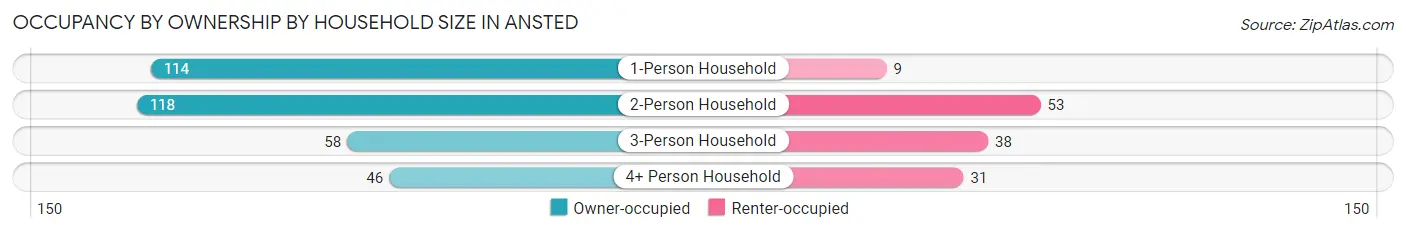
| Household Size | Owner-occupied | Renter-occupied |
| 1-Person Household | 114 (92.7%) | 9 (7.3%) |
| 2-Person Household | 118 (69.0%) | 53 (31.0%) |
| 3-Person Household | 58 (60.4%) | 38 (39.6%) |
| 4+ Person Household | 46 (59.7%) | 31 (40.3%) |
| Total Housing Units | 336 (72.0%) | 131 (28.1%) |
Occupancy by Educational Attainment in Ansted
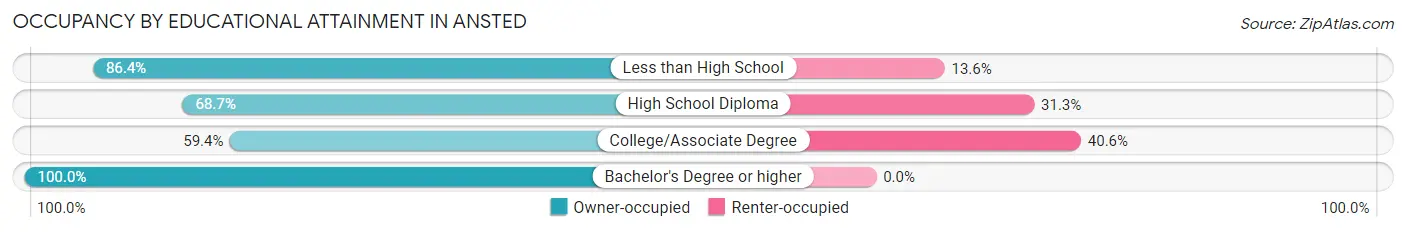
| Household Size | Owner-occupied | Renter-occupied |
| Less than High School | 51 (86.4%) | 8 (13.6%) |
| High School Diploma | 147 (68.7%) | 67 (31.3%) |
| College/Associate Degree | 82 (59.4%) | 56 (40.6%) |
| Bachelor's Degree or higher | 56 (100.0%) | 0 (0.0%) |
Occupancy by Age of Householder in Ansted
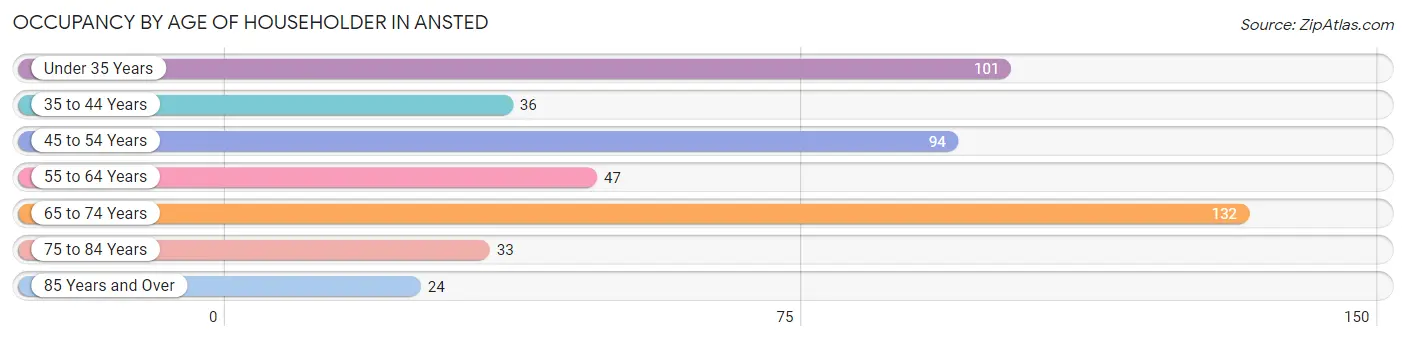
| Age Bracket | # Households | % Households |
| Under 35 Years | 101 | 21.6% |
| 35 to 44 Years | 36 | 7.7% |
| 45 to 54 Years | 94 | 20.1% |
| 55 to 64 Years | 47 | 10.1% |
| 65 to 74 Years | 132 | 28.3% |
| 75 to 84 Years | 33 | 7.1% |
| 85 Years and Over | 24 | 5.1% |
| Total | 467 | 100.0% |
Housing Finances in Ansted
Median Income by Occupancy in Ansted
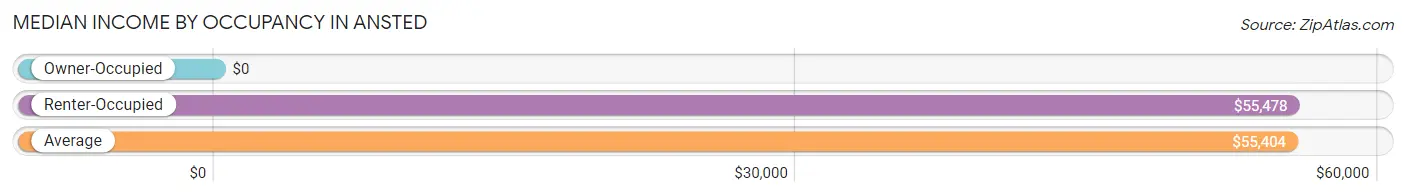
| Occupancy Type | # Households | Median Income |
| Owner-Occupied | 336 (72.0%) | $0 |
| Renter-Occupied | 131 (28.1%) | $55,478 |
| Average | 467 (100.0%) | $55,404 |
Occupancy by Householder Income Bracket in Ansted
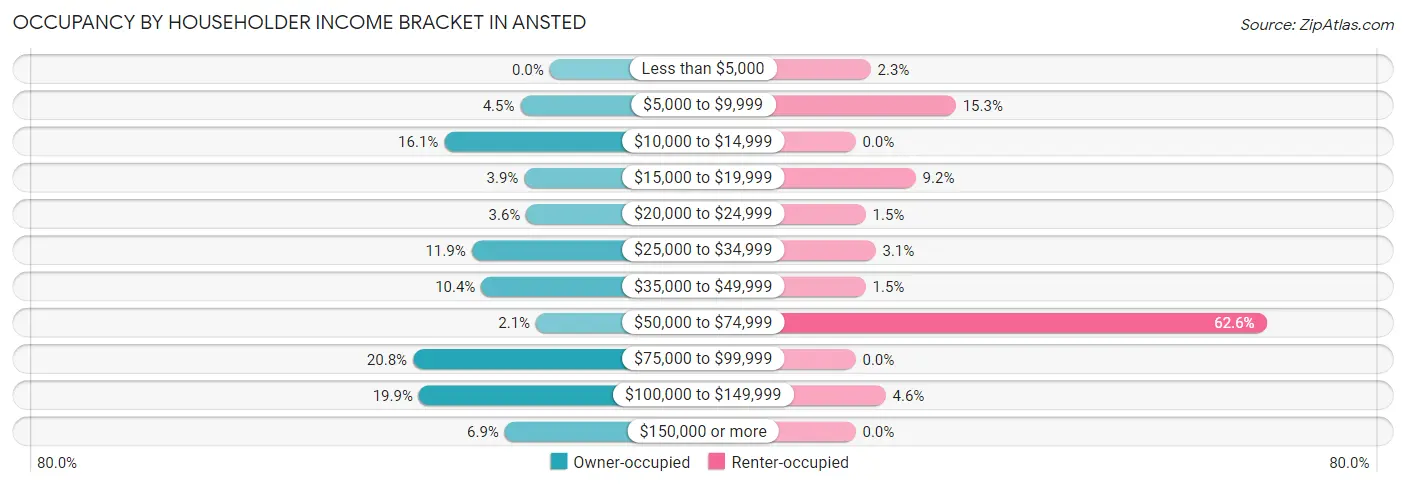
| Income Bracket | Owner-occupied | Renter-occupied |
| Less than $5,000 | 0 (0.0%) | 3 (2.3%) |
| $5,000 to $9,999 | 15 (4.5%) | 20 (15.3%) |
| $10,000 to $14,999 | 54 (16.1%) | 0 (0.0%) |
| $15,000 to $19,999 | 13 (3.9%) | 12 (9.2%) |
| $20,000 to $24,999 | 12 (3.6%) | 2 (1.5%) |
| $25,000 to $34,999 | 40 (11.9%) | 4 (3.0%) |
| $35,000 to $49,999 | 35 (10.4%) | 2 (1.5%) |
| $50,000 to $74,999 | 7 (2.1%) | 82 (62.6%) |
| $75,000 to $99,999 | 70 (20.8%) | 0 (0.0%) |
| $100,000 to $149,999 | 67 (19.9%) | 6 (4.6%) |
| $150,000 or more | 23 (6.9%) | 0 (0.0%) |
| Total | 336 (100.0%) | 131 (100.0%) |
Monthly Housing Cost Tiers in Ansted
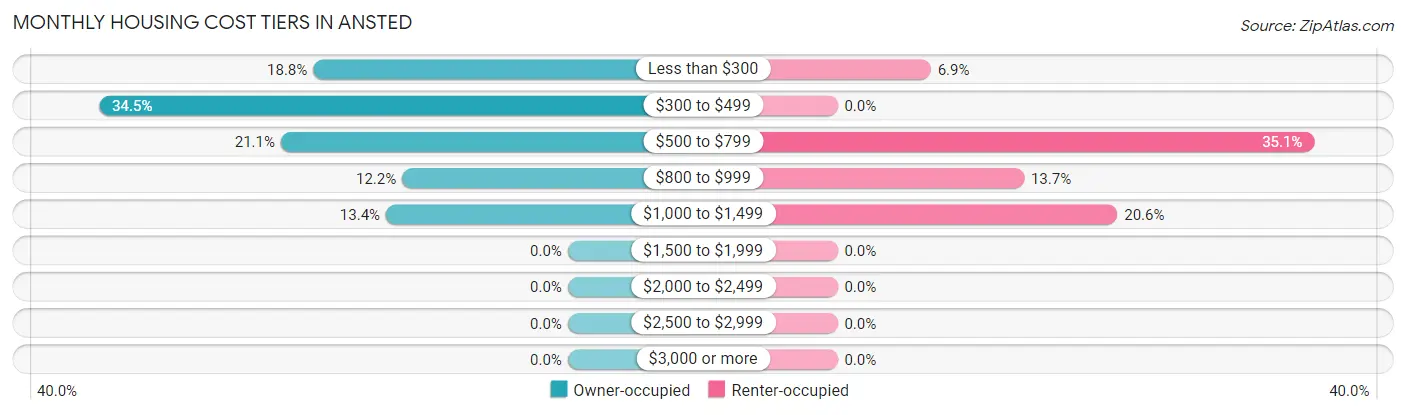
| Monthly Cost | Owner-occupied | Renter-occupied |
| Less than $300 | 63 (18.8%) | 9 (6.9%) |
| $300 to $499 | 116 (34.5%) | 0 (0.0%) |
| $500 to $799 | 71 (21.1%) | 46 (35.1%) |
| $800 to $999 | 41 (12.2%) | 18 (13.7%) |
| $1,000 to $1,499 | 45 (13.4%) | 27 (20.6%) |
| $1,500 to $1,999 | 0 (0.0%) | 0 (0.0%) |
| $2,000 to $2,499 | 0 (0.0%) | 0 (0.0%) |
| $2,500 to $2,999 | 0 (0.0%) | 0 (0.0%) |
| $3,000 or more | 0 (0.0%) | 0 (0.0%) |
| Total | 336 (100.0%) | 131 (100.0%) |
Physical Housing Characteristics in Ansted
Housing Structures in Ansted
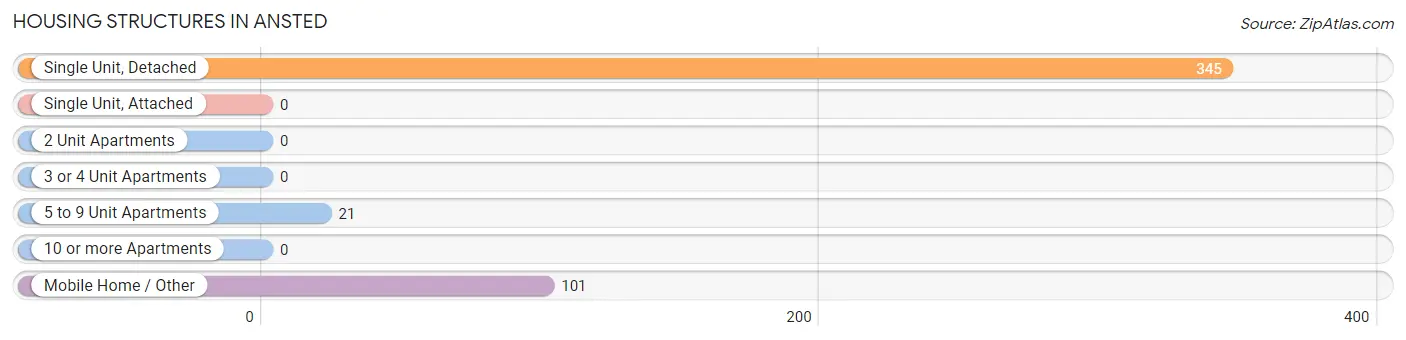
| Structure Type | # Housing Units | % Housing Units |
| Single Unit, Detached | 345 | 73.9% |
| Single Unit, Attached | 0 | 0.0% |
| 2 Unit Apartments | 0 | 0.0% |
| 3 or 4 Unit Apartments | 0 | 0.0% |
| 5 to 9 Unit Apartments | 21 | 4.5% |
| 10 or more Apartments | 0 | 0.0% |
| Mobile Home / Other | 101 | 21.6% |
| Total | 467 | 100.0% |
Housing Structures by Occupancy in Ansted
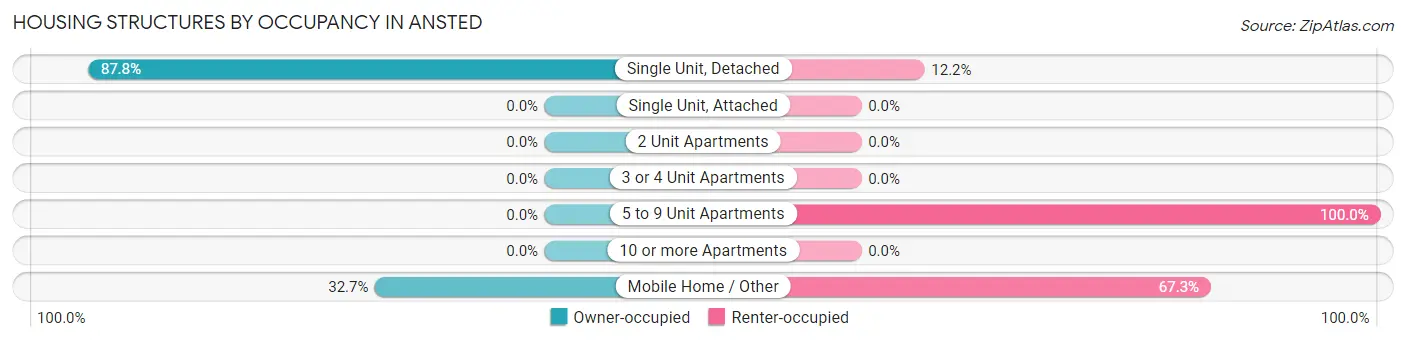
| Structure Type | Owner-occupied | Renter-occupied |
| Single Unit, Detached | 303 (87.8%) | 42 (12.2%) |
| Single Unit, Attached | 0 (0.0%) | 0 (0.0%) |
| 2 Unit Apartments | 0 (0.0%) | 0 (0.0%) |
| 3 or 4 Unit Apartments | 0 (0.0%) | 0 (0.0%) |
| 5 to 9 Unit Apartments | 0 (0.0%) | 21 (100.0%) |
| 10 or more Apartments | 0 (0.0%) | 0 (0.0%) |
| Mobile Home / Other | 33 (32.7%) | 68 (67.3%) |
| Total | 336 (72.0%) | 131 (28.1%) |
Housing Structures by Number of Rooms in Ansted
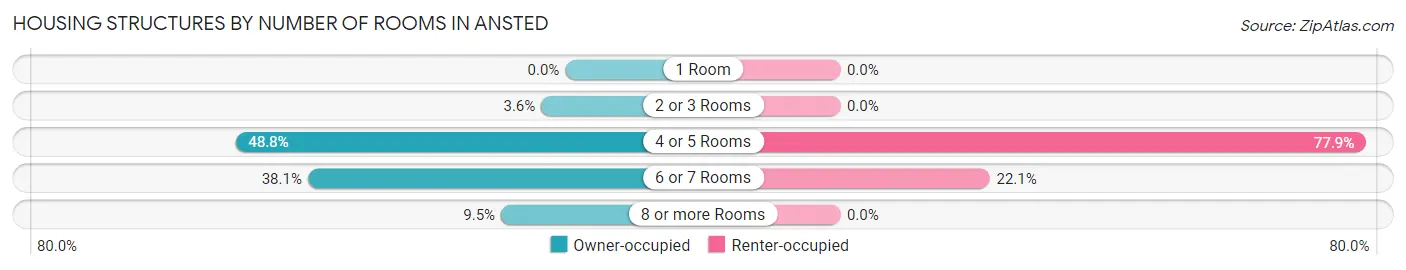
| Number of Rooms | Owner-occupied | Renter-occupied |
| 1 Room | 0 (0.0%) | 0 (0.0%) |
| 2 or 3 Rooms | 12 (3.6%) | 0 (0.0%) |
| 4 or 5 Rooms | 164 (48.8%) | 102 (77.9%) |
| 6 or 7 Rooms | 128 (38.1%) | 29 (22.1%) |
| 8 or more Rooms | 32 (9.5%) | 0 (0.0%) |
| Total | 336 (100.0%) | 131 (100.0%) |
Housing Structure by Heating Type in Ansted
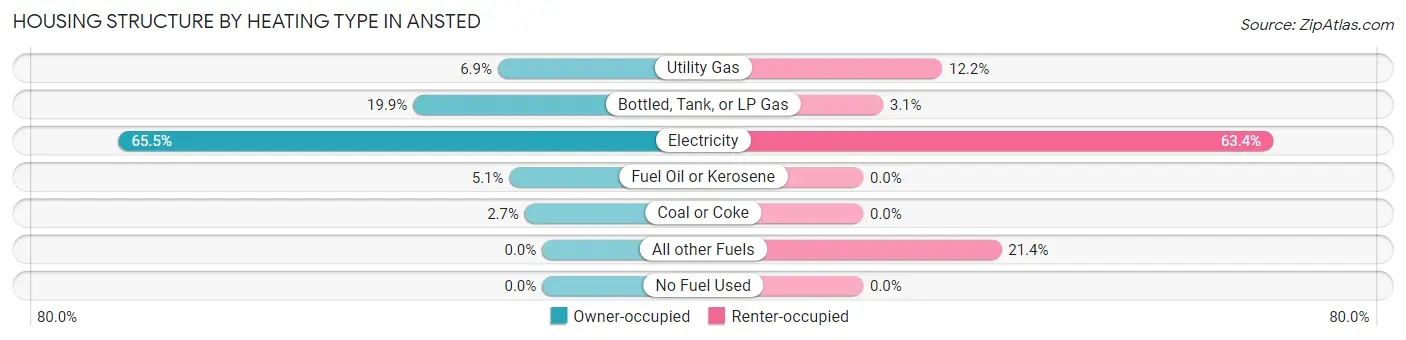
| Heating Type | Owner-occupied | Renter-occupied |
| Utility Gas | 23 (6.9%) | 16 (12.2%) |
| Bottled, Tank, or LP Gas | 67 (19.9%) | 4 (3.0%) |
| Electricity | 220 (65.5%) | 83 (63.4%) |
| Fuel Oil or Kerosene | 17 (5.1%) | 0 (0.0%) |
| Coal or Coke | 9 (2.7%) | 0 (0.0%) |
| All other Fuels | 0 (0.0%) | 28 (21.4%) |
| No Fuel Used | 0 (0.0%) | 0 (0.0%) |
| Total | 336 (100.0%) | 131 (100.0%) |
Household Vehicle Usage in Ansted
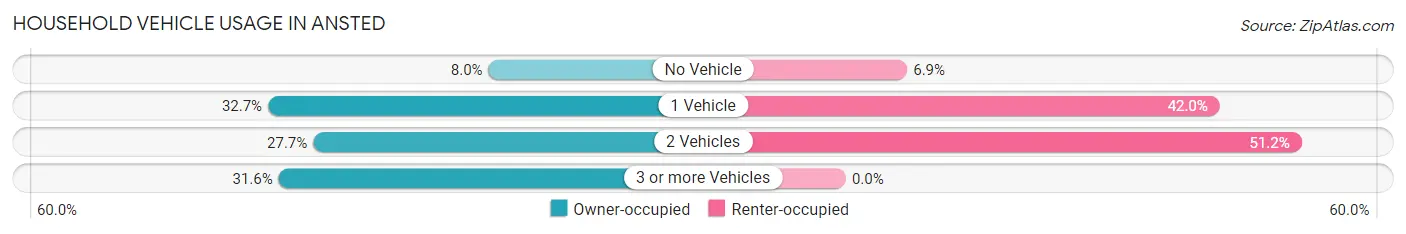
| Vehicles per Household | Owner-occupied | Renter-occupied |
| No Vehicle | 27 (8.0%) | 9 (6.9%) |
| 1 Vehicle | 110 (32.7%) | 55 (42.0%) |
| 2 Vehicles | 93 (27.7%) | 67 (51.1%) |
| 3 or more Vehicles | 106 (31.6%) | 0 (0.0%) |
| Total | 336 (100.0%) | 131 (100.0%) |
Real Estate & Mortgages in Ansted
Real Estate and Mortgage Overview in Ansted
| Characteristic | Without Mortgage | With Mortgage |
| Housing Units | 224 | 112 |
| Median Property Value | $83,800 | $77,500 |
| Median Household Income | $48,833 | $23 |
| Monthly Housing Costs | $376 | $0 |
| Real Estate Taxes | $393 | $0 |
Property Value by Mortgage Status in Ansted
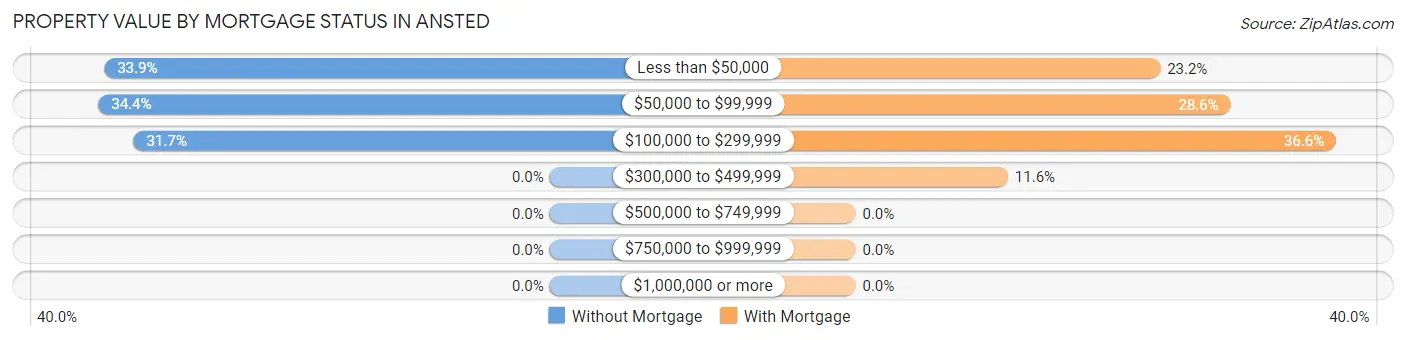
| Property Value | Without Mortgage | With Mortgage |
| Less than $50,000 | 76 (33.9%) | 26 (23.2%) |
| $50,000 to $99,999 | 77 (34.4%) | 32 (28.6%) |
| $100,000 to $299,999 | 71 (31.7%) | 41 (36.6%) |
| $300,000 to $499,999 | 0 (0.0%) | 13 (11.6%) |
| $500,000 to $749,999 | 0 (0.0%) | 0 (0.0%) |
| $750,000 to $999,999 | 0 (0.0%) | 0 (0.0%) |
| $1,000,000 or more | 0 (0.0%) | 0 (0.0%) |
| Total | 224 (100.0%) | 112 (100.0%) |
Household Income by Mortgage Status in Ansted
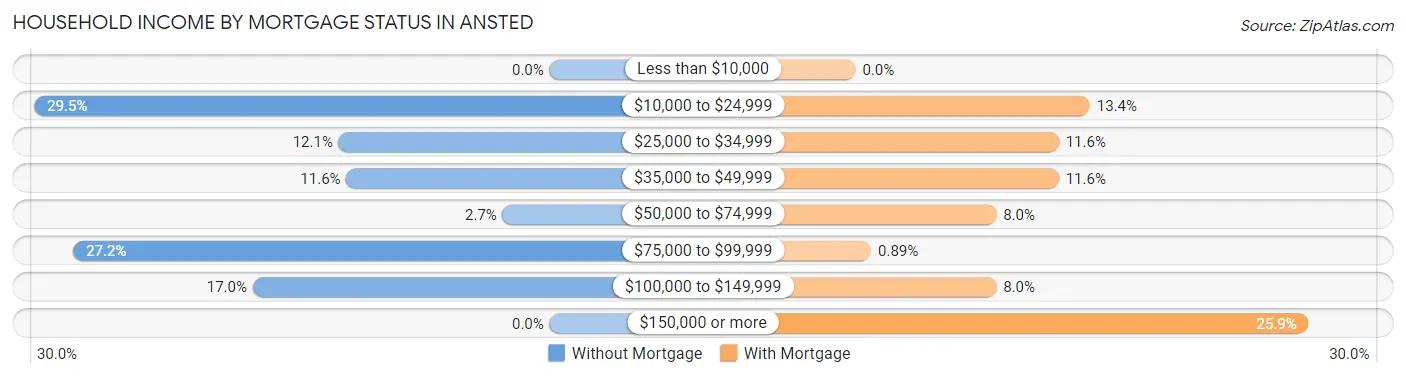
| Household Income | Without Mortgage | With Mortgage |
| Less than $10,000 | 0 (0.0%) | 0 (0.0%) |
| $10,000 to $24,999 | 66 (29.5%) | 15 (13.4%) |
| $25,000 to $34,999 | 27 (12.0%) | 13 (11.6%) |
| $35,000 to $49,999 | 26 (11.6%) | 13 (11.6%) |
| $50,000 to $74,999 | 6 (2.7%) | 9 (8.0%) |
| $75,000 to $99,999 | 61 (27.2%) | 1 (0.9%) |
| $100,000 to $149,999 | 38 (17.0%) | 9 (8.0%) |
| $150,000 or more | 0 (0.0%) | 29 (25.9%) |
| Total | 224 (100.0%) | 112 (100.0%) |
Property Value to Household Income Ratio in Ansted
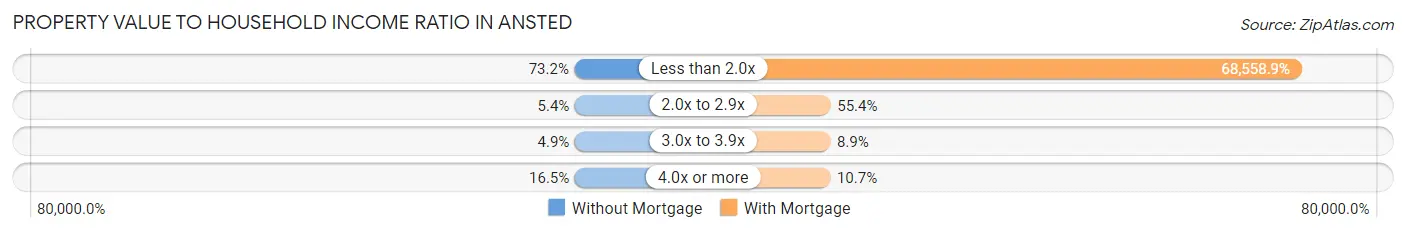
| Value-to-Income Ratio | Without Mortgage | With Mortgage |
| Less than 2.0x | 164 (73.2%) | 76,786 (68,558.9%) |
| 2.0x to 2.9x | 12 (5.4%) | 62 (55.4%) |
| 3.0x to 3.9x | 11 (4.9%) | 10 (8.9%) |
| 4.0x or more | 37 (16.5%) | 12 (10.7%) |
| Total | 224 (100.0%) | 112 (100.0%) |
Real Estate Taxes by Mortgage Status in Ansted
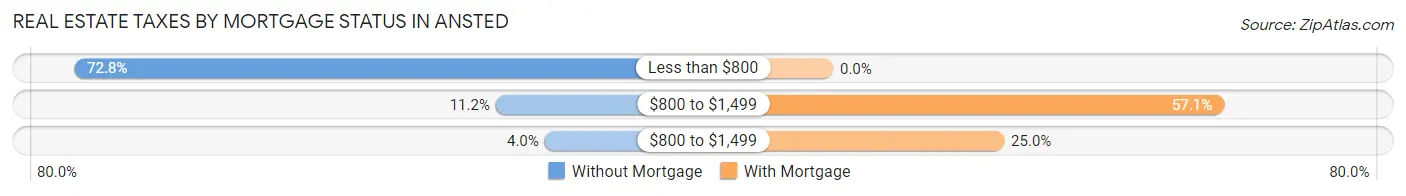
| Property Taxes | Without Mortgage | With Mortgage |
| Less than $800 | 163 (72.8%) | 0 (0.0%) |
| $800 to $1,499 | 25 (11.2%) | 64 (57.1%) |
| $800 to $1,499 | 9 (4.0%) | 28 (25.0%) |
| Total | 224 (100.0%) | 112 (100.0%) |
Health & Disability in Ansted
Health Insurance Coverage by Age in Ansted
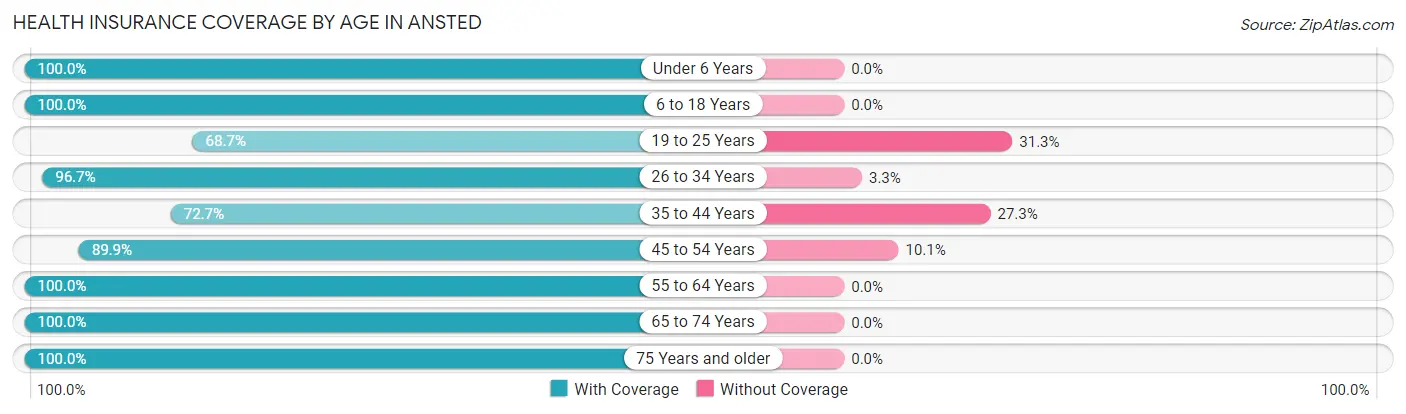
| Age Bracket | With Coverage | Without Coverage |
| Under 6 Years | 74 (100.0%) | 0 (0.0%) |
| 6 to 18 Years | 161 (100.0%) | 0 (0.0%) |
| 19 to 25 Years | 138 (68.7%) | 63 (31.3%) |
| 26 to 34 Years | 175 (96.7%) | 6 (3.3%) |
| 35 to 44 Years | 48 (72.7%) | 18 (27.3%) |
| 45 to 54 Years | 151 (89.9%) | 17 (10.1%) |
| 55 to 64 Years | 152 (100.0%) | 0 (0.0%) |
| 65 to 74 Years | 202 (100.0%) | 0 (0.0%) |
| 75 Years and older | 60 (100.0%) | 0 (0.0%) |
| Total | 1,161 (91.8%) | 104 (8.2%) |
Health Insurance Coverage by Citizenship Status in Ansted
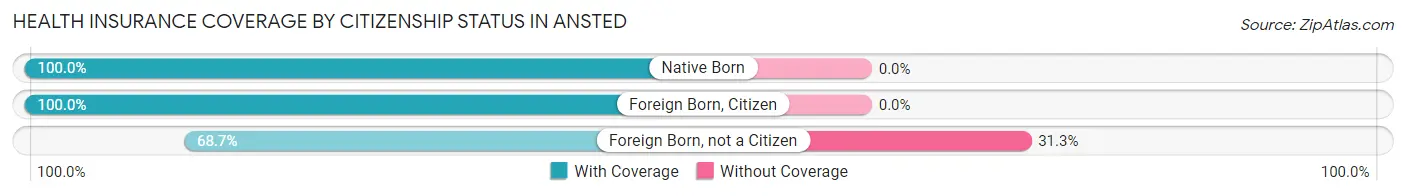
| Citizenship Status | With Coverage | Without Coverage |
| Native Born | 74 (100.0%) | 0 (0.0%) |
| Foreign Born, Citizen | 161 (100.0%) | 0 (0.0%) |
| Foreign Born, not a Citizen | 138 (68.7%) | 63 (31.3%) |
Health Insurance Coverage by Household Income in Ansted
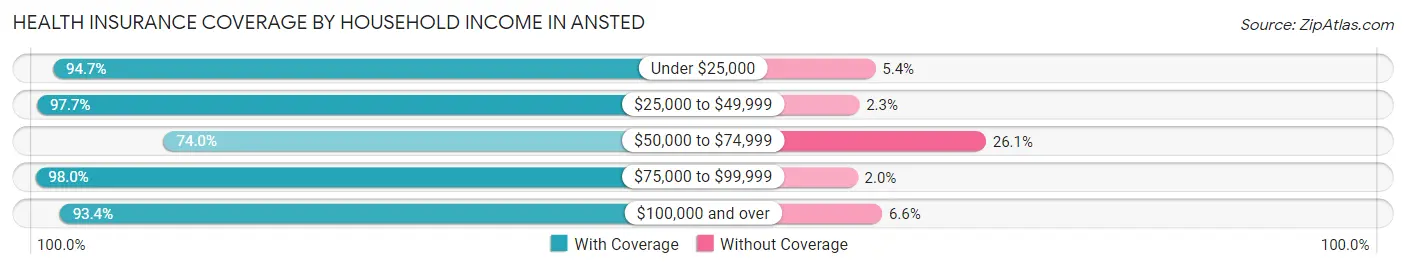
| Household Income | With Coverage | Without Coverage |
| Under $25,000 | 230 (94.7%) | 13 (5.3%) |
| $25,000 to $49,999 | 210 (97.7%) | 5 (2.3%) |
| $50,000 to $74,999 | 176 (74.0%) | 62 (26.1%) |
| $75,000 to $99,999 | 290 (98.0%) | 6 (2.0%) |
| $100,000 and over | 255 (93.4%) | 18 (6.6%) |
Public vs Private Health Insurance Coverage by Age in Ansted
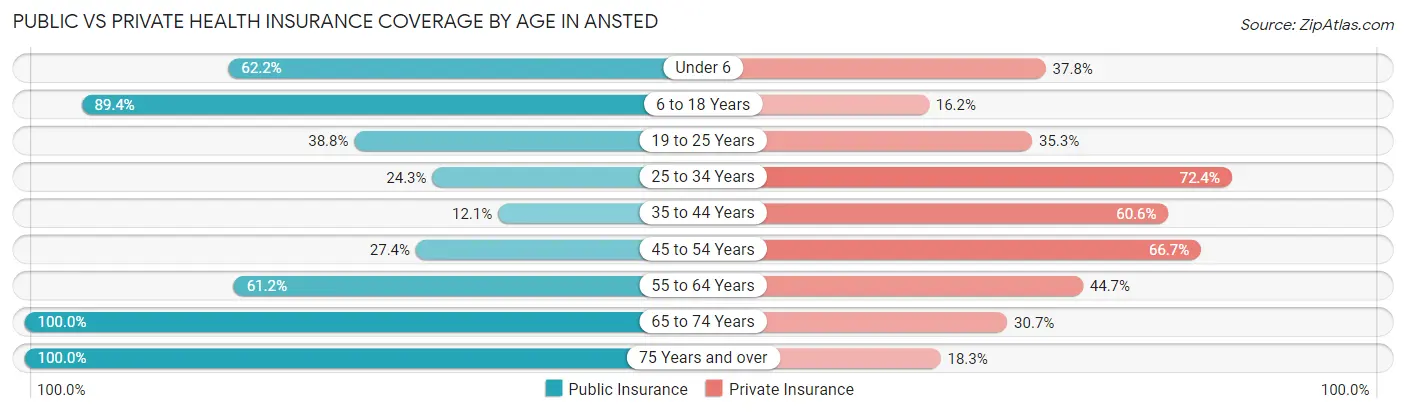
| Age Bracket | Public Insurance | Private Insurance |
| Under 6 | 46 (62.2%) | 28 (37.8%) |
| 6 to 18 Years | 144 (89.4%) | 26 (16.2%) |
| 19 to 25 Years | 78 (38.8%) | 71 (35.3%) |
| 25 to 34 Years | 44 (24.3%) | 131 (72.4%) |
| 35 to 44 Years | 8 (12.1%) | 40 (60.6%) |
| 45 to 54 Years | 46 (27.4%) | 112 (66.7%) |
| 55 to 64 Years | 93 (61.2%) | 68 (44.7%) |
| 65 to 74 Years | 202 (100.0%) | 62 (30.7%) |
| 75 Years and over | 60 (100.0%) | 11 (18.3%) |
| Total | 721 (57.0%) | 549 (43.4%) |
Disability Status by Sex by Age in Ansted
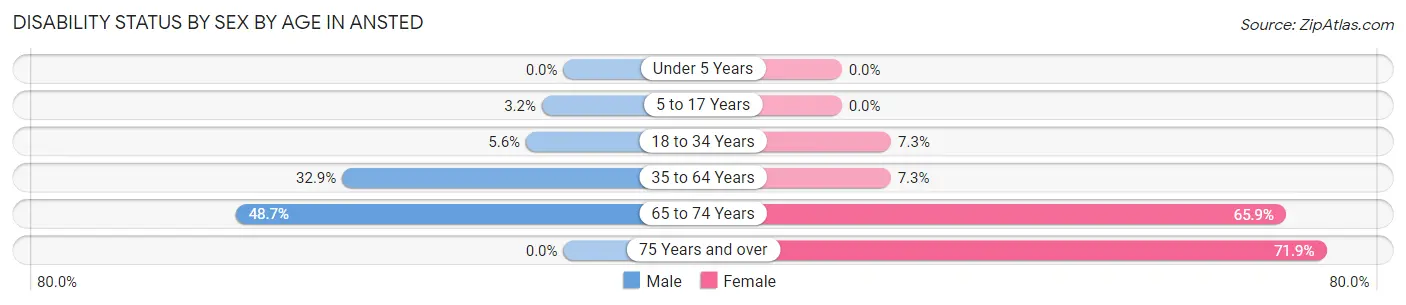
| Age Bracket | Male | Female |
| Under 5 Years | 0 (0.0%) | 0 (0.0%) |
| 5 to 17 Years | 4 (3.2%) | 0 (0.0%) |
| 18 to 34 Years | 13 (5.6%) | 11 (7.3%) |
| 35 to 64 Years | 68 (32.9%) | 13 (7.3%) |
| 65 to 74 Years | 54 (48.6%) | 60 (65.9%) |
| 75 Years and over | 0 (0.0%) | 41 (71.9%) |
Disability Class by Sex by Age in Ansted
Disability Class: Hearing Difficulty
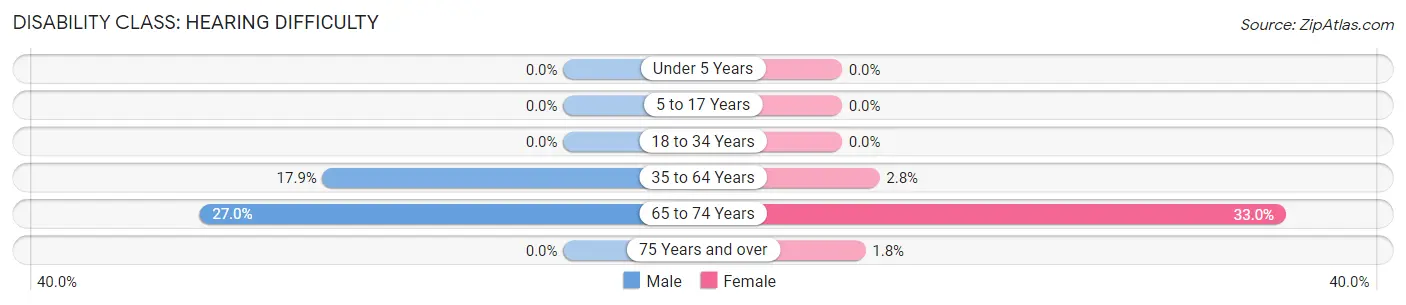
| Age Bracket | Male | Female |
| Under 5 Years | 0 (0.0%) | 0 (0.0%) |
| 5 to 17 Years | 0 (0.0%) | 0 (0.0%) |
| 18 to 34 Years | 0 (0.0%) | 0 (0.0%) |
| 35 to 64 Years | 37 (17.9%) | 5 (2.8%) |
| 65 to 74 Years | 30 (27.0%) | 30 (33.0%) |
| 75 Years and over | 0 (0.0%) | 1 (1.8%) |
Disability Class: Vision Difficulty
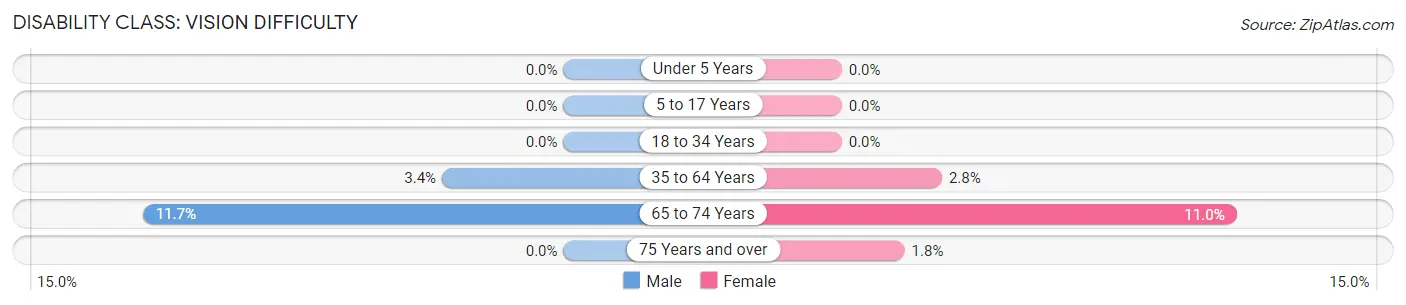
| Age Bracket | Male | Female |
| Under 5 Years | 0 (0.0%) | 0 (0.0%) |
| 5 to 17 Years | 0 (0.0%) | 0 (0.0%) |
| 18 to 34 Years | 0 (0.0%) | 0 (0.0%) |
| 35 to 64 Years | 7 (3.4%) | 5 (2.8%) |
| 65 to 74 Years | 13 (11.7%) | 10 (11.0%) |
| 75 Years and over | 0 (0.0%) | 1 (1.8%) |
Disability Class: Cognitive Difficulty
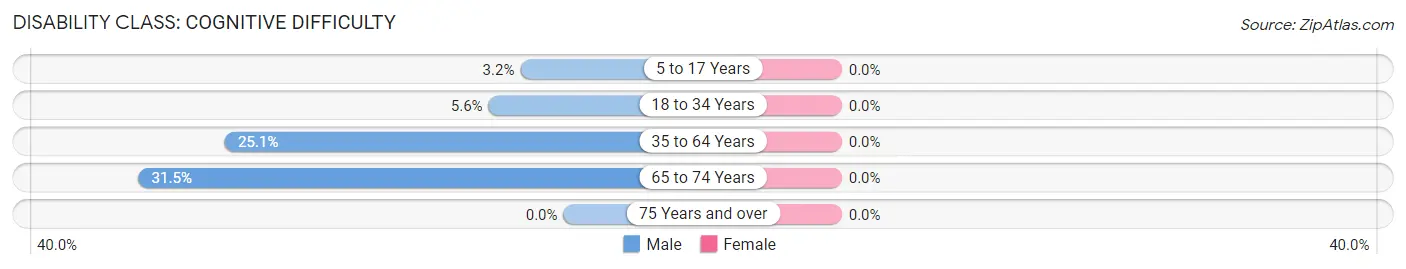
| Age Bracket | Male | Female |
| 5 to 17 Years | 4 (3.2%) | 0 (0.0%) |
| 18 to 34 Years | 13 (5.6%) | 0 (0.0%) |
| 35 to 64 Years | 52 (25.1%) | 0 (0.0%) |
| 65 to 74 Years | 35 (31.5%) | 0 (0.0%) |
| 75 Years and over | 0 (0.0%) | 0 (0.0%) |
Disability Class: Ambulatory Difficulty
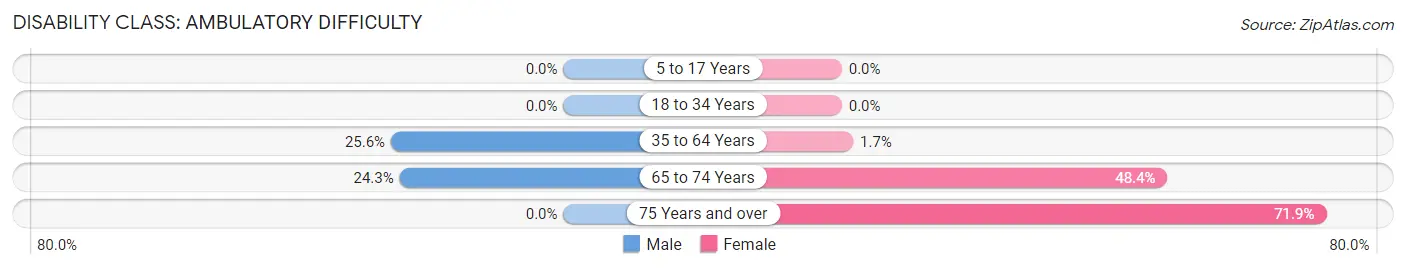
| Age Bracket | Male | Female |
| 5 to 17 Years | 0 (0.0%) | 0 (0.0%) |
| 18 to 34 Years | 0 (0.0%) | 0 (0.0%) |
| 35 to 64 Years | 53 (25.6%) | 3 (1.7%) |
| 65 to 74 Years | 27 (24.3%) | 44 (48.3%) |
| 75 Years and over | 0 (0.0%) | 41 (71.9%) |
Disability Class: Self-Care Difficulty
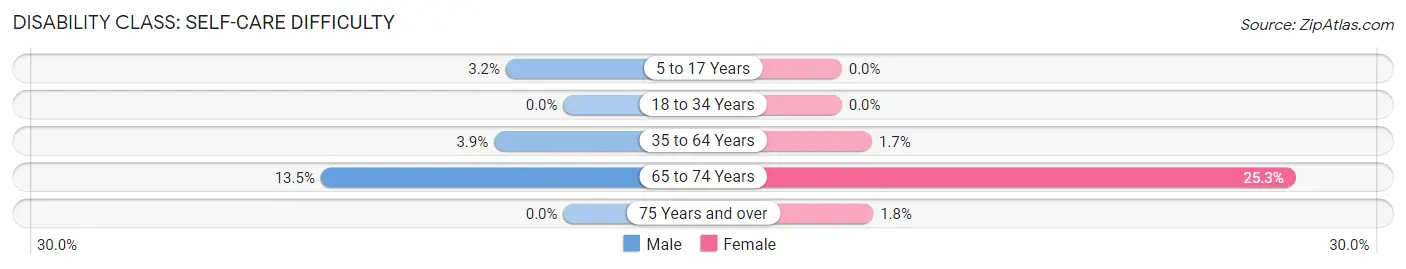
| Age Bracket | Male | Female |
| 5 to 17 Years | 4 (3.2%) | 0 (0.0%) |
| 18 to 34 Years | 0 (0.0%) | 0 (0.0%) |
| 35 to 64 Years | 8 (3.9%) | 3 (1.7%) |
| 65 to 74 Years | 15 (13.5%) | 23 (25.3%) |
| 75 Years and over | 0 (0.0%) | 1 (1.8%) |
Technology Access in Ansted
Computing Device Access in Ansted
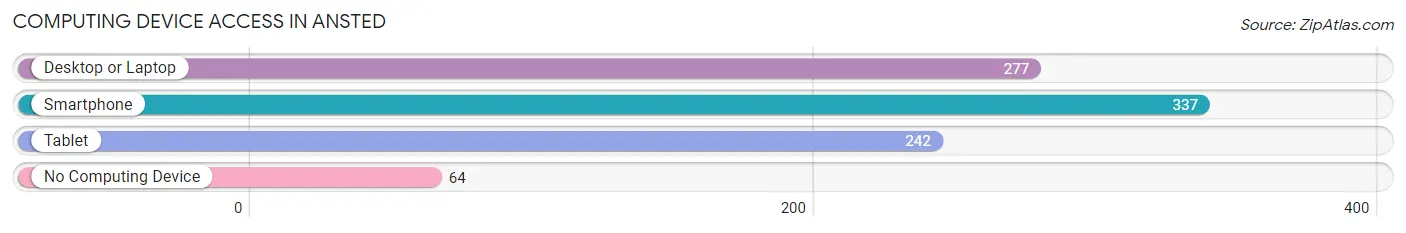
| Device Type | # Households | % Households |
| Desktop or Laptop | 277 | 59.3% |
| Smartphone | 337 | 72.2% |
| Tablet | 242 | 51.8% |
| No Computing Device | 64 | 13.7% |
| Total | 467 | 100.0% |
Internet Access in Ansted
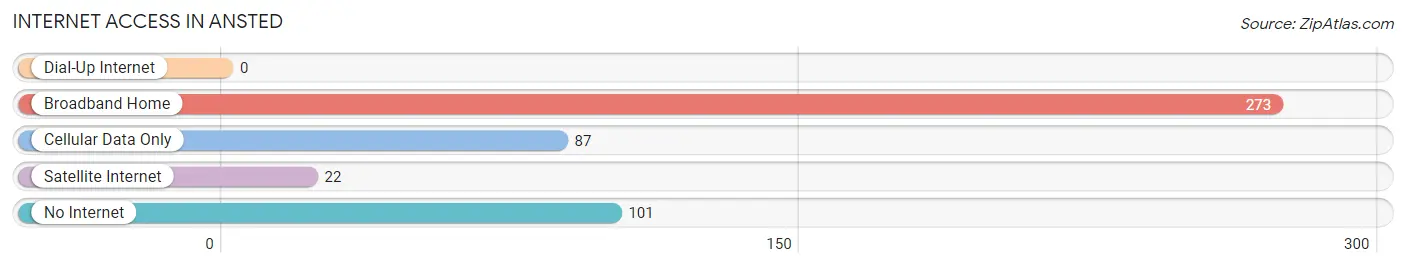
| Internet Type | # Households | % Households |
| Dial-Up Internet | 0 | 0.0% |
| Broadband Home | 273 | 58.5% |
| Cellular Data Only | 87 | 18.6% |
| Satellite Internet | 22 | 4.7% |
| No Internet | 101 | 21.6% |
| Total | 467 | 100.0% |
Ansted Summary
Ansted is a small town located in Fayette County, West Virginia. It is situated on the western edge of the New River Gorge National Park and Preserve, and is part of the larger Beckley-Raleigh County Metropolitan Statistical Area. The town has a population of approximately 1,500 people, and is known for its scenic beauty and outdoor recreation opportunities.
History
Ansted was founded in 1873 by Englishman David T. Ansted, who had previously worked as a surveyor in the area. He named the town after himself, and it quickly became a popular destination for tourists and outdoor enthusiasts. The town was incorporated in 1881, and the first post office was established in 1882.
In the late 19th century, Ansted was a popular destination for wealthy industrialists and entrepreneurs, who built grand homes and resorts in the area. The town was also home to several coal mines, which provided employment for many of the town’s residents.
In the early 20th century, Ansted was a popular tourist destination, with many visitors coming to enjoy the scenic beauty of the area. The town was also home to several resorts, including the Ansted Hotel, which was built in the late 1800s and is now listed on the National Register of Historic Places.
Geography
Ansted is located in the Appalachian Mountains of West Virginia, in the New River Gorge National Park and Preserve. The town is situated on the western edge of the park, and is surrounded by the New River, Gauley River, and Bluestone River. The town is located at an elevation of 1,400 feet, and has a total area of 1.2 square miles.
Economy
The economy of Ansted is largely based on tourism and outdoor recreation. The town is home to several resorts and hotels, as well as several restaurants and shops. The town is also home to several outdoor recreation businesses, including whitewater rafting, fishing, and hiking.
The town is also home to several coal mines, which provide employment for many of the town’s residents. The coal industry has been in decline in recent years, however, due to the increasing use of renewable energy sources.
Demographics
As of the 2010 census, Ansted had a population of 1,500 people. The racial makeup of the town was 97.3% White, 0.7% African American, 0.2% Native American, 0.2% Asian, 0.2% from other races, and 1.6% from two or more races. Hispanic or Latino of any race were 0.7% of the population.
The median household income in Ansted was $30,000, and the median family income was $35,000. The per capita income for the town was $17,000. About 15.7% of the population was below the poverty line.
Common Questions
What is Per Capita Income in Ansted?
Per Capita income in Ansted is $24,440.
What is the Median Family Income in Ansted?
Median Family Income in Ansted is $72,879.
What is the Median Household income in Ansted?
Median Household Income in Ansted is $55,404.
What is Income or Wage Gap in Ansted?
Income or Wage Gap in Ansted is 6.2%.
Women in Ansted earn 93.8 cents for every dollar earned by a man.
What is Inequality or Gini Index in Ansted?
Inequality or Gini Index in Ansted is 0.41.
What is the Total Population of Ansted?
Total Population of Ansted is 1,276.
What is the Total Male Population of Ansted?
Total Male Population of Ansted is 709.
What is the Total Female Population of Ansted?
Total Female Population of Ansted is 567.
What is the Ratio of Males per 100 Females in Ansted?
There are 125.04 Males per 100 Females in Ansted.
What is the Ratio of Females per 100 Males in Ansted?
There are 79.97 Females per 100 Males in Ansted.
What is the Median Population Age in Ansted?
Median Population Age in Ansted is 39.9 Years.
What is the Average Family Size in Ansted
Average Family Size in Ansted is 3.2 People.
What is the Average Household Size in Ansted
Average Household Size in Ansted is 2.7 People.
How Large is the Labor Force in Ansted?
There are 651 People in the Labor Forcein in Ansted.
What is the Percentage of People in the Labor Force in Ansted?
60.3% of People are in the Labor Force in Ansted.
What is the Unemployment Rate in Ansted?
Unemployment Rate in Ansted is 8.6%.