Alum Creek, WV Map & Demographics
Alum Creek Map
Alum Creek Overview
$36,534
PER CAPITA INCOME
$59,813
AVG FAMILY INCOME
$65,179
AVG HOUSEHOLD INCOME
41.8%
WAGE / INCOME GAP [ % ]
58.2¢/ $1
WAGE / INCOME GAP [ $ ]
0.35
INEQUALITY / GINI INDEX
1,420
TOTAL POPULATION
560
MALE POPULATION
860
FEMALE POPULATION
65.12
MALES / 100 FEMALES
153.57
FEMALES / 100 MALES
47.4
MEDIAN AGE
2.8
AVG FAMILY SIZE
2.6
AVG HOUSEHOLD SIZE
689
LABOR FORCE [ PEOPLE ]
54.3%
PERCENT IN LABOR FORCE
11.5%
UNEMPLOYMENT RATE
Alum Creek Zip Codes
Alum Creek Area Codes
Income in Alum Creek
Income Overview in Alum Creek
Per Capita Income in Alum Creek is $36,534, while median incomes of families and households are $59,813 and $65,179 respectively.
| Characteristic | Number | Measure |
| Per Capita Income | 1,420 | $36,534 |
| Median Family Income | 414 | $59,813 |
| Mean Family Income | 414 | $84,533 |
| Median Household Income | 551 | $65,179 |
| Mean Household Income | 551 | $87,850 |
| Income Deficit | 414 | $0 |
| Wage / Income Gap (%) | 1,420 | 41.80% |
| Wage / Income Gap ($) | 1,420 | 58.20¢ per $1 |
| Gini / Inequality Index | 1,420 | 0.35 |
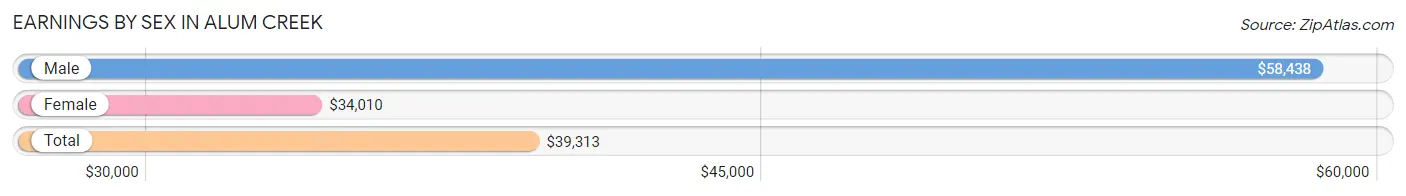
Earnings by Sex in Alum Creek
Average Earnings in Alum Creek are $39,313, $58,438 for men and $34,010 for women, a difference of 41.8%.
| Sex | Number | Average Earnings |
| Male | 373 (53.6%) | $58,438 |
| Female | 323 (46.4%) | $34,010 |
| Total | 696 (100.0%) | $39,313 |
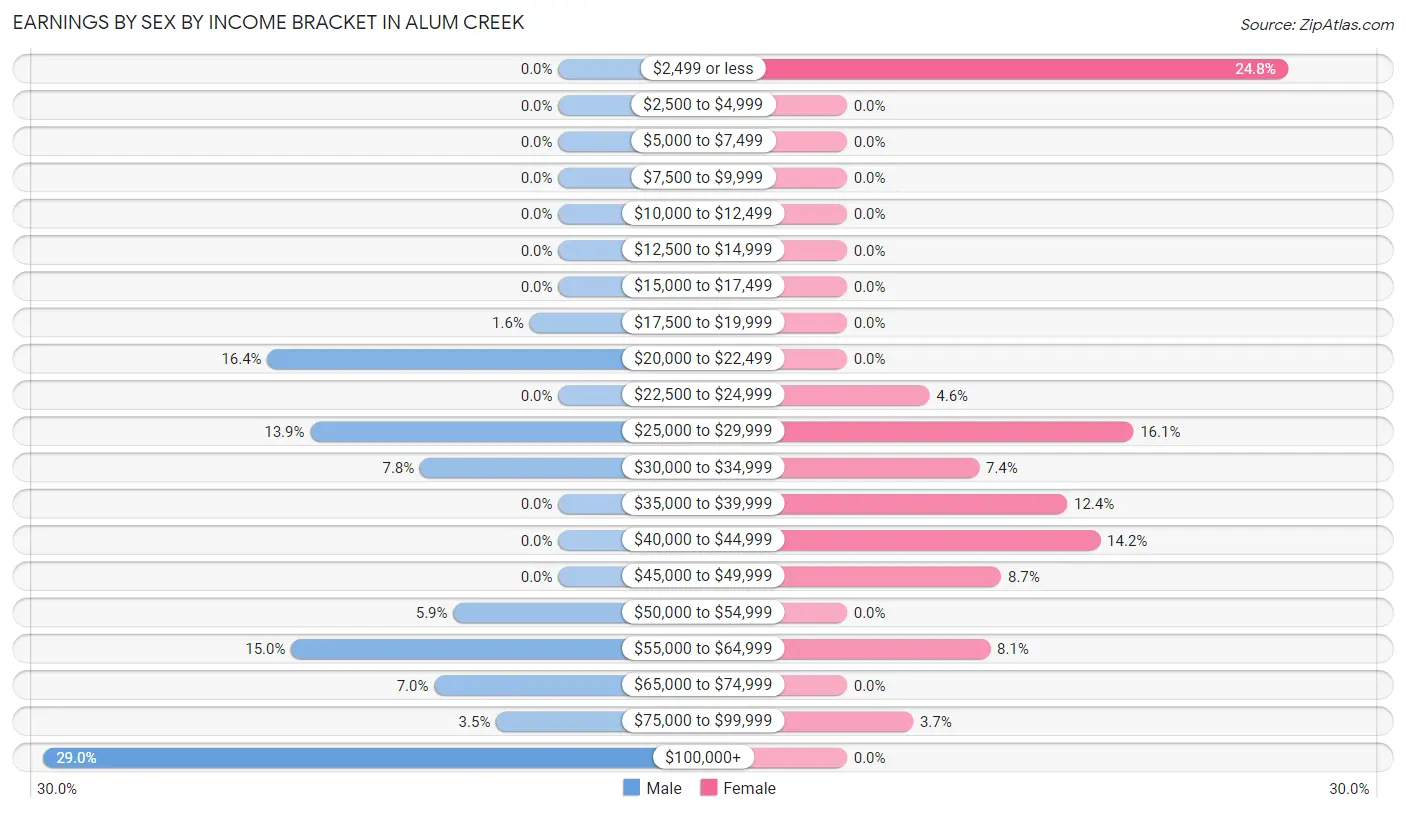
Earnings by Sex by Income Bracket in Alum Creek
The most common earnings brackets in Alum Creek are $100,000+ for men (108 | 28.9%) and $2,499 or less for women (80 | 24.8%).
| Income | Male | Female |
| $2,499 or less | 0 (0.0%) | 80 (24.8%) |
| $2,500 to $4,999 | 0 (0.0%) | 0 (0.0%) |
| $5,000 to $7,499 | 0 (0.0%) | 0 (0.0%) |
| $7,500 to $9,999 | 0 (0.0%) | 0 (0.0%) |
| $10,000 to $12,499 | 0 (0.0%) | 0 (0.0%) |
| $12,500 to $14,999 | 0 (0.0%) | 0 (0.0%) |
| $15,000 to $17,499 | 0 (0.0%) | 0 (0.0%) |
| $17,500 to $19,999 | 6 (1.6%) | 0 (0.0%) |
| $20,000 to $22,499 | 61 (16.4%) | 0 (0.0%) |
| $22,500 to $24,999 | 0 (0.0%) | 15 (4.6%) |
| $25,000 to $29,999 | 52 (13.9%) | 52 (16.1%) |
| $30,000 to $34,999 | 29 (7.8%) | 24 (7.4%) |
| $35,000 to $39,999 | 0 (0.0%) | 40 (12.4%) |
| $40,000 to $44,999 | 0 (0.0%) | 46 (14.2%) |
| $45,000 to $49,999 | 0 (0.0%) | 28 (8.7%) |
| $50,000 to $54,999 | 22 (5.9%) | 0 (0.0%) |
| $55,000 to $64,999 | 56 (15.0%) | 26 (8.1%) |
| $65,000 to $74,999 | 26 (7.0%) | 0 (0.0%) |
| $75,000 to $99,999 | 13 (3.5%) | 12 (3.7%) |
| $100,000+ | 108 (28.9%) | 0 (0.0%) |
| Total | 373 (100.0%) | 323 (100.0%) |
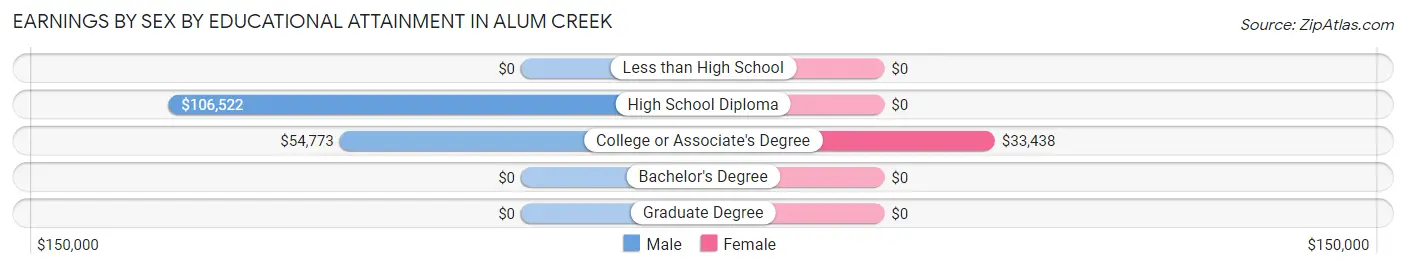
Earnings by Sex by Educational Attainment in Alum Creek
Average earnings in Alum Creek are $58,438 for men and $38,281 for women, a difference of 34.5%. Men with an educational attainment of high school diploma enjoy the highest average annual earnings of $106,522, while those with college or associate's degree education earn the least with $54,773. Women with an educational attainment of college or associate's degree earn the most with the average annual earnings of $33,438, while those with college or associate's degree education have the smallest earnings of $33,438.
| Educational Attainment | Male Income | Female Income |
| Less than High School | - | - |
| High School Diploma | $106,522 | $0 |
| College or Associate's Degree | $54,773 | $33,438 |
| Bachelor's Degree | - | - |
| Graduate Degree | - | - |
| Total | $58,438 | $38,281 |
Family Income in Alum Creek
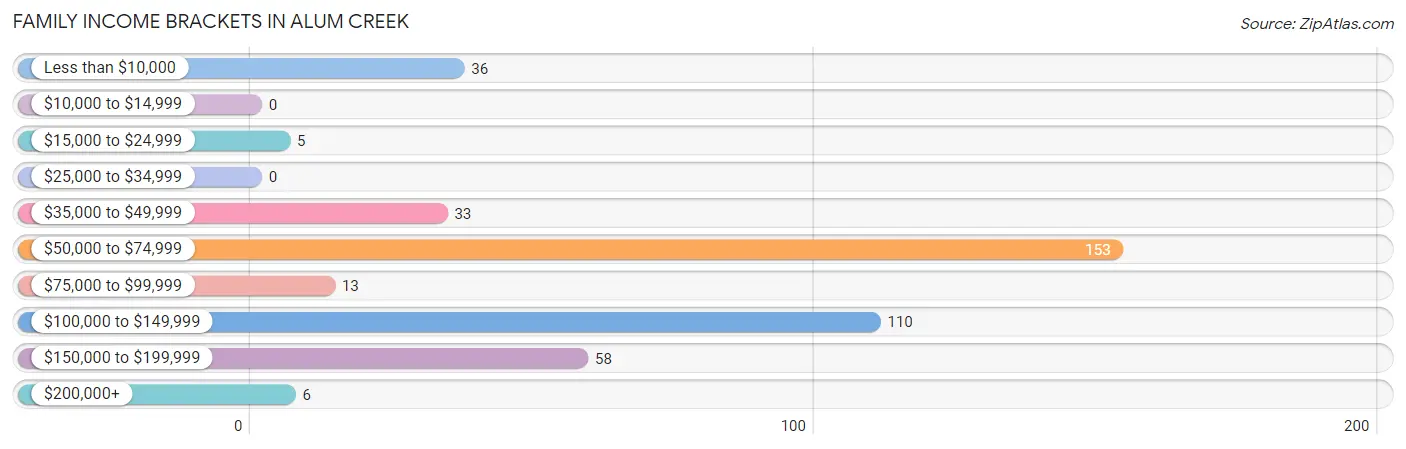
Family Income Brackets in Alum Creek
According to the Alum Creek family income data, there are 153 families falling into the $50,000 to $74,999 income range, which is the most common income bracket and makes up 37.0% of all families.
| Income Bracket | # Families | % Families |
| Less than $10,000 | 36 | 8.7% |
| $10,000 to $14,999 | 0 | 0.0% |
| $15,000 to $24,999 | 5 | 1.2% |
| $25,000 to $34,999 | 0 | 0.0% |
| $35,000 to $49,999 | 33 | 8.0% |
| $50,000 to $74,999 | 153 | 37.0% |
| $75,000 to $99,999 | 13 | 3.1% |
| $100,000 to $149,999 | 110 | 26.6% |
| $150,000 to $199,999 | 58 | 14.0% |
| $200,000+ | 6 | 1.4% |
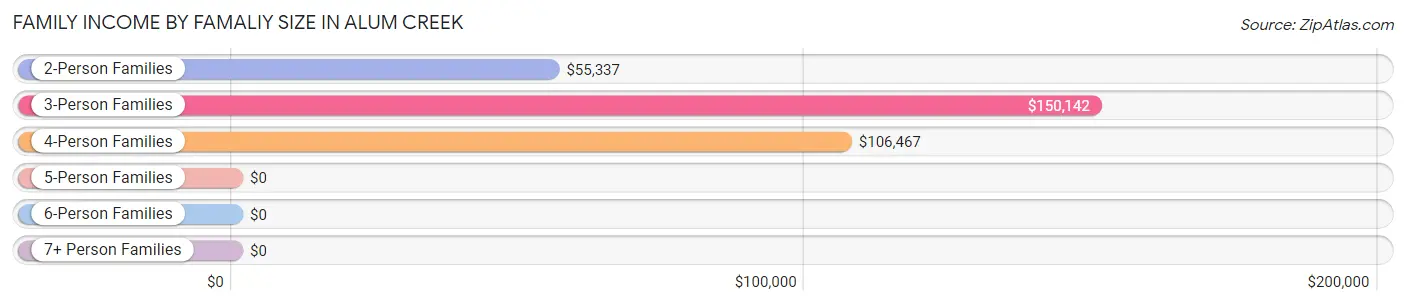
Family Income by Famaliy Size in Alum Creek
3-person families (83 | 20.1%) account for the highest median family income in Alum Creek with $150,142 per family, while 3-person families (83 | 20.1%) have the highest median income of $50,047 per family member.
| Income Bracket | # Families | Median Income |
| 2-Person Families | 250 (60.4%) | $55,337 |
| 3-Person Families | 83 (20.1%) | $150,142 |
| 4-Person Families | 81 (19.6%) | $106,467 |
| 5-Person Families | 0 (0.0%) | $0 |
| 6-Person Families | 0 (0.0%) | $0 |
| 7+ Person Families | 0 (0.0%) | $0 |
| Total | 414 (100.0%) | $59,813 |
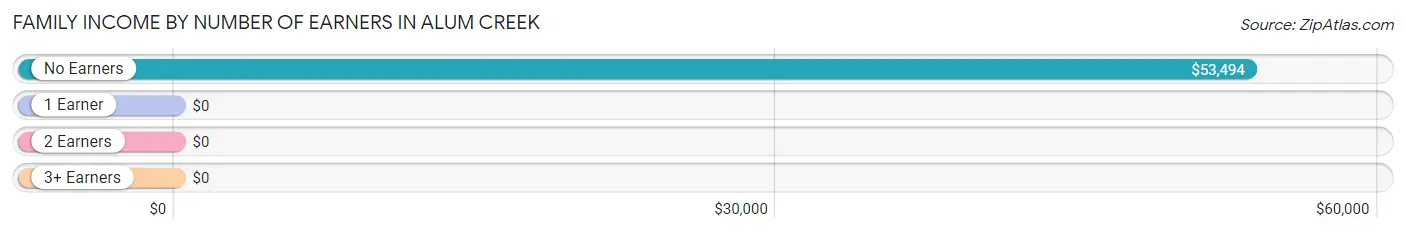
Family Income by Number of Earners in Alum Creek
| Number of Earners | # Families | Median Income |
| No Earners | 111 (26.8%) | $53,494 |
| 1 Earner | 161 (38.9%) | $0 |
| 2 Earners | 92 (22.2%) | $0 |
| 3+ Earners | 50 (12.1%) | $0 |
| Total | 414 (100.0%) | $59,813 |
Household Income in Alum Creek
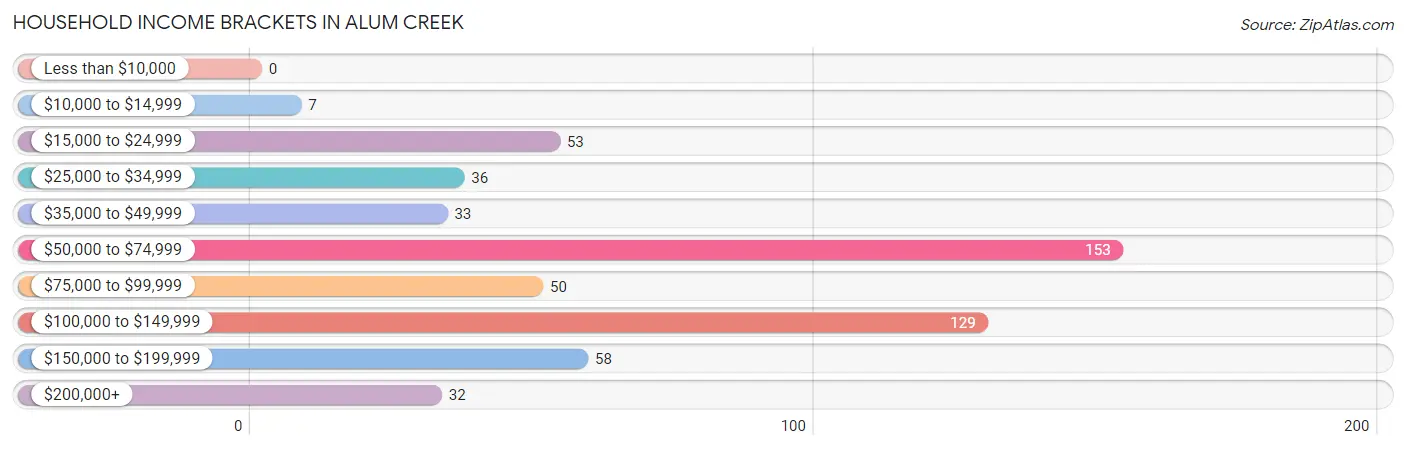
Household Income Brackets in Alum Creek
With 153 households falling in the category, the $50,000 to $74,999 income range is the most frequent in Alum Creek, accounting for 27.8% of all households.
| Income Bracket | # Households | % Households |
| Less than $10,000 | 0 | 0.0% |
| $10,000 to $14,999 | 7 | 1.3% |
| $15,000 to $24,999 | 53 | 9.6% |
| $25,000 to $34,999 | 36 | 6.5% |
| $35,000 to $49,999 | 33 | 6.0% |
| $50,000 to $74,999 | 153 | 27.8% |
| $75,000 to $99,999 | 50 | 9.1% |
| $100,000 to $149,999 | 129 | 23.4% |
| $150,000 to $199,999 | 58 | 10.5% |
| $200,000+ | 32 | 5.8% |
Household Income by Householder Age in Alum Creek
The median household income in Alum Creek is $65,179, with the highest median household income of $116,250 found in the 45 to 64 years age bracket for the primary householder. A total of 244 households (44.3%) fall into this category.
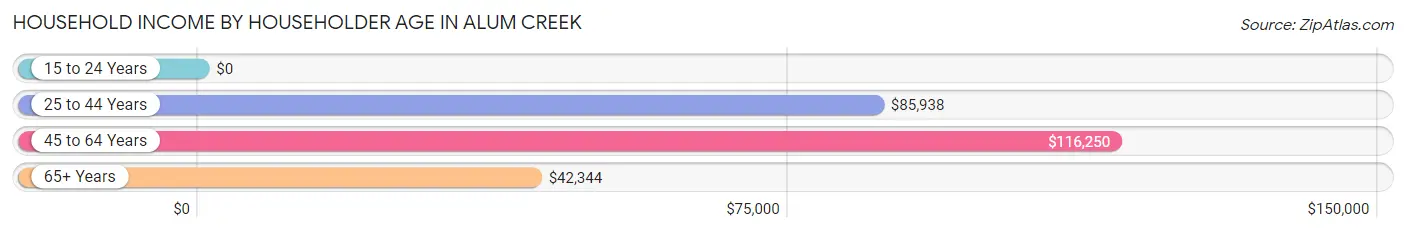
| Income Bracket | # Households | Median Income |
| 15 to 24 Years | 0 (0.0%) | $0 |
| 25 to 44 Years | 194 (35.2%) | $85,938 |
| 45 to 64 Years | 244 (44.3%) | $116,250 |
| 65+ Years | 113 (20.5%) | $42,344 |
| Total | 551 (100.0%) | $65,179 |
Poverty in Alum Creek
Income Below Poverty by Sex and Age in Alum Creek
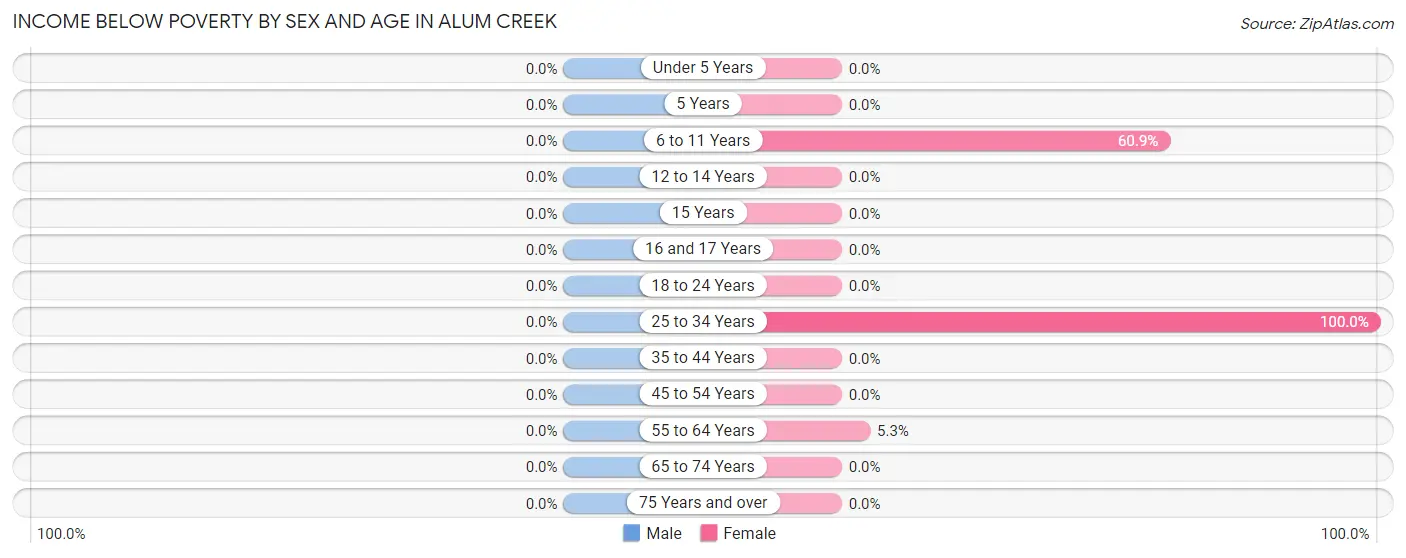
| Age Bracket | Male | Female |
| Under 5 Years | 0 (0.0%) | 0 (0.0%) |
| 5 Years | 0 (0.0%) | 0 (0.0%) |
| 6 to 11 Years | 0 (0.0%) | 39 (60.9%) |
| 12 to 14 Years | 0 (0.0%) | 0 (0.0%) |
| 15 Years | 0 (0.0%) | 0 (0.0%) |
| 16 and 17 Years | 0 (0.0%) | 0 (0.0%) |
| 18 to 24 Years | 0 (0.0%) | 0 (0.0%) |
| 25 to 34 Years | 0 (0.0%) | 36 (100.0%) |
| 35 to 44 Years | 0 (0.0%) | 0 (0.0%) |
| 45 to 54 Years | 0 (0.0%) | 0 (0.0%) |
| 55 to 64 Years | 0 (0.0%) | 7 (5.3%) |
| 65 to 74 Years | 0 (0.0%) | 0 (0.0%) |
| 75 Years and over | 0 (0.0%) | 0 (0.0%) |
| Total | 0 (0.0%) | 82 (9.5%) |
Income Above Poverty by Sex and Age in Alum Creek
According to the poverty statistics in Alum Creek, males aged 16 and 17 years and females aged 12 to 14 years are the age groups that are most secure financially, with 100.0% of males and 100.0% of females in these age groups living above the poverty line.
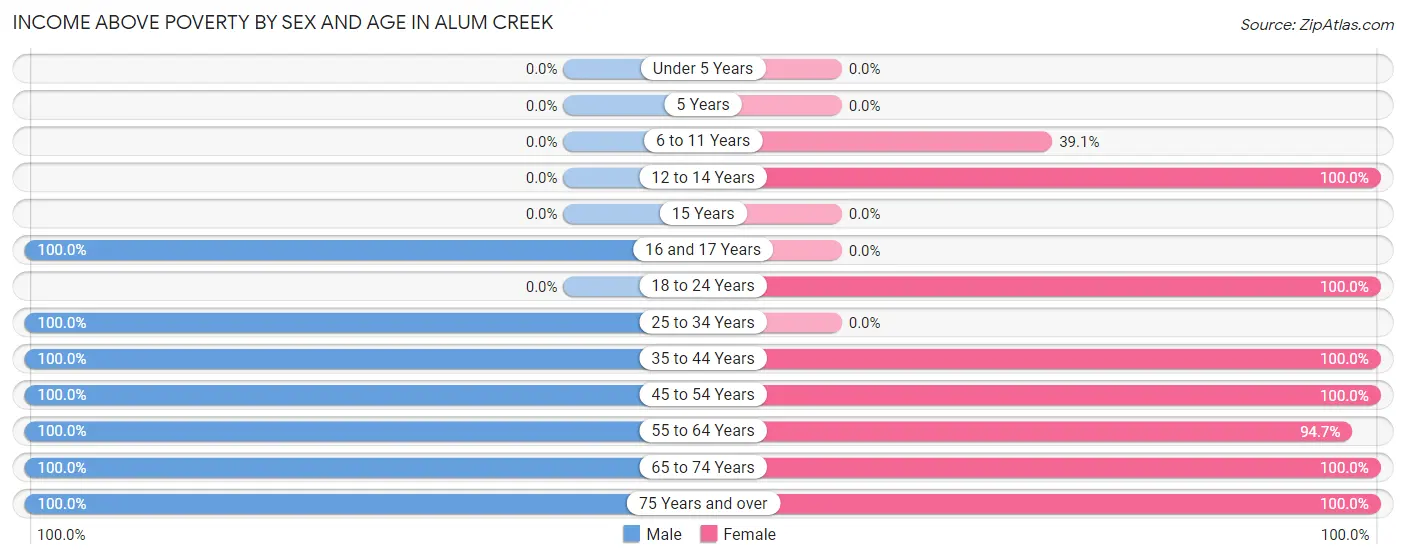
| Age Bracket | Male | Female |
| Under 5 Years | 0 (0.0%) | 0 (0.0%) |
| 5 Years | 0 (0.0%) | 0 (0.0%) |
| 6 to 11 Years | 0 (0.0%) | 25 (39.1%) |
| 12 to 14 Years | 0 (0.0%) | 87 (100.0%) |
| 15 Years | 0 (0.0%) | 0 (0.0%) |
| 16 and 17 Years | 58 (100.0%) | 0 (0.0%) |
| 18 to 24 Years | 0 (0.0%) | 44 (100.0%) |
| 25 to 34 Years | 61 (100.0%) | 0 (0.0%) |
| 35 to 44 Years | 82 (100.0%) | 204 (100.0%) |
| 45 to 54 Years | 204 (100.0%) | 89 (100.0%) |
| 55 to 64 Years | 70 (100.0%) | 126 (94.7%) |
| 65 to 74 Years | 41 (100.0%) | 85 (100.0%) |
| 75 Years and over | 44 (100.0%) | 118 (100.0%) |
| Total | 560 (100.0%) | 778 (90.5%) |
Income Below Poverty Among Married-Couple Families in Alum Creek
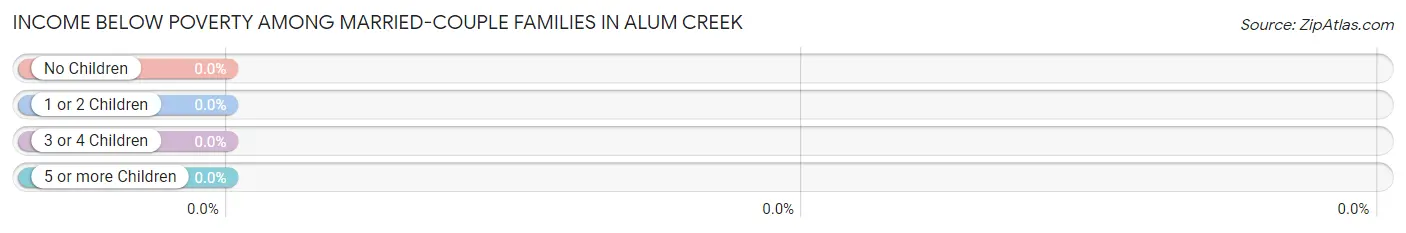
| Children | Above Poverty | Below Poverty |
| No Children | 283 (100.0%) | 0 (0.0%) |
| 1 or 2 Children | 95 (100.0%) | 0 (0.0%) |
| 3 or 4 Children | 0 (0.0%) | 0 (0.0%) |
| 5 or more Children | 0 (0.0%) | 0 (0.0%) |
| Total | 378 (100.0%) | 0 (0.0%) |
Income Below Poverty Among Single-Parent Households in Alum Creek
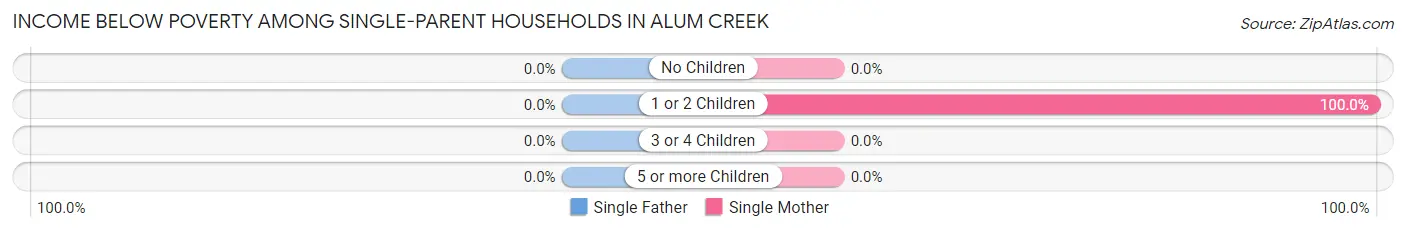
| Children | Single Father | Single Mother |
| No Children | 0 (0.0%) | 0 (0.0%) |
| 1 or 2 Children | 0 (0.0%) | 36 (100.0%) |
| 3 or 4 Children | 0 (0.0%) | 0 (0.0%) |
| 5 or more Children | 0 (0.0%) | 0 (0.0%) |
| Total | 0 (0.0%) | 36 (100.0%) |
Income Below Poverty Among Married-Couple vs Single-Parent Households in Alum Creek
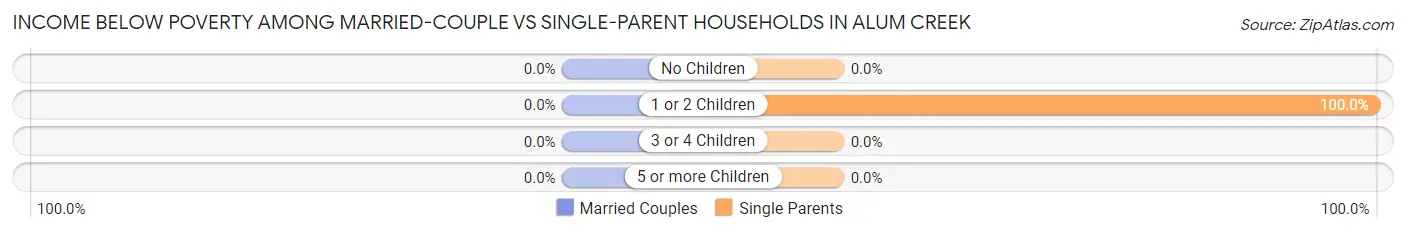
| Children | Married-Couple Families | Single-Parent Households |
| No Children | 0 (0.0%) | 0 (0.0%) |
| 1 or 2 Children | 0 (0.0%) | 36 (100.0%) |
| 3 or 4 Children | 0 (0.0%) | 0 (0.0%) |
| 5 or more Children | 0 (0.0%) | 0 (0.0%) |
| Total | 0 (0.0%) | 36 (100.0%) |
Race in Alum Creek
The most populous races in Alum Creek are White / Caucasian (1,414 | 99.6%), and Two or more Races (6 | 0.4%).
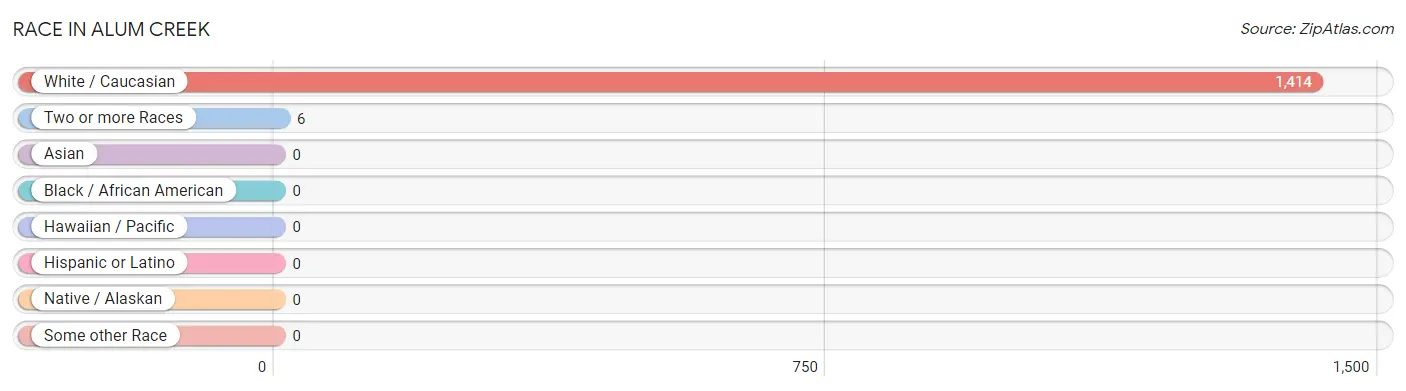
| Race | # Population | % Population |
| Asian | 0 | 0.0% |
| Black / African American | 0 | 0.0% |
| Hawaiian / Pacific | 0 | 0.0% |
| Hispanic or Latino | 0 | 0.0% |
| Native / Alaskan | 0 | 0.0% |
| White / Caucasian | 1,414 | 99.6% |
| Two or more Races | 6 | 0.4% |
| Some other Race | 0 | 0.0% |
| Total | 1,420 | 100.0% |
Ancestry in Alum Creek
The most populous ancestries reported in Alum Creek are English (377 | 26.6%), Irish (153 | 10.8%), German (151 | 10.6%), European (107 | 7.5%), and American (62 | 4.4%), together accounting for 59.9% of all Alum Creek residents.
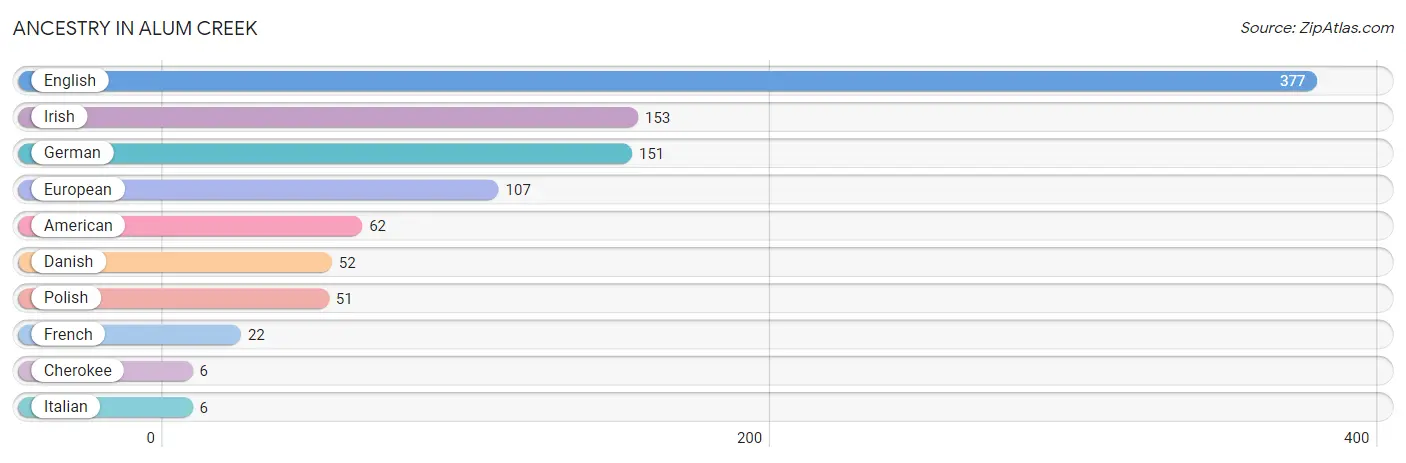
| Ancestry | # Population | % Population |
| American | 62 | 4.4% |
| Cherokee | 6 | 0.4% |
| Danish | 52 | 3.7% |
| English | 377 | 26.6% |
| European | 107 | 7.5% |
| French | 22 | 1.5% |
| German | 151 | 10.6% |
| Irish | 153 | 10.8% |
| Italian | 6 | 0.4% |
| Polish | 51 | 3.6% | View All 10 Rows |
Immigrants in Alum Creek

| Immigration Origin | # Population | % Population | View All 0 Rows |
Sex and Age in Alum Creek
Sex and Age in Alum Creek
The most populous age groups in Alum Creek are 50 to 54 Years (107 | 19.1%) for men and 40 to 44 Years (204 | 23.7%) for women.
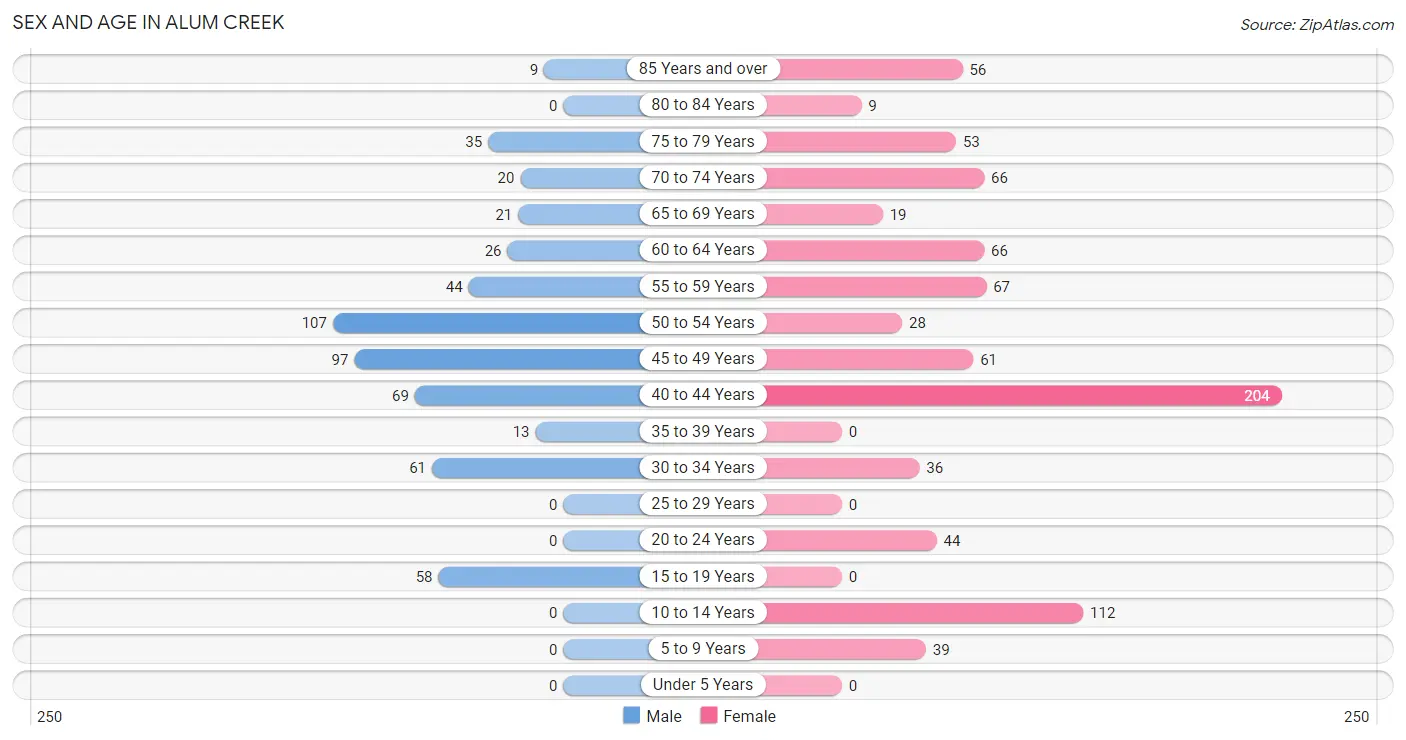
| Age Bracket | Male | Female |
| Under 5 Years | 0 (0.0%) | 0 (0.0%) |
| 5 to 9 Years | 0 (0.0%) | 39 (4.5%) |
| 10 to 14 Years | 0 (0.0%) | 112 (13.0%) |
| 15 to 19 Years | 58 (10.4%) | 0 (0.0%) |
| 20 to 24 Years | 0 (0.0%) | 44 (5.1%) |
| 25 to 29 Years | 0 (0.0%) | 0 (0.0%) |
| 30 to 34 Years | 61 (10.9%) | 36 (4.2%) |
| 35 to 39 Years | 13 (2.3%) | 0 (0.0%) |
| 40 to 44 Years | 69 (12.3%) | 204 (23.7%) |
| 45 to 49 Years | 97 (17.3%) | 61 (7.1%) |
| 50 to 54 Years | 107 (19.1%) | 28 (3.3%) |
| 55 to 59 Years | 44 (7.9%) | 67 (7.8%) |
| 60 to 64 Years | 26 (4.6%) | 66 (7.7%) |
| 65 to 69 Years | 21 (3.7%) | 19 (2.2%) |
| 70 to 74 Years | 20 (3.6%) | 66 (7.7%) |
| 75 to 79 Years | 35 (6.2%) | 53 (6.2%) |
| 80 to 84 Years | 0 (0.0%) | 9 (1.1%) |
| 85 Years and over | 9 (1.6%) | 56 (6.5%) |
| Total | 560 (100.0%) | 860 (100.0%) |
Families and Households in Alum Creek
Median Family Size in Alum Creek
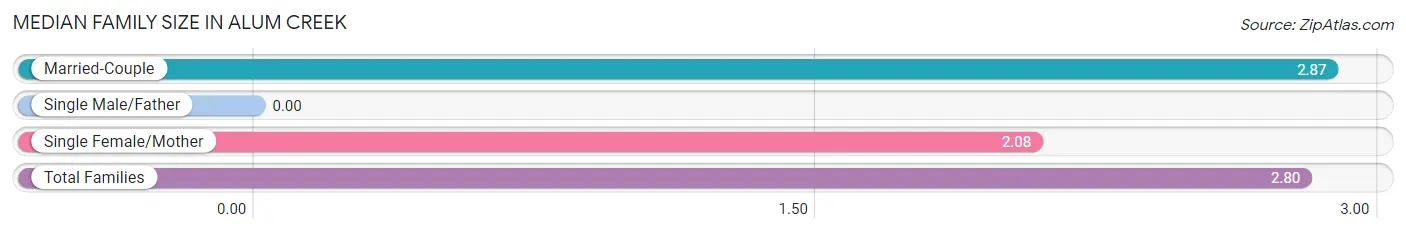
| Family Type | # Families | Family Size |
| Married-Couple | 378 (91.3%) | 2.87 |
| Single Male/Father | 0 (0.0%) | - |
| Single Female/Mother | 36 (8.7%) | 2.08 |
| Total Families | 414 (100.0%) | 2.80 |
Median Household Size in Alum Creek
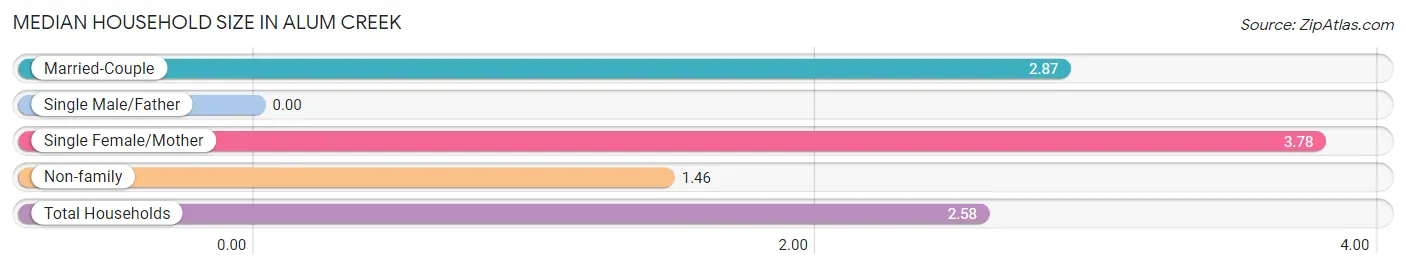
| Household Type | # Households | Household Size |
| Married-Couple | 378 (68.6%) | 2.87 |
| Single Male/Father | 0 (0.0%) | - |
| Single Female/Mother | 36 (6.5%) | 3.78 |
| Non-family | 137 (24.9%) | 1.46 |
| Total Households | 551 (100.0%) | 2.58 |
Household Size by Marriage Status in Alum Creek
Out of a total of 551 households in Alum Creek, 414 (75.1%) are family households, while 137 (24.9%) are nonfamily households. The most numerous type of family households are 2-person households, comprising 214, and the most common type of nonfamily households are 1-person households, comprising 87.
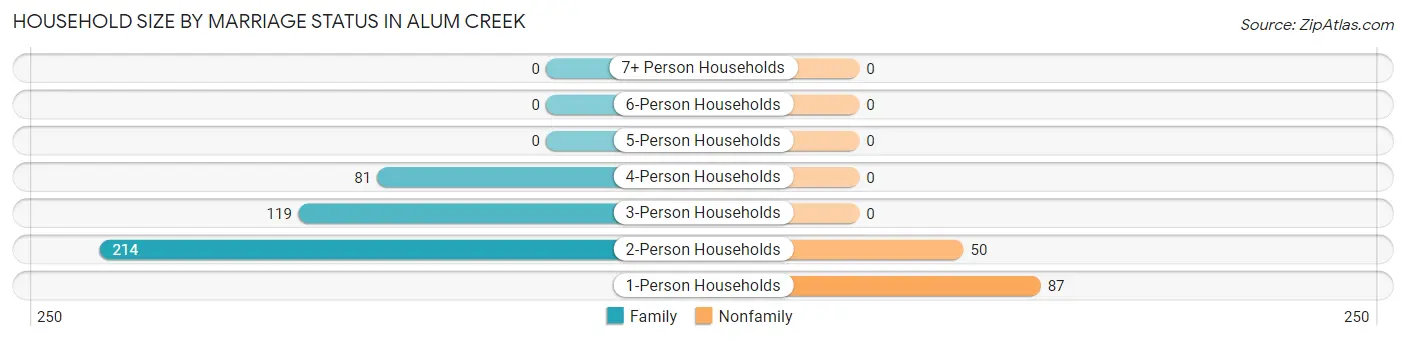
| Household Size | Family Households | Nonfamily Households |
| 1-Person Households | - | 87 (15.8%) |
| 2-Person Households | 214 (38.8%) | 50 (9.1%) |
| 3-Person Households | 119 (21.6%) | 0 (0.0%) |
| 4-Person Households | 81 (14.7%) | 0 (0.0%) |
| 5-Person Households | 0 (0.0%) | 0 (0.0%) |
| 6-Person Households | 0 (0.0%) | 0 (0.0%) |
| 7+ Person Households | 0 (0.0%) | 0 (0.0%) |
| Total | 414 (75.1%) | 137 (24.9%) |
Female Fertility in Alum Creek
Fertility by Age in Alum Creek
| Age Bracket | Women with Births | Births / 1,000 Women |
| 15 to 19 years | 0 (0.0%) | 0.0 |
| 20 to 34 years | 0 (0.0%) | 0.0 |
| 35 to 50 years | 0 (0.0%) | 0.0 |
| Total | 0 (0.0%) | 0.0 |
Fertility by Age by Marriage Status in Alum Creek
| Age Bracket | Married | Unmarried |
| 15 to 19 years | 0 (0.0%) | 0 (0.0%) |
| 20 to 34 years | 0 (0.0%) | 0 (0.0%) |
| 35 to 50 years | 0 (0.0%) | 0 (0.0%) |
| Total | 0 (0.0%) | 0 (0.0%) |
Fertility by Education in Alum Creek
| Educational Attainment | Women with Births | Births / 1,000 Women |
| Less than High School | 0 (0.0%) | 0.0 |
| High School Diploma | 0 (0.0%) | 0.0 |
| College or Associate's Degree | 0 (0.0%) | 0.0 |
| Bachelor's Degree | 0 (0.0%) | 0.0 |
| Graduate Degree | 0 (0.0%) | 0.0 |
| Total | 0 (0.0%) | 0.0 |
Fertility by Education by Marriage Status in Alum Creek
| Educational Attainment | Married | Unmarried |
| Less than High School | 0 (0.0%) | 0 (0.0%) |
| High School Diploma | 0 (0.0%) | 0 (0.0%) |
| College or Associate's Degree | 0 (0.0%) | 0 (0.0%) |
| Bachelor's Degree | 0 (0.0%) | 0 (0.0%) |
| Graduate Degree | 0 (0.0%) | 0 (0.0%) |
| Total | 0 (0.0%) | 0 (0.0%) |
Employment Characteristics in Alum Creek
Employment by Class of Employer in Alum Creek
Among the 610 employed individuals in Alum Creek, private company employees (501 | 82.1%), state government employees (48 | 7.9%), and local government employees (46 | 7.5%) make up the most common classes of employment.
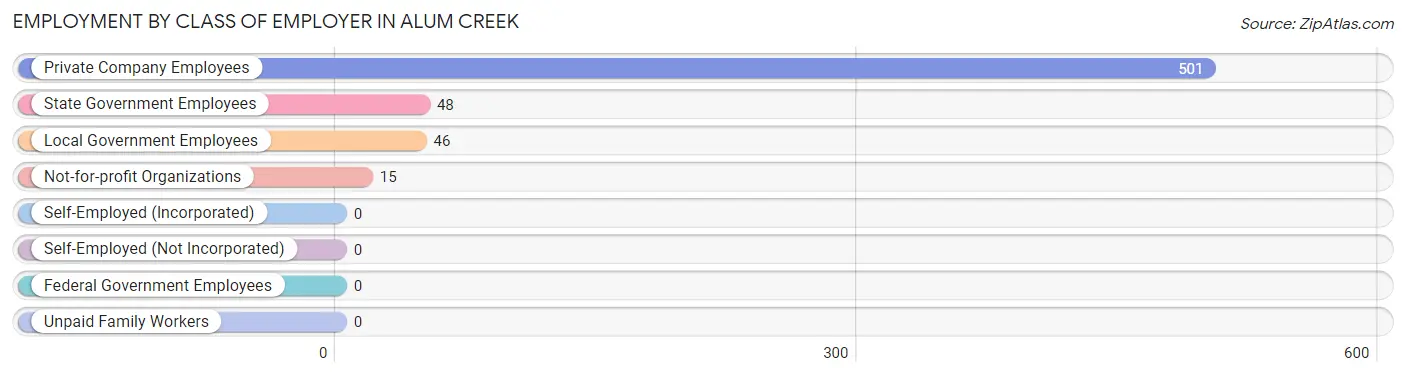
| Employer Class | # Employees | % Employees |
| Private Company Employees | 501 | 82.1% |
| Self-Employed (Incorporated) | 0 | 0.0% |
| Self-Employed (Not Incorporated) | 0 | 0.0% |
| Not-for-profit Organizations | 15 | 2.5% |
| Local Government Employees | 46 | 7.5% |
| State Government Employees | 48 | 7.9% |
| Federal Government Employees | 0 | 0.0% |
| Unpaid Family Workers | 0 | 0.0% |
| Total | 610 | 100.0% |
Employment Status by Age in Alum Creek
According to the labor force statistics for Alum Creek, out of the total population over 16 years of age (1,269), 54.3% or 689 individuals are in the labor force, with 11.5% or 79 of them unemployed. The age group with the highest labor force participation rate is 20 to 24 years, with 100.0% or 44 individuals in the labor force. Within the labor force, the 20 to 24 years age range has the highest percentage of unemployed individuals, with 100.0% or 44 of them being unemployed.
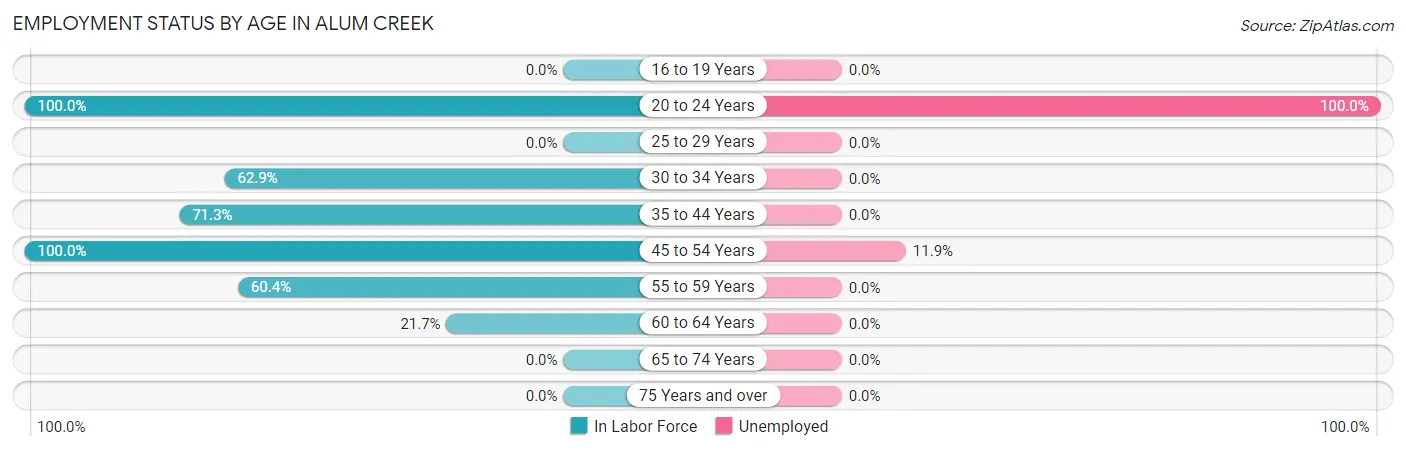
| Age Bracket | In Labor Force | Unemployed |
| 16 to 19 Years | 0 (0.0%) | 0 (0.0%) |
| 20 to 24 Years | 44 (100.0%) | 44 (100.0%) |
| 25 to 29 Years | 0 (0.0%) | 0 (0.0%) |
| 30 to 34 Years | 61 (62.9%) | 0 (0.0%) |
| 35 to 44 Years | 204 (71.3%) | 0 (0.0%) |
| 45 to 54 Years | 293 (100.0%) | 35 (11.9%) |
| 55 to 59 Years | 67 (60.4%) | 0 (0.0%) |
| 60 to 64 Years | 20 (21.7%) | 0 (0.0%) |
| 65 to 74 Years | 0 (0.0%) | 0 (0.0%) |
| 75 Years and over | 0 (0.0%) | 0 (0.0%) |
| Total | 689 (54.3%) | 79 (11.5%) |
Employment Status by Educational Attainment in Alum Creek
According to labor force statistics for Alum Creek, 73.4% of individuals (645) out of the total population between 25 and 64 years of age (879) are in the labor force, with 5.4% or 35 of them being unemployed. The group with the highest labor force participation rate are those with the educational attainment of less than high school, with 100.0% or 44 individuals in the labor force. Within the labor force, individuals with college / associate degree education have the highest percentage of unemployment, with 11.6% or 35 of them being unemployed.
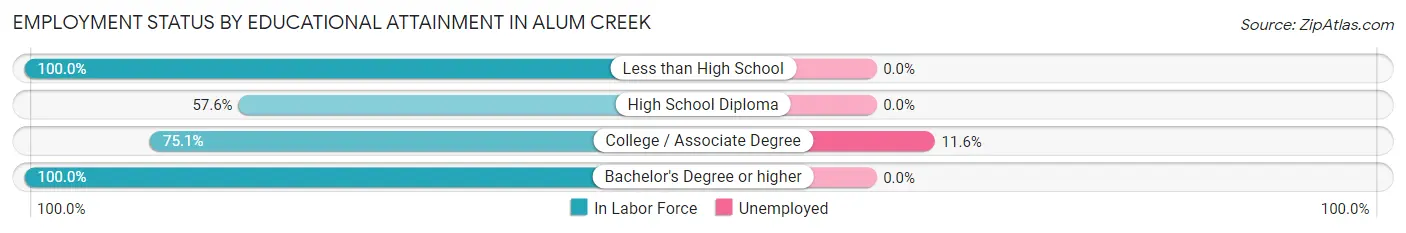
| Educational Attainment | In Labor Force | Unemployed |
| Less than High School | 44 (100.0%) | 0 (0.0%) |
| High School Diploma | 182 (57.6%) | 0 (0.0%) |
| College / Associate Degree | 301 (75.1%) | 47 (11.6%) |
| Bachelor's Degree or higher | 118 (100.0%) | 0 (0.0%) |
| Total | 645 (73.4%) | 47 (5.4%) |
Employment Occupations by Sex in Alum Creek
Management, Business, Science and Arts Occupations
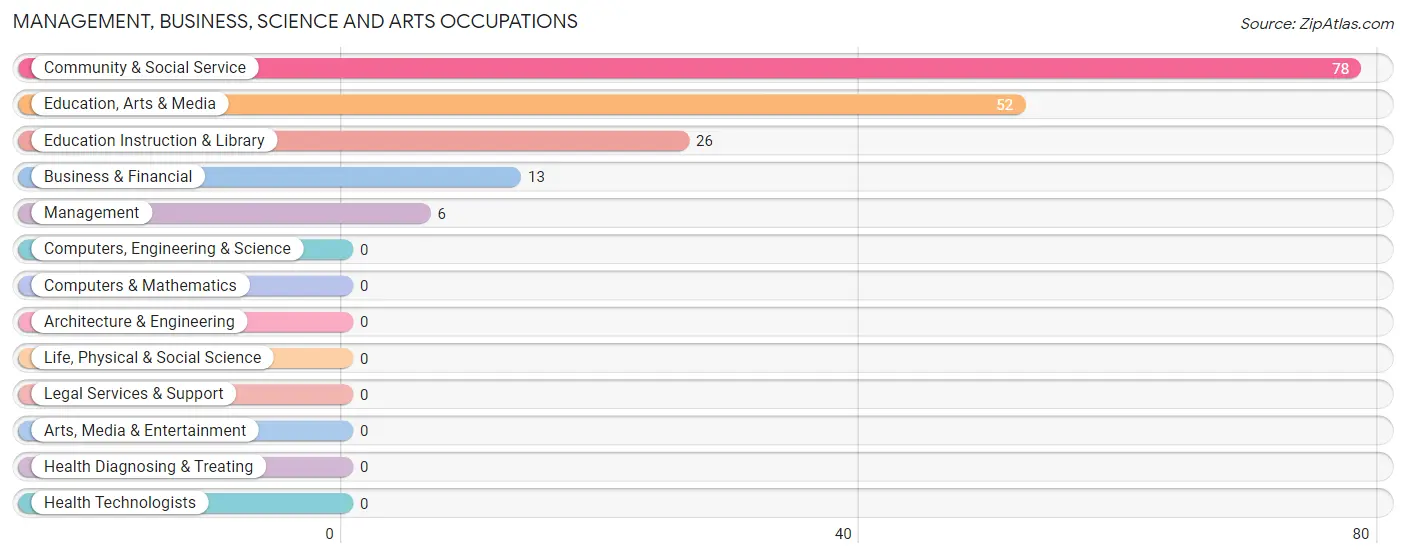
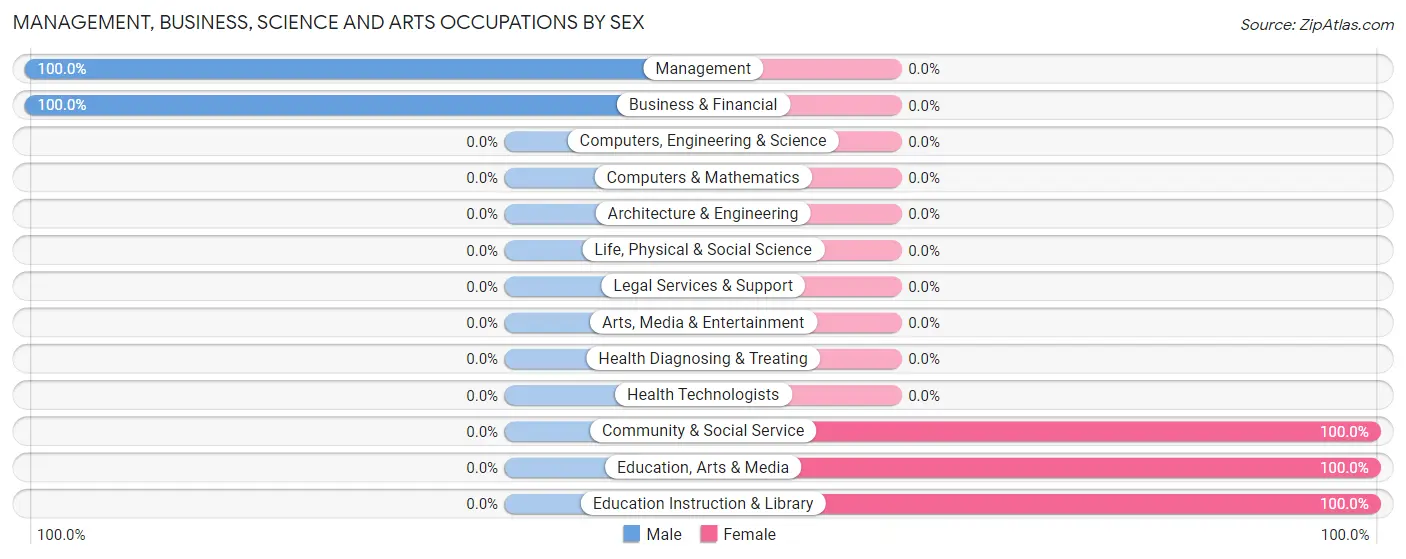
The most common Management, Business, Science and Arts occupations in Alum Creek are Community & Social Service (78 | 12.8%), Education, Arts & Media (52 | 8.5%), Education Instruction & Library (26 | 4.3%), Business & Financial (13 | 2.1%), and Management (6 | 1.0%).
Management, Business, Science and Arts Occupations by Sex
Within the Management, Business, Science and Arts occupations in Alum Creek, the most male-oriented occupations are Management (100.0%), and Business & Financial (100.0%), while the most female-oriented occupations are Community & Social Service (100.0%), Education, Arts & Media (100.0%), and Education Instruction & Library (100.0%).
| Occupation | Male | Female |
| Management | 6 (100.0%) | 0 (0.0%) |
| Business & Financial | 13 (100.0%) | 0 (0.0%) |
| Computers, Engineering & Science | 0 (0.0%) | 0 (0.0%) |
| Computers & Mathematics | 0 (0.0%) | 0 (0.0%) |
| Architecture & Engineering | 0 (0.0%) | 0 (0.0%) |
| Life, Physical & Social Science | 0 (0.0%) | 0 (0.0%) |
| Community & Social Service | 0 (0.0%) | 78 (100.0%) |
| Education, Arts & Media | 0 (0.0%) | 52 (100.0%) |
| Legal Services & Support | 0 (0.0%) | 0 (0.0%) |
| Education Instruction & Library | 0 (0.0%) | 26 (100.0%) |
| Arts, Media & Entertainment | 0 (0.0%) | 0 (0.0%) |
| Health Diagnosing & Treating | 0 (0.0%) | 0 (0.0%) |
| Health Technologists | 0 (0.0%) | 0 (0.0%) |
| Total (Category) | 19 (19.6%) | 78 (80.4%) |
| Total (Overall) | 367 (60.2%) | 243 (39.8%) |
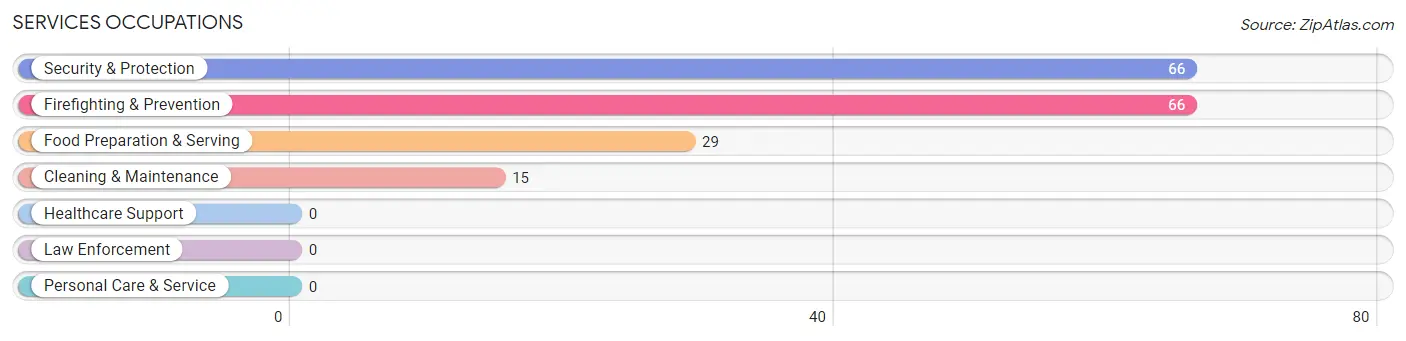
Services Occupations
The most common Services occupations in Alum Creek are Security & Protection (66 | 10.8%), Firefighting & Prevention (66 | 10.8%), Food Preparation & Serving (29 | 4.8%), and Cleaning & Maintenance (15 | 2.5%).
Services Occupations by Sex
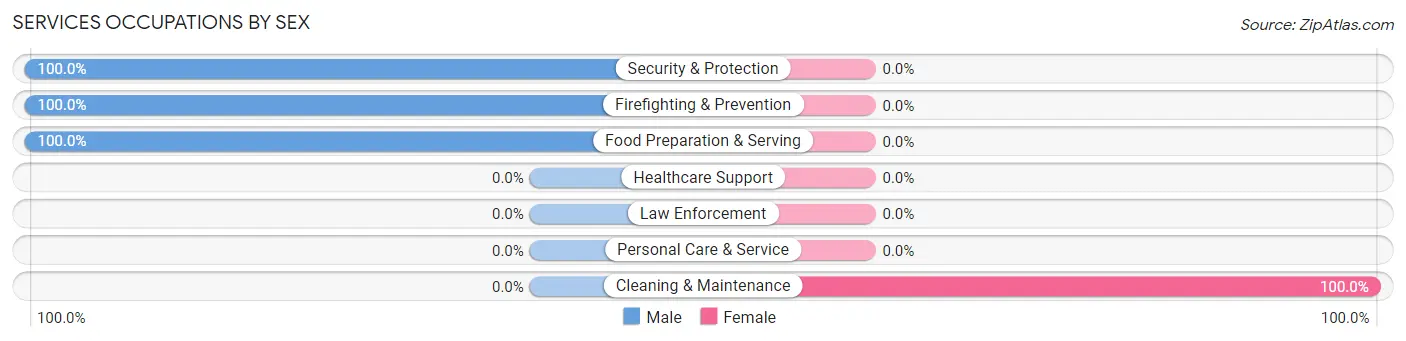
| Occupation | Male | Female |
| Healthcare Support | 0 (0.0%) | 0 (0.0%) |
| Security & Protection | 66 (100.0%) | 0 (0.0%) |
| Firefighting & Prevention | 66 (100.0%) | 0 (0.0%) |
| Law Enforcement | 0 (0.0%) | 0 (0.0%) |
| Food Preparation & Serving | 29 (100.0%) | 0 (0.0%) |
| Cleaning & Maintenance | 0 (0.0%) | 15 (100.0%) |
| Personal Care & Service | 0 (0.0%) | 0 (0.0%) |
| Total (Category) | 95 (86.4%) | 15 (13.6%) |
| Total (Overall) | 367 (60.2%) | 243 (39.8%) |
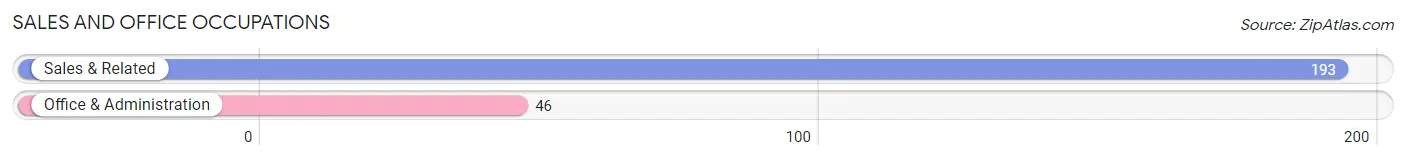
Sales and Office Occupations
The most common Sales and Office occupations in Alum Creek are Sales & Related (193 | 31.6%), and Office & Administration (46 | 7.5%).
Sales and Office Occupations by Sex

| Occupation | Male | Female |
| Sales & Related | 113 (58.6%) | 80 (41.4%) |
| Office & Administration | 0 (0.0%) | 46 (100.0%) |
| Total (Category) | 113 (47.3%) | 126 (52.7%) |
| Total (Overall) | 367 (60.2%) | 243 (39.8%) |
Natural Resources, Construction and Maintenance Occupations
The most common Natural Resources, Construction and Maintenance occupations in Alum Creek are , and Construction & Extraction (50 | 8.2%).
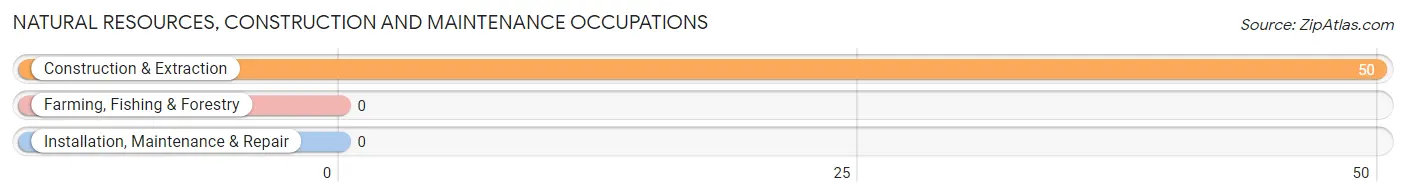
Natural Resources, Construction and Maintenance Occupations by Sex
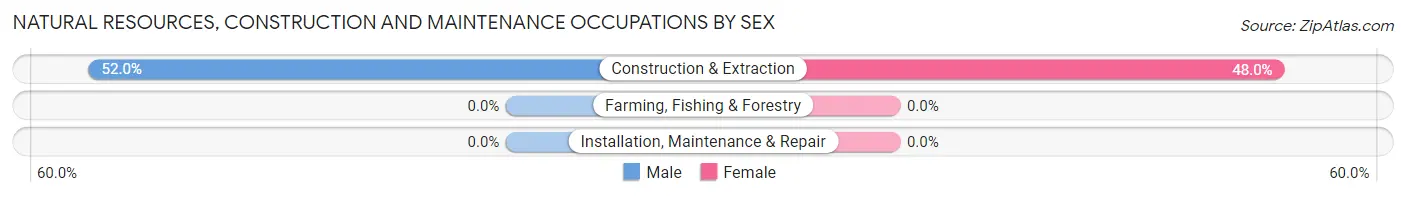
| Occupation | Male | Female |
| Farming, Fishing & Forestry | 0 (0.0%) | 0 (0.0%) |
| Construction & Extraction | 26 (52.0%) | 24 (48.0%) |
| Installation, Maintenance & Repair | 0 (0.0%) | 0 (0.0%) |
| Total (Category) | 26 (52.0%) | 24 (48.0%) |
| Total (Overall) | 367 (60.2%) | 243 (39.8%) |
Production, Transportation and Moving Occupations
The most common Production, Transportation and Moving occupations in Alum Creek are Production (95 | 15.6%), and Transportation (19 | 3.1%).
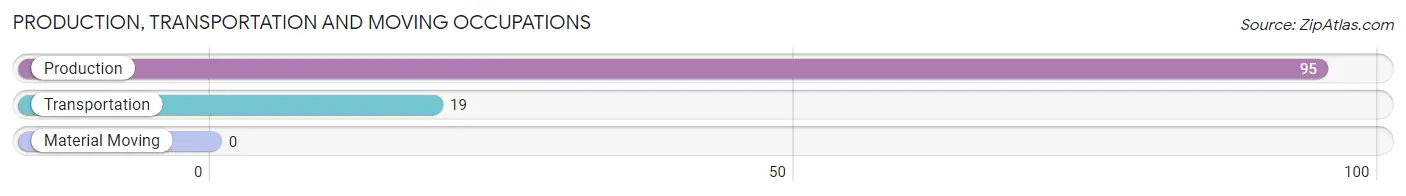
Production, Transportation and Moving Occupations by Sex
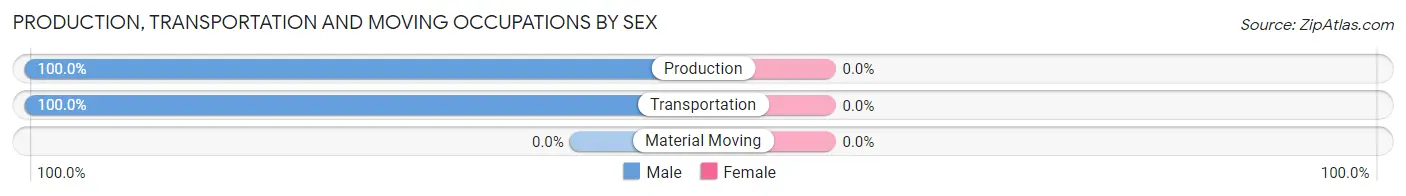
| Occupation | Male | Female |
| Production | 95 (100.0%) | 0 (0.0%) |
| Transportation | 19 (100.0%) | 0 (0.0%) |
| Material Moving | 0 (0.0%) | 0 (0.0%) |
| Total (Category) | 114 (100.0%) | 0 (0.0%) |
| Total (Overall) | 367 (60.2%) | 243 (39.8%) |
Employment Industries by Sex in Alum Creek
Employment Industries in Alum Creek
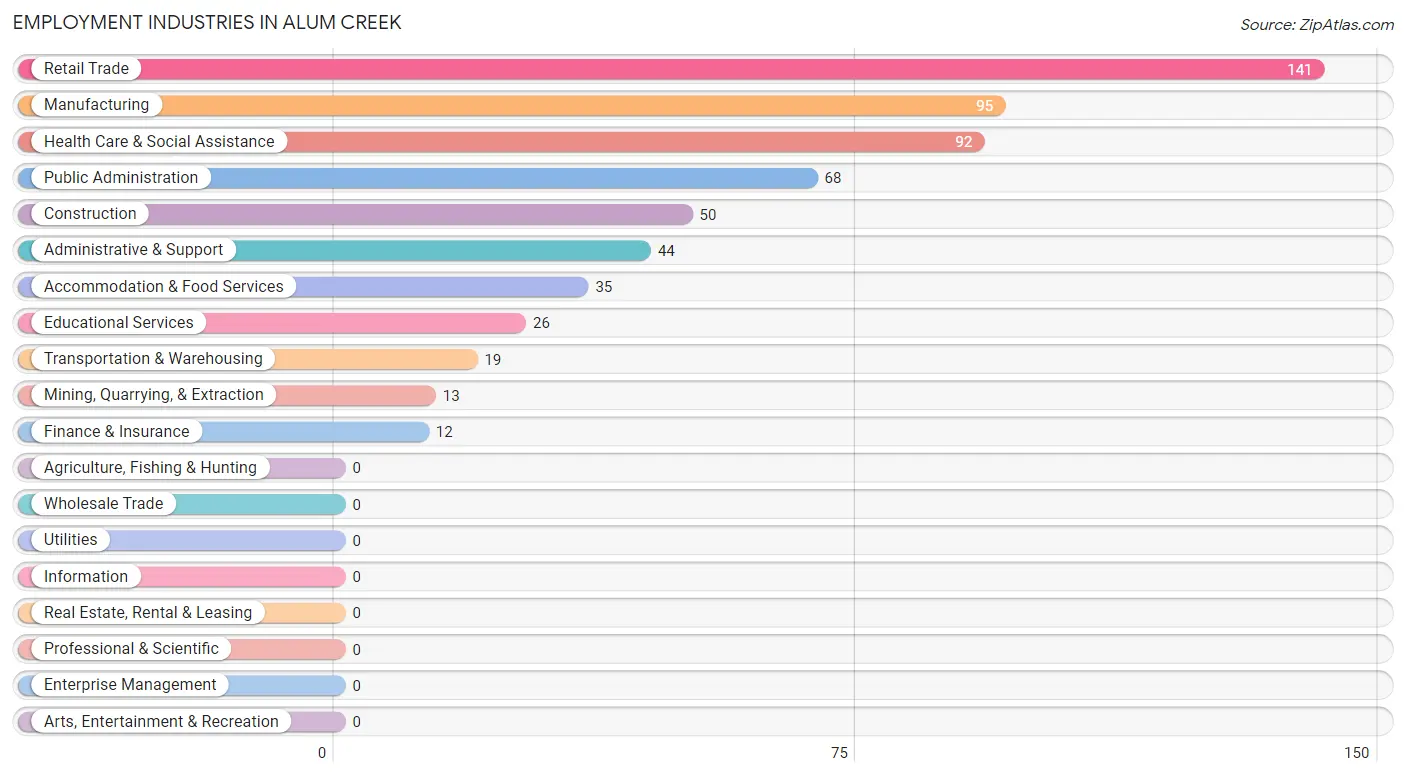
The major employment industries in Alum Creek include Retail Trade (141 | 23.1%), Manufacturing (95 | 15.6%), Health Care & Social Assistance (92 | 15.1%), Public Administration (68 | 11.2%), and Construction (50 | 8.2%).
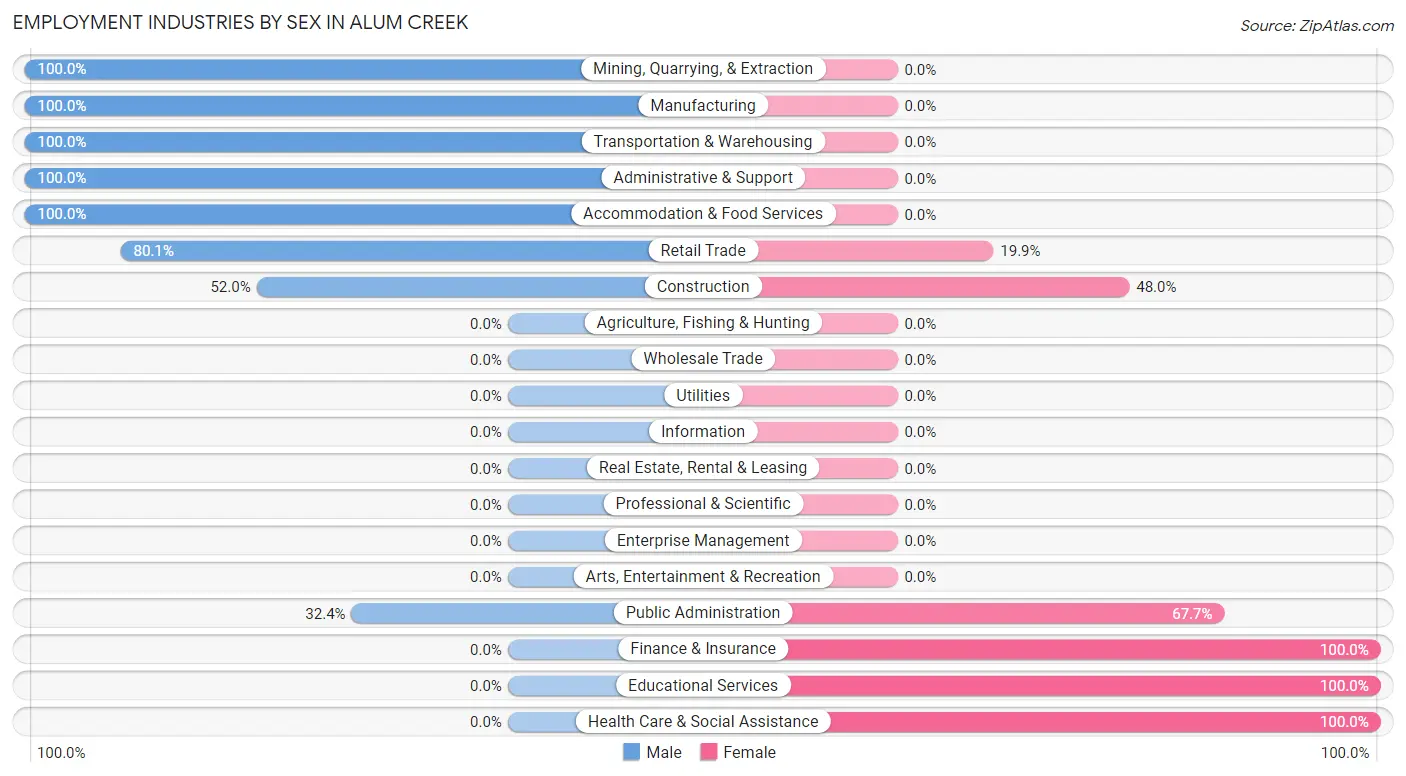
Employment Industries by Sex in Alum Creek
The Alum Creek industries that see more men than women are Mining, Quarrying, & Extraction (100.0%), Manufacturing (100.0%), and Transportation & Warehousing (100.0%), whereas the industries that tend to have a higher number of women are Finance & Insurance (100.0%), Educational Services (100.0%), and Health Care & Social Assistance (100.0%).
| Industry | Male | Female |
| Agriculture, Fishing & Hunting | 0 (0.0%) | 0 (0.0%) |
| Mining, Quarrying, & Extraction | 13 (100.0%) | 0 (0.0%) |
| Construction | 26 (52.0%) | 24 (48.0%) |
| Manufacturing | 95 (100.0%) | 0 (0.0%) |
| Wholesale Trade | 0 (0.0%) | 0 (0.0%) |
| Retail Trade | 113 (80.1%) | 28 (19.9%) |
| Transportation & Warehousing | 19 (100.0%) | 0 (0.0%) |
| Utilities | 0 (0.0%) | 0 (0.0%) |
| Information | 0 (0.0%) | 0 (0.0%) |
| Finance & Insurance | 0 (0.0%) | 12 (100.0%) |
| Real Estate, Rental & Leasing | 0 (0.0%) | 0 (0.0%) |
| Professional & Scientific | 0 (0.0%) | 0 (0.0%) |
| Enterprise Management | 0 (0.0%) | 0 (0.0%) |
| Administrative & Support | 44 (100.0%) | 0 (0.0%) |
| Educational Services | 0 (0.0%) | 26 (100.0%) |
| Health Care & Social Assistance | 0 (0.0%) | 92 (100.0%) |
| Arts, Entertainment & Recreation | 0 (0.0%) | 0 (0.0%) |
| Accommodation & Food Services | 35 (100.0%) | 0 (0.0%) |
| Public Administration | 22 (32.4%) | 46 (67.6%) |
| Total | 367 (60.2%) | 243 (39.8%) |
Education in Alum Creek
School Enrollment in Alum Creek
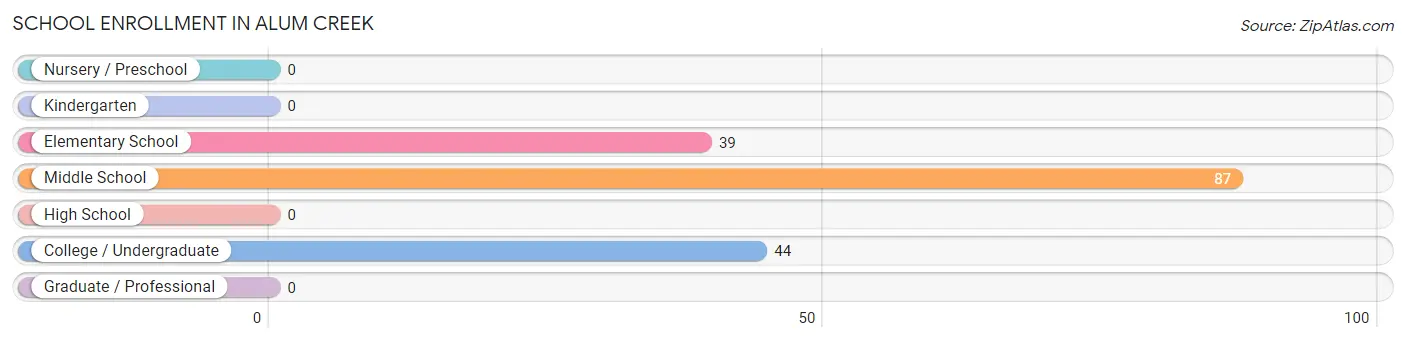
The most common levels of schooling among the 170 students in Alum Creek are middle school (87 | 51.2%), college / undergraduate (44 | 25.9%), and elementary school (39 | 22.9%).
| School Level | # Students | % Students |
| Nursery / Preschool | 0 | 0.0% |
| Kindergarten | 0 | 0.0% |
| Elementary School | 39 | 22.9% |
| Middle School | 87 | 51.2% |
| High School | 0 | 0.0% |
| College / Undergraduate | 44 | 25.9% |
| Graduate / Professional | 0 | 0.0% |
| Total | 170 | 100.0% |
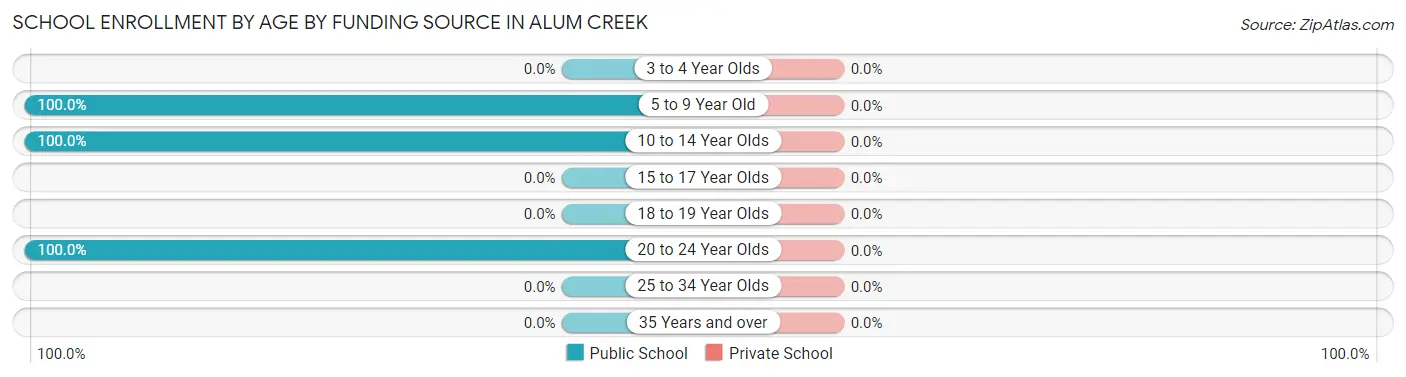
School Enrollment by Age by Funding Source in Alum Creek
| Age Bracket | Public School | Private School |
| 3 to 4 Year Olds | 0 (0.0%) | 0 (0.0%) |
| 5 to 9 Year Old | 39 (100.0%) | 0 (0.0%) |
| 10 to 14 Year Olds | 87 (100.0%) | 0 (0.0%) |
| 15 to 17 Year Olds | 0 (0.0%) | 0 (0.0%) |
| 18 to 19 Year Olds | 0 (0.0%) | 0 (0.0%) |
| 20 to 24 Year Olds | 44 (100.0%) | 0 (0.0%) |
| 25 to 34 Year Olds | 0 (0.0%) | 0 (0.0%) |
| 35 Years and over | 0 (0.0%) | 0 (0.0%) |
| Total | 170 (100.0%) | 0 (0.0%) |
Educational Attainment by Field of Study in Alum Creek
Arts & humanities (66 | 33.2%), psychology (61 | 30.6%), education (32 | 16.1%), business (31 | 15.6%), and literature & languages (9 | 4.5%) are the most common fields of study among 199 individuals in Alum Creek who have obtained a bachelor's degree or higher.
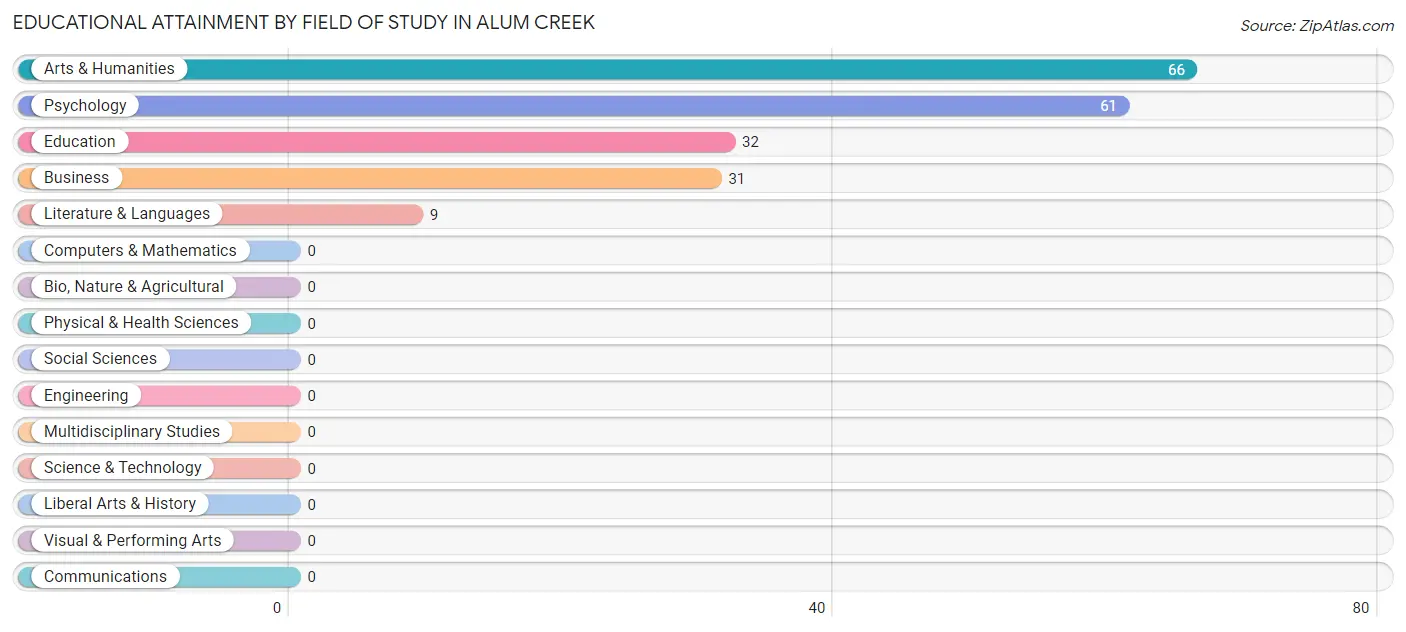
| Field of Study | # Graduates | % Graduates |
| Computers & Mathematics | 0 | 0.0% |
| Bio, Nature & Agricultural | 0 | 0.0% |
| Physical & Health Sciences | 0 | 0.0% |
| Psychology | 61 | 30.6% |
| Social Sciences | 0 | 0.0% |
| Engineering | 0 | 0.0% |
| Multidisciplinary Studies | 0 | 0.0% |
| Science & Technology | 0 | 0.0% |
| Business | 31 | 15.6% |
| Education | 32 | 16.1% |
| Literature & Languages | 9 | 4.5% |
| Liberal Arts & History | 0 | 0.0% |
| Visual & Performing Arts | 0 | 0.0% |
| Communications | 0 | 0.0% |
| Arts & Humanities | 66 | 33.2% |
| Total | 199 | 100.0% |
Transportation & Commute in Alum Creek
Vehicle Availability by Sex in Alum Creek
The most prevalent vehicle ownership categories in Alum Creek are males with 2 vehicles (245, accounting for 66.8%) and females with 2 vehicles (93, making up 100.8%).
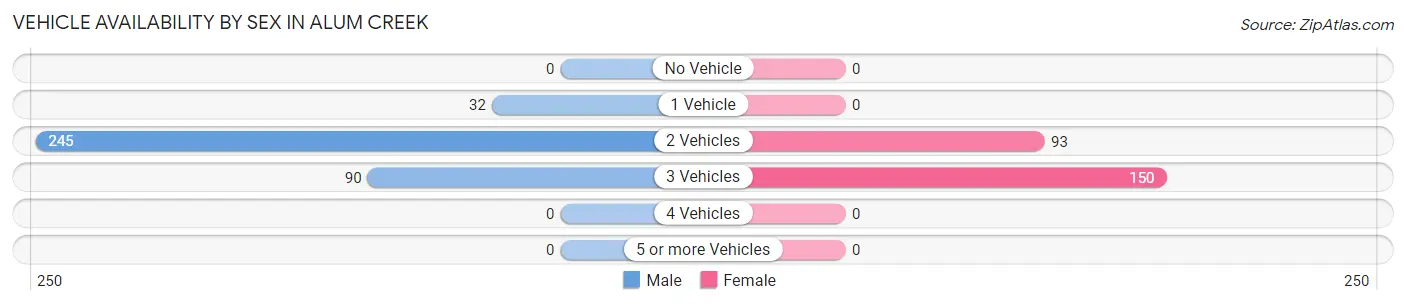
| Vehicles Available | Male | Female |
| No Vehicle | 0 (0.0%) | 0 (0.0%) |
| 1 Vehicle | 32 (8.7%) | 0 (0.0%) |
| 2 Vehicles | 245 (66.8%) | 93 (38.3%) |
| 3 Vehicles | 90 (24.5%) | 150 (61.7%) |
| 4 Vehicles | 0 (0.0%) | 0 (0.0%) |
| 5 or more Vehicles | 0 (0.0%) | 0 (0.0%) |
| Total | 367 (100.0%) | 243 (100.0%) |
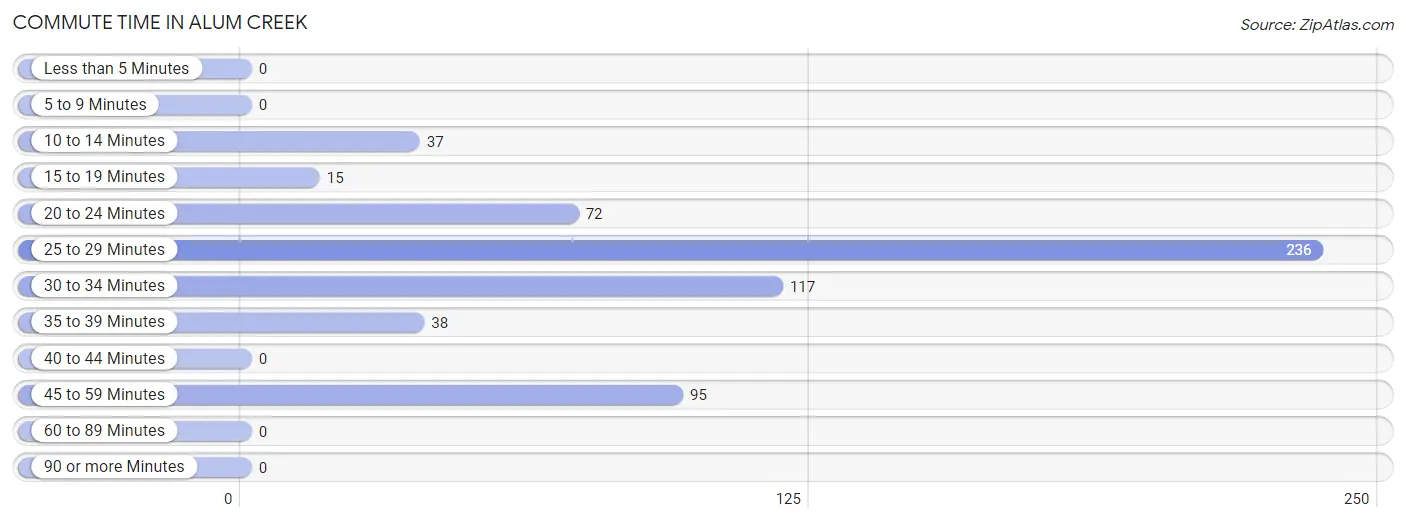
Commute Time in Alum Creek
The most frequently occuring commute durations in Alum Creek are 25 to 29 minutes (236 commuters, 38.7%), 30 to 34 minutes (117 commuters, 19.2%), and 45 to 59 minutes (95 commuters, 15.6%).
| Commute Time | # Commuters | % Commuters |
| Less than 5 Minutes | 0 | 0.0% |
| 5 to 9 Minutes | 0 | 0.0% |
| 10 to 14 Minutes | 37 | 6.1% |
| 15 to 19 Minutes | 15 | 2.5% |
| 20 to 24 Minutes | 72 | 11.8% |
| 25 to 29 Minutes | 236 | 38.7% |
| 30 to 34 Minutes | 117 | 19.2% |
| 35 to 39 Minutes | 38 | 6.2% |
| 40 to 44 Minutes | 0 | 0.0% |
| 45 to 59 Minutes | 95 | 15.6% |
| 60 to 89 Minutes | 0 | 0.0% |
| 90 or more Minutes | 0 | 0.0% |
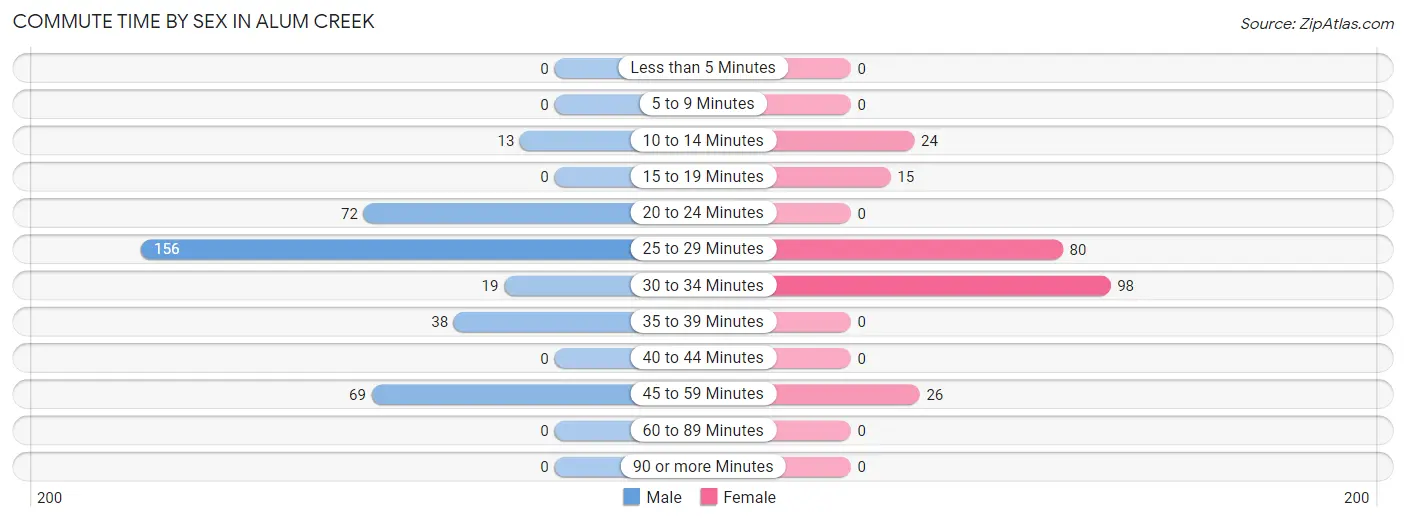
Commute Time by Sex in Alum Creek
The most common commute times in Alum Creek are 25 to 29 minutes (156 commuters, 42.5%) for males and 30 to 34 minutes (98 commuters, 40.3%) for females.
| Commute Time | Male | Female |
| Less than 5 Minutes | 0 (0.0%) | 0 (0.0%) |
| 5 to 9 Minutes | 0 (0.0%) | 0 (0.0%) |
| 10 to 14 Minutes | 13 (3.5%) | 24 (9.9%) |
| 15 to 19 Minutes | 0 (0.0%) | 15 (6.2%) |
| 20 to 24 Minutes | 72 (19.6%) | 0 (0.0%) |
| 25 to 29 Minutes | 156 (42.5%) | 80 (32.9%) |
| 30 to 34 Minutes | 19 (5.2%) | 98 (40.3%) |
| 35 to 39 Minutes | 38 (10.3%) | 0 (0.0%) |
| 40 to 44 Minutes | 0 (0.0%) | 0 (0.0%) |
| 45 to 59 Minutes | 69 (18.8%) | 26 (10.7%) |
| 60 to 89 Minutes | 0 (0.0%) | 0 (0.0%) |
| 90 or more Minutes | 0 (0.0%) | 0 (0.0%) |
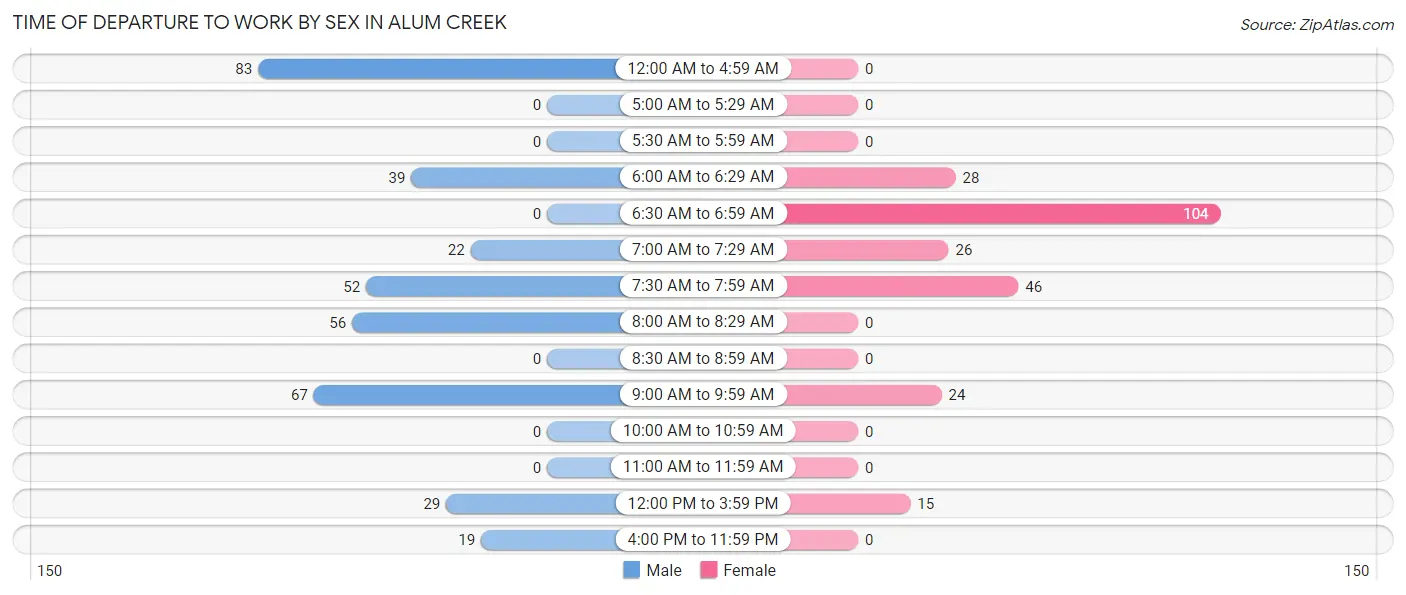
Time of Departure to Work by Sex in Alum Creek
The most frequent times of departure to work in Alum Creek are 12:00 AM to 4:59 AM (83, 22.6%) for males and 6:30 AM to 6:59 AM (104, 42.8%) for females.
| Time of Departure | Male | Female |
| 12:00 AM to 4:59 AM | 83 (22.6%) | 0 (0.0%) |
| 5:00 AM to 5:29 AM | 0 (0.0%) | 0 (0.0%) |
| 5:30 AM to 5:59 AM | 0 (0.0%) | 0 (0.0%) |
| 6:00 AM to 6:29 AM | 39 (10.6%) | 28 (11.5%) |
| 6:30 AM to 6:59 AM | 0 (0.0%) | 104 (42.8%) |
| 7:00 AM to 7:29 AM | 22 (6.0%) | 26 (10.7%) |
| 7:30 AM to 7:59 AM | 52 (14.2%) | 46 (18.9%) |
| 8:00 AM to 8:29 AM | 56 (15.3%) | 0 (0.0%) |
| 8:30 AM to 8:59 AM | 0 (0.0%) | 0 (0.0%) |
| 9:00 AM to 9:59 AM | 67 (18.3%) | 24 (9.9%) |
| 10:00 AM to 10:59 AM | 0 (0.0%) | 0 (0.0%) |
| 11:00 AM to 11:59 AM | 0 (0.0%) | 0 (0.0%) |
| 12:00 PM to 3:59 PM | 29 (7.9%) | 15 (6.2%) |
| 4:00 PM to 11:59 PM | 19 (5.2%) | 0 (0.0%) |
| Total | 367 (100.0%) | 243 (100.0%) |
Housing Occupancy in Alum Creek
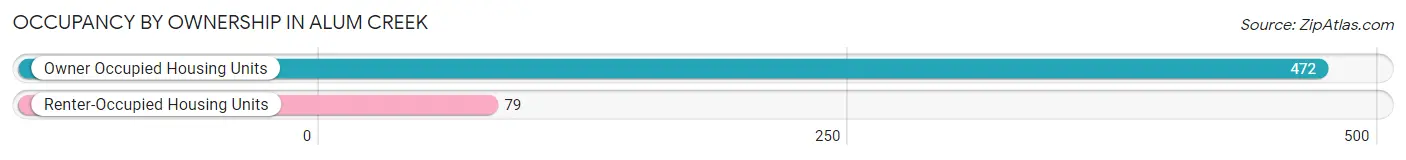
Occupancy by Ownership in Alum Creek
Of the total 551 dwellings in Alum Creek, owner-occupied units account for 472 (85.7%), while renter-occupied units make up 79 (14.3%).
| Occupancy | # Housing Units | % Housing Units |
| Owner Occupied Housing Units | 472 | 85.7% |
| Renter-Occupied Housing Units | 79 | 14.3% |
| Total Occupied Housing Units | 551 | 100.0% |
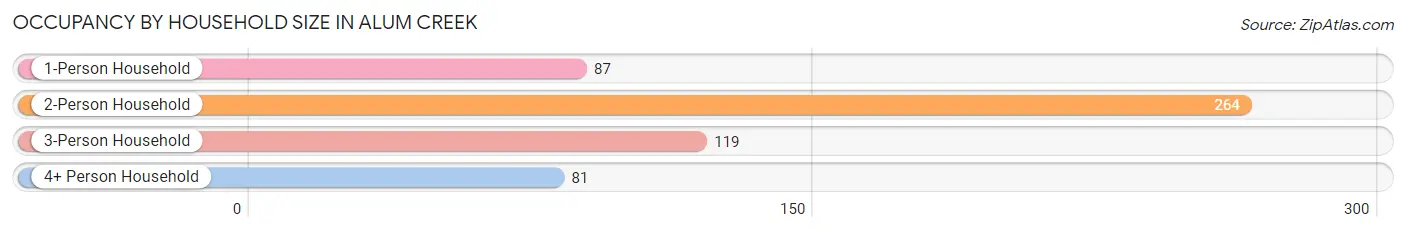
Occupancy by Household Size in Alum Creek
| Household Size | # Housing Units | % Housing Units |
| 1-Person Household | 87 | 15.8% |
| 2-Person Household | 264 | 47.9% |
| 3-Person Household | 119 | 21.6% |
| 4+ Person Household | 81 | 14.7% |
| Total Housing Units | 551 | 100.0% |
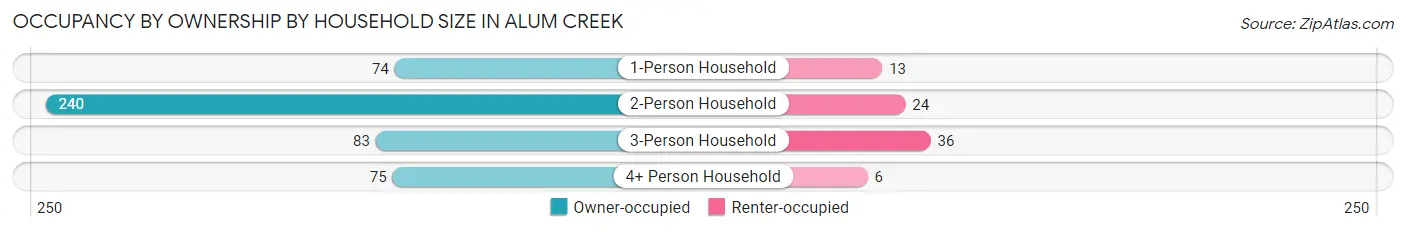
Occupancy by Ownership by Household Size in Alum Creek
| Household Size | Owner-occupied | Renter-occupied |
| 1-Person Household | 74 (85.1%) | 13 (14.9%) |
| 2-Person Household | 240 (90.9%) | 24 (9.1%) |
| 3-Person Household | 83 (69.8%) | 36 (30.2%) |
| 4+ Person Household | 75 (92.6%) | 6 (7.4%) |
| Total Housing Units | 472 (85.7%) | 79 (14.3%) |
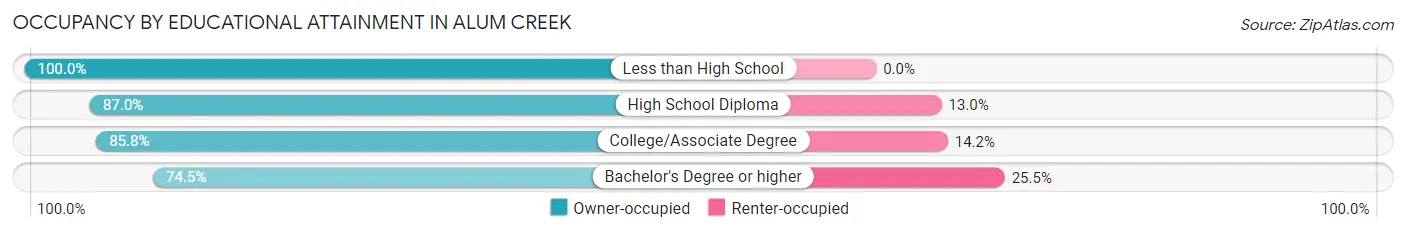
Occupancy by Educational Attainment in Alum Creek
| Household Size | Owner-occupied | Renter-occupied |
| Less than High School | 7 (100.0%) | 0 (0.0%) |
| High School Diploma | 282 (87.0%) | 42 (13.0%) |
| College/Associate Degree | 145 (85.8%) | 24 (14.2%) |
| Bachelor's Degree or higher | 38 (74.5%) | 13 (25.5%) |
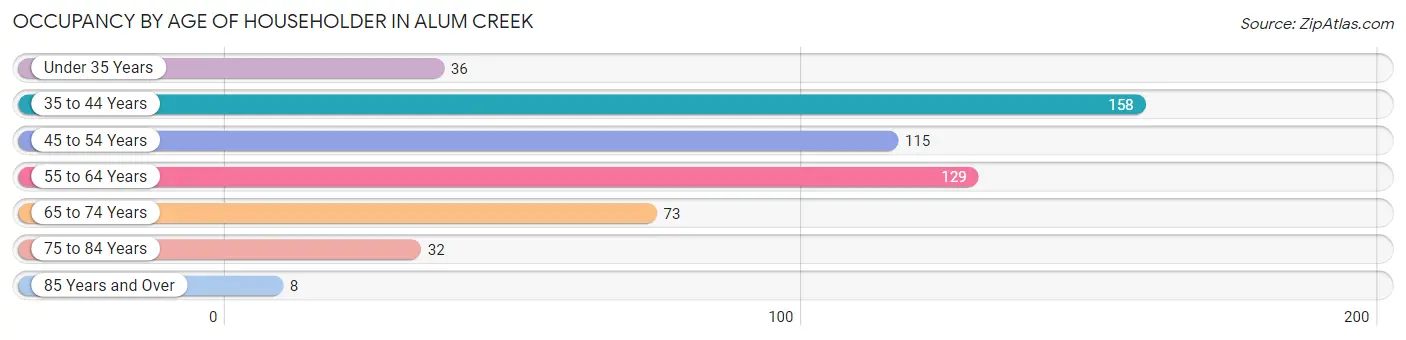
Occupancy by Age of Householder in Alum Creek
| Age Bracket | # Households | % Households |
| Under 35 Years | 36 | 6.5% |
| 35 to 44 Years | 158 | 28.7% |
| 45 to 54 Years | 115 | 20.9% |
| 55 to 64 Years | 129 | 23.4% |
| 65 to 74 Years | 73 | 13.3% |
| 75 to 84 Years | 32 | 5.8% |
| 85 Years and Over | 8 | 1.5% |
| Total | 551 | 100.0% |
Housing Finances in Alum Creek
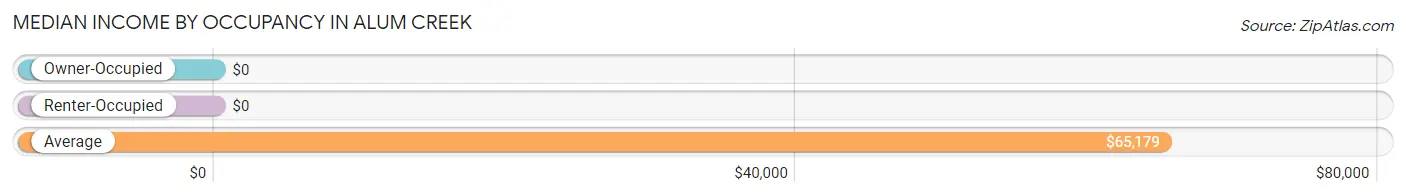
Median Income by Occupancy in Alum Creek
| Occupancy Type | # Households | Median Income |
| Owner-Occupied | 472 (85.7%) | $0 |
| Renter-Occupied | 79 (14.3%) | $0 |
| Average | 551 (100.0%) | $65,179 |
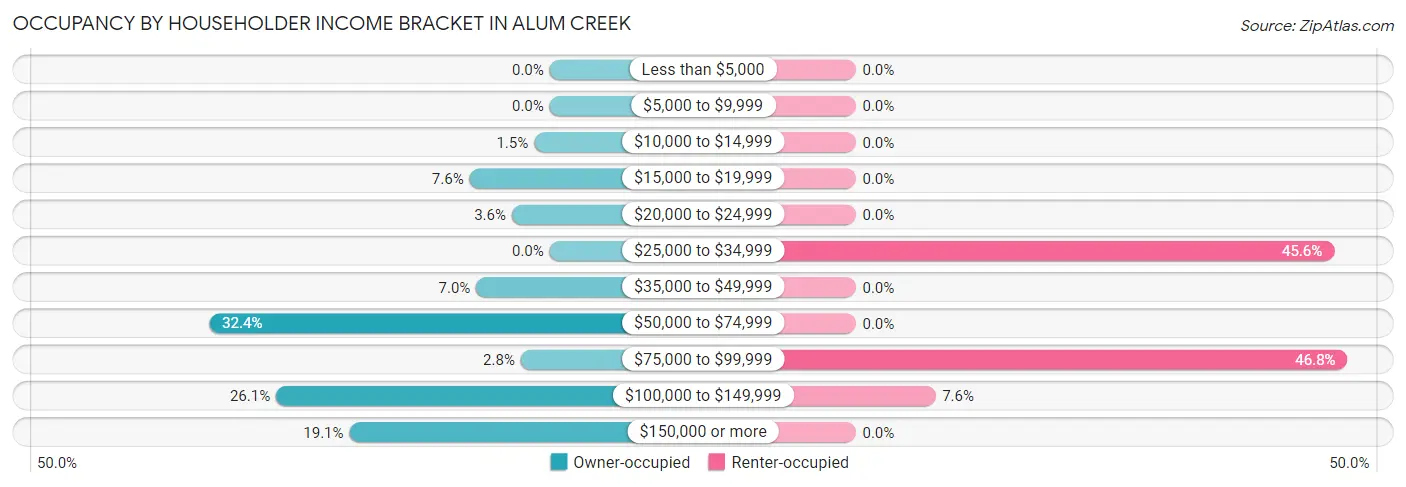
Occupancy by Householder Income Bracket in Alum Creek
| Income Bracket | Owner-occupied | Renter-occupied |
| Less than $5,000 | 0 (0.0%) | 0 (0.0%) |
| $5,000 to $9,999 | 0 (0.0%) | 0 (0.0%) |
| $10,000 to $14,999 | 7 (1.5%) | 0 (0.0%) |
| $15,000 to $19,999 | 36 (7.6%) | 0 (0.0%) |
| $20,000 to $24,999 | 17 (3.6%) | 0 (0.0%) |
| $25,000 to $34,999 | 0 (0.0%) | 36 (45.6%) |
| $35,000 to $49,999 | 33 (7.0%) | 0 (0.0%) |
| $50,000 to $74,999 | 153 (32.4%) | 0 (0.0%) |
| $75,000 to $99,999 | 13 (2.8%) | 37 (46.8%) |
| $100,000 to $149,999 | 123 (26.1%) | 6 (7.6%) |
| $150,000 or more | 90 (19.1%) | 0 (0.0%) |
| Total | 472 (100.0%) | 79 (100.0%) |
Monthly Housing Cost Tiers in Alum Creek
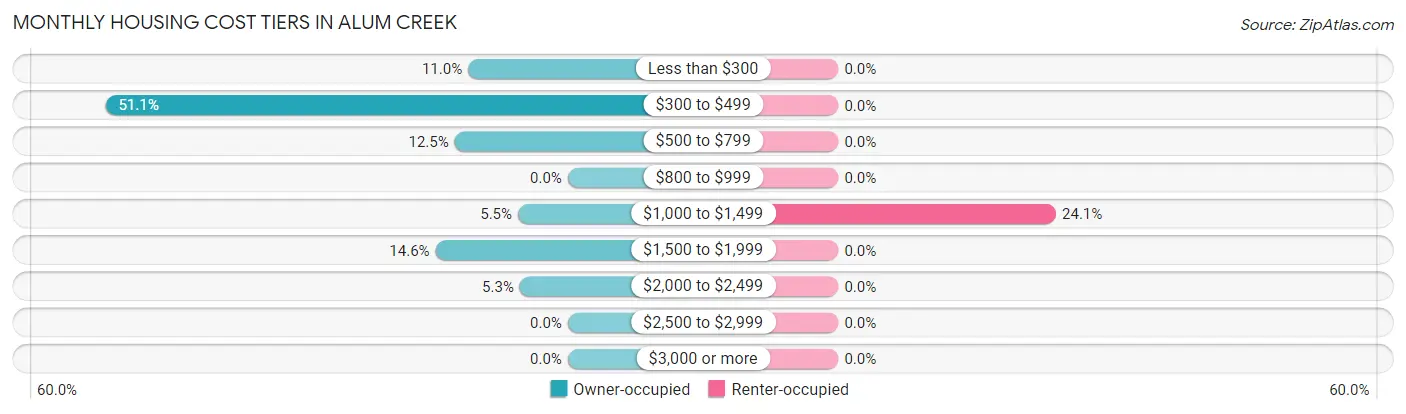
| Monthly Cost | Owner-occupied | Renter-occupied |
| Less than $300 | 52 (11.0%) | 0 (0.0%) |
| $300 to $499 | 241 (51.1%) | 0 (0.0%) |
| $500 to $799 | 59 (12.5%) | 0 (0.0%) |
| $800 to $999 | 0 (0.0%) | 0 (0.0%) |
| $1,000 to $1,499 | 26 (5.5%) | 19 (24.0%) |
| $1,500 to $1,999 | 69 (14.6%) | 0 (0.0%) |
| $2,000 to $2,499 | 25 (5.3%) | 0 (0.0%) |
| $2,500 to $2,999 | 0 (0.0%) | 0 (0.0%) |
| $3,000 or more | 0 (0.0%) | 0 (0.0%) |
| Total | 472 (100.0%) | 79 (100.0%) |
Physical Housing Characteristics in Alum Creek
Housing Structures in Alum Creek
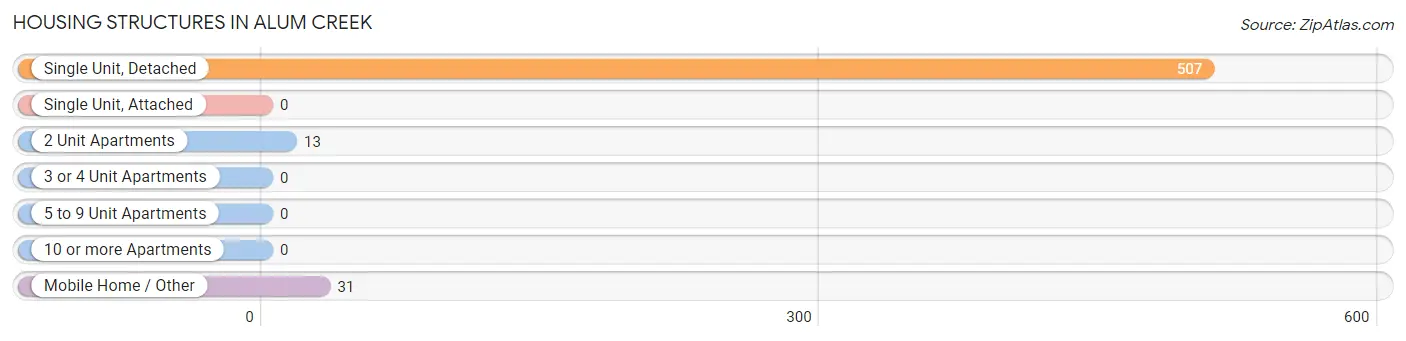
| Structure Type | # Housing Units | % Housing Units |
| Single Unit, Detached | 507 | 92.0% |
| Single Unit, Attached | 0 | 0.0% |
| 2 Unit Apartments | 13 | 2.4% |
| 3 or 4 Unit Apartments | 0 | 0.0% |
| 5 to 9 Unit Apartments | 0 | 0.0% |
| 10 or more Apartments | 0 | 0.0% |
| Mobile Home / Other | 31 | 5.6% |
| Total | 551 | 100.0% |
Housing Structures by Occupancy in Alum Creek
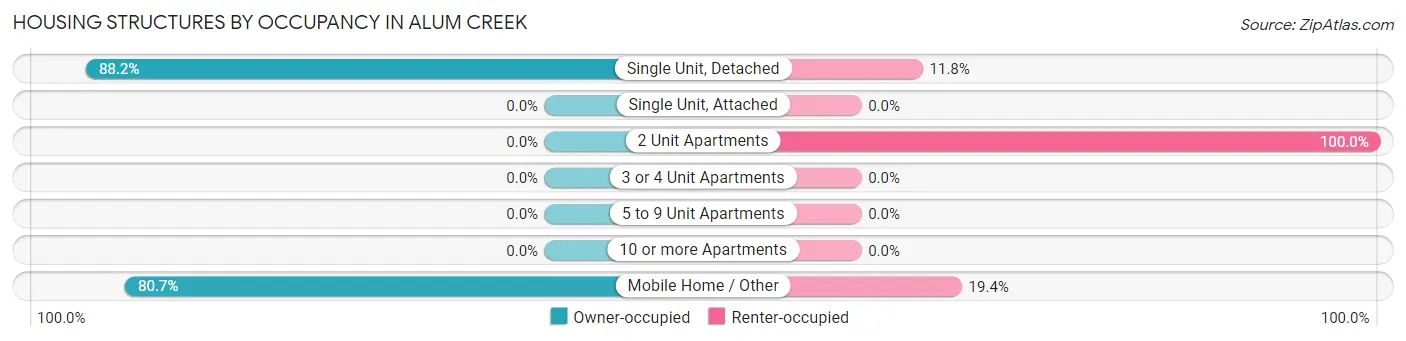
| Structure Type | Owner-occupied | Renter-occupied |
| Single Unit, Detached | 447 (88.2%) | 60 (11.8%) |
| Single Unit, Attached | 0 (0.0%) | 0 (0.0%) |
| 2 Unit Apartments | 0 (0.0%) | 13 (100.0%) |
| 3 or 4 Unit Apartments | 0 (0.0%) | 0 (0.0%) |
| 5 to 9 Unit Apartments | 0 (0.0%) | 0 (0.0%) |
| 10 or more Apartments | 0 (0.0%) | 0 (0.0%) |
| Mobile Home / Other | 25 (80.6%) | 6 (19.4%) |
| Total | 472 (85.7%) | 79 (14.3%) |
Housing Structures by Number of Rooms in Alum Creek
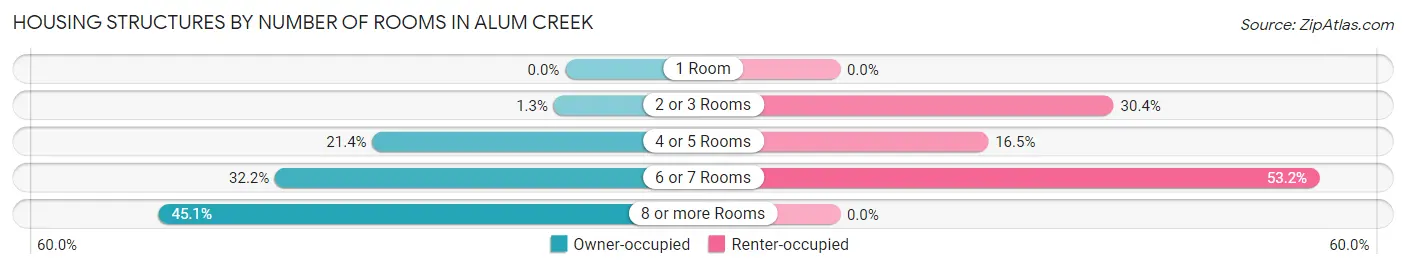
| Number of Rooms | Owner-occupied | Renter-occupied |
| 1 Room | 0 (0.0%) | 0 (0.0%) |
| 2 or 3 Rooms | 6 (1.3%) | 24 (30.4%) |
| 4 or 5 Rooms | 101 (21.4%) | 13 (16.5%) |
| 6 or 7 Rooms | 152 (32.2%) | 42 (53.2%) |
| 8 or more Rooms | 213 (45.1%) | 0 (0.0%) |
| Total | 472 (100.0%) | 79 (100.0%) |
Housing Structure by Heating Type in Alum Creek
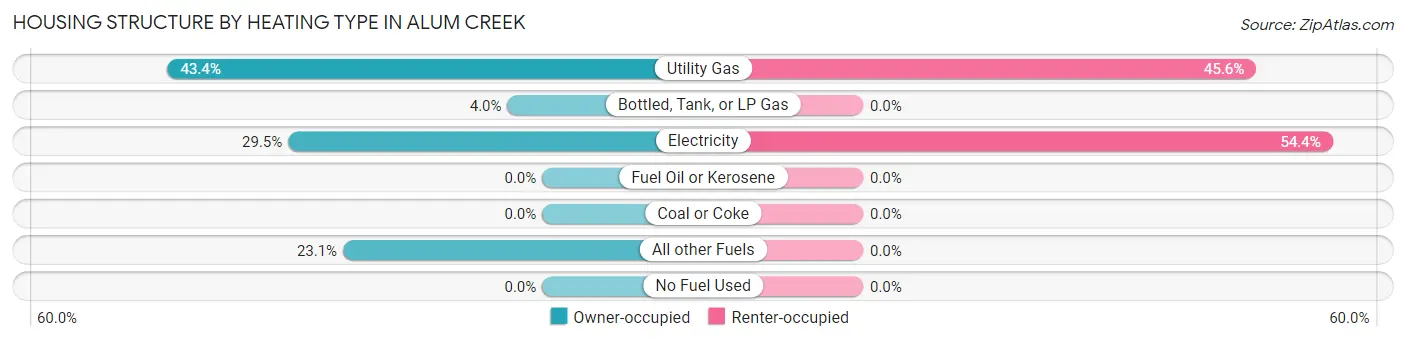
| Heating Type | Owner-occupied | Renter-occupied |
| Utility Gas | 205 (43.4%) | 36 (45.6%) |
| Bottled, Tank, or LP Gas | 19 (4.0%) | 0 (0.0%) |
| Electricity | 139 (29.4%) | 43 (54.4%) |
| Fuel Oil or Kerosene | 0 (0.0%) | 0 (0.0%) |
| Coal or Coke | 0 (0.0%) | 0 (0.0%) |
| All other Fuels | 109 (23.1%) | 0 (0.0%) |
| No Fuel Used | 0 (0.0%) | 0 (0.0%) |
| Total | 472 (100.0%) | 79 (100.0%) |
Household Vehicle Usage in Alum Creek
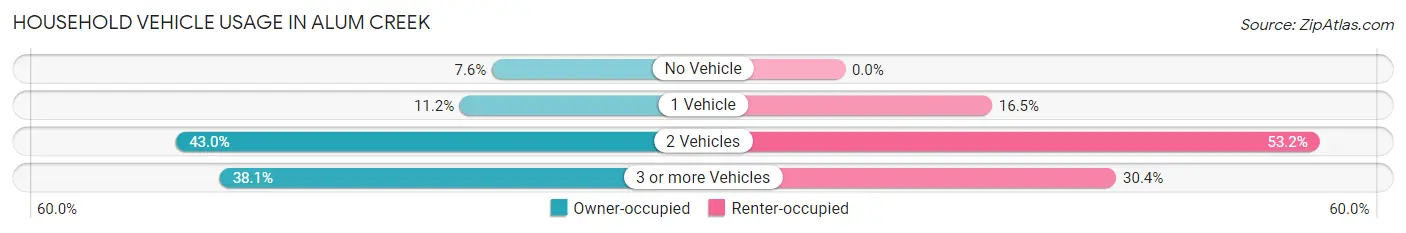
| Vehicles per Household | Owner-occupied | Renter-occupied |
| No Vehicle | 36 (7.6%) | 0 (0.0%) |
| 1 Vehicle | 53 (11.2%) | 13 (16.5%) |
| 2 Vehicles | 203 (43.0%) | 42 (53.2%) |
| 3 or more Vehicles | 180 (38.1%) | 24 (30.4%) |
| Total | 472 (100.0%) | 79 (100.0%) |
Real Estate & Mortgages in Alum Creek
Real Estate and Mortgage Overview in Alum Creek
| Characteristic | Without Mortgage | With Mortgage |
| Housing Units | 286 | 186 |
| Median Property Value | $118,200 | $229,500 |
| Median Household Income | $55,865 | $50 |
| Monthly Housing Costs | $433 | $0 |
| Real Estate Taxes | $563 | $0 |
Property Value by Mortgage Status in Alum Creek
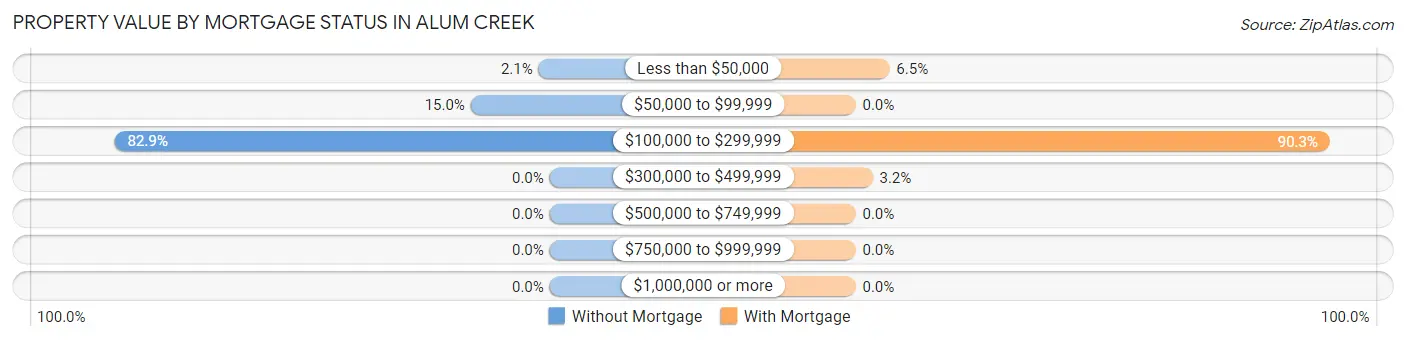
| Property Value | Without Mortgage | With Mortgage |
| Less than $50,000 | 6 (2.1%) | 12 (6.5%) |
| $50,000 to $99,999 | 43 (15.0%) | 0 (0.0%) |
| $100,000 to $299,999 | 237 (82.9%) | 168 (90.3%) |
| $300,000 to $499,999 | 0 (0.0%) | 6 (3.2%) |
| $500,000 to $749,999 | 0 (0.0%) | 0 (0.0%) |
| $750,000 to $999,999 | 0 (0.0%) | 0 (0.0%) |
| $1,000,000 or more | 0 (0.0%) | 0 (0.0%) |
| Total | 286 (100.0%) | 186 (100.0%) |
Household Income by Mortgage Status in Alum Creek
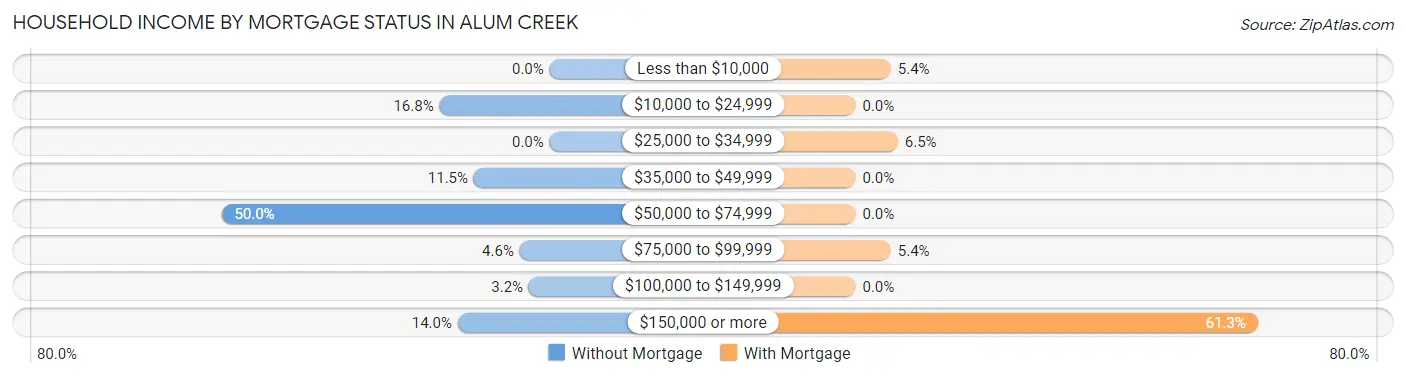
| Household Income | Without Mortgage | With Mortgage |
| Less than $10,000 | 0 (0.0%) | 10 (5.4%) |
| $10,000 to $24,999 | 48 (16.8%) | 0 (0.0%) |
| $25,000 to $34,999 | 0 (0.0%) | 12 (6.5%) |
| $35,000 to $49,999 | 33 (11.5%) | 0 (0.0%) |
| $50,000 to $74,999 | 143 (50.0%) | 0 (0.0%) |
| $75,000 to $99,999 | 13 (4.5%) | 10 (5.4%) |
| $100,000 to $149,999 | 9 (3.2%) | 0 (0.0%) |
| $150,000 or more | 40 (14.0%) | 114 (61.3%) |
| Total | 286 (100.0%) | 186 (100.0%) |
Property Value to Household Income Ratio in Alum Creek
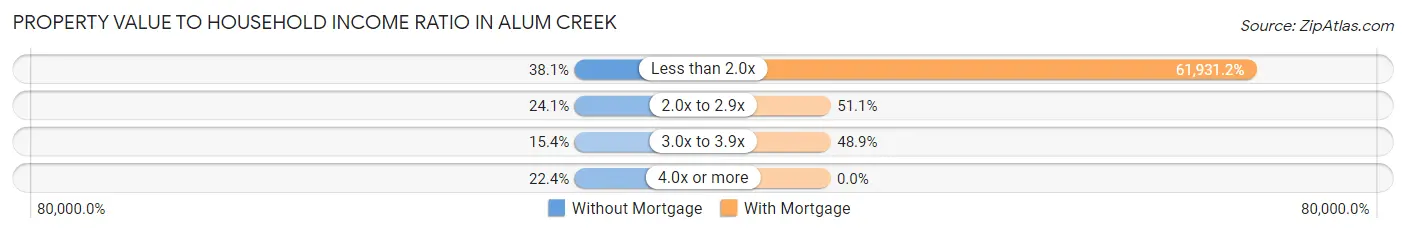
| Value-to-Income Ratio | Without Mortgage | With Mortgage |
| Less than 2.0x | 109 (38.1%) | 115,192 (61,931.2%) |
| 2.0x to 2.9x | 69 (24.1%) | 95 (51.1%) |
| 3.0x to 3.9x | 44 (15.4%) | 91 (48.9%) |
| 4.0x or more | 64 (22.4%) | 0 (0.0%) |
| Total | 286 (100.0%) | 186 (100.0%) |
Real Estate Taxes by Mortgage Status in Alum Creek
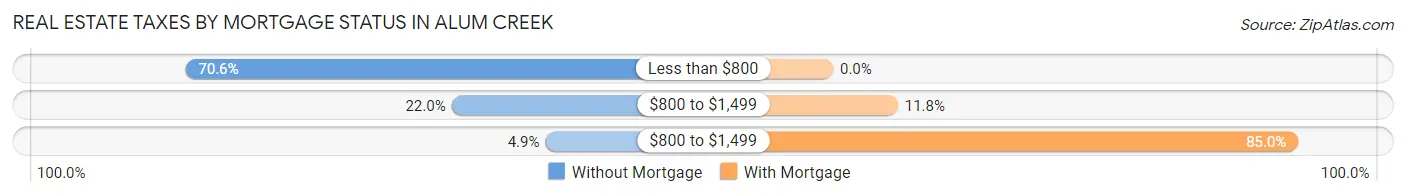
| Property Taxes | Without Mortgage | With Mortgage |
| Less than $800 | 202 (70.6%) | 0 (0.0%) |
| $800 to $1,499 | 63 (22.0%) | 22 (11.8%) |
| $800 to $1,499 | 14 (4.9%) | 158 (85.0%) |
| Total | 286 (100.0%) | 186 (100.0%) |
Health & Disability in Alum Creek
Health Insurance Coverage by Age in Alum Creek
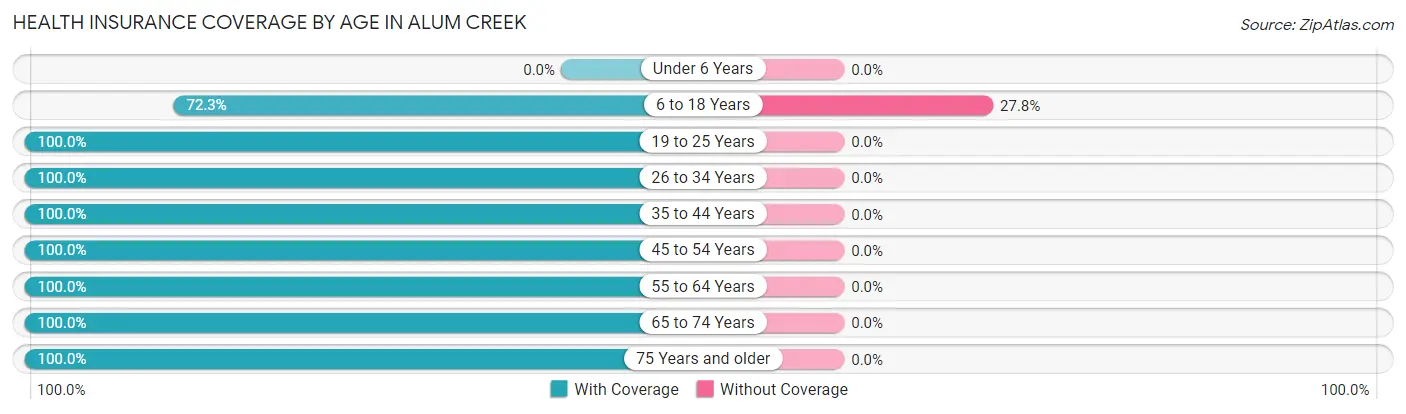
| Age Bracket | With Coverage | Without Coverage |
| Under 6 Years | 0 (0.0%) | 0 (0.0%) |
| 6 to 18 Years | 151 (72.3%) | 58 (27.8%) |
| 19 to 25 Years | 44 (100.0%) | 0 (0.0%) |
| 26 to 34 Years | 97 (100.0%) | 0 (0.0%) |
| 35 to 44 Years | 286 (100.0%) | 0 (0.0%) |
| 45 to 54 Years | 293 (100.0%) | 0 (0.0%) |
| 55 to 64 Years | 203 (100.0%) | 0 (0.0%) |
| 65 to 74 Years | 126 (100.0%) | 0 (0.0%) |
| 75 Years and older | 162 (100.0%) | 0 (0.0%) |
| Total | 1,362 (95.9%) | 58 (4.1%) |
Health Insurance Coverage by Citizenship Status in Alum Creek
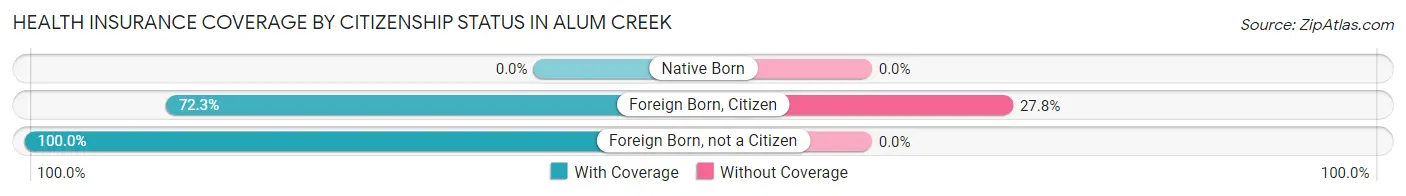
| Citizenship Status | With Coverage | Without Coverage |
| Native Born | 0 (0.0%) | 0 (0.0%) |
| Foreign Born, Citizen | 151 (72.3%) | 58 (27.8%) |
| Foreign Born, not a Citizen | 44 (100.0%) | 0 (0.0%) |
Health Insurance Coverage by Household Income in Alum Creek
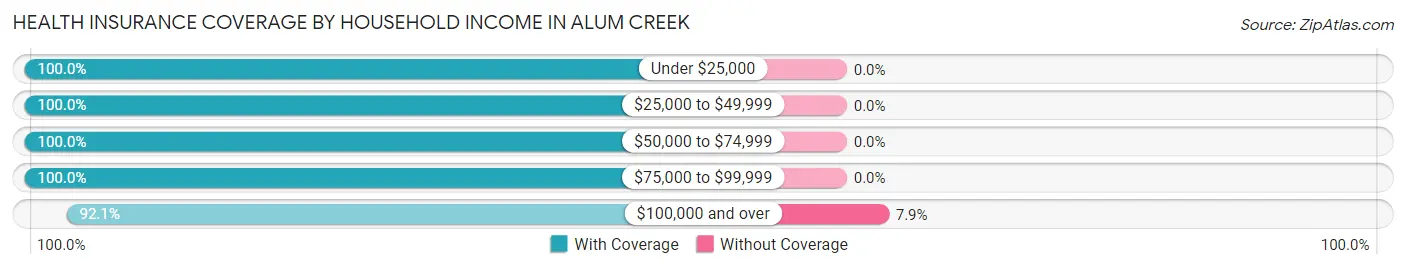
| Household Income | With Coverage | Without Coverage |
| Under $25,000 | 64 (100.0%) | 0 (0.0%) |
| $25,000 to $49,999 | 202 (100.0%) | 0 (0.0%) |
| $50,000 to $74,999 | 281 (100.0%) | 0 (0.0%) |
| $75,000 to $99,999 | 136 (100.0%) | 0 (0.0%) |
| $100,000 and over | 679 (92.1%) | 58 (7.9%) |
Public vs Private Health Insurance Coverage by Age in Alum Creek
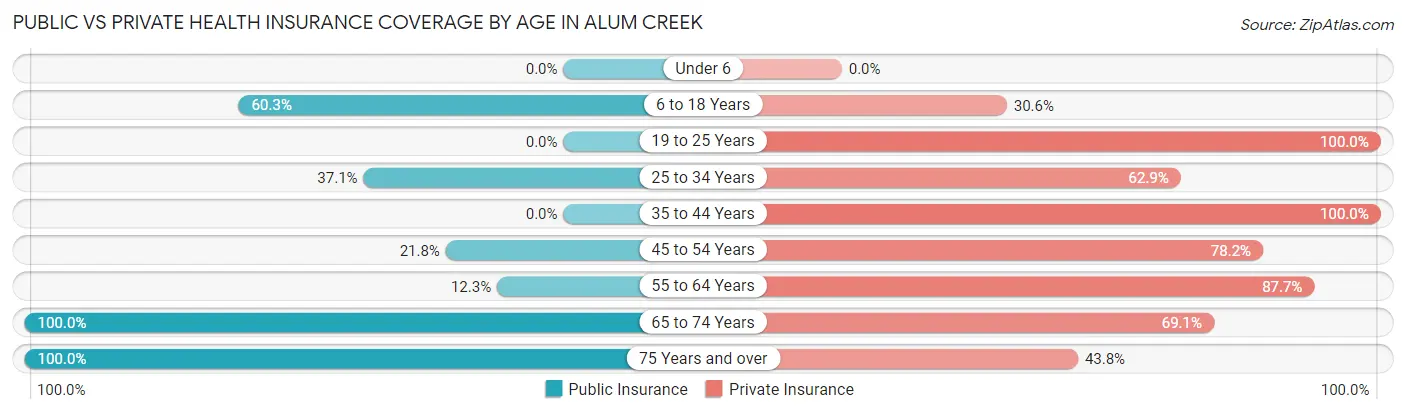
| Age Bracket | Public Insurance | Private Insurance |
| Under 6 | 0 (0.0%) | 0 (0.0%) |
| 6 to 18 Years | 126 (60.3%) | 64 (30.6%) |
| 19 to 25 Years | 0 (0.0%) | 44 (100.0%) |
| 25 to 34 Years | 36 (37.1%) | 61 (62.9%) |
| 35 to 44 Years | 0 (0.0%) | 286 (100.0%) |
| 45 to 54 Years | 64 (21.8%) | 229 (78.2%) |
| 55 to 64 Years | 25 (12.3%) | 178 (87.7%) |
| 65 to 74 Years | 126 (100.0%) | 87 (69.1%) |
| 75 Years and over | 162 (100.0%) | 71 (43.8%) |
| Total | 539 (38.0%) | 1,020 (71.8%) |
Disability Status by Sex by Age in Alum Creek
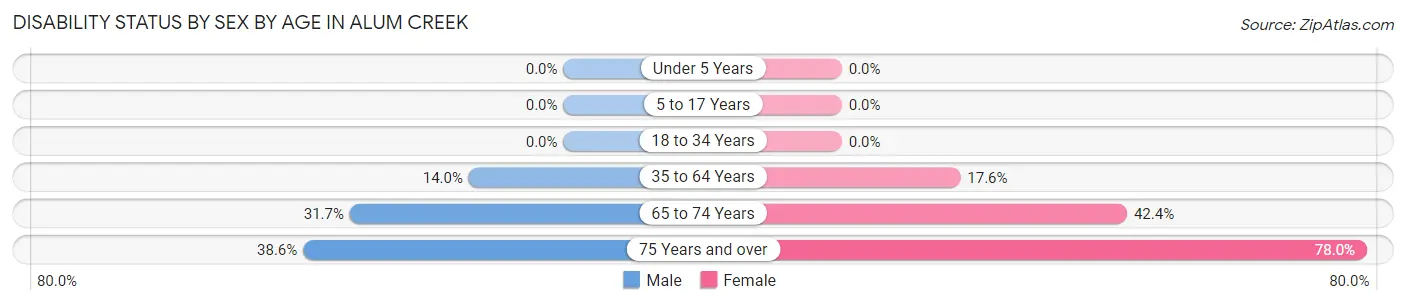
| Age Bracket | Male | Female |
| Under 5 Years | 0 (0.0%) | 0 (0.0%) |
| 5 to 17 Years | 0 (0.0%) | 0 (0.0%) |
| 18 to 34 Years | 0 (0.0%) | 0 (0.0%) |
| 35 to 64 Years | 50 (14.0%) | 75 (17.6%) |
| 65 to 74 Years | 13 (31.7%) | 36 (42.3%) |
| 75 Years and over | 17 (38.6%) | 92 (78.0%) |
Disability Class by Sex by Age in Alum Creek
Disability Class: Hearing Difficulty
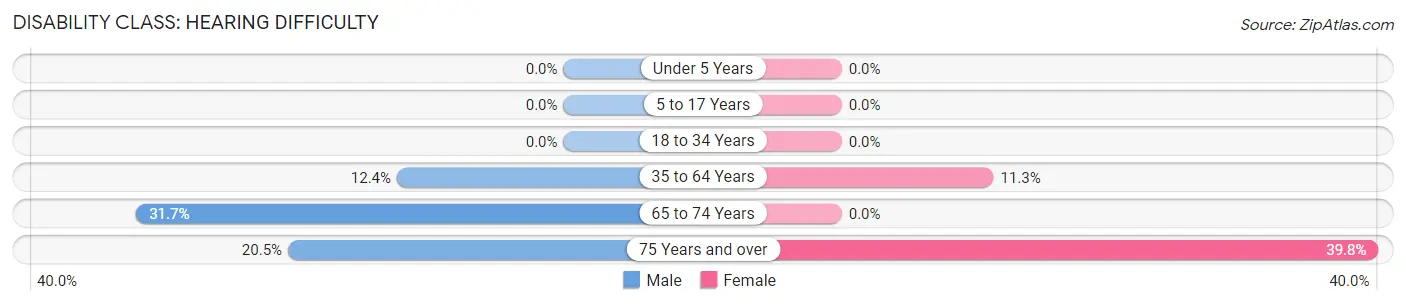
| Age Bracket | Male | Female |
| Under 5 Years | 0 (0.0%) | 0 (0.0%) |
| 5 to 17 Years | 0 (0.0%) | 0 (0.0%) |
| 18 to 34 Years | 0 (0.0%) | 0 (0.0%) |
| 35 to 64 Years | 44 (12.4%) | 48 (11.3%) |
| 65 to 74 Years | 13 (31.7%) | 0 (0.0%) |
| 75 Years and over | 9 (20.4%) | 47 (39.8%) |
Disability Class: Vision Difficulty
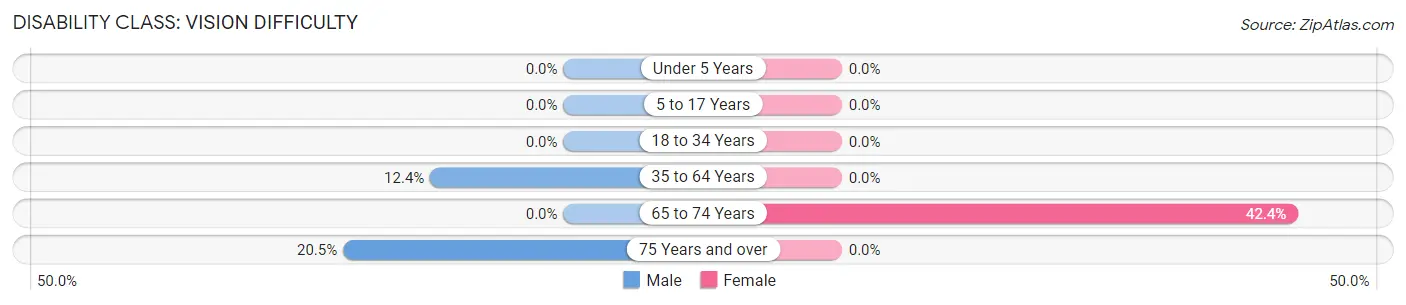
| Age Bracket | Male | Female |
| Under 5 Years | 0 (0.0%) | 0 (0.0%) |
| 5 to 17 Years | 0 (0.0%) | 0 (0.0%) |
| 18 to 34 Years | 0 (0.0%) | 0 (0.0%) |
| 35 to 64 Years | 44 (12.4%) | 0 (0.0%) |
| 65 to 74 Years | 0 (0.0%) | 36 (42.3%) |
| 75 Years and over | 9 (20.4%) | 0 (0.0%) |
Disability Class: Cognitive Difficulty
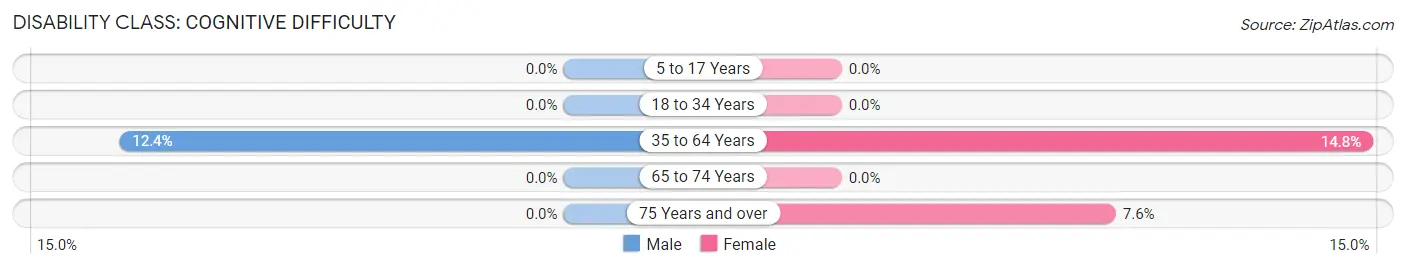
| Age Bracket | Male | Female |
| 5 to 17 Years | 0 (0.0%) | 0 (0.0%) |
| 18 to 34 Years | 0 (0.0%) | 0 (0.0%) |
| 35 to 64 Years | 44 (12.4%) | 63 (14.8%) |
| 65 to 74 Years | 0 (0.0%) | 0 (0.0%) |
| 75 Years and over | 0 (0.0%) | 9 (7.6%) |
Disability Class: Ambulatory Difficulty
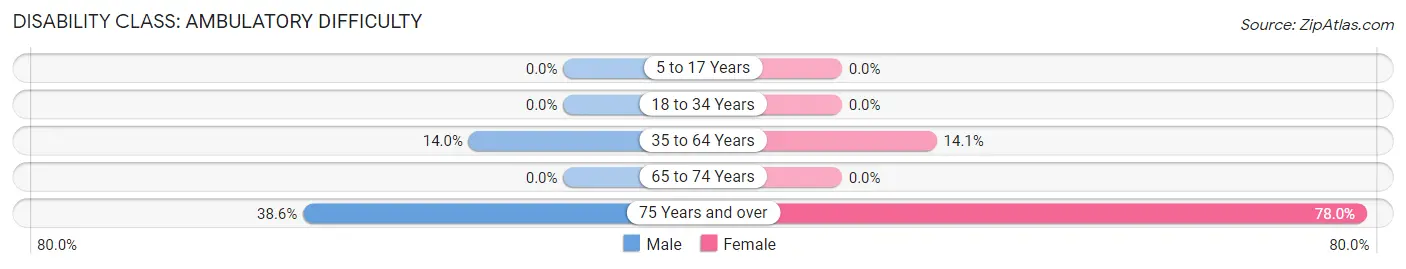
| Age Bracket | Male | Female |
| 5 to 17 Years | 0 (0.0%) | 0 (0.0%) |
| 18 to 34 Years | 0 (0.0%) | 0 (0.0%) |
| 35 to 64 Years | 50 (14.0%) | 60 (14.1%) |
| 65 to 74 Years | 0 (0.0%) | 0 (0.0%) |
| 75 Years and over | 17 (38.6%) | 92 (78.0%) |
Disability Class: Self-Care Difficulty
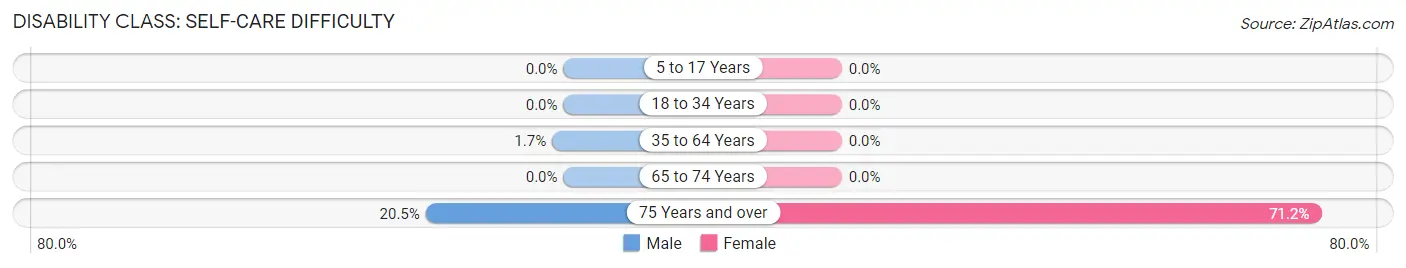
| Age Bracket | Male | Female |
| 5 to 17 Years | 0 (0.0%) | 0 (0.0%) |
| 18 to 34 Years | 0 (0.0%) | 0 (0.0%) |
| 35 to 64 Years | 6 (1.7%) | 0 (0.0%) |
| 65 to 74 Years | 0 (0.0%) | 0 (0.0%) |
| 75 Years and over | 9 (20.4%) | 84 (71.2%) |
Technology Access in Alum Creek
Computing Device Access in Alum Creek
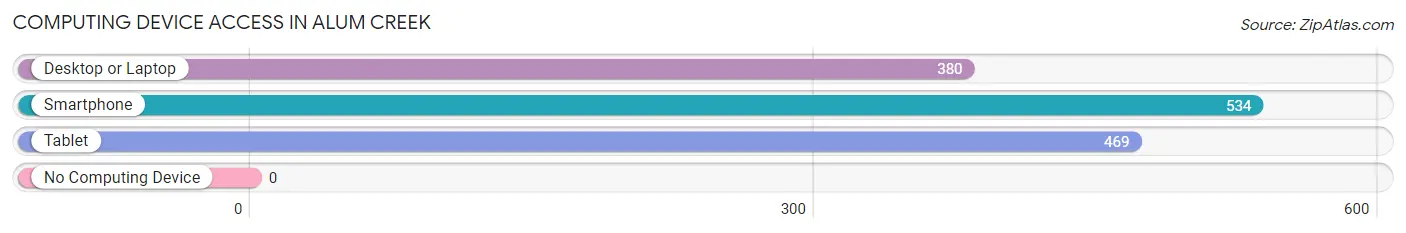
| Device Type | # Households | % Households |
| Desktop or Laptop | 380 | 69.0% |
| Smartphone | 534 | 96.9% |
| Tablet | 469 | 85.1% |
| No Computing Device | 0 | 0.0% |
| Total | 551 | 100.0% |
Internet Access in Alum Creek
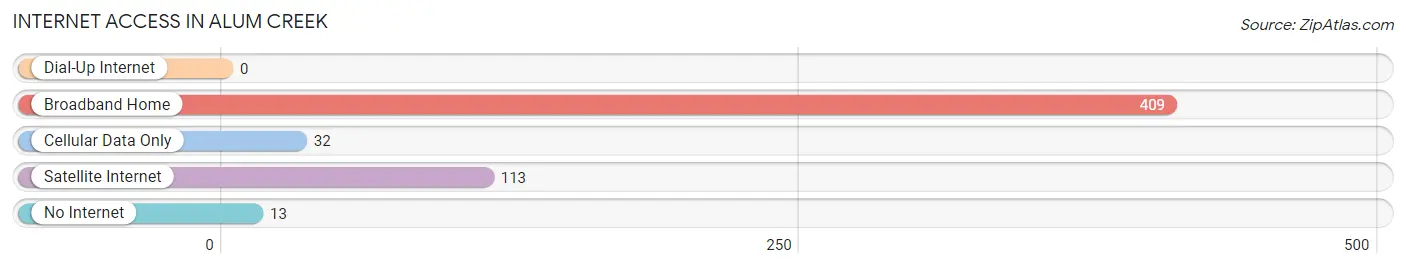
| Internet Type | # Households | % Households |
| Dial-Up Internet | 0 | 0.0% |
| Broadband Home | 409 | 74.2% |
| Cellular Data Only | 32 | 5.8% |
| Satellite Internet | 113 | 20.5% |
| No Internet | 13 | 2.4% |
| Total | 551 | 100.0% |
Alum Creek Summary
Alum Creek is a small unincorporated community located in Kanawha County, West Virginia. It is situated along the banks of the Kanawha River, approximately 10 miles south of Charleston, the state capital. The community is home to a population of approximately 1,000 people, and is part of the Charleston metropolitan area.
History
Alum Creek was first settled in the early 1800s by a group of German immigrants. The community was named after the nearby Alum Creek, which was used to power a grist mill. The mill was built in 1820 and was the first industry in the area. The mill was used to grind grain for local farmers and was a major source of income for the community.
In the late 1800s, the area began to experience a period of growth and development. The Chesapeake and Ohio Railway was built through the area in 1873, connecting Alum Creek to the larger cities of Charleston and Huntington. This allowed for increased trade and commerce, and the community began to grow.
In the early 1900s, the area experienced a period of industrialization. The Chesapeake and Ohio Railway built a coal mine in the area, and the community began to rely heavily on the coal industry. The mine provided jobs for many of the local residents, and the community began to thrive.
Geography
Alum Creek is located in the southeastern part of Kanawha County, West Virginia. It is situated along the banks of the Kanawha River, approximately 10 miles south of Charleston, the state capital. The community is located in a rural area, and is surrounded by rolling hills and forests. The climate in the area is humid subtropical, with hot summers and mild winters.
Economy
The economy of Alum Creek is largely based on the coal industry. The Chesapeake and Ohio Railway operates a coal mine in the area, and the mine provides jobs for many of the local residents. In addition to the coal industry, the community also has a few small businesses, including a grocery store, a hardware store, and a few restaurants.
Demographics
As of the 2010 census, the population of Alum Creek was 1,000. The racial makeup of the community was 97.2% White, 0.7% African American, 0.3% Native American, 0.2% Asian, and 1.6% from other races. The median household income was $35,000, and the median age was 40.
Conclusion
Alum Creek is a small unincorporated community located in Kanawha County, West Virginia. It is situated along the banks of the Kanawha River, approximately 10 miles south of Charleston, the state capital. The community is home to a population of approximately 1,000 people, and is part of the Charleston metropolitan area. The economy of Alum Creek is largely based on the coal industry, and the community also has a few small businesses. The racial makeup of the community is predominantly White, with a small percentage of African American, Native American, and Asian residents.
Common Questions
What is Per Capita Income in Alum Creek?
Per Capita income in Alum Creek is $36,534.
What is the Median Family Income in Alum Creek?
Median Family Income in Alum Creek is $59,813.
What is the Median Household income in Alum Creek?
Median Household Income in Alum Creek is $65,179.
What is Income or Wage Gap in Alum Creek?
Income or Wage Gap in Alum Creek is 41.8%.
Women in Alum Creek earn 58.2 cents for every dollar earned by a man.
What is Inequality or Gini Index in Alum Creek?
Inequality or Gini Index in Alum Creek is 0.35.
What is the Total Population of Alum Creek?
Total Population of Alum Creek is 1,420.
What is the Total Male Population of Alum Creek?
Total Male Population of Alum Creek is 560.
What is the Total Female Population of Alum Creek?
Total Female Population of Alum Creek is 860.
What is the Ratio of Males per 100 Females in Alum Creek?
There are 65.12 Males per 100 Females in Alum Creek.
What is the Ratio of Females per 100 Males in Alum Creek?
There are 153.57 Females per 100 Males in Alum Creek.
What is the Median Population Age in Alum Creek?
Median Population Age in Alum Creek is 47.4 Years.
What is the Average Family Size in Alum Creek
Average Family Size in Alum Creek is 2.8 People.
What is the Average Household Size in Alum Creek
Average Household Size in Alum Creek is 2.6 People.
How Large is the Labor Force in Alum Creek?
There are 689 People in the Labor Forcein in Alum Creek.
What is the Percentage of People in the Labor Force in Alum Creek?
54.3% of People are in the Labor Force in Alum Creek.
What is the Unemployment Rate in Alum Creek?
Unemployment Rate in Alum Creek is 11.5%.