Zip Codes with the Highest Percentage of Population with a Degree in Liberal Arts and History in Port Orchard, WA
RELATED REPORTS & OPTIONS
Liberal Arts and History
Port Orchard
Compare Zip Codes
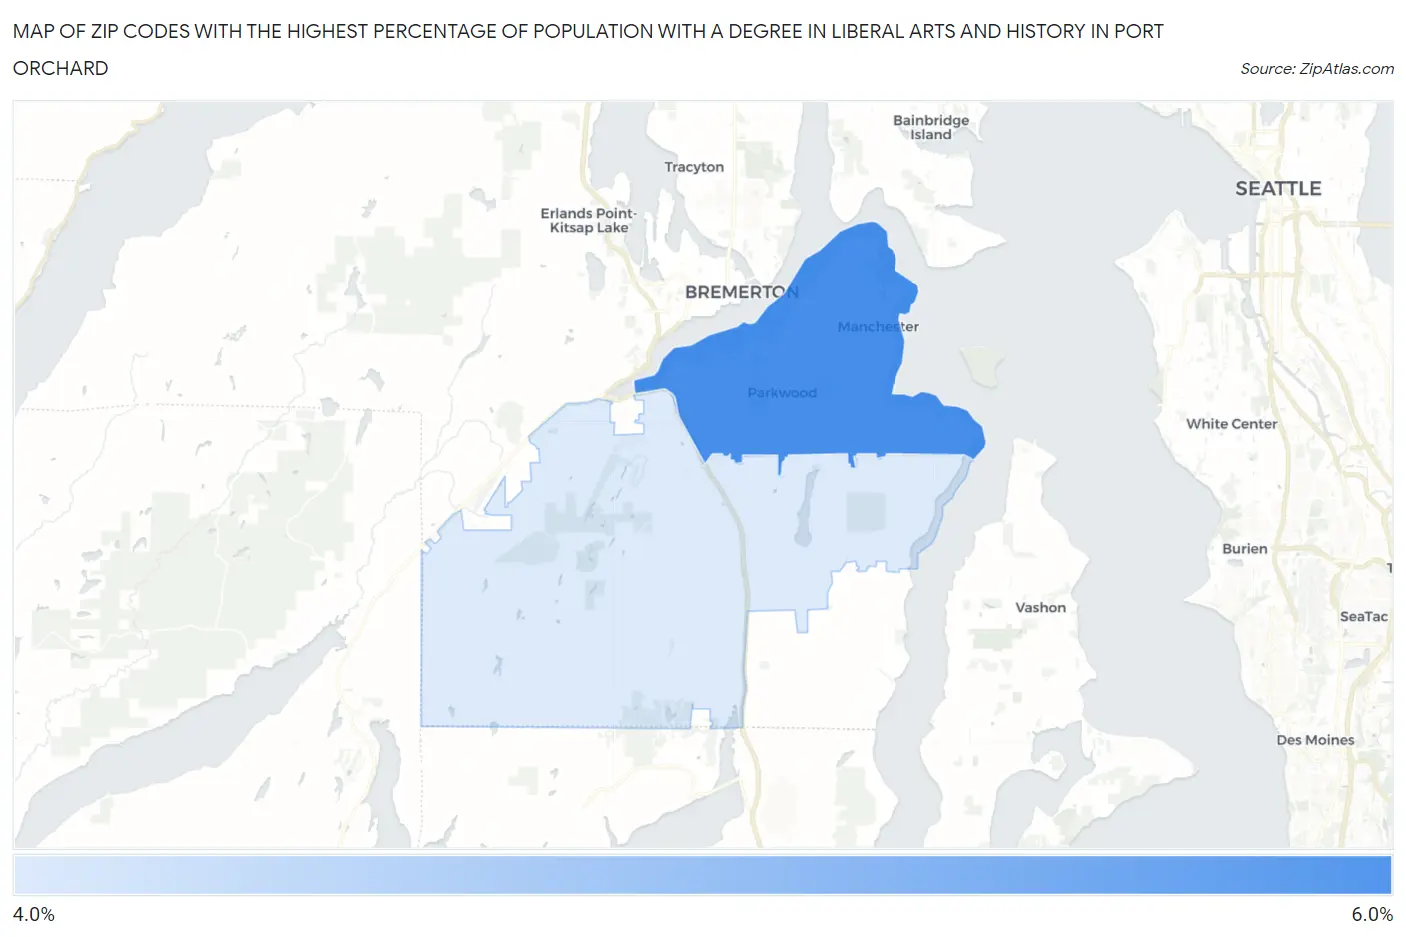
Map of Zip Codes with the Highest Percentage of Population with a Degree in Liberal Arts and History in Port Orchard
4.3%
5.2%
Zip Codes with the Highest Percentage of Population with a Degree in Liberal Arts and History in Port Orchard, WA
| Zip Code | % Graduates | vs State | vs National | |
| 1. | 98366 | 5.2% | 5.1%(+0.065)#242 | 4.9%(+0.341)#10,687 |
| 2. | 98367 | 4.3% | 5.1%(-0.890)#311 | 4.9%(-0.615)#13,785 |
1
Common Questions
What are the Top Zip Codes with the Highest Percentage of Population with a Degree in Liberal Arts and History in Port Orchard, WA?
Top Zip Codes with the Highest Percentage of Population with a Degree in Liberal Arts and History in Port Orchard, WA are:
What zip code has the Highest Percentage of Population with a Degree in Liberal Arts and History in Port Orchard, WA?
98366 has the Highest Percentage of Population with a Degree in Liberal Arts and History in Port Orchard, WA with 5.2%.
What is the Percentage of Population with a Degree in Liberal Arts and History in Port Orchard, WA?
Percentage of Population with a Degree in Liberal Arts and History in Port Orchard is 4.0%.
What is the Percentage of Population with a Degree in Liberal Arts and History in Washington?
Percentage of Population with a Degree in Liberal Arts and History in Washington is 5.1%.
What is the Percentage of Population with a Degree in Liberal Arts and History in the United States?
Percentage of Population with a Degree in Liberal Arts and History in the United States is 4.9%.