Zip Codes with the Highest Percentage of Households Heated by Bottled Gas / Liquid Propane in Kennewick, WA
RELATED REPORTS & OPTIONS
Bottled Gas / LP Heating
Kennewick
Compare Zip Codes
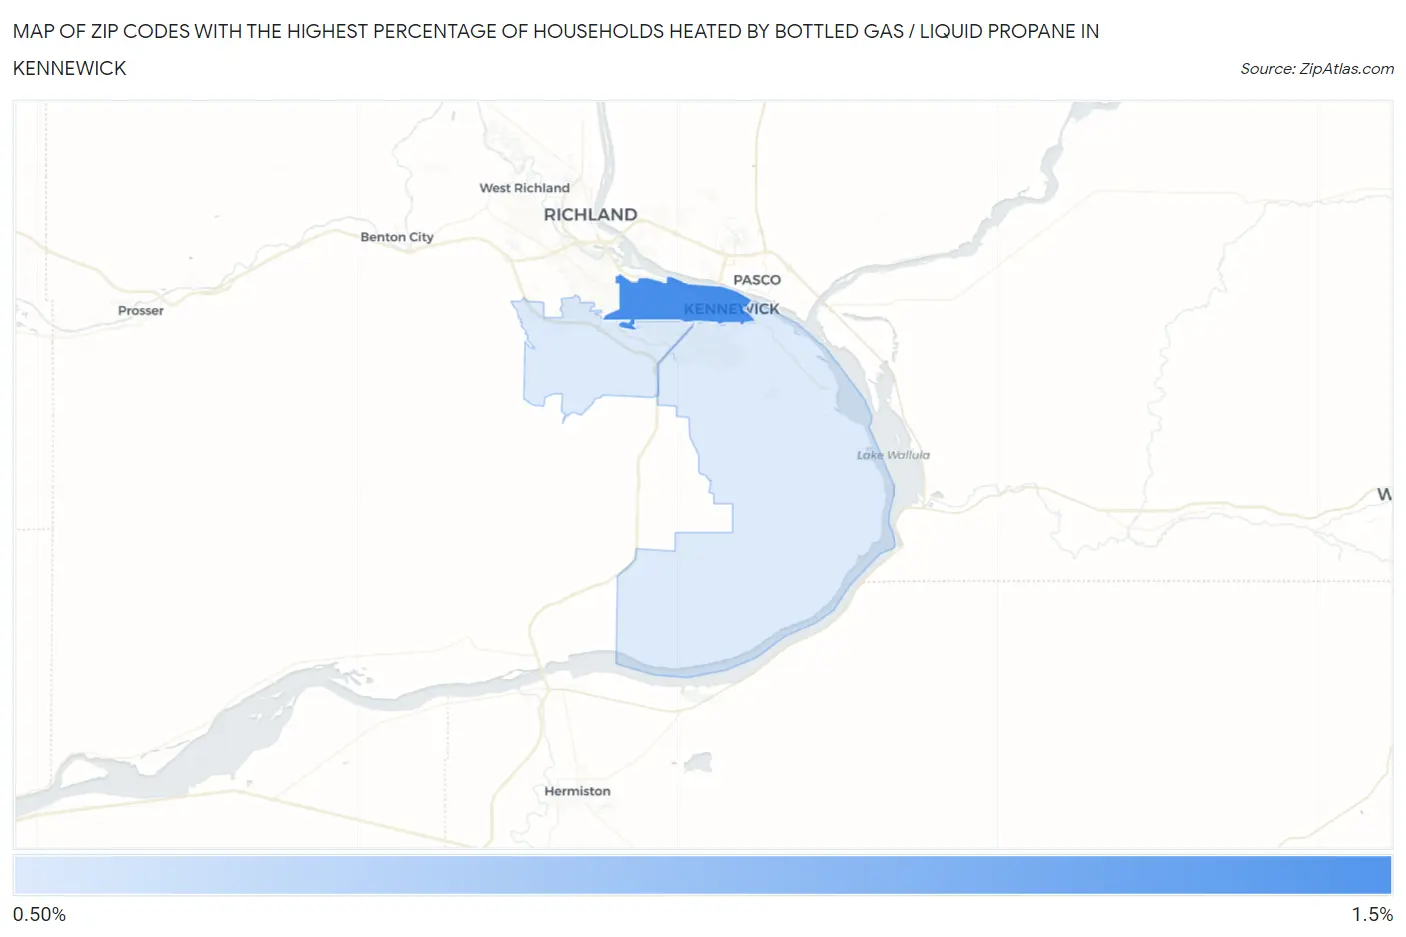
Map of Zip Codes with the Highest Percentage of Households Heated by Bottled Gas / Liquid Propane in Kennewick
0.0%
1.5%
Zip Codes with the Highest Percentage of Households Heated by Bottled Gas / Liquid Propane in Kennewick, WA
| Zip Code | Bottled Gas / LP Heating | vs State | vs National | |
| 1. | 99336 | 1.2% | 3.1%(-1.90)#370 | 4.9%(-3.70)#25,753 |
| 2. | 99337 | 1.0% | 3.1%(-2.10)#408 | 4.9%(-3.90)#26,634 |
| 3. | 99338 | 1.0% | 3.1%(-2.10)#415 | 4.9%(-3.90)#26,779 |
1
Common Questions
What are the Top Zip Codes with the Highest Percentage of Households Heated by Bottled Gas / Liquid Propane in Kennewick, WA?
Top Zip Codes with the Highest Percentage of Households Heated by Bottled Gas / Liquid Propane in Kennewick, WA are:
What zip code has the Highest Percentage of Households Heated by Bottled Gas / Liquid Propane in Kennewick, WA?
99336 has the Highest Percentage of Households Heated by Bottled Gas / Liquid Propane in Kennewick, WA with 1.2%.
What is the Percentage of Households Heated by Bottled Gas / Liquid Propane in Kennewick, WA?
Percentage of Households Heated by Bottled Gas / Liquid Propane in Kennewick is 1.2%.
What is the Percentage of Households Heated by Bottled Gas / Liquid Propane in Washington?
Percentage of Households Heated by Bottled Gas / Liquid Propane in Washington is 3.1%.
What is the Percentage of Households Heated by Bottled Gas / Liquid Propane in the United States?
Percentage of Households Heated by Bottled Gas / Liquid Propane in the United States is 4.9%.