Zip Codes with the Highest Percentage of Population Employed in Farming, Fishing & Forestry in Edmonds, WA
RELATED REPORTS & OPTIONS
Farming, Fishing & Forestry
Edmonds
Compare Zip Codes
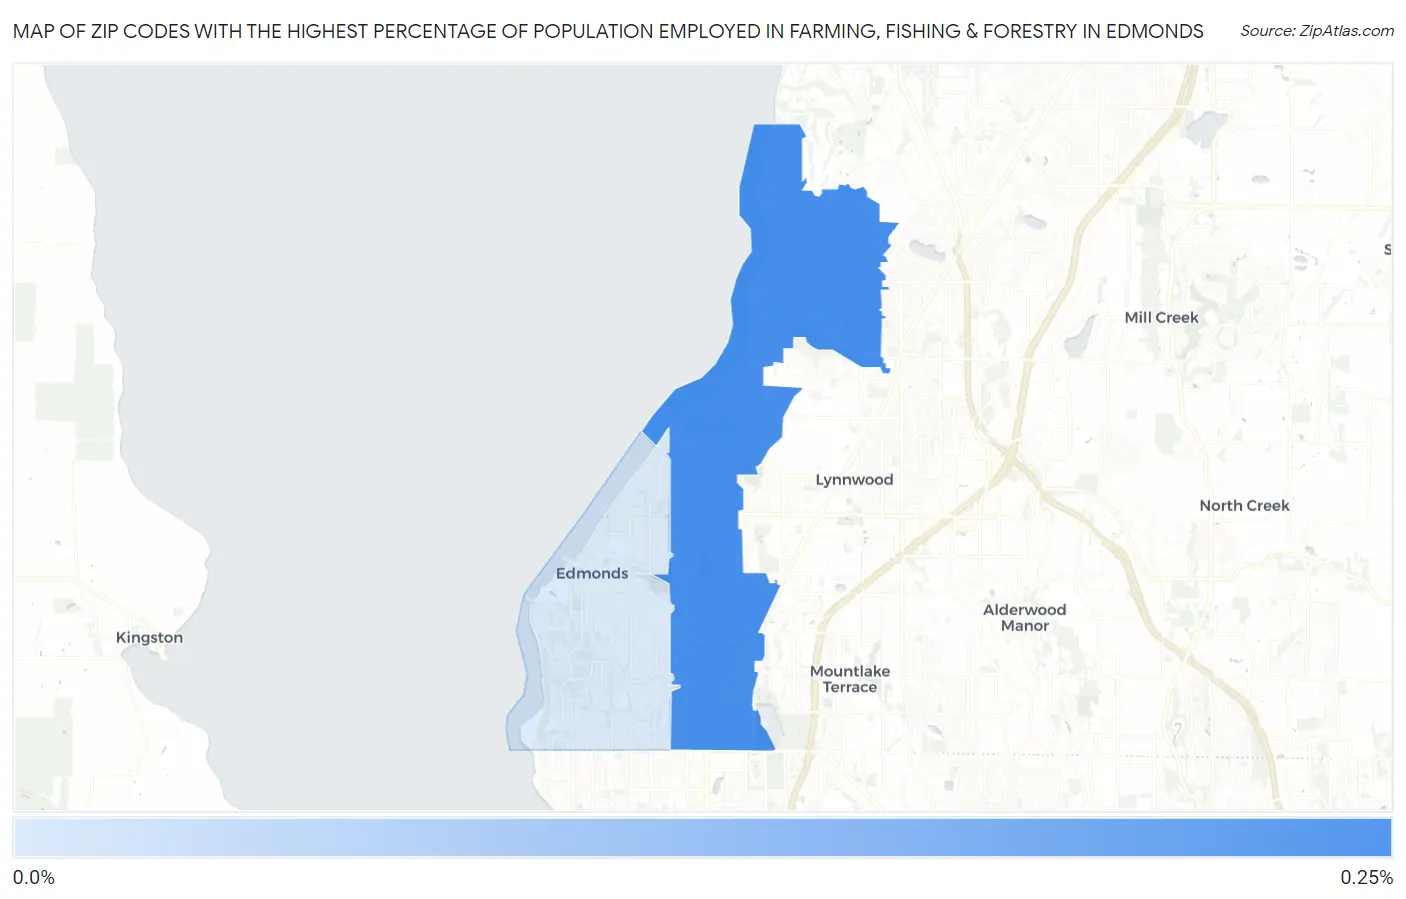
Map of Zip Codes with the Highest Percentage of Population Employed in Farming, Fishing & Forestry in Edmonds
0.0%
0.25%
Zip Codes with the Highest Percentage of Population Employed in Farming, Fishing & Forestry in Edmonds, WA
| Zip Code | % Employed | vs State | vs National | |
| 1. | 98026 | 0.24% | 1.5%(-1.28)#367 | 0.61%(-0.370)#15,608 |
| 2. | 98020 | 0.042% | 1.5%(-1.47)#426 | 0.61%(-0.563)#18,782 |
1
Common Questions
What are the Top Zip Codes with the Highest Percentage of Population Employed in Farming, Fishing & Forestry in Edmonds, WA?
Top Zip Codes with the Highest Percentage of Population Employed in Farming, Fishing & Forestry in Edmonds, WA are:
What zip code has the Highest Percentage of Population Employed in Farming, Fishing & Forestry in Edmonds, WA?
98026 has the Highest Percentage of Population Employed in Farming, Fishing & Forestry in Edmonds, WA with 0.24%.
What is the Percentage of Population Employed in Farming, Fishing & Forestry in Edmonds, WA?
Percentage of Population Employed in Farming, Fishing & Forestry in Edmonds is 0.12%.
What is the Percentage of Population Employed in Farming, Fishing & Forestry in Washington?
Percentage of Population Employed in Farming, Fishing & Forestry in Washington is 1.5%.
What is the Percentage of Population Employed in Farming, Fishing & Forestry in the United States?
Percentage of Population Employed in Farming, Fishing & Forestry in the United States is 0.61%.