Zip Codes with the Highest Percentage of Households Heated by Electricity in Danville, VA
RELATED REPORTS & OPTIONS
Electrical Heating
Danville
Compare Zip Codes
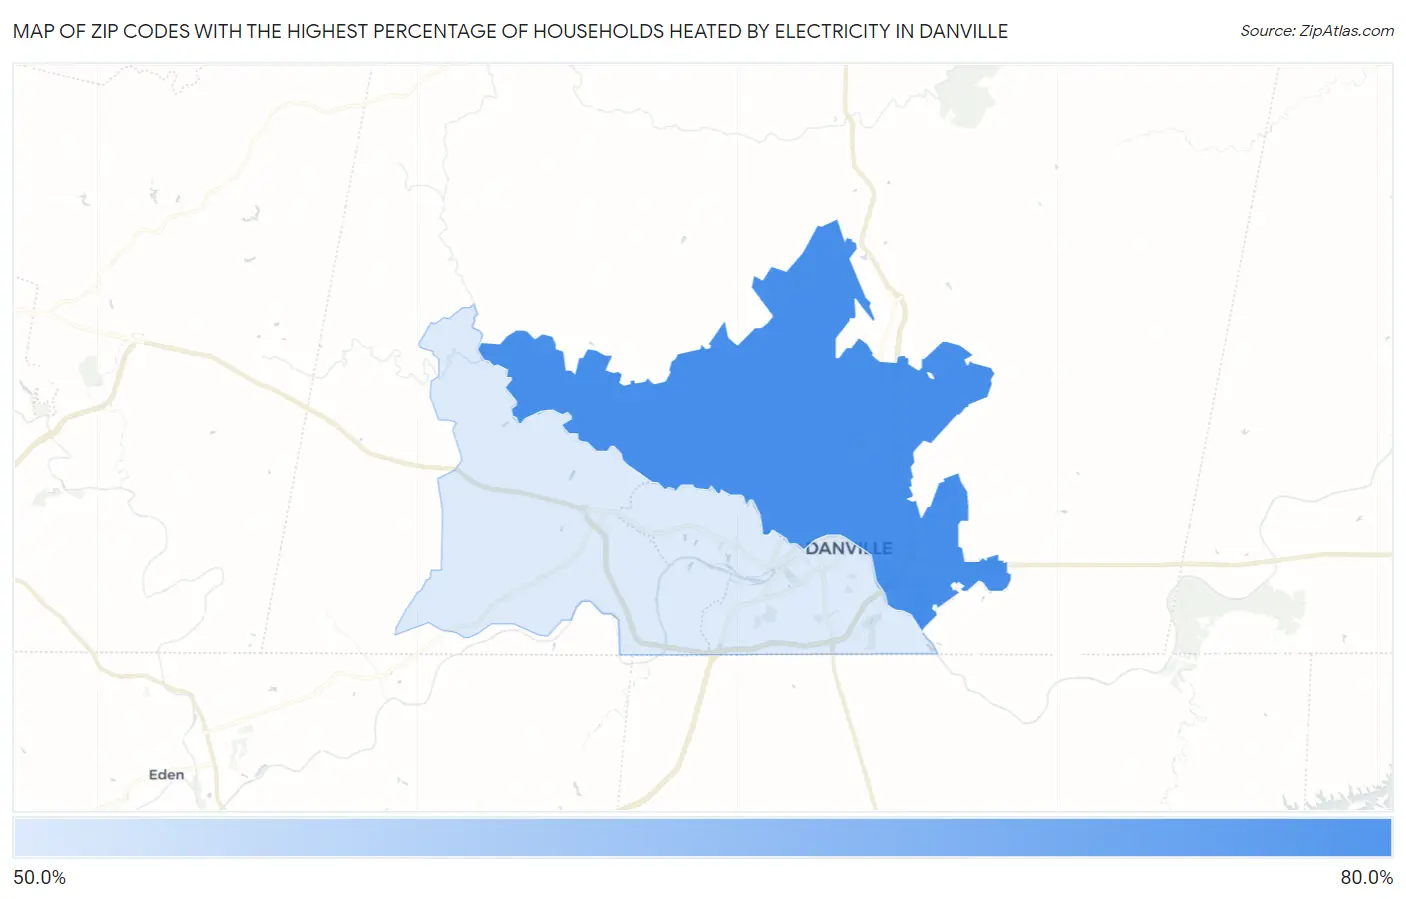
Map of Zip Codes with the Highest Percentage of Households Heated by Electricity in Danville
0.0%
80.0%
Zip Codes with the Highest Percentage of Households Heated by Electricity in Danville, VA
| Zip Code | Electrical Heating | vs State | vs National | |
| 1. | 24540 | 67.6% | 56.5%(+11.1)#354 | 40.2%(+27.4)#5,591 |
| 2. | 24541 | 59.6% | 56.5%(+3.10)#487 | 40.2%(+19.4)#7,494 |
1
Common Questions
What are the Top Zip Codes with the Highest Percentage of Households Heated by Electricity in Danville, VA?
Top Zip Codes with the Highest Percentage of Households Heated by Electricity in Danville, VA are:
What zip code has the Highest Percentage of Households Heated by Electricity in Danville, VA?
24540 has the Highest Percentage of Households Heated by Electricity in Danville, VA with 67.6%.
What is the Percentage of Households Heated by Electricity in Danville, VA?
Percentage of Households Heated by Electricity in Danville is 59.7%.
What is the Percentage of Households Heated by Electricity in Virginia?
Percentage of Households Heated by Electricity in Virginia is 56.5%.
What is the Percentage of Households Heated by Electricity in the United States?
Percentage of Households Heated by Electricity in the United States is 40.2%.