Zip Codes with the Highest Percentage of Population Employed in Agriculture, Fishing & Hunting in Logan, UT
RELATED REPORTS & OPTIONS
Agriculture, Fishing & Hunting
Logan
Compare Zip Codes
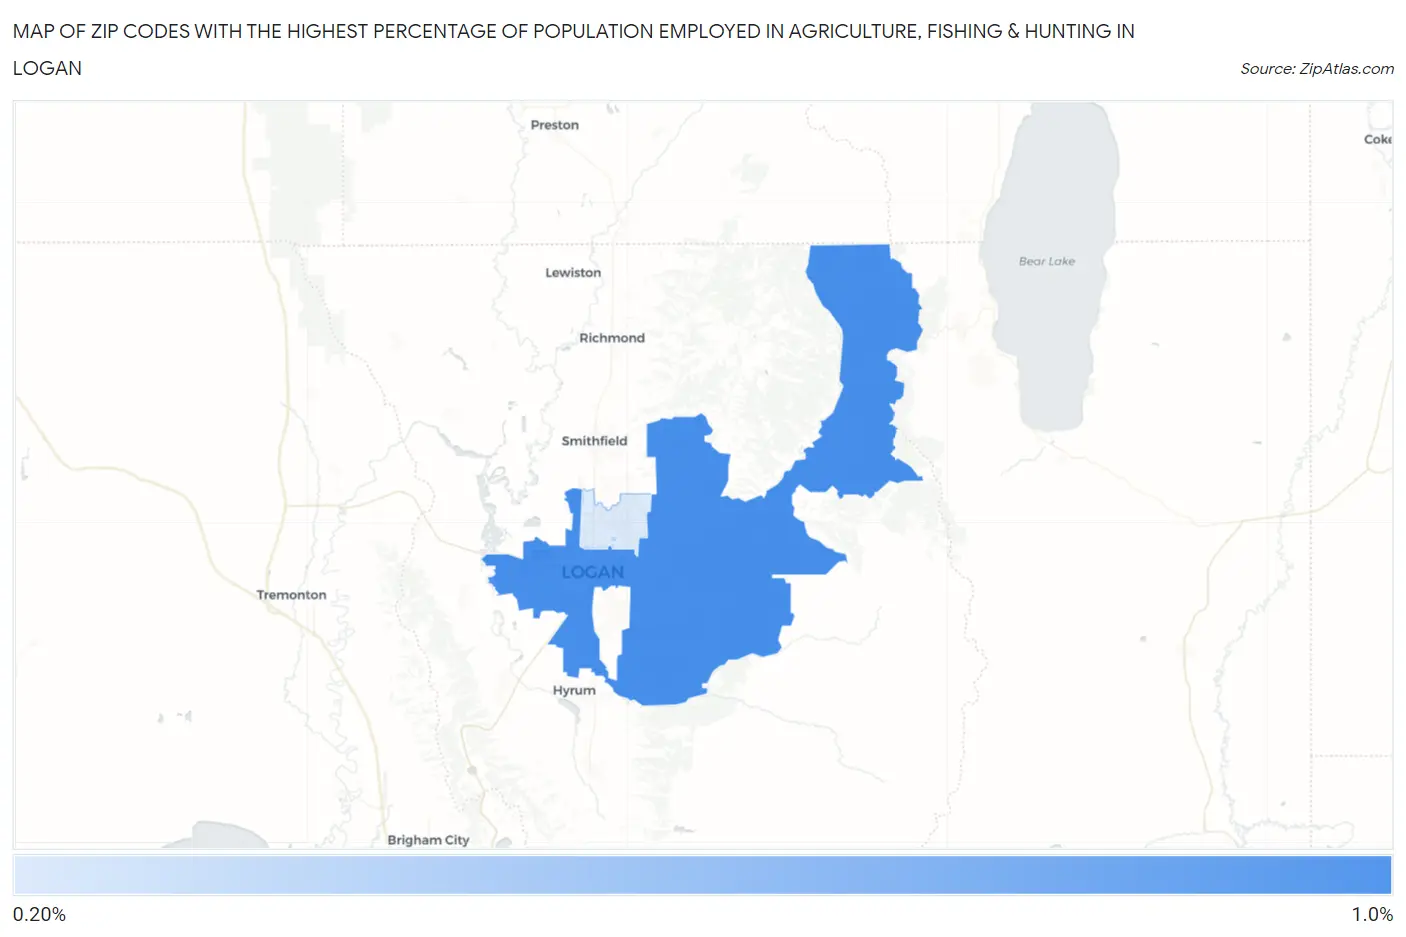
Map of Zip Codes with the Highest Percentage of Population Employed in Agriculture, Fishing & Hunting in Logan
0.0%
1.0%
Zip Codes with the Highest Percentage of Population Employed in Agriculture, Fishing & Hunting in Logan, UT
| Zip Code | % Employed | vs State | vs National | |
| 1. | 84321 | 0.86% | 0.72%(+0.132)#142 | 1.2%(-0.344)#16,944 |
| 2. | 84341 | 0.26% | 0.72%(-0.461)#198 | 1.2%(-0.937)#21,624 |
1
Common Questions
What are the Top Zip Codes with the Highest Percentage of Population Employed in Agriculture, Fishing & Hunting in Logan, UT?
Top Zip Codes with the Highest Percentage of Population Employed in Agriculture, Fishing & Hunting in Logan, UT are:
What zip code has the Highest Percentage of Population Employed in Agriculture, Fishing & Hunting in Logan, UT?
84321 has the Highest Percentage of Population Employed in Agriculture, Fishing & Hunting in Logan, UT with 0.86%.
What is the Percentage of Population Employed in Agriculture, Fishing & Hunting in Logan, UT?
Percentage of Population Employed in Agriculture, Fishing & Hunting in Logan is 0.51%.
What is the Percentage of Population Employed in Agriculture, Fishing & Hunting in Utah?
Percentage of Population Employed in Agriculture, Fishing & Hunting in Utah is 0.72%.
What is the Percentage of Population Employed in Agriculture, Fishing & Hunting in the United States?
Percentage of Population Employed in Agriculture, Fishing & Hunting in the United States is 1.2%.