Zip Codes with the Highest Percentage of Population Employed in Agriculture, Fishing & Hunting in Port Arthur, TX
RELATED REPORTS & OPTIONS
Agriculture, Fishing & Hunting
Port Arthur
Compare Zip Codes
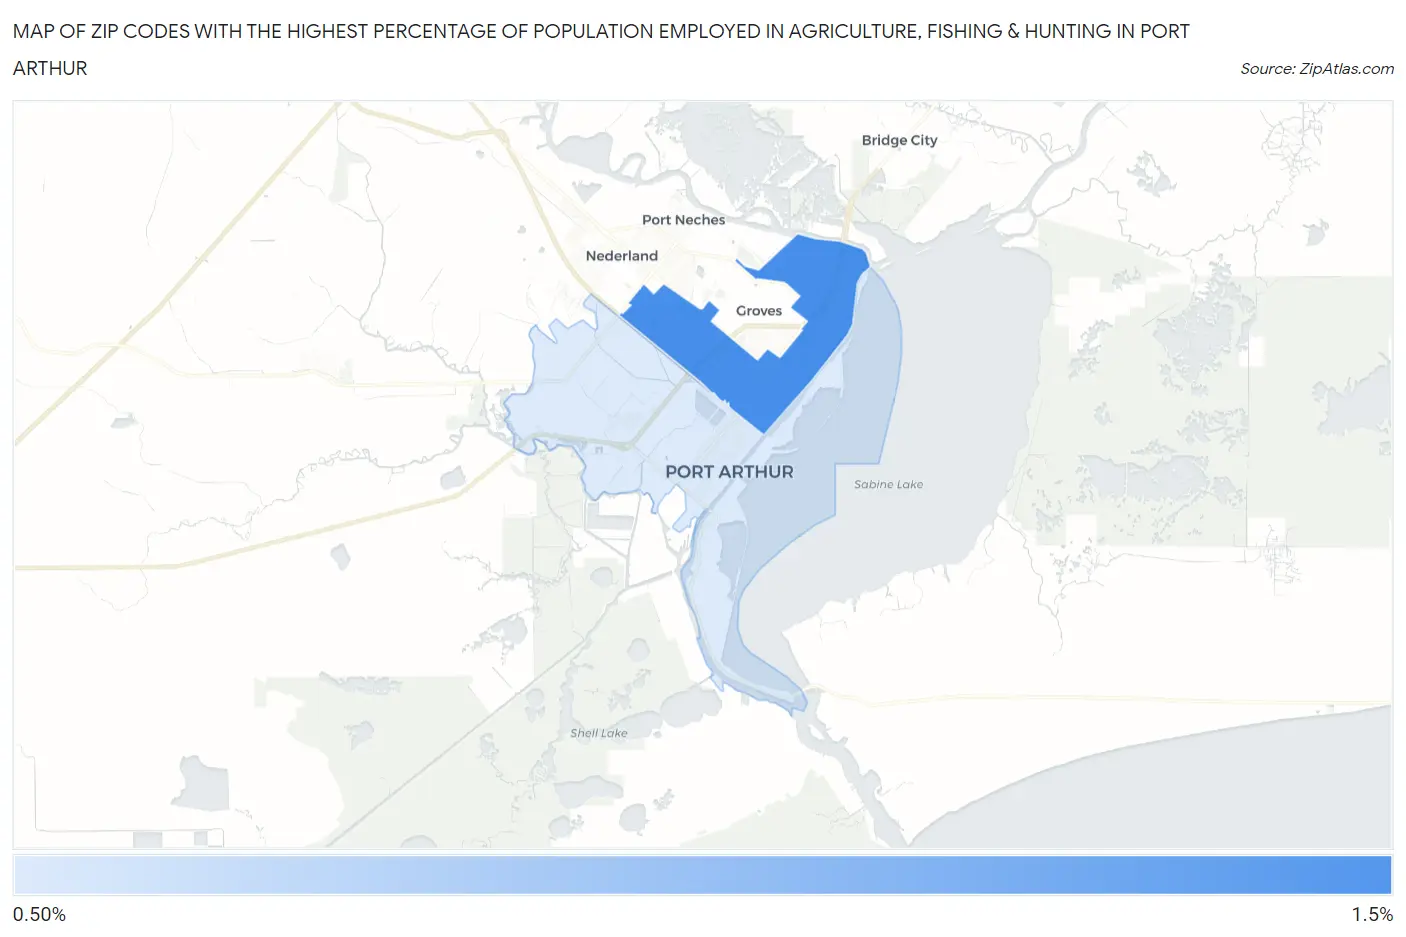
Map of Zip Codes with the Highest Percentage of Population Employed in Agriculture, Fishing & Hunting in Port Arthur
0.0%
1.5%
Zip Codes with the Highest Percentage of Population Employed in Agriculture, Fishing & Hunting in Port Arthur, TX
| Zip Code | % Employed | vs State | vs National | |
| 1. | 77642 | 1.2% | 0.75%(+0.482)#805 | 1.2%(+0.034)#15,277 |
| 2. | 77640 | 0.58% | 0.75%(-0.170)#1,002 | 1.2%(-0.617)#18,614 |
1
Common Questions
What are the Top Zip Codes with the Highest Percentage of Population Employed in Agriculture, Fishing & Hunting in Port Arthur, TX?
Top Zip Codes with the Highest Percentage of Population Employed in Agriculture, Fishing & Hunting in Port Arthur, TX are:
What zip code has the Highest Percentage of Population Employed in Agriculture, Fishing & Hunting in Port Arthur, TX?
77642 has the Highest Percentage of Population Employed in Agriculture, Fishing & Hunting in Port Arthur, TX with 1.2%.
What is the Percentage of Population Employed in Agriculture, Fishing & Hunting in Port Arthur, TX?
Percentage of Population Employed in Agriculture, Fishing & Hunting in Port Arthur is 1.0%.
What is the Percentage of Population Employed in Agriculture, Fishing & Hunting in Texas?
Percentage of Population Employed in Agriculture, Fishing & Hunting in Texas is 0.75%.
What is the Percentage of Population Employed in Agriculture, Fishing & Hunting in the United States?
Percentage of Population Employed in Agriculture, Fishing & Hunting in the United States is 1.2%.