Zip Codes with the Highest Percentage of Population Employed in Farming, Fishing & Forestry in Denton, TX
RELATED REPORTS & OPTIONS
Farming, Fishing & Forestry
Denton
Compare Zip Codes
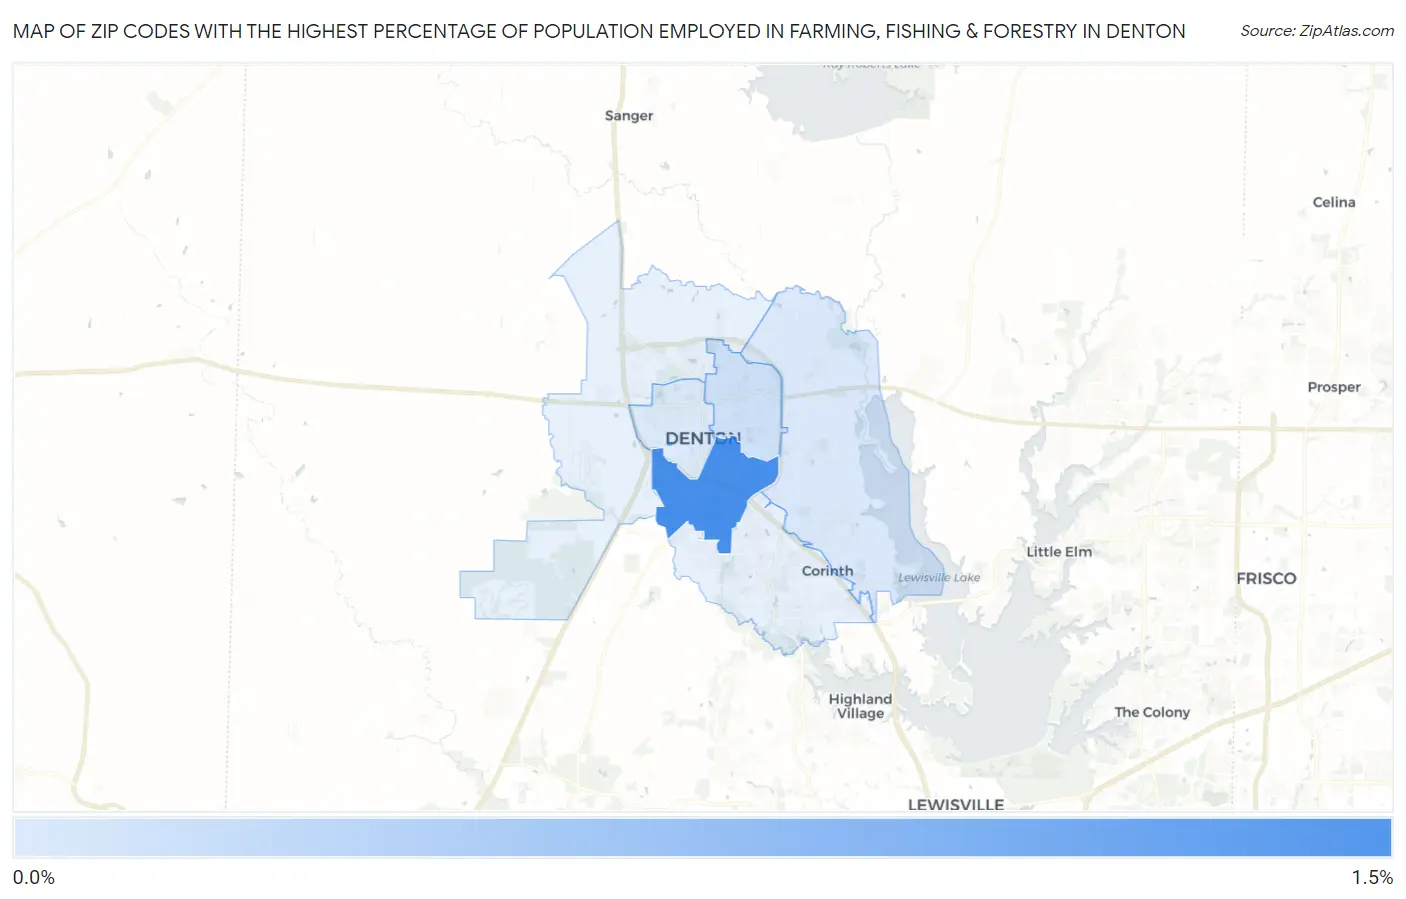
Map of Zip Codes with the Highest Percentage of Population Employed in Farming, Fishing & Forestry in Denton
0.0%
1.5%
Zip Codes with the Highest Percentage of Population Employed in Farming, Fishing & Forestry in Denton, TX
| Zip Code | % Employed | vs State | vs National | |
| 1. | 76205 | 1.2% | 0.37%(+0.847)#469 | 0.61%(+0.614)#8,858 |
| 2. | 76209 | 0.15% | 0.37%(-0.224)#934 | 0.61%(-0.458)#16,958 |
| 3. | 76208 | 0.045% | 0.37%(-0.327)#1,071 | 0.61%(-0.560)#18,732 |
| 4. | 76201 | 0.036% | 0.37%(-0.336)#1,082 | 0.61%(-0.570)#18,879 |
1
Common Questions
What are the Top 5 Zip Codes with the Highest Percentage of Population Employed in Farming, Fishing & Forestry in Denton, TX?
Top 5 Zip Codes with the Highest Percentage of Population Employed in Farming, Fishing & Forestry in Denton, TX are:
What zip code has the Highest Percentage of Population Employed in Farming, Fishing & Forestry in Denton, TX?
76205 has the Highest Percentage of Population Employed in Farming, Fishing & Forestry in Denton, TX with 1.2%.
What is the Percentage of Population Employed in Farming, Fishing & Forestry in Denton, TX?
Percentage of Population Employed in Farming, Fishing & Forestry in Denton is 0.25%.
What is the Percentage of Population Employed in Farming, Fishing & Forestry in Texas?
Percentage of Population Employed in Farming, Fishing & Forestry in Texas is 0.37%.
What is the Percentage of Population Employed in Farming, Fishing & Forestry in the United States?
Percentage of Population Employed in Farming, Fishing & Forestry in the United States is 0.61%.