Zip Codes with the Most Immigrants from South Central Asia in Morristown, TN
RELATED REPORTS & OPTIONS
South Central Asia
Morristown
Compare Zip Codes
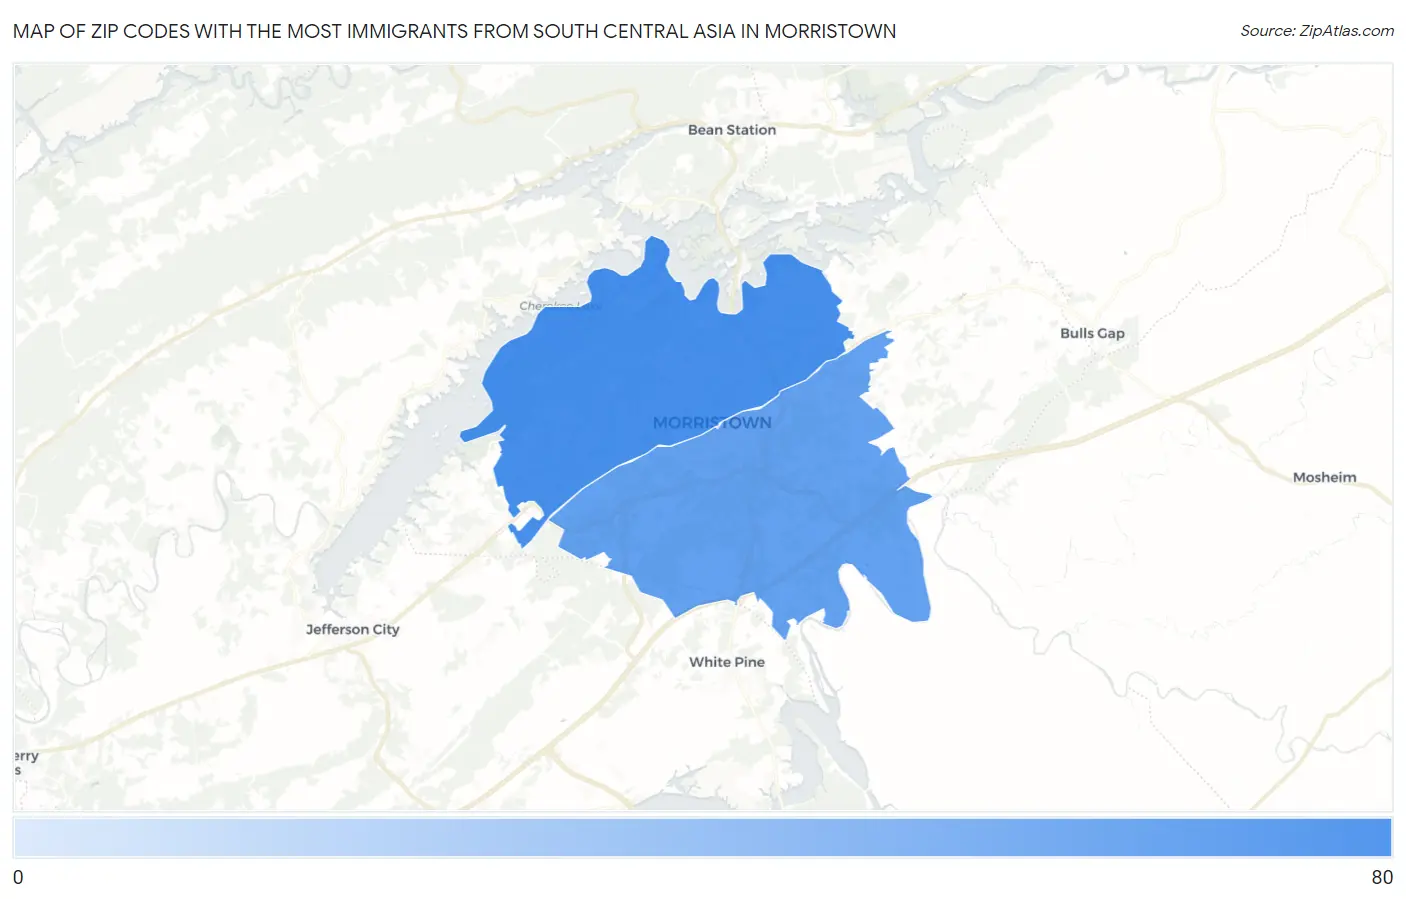
Map of Zip Codes with the Most Immigrants from South Central Asia in Morristown
32
69
Zip Codes with the Most Immigrants from South Central Asia in Morristown, TN
| Zip Code | South Central Asia | vs State | vs National | |
| 1. | 37814 | 69 | 34,050(0.20%)#78 | 4,330,976(0.00%)#6,194 |
| 2. | 37813 | 32 | 34,050(0.09%)#115 | 4,330,976(0.00%)#7,668 |
1
Common Questions
What are the Top Zip Codes with the Most Immigrants from South Central Asia in Morristown, TN?
Top Zip Codes with the Most Immigrants from South Central Asia in Morristown, TN are:
What zip code has the Most Immigrants from South Central Asia in Morristown, TN?
37814 has the Most Immigrants from South Central Asia in Morristown, TN with 69.
What is the Total Immigrants from South Central Asia in Morristown, TN?
Total Immigrants from South Central Asia in Morristown is 51.
What is the Total Immigrants from South Central Asia in Tennessee?
Total Immigrants from South Central Asia in Tennessee is 34,050.
What is the Total Immigrants from South Central Asia in the United States?
Total Immigrants from South Central Asia in the United States is 4,330,976.