Zip Codes with the Highest Percentage of Hawaiian / Pacific Population in Morristown, TN
RELATED REPORTS & OPTIONS
Hawaiian / Pacific
Morristown
Compare Zip Codes
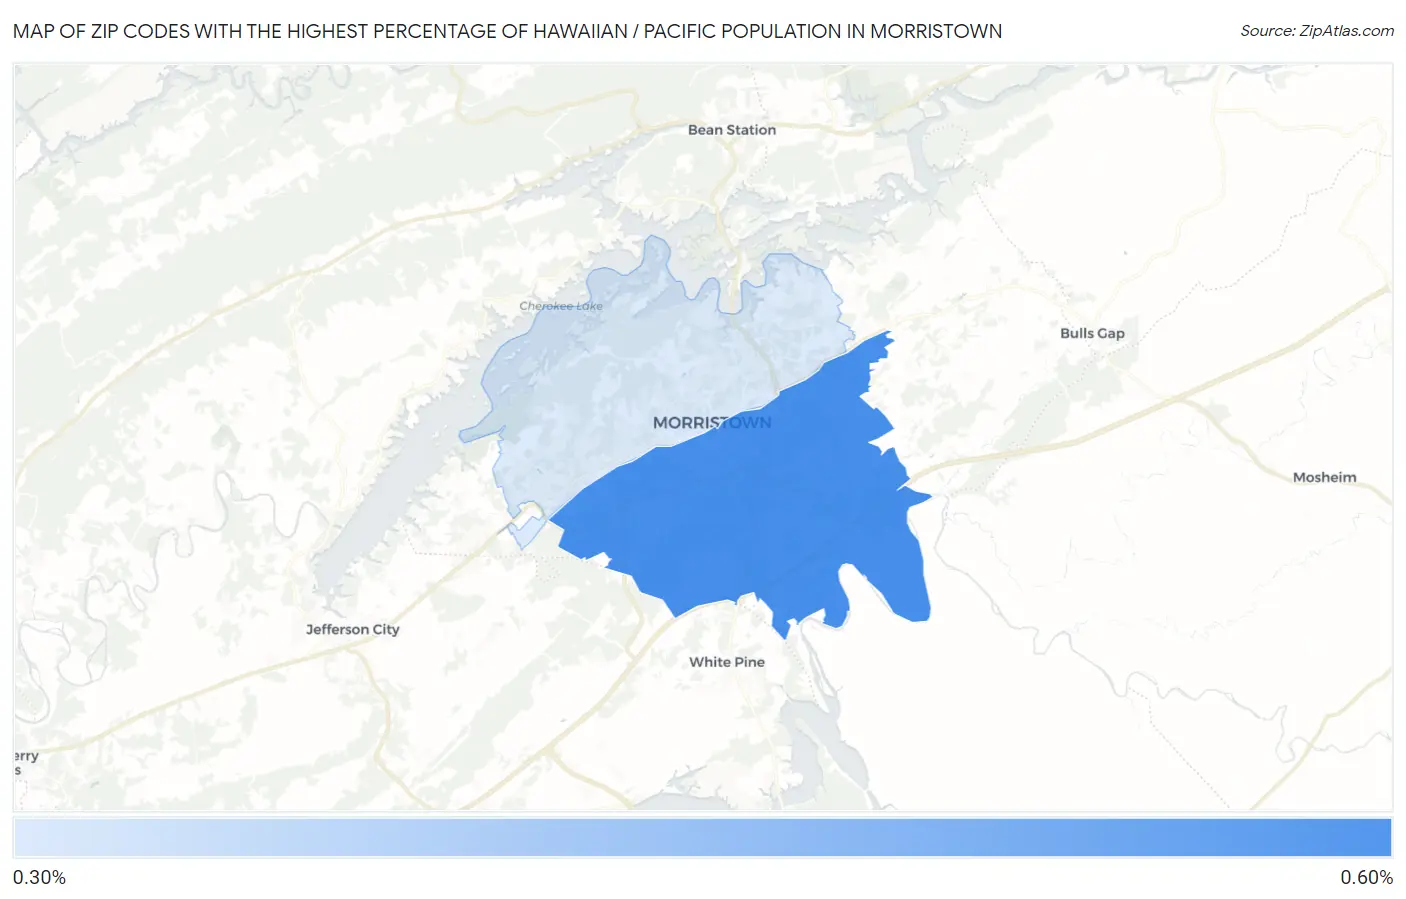
Map of Zip Codes with the Highest Percentage of Hawaiian / Pacific Population in Morristown
0.39%
0.58%
Zip Codes with the Highest Percentage of Hawaiian / Pacific Population in Morristown, TN
| Zip Code | Hawaiian / Pacific | vs State | vs National | |
| 1. | 37813 | 0.58% | 0.068%(+0.514)#15 | 0.19%(+0.393)#1,248 |
| 2. | 37814 | 0.39% | 0.068%(+0.325)#28 | 0.19%(+0.204)#1,720 |
1
Common Questions
What are the Top Zip Codes with the Highest Percentage of Hawaiian / Pacific Population in Morristown, TN?
Top Zip Codes with the Highest Percentage of Hawaiian / Pacific Population in Morristown, TN are:
What zip code has the Highest Percentage of Hawaiian / Pacific Population in Morristown, TN?
37813 has the Highest Percentage of Hawaiian / Pacific Population in Morristown, TN with 0.58%.
What is the Percentage of Hawaiian / Pacific Population in Morristown, TN?
Percentage of Hawaiian / Pacific Population in Morristown is 0.78%.
What is the Percentage of Hawaiian / Pacific Population in Tennessee?
Percentage of Hawaiian / Pacific Population in Tennessee is 0.068%.
What is the Percentage of Hawaiian / Pacific Population in the United States?
Percentage of Hawaiian / Pacific Population in the United States is 0.19%.