Zip Codes with the Highest Percentage of Population Employed in Professional & Scientific Services in Morristown, TN
RELATED REPORTS & OPTIONS
Professional & Scientific Services
Morristown
Compare Zip Codes
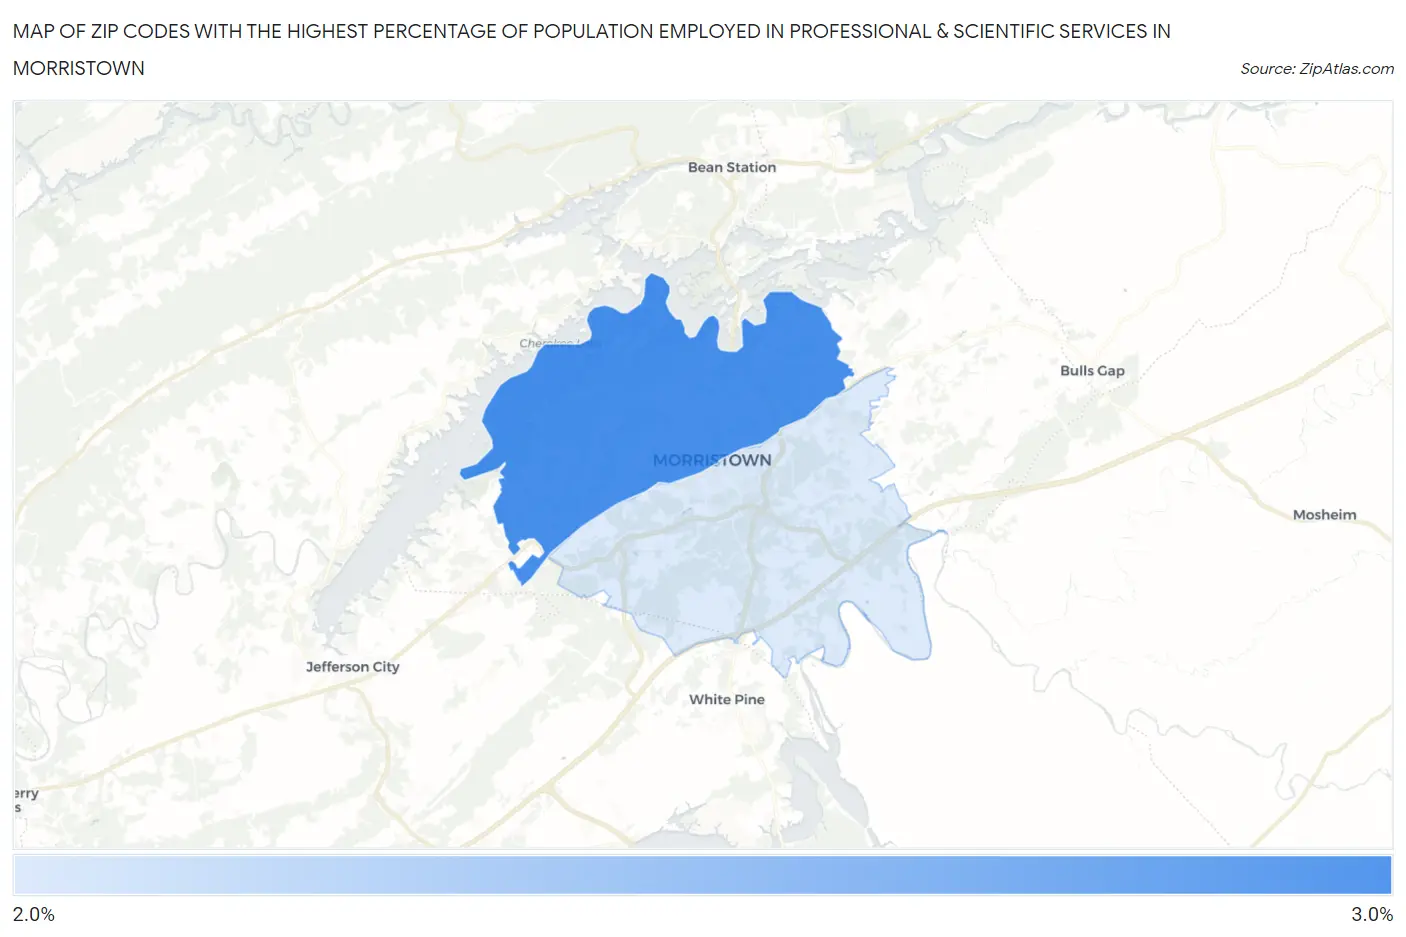
Map of Zip Codes with the Highest Percentage of Population Employed in Professional & Scientific Services in Morristown
0.0%
3.0%
Zip Codes with the Highest Percentage of Population Employed in Professional & Scientific Services in Morristown, TN
| Zip Code | % Employed | vs State | vs National | |
| 1. | 37814 | 2.7% | 5.7%(-2.99)#336 | 7.8%(-5.11)#19,403 |
| 2. | 37813 | 2.1% | 5.7%(-3.63)#397 | 7.8%(-5.75)#21,575 |
1
Common Questions
What are the Top Zip Codes with the Highest Percentage of Population Employed in Professional & Scientific Services in Morristown, TN?
Top Zip Codes with the Highest Percentage of Population Employed in Professional & Scientific Services in Morristown, TN are:
What zip code has the Highest Percentage of Population Employed in Professional & Scientific Services in Morristown, TN?
37814 has the Highest Percentage of Population Employed in Professional & Scientific Services in Morristown, TN with 2.7%.
What is the Percentage of Population Employed in Professional & Scientific Services in Morristown, TN?
Percentage of Population Employed in Professional & Scientific Services in Morristown is 2.8%.
What is the Percentage of Population Employed in Professional & Scientific Services in Tennessee?
Percentage of Population Employed in Professional & Scientific Services in Tennessee is 5.7%.
What is the Percentage of Population Employed in Professional & Scientific Services in the United States?
Percentage of Population Employed in Professional & Scientific Services in the United States is 7.8%.