Zip Codes with the Highest Percentage of Population Employed in Sales & Related in Lebanon, TN
RELATED REPORTS & OPTIONS
Sales & Related
Lebanon
Compare Zip Codes
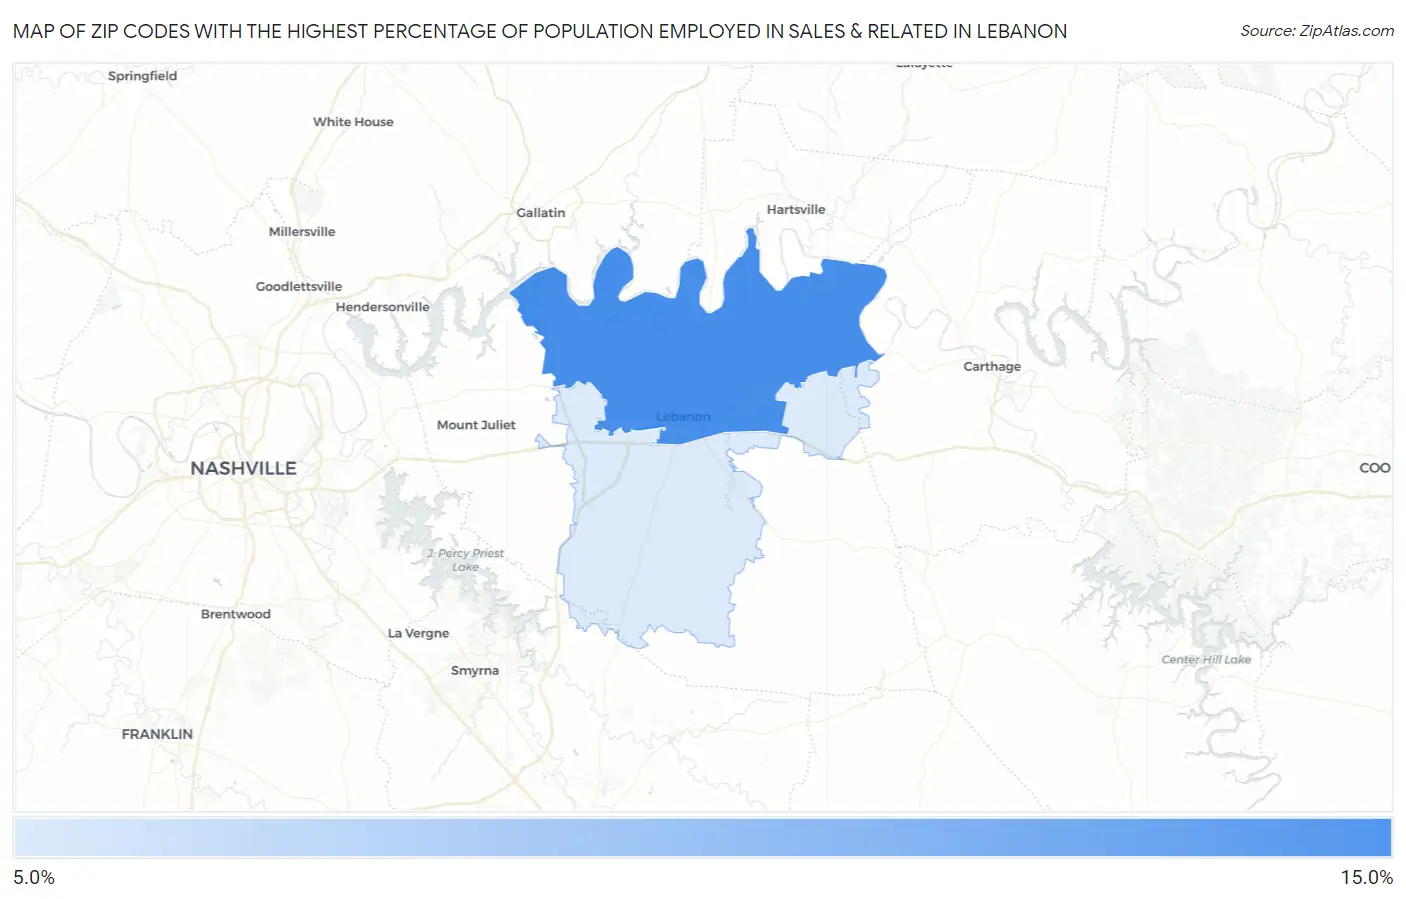
Map of Zip Codes with the Highest Percentage of Population Employed in Sales & Related in Lebanon
0.0%
15.0%
Zip Codes with the Highest Percentage of Population Employed in Sales & Related in Lebanon, TN
| Zip Code | % Employed | vs State | vs National | |
| 1. | 37087 | 12.2% | 9.8%(+2.38)#102 | 9.6%(+2.62)#5,642 |
| 2. | 37090 | 10.6% | 9.8%(+0.750)#186 | 9.6%(+0.988)#9,319 |
1
Common Questions
What are the Top Zip Codes with the Highest Percentage of Population Employed in Sales & Related in Lebanon, TN?
Top Zip Codes with the Highest Percentage of Population Employed in Sales & Related in Lebanon, TN are:
What zip code has the Highest Percentage of Population Employed in Sales & Related in Lebanon, TN?
37087 has the Highest Percentage of Population Employed in Sales & Related in Lebanon, TN with 12.2%.
What is the Percentage of Population Employed in Sales & Related in Lebanon, TN?
Percentage of Population Employed in Sales & Related in Lebanon is 9.6%.
What is the Percentage of Population Employed in Sales & Related in Tennessee?
Percentage of Population Employed in Sales & Related in Tennessee is 9.8%.
What is the Percentage of Population Employed in Sales & Related in the United States?
Percentage of Population Employed in Sales & Related in the United States is 9.6%.