Zip Codes with the Highest Percentage of Population Employed in Professional & Scientific Services in Lebanon, TN
RELATED REPORTS & OPTIONS
Professional & Scientific Services
Lebanon
Compare Zip Codes
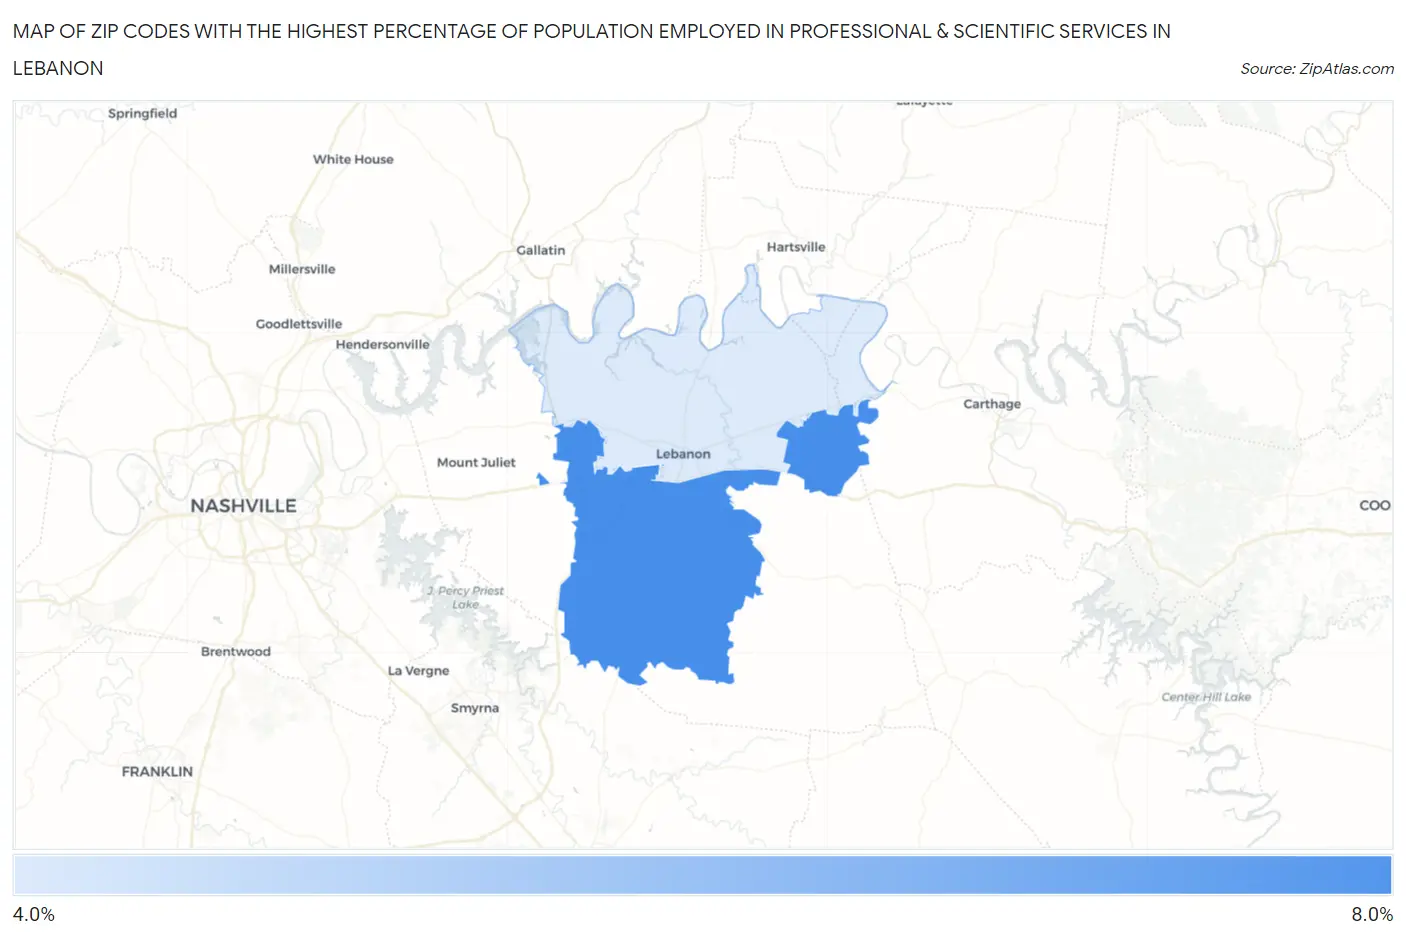
Map of Zip Codes with the Highest Percentage of Population Employed in Professional & Scientific Services in Lebanon
0.0%
8.0%
Zip Codes with the Highest Percentage of Population Employed in Professional & Scientific Services in Lebanon, TN
| Zip Code | % Employed | vs State | vs National | |
| 1. | 37090 | 7.2% | 5.7%(+1.45)#99 | 7.8%(-0.669)#7,845 |
| 2. | 37087 | 4.9% | 5.7%(-0.863)#191 | 7.8%(-2.99)#12,675 |
1
Common Questions
What are the Top Zip Codes with the Highest Percentage of Population Employed in Professional & Scientific Services in Lebanon, TN?
Top Zip Codes with the Highest Percentage of Population Employed in Professional & Scientific Services in Lebanon, TN are:
What zip code has the Highest Percentage of Population Employed in Professional & Scientific Services in Lebanon, TN?
37090 has the Highest Percentage of Population Employed in Professional & Scientific Services in Lebanon, TN with 7.2%.
What is the Percentage of Population Employed in Professional & Scientific Services in Lebanon, TN?
Percentage of Population Employed in Professional & Scientific Services in Lebanon is 5.2%.
What is the Percentage of Population Employed in Professional & Scientific Services in Tennessee?
Percentage of Population Employed in Professional & Scientific Services in Tennessee is 5.7%.
What is the Percentage of Population Employed in Professional & Scientific Services in the United States?
Percentage of Population Employed in Professional & Scientific Services in the United States is 7.8%.