Zip Codes with the Highest Percentage of Population Employed in Agriculture, Fishing & Hunting in Sioux Falls, SD
RELATED REPORTS & OPTIONS
Agriculture, Fishing & Hunting
Sioux Falls
Compare Zip Codes
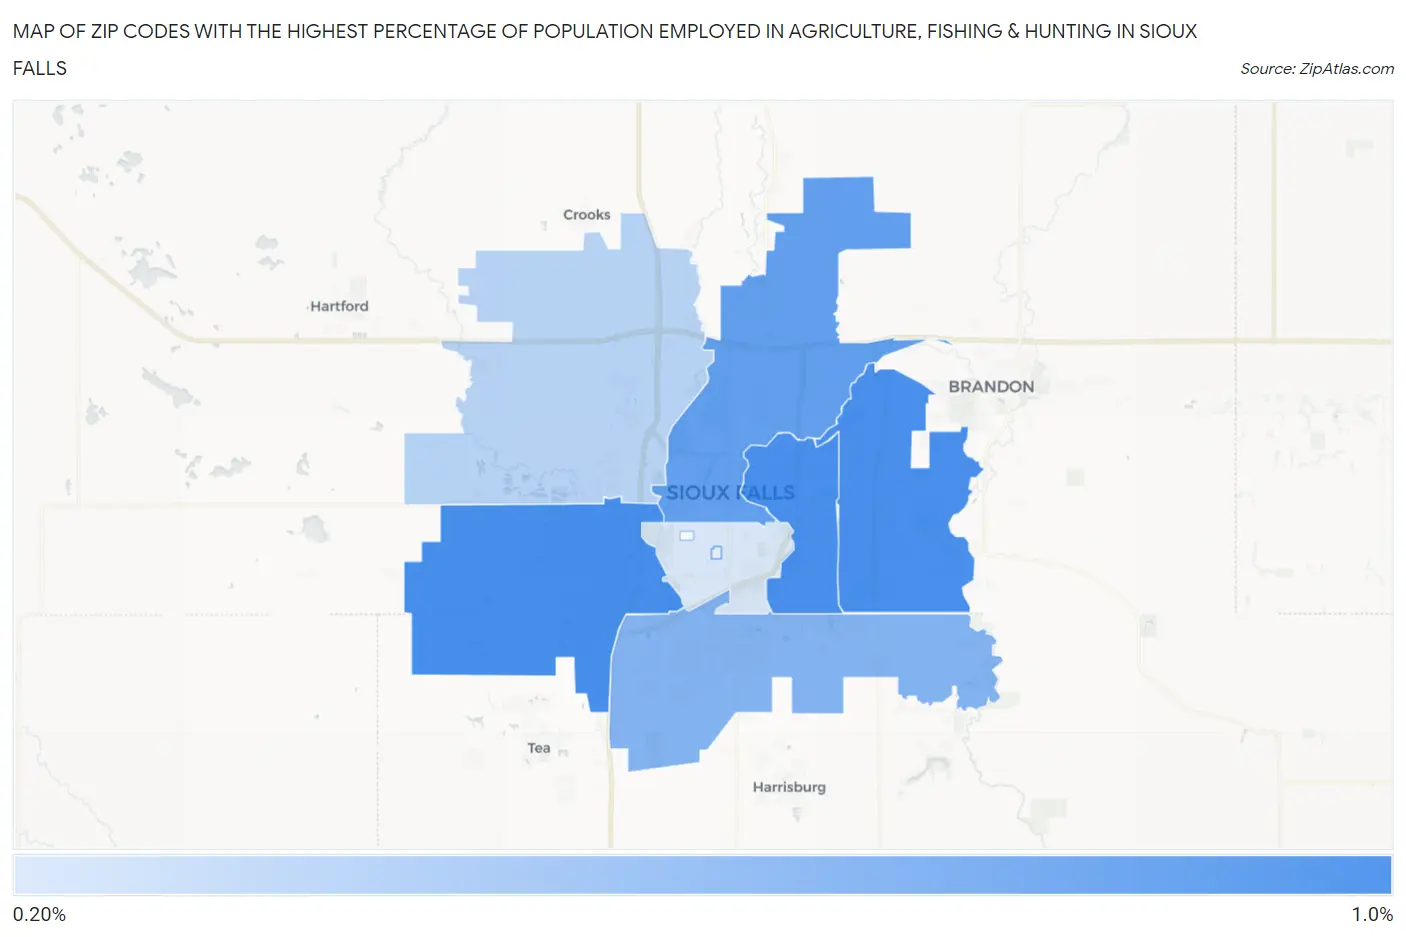
Map of Zip Codes with the Highest Percentage of Population Employed in Agriculture, Fishing & Hunting in Sioux Falls
0.26%
0.94%
Zip Codes with the Highest Percentage of Population Employed in Agriculture, Fishing & Hunting in Sioux Falls, SD
| Zip Code | % Employed | vs State | vs National | |
| 1. | 57106 | 0.94% | 5.9%(-4.95)#338 | 1.2%(-0.256)#16,481 |
| 2. | 57103 | 0.93% | 5.9%(-4.96)#340 | 1.2%(-0.267)#16,543 |
| 3. | 57110 | 0.93% | 5.9%(-4.96)#341 | 1.2%(-0.271)#16,565 |
| 4. | 57104 | 0.82% | 5.9%(-5.08)#342 | 1.2%(-0.383)#17,156 |
| 5. | 57108 | 0.66% | 5.9%(-5.24)#344 | 1.2%(-0.542)#18,090 |
| 6. | 57107 | 0.42% | 5.9%(-5.47)#346 | 1.2%(-0.780)#19,984 |
| 7. | 57105 | 0.26% | 5.9%(-5.63)#347 | 1.2%(-0.940)#21,657 |
1
Common Questions
What are the Top 5 Zip Codes with the Highest Percentage of Population Employed in Agriculture, Fishing & Hunting in Sioux Falls, SD?
Top 5 Zip Codes with the Highest Percentage of Population Employed in Agriculture, Fishing & Hunting in Sioux Falls, SD are:
What zip code has the Highest Percentage of Population Employed in Agriculture, Fishing & Hunting in Sioux Falls, SD?
57106 has the Highest Percentage of Population Employed in Agriculture, Fishing & Hunting in Sioux Falls, SD with 0.94%.
What is the Percentage of Population Employed in Agriculture, Fishing & Hunting in Sioux Falls, SD?
Percentage of Population Employed in Agriculture, Fishing & Hunting in Sioux Falls is 0.74%.
What is the Percentage of Population Employed in Agriculture, Fishing & Hunting in South Dakota?
Percentage of Population Employed in Agriculture, Fishing & Hunting in South Dakota is 5.9%.
What is the Percentage of Population Employed in Agriculture, Fishing & Hunting in the United States?
Percentage of Population Employed in Agriculture, Fishing & Hunting in the United States is 1.2%.