Zip Codes with the Highest Percentage of Population Employed in Farming, Fishing & Forestry in Rapid City, SD
RELATED REPORTS & OPTIONS
Farming, Fishing & Forestry
Rapid City
Compare Zip Codes
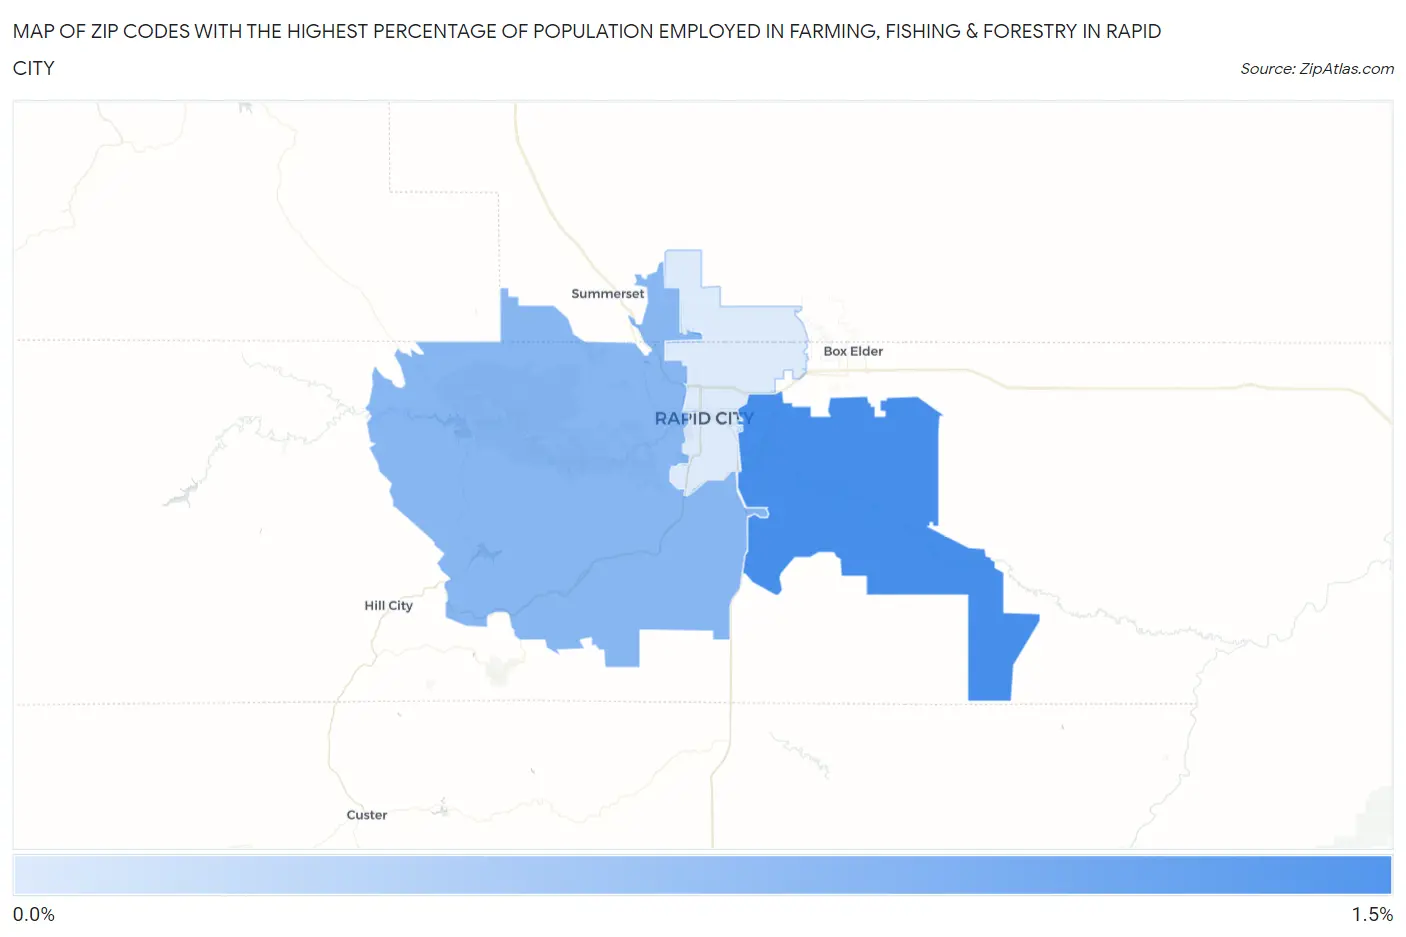
Map of Zip Codes with the Highest Percentage of Population Employed in Farming, Fishing & Forestry in Rapid City
0.0%
1.5%
Zip Codes with the Highest Percentage of Population Employed in Farming, Fishing & Forestry in Rapid City, SD
| Zip Code | % Employed | vs State | vs National | |
| 1. | 57703 | 1.2% | 1.7%(-0.568)#231 | 0.61%(+0.570)#9,022 |
| 2. | 57702 | 0.76% | 1.7%(-0.980)#250 | 0.61%(+0.158)#10,997 |
| 3. | 57701 | 0.22% | 1.7%(-1.52)#278 | 0.61%(-0.383)#15,810 |
1
Common Questions
What are the Top Zip Codes with the Highest Percentage of Population Employed in Farming, Fishing & Forestry in Rapid City, SD?
Top Zip Codes with the Highest Percentage of Population Employed in Farming, Fishing & Forestry in Rapid City, SD are:
What zip code has the Highest Percentage of Population Employed in Farming, Fishing & Forestry in Rapid City, SD?
57703 has the Highest Percentage of Population Employed in Farming, Fishing & Forestry in Rapid City, SD with 1.2%.
What is the Percentage of Population Employed in Farming, Fishing & Forestry in Rapid City, SD?
Percentage of Population Employed in Farming, Fishing & Forestry in Rapid City is 0.69%.
What is the Percentage of Population Employed in Farming, Fishing & Forestry in South Dakota?
Percentage of Population Employed in Farming, Fishing & Forestry in South Dakota is 1.7%.
What is the Percentage of Population Employed in Farming, Fishing & Forestry in the United States?
Percentage of Population Employed in Farming, Fishing & Forestry in the United States is 0.61%.