Ashland Heights, SD Map & Demographics
Ashland Heights Map
Ashland Heights Overview
$17,368
PER CAPITA INCOME
$58,808
AVG FAMILY INCOME
$59,186
AVG HOUSEHOLD INCOME
0.32
INEQUALITY / GINI INDEX
1,215
TOTAL POPULATION
734
MALE POPULATION
481
FEMALE POPULATION
152.60
MALES / 100 FEMALES
65.53
FEMALES / 100 MALES
47.9
MEDIAN AGE
3.6
AVG FAMILY SIZE
3.5
AVG HOUSEHOLD SIZE
576
LABOR FORCE [ PEOPLE ]
50.7%
PERCENT IN LABOR FORCE
28.8%
UNEMPLOYMENT RATE
Income in Ashland Heights
Income Overview in Ashland Heights
Per Capita Income in Ashland Heights is $17,368, while median incomes of families and households are $58,808 and $59,186 respectively.
| Characteristic | Number | Measure |
| Per Capita Income | 1,215 | $17,368 |
| Median Family Income | 317 | $58,808 |
| Mean Family Income | 317 | $52,175 |
| Median Household Income | 348 | $59,186 |
| Mean Household Income | 348 | $53,866 |
| Income Deficit | 317 | $0 |
| Wage / Income Gap (%) | 1,215 | 0.00% |
| Wage / Income Gap ($) | 1,215 | 100.00¢ per $1 |
| Gini / Inequality Index | 1,215 | 0.32 |
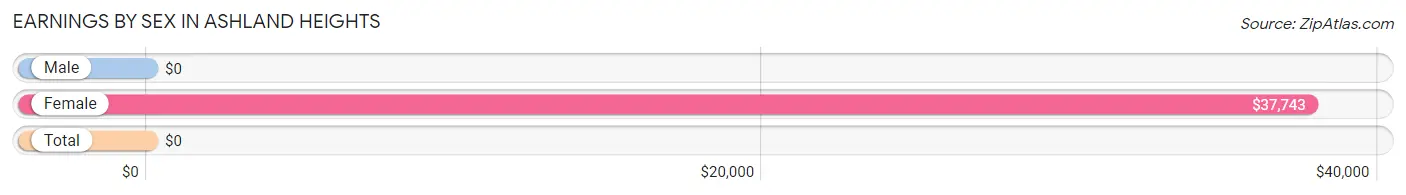
Earnings by Sex in Ashland Heights
| Sex | Number | Average Earnings |
| Male | 308 (54.8%) | $0 |
| Female | 254 (45.2%) | $37,743 |
| Total | 562 (100.0%) | $0 |
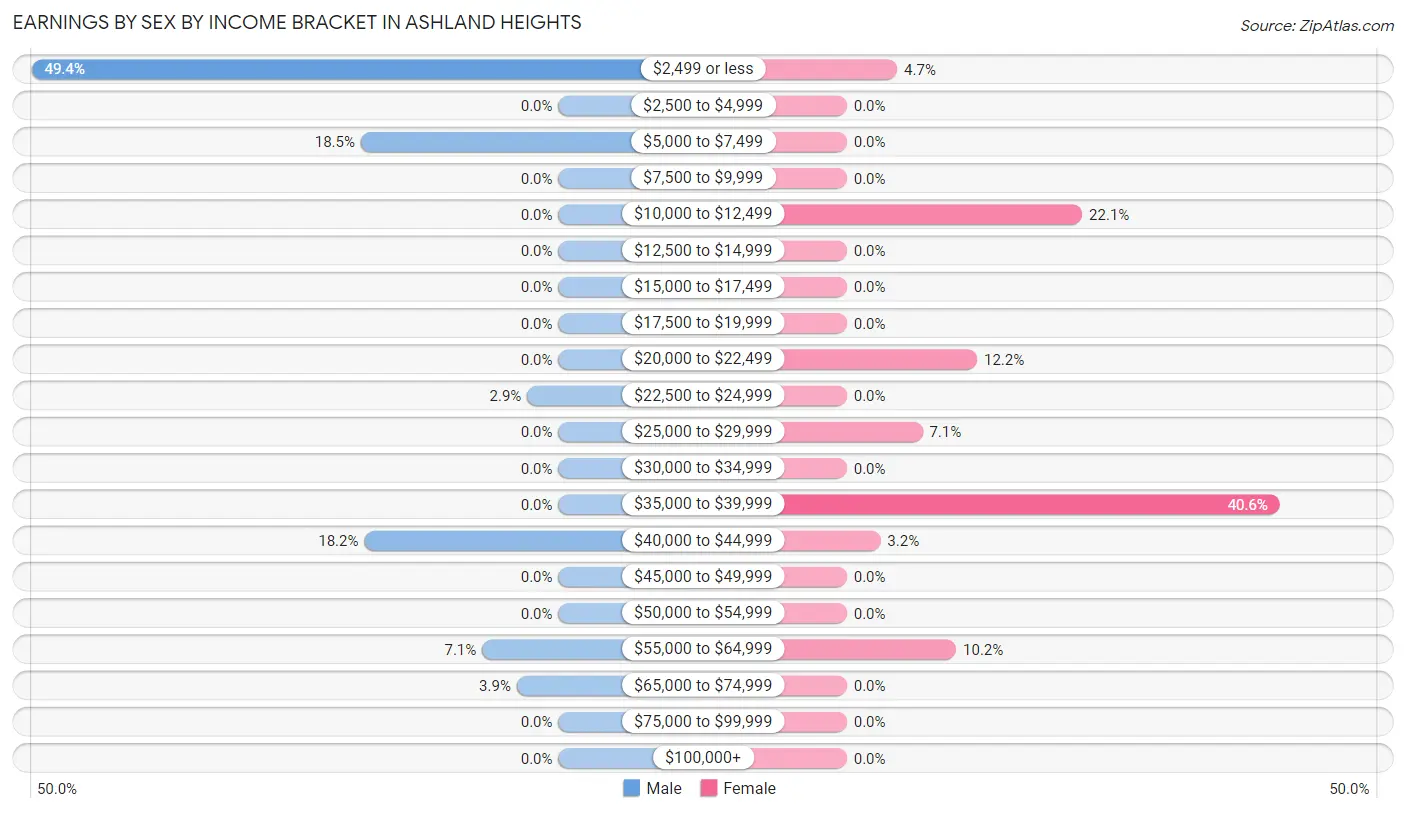
Earnings by Sex by Income Bracket in Ashland Heights
The most common earnings brackets in Ashland Heights are $2,499 or less for men (152 | 49.3%) and $35,000 to $39,999 for women (103 | 40.6%).
| Income | Male | Female |
| $2,499 or less | 152 (49.3%) | 12 (4.7%) |
| $2,500 to $4,999 | 0 (0.0%) | 0 (0.0%) |
| $5,000 to $7,499 | 57 (18.5%) | 0 (0.0%) |
| $7,500 to $9,999 | 0 (0.0%) | 0 (0.0%) |
| $10,000 to $12,499 | 0 (0.0%) | 56 (22.1%) |
| $12,500 to $14,999 | 0 (0.0%) | 0 (0.0%) |
| $15,000 to $17,499 | 0 (0.0%) | 0 (0.0%) |
| $17,500 to $19,999 | 0 (0.0%) | 0 (0.0%) |
| $20,000 to $22,499 | 0 (0.0%) | 31 (12.2%) |
| $22,500 to $24,999 | 9 (2.9%) | 0 (0.0%) |
| $25,000 to $29,999 | 0 (0.0%) | 18 (7.1%) |
| $30,000 to $34,999 | 0 (0.0%) | 0 (0.0%) |
| $35,000 to $39,999 | 0 (0.0%) | 103 (40.6%) |
| $40,000 to $44,999 | 56 (18.2%) | 8 (3.2%) |
| $45,000 to $49,999 | 0 (0.0%) | 0 (0.0%) |
| $50,000 to $54,999 | 0 (0.0%) | 0 (0.0%) |
| $55,000 to $64,999 | 22 (7.1%) | 26 (10.2%) |
| $65,000 to $74,999 | 12 (3.9%) | 0 (0.0%) |
| $75,000 to $99,999 | 0 (0.0%) | 0 (0.0%) |
| $100,000+ | 0 (0.0%) | 0 (0.0%) |
| Total | 308 (100.0%) | 254 (100.0%) |
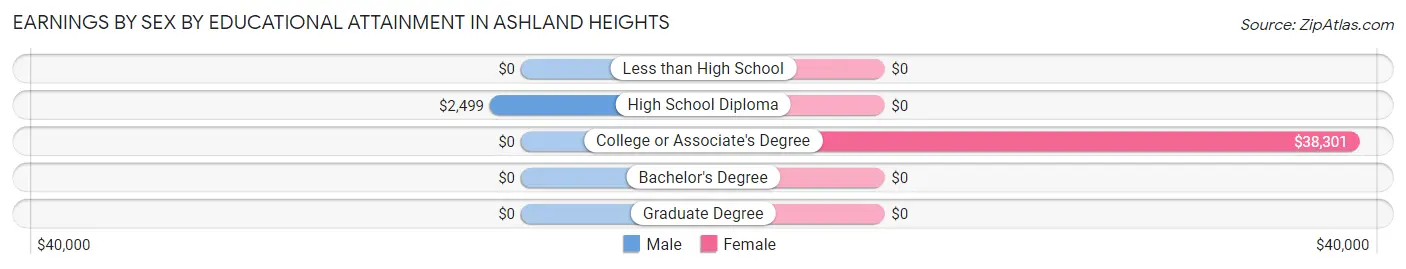
Earnings by Sex by Educational Attainment in Ashland Heights
| Educational Attainment | Male Income | Female Income |
| Less than High School | - | - |
| High School Diploma | $2,499 | $0 |
| College or Associate's Degree | - | - |
| Bachelor's Degree | - | - |
| Graduate Degree | - | - |
| Total | - | - |
Family Income in Ashland Heights
Family Income Brackets in Ashland Heights
According to the Ashland Heights family income data, there are 146 families falling into the $50,000 to $74,999 income range, which is the most common income bracket and makes up 46.1% of all families.
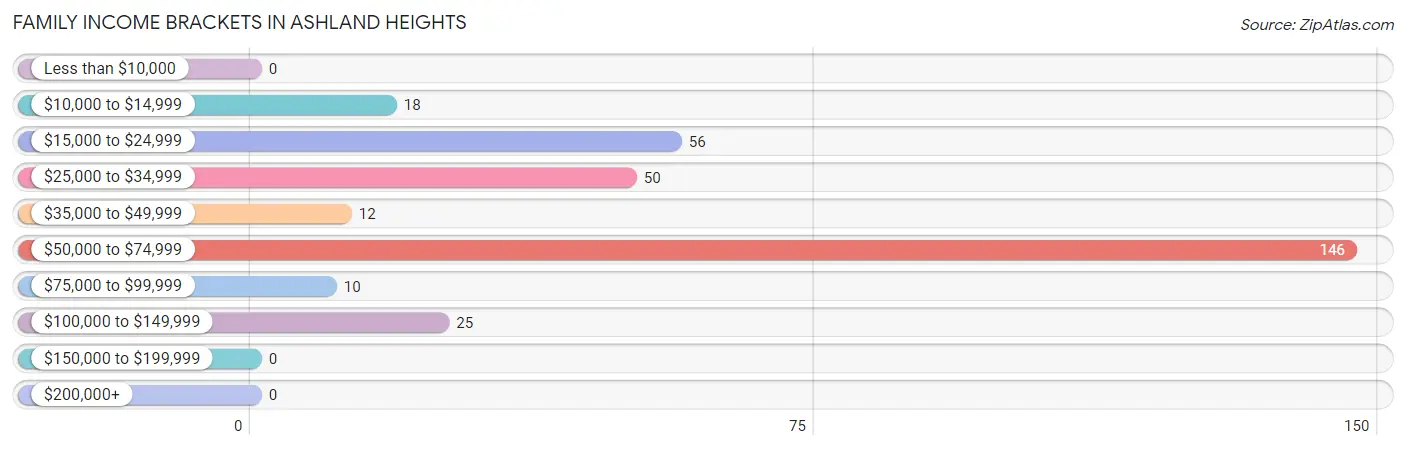
| Income Bracket | # Families | % Families |
| Less than $10,000 | 0 | 0.0% |
| $10,000 to $14,999 | 18 | 5.7% |
| $15,000 to $24,999 | 56 | 17.7% |
| $25,000 to $34,999 | 50 | 15.8% |
| $35,000 to $49,999 | 12 | 3.8% |
| $50,000 to $74,999 | 146 | 46.1% |
| $75,000 to $99,999 | 10 | 3.2% |
| $100,000 to $149,999 | 25 | 7.9% |
| $150,000 to $199,999 | 0 | 0.0% |
| $200,000+ | 0 | 0.0% |
Family Income by Famaliy Size in Ashland Heights
2-person families (142 | 44.8%) account for the highest median family income in Ashland Heights with $48,125 per family, while 2-person families (142 | 44.8%) have the highest median income of $24,062 per family member.
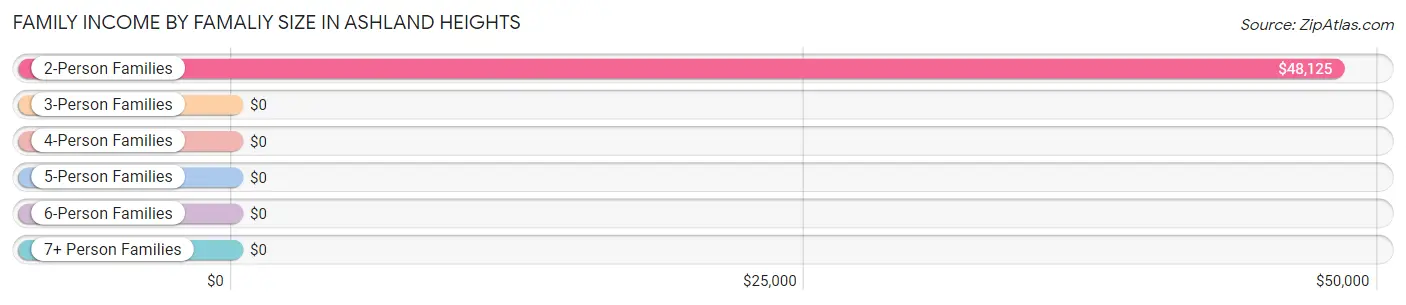
| Income Bracket | # Families | Median Income |
| 2-Person Families | 142 (44.8%) | $48,125 |
| 3-Person Families | 103 (32.5%) | $0 |
| 4-Person Families | 56 (17.7%) | $0 |
| 5-Person Families | 0 (0.0%) | $0 |
| 6-Person Families | 16 (5.1%) | $0 |
| 7+ Person Families | 0 (0.0%) | $0 |
| Total | 317 (100.0%) | $58,808 |
Family Income by Number of Earners in Ashland Heights
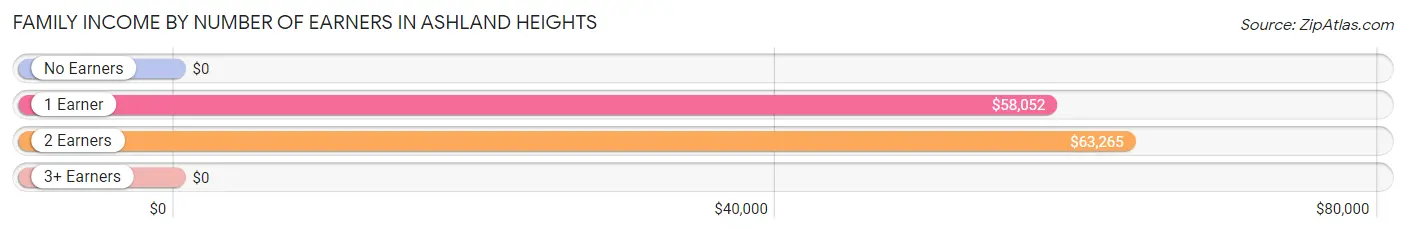
| Number of Earners | # Families | Median Income |
| No Earners | 37 (11.7%) | $0 |
| 1 Earner | 105 (33.1%) | $58,052 |
| 2 Earners | 175 (55.2%) | $63,265 |
| 3+ Earners | 0 (0.0%) | $0 |
| Total | 317 (100.0%) | $58,808 |
Household Income in Ashland Heights
Household Income Brackets in Ashland Heights
With 146 households falling in the category, the $50,000 to $74,999 income range is the most frequent in Ashland Heights, accounting for 41.9% of all households.
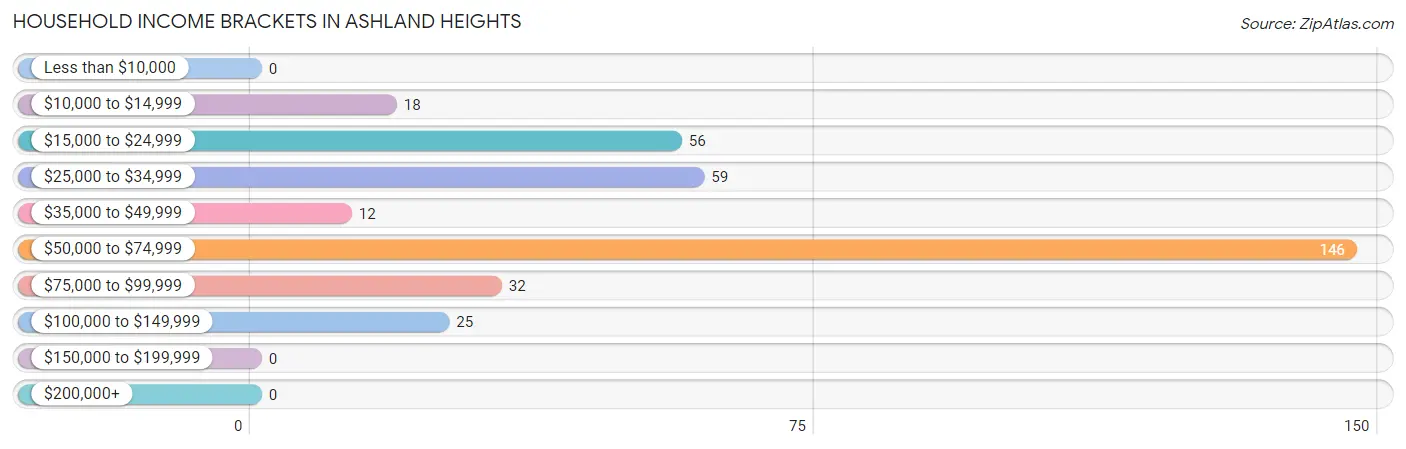
| Income Bracket | # Households | % Households |
| Less than $10,000 | 0 | 0.0% |
| $10,000 to $14,999 | 18 | 5.2% |
| $15,000 to $24,999 | 56 | 16.1% |
| $25,000 to $34,999 | 59 | 17.0% |
| $35,000 to $49,999 | 12 | 3.4% |
| $50,000 to $74,999 | 146 | 42.0% |
| $75,000 to $99,999 | 32 | 9.2% |
| $100,000 to $149,999 | 25 | 7.2% |
| $150,000 to $199,999 | 0 | 0.0% |
| $200,000+ | 0 | 0.0% |
Household Income by Householder Age in Ashland Heights
The median household income in Ashland Heights is $59,186, with the highest median household income of $62,561 found in the 45 to 64 years age bracket for the primary householder. A total of 283 households (81.3%) fall into this category.
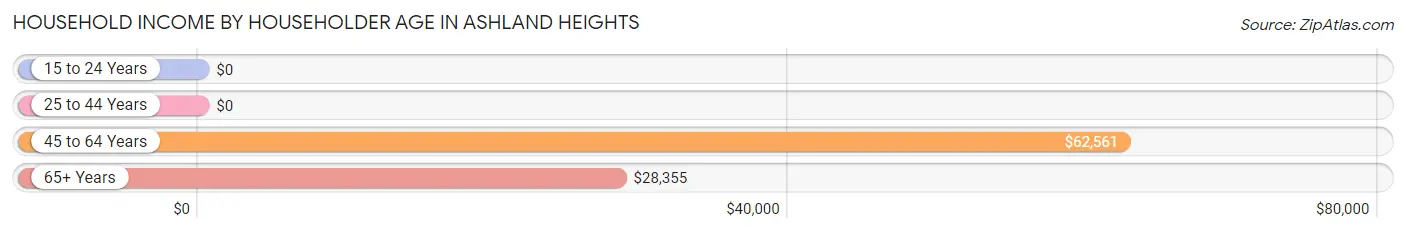
| Income Bracket | # Households | Median Income |
| 15 to 24 Years | 0 (0.0%) | $0 |
| 25 to 44 Years | 16 (4.6%) | $0 |
| 45 to 64 Years | 283 (81.3%) | $62,561 |
| 65+ Years | 49 (14.1%) | $28,355 |
| Total | 348 (100.0%) | $59,186 |
Poverty in Ashland Heights
Income Below Poverty by Sex and Age in Ashland Heights
With 28.2% poverty level for males and 23.7% for females among the residents of Ashland Heights, 18 to 24 year old males and 18 to 24 year old females are the most vulnerable to poverty, with 128 males (100.0%) and 35 females (100.0%) in their respective age groups living below the poverty level.
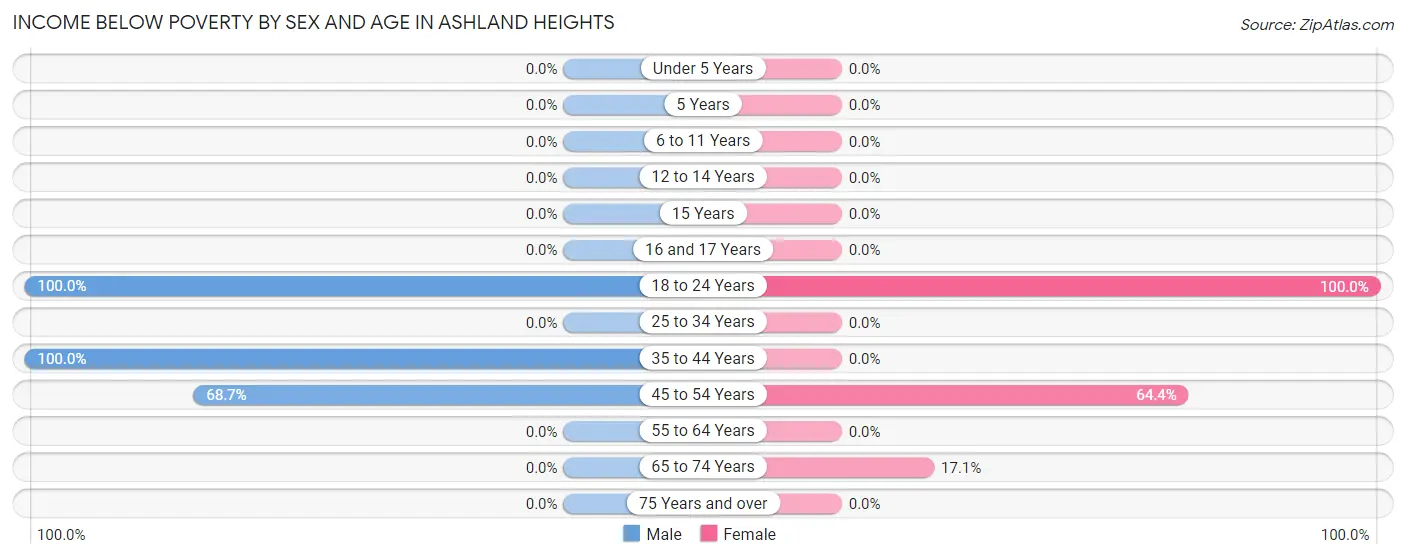
| Age Bracket | Male | Female |
| Under 5 Years | 0 (0.0%) | 0 (0.0%) |
| 5 Years | 0 (0.0%) | 0 (0.0%) |
| 6 to 11 Years | 0 (0.0%) | 0 (0.0%) |
| 12 to 14 Years | 0 (0.0%) | 0 (0.0%) |
| 15 Years | 0 (0.0%) | 0 (0.0%) |
| 16 and 17 Years | 0 (0.0%) | 0 (0.0%) |
| 18 to 24 Years | 128 (100.0%) | 35 (100.0%) |
| 25 to 34 Years | 0 (0.0%) | 0 (0.0%) |
| 35 to 44 Years | 22 (100.0%) | 0 (0.0%) |
| 45 to 54 Years | 57 (68.7%) | 56 (64.4%) |
| 55 to 64 Years | 0 (0.0%) | 0 (0.0%) |
| 65 to 74 Years | 0 (0.0%) | 18 (17.1%) |
| 75 Years and over | 0 (0.0%) | 0 (0.0%) |
| Total | 207 (28.2%) | 109 (23.7%) |
Income Above Poverty by Sex and Age in Ashland Heights
According to the poverty statistics in Ashland Heights, males aged 6 to 11 years and females aged 16 and 17 years are the age groups that are most secure financially, with 100.0% of males and 100.0% of females in these age groups living above the poverty line.
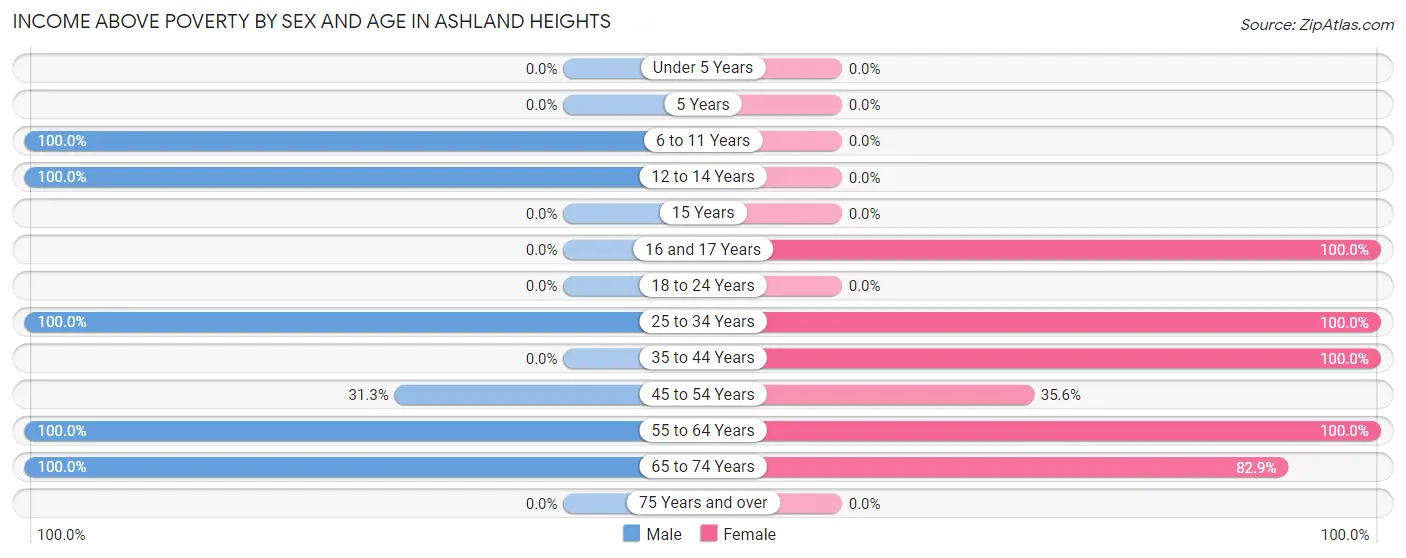
| Age Bracket | Male | Female |
| Under 5 Years | 0 (0.0%) | 0 (0.0%) |
| 5 Years | 0 (0.0%) | 0 (0.0%) |
| 6 to 11 Years | 38 (100.0%) | 0 (0.0%) |
| 12 to 14 Years | 19 (100.0%) | 0 (0.0%) |
| 15 Years | 0 (0.0%) | 0 (0.0%) |
| 16 and 17 Years | 0 (0.0%) | 35 (100.0%) |
| 18 to 24 Years | 0 (0.0%) | 0 (0.0%) |
| 25 to 34 Years | 208 (100.0%) | 16 (100.0%) |
| 35 to 44 Years | 0 (0.0%) | 18 (100.0%) |
| 45 to 54 Years | 26 (31.3%) | 31 (35.6%) |
| 55 to 64 Years | 206 (100.0%) | 164 (100.0%) |
| 65 to 74 Years | 30 (100.0%) | 87 (82.9%) |
| 75 Years and over | 0 (0.0%) | 0 (0.0%) |
| Total | 527 (71.8%) | 351 (76.3%) |
Income Below Poverty Among Married-Couple Families in Ashland Heights
The poverty statistics for married-couple families in Ashland Heights show that 26.3% or 56 of the total 213 families live below the poverty line. Families with no children have the highest poverty rate of 28.4%, comprising of 56 families. On the other hand, families with 3 or 4 children have the lowest poverty rate of 0.0%, which includes 0 families.
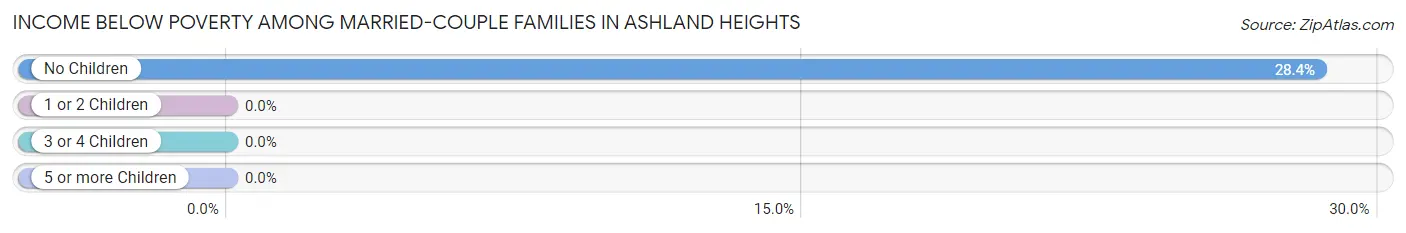
| Children | Above Poverty | Below Poverty |
| No Children | 141 (71.6%) | 56 (28.4%) |
| 1 or 2 Children | 0 (0.0%) | 0 (0.0%) |
| 3 or 4 Children | 16 (100.0%) | 0 (0.0%) |
| 5 or more Children | 0 (0.0%) | 0 (0.0%) |
| Total | 157 (73.7%) | 56 (26.3%) |
Income Below Poverty Among Single-Parent Households in Ashland Heights
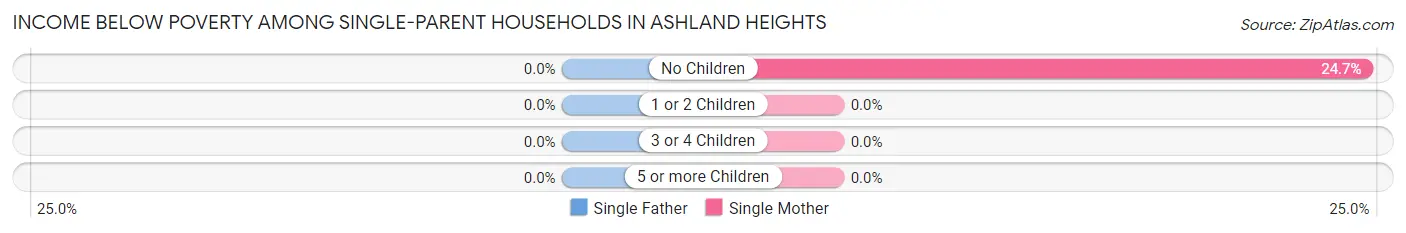
| Children | Single Father | Single Mother |
| No Children | 0 (0.0%) | 18 (24.7%) |
| 1 or 2 Children | 0 (0.0%) | 0 (0.0%) |
| 3 or 4 Children | 0 (0.0%) | 0 (0.0%) |
| 5 or more Children | 0 (0.0%) | 0 (0.0%) |
| Total | 0 (0.0%) | 18 (17.3%) |
Income Below Poverty Among Married-Couple vs Single-Parent Households in Ashland Heights
The poverty data for Ashland Heights shows that 56 of the married-couple family households (26.3%) and 18 of the single-parent households (17.3%) are living below the poverty level. Within the married-couple family households, those with no children have the highest poverty rate, with 56 households (28.4%) falling below the poverty line. Among the single-parent households, those with no children have the highest poverty rate, with 18 household (24.7%) living below poverty.
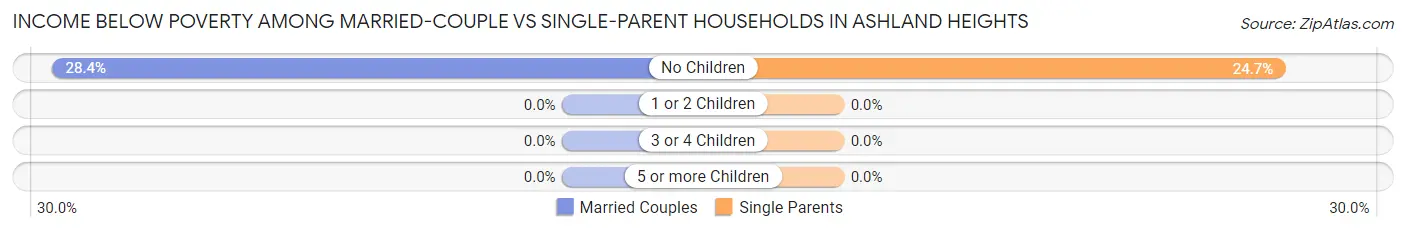
| Children | Married-Couple Families | Single-Parent Households |
| No Children | 56 (28.4%) | 18 (24.7%) |
| 1 or 2 Children | 0 (0.0%) | 0 (0.0%) |
| 3 or 4 Children | 0 (0.0%) | 0 (0.0%) |
| 5 or more Children | 0 (0.0%) | 0 (0.0%) |
| Total | 56 (26.3%) | 18 (17.3%) |
Race in Ashland Heights
The most populous races in Ashland Heights are White / Caucasian (1,043 | 85.8%), and Two or more Races (172 | 14.2%).
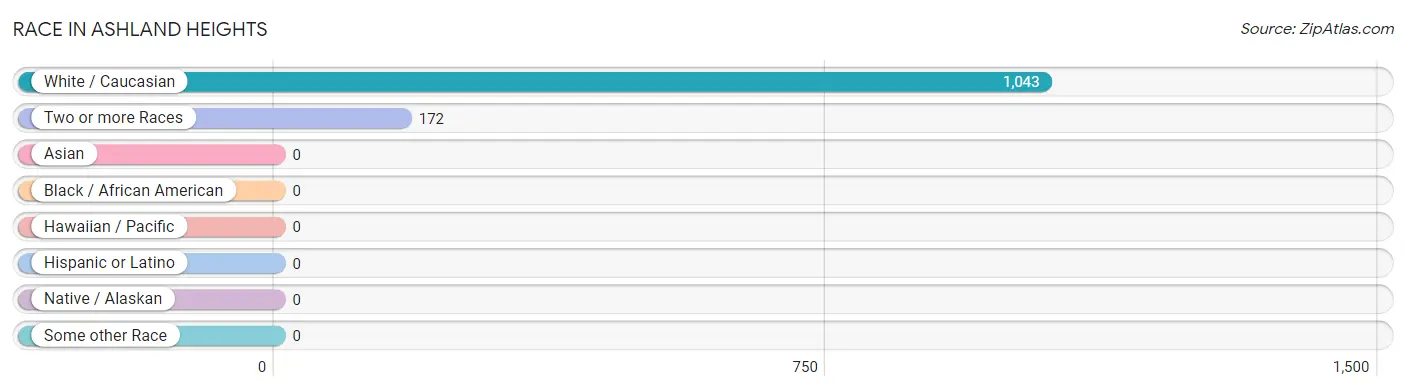
| Race | # Population | % Population |
| Asian | 0 | 0.0% |
| Black / African American | 0 | 0.0% |
| Hawaiian / Pacific | 0 | 0.0% |
| Hispanic or Latino | 0 | 0.0% |
| Native / Alaskan | 0 | 0.0% |
| White / Caucasian | 1,043 | 85.8% |
| Two or more Races | 172 | 14.2% |
| Some other Race | 0 | 0.0% |
| Total | 1,215 | 100.0% |
Ancestry in Ashland Heights
The most populous ancestries reported in Ashland Heights are German (374 | 30.8%), Irish (336 | 27.7%), French (152 | 12.5%), Scandinavian (103 | 8.5%), and Sioux (73 | 6.0%), together accounting for 85.4% of all Ashland Heights residents.
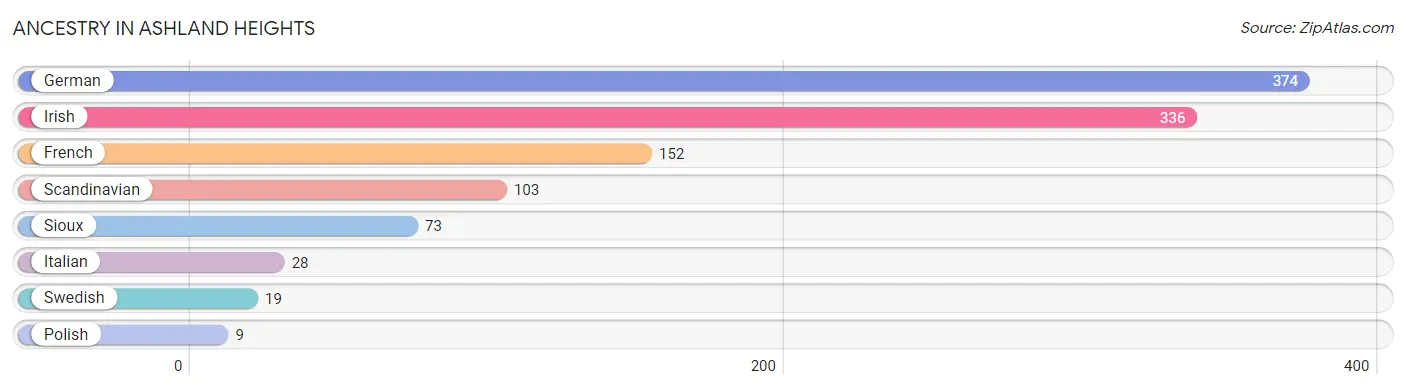
| Ancestry | # Population | % Population |
| French | 152 | 12.5% |
| German | 374 | 30.8% |
| Irish | 336 | 27.7% |
| Italian | 28 | 2.3% |
| Polish | 9 | 0.7% |
| Scandinavian | 103 | 8.5% |
| Sioux | 73 | 6.0% |
| Swedish | 19 | 1.6% | View All 8 Rows |
Immigrants in Ashland Heights

| Immigration Origin | # Population | % Population | View All 0 Rows |
Sex and Age in Ashland Heights
Sex and Age in Ashland Heights
The most populous age groups in Ashland Heights are 25 to 29 Years (208 | 28.3%) for men and 55 to 59 Years (103 | 21.4%) for women.
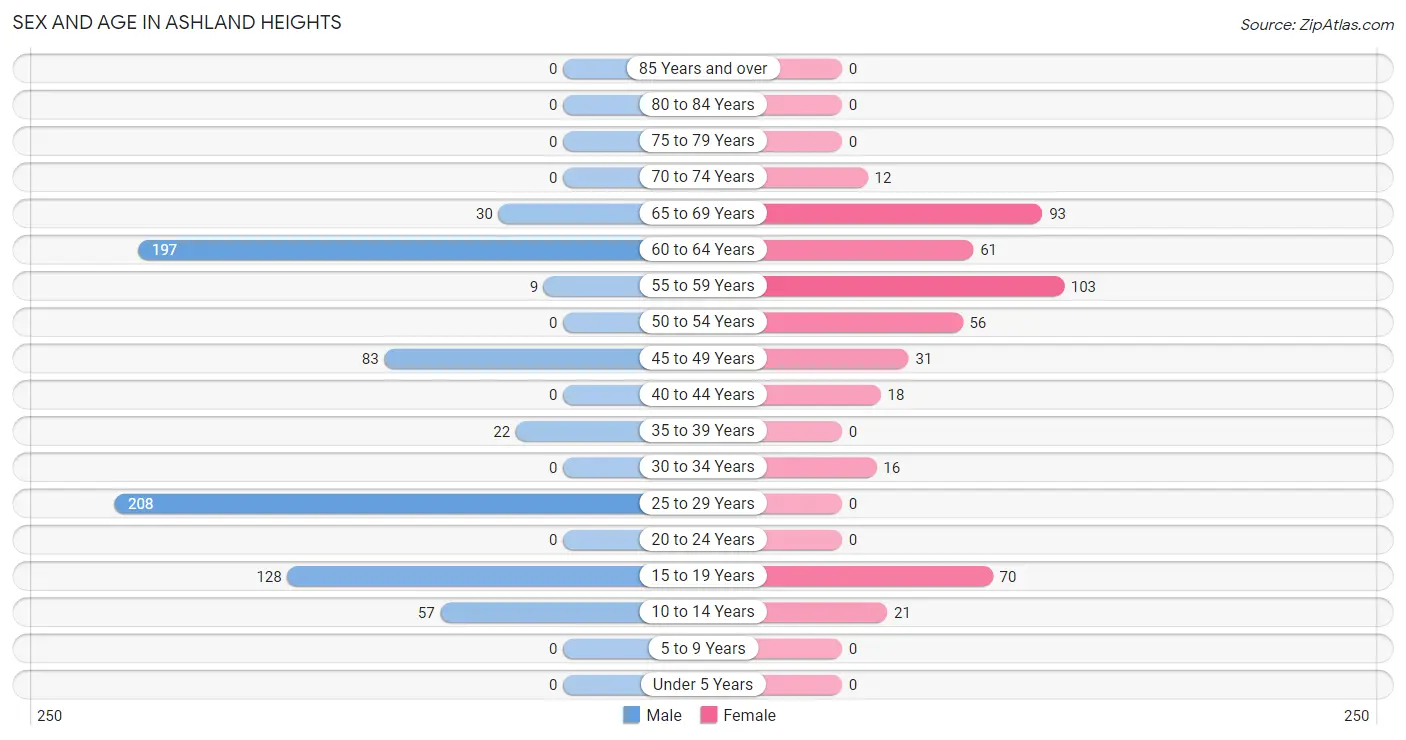
| Age Bracket | Male | Female |
| Under 5 Years | 0 (0.0%) | 0 (0.0%) |
| 5 to 9 Years | 0 (0.0%) | 0 (0.0%) |
| 10 to 14 Years | 57 (7.8%) | 21 (4.4%) |
| 15 to 19 Years | 128 (17.4%) | 70 (14.5%) |
| 20 to 24 Years | 0 (0.0%) | 0 (0.0%) |
| 25 to 29 Years | 208 (28.3%) | 0 (0.0%) |
| 30 to 34 Years | 0 (0.0%) | 16 (3.3%) |
| 35 to 39 Years | 22 (3.0%) | 0 (0.0%) |
| 40 to 44 Years | 0 (0.0%) | 18 (3.7%) |
| 45 to 49 Years | 83 (11.3%) | 31 (6.4%) |
| 50 to 54 Years | 0 (0.0%) | 56 (11.6%) |
| 55 to 59 Years | 9 (1.2%) | 103 (21.4%) |
| 60 to 64 Years | 197 (26.8%) | 61 (12.7%) |
| 65 to 69 Years | 30 (4.1%) | 93 (19.3%) |
| 70 to 74 Years | 0 (0.0%) | 12 (2.5%) |
| 75 to 79 Years | 0 (0.0%) | 0 (0.0%) |
| 80 to 84 Years | 0 (0.0%) | 0 (0.0%) |
| 85 Years and over | 0 (0.0%) | 0 (0.0%) |
| Total | 734 (100.0%) | 481 (100.0%) |
Families and Households in Ashland Heights
Median Family Size in Ashland Heights
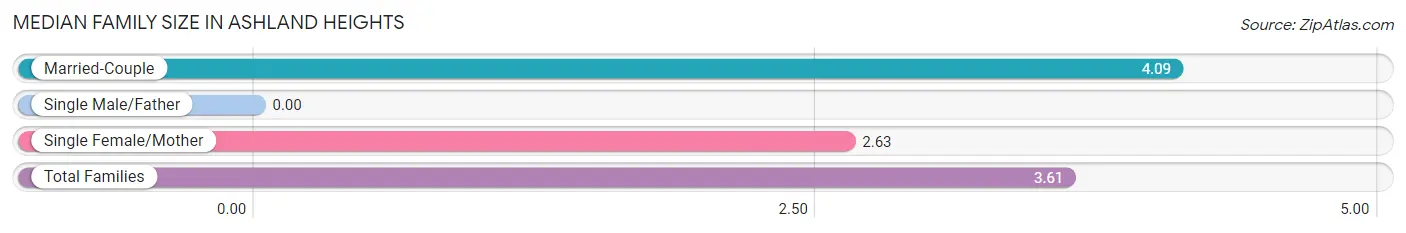
| Family Type | # Families | Family Size |
| Married-Couple | 213 (67.2%) | 4.09 |
| Single Male/Father | 0 (0.0%) | - |
| Single Female/Mother | 104 (32.8%) | 2.63 |
| Total Families | 317 (100.0%) | 3.61 |
Median Household Size in Ashland Heights
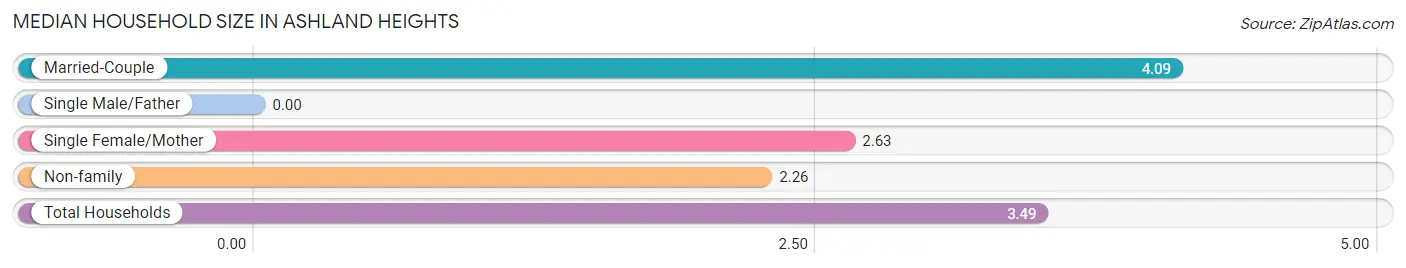
| Household Type | # Households | Household Size |
| Married-Couple | 213 (61.2%) | 4.09 |
| Single Male/Father | 0 (0.0%) | - |
| Single Female/Mother | 104 (29.9%) | 2.63 |
| Non-family | 31 (8.9%) | 2.26 |
| Total Households | 348 (100.0%) | 3.49 |
Household Size by Marriage Status in Ashland Heights
Out of a total of 348 households in Ashland Heights, 317 (91.1%) are family households, while 31 (8.9%) are nonfamily households. The most numerous type of family households are 2-person households, comprising 142, and the most common type of nonfamily households are 3-person households, comprising 22.
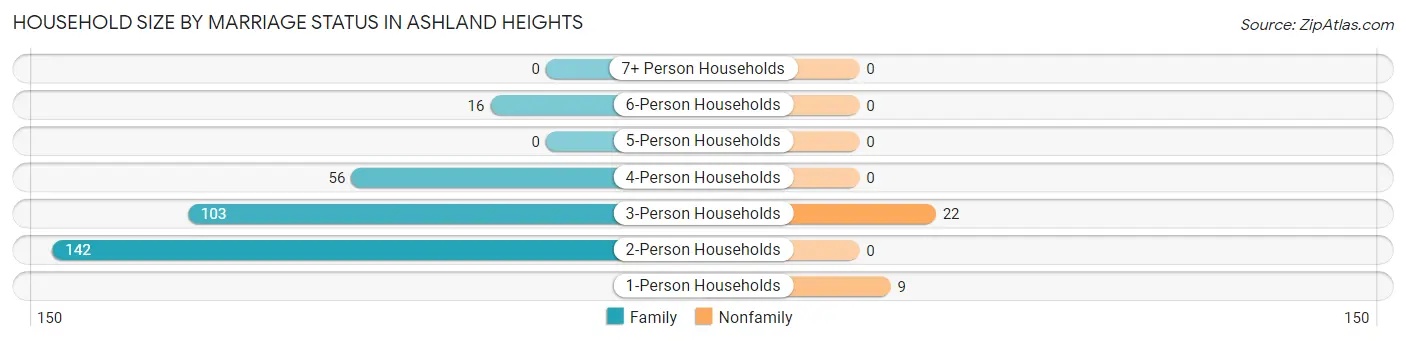
| Household Size | Family Households | Nonfamily Households |
| 1-Person Households | - | 9 (2.6%) |
| 2-Person Households | 142 (40.8%) | 0 (0.0%) |
| 3-Person Households | 103 (29.6%) | 22 (6.3%) |
| 4-Person Households | 56 (16.1%) | 0 (0.0%) |
| 5-Person Households | 0 (0.0%) | 0 (0.0%) |
| 6-Person Households | 16 (4.6%) | 0 (0.0%) |
| 7+ Person Households | 0 (0.0%) | 0 (0.0%) |
| Total | 317 (91.1%) | 31 (8.9%) |
Female Fertility in Ashland Heights
Fertility by Age in Ashland Heights
| Age Bracket | Women with Births | Births / 1,000 Women |
| 15 to 19 years | 0 (0.0%) | 0.0 |
| 20 to 34 years | 0 (0.0%) | 0.0 |
| 35 to 50 years | 0 (0.0%) | 0.0 |
| Total | 0 (0.0%) | 0.0 |
Fertility by Age by Marriage Status in Ashland Heights
| Age Bracket | Married | Unmarried |
| 15 to 19 years | 0 (0.0%) | 0 (0.0%) |
| 20 to 34 years | 0 (0.0%) | 0 (0.0%) |
| 35 to 50 years | 0 (0.0%) | 0 (0.0%) |
| Total | 0 (0.0%) | 0 (0.0%) |
Fertility by Education in Ashland Heights
| Educational Attainment | Women with Births | Births / 1,000 Women |
| Less than High School | 0 (0.0%) | 0.0 |
| High School Diploma | 0 (0.0%) | 0.0 |
| College or Associate's Degree | 0 (0.0%) | 0.0 |
| Bachelor's Degree | 0 (0.0%) | 0.0 |
| Graduate Degree | 0 (0.0%) | 0.0 |
| Total | 0 (0.0%) | 0.0 |
Fertility by Education by Marriage Status in Ashland Heights
| Educational Attainment | Married | Unmarried |
| Less than High School | 0 (0.0%) | 0 (0.0%) |
| High School Diploma | 0 (0.0%) | 0 (0.0%) |
| College or Associate's Degree | 0 (0.0%) | 0 (0.0%) |
| Bachelor's Degree | 0 (0.0%) | 0 (0.0%) |
| Graduate Degree | 0 (0.0%) | 0 (0.0%) |
| Total | 0 (0.0%) | 0 (0.0%) |
Employment Characteristics in Ashland Heights
Employment by Class of Employer in Ashland Heights
Among the 410 employed individuals in Ashland Heights, private company employees (256 | 62.4%), self-employed (not incorporated) (57 | 13.9%), and not-for-profit organizations (56 | 13.7%) make up the most common classes of employment.
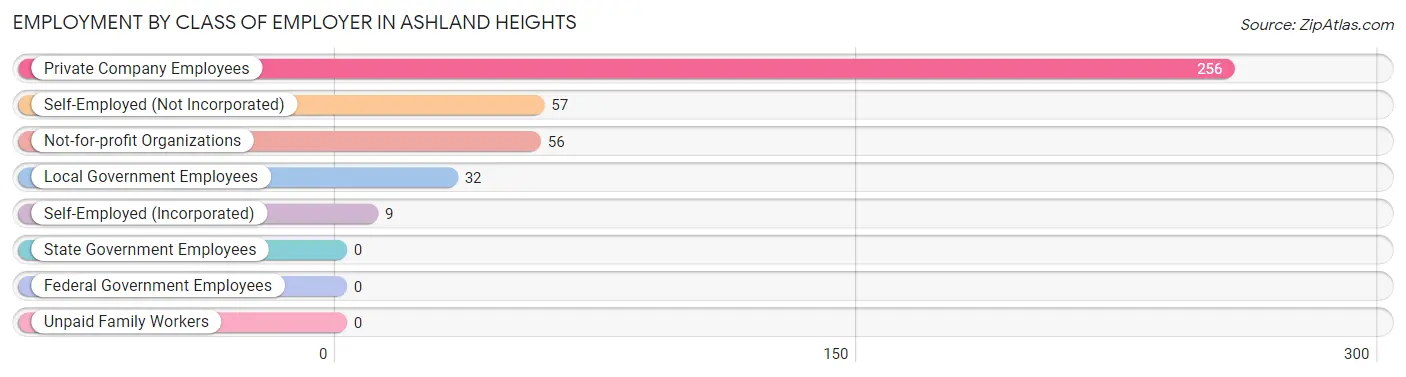
| Employer Class | # Employees | % Employees |
| Private Company Employees | 256 | 62.4% |
| Self-Employed (Incorporated) | 9 | 2.2% |
| Self-Employed (Not Incorporated) | 57 | 13.9% |
| Not-for-profit Organizations | 56 | 13.7% |
| Local Government Employees | 32 | 7.8% |
| State Government Employees | 0 | 0.0% |
| Federal Government Employees | 0 | 0.0% |
| Unpaid Family Workers | 0 | 0.0% |
| Total | 410 | 100.0% |
Employment Status by Age in Ashland Heights
According to the labor force statistics for Ashland Heights, out of the total population over 16 years of age (1,137), 50.7% or 576 individuals are in the labor force, with 28.8% or 166 of them unemployed. The age group with the highest labor force participation rate is 25 to 29 years, with 100.0% or 208 individuals in the labor force. Within the labor force, the 25 to 29 years age range has the highest percentage of unemployed individuals, with 73.1% or 152 of them being unemployed.
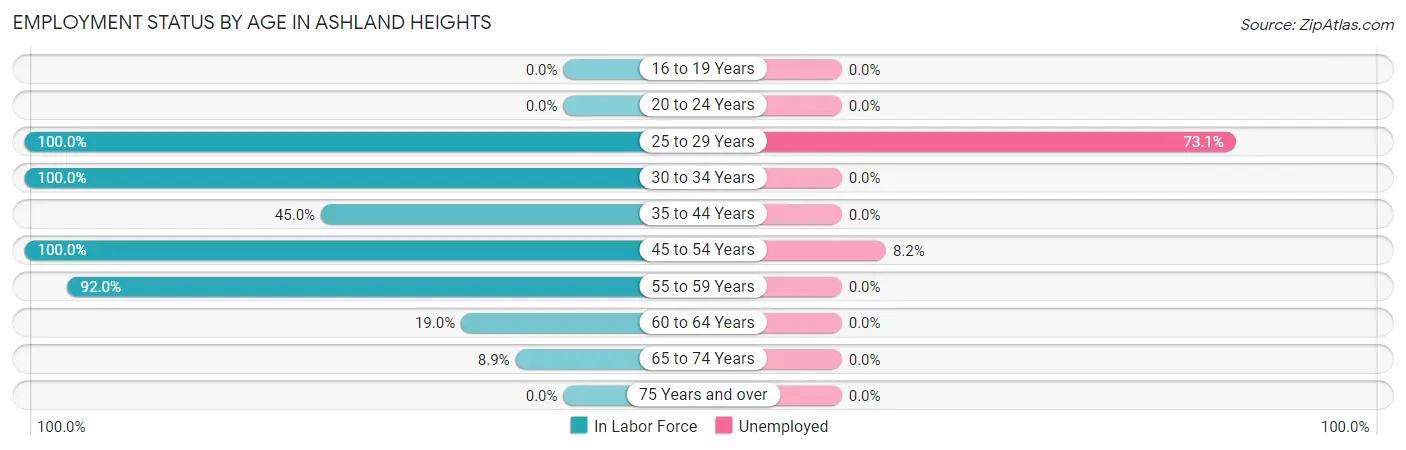
| Age Bracket | In Labor Force | Unemployed |
| 16 to 19 Years | 0 (0.0%) | 0 (0.0%) |
| 20 to 24 Years | 0 (0.0%) | 0 (0.0%) |
| 25 to 29 Years | 208 (100.0%) | 152 (73.1%) |
| 30 to 34 Years | 16 (100.0%) | 0 (0.0%) |
| 35 to 44 Years | 18 (45.0%) | 0 (0.0%) |
| 45 to 54 Years | 170 (100.0%) | 14 (8.2%) |
| 55 to 59 Years | 103 (92.0%) | 0 (0.0%) |
| 60 to 64 Years | 49 (19.0%) | 0 (0.0%) |
| 65 to 74 Years | 12 (8.9%) | 0 (0.0%) |
| 75 Years and over | 0 (0.0%) | 0 (0.0%) |
| Total | 576 (50.7%) | 166 (28.8%) |
Employment Status by Educational Attainment in Ashland Heights
According to labor force statistics for Ashland Heights, 70.1% of individuals (564) out of the total population between 25 and 64 years of age (804) are in the labor force, with 29.4% or 166 of them being unemployed. The group with the highest labor force participation rate are those with the educational attainment of less than high school, with 100.0% or 22 individuals in the labor force. Within the labor force, individuals with bachelor's degree or higher education have the highest percentage of unemployment, with 58.3% or 14 of them being unemployed.
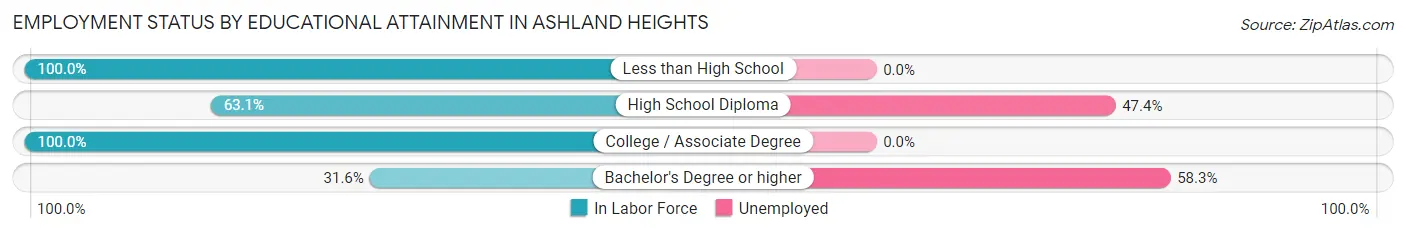
| Educational Attainment | In Labor Force | Unemployed |
| Less than High School | 22 (100.0%) | 0 (0.0%) |
| High School Diploma | 321 (63.1%) | 241 (47.4%) |
| College / Associate Degree | 197 (100.0%) | 0 (0.0%) |
| Bachelor's Degree or higher | 24 (31.6%) | 44 (58.3%) |
| Total | 564 (70.1%) | 236 (29.4%) |
Employment Occupations by Sex in Ashland Heights
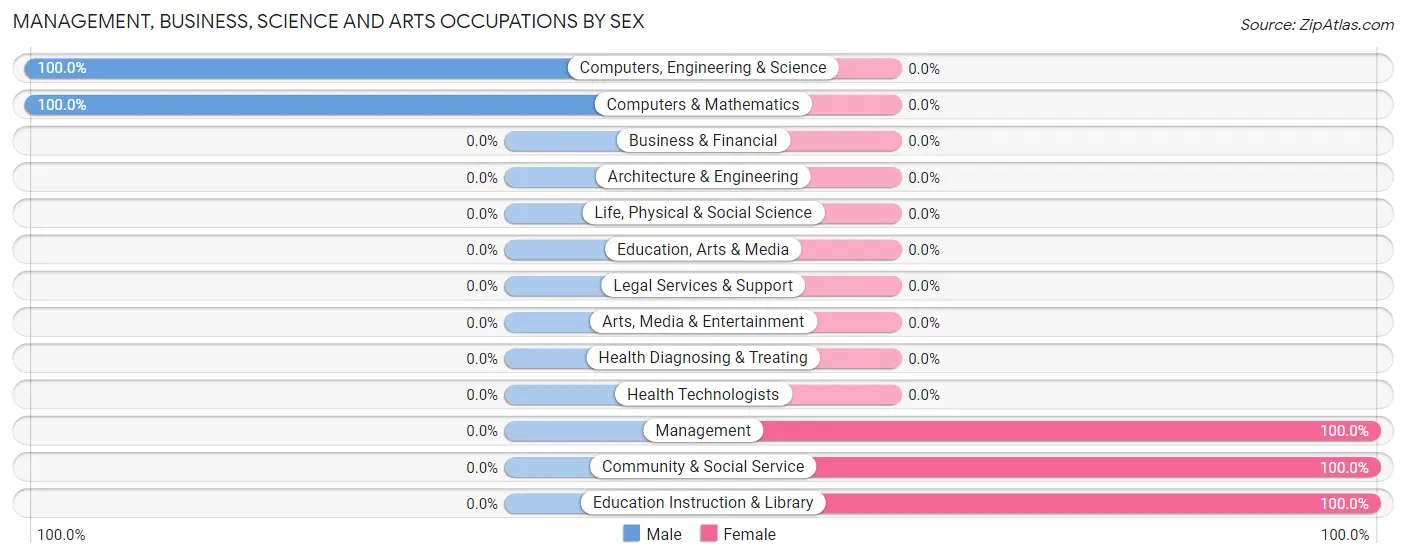
Management, Business, Science and Arts Occupations
The most common Management, Business, Science and Arts occupations in Ashland Heights are Management (115 | 28.1%), Computers, Engineering & Science (12 | 2.9%), Computers & Mathematics (12 | 2.9%), Community & Social Service (10 | 2.4%), and Education Instruction & Library (10 | 2.4%).
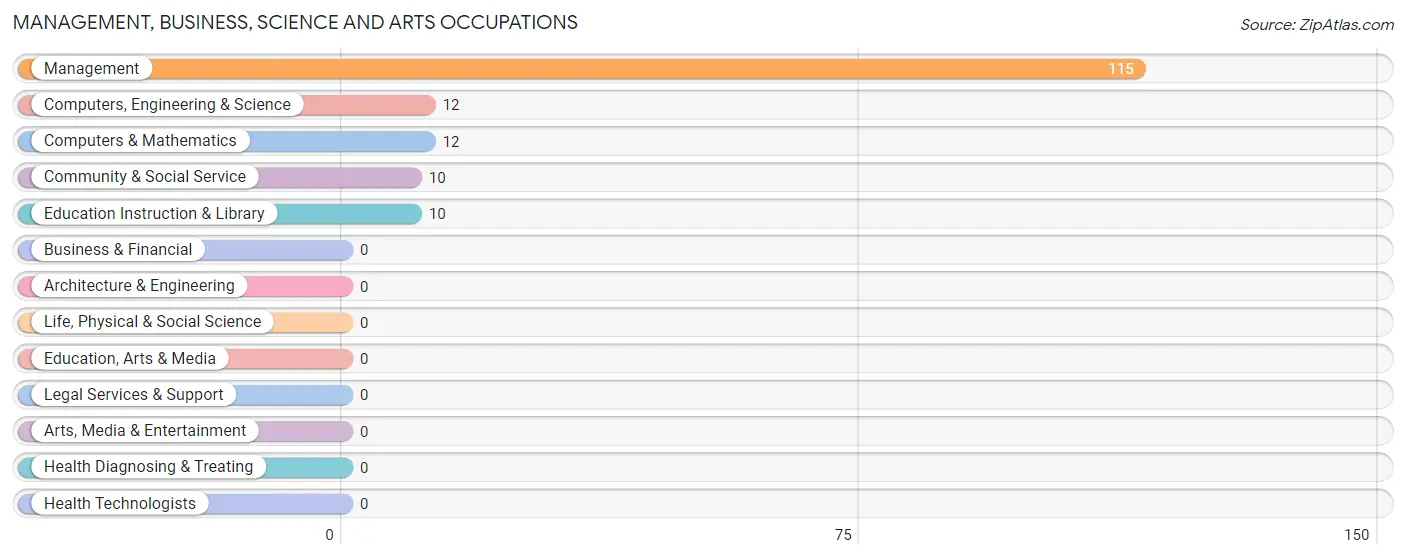
Management, Business, Science and Arts Occupations by Sex
Within the Management, Business, Science and Arts occupations in Ashland Heights, the most male-oriented occupations are Computers, Engineering & Science (100.0%), and Computers & Mathematics (100.0%), while the most female-oriented occupations are Management (100.0%), Community & Social Service (100.0%), and Education Instruction & Library (100.0%).
| Occupation | Male | Female |
| Management | 0 (0.0%) | 115 (100.0%) |
| Business & Financial | 0 (0.0%) | 0 (0.0%) |
| Computers, Engineering & Science | 12 (100.0%) | 0 (0.0%) |
| Computers & Mathematics | 12 (100.0%) | 0 (0.0%) |
| Architecture & Engineering | 0 (0.0%) | 0 (0.0%) |
| Life, Physical & Social Science | 0 (0.0%) | 0 (0.0%) |
| Community & Social Service | 0 (0.0%) | 10 (100.0%) |
| Education, Arts & Media | 0 (0.0%) | 0 (0.0%) |
| Legal Services & Support | 0 (0.0%) | 0 (0.0%) |
| Education Instruction & Library | 0 (0.0%) | 10 (100.0%) |
| Arts, Media & Entertainment | 0 (0.0%) | 0 (0.0%) |
| Health Diagnosing & Treating | 0 (0.0%) | 0 (0.0%) |
| Health Technologists | 0 (0.0%) | 0 (0.0%) |
| Total (Category) | 12 (8.8%) | 125 (91.2%) |
| Total (Overall) | 156 (38.1%) | 254 (62.0%) |
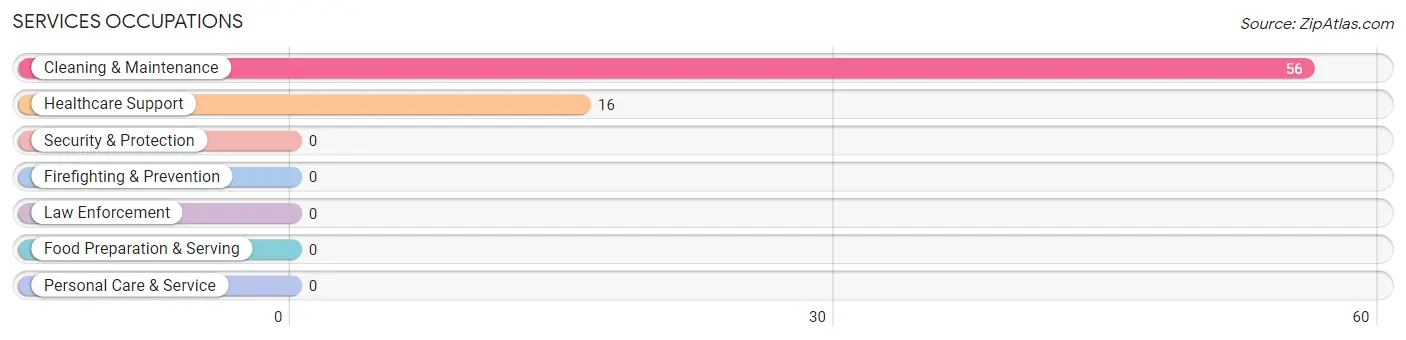
Services Occupations
The most common Services occupations in Ashland Heights are Cleaning & Maintenance (56 | 13.7%), and Healthcare Support (16 | 3.9%).
Services Occupations by Sex
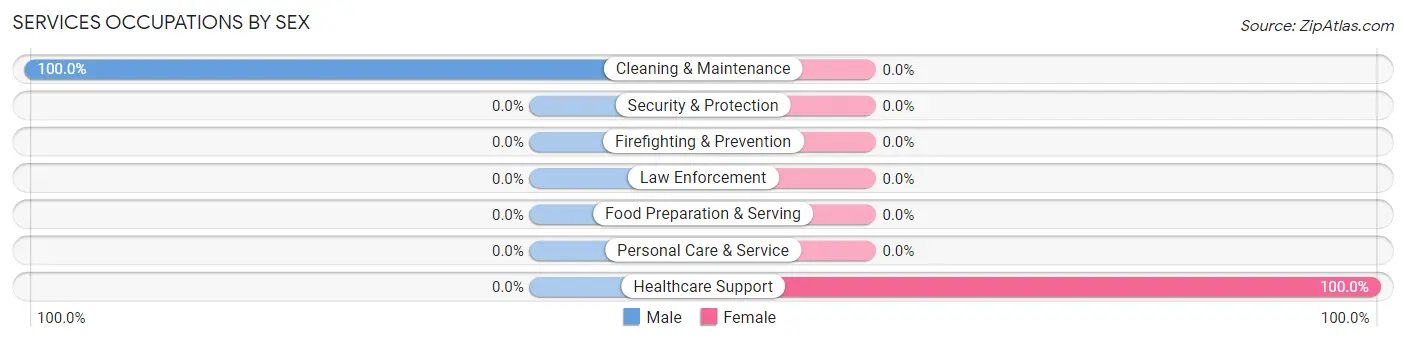
| Occupation | Male | Female |
| Healthcare Support | 0 (0.0%) | 16 (100.0%) |
| Security & Protection | 0 (0.0%) | 0 (0.0%) |
| Firefighting & Prevention | 0 (0.0%) | 0 (0.0%) |
| Law Enforcement | 0 (0.0%) | 0 (0.0%) |
| Food Preparation & Serving | 0 (0.0%) | 0 (0.0%) |
| Cleaning & Maintenance | 56 (100.0%) | 0 (0.0%) |
| Personal Care & Service | 0 (0.0%) | 0 (0.0%) |
| Total (Category) | 56 (77.8%) | 16 (22.2%) |
| Total (Overall) | 156 (38.1%) | 254 (62.0%) |
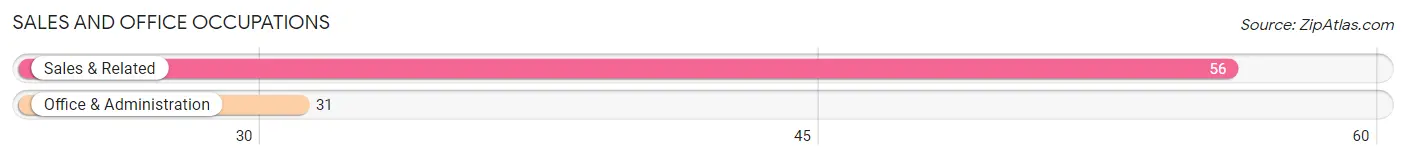
Sales and Office Occupations
The most common Sales and Office occupations in Ashland Heights are Sales & Related (56 | 13.7%), and Office & Administration (31 | 7.6%).
Sales and Office Occupations by Sex
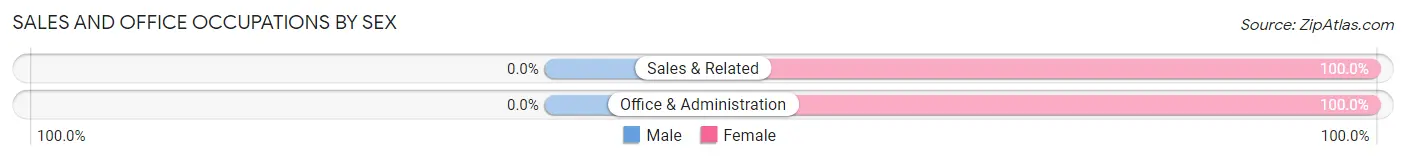
| Occupation | Male | Female |
| Sales & Related | 0 (0.0%) | 56 (100.0%) |
| Office & Administration | 0 (0.0%) | 31 (100.0%) |
| Total (Category) | 0 (0.0%) | 87 (100.0%) |
| Total (Overall) | 156 (38.1%) | 254 (62.0%) |
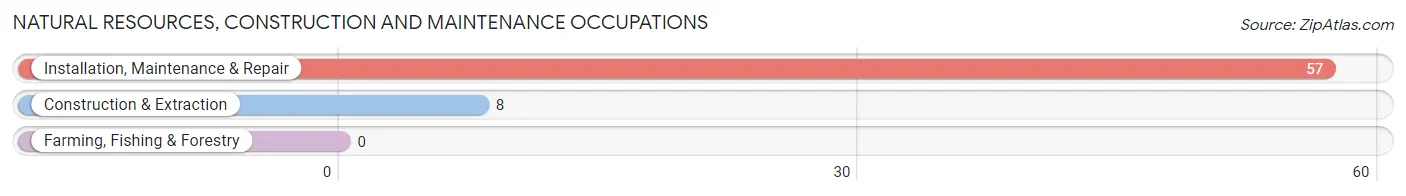
Natural Resources, Construction and Maintenance Occupations
The most common Natural Resources, Construction and Maintenance occupations in Ashland Heights are Installation, Maintenance & Repair (57 | 13.9%), and Construction & Extraction (8 | 1.9%).
Natural Resources, Construction and Maintenance Occupations by Sex
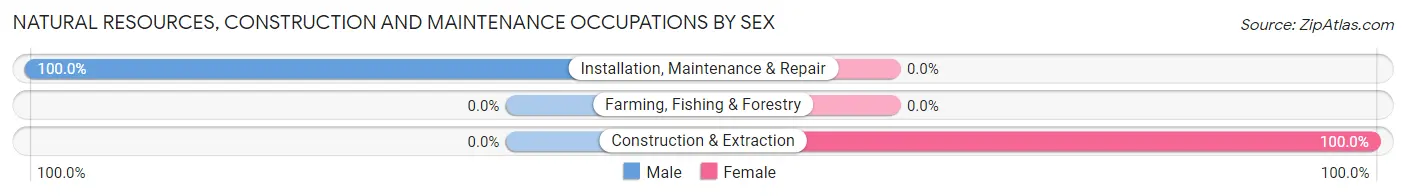
| Occupation | Male | Female |
| Farming, Fishing & Forestry | 0 (0.0%) | 0 (0.0%) |
| Construction & Extraction | 0 (0.0%) | 8 (100.0%) |
| Installation, Maintenance & Repair | 57 (100.0%) | 0 (0.0%) |
| Total (Category) | 57 (87.7%) | 8 (12.3%) |
| Total (Overall) | 156 (38.1%) | 254 (62.0%) |
Production, Transportation and Moving Occupations
The most common Production, Transportation and Moving occupations in Ashland Heights are Production (22 | 5.4%), Material Moving (18 | 4.4%), and Transportation (9 | 2.2%).
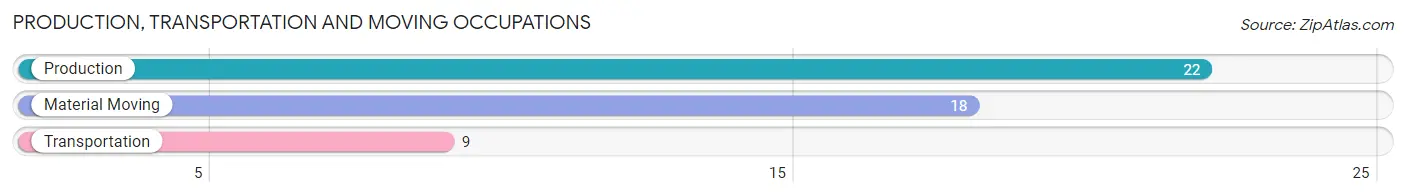
Production, Transportation and Moving Occupations by Sex
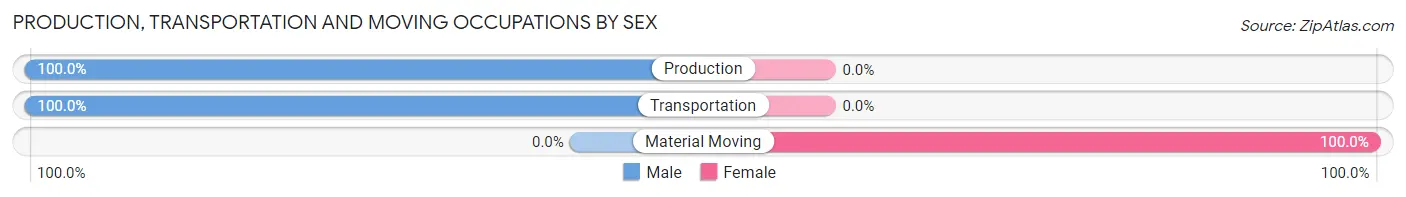
| Occupation | Male | Female |
| Production | 22 (100.0%) | 0 (0.0%) |
| Transportation | 9 (100.0%) | 0 (0.0%) |
| Material Moving | 0 (0.0%) | 18 (100.0%) |
| Total (Category) | 31 (63.3%) | 18 (36.7%) |
| Total (Overall) | 156 (38.1%) | 254 (62.0%) |
Employment Industries by Sex in Ashland Heights
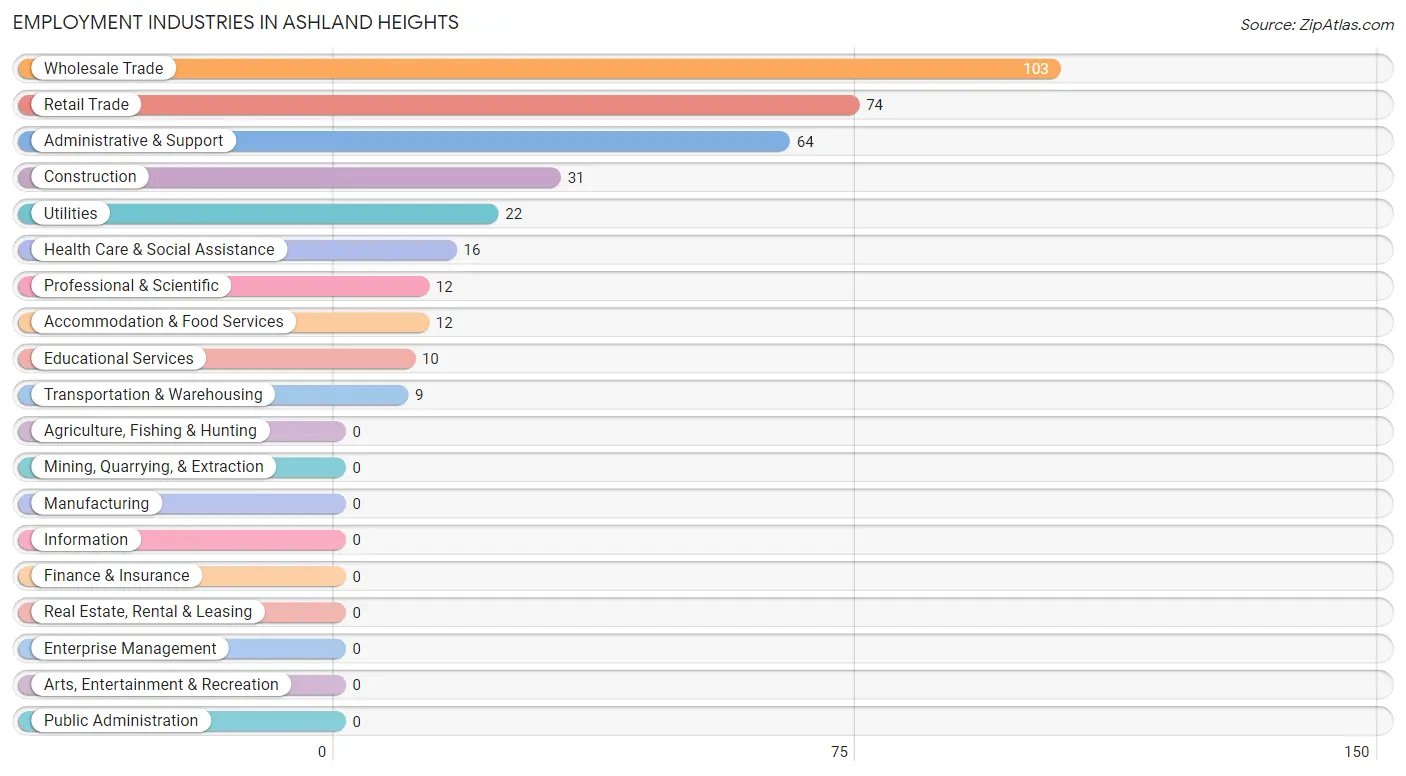
Employment Industries in Ashland Heights
The major employment industries in Ashland Heights include Wholesale Trade (103 | 25.1%), Retail Trade (74 | 18.0%), Administrative & Support (64 | 15.6%), Construction (31 | 7.6%), and Utilities (22 | 5.4%).
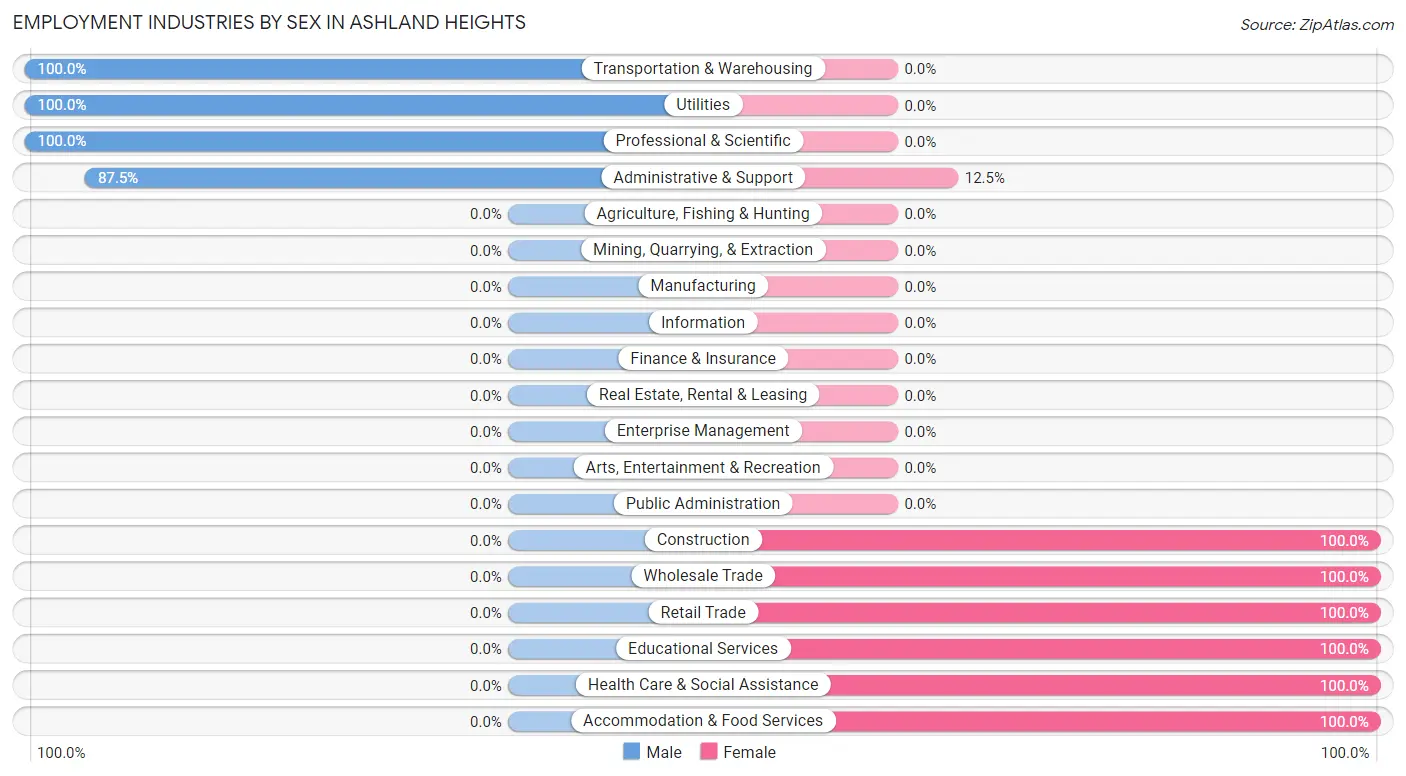
Employment Industries by Sex in Ashland Heights
The Ashland Heights industries that see more men than women are Transportation & Warehousing (100.0%), Utilities (100.0%), and Professional & Scientific (100.0%), whereas the industries that tend to have a higher number of women are Construction (100.0%), Wholesale Trade (100.0%), and Retail Trade (100.0%).
| Industry | Male | Female |
| Agriculture, Fishing & Hunting | 0 (0.0%) | 0 (0.0%) |
| Mining, Quarrying, & Extraction | 0 (0.0%) | 0 (0.0%) |
| Construction | 0 (0.0%) | 31 (100.0%) |
| Manufacturing | 0 (0.0%) | 0 (0.0%) |
| Wholesale Trade | 0 (0.0%) | 103 (100.0%) |
| Retail Trade | 0 (0.0%) | 74 (100.0%) |
| Transportation & Warehousing | 9 (100.0%) | 0 (0.0%) |
| Utilities | 22 (100.0%) | 0 (0.0%) |
| Information | 0 (0.0%) | 0 (0.0%) |
| Finance & Insurance | 0 (0.0%) | 0 (0.0%) |
| Real Estate, Rental & Leasing | 0 (0.0%) | 0 (0.0%) |
| Professional & Scientific | 12 (100.0%) | 0 (0.0%) |
| Enterprise Management | 0 (0.0%) | 0 (0.0%) |
| Administrative & Support | 56 (87.5%) | 8 (12.5%) |
| Educational Services | 0 (0.0%) | 10 (100.0%) |
| Health Care & Social Assistance | 0 (0.0%) | 16 (100.0%) |
| Arts, Entertainment & Recreation | 0 (0.0%) | 0 (0.0%) |
| Accommodation & Food Services | 0 (0.0%) | 12 (100.0%) |
| Public Administration | 0 (0.0%) | 0 (0.0%) |
| Total | 156 (38.1%) | 254 (62.0%) |
Education in Ashland Heights
School Enrollment in Ashland Heights
The most common levels of schooling among the 272 students in Ashland Heights are high school (163 | 59.9%), middle school (59 | 21.7%), and college / undergraduate (31 | 11.4%).
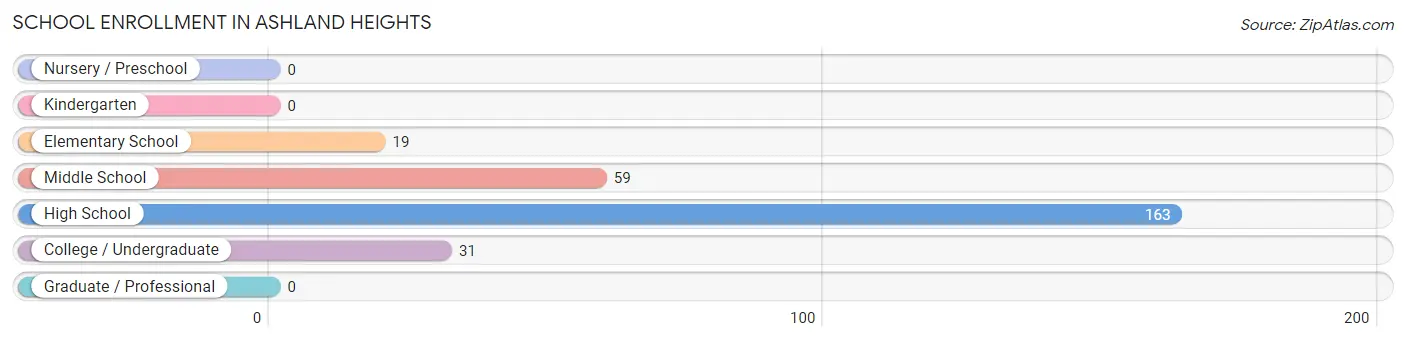
| School Level | # Students | % Students |
| Nursery / Preschool | 0 | 0.0% |
| Kindergarten | 0 | 0.0% |
| Elementary School | 19 | 7.0% |
| Middle School | 59 | 21.7% |
| High School | 163 | 59.9% |
| College / Undergraduate | 31 | 11.4% |
| Graduate / Professional | 0 | 0.0% |
| Total | 272 | 100.0% |
School Enrollment by Age by Funding Source in Ashland Heights
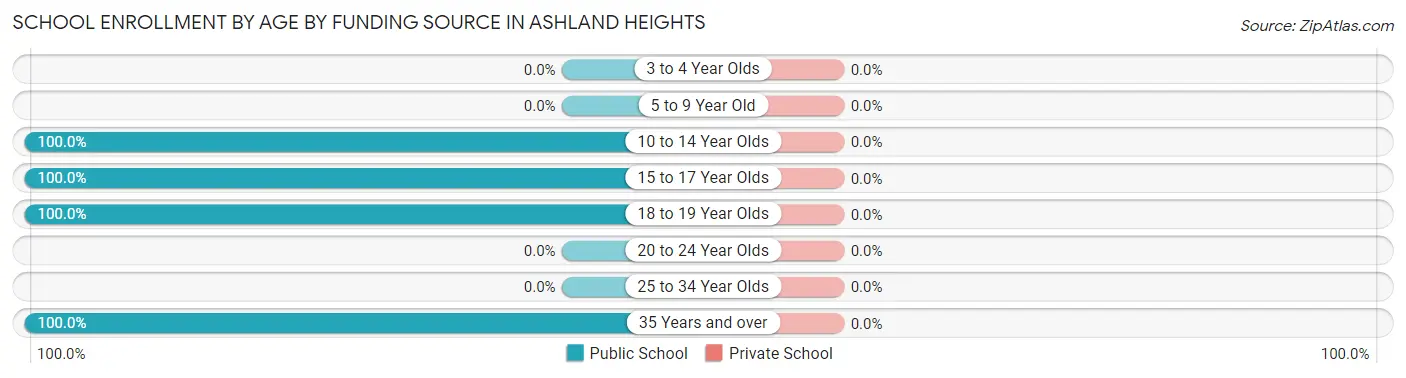
| Age Bracket | Public School | Private School |
| 3 to 4 Year Olds | 0 (0.0%) | 0 (0.0%) |
| 5 to 9 Year Old | 0 (0.0%) | 0 (0.0%) |
| 10 to 14 Year Olds | 78 (100.0%) | 0 (0.0%) |
| 15 to 17 Year Olds | 35 (100.0%) | 0 (0.0%) |
| 18 to 19 Year Olds | 128 (100.0%) | 0 (0.0%) |
| 20 to 24 Year Olds | 0 (0.0%) | 0 (0.0%) |
| 25 to 34 Year Olds | 0 (0.0%) | 0 (0.0%) |
| 35 Years and over | 31 (100.0%) | 0 (0.0%) |
| Total | 272 (100.0%) | 0 (0.0%) |
Educational Attainment by Field of Study in Ashland Heights
Arts & humanities (43 | 40.9%), education (28 | 26.7%), psychology (14 | 13.3%), engineering (11 | 10.5%), and science & technology (9 | 8.6%) are the most common fields of study among 105 individuals in Ashland Heights who have obtained a bachelor's degree or higher.
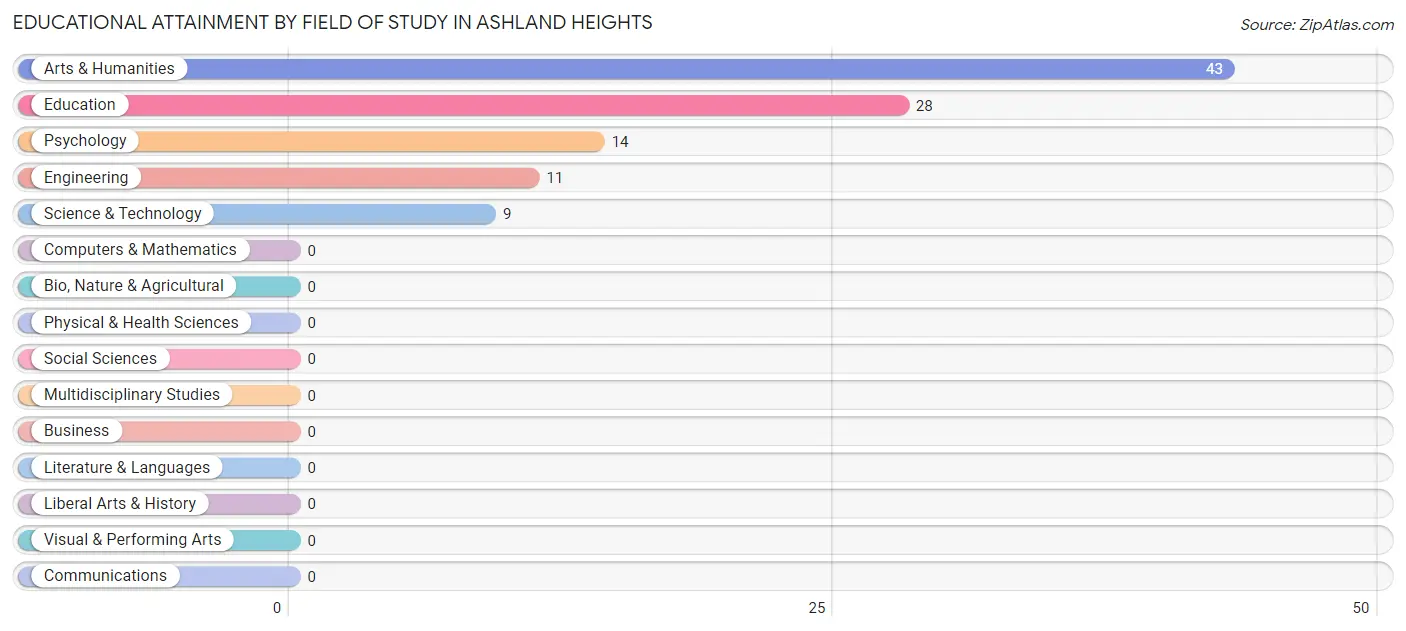
| Field of Study | # Graduates | % Graduates |
| Computers & Mathematics | 0 | 0.0% |
| Bio, Nature & Agricultural | 0 | 0.0% |
| Physical & Health Sciences | 0 | 0.0% |
| Psychology | 14 | 13.3% |
| Social Sciences | 0 | 0.0% |
| Engineering | 11 | 10.5% |
| Multidisciplinary Studies | 0 | 0.0% |
| Science & Technology | 9 | 8.6% |
| Business | 0 | 0.0% |
| Education | 28 | 26.7% |
| Literature & Languages | 0 | 0.0% |
| Liberal Arts & History | 0 | 0.0% |
| Visual & Performing Arts | 0 | 0.0% |
| Communications | 0 | 0.0% |
| Arts & Humanities | 43 | 40.9% |
| Total | 105 | 100.0% |
Transportation & Commute in Ashland Heights
Vehicle Availability by Sex in Ashland Heights
The most prevalent vehicle ownership categories in Ashland Heights are males with 3 vehicles (135, accounting for 86.5%) and females with 3 vehicles (84, making up 53.1%).
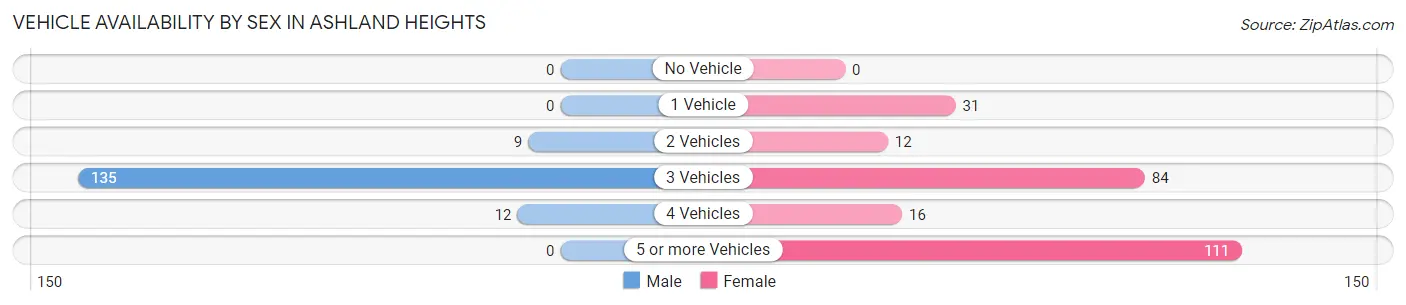
| Vehicles Available | Male | Female |
| No Vehicle | 0 (0.0%) | 0 (0.0%) |
| 1 Vehicle | 0 (0.0%) | 31 (12.2%) |
| 2 Vehicles | 9 (5.8%) | 12 (4.7%) |
| 3 Vehicles | 135 (86.5%) | 84 (33.1%) |
| 4 Vehicles | 12 (7.7%) | 16 (6.3%) |
| 5 or more Vehicles | 0 (0.0%) | 111 (43.7%) |
| Total | 156 (100.0%) | 254 (100.0%) |
Commute Time in Ashland Heights
The most frequently occuring commute durations in Ashland Heights are 10 to 14 minutes (171 commuters, 41.7%), 15 to 19 minutes (165 commuters, 40.2%), and 20 to 24 minutes (65 commuters, 15.9%).
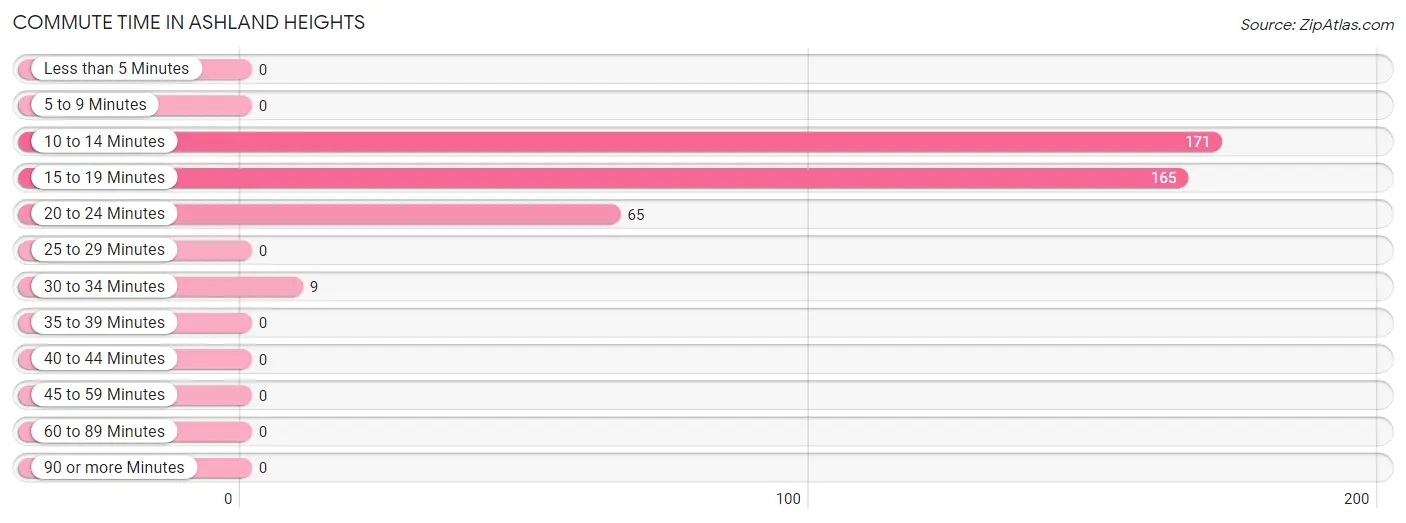
| Commute Time | # Commuters | % Commuters |
| Less than 5 Minutes | 0 | 0.0% |
| 5 to 9 Minutes | 0 | 0.0% |
| 10 to 14 Minutes | 171 | 41.7% |
| 15 to 19 Minutes | 165 | 40.2% |
| 20 to 24 Minutes | 65 | 15.9% |
| 25 to 29 Minutes | 0 | 0.0% |
| 30 to 34 Minutes | 9 | 2.2% |
| 35 to 39 Minutes | 0 | 0.0% |
| 40 to 44 Minutes | 0 | 0.0% |
| 45 to 59 Minutes | 0 | 0.0% |
| 60 to 89 Minutes | 0 | 0.0% |
| 90 or more Minutes | 0 | 0.0% |
Commute Time by Sex in Ashland Heights
The most common commute times in Ashland Heights are 15 to 19 minutes (147 commuters, 94.2%) for males and 10 to 14 minutes (171 commuters, 67.3%) for females.
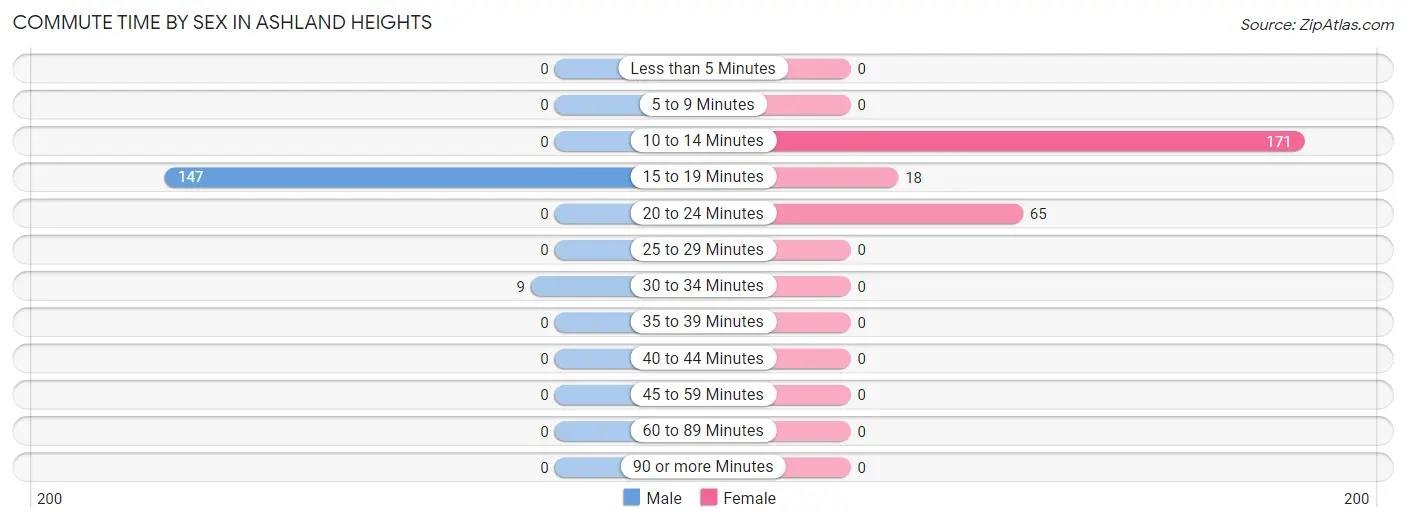
| Commute Time | Male | Female |
| Less than 5 Minutes | 0 (0.0%) | 0 (0.0%) |
| 5 to 9 Minutes | 0 (0.0%) | 0 (0.0%) |
| 10 to 14 Minutes | 0 (0.0%) | 171 (67.3%) |
| 15 to 19 Minutes | 147 (94.2%) | 18 (7.1%) |
| 20 to 24 Minutes | 0 (0.0%) | 65 (25.6%) |
| 25 to 29 Minutes | 0 (0.0%) | 0 (0.0%) |
| 30 to 34 Minutes | 9 (5.8%) | 0 (0.0%) |
| 35 to 39 Minutes | 0 (0.0%) | 0 (0.0%) |
| 40 to 44 Minutes | 0 (0.0%) | 0 (0.0%) |
| 45 to 59 Minutes | 0 (0.0%) | 0 (0.0%) |
| 60 to 89 Minutes | 0 (0.0%) | 0 (0.0%) |
| 90 or more Minutes | 0 (0.0%) | 0 (0.0%) |
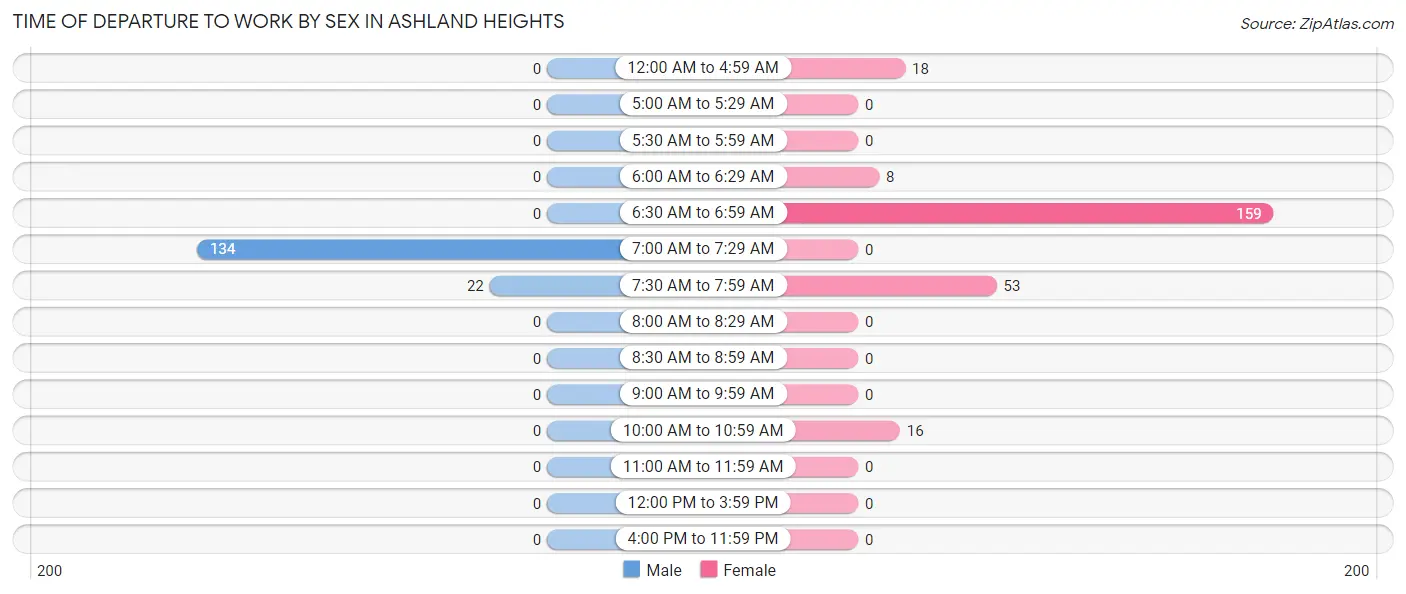
Time of Departure to Work by Sex in Ashland Heights
The most frequent times of departure to work in Ashland Heights are 7:00 AM to 7:29 AM (134, 85.9%) for males and 6:30 AM to 6:59 AM (159, 62.6%) for females.
| Time of Departure | Male | Female |
| 12:00 AM to 4:59 AM | 0 (0.0%) | 18 (7.1%) |
| 5:00 AM to 5:29 AM | 0 (0.0%) | 0 (0.0%) |
| 5:30 AM to 5:59 AM | 0 (0.0%) | 0 (0.0%) |
| 6:00 AM to 6:29 AM | 0 (0.0%) | 8 (3.2%) |
| 6:30 AM to 6:59 AM | 0 (0.0%) | 159 (62.6%) |
| 7:00 AM to 7:29 AM | 134 (85.9%) | 0 (0.0%) |
| 7:30 AM to 7:59 AM | 22 (14.1%) | 53 (20.9%) |
| 8:00 AM to 8:29 AM | 0 (0.0%) | 0 (0.0%) |
| 8:30 AM to 8:59 AM | 0 (0.0%) | 0 (0.0%) |
| 9:00 AM to 9:59 AM | 0 (0.0%) | 0 (0.0%) |
| 10:00 AM to 10:59 AM | 0 (0.0%) | 16 (6.3%) |
| 11:00 AM to 11:59 AM | 0 (0.0%) | 0 (0.0%) |
| 12:00 PM to 3:59 PM | 0 (0.0%) | 0 (0.0%) |
| 4:00 PM to 11:59 PM | 0 (0.0%) | 0 (0.0%) |
| Total | 156 (100.0%) | 254 (100.0%) |
Housing Occupancy in Ashland Heights
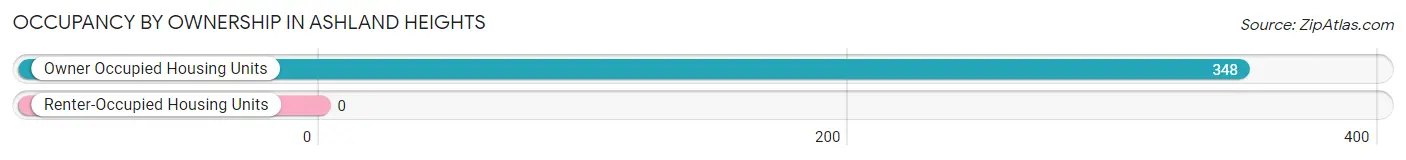
Occupancy by Ownership in Ashland Heights
Of the total 348 dwellings in Ashland Heights, owner-occupied units account for 348 (100.0%), while renter-occupied units make up 0 (0.0%).
| Occupancy | # Housing Units | % Housing Units |
| Owner Occupied Housing Units | 348 | 100.0% |
| Renter-Occupied Housing Units | 0 | 0.0% |
| Total Occupied Housing Units | 348 | 100.0% |
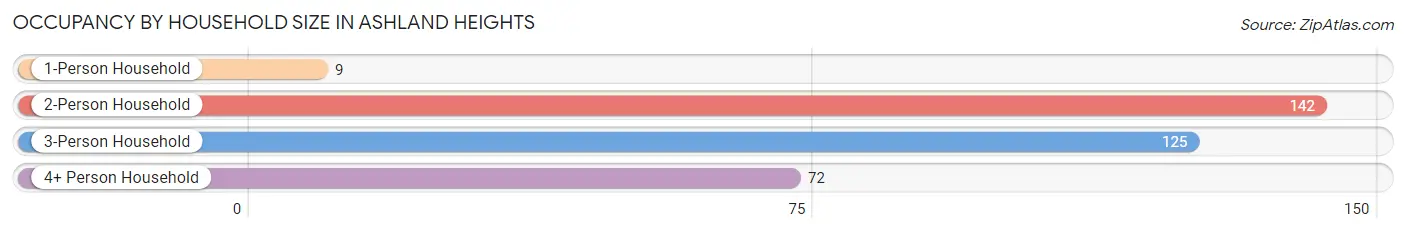
Occupancy by Household Size in Ashland Heights
| Household Size | # Housing Units | % Housing Units |
| 1-Person Household | 9 | 2.6% |
| 2-Person Household | 142 | 40.8% |
| 3-Person Household | 125 | 35.9% |
| 4+ Person Household | 72 | 20.7% |
| Total Housing Units | 348 | 100.0% |
Occupancy by Ownership by Household Size in Ashland Heights
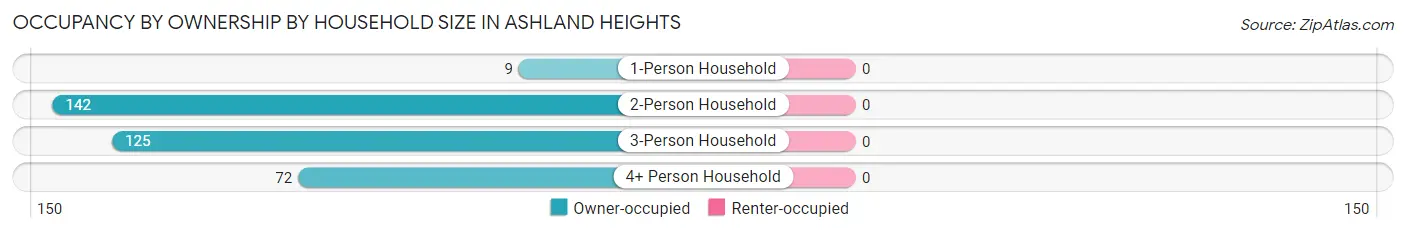
| Household Size | Owner-occupied | Renter-occupied |
| 1-Person Household | 9 (100.0%) | 0 (0.0%) |
| 2-Person Household | 142 (100.0%) | 0 (0.0%) |
| 3-Person Household | 125 (100.0%) | 0 (0.0%) |
| 4+ Person Household | 72 (100.0%) | 0 (0.0%) |
| Total Housing Units | 348 (100.0%) | 0 (0.0%) |
Occupancy by Educational Attainment in Ashland Heights
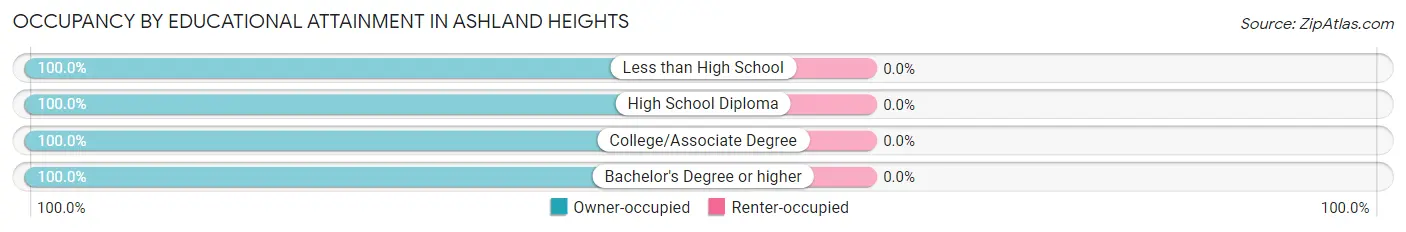
| Household Size | Owner-occupied | Renter-occupied |
| Less than High School | 22 (100.0%) | 0 (0.0%) |
| High School Diploma | 75 (100.0%) | 0 (0.0%) |
| College/Associate Degree | 171 (100.0%) | 0 (0.0%) |
| Bachelor's Degree or higher | 80 (100.0%) | 0 (0.0%) |
Occupancy by Age of Householder in Ashland Heights
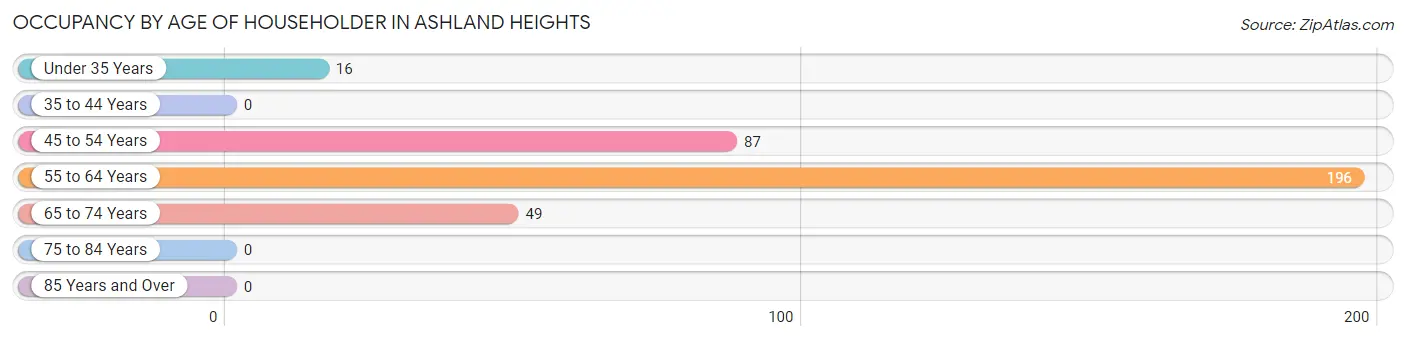
| Age Bracket | # Households | % Households |
| Under 35 Years | 16 | 4.6% |
| 35 to 44 Years | 0 | 0.0% |
| 45 to 54 Years | 87 | 25.0% |
| 55 to 64 Years | 196 | 56.3% |
| 65 to 74 Years | 49 | 14.1% |
| 75 to 84 Years | 0 | 0.0% |
| 85 Years and Over | 0 | 0.0% |
| Total | 348 | 100.0% |
Housing Finances in Ashland Heights
Median Income by Occupancy in Ashland Heights
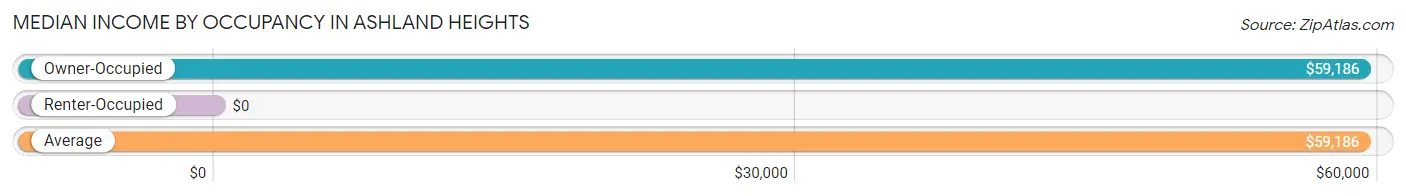
| Occupancy Type | # Households | Median Income |
| Owner-Occupied | 348 (100.0%) | $59,186 |
| Renter-Occupied | 0 (0.0%) | $0 |
| Average | 348 (100.0%) | $59,186 |
Occupancy by Householder Income Bracket in Ashland Heights
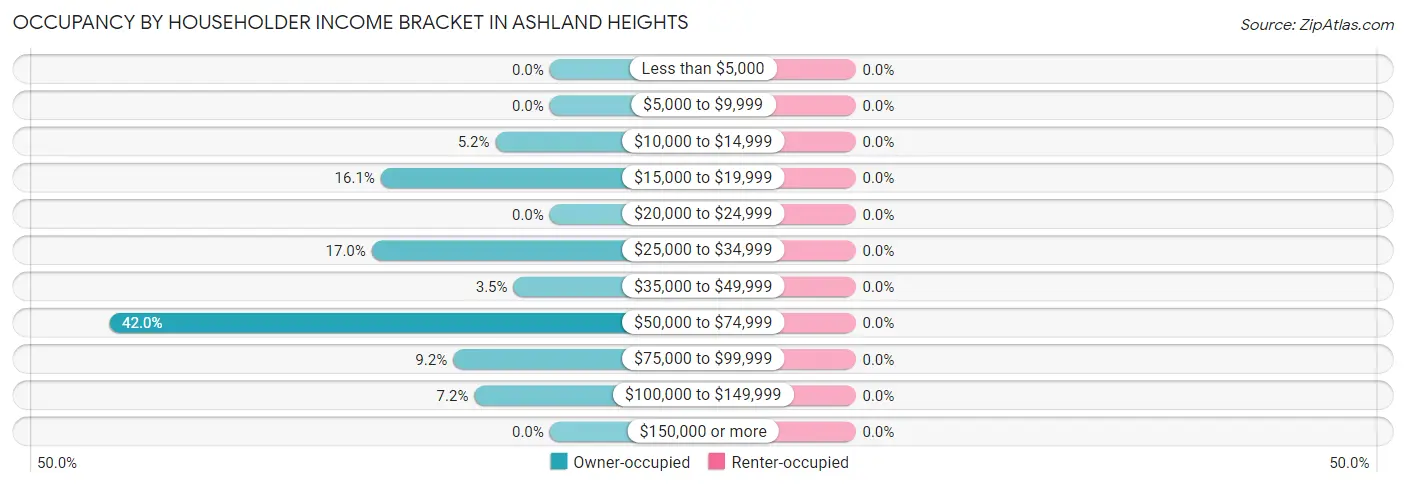
| Income Bracket | Owner-occupied | Renter-occupied |
| Less than $5,000 | 0 (0.0%) | 0 (0.0%) |
| $5,000 to $9,999 | 0 (0.0%) | 0 (0.0%) |
| $10,000 to $14,999 | 18 (5.2%) | 0 (0.0%) |
| $15,000 to $19,999 | 56 (16.1%) | 0 (0.0%) |
| $20,000 to $24,999 | 0 (0.0%) | 0 (0.0%) |
| $25,000 to $34,999 | 59 (17.0%) | 0 (0.0%) |
| $35,000 to $49,999 | 12 (3.5%) | 0 (0.0%) |
| $50,000 to $74,999 | 146 (41.9%) | 0 (0.0%) |
| $75,000 to $99,999 | 32 (9.2%) | 0 (0.0%) |
| $100,000 to $149,999 | 25 (7.2%) | 0 (0.0%) |
| $150,000 or more | 0 (0.0%) | 0 (0.0%) |
| Total | 348 (100.0%) | 0 (0.0%) |
Monthly Housing Cost Tiers in Ashland Heights
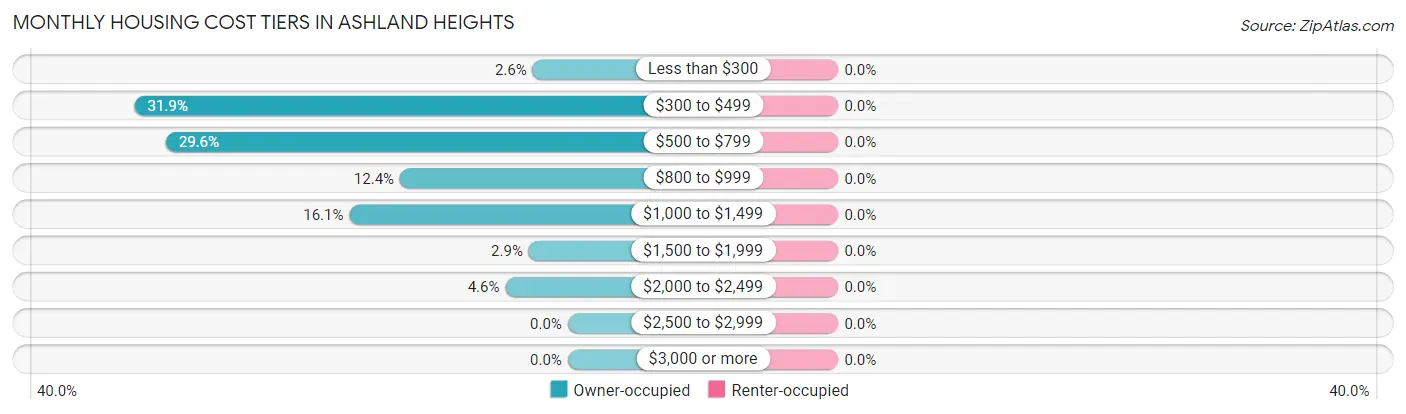
| Monthly Cost | Owner-occupied | Renter-occupied |
| Less than $300 | 9 (2.6%) | 0 (0.0%) |
| $300 to $499 | 111 (31.9%) | 0 (0.0%) |
| $500 to $799 | 103 (29.6%) | 0 (0.0%) |
| $800 to $999 | 43 (12.4%) | 0 (0.0%) |
| $1,000 to $1,499 | 56 (16.1%) | 0 (0.0%) |
| $1,500 to $1,999 | 10 (2.9%) | 0 (0.0%) |
| $2,000 to $2,499 | 16 (4.6%) | 0 (0.0%) |
| $2,500 to $2,999 | 0 (0.0%) | 0 (0.0%) |
| $3,000 or more | 0 (0.0%) | 0 (0.0%) |
| Total | 348 (100.0%) | 0 (0.0%) |
Physical Housing Characteristics in Ashland Heights
Housing Structures in Ashland Heights
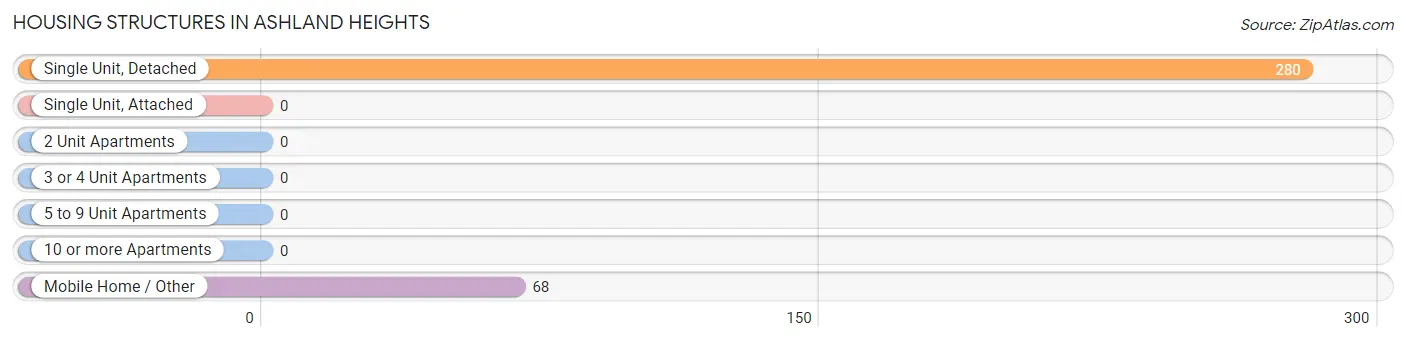
| Structure Type | # Housing Units | % Housing Units |
| Single Unit, Detached | 280 | 80.5% |
| Single Unit, Attached | 0 | 0.0% |
| 2 Unit Apartments | 0 | 0.0% |
| 3 or 4 Unit Apartments | 0 | 0.0% |
| 5 to 9 Unit Apartments | 0 | 0.0% |
| 10 or more Apartments | 0 | 0.0% |
| Mobile Home / Other | 68 | 19.5% |
| Total | 348 | 100.0% |
Housing Structures by Occupancy in Ashland Heights
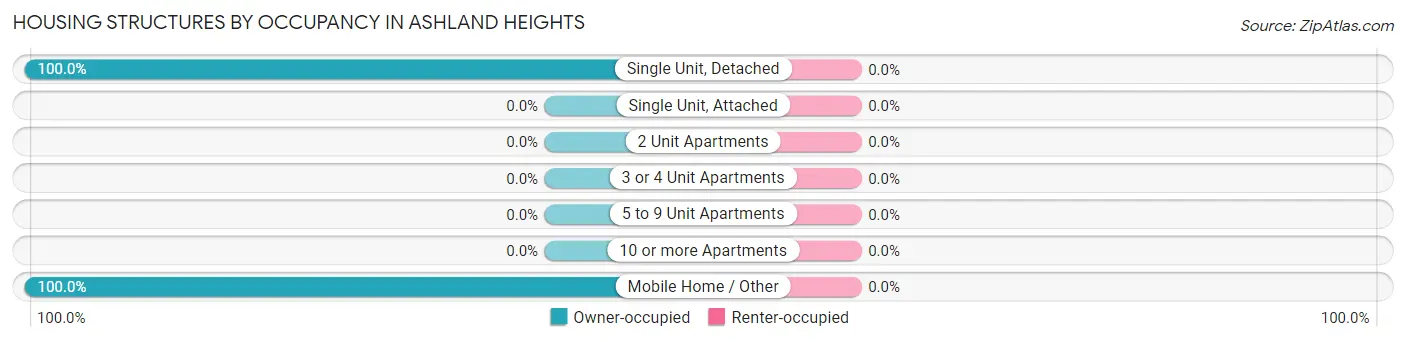
| Structure Type | Owner-occupied | Renter-occupied |
| Single Unit, Detached | 280 (100.0%) | 0 (0.0%) |
| Single Unit, Attached | 0 (0.0%) | 0 (0.0%) |
| 2 Unit Apartments | 0 (0.0%) | 0 (0.0%) |
| 3 or 4 Unit Apartments | 0 (0.0%) | 0 (0.0%) |
| 5 to 9 Unit Apartments | 0 (0.0%) | 0 (0.0%) |
| 10 or more Apartments | 0 (0.0%) | 0 (0.0%) |
| Mobile Home / Other | 68 (100.0%) | 0 (0.0%) |
| Total | 348 (100.0%) | 0 (0.0%) |
Housing Structures by Number of Rooms in Ashland Heights
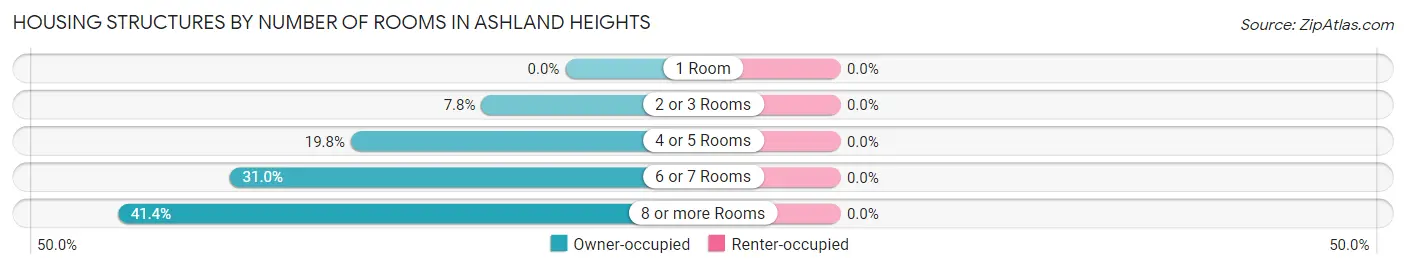
| Number of Rooms | Owner-occupied | Renter-occupied |
| 1 Room | 0 (0.0%) | 0 (0.0%) |
| 2 or 3 Rooms | 27 (7.8%) | 0 (0.0%) |
| 4 or 5 Rooms | 69 (19.8%) | 0 (0.0%) |
| 6 or 7 Rooms | 108 (31.0%) | 0 (0.0%) |
| 8 or more Rooms | 144 (41.4%) | 0 (0.0%) |
| Total | 348 (100.0%) | 0 (0.0%) |
Housing Structure by Heating Type in Ashland Heights
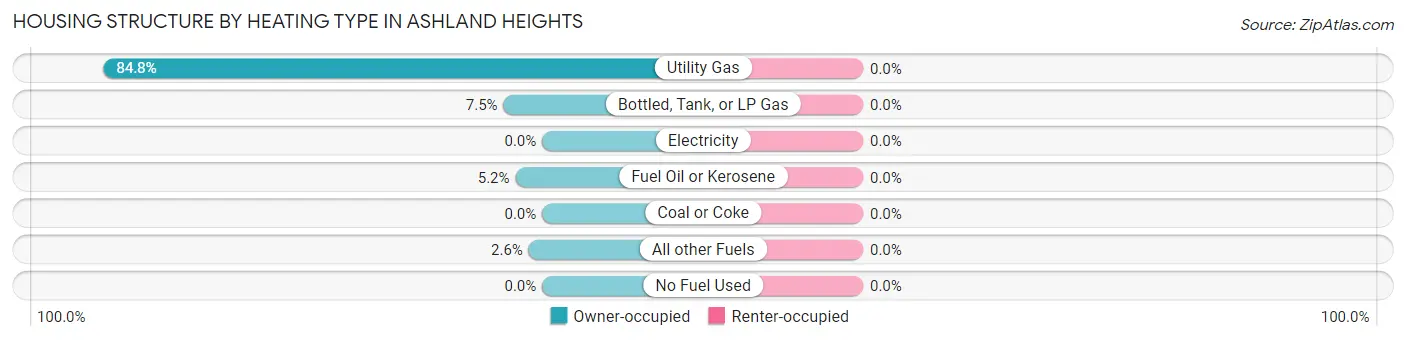
| Heating Type | Owner-occupied | Renter-occupied |
| Utility Gas | 295 (84.8%) | 0 (0.0%) |
| Bottled, Tank, or LP Gas | 26 (7.5%) | 0 (0.0%) |
| Electricity | 0 (0.0%) | 0 (0.0%) |
| Fuel Oil or Kerosene | 18 (5.2%) | 0 (0.0%) |
| Coal or Coke | 0 (0.0%) | 0 (0.0%) |
| All other Fuels | 9 (2.6%) | 0 (0.0%) |
| No Fuel Used | 0 (0.0%) | 0 (0.0%) |
| Total | 348 (100.0%) | 0 (0.0%) |
Household Vehicle Usage in Ashland Heights
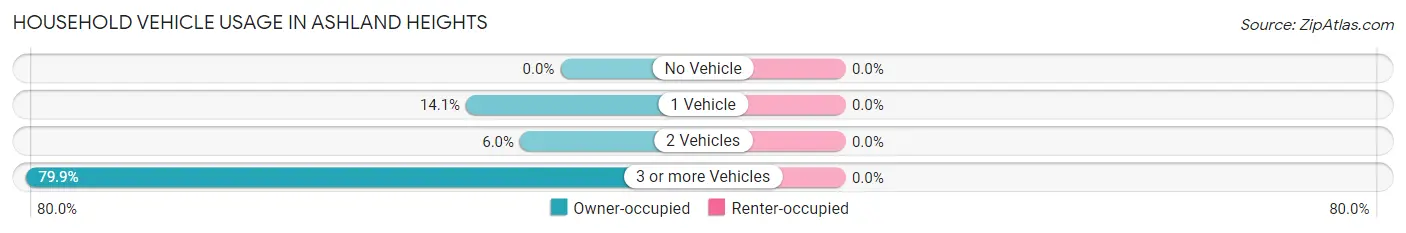
| Vehicles per Household | Owner-occupied | Renter-occupied |
| No Vehicle | 0 (0.0%) | 0 (0.0%) |
| 1 Vehicle | 49 (14.1%) | 0 (0.0%) |
| 2 Vehicles | 21 (6.0%) | 0 (0.0%) |
| 3 or more Vehicles | 278 (79.9%) | 0 (0.0%) |
| Total | 348 (100.0%) | 0 (0.0%) |
Real Estate & Mortgages in Ashland Heights
Real Estate and Mortgage Overview in Ashland Heights
| Characteristic | Without Mortgage | With Mortgage |
| Housing Units | 223 | 125 |
| Median Property Value | - | - |
| Median Household Income | $63,046 | $0 |
| Monthly Housing Costs | $479 | $0 |
| Real Estate Taxes | $1,074 | $0 |
Property Value by Mortgage Status in Ashland Heights
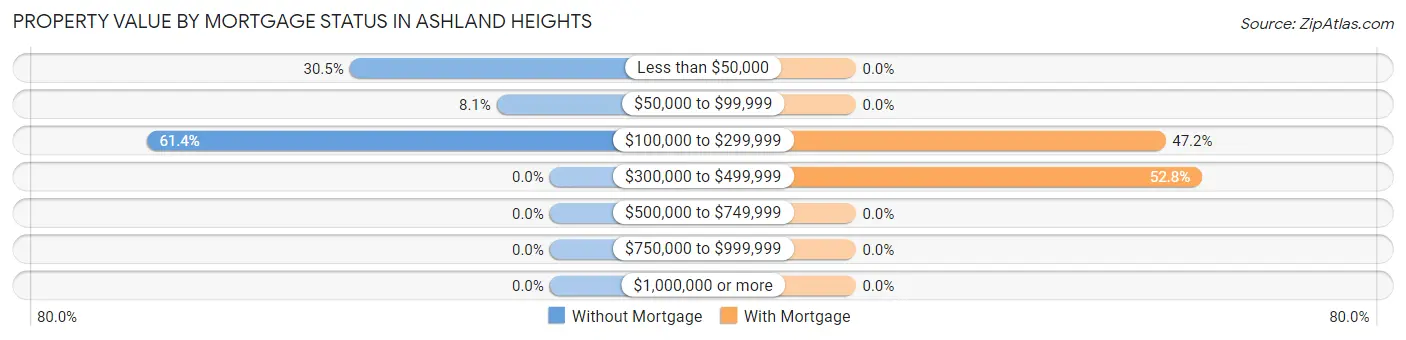
| Property Value | Without Mortgage | With Mortgage |
| Less than $50,000 | 68 (30.5%) | 0 (0.0%) |
| $50,000 to $99,999 | 18 (8.1%) | 0 (0.0%) |
| $100,000 to $299,999 | 137 (61.4%) | 59 (47.2%) |
| $300,000 to $499,999 | 0 (0.0%) | 66 (52.8%) |
| $500,000 to $749,999 | 0 (0.0%) | 0 (0.0%) |
| $750,000 to $999,999 | 0 (0.0%) | 0 (0.0%) |
| $1,000,000 or more | 0 (0.0%) | 0 (0.0%) |
| Total | 223 (100.0%) | 125 (100.0%) |
Household Income by Mortgage Status in Ashland Heights
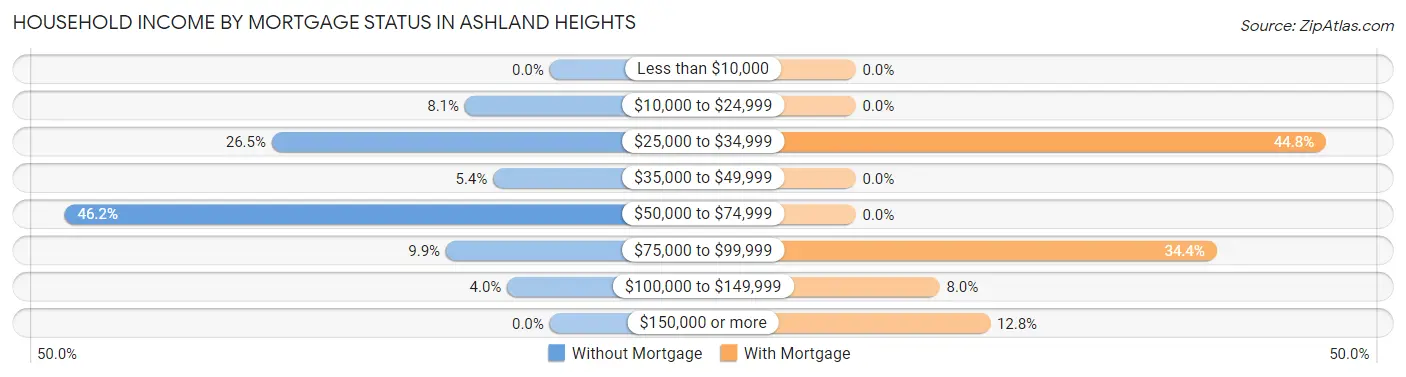
| Household Income | Without Mortgage | With Mortgage |
| Less than $10,000 | 0 (0.0%) | 0 (0.0%) |
| $10,000 to $24,999 | 18 (8.1%) | 0 (0.0%) |
| $25,000 to $34,999 | 59 (26.5%) | 56 (44.8%) |
| $35,000 to $49,999 | 12 (5.4%) | 0 (0.0%) |
| $50,000 to $74,999 | 103 (46.2%) | 0 (0.0%) |
| $75,000 to $99,999 | 22 (9.9%) | 43 (34.4%) |
| $100,000 to $149,999 | 9 (4.0%) | 10 (8.0%) |
| $150,000 or more | 0 (0.0%) | 16 (12.8%) |
| Total | 223 (100.0%) | 125 (100.0%) |
Property Value to Household Income Ratio in Ashland Heights
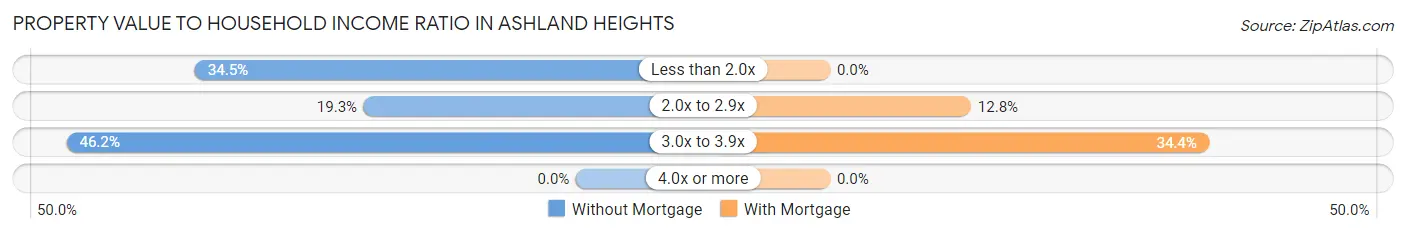
| Value-to-Income Ratio | Without Mortgage | With Mortgage |
| Less than 2.0x | 77 (34.5%) | 0 (0.0%) |
| 2.0x to 2.9x | 43 (19.3%) | 16 (12.8%) |
| 3.0x to 3.9x | 103 (46.2%) | 43 (34.4%) |
| 4.0x or more | 0 (0.0%) | 0 (0.0%) |
| Total | 223 (100.0%) | 125 (100.0%) |
Real Estate Taxes by Mortgage Status in Ashland Heights
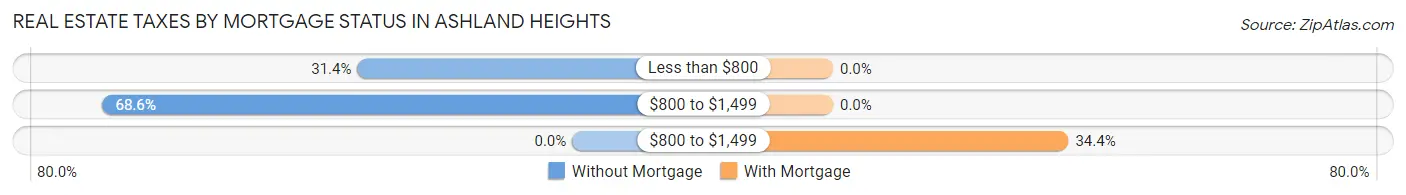
| Property Taxes | Without Mortgage | With Mortgage |
| Less than $800 | 70 (31.4%) | 0 (0.0%) |
| $800 to $1,499 | 153 (68.6%) | 0 (0.0%) |
| $800 to $1,499 | 0 (0.0%) | 43 (34.4%) |
| Total | 223 (100.0%) | 125 (100.0%) |
Health & Disability in Ashland Heights
Health Insurance Coverage by Age in Ashland Heights
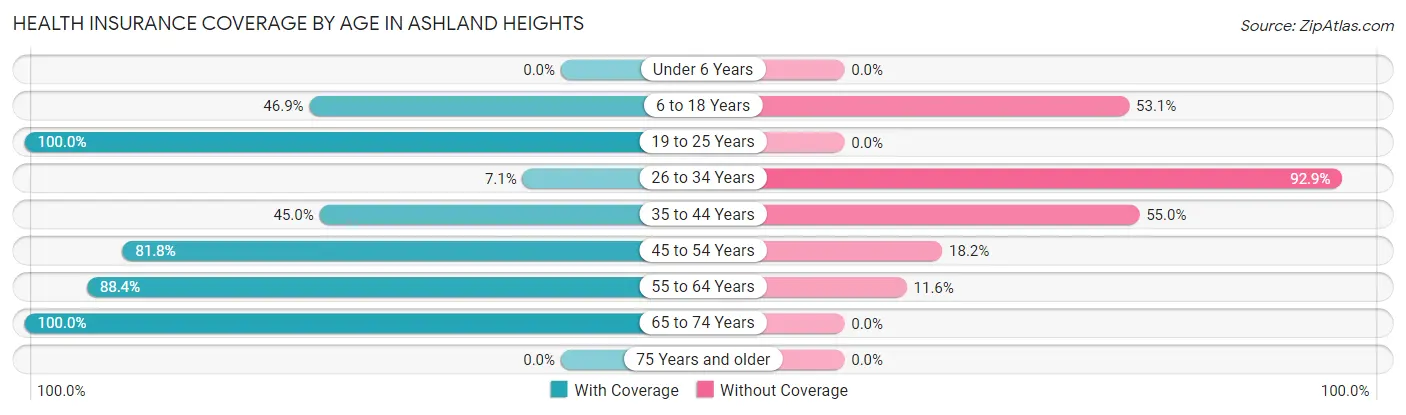
| Age Bracket | With Coverage | Without Coverage |
| Under 6 Years | 0 (0.0%) | 0 (0.0%) |
| 6 to 18 Years | 113 (46.9%) | 128 (53.1%) |
| 19 to 25 Years | 35 (100.0%) | 0 (0.0%) |
| 26 to 34 Years | 16 (7.1%) | 208 (92.9%) |
| 35 to 44 Years | 18 (45.0%) | 22 (55.0%) |
| 45 to 54 Years | 139 (81.8%) | 31 (18.2%) |
| 55 to 64 Years | 327 (88.4%) | 43 (11.6%) |
| 65 to 74 Years | 135 (100.0%) | 0 (0.0%) |
| 75 Years and older | 0 (0.0%) | 0 (0.0%) |
| Total | 783 (64.4%) | 432 (35.6%) |
Health Insurance Coverage by Citizenship Status in Ashland Heights
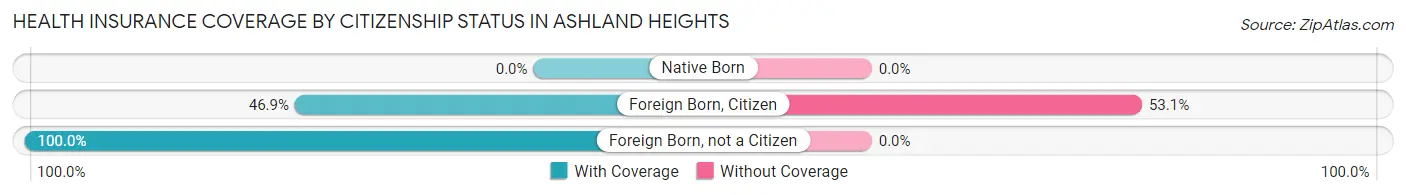
| Citizenship Status | With Coverage | Without Coverage |
| Native Born | 0 (0.0%) | 0 (0.0%) |
| Foreign Born, Citizen | 113 (46.9%) | 128 (53.1%) |
| Foreign Born, not a Citizen | 35 (100.0%) | 0 (0.0%) |
Health Insurance Coverage by Household Income in Ashland Heights
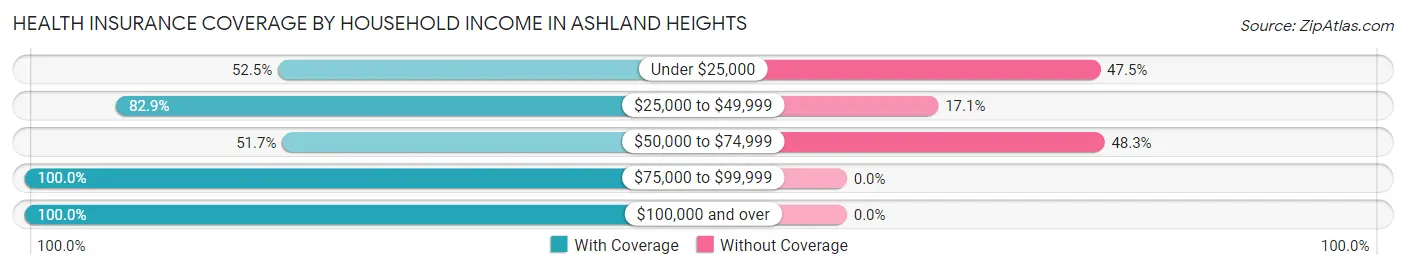
| Household Income | With Coverage | Without Coverage |
| Under $25,000 | 166 (52.5%) | 150 (47.5%) |
| $25,000 to $49,999 | 150 (82.9%) | 31 (17.1%) |
| $50,000 to $74,999 | 269 (51.7%) | 251 (48.3%) |
| $75,000 to $99,999 | 82 (100.0%) | 0 (0.0%) |
| $100,000 and over | 116 (100.0%) | 0 (0.0%) |
Public vs Private Health Insurance Coverage by Age in Ashland Heights
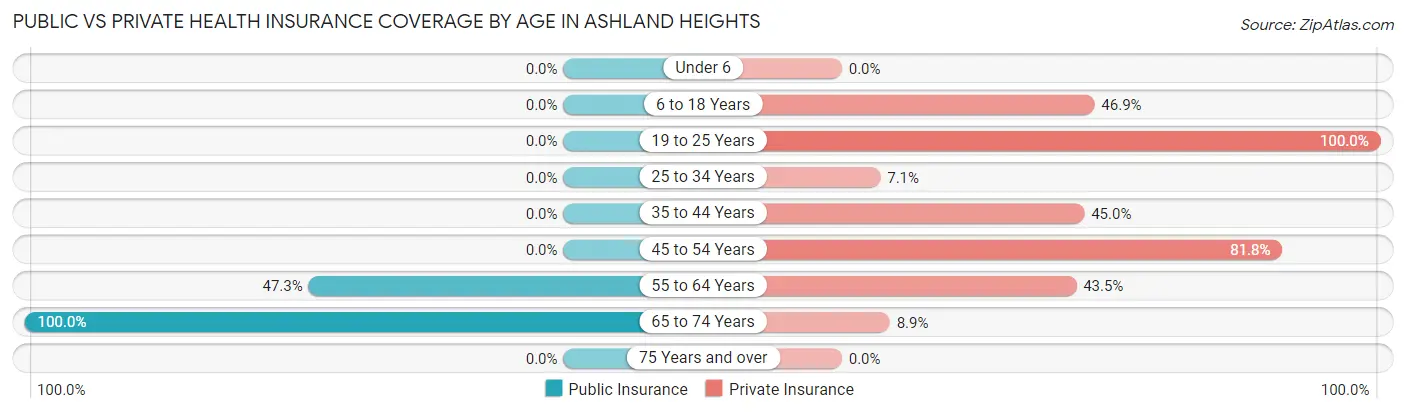
| Age Bracket | Public Insurance | Private Insurance |
| Under 6 | 0 (0.0%) | 0 (0.0%) |
| 6 to 18 Years | 0 (0.0%) | 113 (46.9%) |
| 19 to 25 Years | 0 (0.0%) | 35 (100.0%) |
| 25 to 34 Years | 0 (0.0%) | 16 (7.1%) |
| 35 to 44 Years | 0 (0.0%) | 18 (45.0%) |
| 45 to 54 Years | 0 (0.0%) | 139 (81.8%) |
| 55 to 64 Years | 175 (47.3%) | 161 (43.5%) |
| 65 to 74 Years | 135 (100.0%) | 12 (8.9%) |
| 75 Years and over | 0 (0.0%) | 0 (0.0%) |
| Total | 310 (25.5%) | 494 (40.7%) |
Disability Status by Sex by Age in Ashland Heights
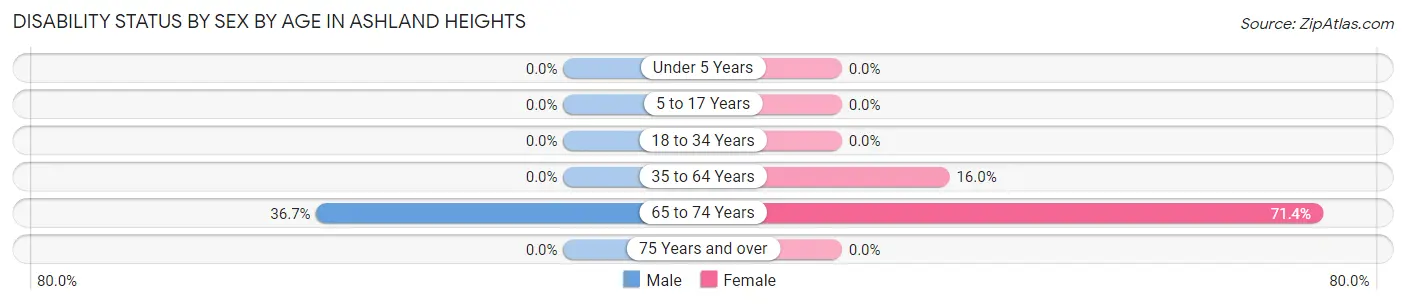
| Age Bracket | Male | Female |
| Under 5 Years | 0 (0.0%) | 0 (0.0%) |
| 5 to 17 Years | 0 (0.0%) | 0 (0.0%) |
| 18 to 34 Years | 0 (0.0%) | 0 (0.0%) |
| 35 to 64 Years | 0 (0.0%) | 43 (16.0%) |
| 65 to 74 Years | 11 (36.7%) | 75 (71.4%) |
| 75 Years and over | 0 (0.0%) | 0 (0.0%) |
Disability Class by Sex by Age in Ashland Heights
Disability Class: Hearing Difficulty
| Age Bracket | Male | Female |
| Under 5 Years | 0 (0.0%) | 0 (0.0%) |
| 5 to 17 Years | 0 (0.0%) | 0 (0.0%) |
| 18 to 34 Years | 0 (0.0%) | 0 (0.0%) |
| 35 to 64 Years | 0 (0.0%) | 0 (0.0%) |
| 65 to 74 Years | 0 (0.0%) | 0 (0.0%) |
| 75 Years and over | 0 (0.0%) | 0 (0.0%) |
Disability Class: Vision Difficulty
| Age Bracket | Male | Female |
| Under 5 Years | 0 (0.0%) | 0 (0.0%) |
| 5 to 17 Years | 0 (0.0%) | 0 (0.0%) |
| 18 to 34 Years | 0 (0.0%) | 0 (0.0%) |
| 35 to 64 Years | 0 (0.0%) | 0 (0.0%) |
| 65 to 74 Years | 0 (0.0%) | 0 (0.0%) |
| 75 Years and over | 0 (0.0%) | 0 (0.0%) |
Disability Class: Cognitive Difficulty
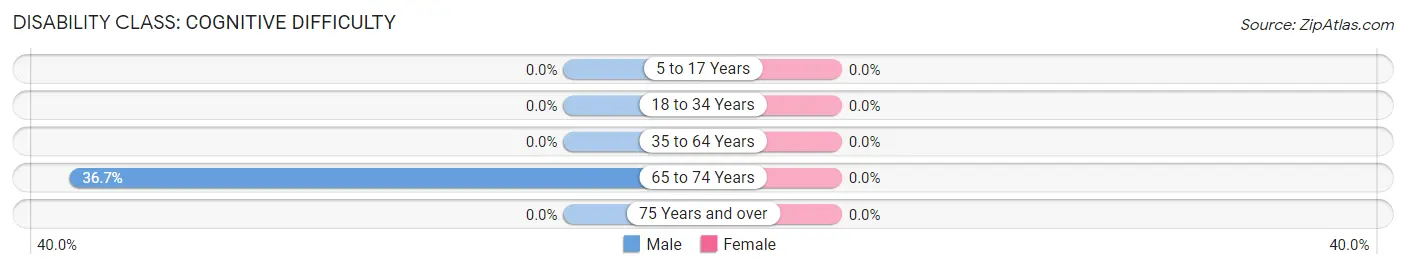
| Age Bracket | Male | Female |
| 5 to 17 Years | 0 (0.0%) | 0 (0.0%) |
| 18 to 34 Years | 0 (0.0%) | 0 (0.0%) |
| 35 to 64 Years | 0 (0.0%) | 0 (0.0%) |
| 65 to 74 Years | 11 (36.7%) | 0 (0.0%) |
| 75 Years and over | 0 (0.0%) | 0 (0.0%) |
Disability Class: Ambulatory Difficulty
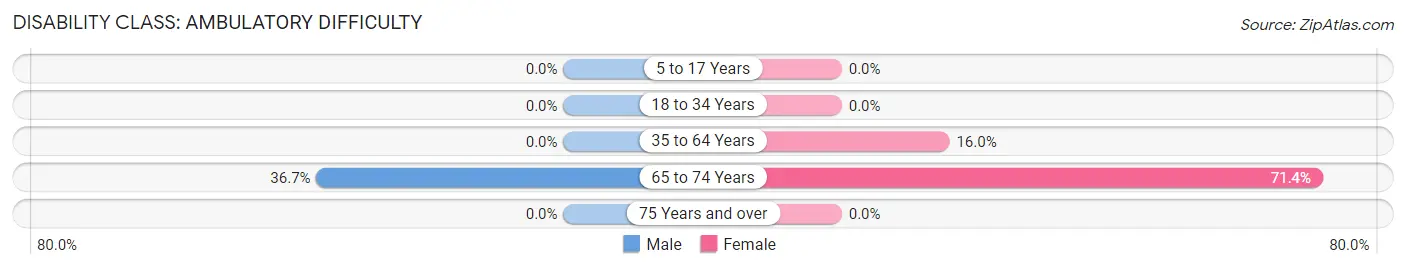
| Age Bracket | Male | Female |
| 5 to 17 Years | 0 (0.0%) | 0 (0.0%) |
| 18 to 34 Years | 0 (0.0%) | 0 (0.0%) |
| 35 to 64 Years | 0 (0.0%) | 43 (16.0%) |
| 65 to 74 Years | 11 (36.7%) | 75 (71.4%) |
| 75 Years and over | 0 (0.0%) | 0 (0.0%) |
Disability Class: Self-Care Difficulty
| Age Bracket | Male | Female |
| 5 to 17 Years | 0 (0.0%) | 0 (0.0%) |
| 18 to 34 Years | 0 (0.0%) | 0 (0.0%) |
| 35 to 64 Years | 0 (0.0%) | 0 (0.0%) |
| 65 to 74 Years | 0 (0.0%) | 0 (0.0%) |
| 75 Years and over | 0 (0.0%) | 0 (0.0%) |
Technology Access in Ashland Heights
Computing Device Access in Ashland Heights
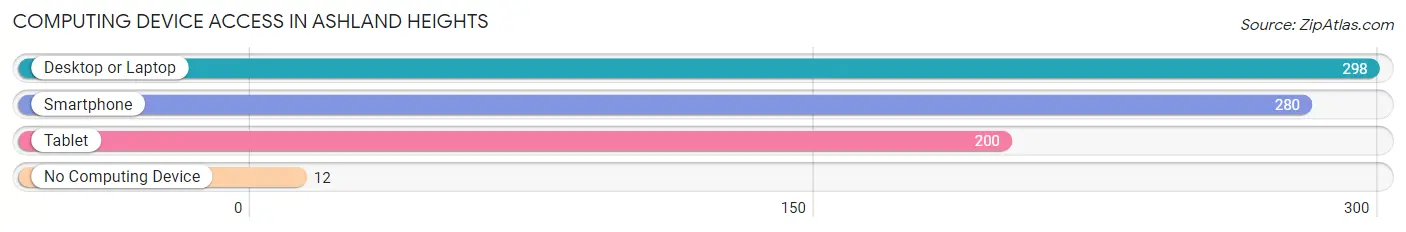
| Device Type | # Households | % Households |
| Desktop or Laptop | 298 | 85.6% |
| Smartphone | 280 | 80.5% |
| Tablet | 200 | 57.5% |
| No Computing Device | 12 | 3.5% |
| Total | 348 | 100.0% |
Internet Access in Ashland Heights
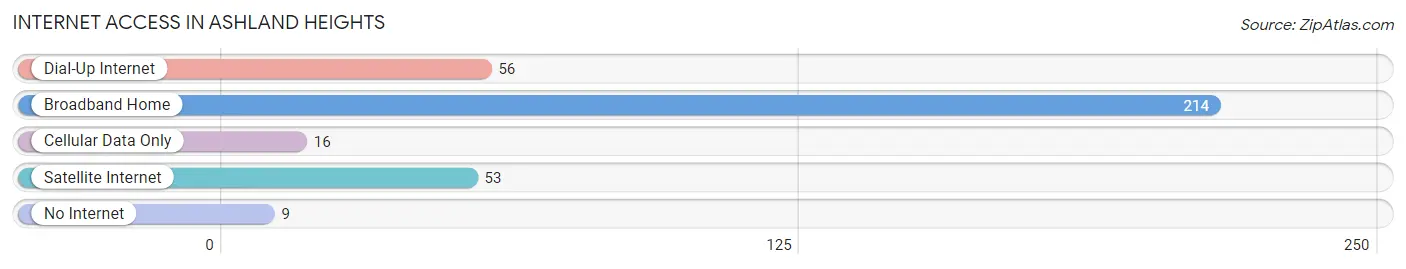
| Internet Type | # Households | % Households |
| Dial-Up Internet | 56 | 16.1% |
| Broadband Home | 214 | 61.5% |
| Cellular Data Only | 16 | 4.6% |
| Satellite Internet | 53 | 15.2% |
| No Internet | 9 | 2.6% |
| Total | 348 | 100.0% |
Ashland Heights Summary
Ashland Heights is a small town located in the state of South Dakota. It is situated in the southeastern corner of the state, near the border with Nebraska. The town has a population of just over 500 people, and is part of the Sioux Falls metropolitan area.
History
The town of Ashland Heights was founded in 1883 by a group of settlers from the nearby town of Ashland. The settlers were looking for a place to settle that was close to the railroad, and they chose the area that is now Ashland Heights. The town was originally called Ashland Station, but the name was changed to Ashland Heights in 1887.
The town grew slowly over the years, and by the early 1900s it had become a thriving community. The town was home to a variety of businesses, including a general store, a blacksmith shop, a hotel, and a post office. The town also had a school, which was built in 1902.
In the early 1900s, the town was home to a large number of immigrants from Europe, particularly from Germany and Scandinavia. These immigrants brought with them their culture and traditions, which are still evident in the town today.
Geography
Ashland Heights is located in the southeastern corner of South Dakota, near the border with Nebraska. The town is situated in the rolling hills of the Great Plains, and is surrounded by farmland. The town is located about 25 miles from Sioux Falls, the largest city in the state.
The town is located at an elevation of 1,845 feet above sea level, and has a total area of 0.7 square miles. The town is located in the Central Time Zone, and has a humid continental climate, with hot summers and cold winters.
Economy
The economy of Ashland Heights is largely based on agriculture. The town is surrounded by farmland, and many of the town’s residents are involved in farming and ranching. The town also has a few small businesses, including a general store, a gas station, and a restaurant.
The town is also home to a number of manufacturing companies, including a furniture factory and a plastics factory. These companies provide employment for many of the town’s residents.
Demographics
As of the 2010 census, the population of Ashland Heights was 514. The town has a median age of 38.7 years, and a median household income of $45,000. The town is predominantly white, with 92.3% of the population identifying as white. The town also has a small Hispanic population, with 4.3% of the population identifying as Hispanic or Latino. The town also has a small Native American population, with 1.2% of the population identifying as Native American.
Common Questions
What is Per Capita Income in Ashland Heights?
Per Capita income in Ashland Heights is $17,368.
What is the Median Family Income in Ashland Heights?
Median Family Income in Ashland Heights is $58,808.
What is the Median Household income in Ashland Heights?
Median Household Income in Ashland Heights is $59,186.
What is Inequality or Gini Index in Ashland Heights?
Inequality or Gini Index in Ashland Heights is 0.32.
What is the Total Population of Ashland Heights?
Total Population of Ashland Heights is 1,215.
What is the Total Male Population of Ashland Heights?
Total Male Population of Ashland Heights is 734.
What is the Total Female Population of Ashland Heights?
Total Female Population of Ashland Heights is 481.
What is the Ratio of Males per 100 Females in Ashland Heights?
There are 152.60 Males per 100 Females in Ashland Heights.
What is the Ratio of Females per 100 Males in Ashland Heights?
There are 65.53 Females per 100 Males in Ashland Heights.
What is the Median Population Age in Ashland Heights?
Median Population Age in Ashland Heights is 47.9 Years.
What is the Average Family Size in Ashland Heights
Average Family Size in Ashland Heights is 3.6 People.
What is the Average Household Size in Ashland Heights
Average Household Size in Ashland Heights is 3.5 People.
How Large is the Labor Force in Ashland Heights?
There are 576 People in the Labor Forcein in Ashland Heights.
What is the Percentage of People in the Labor Force in Ashland Heights?
50.7% of People are in the Labor Force in Ashland Heights.
What is the Unemployment Rate in Ashland Heights?
Unemployment Rate in Ashland Heights is 28.8%.