Zip Codes with the Highest Percentage of Renter-Occupied Units in North Augusta, SC
RELATED REPORTS & OPTIONS
Highest Renter-Occupied
North Augusta
Compare Zip Codes
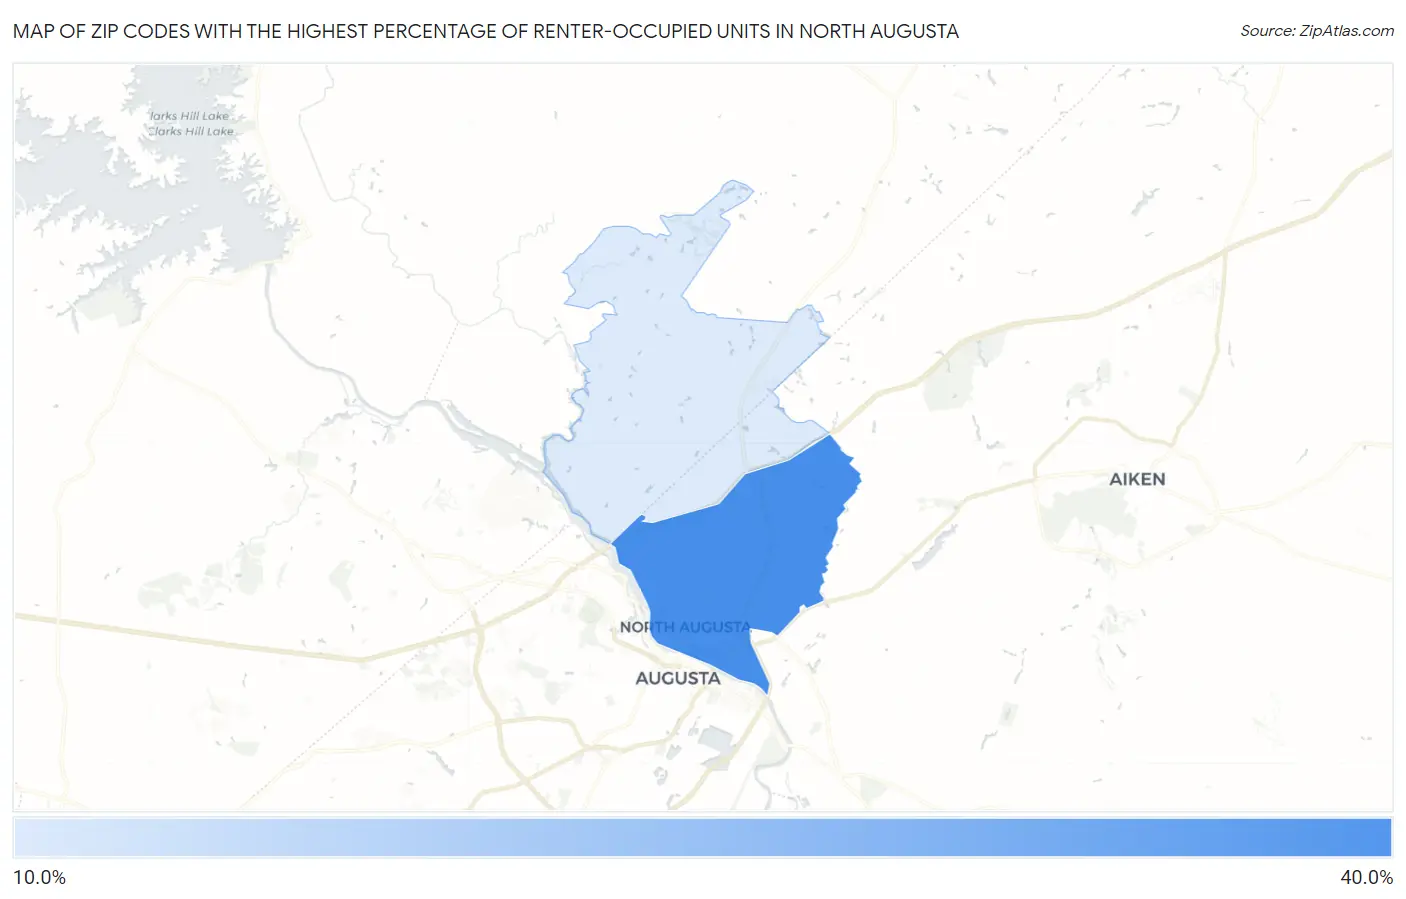
Map of Zip Codes with the Highest Percentage of Renter-Occupied Units in North Augusta
0.0%
40.0%
Zip Codes with the Highest Percentage of Renter-Occupied Units in North Augusta, SC
| Zip Code | % Renter-Occupied | vs State | vs National | |
| 1. | 29841 | 32.8% | 29.1%(+3.72)#108 | 35.2%(-2.38)#8,429 |
| 2. | 29860 | 14.4% | 29.1%(-14.7)#336 | 35.2%(-20.7)#23,673 |
1
Common Questions
What are the Top Zip Codes with the Highest Percentage of Renter-Occupied Units in North Augusta, SC?
Top Zip Codes with the Highest Percentage of Renter-Occupied Units in North Augusta, SC are:
What zip code has the Highest Percentage of Renter-Occupied Units in North Augusta, SC?
29841 has the Highest Percentage of Renter-Occupied Units in North Augusta, SC with 32.8%.
What is the Percentage of Renter-Occupied Units in North Augusta, SC?
Percentage of Renter-Occupied Units in North Augusta is 28.9%.
What is the Percentage of Renter-Occupied Units in South Carolina?
Percentage of Renter-Occupied Units in South Carolina is 29.1%.
What is the Percentage of Renter-Occupied Units in the United States?
Percentage of Renter-Occupied Units in the United States is 35.2%.