Zip Codes with the Highest Percentage of Population Taking Public Transit to Work in Mount Pleasant, SC
RELATED REPORTS & OPTIONS
Select to Compare
Select to Compare
Compare Zip Codes
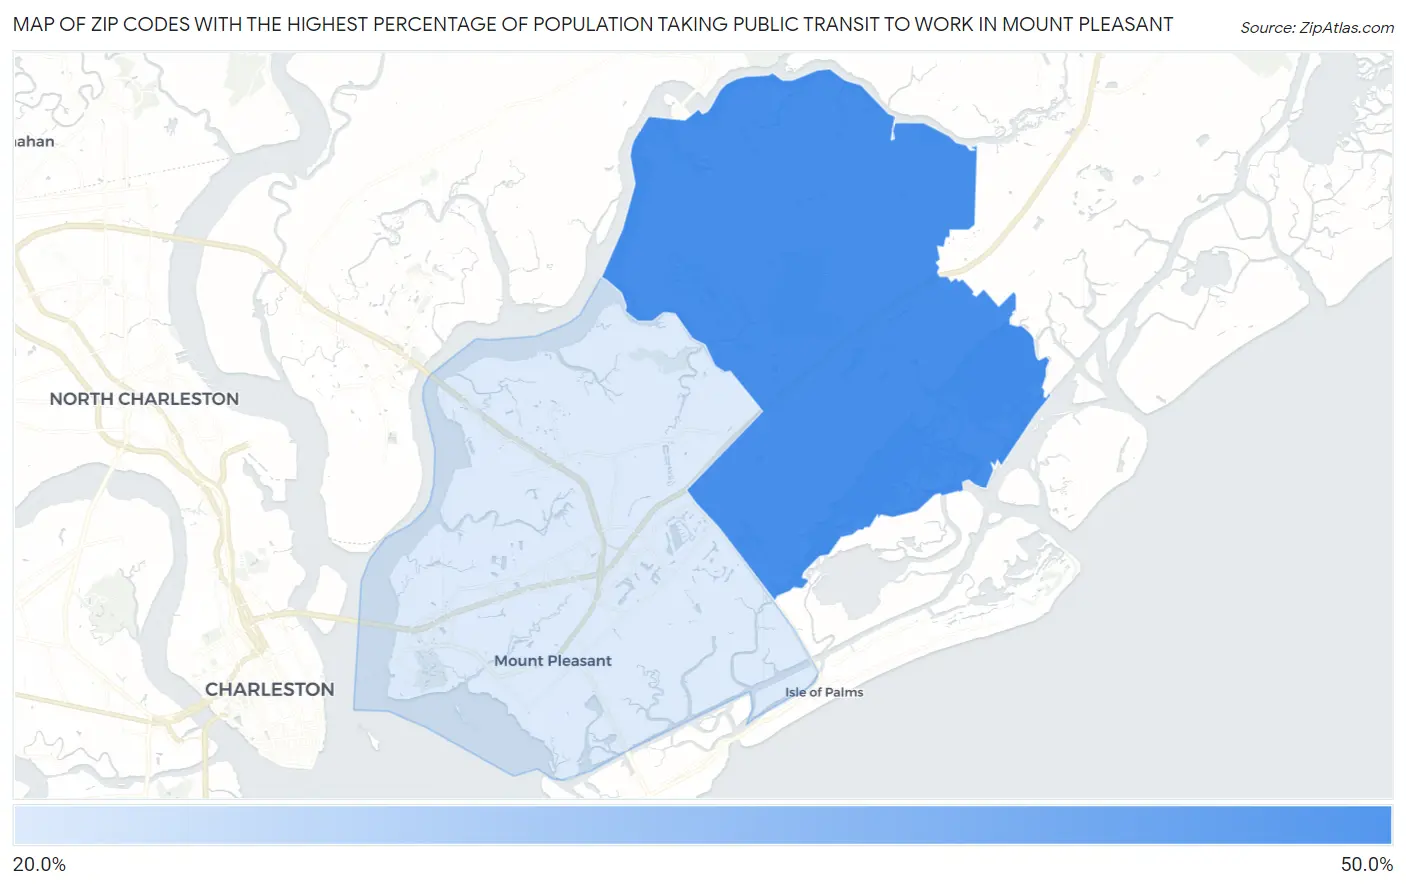
Map of Zip Codes with the Highest Percentage of Population Taking Public Transit to Work in Mount Pleasant
0.0%
25.0%
Zip Codes with the Highest Percentage of Population Taking Public Transit to Work in Mount Pleasant, SC
| Zip Code | % Public Transit | vs State | vs National | |
| 1. | 29464 | 22.3% | 40.3%(-18.0)#60 | 38.5%(-16.2)#7,876 |
1
Common Questions
What are the Top Zip Codes with the Highest Percentage of Population Taking Public Transit to Work in Mount Pleasant, SC?
Top Zip Codes with the Highest Percentage of Population Taking Public Transit to Work in Mount Pleasant, SC are:
What zip code has the Highest Percentage of Population Taking Public Transit to Work in Mount Pleasant, SC?
29464 has the Highest Percentage of Population Taking Public Transit to Work in Mount Pleasant, SC with 22.3%.
What is the Percentage of Population Taking Public Transit to Work in Mount Pleasant, SC?
Percentage of Population Taking Public Transit to Work in Mount Pleasant is 22.5%.
What is the Percentage of Population Taking Public Transit to Work in South Carolina?
Percentage of Population Taking Public Transit to Work in South Carolina is 40.3%.
What is the Percentage of Population Taking Public Transit to Work in the United States?
Percentage of Population Taking Public Transit to Work in the United States is 38.5%.