Zip Codes with the Highest Percentage of Population Employed in Agriculture, Fishing & Hunting in Fort Mill, SC
RELATED REPORTS & OPTIONS
Agriculture, Fishing & Hunting
Fort Mill
Compare Zip Codes
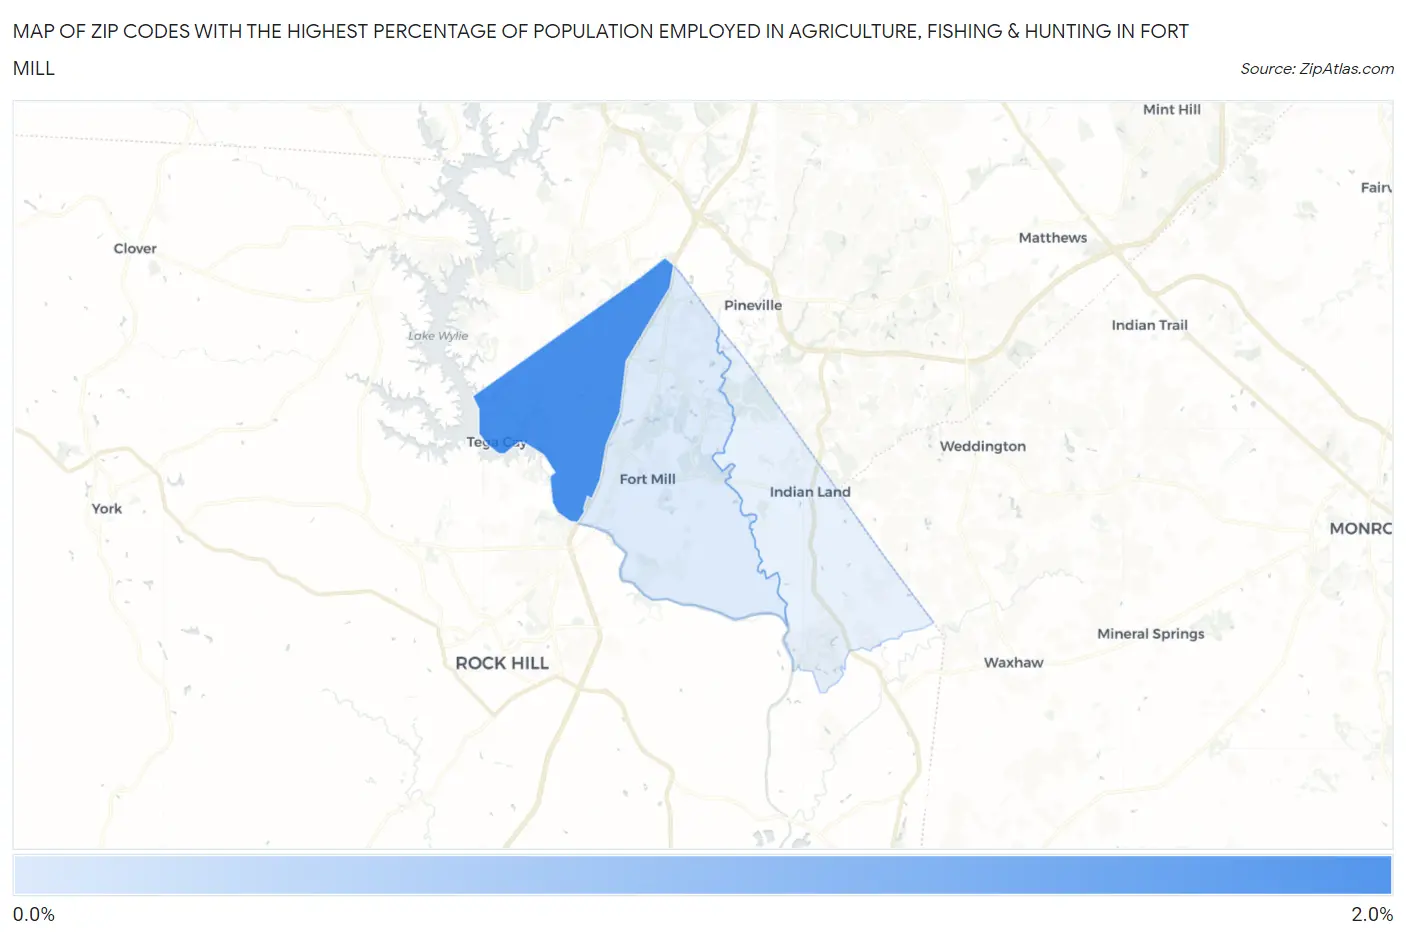
Map of Zip Codes with the Highest Percentage of Population Employed in Agriculture, Fishing & Hunting in Fort Mill
0.0%
2.0%
Zip Codes with the Highest Percentage of Population Employed in Agriculture, Fishing & Hunting in Fort Mill, SC
| Zip Code | % Employed | vs State | vs National | |
| 1. | 29708 | 1.8% | 0.78%(+0.981)#116 | 1.2%(+0.559)#13,468 |
| 2. | 29715 | 0.088% | 0.78%(-0.690)#305 | 1.2%(-1.11)#23,847 |
1
Common Questions
What are the Top Zip Codes with the Highest Percentage of Population Employed in Agriculture, Fishing & Hunting in Fort Mill, SC?
Top Zip Codes with the Highest Percentage of Population Employed in Agriculture, Fishing & Hunting in Fort Mill, SC are:
What zip code has the Highest Percentage of Population Employed in Agriculture, Fishing & Hunting in Fort Mill, SC?
29708 has the Highest Percentage of Population Employed in Agriculture, Fishing & Hunting in Fort Mill, SC with 1.8%.
What is the Percentage of Population Employed in Agriculture, Fishing & Hunting in Fort Mill, SC?
Percentage of Population Employed in Agriculture, Fishing & Hunting in Fort Mill is 0.27%.
What is the Percentage of Population Employed in Agriculture, Fishing & Hunting in South Carolina?
Percentage of Population Employed in Agriculture, Fishing & Hunting in South Carolina is 0.78%.
What is the Percentage of Population Employed in Agriculture, Fishing & Hunting in the United States?
Percentage of Population Employed in Agriculture, Fishing & Hunting in the United States is 1.2%.