Zip Codes with the Highest Poverty Level Among Children Under the Age of 5 in Columbia, SC

RELATED REPORTS & OPTIONS

Highest Poverty | Child 0-5
Population
Families and Households
Female Fertility
Female Fertility (Unmarried)
Race (Community Size)
Race (Percentage)
Ancestry (Community Size)
AfricanAlbanianAmericanApacheArabArgentineanArmenianAustralianAustrianBahamianBangladeshiBarbadianBelgianBelizeanBhutaneseBlackfeetBolivianBrazilianBritishBritish West IndianBurmeseCajunCambodianCanadianCape VerdeanCelticCentral AmericanCentral American IndianCherokeeChickasawChileanChippewaChoctawColombianCosta RicanCreekCroatianCubanCzechCzechoslovakianDanishDominicanDutchEastern EuropeanEcuadorianEgyptianEnglishEthiopianEuropeanFilipinoFinnishFrenchFrench American IndianFrench CanadianGermanGhanaianGreekGuamanian / ChamorroGuatemalanGuyaneseHaitianHonduranHungarianIndian (Asian)IndonesianIranianIraqiIrishIsraeliItalianJamaicanJapaneseKoreanLatvianLebaneseLithuanianLumbeeLuxembourgerMalaysianMexicanMexican American IndianMoroccanNative HawaiianNicaraguanNigerianNorthern EuropeanNorwegianPakistaniPalestinianPanamanianPennsylvania GermanPeruvianPolishPortuguesePuerto RicanRomanianRussianSalvadoranSamoanScandinavianScotch-IrishScottishSeminoleSerbianShoshoneSiouxSlavicSlovakSloveneSouth AfricanSouth AmericanSpaniardSpanishSri LankanSubsaharan AfricanSwedishSwissSyrianThaiTrinidadian and TobagonianTurkishU.S. Virgin IslanderUkrainianVenezuelanVietnameseWelshWest IndianYugoslavian
Ancestry (Percentage)
AfricanAlbanianAmericanApacheArabArgentineanArmenianAustralianAustrianBahamianBangladeshiBarbadianBelgianBelizeanBhutaneseBlackfeetBolivianBrazilianBritishBritish West IndianBurmeseCajunCambodianCanadianCape VerdeanCelticCentral AmericanCentral American IndianCherokeeChickasawChileanChippewaChoctawColombianCosta RicanCreekCroatianCubanCzechCzechoslovakianDanishDominicanDutchEastern EuropeanEcuadorianEgyptianEnglishEthiopianEuropeanFilipinoFinnishFrenchFrench American IndianFrench CanadianGermanGhanaianGreekGuamanian / ChamorroGuatemalanGuyaneseHaitianHonduranHungarianIndian (Asian)IndonesianIranianIraqiIrishIsraeliItalianJamaicanJapaneseKoreanLatvianLebaneseLithuanianLumbeeLuxembourgerMalaysianMexicanMexican American IndianMoroccanNative HawaiianNicaraguanNigerianNorthern EuropeanNorwegianPakistaniPalestinianPanamanianPennsylvania GermanPeruvianPolishPortuguesePuerto RicanRomanianRussianSalvadoranSamoanScandinavianScotch-IrishScottishSeminoleSerbianShoshoneSiouxSlavicSlovakSloveneSouth AfricanSouth AmericanSpaniardSpanishSri LankanSubsaharan AfricanSwedishSwissSyrianThaiTrinidadian and TobagonianTurkishU.S. Virgin IslanderUkrainianVenezuelanVietnameseWelshWest IndianYugoslavian
Immigrant Origin (Total)
AfricaAlbaniaAsiaAustraliaBahamasBangladeshBarbadosBelarusBelgiumBelizeBoliviaBosnia and HerzegovinaBrazilBurma / MyanmarCambodiaCanadaCaribbeanCentral AmericaChinaColombiaCongoCosta RicaCubaDominicaDominican RepublicEastern AfricaEastern AsiaEastern EuropeEcuadorEl SalvadorEnglandEritreaEthiopiaEuropeFranceGermanyGreeceGrenadaGuatemalaHaitiHondurasHong KongHungaryIndiaIndonesiaIranIraqIrelandItalyJamaicaJapanKenyaKoreaLaosLatin AmericaLebanonLiberiaMexicoMiddle AfricaNepalNetherlandsNicaraguaNigeriaNorthern AfricaNorthern EuropeOceaniaPakistanPanamaPeruPhilippinesPolandRomaniaRussiaSaudi ArabiaSingaporeSouth AfricaSouth AmericaSouth Central AsiaSouth Eastern AsiaSouthern EuropeSpainSwitzerlandTaiwanThailandTrinidad and TobagoTurkeyUgandaUkraineVenezuelaVietnamWestern AfricaWestern AsiaWestern EuropeZaire
Immigrant Origin (Percentage)
AfricaAlbaniaAsiaAustraliaBahamasBangladeshBarbadosBelarusBelgiumBelizeBoliviaBosnia and HerzegovinaBrazilBurma / MyanmarCambodiaCanadaCaribbeanCentral AmericaChinaColombiaCongoCosta RicaCubaDominicaDominican RepublicEastern AfricaEastern AsiaEastern EuropeEcuadorEl SalvadorEnglandEritreaEthiopiaEuropeFranceGermanyGreeceGrenadaGuatemalaHaitiHondurasHong KongHungaryIndiaIndonesiaIranIraqIrelandItalyJamaicaJapanKenyaKoreaLaosLatin AmericaLebanonLiberiaMexicoMiddle AfricaNepalNetherlandsNicaraguaNigeriaNorthern AfricaNorthern EuropeOceaniaPakistanPanamaPeruPhilippinesPolandRomaniaRussiaSaudi ArabiaSingaporeSouth AfricaSouth AmericaSouth Central AsiaSouth Eastern AsiaSouthern EuropeSpainSwitzerlandTaiwanThailandTrinidad and TobagoTurkeyUgandaUkraineVenezuelaVietnamWestern AfricaWestern AsiaWestern EuropeZaire
Income
Income (Families)
Income (Households)
Poverty
Poverty (Families)
Unemployment
Employment Occupations
Employment Industries
Employer Class
Commute Time
Commute Means
School Enrollment
Education by Degree Field
Occupancy
Finances
Physical Characteristics
Columbia
Compare Zip Codes
Comparison Subject

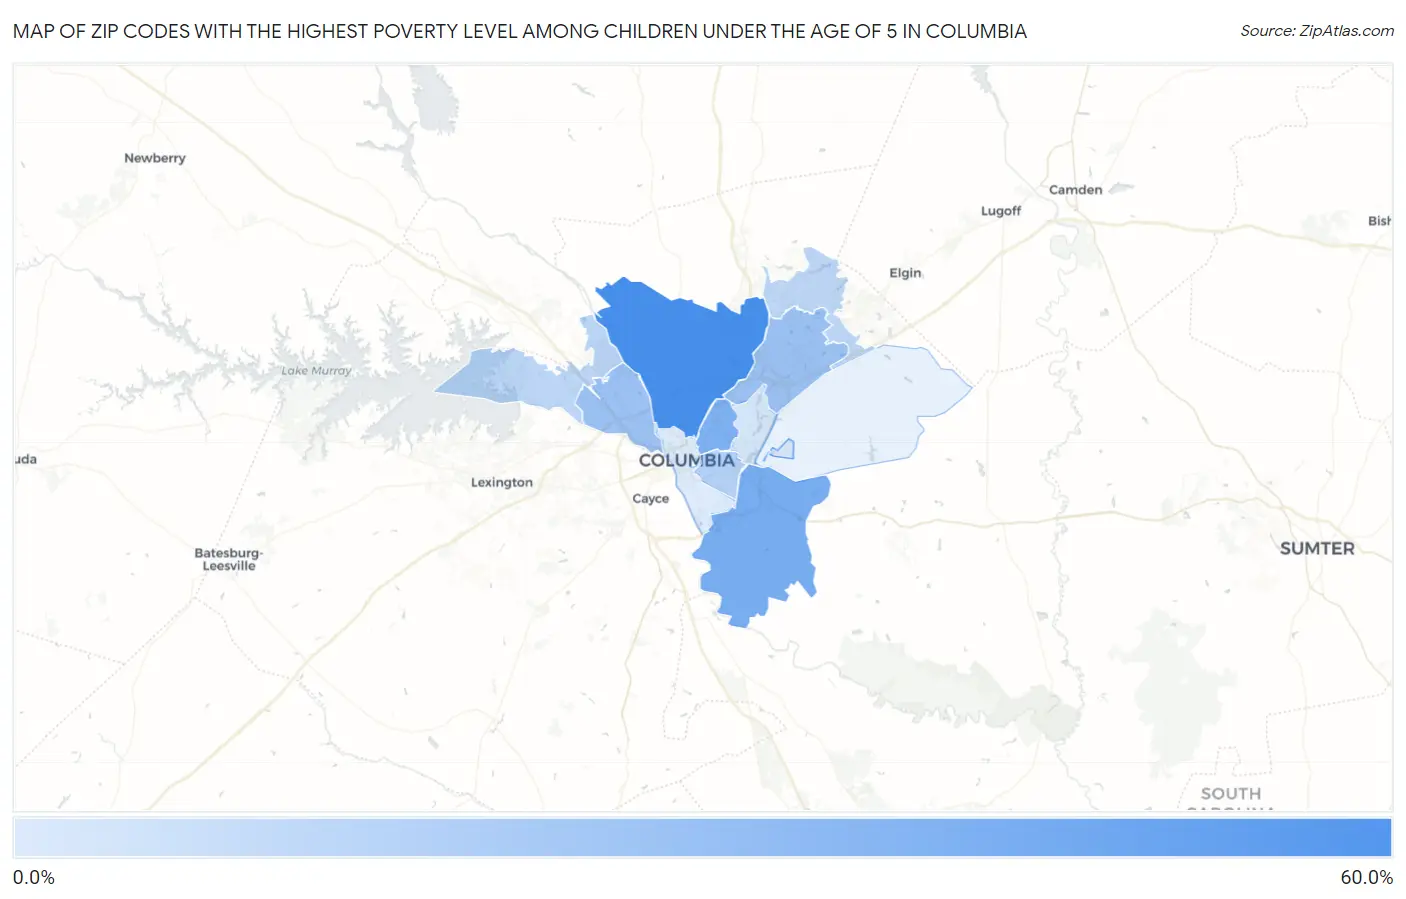
Map of Zip Codes with the Highest Poverty Level Among Children Under the Age of 5 in Columbia

0.0%
60.0%
Zip Codes with the Highest Poverty Level Among Children Under the Age of 5 in Columbia Map

Zip Codes with the Highest Poverty Level Among Children Under the Age of 5 in Columbia, SC

Zip Code Child Poverty vs State vs National
1.2920356.2%22.4%(+33.9)#4018.1%(+38.2)#1,972
2.2920938.0%22.4%(+15.6)#9118.1%(+19.9)#4,417
3.2920435.4%22.4%(+13.1)#10318.1%(+17.4)#4,970
4.2922326.0%22.4%(+3.62)#14118.1%(+7.93)#7,644
5.2921025.5%22.4%(+3.15)#14718.1%(+7.46)#7,814
6.2920518.9%22.4%(-3.48)#20718.1%(+0.829)#10,551
7.2921215.6%22.4%(-6.77)#23218.1%(-2.46)#12,126
8.2922914.9%22.4%(-7.48)#23718.1%(-3.17)#12,533
9.292068.7%22.4%(-13.7)#28618.1%(-9.40)#16,302
10.292016.7%22.4%(-15.7)#29318.1%(-11.4)#17,651

Common Questions

What are the Top 10 Zip Codes with the Highest Poverty Level Among Children Under the Age of 5 in Columbia, SC?
Top 10 Zip Codes with the Highest Poverty Level Among Children Under the Age of 5 in Columbia, SC are:
#1
56.2%
#2
38.0%
#3
35.4%
#4
26.0%
#5
25.5%
#6
18.9%
#7
15.6%
#8
14.9%
#9
8.7%
#10
6.7%
What zip code has the Highest Poverty Level Among Children Under the Age of 5 in Columbia, SC?
29203 has the Highest Poverty Level Among Children Under the Age of 5 in Columbia, SC with 56.2%.
What is the Poverty Level Among Children Under the Age of 5 in Columbia, SC?
Poverty Level Among Children Under the Age of 5 in Columbia is 31.4%.
What is the Poverty Level Among Children Under the Age of 5 in South Carolina?
Poverty Level Among Children Under the Age of 5 in South Carolina is 22.4%.
What is the Poverty Level Among Children Under the Age of 5 in the United States?
Poverty Level Among Children Under the Age of 5 in the United States is 18.1%.