Newport County, RI Map & Demographics
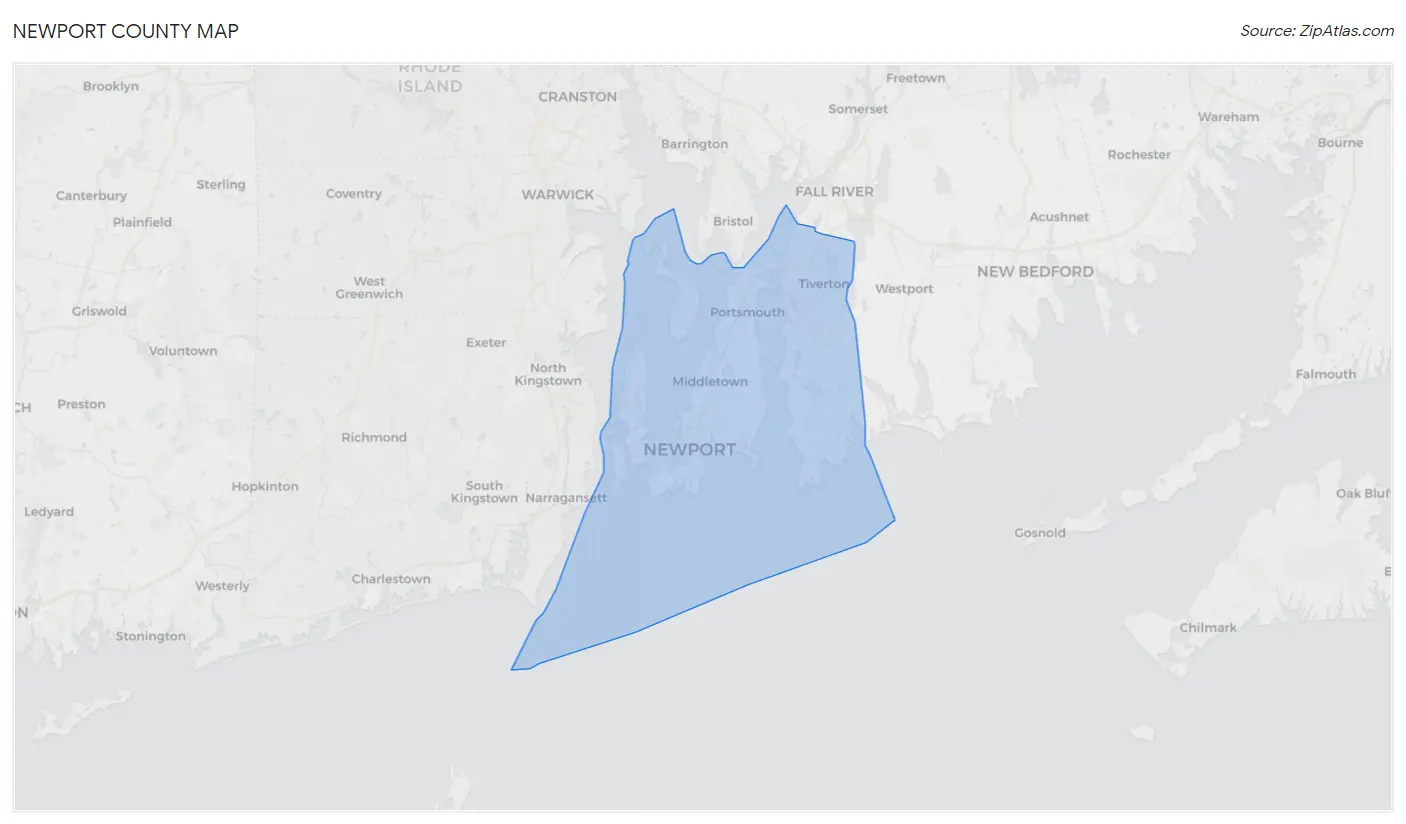
Newport County Map
Newport County Overview
$58,280
PER CAPITA INCOME
$130,074
AVG FAMILY INCOME
$96,319
AVG HOUSEHOLD INCOME
32.5%
WAGE / INCOME GAP [ % ]
67.5¢/ $1
WAGE / INCOME GAP [ $ ]
$9,890
FAMILY INCOME DEFICIT
0.48
INEQUALITY / GINI INDEX
85,442
TOTAL POPULATION
42,340
MALE POPULATION
43,102
FEMALE POPULATION
98.23
MALES / 100 FEMALES
101.80
FEMALES / 100 MALES
46.4
MEDIAN AGE
2.9
AVG FAMILY SIZE
2.3
AVG HOUSEHOLD SIZE
47,283
LABOR FORCE [ PEOPLE ]
64.4%
PERCENT IN LABOR FORCE
6.5%
UNEMPLOYMENT RATE
Newport County Area Codes
Income in Newport County
Income Overview in Newport County
Per Capita Income in Newport County is $58,280, while median incomes of families and households are $130,074 and $96,319 respectively.
| Characteristic | Number | Measure |
| Per Capita Income | 85,442 | $58,280 |
| Median Family Income | 21,759 | $130,074 |
| Mean Family Income | 21,759 | $166,037 |
| Median Household Income | 35,786 | $96,319 |
| Mean Household Income | 35,786 | $133,288 |
| Income Deficit | 21,759 | $9,890 |
| Wage / Income Gap (%) | 85,442 | 32.54% |
| Wage / Income Gap ($) | 85,442 | 67.46¢ per $1 |
| Gini / Inequality Index | 85,442 | 0.48 |
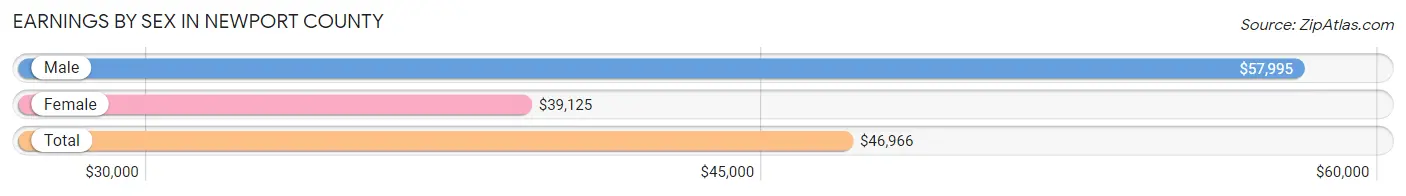
Earnings by Sex in Newport County
Average Earnings in Newport County are $46,966, $57,995 for men and $39,125 for women, a difference of 32.5%.
| Sex | Number | Average Earnings |
| Male | 26,583 (52.6%) | $57,995 |
| Female | 23,929 (47.4%) | $39,125 |
| Total | 50,512 (100.0%) | $46,966 |
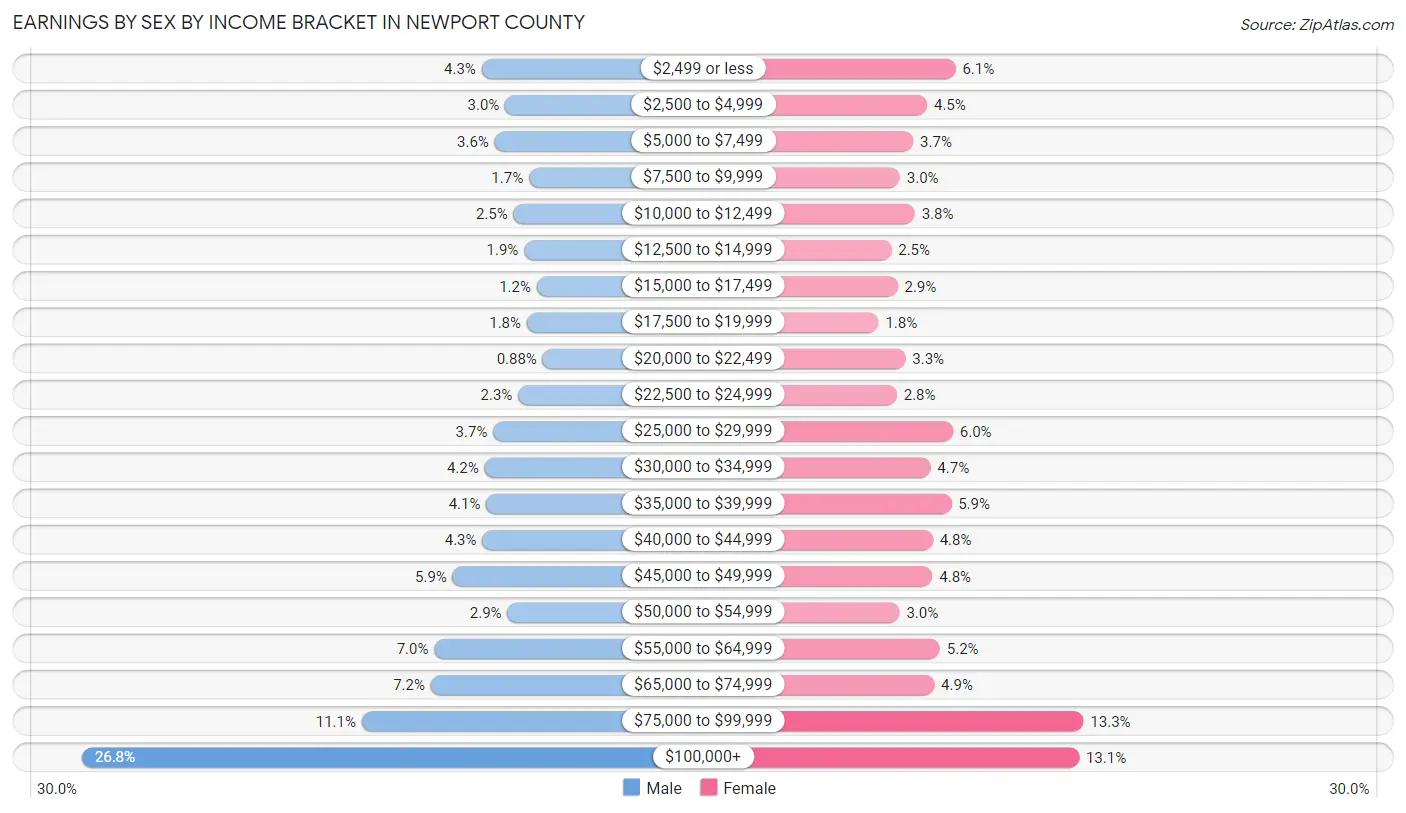
Earnings by Sex by Income Bracket in Newport County
The most common earnings brackets in Newport County are $100,000+ for men (7,120 | 26.8%) and $75,000 to $99,999 for women (3,182 | 13.3%).
| Income | Male | Female |
| $2,499 or less | 1,146 (4.3%) | 1,463 (6.1%) |
| $2,500 to $4,999 | 794 (3.0%) | 1,080 (4.5%) |
| $5,000 to $7,499 | 953 (3.6%) | 892 (3.7%) |
| $7,500 to $9,999 | 438 (1.7%) | 712 (3.0%) |
| $10,000 to $12,499 | 671 (2.5%) | 914 (3.8%) |
| $12,500 to $14,999 | 510 (1.9%) | 598 (2.5%) |
| $15,000 to $17,499 | 321 (1.2%) | 682 (2.9%) |
| $17,500 to $19,999 | 471 (1.8%) | 427 (1.8%) |
| $20,000 to $22,499 | 233 (0.9%) | 788 (3.3%) |
| $22,500 to $24,999 | 600 (2.3%) | 672 (2.8%) |
| $25,000 to $29,999 | 972 (3.7%) | 1,427 (6.0%) |
| $30,000 to $34,999 | 1,104 (4.2%) | 1,124 (4.7%) |
| $35,000 to $39,999 | 1,076 (4.1%) | 1,404 (5.9%) |
| $40,000 to $44,999 | 1,136 (4.3%) | 1,156 (4.8%) |
| $45,000 to $49,999 | 1,580 (5.9%) | 1,152 (4.8%) |
| $50,000 to $54,999 | 761 (2.9%) | 709 (3.0%) |
| $55,000 to $64,999 | 1,854 (7.0%) | 1,251 (5.2%) |
| $65,000 to $74,999 | 1,906 (7.2%) | 1,174 (4.9%) |
| $75,000 to $99,999 | 2,937 (11.1%) | 3,182 (13.3%) |
| $100,000+ | 7,120 (26.8%) | 3,122 (13.1%) |
| Total | 26,583 (100.0%) | 23,929 (100.0%) |
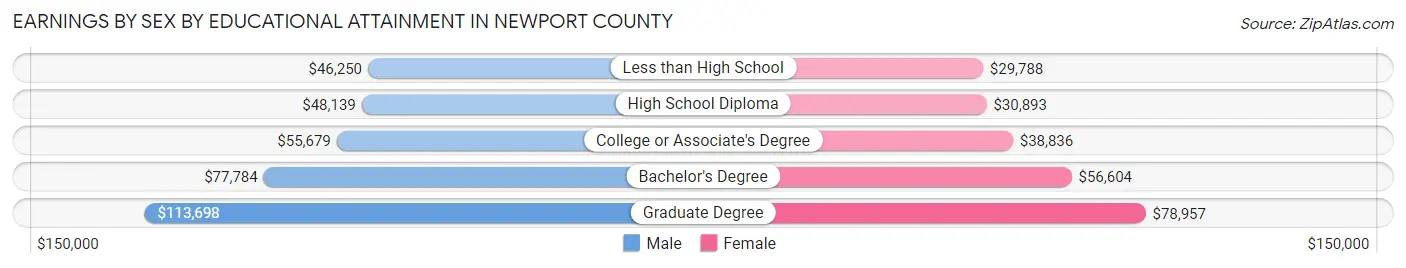
Earnings by Sex by Educational Attainment in Newport County
Average earnings in Newport County are $67,422 for men and $45,779 for women, a difference of 32.1%. Men with an educational attainment of graduate degree enjoy the highest average annual earnings of $113,698, while those with less than high school education earn the least with $46,250. Women with an educational attainment of graduate degree earn the most with the average annual earnings of $78,957, while those with less than high school education have the smallest earnings of $29,788.
| Educational Attainment | Male Income | Female Income |
| Less than High School | $46,250 | $29,788 |
| High School Diploma | $48,139 | $30,893 |
| College or Associate's Degree | $55,679 | $38,836 |
| Bachelor's Degree | $77,784 | $56,604 |
| Graduate Degree | $113,698 | $78,957 |
| Total | $67,422 | $45,779 |
Family Income in Newport County
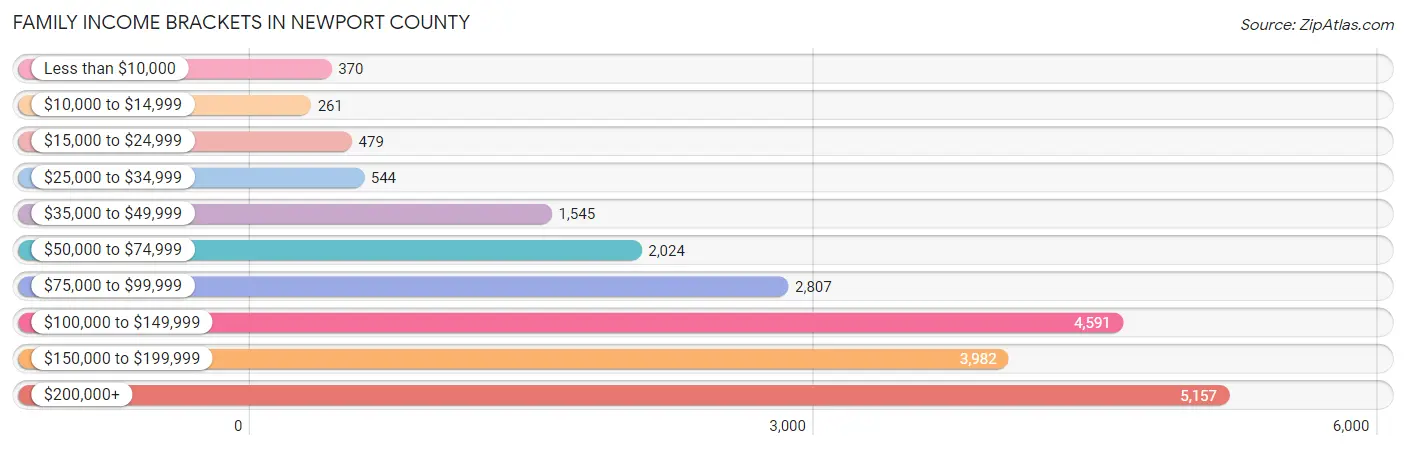
Family Income Brackets in Newport County
According to the Newport County family income data, there are 5,157 families falling into the $200,000+ income range, which is the most common income bracket and makes up 23.7% of all families. Conversely, the $10,000 to $14,999 income bracket is the least frequent group with only 261 families (1.2%) belonging to this category.
| Income Bracket | # Families | % Families |
| Less than $10,000 | 370 | 1.7% |
| $10,000 to $14,999 | 261 | 1.2% |
| $15,000 to $24,999 | 479 | 2.2% |
| $25,000 to $34,999 | 544 | 2.5% |
| $35,000 to $49,999 | 1,545 | 7.1% |
| $50,000 to $74,999 | 2,024 | 9.3% |
| $75,000 to $99,999 | 2,807 | 12.9% |
| $100,000 to $149,999 | 4,591 | 21.1% |
| $150,000 to $199,999 | 3,982 | 18.3% |
| $200,000+ | 5,157 | 23.7% |
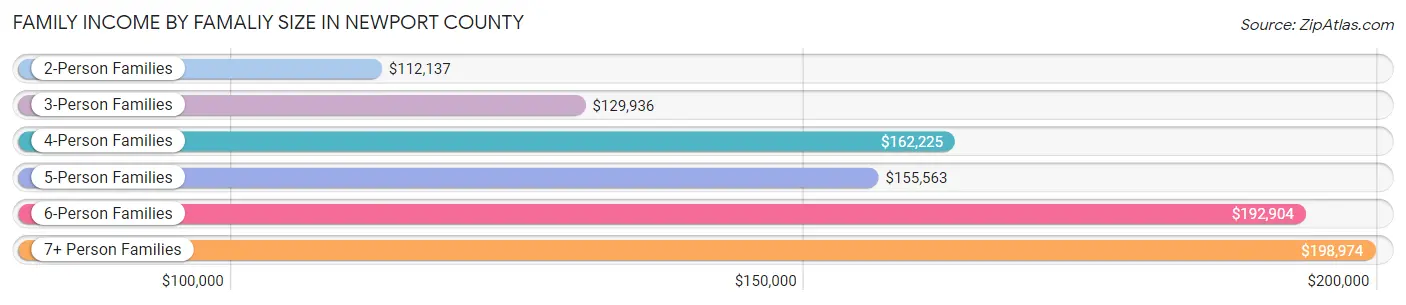
Family Income by Famaliy Size in Newport County
7+ person families (102 | 0.5%) account for the highest median family income in Newport County with $198,974 per family, while 2-person families (11,938 | 54.9%) have the highest median income of $56,068 per family member.
| Income Bracket | # Families | Median Income |
| 2-Person Families | 11,938 (54.9%) | $112,137 |
| 3-Person Families | 4,662 (21.4%) | $129,936 |
| 4-Person Families | 3,647 (16.8%) | $162,225 |
| 5-Person Families | 1,129 (5.2%) | $155,563 |
| 6-Person Families | 281 (1.3%) | $192,904 |
| 7+ Person Families | 102 (0.5%) | $198,974 |
| Total | 21,759 (100.0%) | $130,074 |
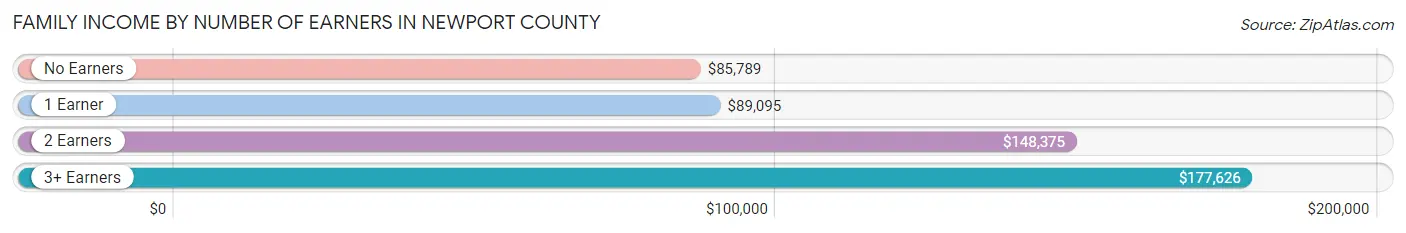
Family Income by Number of Earners in Newport County
The median family income in Newport County is $130,074, with families comprising 3+ earners (2,947) having the highest median family income of $177,626, while families with no earners (3,514) have the lowest median family income of $85,789, accounting for 13.5% and 16.2% of families, respectively.
| Number of Earners | # Families | Median Income |
| No Earners | 3,514 (16.2%) | $85,789 |
| 1 Earner | 6,076 (27.9%) | $89,095 |
| 2 Earners | 9,222 (42.4%) | $148,375 |
| 3+ Earners | 2,947 (13.5%) | $177,626 |
| Total | 21,759 (100.0%) | $130,074 |
Household Income in Newport County
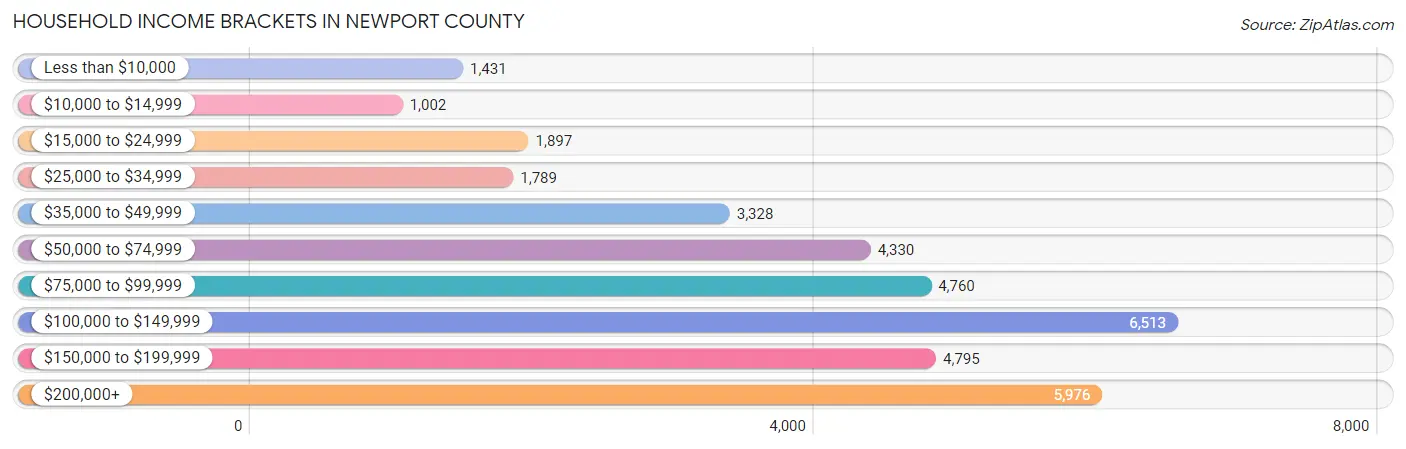
Household Income Brackets in Newport County
With 6,513 households falling in the category, the $100,000 to $149,999 income range is the most frequent in Newport County, accounting for 18.2% of all households. In contrast, only 1,002 households (2.8%) fall into the $10,000 to $14,999 income bracket, making it the least populous group.
| Income Bracket | # Households | % Households |
| Less than $10,000 | 1,431 | 4.0% |
| $10,000 to $14,999 | 1,002 | 2.8% |
| $15,000 to $24,999 | 1,897 | 5.3% |
| $25,000 to $34,999 | 1,789 | 5.0% |
| $35,000 to $49,999 | 3,328 | 9.3% |
| $50,000 to $74,999 | 4,330 | 12.1% |
| $75,000 to $99,999 | 4,760 | 13.3% |
| $100,000 to $149,999 | 6,513 | 18.2% |
| $150,000 to $199,999 | 4,795 | 13.4% |
| $200,000+ | 5,976 | 16.7% |
Household Income by Householder Age in Newport County
The median household income in Newport County is $96,319, with the highest median household income of $126,578 found in the 45 to 64 years age bracket for the primary householder. A total of 13,187 households (36.8%) fall into this category. Meanwhile, the 15 to 24 years age bracket for the primary householder has the lowest median household income of $47,589, with 741 households (2.1%) in this group.
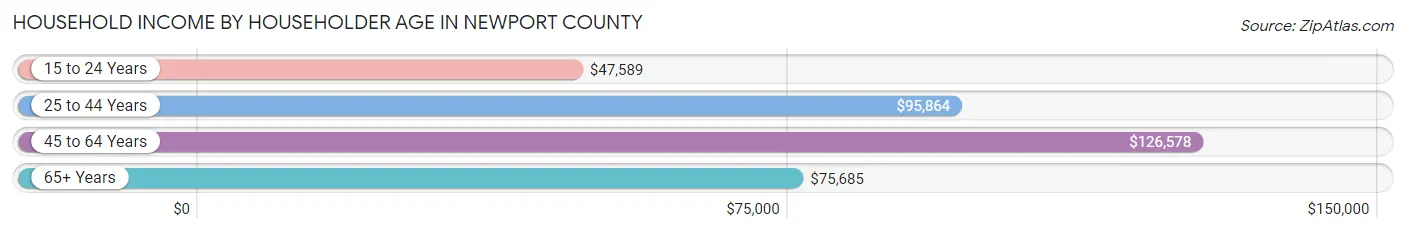
| Income Bracket | # Households | Median Income |
| 15 to 24 Years | 741 (2.1%) | $47,589 |
| 25 to 44 Years | 8,861 (24.8%) | $95,864 |
| 45 to 64 Years | 13,187 (36.8%) | $126,578 |
| 65+ Years | 12,997 (36.3%) | $75,685 |
| Total | 35,786 (100.0%) | $96,319 |
Poverty in Newport County
Income Below Poverty by Sex and Age in Newport County
With 6.8% poverty level for males and 8.7% for females among the residents of Newport County, 5 year old males and under 5 year old females are the most vulnerable to poverty, with 73 males (19.0%) and 315 females (18.7%) in their respective age groups living below the poverty level.
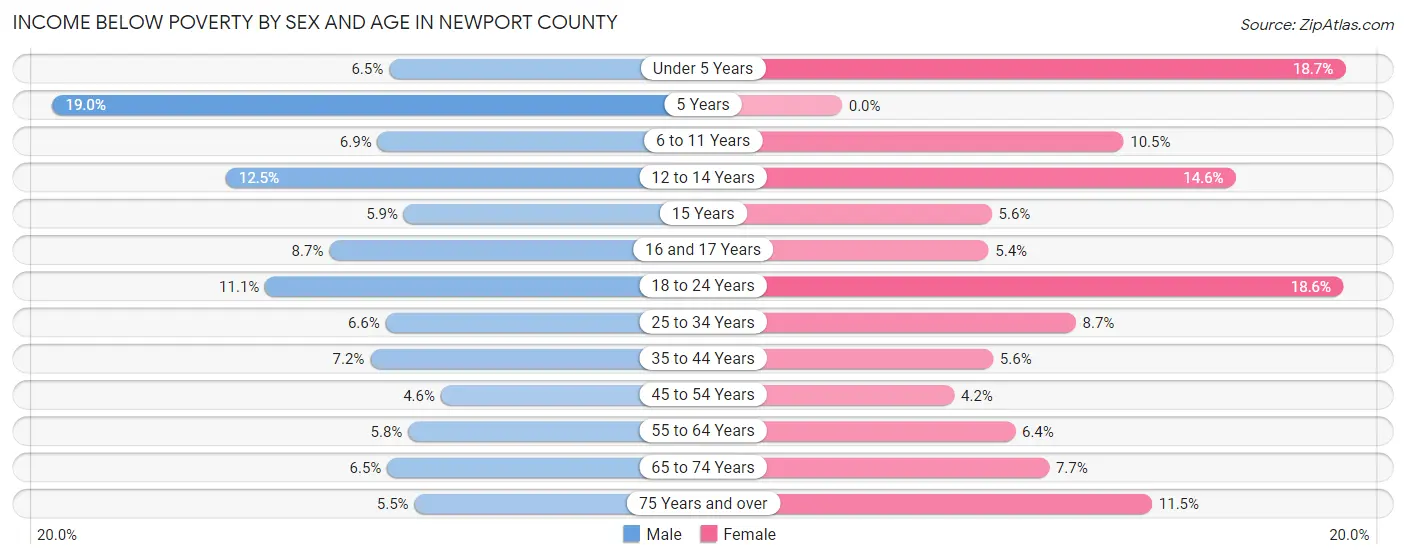
| Age Bracket | Male | Female |
| Under 5 Years | 111 (6.5%) | 315 (18.7%) |
| 5 Years | 73 (19.0%) | 0 (0.0%) |
| 6 to 11 Years | 172 (6.9%) | 195 (10.4%) |
| 12 to 14 Years | 140 (12.5%) | 196 (14.6%) |
| 15 Years | 25 (5.9%) | 23 (5.6%) |
| 16 and 17 Years | 94 (8.7%) | 41 (5.4%) |
| 18 to 24 Years | 317 (11.1%) | 480 (18.6%) |
| 25 to 34 Years | 357 (6.6%) | 414 (8.7%) |
| 35 to 44 Years | 329 (7.2%) | 254 (5.6%) |
| 45 to 54 Years | 240 (4.5%) | 219 (4.2%) |
| 55 to 64 Years | 361 (5.8%) | 434 (6.4%) |
| 65 to 74 Years | 363 (6.5%) | 455 (7.7%) |
| 75 Years and over | 195 (5.5%) | 570 (11.5%) |
| Total | 2,777 (6.8%) | 3,596 (8.7%) |
Income Above Poverty by Sex and Age in Newport County
According to the poverty statistics in Newport County, males aged 45 to 54 years and females aged 5 years are the age groups that are most secure financially, with 95.5% of males and 100.0% of females in these age groups living above the poverty line.
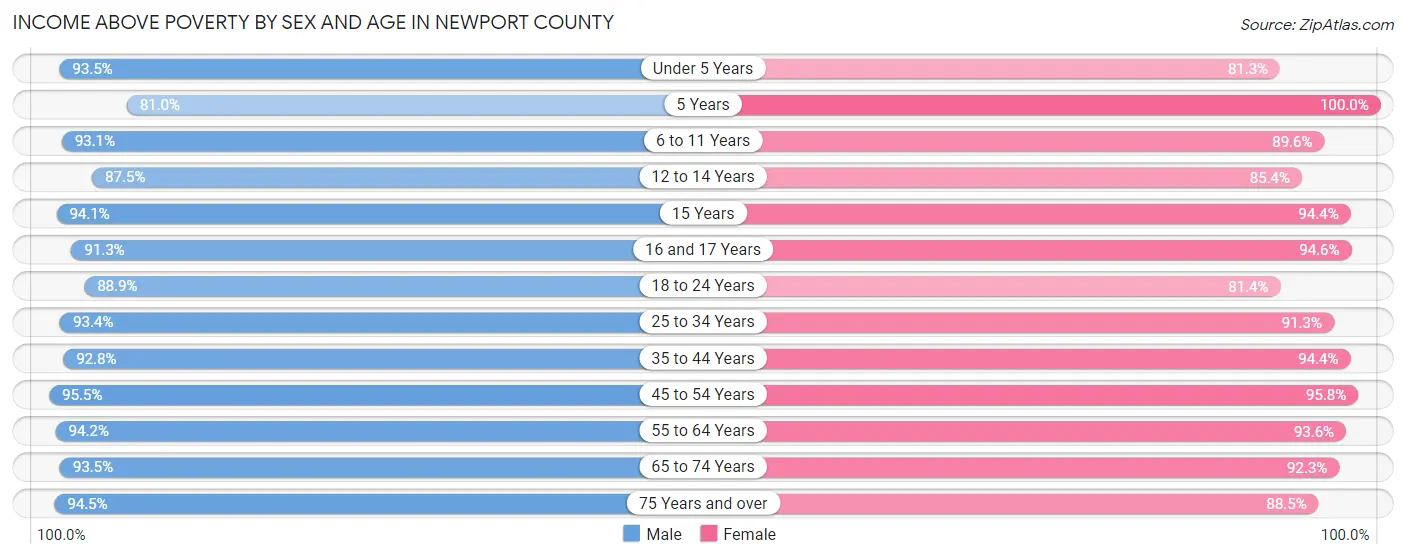
| Age Bracket | Male | Female |
| Under 5 Years | 1,604 (93.5%) | 1,371 (81.3%) |
| 5 Years | 312 (81.0%) | 487 (100.0%) |
| 6 to 11 Years | 2,320 (93.1%) | 1,671 (89.5%) |
| 12 to 14 Years | 977 (87.5%) | 1,146 (85.4%) |
| 15 Years | 397 (94.1%) | 391 (94.4%) |
| 16 and 17 Years | 988 (91.3%) | 712 (94.6%) |
| 18 to 24 Years | 2,547 (88.9%) | 2,101 (81.4%) |
| 25 to 34 Years | 5,052 (93.4%) | 4,357 (91.3%) |
| 35 to 44 Years | 4,258 (92.8%) | 4,274 (94.4%) |
| 45 to 54 Years | 5,031 (95.5%) | 5,028 (95.8%) |
| 55 to 64 Years | 5,903 (94.2%) | 6,311 (93.6%) |
| 65 to 74 Years | 5,184 (93.5%) | 5,465 (92.3%) |
| 75 Years and over | 3,334 (94.5%) | 4,381 (88.5%) |
| Total | 37,907 (93.2%) | 37,695 (91.3%) |
Income Below Poverty Among Married-Couple Families in Newport County
The poverty statistics for married-couple families in Newport County show that 2.4% or 406 of the total 17,231 families live below the poverty line. Families with 3 or 4 children have the highest poverty rate of 3.1%, comprising of 28 families. On the other hand, families with 5 or more children have the lowest poverty rate of 0.0%, which includes 0 families.
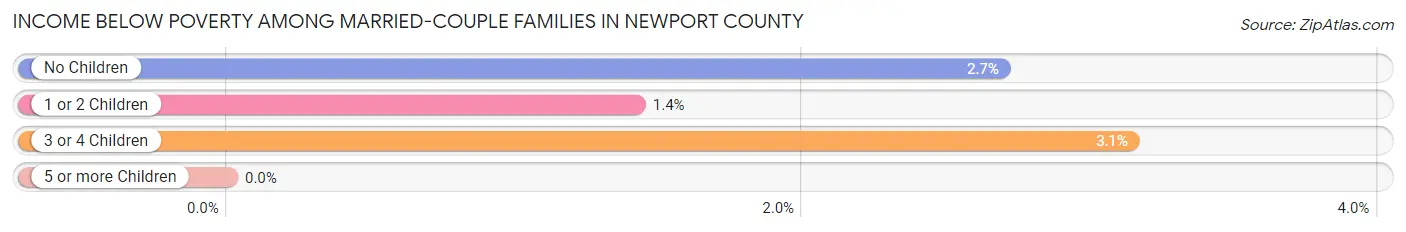
| Children | Above Poverty | Below Poverty |
| No Children | 11,195 (97.3%) | 310 (2.7%) |
| 1 or 2 Children | 4,728 (98.6%) | 68 (1.4%) |
| 3 or 4 Children | 863 (96.9%) | 28 (3.1%) |
| 5 or more Children | 39 (100.0%) | 0 (0.0%) |
| Total | 16,825 (97.6%) | 406 (2.4%) |
Income Below Poverty Among Single-Parent Households in Newport County
According to the poverty data in Newport County, 10.6% or 136 single-father households and 12.4% or 402 single-mother households are living below the poverty line. Among single-father households, those with 3 or 4 children have the highest poverty rate, with 56 households (100.0%) experiencing poverty. Likewise, among single-mother households, those with 3 or 4 children have the highest poverty rate, with 55 households (57.9%) falling below the poverty line.
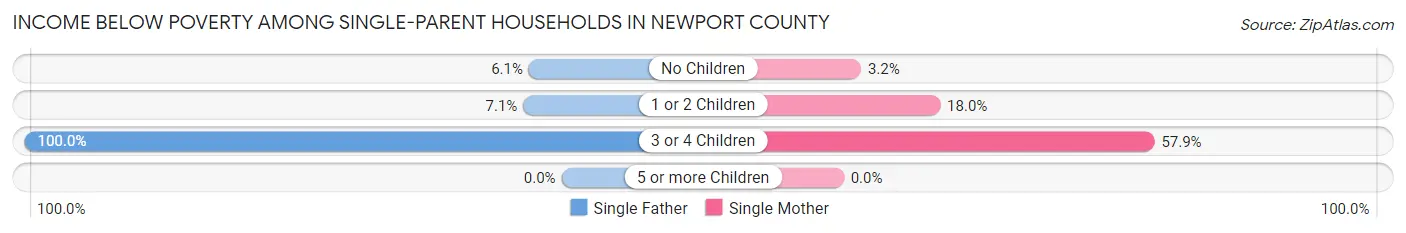
| Children | Single Father | Single Mother |
| No Children | 44 (6.1%) | 48 (3.2%) |
| 1 or 2 Children | 36 (7.1%) | 299 (18.0%) |
| 3 or 4 Children | 56 (100.0%) | 55 (57.9%) |
| 5 or more Children | 0 (0.0%) | 0 (0.0%) |
| Total | 136 (10.6%) | 402 (12.4%) |
Income Below Poverty Among Married-Couple vs Single-Parent Households in Newport County
The poverty data for Newport County shows that 406 of the married-couple family households (2.4%) and 538 of the single-parent households (11.9%) are living below the poverty level. Within the married-couple family households, those with 3 or 4 children have the highest poverty rate, with 28 households (3.1%) falling below the poverty line. Among the single-parent households, those with 3 or 4 children have the highest poverty rate, with 111 household (73.5%) living below poverty.
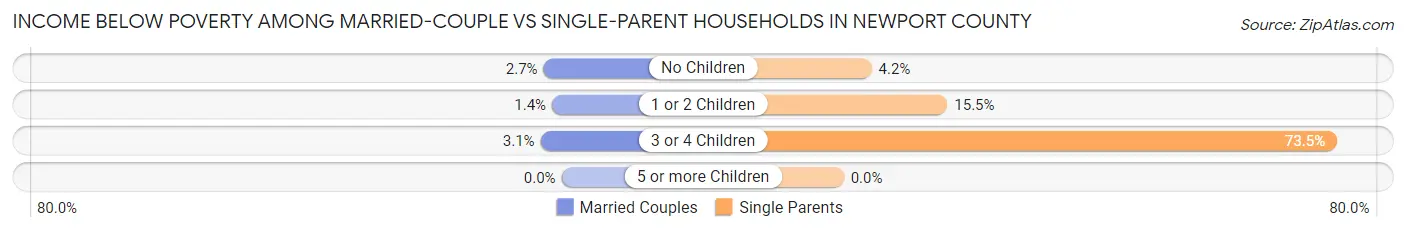
| Children | Married-Couple Families | Single-Parent Households |
| No Children | 310 (2.7%) | 92 (4.2%) |
| 1 or 2 Children | 68 (1.4%) | 335 (15.4%) |
| 3 or 4 Children | 28 (3.1%) | 111 (73.5%) |
| 5 or more Children | 0 (0.0%) | 0 (0.0%) |
| Total | 406 (2.4%) | 538 (11.9%) |
Race in Newport County
The most populous races in Newport County are White / Caucasian (73,700 | 86.3%), Hispanic or Latino (5,102 | 6.0%), and Two or more Races (4,960 | 5.8%).
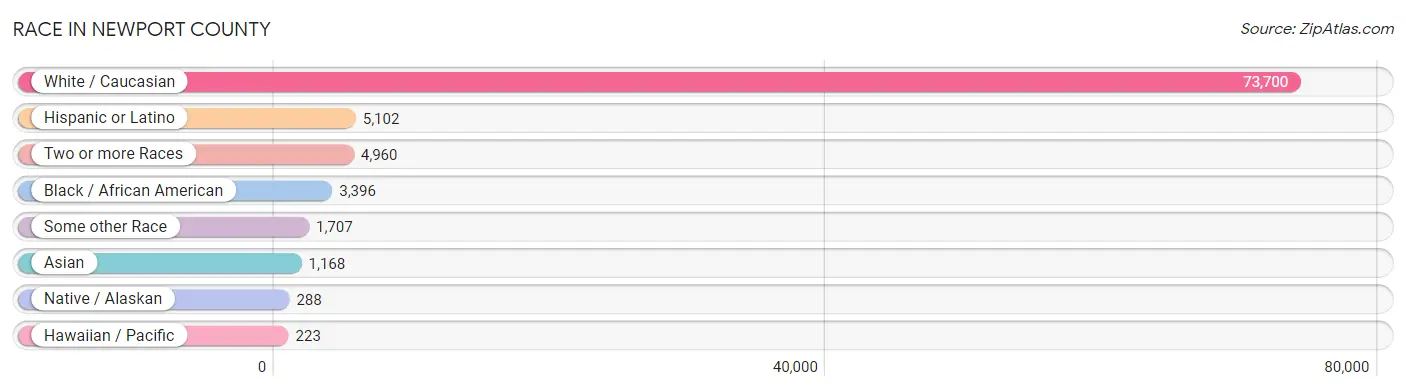
| Race | # Population | % Population |
| Asian | 1,168 | 1.4% |
| Black / African American | 3,396 | 4.0% |
| Hawaiian / Pacific | 223 | 0.3% |
| Hispanic or Latino | 5,102 | 6.0% |
| Native / Alaskan | 288 | 0.3% |
| White / Caucasian | 73,700 | 86.3% |
| Two or more Races | 4,960 | 5.8% |
| Some other Race | 1,707 | 2.0% |
| Total | 85,442 | 100.0% |
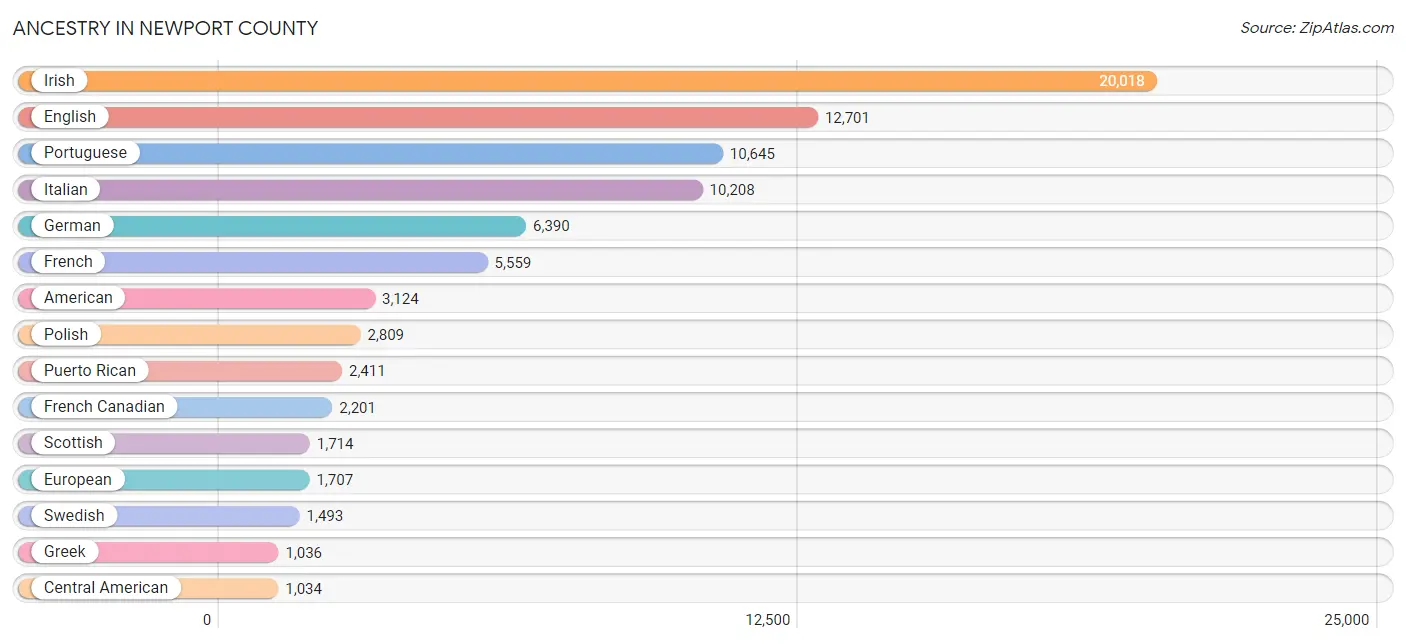
Ancestry in Newport County
The most populous ancestries reported in Newport County are Irish (20,018 | 23.4%), English (12,701 | 14.9%), Portuguese (10,645 | 12.5%), Italian (10,208 | 11.9%), and German (6,390 | 7.5%), together accounting for 70.2% of all Newport County residents.
| Ancestry | # Population | % Population |
| African | 214 | 0.3% |
| Albanian | 6 | 0.0% |
| American | 3,124 | 3.7% |
| Arab | 692 | 0.8% |
| Argentinean | 119 | 0.1% |
| Armenian | 223 | 0.3% |
| Assyrian / Chaldean / Syriac | 18 | 0.0% |
| Australian | 28 | 0.0% |
| Austrian | 119 | 0.1% |
| Barbadian | 29 | 0.0% |
| Basque | 80 | 0.1% |
| Belgian | 66 | 0.1% |
| Belizean | 48 | 0.1% |
| Bermudan | 26 | 0.0% |
| Bhutanese | 571 | 0.7% |
| Brazilian | 479 | 0.6% |
| British | 540 | 0.6% |
| British West Indian | 41 | 0.1% |
| Bulgarian | 66 | 0.1% |
| Burmese | 214 | 0.3% |
| Cambodian | 15 | 0.0% |
| Canadian | 208 | 0.2% |
| Cape Verdean | 292 | 0.3% |
| Carpatho Rusyn | 133 | 0.2% |
| Central American | 1,034 | 1.2% |
| Central American Indian | 52 | 0.1% |
| Cherokee | 45 | 0.1% |
| Cheyenne | 13 | 0.0% |
| Chilean | 48 | 0.1% |
| Colombian | 127 | 0.2% |
| Costa Rican | 3 | 0.0% |
| Croatian | 81 | 0.1% |
| Cuban | 53 | 0.1% |
| Czech | 98 | 0.1% |
| Czechoslovakian | 121 | 0.1% |
| Danish | 205 | 0.2% |
| Delaware | 16 | 0.0% |
| Dominican | 271 | 0.3% |
| Dutch | 596 | 0.7% |
| Dutch West Indian | 29 | 0.0% |
| Eastern European | 413 | 0.5% |
| Ecuadorian | 170 | 0.2% |
| Egyptian | 21 | 0.0% |
| English | 12,701 | 14.9% |
| Estonian | 15 | 0.0% |
| Ethiopian | 3 | 0.0% |
| European | 1,707 | 2.0% |
| Filipino | 23 | 0.0% |
| Finnish | 158 | 0.2% |
| French | 5,559 | 6.5% |
| French American Indian | 60 | 0.1% |
| French Canadian | 2,201 | 2.6% |
| German | 6,390 | 7.5% |
| Ghanaian | 13 | 0.0% |
| Greek | 1,036 | 1.2% |
| Guatemalan | 650 | 0.8% |
| Haitian | 8 | 0.0% |
| Honduran | 82 | 0.1% |
| Hungarian | 141 | 0.2% |
| Indian (Asian) | 411 | 0.5% |
| Iranian | 18 | 0.0% |
| Irish | 20,018 | 23.4% |
| Iroquois | 10 | 0.0% |
| Italian | 10,208 | 11.9% |
| Jamaican | 220 | 0.3% |
| Korean | 624 | 0.7% |
| Latvian | 14 | 0.0% |
| Lebanese | 599 | 0.7% |
| Lithuanian | 360 | 0.4% |
| Lumbee | 25 | 0.0% |
| Luxembourger | 14 | 0.0% |
| Malaysian | 7 | 0.0% |
| Maltese | 33 | 0.0% |
| Mexican | 499 | 0.6% |
| Mexican American Indian | 3 | 0.0% |
| Native Hawaiian | 280 | 0.3% |
| Navajo | 101 | 0.1% |
| Nigerian | 41 | 0.1% |
| Northern European | 44 | 0.1% |
| Norwegian | 568 | 0.7% |
| Pakistani | 67 | 0.1% |
| Panamanian | 29 | 0.0% |
| Peruvian | 27 | 0.0% |
| Polish | 2,809 | 3.3% |
| Portuguese | 10,645 | 12.5% |
| Puerto Rican | 2,411 | 2.8% |
| Romanian | 121 | 0.1% |
| Russian | 534 | 0.6% |
| Salvadoran | 270 | 0.3% |
| Samoan | 24 | 0.0% |
| Scandinavian | 193 | 0.2% |
| Scotch-Irish | 845 | 1.0% |
| Scottish | 1,714 | 2.0% |
| Seminole | 53 | 0.1% |
| Senegalese | 7 | 0.0% |
| Serbian | 52 | 0.1% |
| Shoshone | 11 | 0.0% |
| Sioux | 10 | 0.0% |
| Slavic | 27 | 0.0% |
| Slovak | 184 | 0.2% |
| Slovene | 7 | 0.0% |
| South American | 491 | 0.6% |
| Spaniard | 189 | 0.2% |
| Spanish | 53 | 0.1% |
| Sri Lankan | 191 | 0.2% |
| Subsaharan African | 570 | 0.7% |
| Swedish | 1,493 | 1.8% |
| Swiss | 40 | 0.1% |
| Syrian | 72 | 0.1% |
| Thai | 49 | 0.1% |
| Trinidadian and Tobagonian | 75 | 0.1% |
| Ukrainian | 319 | 0.4% |
| Welsh | 723 | 0.9% |
| West Indian | 16 | 0.0% | View All 114 Rows |
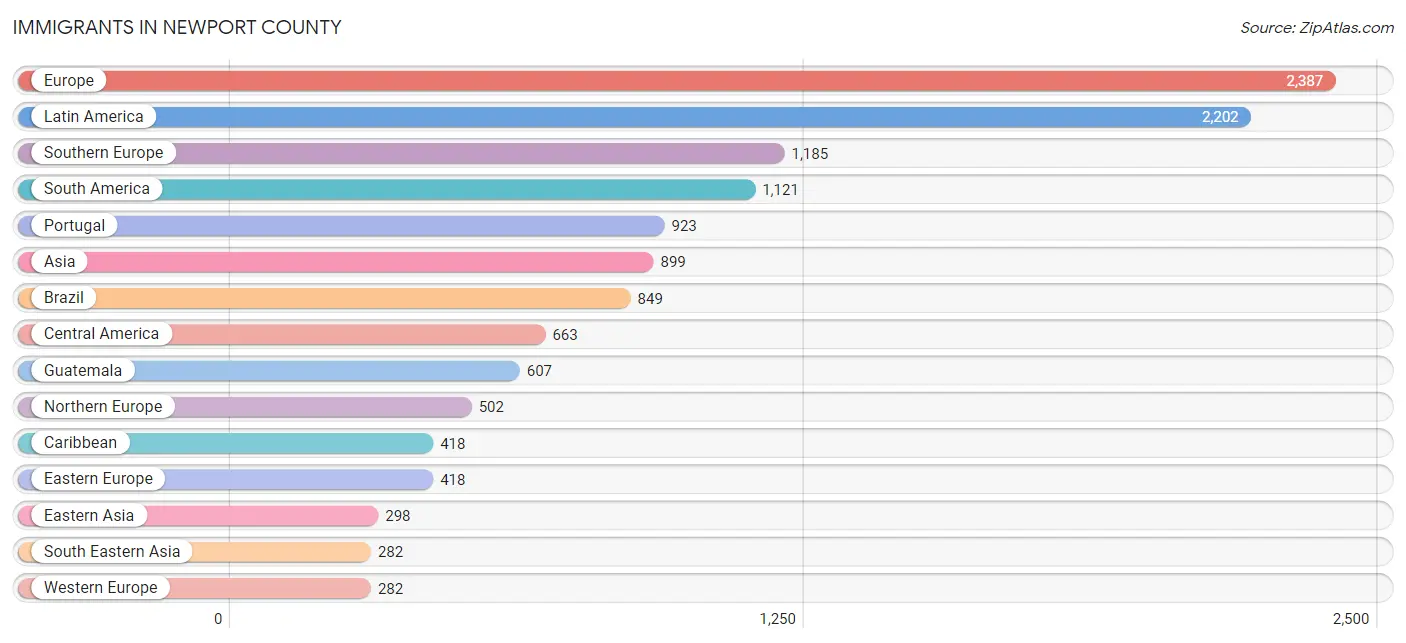
Immigrants in Newport County
The most numerous immigrant groups reported in Newport County came from Europe (2,387 | 2.8%), Latin America (2,202 | 2.6%), Southern Europe (1,185 | 1.4%), South America (1,121 | 1.3%), and Portugal (923 | 1.1%), together accounting for 9.1% of all Newport County residents.
| Immigration Origin | # Population | % Population |
| Africa | 158 | 0.2% |
| Argentina | 92 | 0.1% |
| Asia | 899 | 1.1% |
| Australia | 22 | 0.0% |
| Austria | 10 | 0.0% |
| Azores | 267 | 0.3% |
| Barbados | 39 | 0.1% |
| Bosnia and Herzegovina | 12 | 0.0% |
| Brazil | 849 | 1.0% |
| Bulgaria | 98 | 0.1% |
| Cabo Verde | 32 | 0.0% |
| Canada | 163 | 0.2% |
| Caribbean | 418 | 0.5% |
| Central America | 663 | 0.8% |
| China | 227 | 0.3% |
| Colombia | 88 | 0.1% |
| Croatia | 22 | 0.0% |
| Czechoslovakia | 60 | 0.1% |
| Denmark | 11 | 0.0% |
| Dominica | 39 | 0.1% |
| Dominican Republic | 112 | 0.1% |
| Eastern Africa | 3 | 0.0% |
| Eastern Asia | 298 | 0.4% |
| Eastern Europe | 418 | 0.5% |
| Ecuador | 50 | 0.1% |
| Egypt | 10 | 0.0% |
| El Salvador | 22 | 0.0% |
| England | 104 | 0.1% |
| Ethiopia | 3 | 0.0% |
| Europe | 2,387 | 2.8% |
| France | 50 | 0.1% |
| Germany | 155 | 0.2% |
| Greece | 147 | 0.2% |
| Guatemala | 607 | 0.7% |
| Hong Kong | 18 | 0.0% |
| India | 6 | 0.0% |
| Ireland | 144 | 0.2% |
| Italy | 68 | 0.1% |
| Jamaica | 120 | 0.1% |
| Japan | 54 | 0.1% |
| Kazakhstan | 24 | 0.0% |
| Korea | 17 | 0.0% |
| Laos | 7 | 0.0% |
| Latin America | 2,202 | 2.6% |
| Lebanon | 168 | 0.2% |
| Liberia | 20 | 0.0% |
| Mexico | 34 | 0.0% |
| Moldova | 9 | 0.0% |
| Netherlands | 67 | 0.1% |
| Nigeria | 26 | 0.0% |
| Northern Africa | 20 | 0.0% |
| Northern Europe | 502 | 0.6% |
| Oceania | 22 | 0.0% |
| Pakistan | 76 | 0.1% |
| Peru | 27 | 0.0% |
| Philippines | 114 | 0.1% |
| Poland | 28 | 0.0% |
| Portugal | 923 | 1.1% |
| Romania | 46 | 0.1% |
| Russia | 63 | 0.1% |
| Scotland | 28 | 0.0% |
| Senegal | 24 | 0.0% |
| Serbia | 52 | 0.1% |
| Singapore | 4 | 0.0% |
| South Africa | 5 | 0.0% |
| South America | 1,121 | 1.3% |
| South Central Asia | 106 | 0.1% |
| South Eastern Asia | 282 | 0.3% |
| Southern Europe | 1,185 | 1.4% |
| Spain | 47 | 0.1% |
| Sweden | 9 | 0.0% |
| Syria | 45 | 0.1% |
| Taiwan | 63 | 0.1% |
| Thailand | 67 | 0.1% |
| Trinidad and Tobago | 96 | 0.1% |
| Ukraine | 28 | 0.0% |
| Vietnam | 90 | 0.1% |
| Western Africa | 115 | 0.1% |
| Western Asia | 213 | 0.3% |
| Western Europe | 282 | 0.3% | View All 80 Rows |
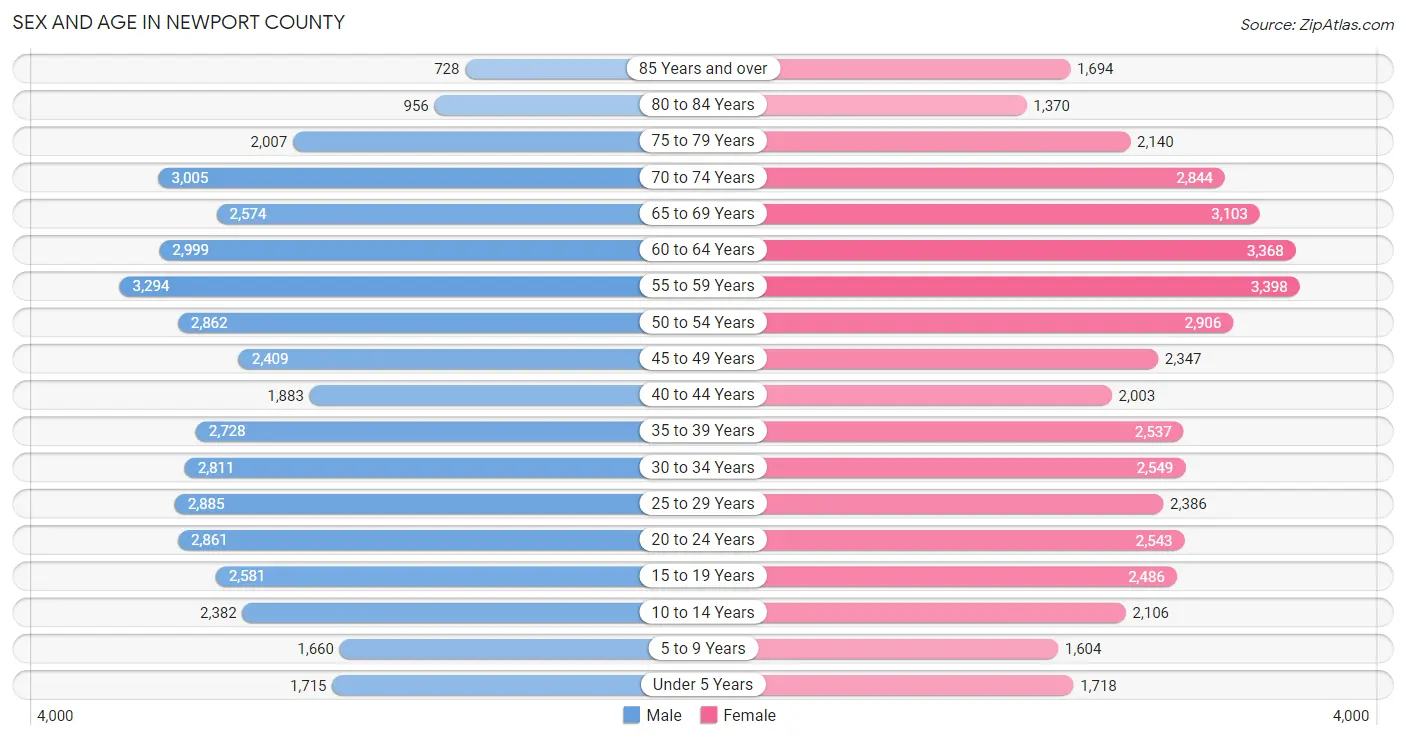
Sex and Age in Newport County
Sex and Age in Newport County
The most populous age groups in Newport County are 55 to 59 Years (3,294 | 7.8%) for men and 55 to 59 Years (3,398 | 7.9%) for women.
| Age Bracket | Male | Female |
| Under 5 Years | 1,715 (4.1%) | 1,718 (4.0%) |
| 5 to 9 Years | 1,660 (3.9%) | 1,604 (3.7%) |
| 10 to 14 Years | 2,382 (5.6%) | 2,106 (4.9%) |
| 15 to 19 Years | 2,581 (6.1%) | 2,486 (5.8%) |
| 20 to 24 Years | 2,861 (6.8%) | 2,543 (5.9%) |
| 25 to 29 Years | 2,885 (6.8%) | 2,386 (5.5%) |
| 30 to 34 Years | 2,811 (6.6%) | 2,549 (5.9%) |
| 35 to 39 Years | 2,728 (6.4%) | 2,537 (5.9%) |
| 40 to 44 Years | 1,883 (4.4%) | 2,003 (4.6%) |
| 45 to 49 Years | 2,409 (5.7%) | 2,347 (5.4%) |
| 50 to 54 Years | 2,862 (6.8%) | 2,906 (6.7%) |
| 55 to 59 Years | 3,294 (7.8%) | 3,398 (7.9%) |
| 60 to 64 Years | 2,999 (7.1%) | 3,368 (7.8%) |
| 65 to 69 Years | 2,574 (6.1%) | 3,103 (7.2%) |
| 70 to 74 Years | 3,005 (7.1%) | 2,844 (6.6%) |
| 75 to 79 Years | 2,007 (4.7%) | 2,140 (5.0%) |
| 80 to 84 Years | 956 (2.3%) | 1,370 (3.2%) |
| 85 Years and over | 728 (1.7%) | 1,694 (3.9%) |
| Total | 42,340 (100.0%) | 43,102 (100.0%) |
Families and Households in Newport County
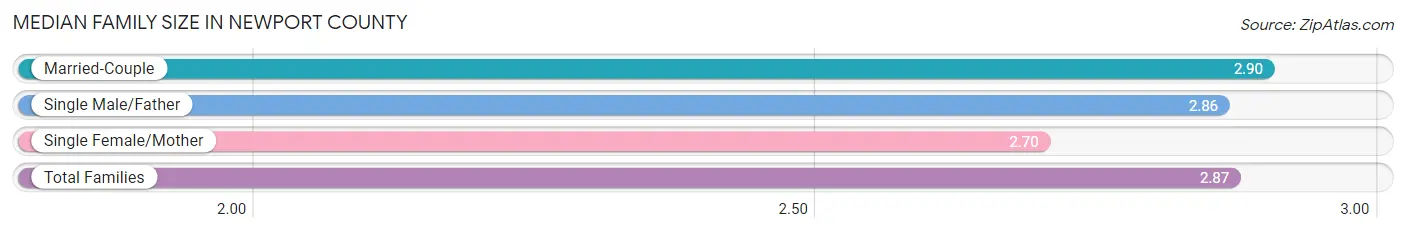
Median Family Size in Newport County
The median family size in Newport County is 2.87 persons per family, with married-couple families (17,231 | 79.2%) accounting for the largest median family size of 2.9 persons per family. On the other hand, single female/mother families (3,245 | 14.9%) represent the smallest median family size with 2.70 persons per family.
| Family Type | # Families | Family Size |
| Married-Couple | 17,231 (79.2%) | 2.90 |
| Single Male/Father | 1,283 (5.9%) | 2.86 |
| Single Female/Mother | 3,245 (14.9%) | 2.70 |
| Total Families | 21,759 (100.0%) | 2.87 |
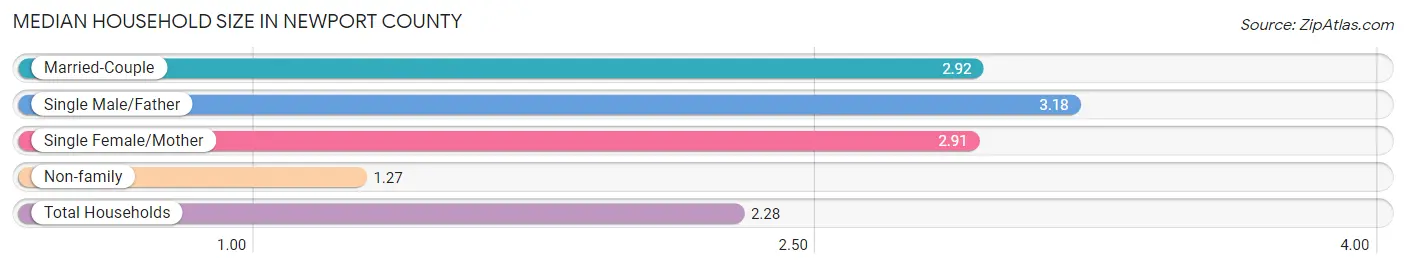
Median Household Size in Newport County
The median household size in Newport County is 2.28 persons per household, with single male/father households (1,283 | 3.6%) accounting for the largest median household size of 3.18 persons per household. non-family households (14,027 | 39.2%) represent the smallest median household size with 1.27 persons per household.
| Household Type | # Households | Household Size |
| Married-Couple | 17,231 (48.1%) | 2.92 |
| Single Male/Father | 1,283 (3.6%) | 3.18 |
| Single Female/Mother | 3,245 (9.1%) | 2.91 |
| Non-family | 14,027 (39.2%) | 1.27 |
| Total Households | 35,786 (100.0%) | 2.28 |
Household Size by Marriage Status in Newport County
Out of a total of 35,786 households in Newport County, 21,759 (60.8%) are family households, while 14,027 (39.2%) are nonfamily households. The most numerous type of family households are 2-person households, comprising 11,504, and the most common type of nonfamily households are 1-person households, comprising 11,201.
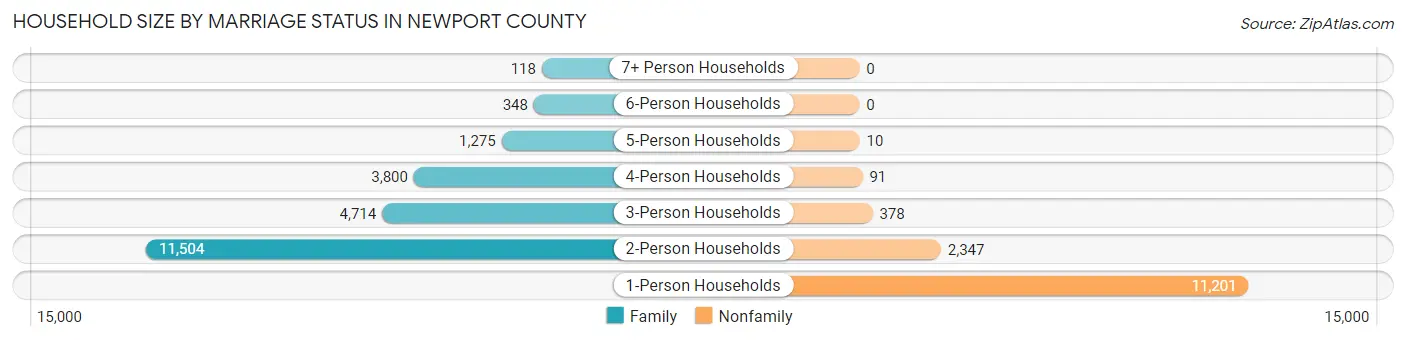
| Household Size | Family Households | Nonfamily Households |
| 1-Person Households | - | 11,201 (31.3%) |
| 2-Person Households | 11,504 (32.2%) | 2,347 (6.6%) |
| 3-Person Households | 4,714 (13.2%) | 378 (1.1%) |
| 4-Person Households | 3,800 (10.6%) | 91 (0.3%) |
| 5-Person Households | 1,275 (3.6%) | 10 (0.0%) |
| 6-Person Households | 348 (1.0%) | 0 (0.0%) |
| 7+ Person Households | 118 (0.3%) | 0 (0.0%) |
| Total | 21,759 (60.8%) | 14,027 (39.2%) |
Female Fertility in Newport County
Fertility by Age in Newport County
Average fertility rate in Newport County is 42.0 births per 1,000 women. Women in the age bracket of 20 to 34 years have the highest fertility rate with 78.0 births per 1,000 women. Women in the age bracket of 20 to 34 years acount for 80.2% of all women with births.
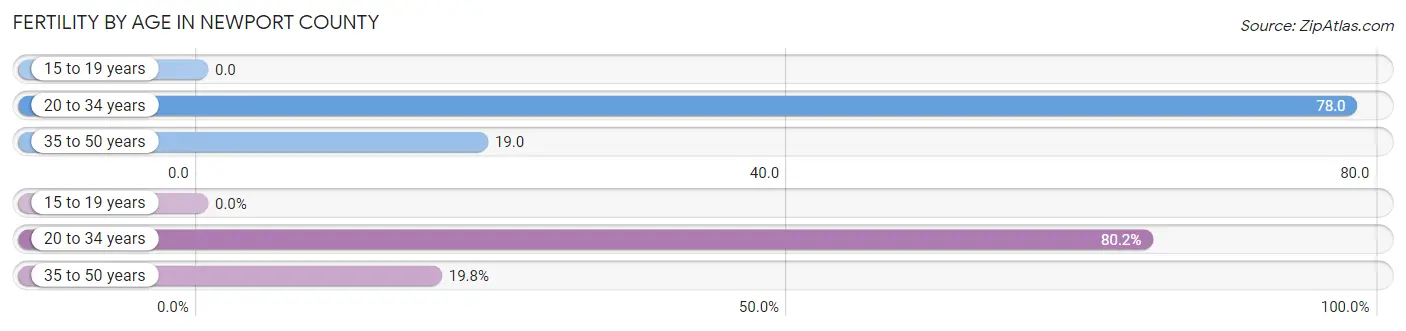
| Age Bracket | Women with Births | Births / 1,000 Women |
| 15 to 19 years | 0 (0.0%) | 0.0 |
| 20 to 34 years | 582 (80.2%) | 78.0 |
| 35 to 50 years | 144 (19.8%) | 19.0 |
| Total | 726 (100.0%) | 42.0 |
Fertility by Age by Marriage Status in Newport County
52.3% of women with births (726) in Newport County are married. The highest percentage of unmarried women with births falls into 35 to 50 years age bracket with 49.3% of them unmarried at the time of birth, while the lowest percentage of unmarried women with births belong to 20 to 34 years age bracket with 47.3% of them unmarried.
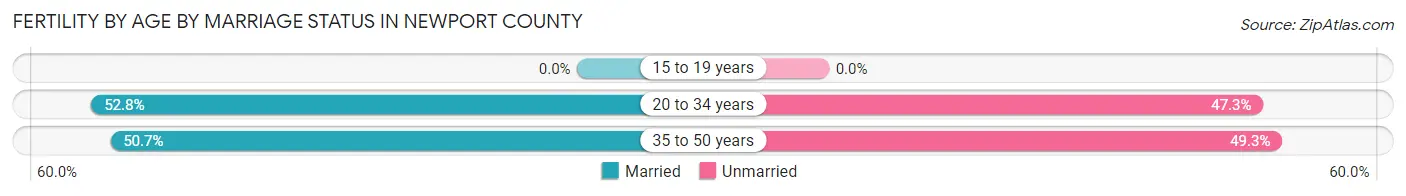
| Age Bracket | Married | Unmarried |
| 15 to 19 years | 0 (0.0%) | 0 (0.0%) |
| 20 to 34 years | 307 (52.7%) | 275 (47.2%) |
| 35 to 50 years | 73 (50.7%) | 71 (49.3%) |
| Total | 380 (52.3%) | 346 (47.7%) |
Fertility by Education in Newport County
Average fertility rate in Newport County is 42.0 births per 1,000 women. Women with the education attainment of high school diploma have the highest fertility rate of 63.0 births per 1,000 women, while women with the education attainment of bachelor's degree have the lowest fertility at 13.0 births per 1,000 women. Women with the education attainment of college or associate's degree represent 32.6% of all women with births.
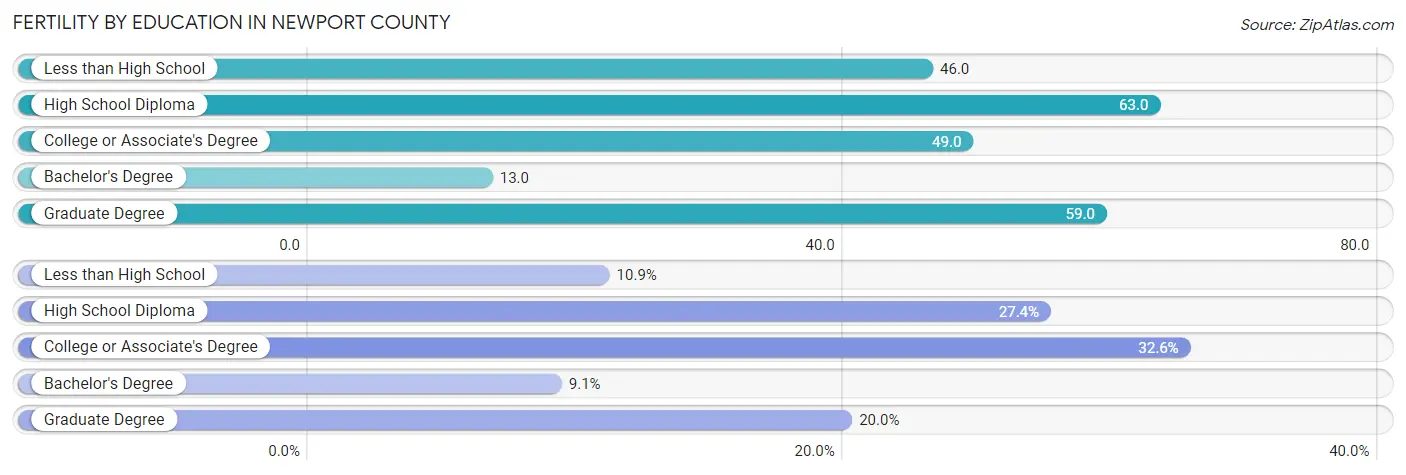
| Educational Attainment | Women with Births | Births / 1,000 Women |
| Less than High School | 79 (10.9%) | 46.0 |
| High School Diploma | 199 (27.4%) | 63.0 |
| College or Associate's Degree | 237 (32.6%) | 49.0 |
| Bachelor's Degree | 66 (9.1%) | 13.0 |
| Graduate Degree | 145 (20.0%) | 59.0 |
| Total | 726 (100.0%) | 42.0 |
Fertility by Education by Marriage Status in Newport County
47.7% of women with births in Newport County are unmarried. Women with the educational attainment of graduate degree are most likely to be married with 90.3% of them married at childbirth, while women with the educational attainment of high school diploma are least likely to be married with 100.0% of them unmarried at childbirth.
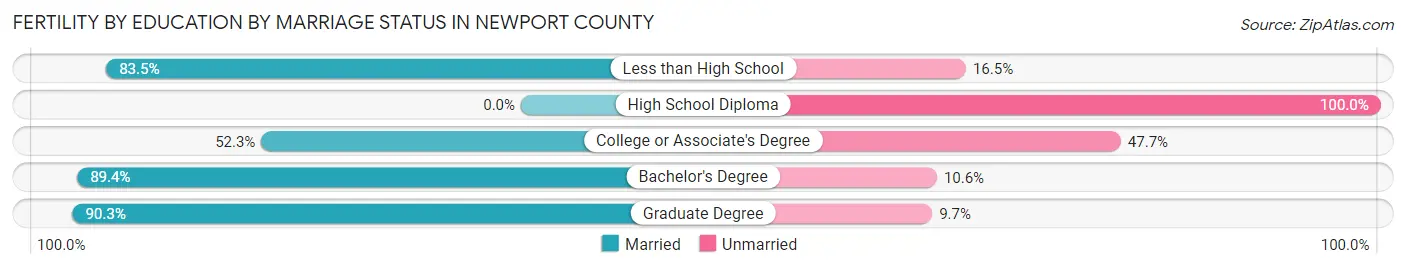
| Educational Attainment | Married | Unmarried |
| Less than High School | 66 (83.5%) | 13 (16.5%) |
| High School Diploma | 0 (0.0%) | 199 (100.0%) |
| College or Associate's Degree | 124 (52.3%) | 113 (47.7%) |
| Bachelor's Degree | 59 (89.4%) | 7 (10.6%) |
| Graduate Degree | 131 (90.3%) | 14 (9.7%) |
| Total | 380 (52.3%) | 346 (47.7%) |
Employment Characteristics in Newport County
Employment by Class of Employer in Newport County
Among the 43,577 employed individuals in Newport County, private company employees (24,875 | 57.1%), not-for-profit organizations (5,390 | 12.4%), and federal government employees (4,953 | 11.4%) make up the most common classes of employment.
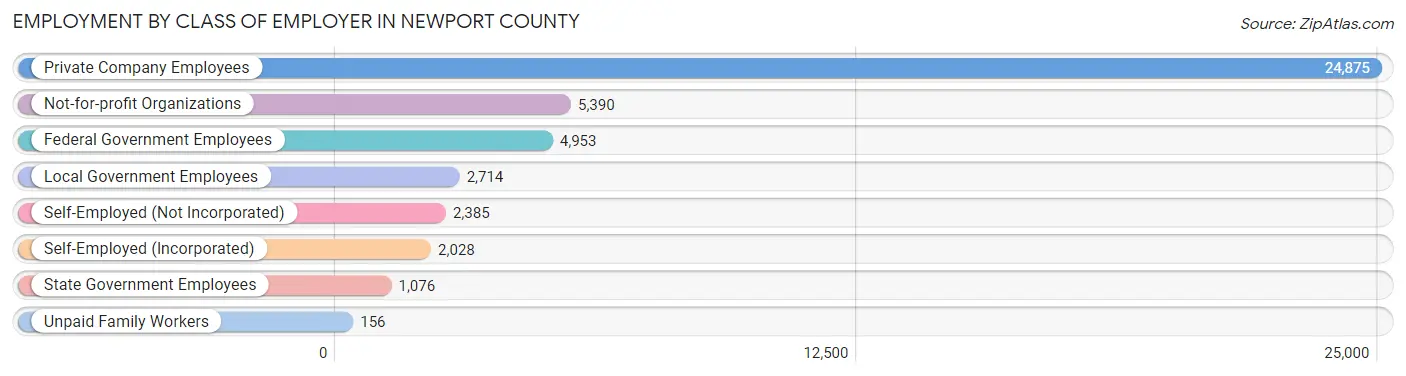
| Employer Class | # Employees | % Employees |
| Private Company Employees | 24,875 | 57.1% |
| Self-Employed (Incorporated) | 2,028 | 4.6% |
| Self-Employed (Not Incorporated) | 2,385 | 5.5% |
| Not-for-profit Organizations | 5,390 | 12.4% |
| Local Government Employees | 2,714 | 6.2% |
| State Government Employees | 1,076 | 2.5% |
| Federal Government Employees | 4,953 | 11.4% |
| Unpaid Family Workers | 156 | 0.4% |
| Total | 43,577 | 100.0% |
Employment Status by Age in Newport County
According to the labor force statistics for Newport County, out of the total population over 16 years of age (73,421), 64.4% or 47,283 individuals are in the labor force, with 6.5% or 3,073 of them unemployed. The age group with the highest labor force participation rate is 30 to 34 years, with 90.4% or 4,845 individuals in the labor force. Within the labor force, the 20 to 24 years age range has the highest percentage of unemployed individuals, with 12.8% or 515 of them being unemployed.
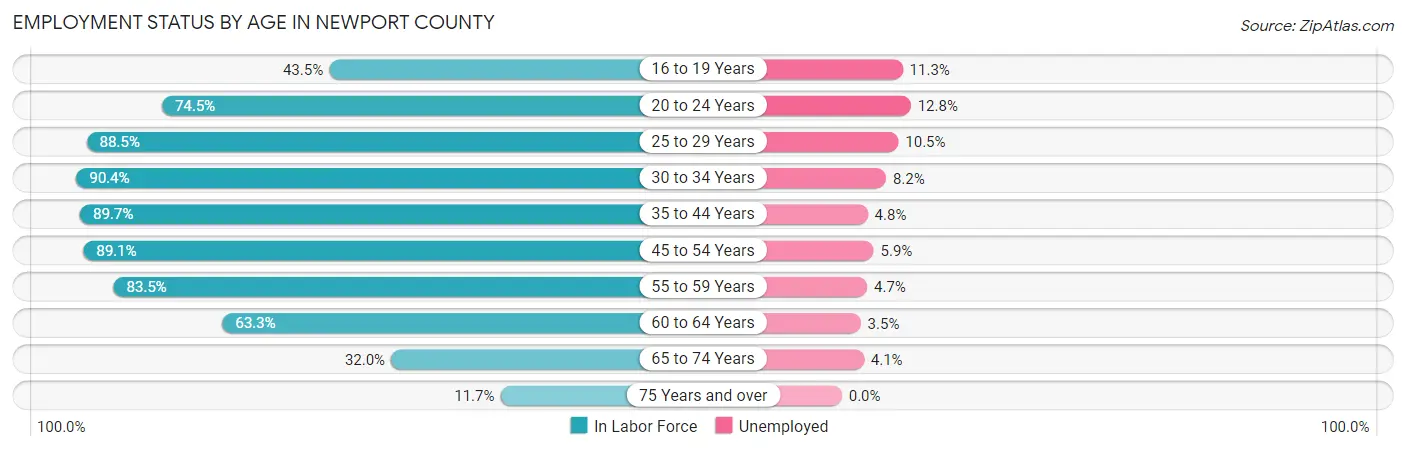
| Age Bracket | In Labor Force | Unemployed |
| 16 to 19 Years | 1,840 (43.5%) | 208 (11.3%) |
| 20 to 24 Years | 4,026 (74.5%) | 515 (12.8%) |
| 25 to 29 Years | 4,665 (88.5%) | 490 (10.5%) |
| 30 to 34 Years | 4,845 (90.4%) | 397 (8.2%) |
| 35 to 44 Years | 8,208 (89.7%) | 394 (4.8%) |
| 45 to 54 Years | 9,377 (89.1%) | 553 (5.9%) |
| 55 to 59 Years | 5,588 (83.5%) | 263 (4.7%) |
| 60 to 64 Years | 4,030 (63.3%) | 141 (3.5%) |
| 65 to 74 Years | 3,688 (32.0%) | 151 (4.1%) |
| 75 Years and over | 1,041 (11.7%) | 0 (0.0%) |
| Total | 47,283 (64.4%) | 3,073 (6.5%) |
Employment Status by Educational Attainment in Newport County
According to labor force statistics for Newport County, 84.7% of individuals (36,730) out of the total population between 25 and 64 years of age (43,365) are in the labor force, with 6.0% or 2,204 of them being unemployed. The group with the highest labor force participation rate are those with the educational attainment of bachelor's degree or higher, with 87.6% or 20,300 individuals in the labor force. Within the labor force, individuals with less than high school education have the highest percentage of unemployment, with 18.1% or 225 of them being unemployed.
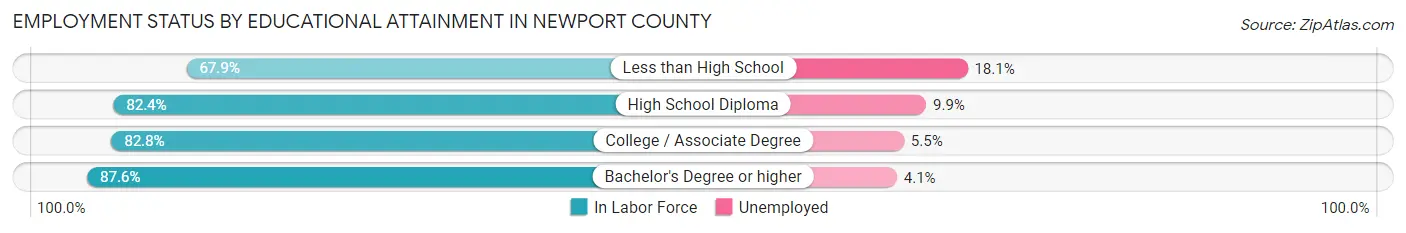
| Educational Attainment | In Labor Force | Unemployed |
| Less than High School | 1,241 (67.9%) | 331 (18.1%) |
| High School Diploma | 6,861 (82.4%) | 824 (9.9%) |
| College / Associate Degree | 8,311 (82.8%) | 552 (5.5%) |
| Bachelor's Degree or higher | 20,300 (87.6%) | 950 (4.1%) |
| Total | 36,730 (84.7%) | 2,602 (6.0%) |
Employment Occupations by Sex in Newport County
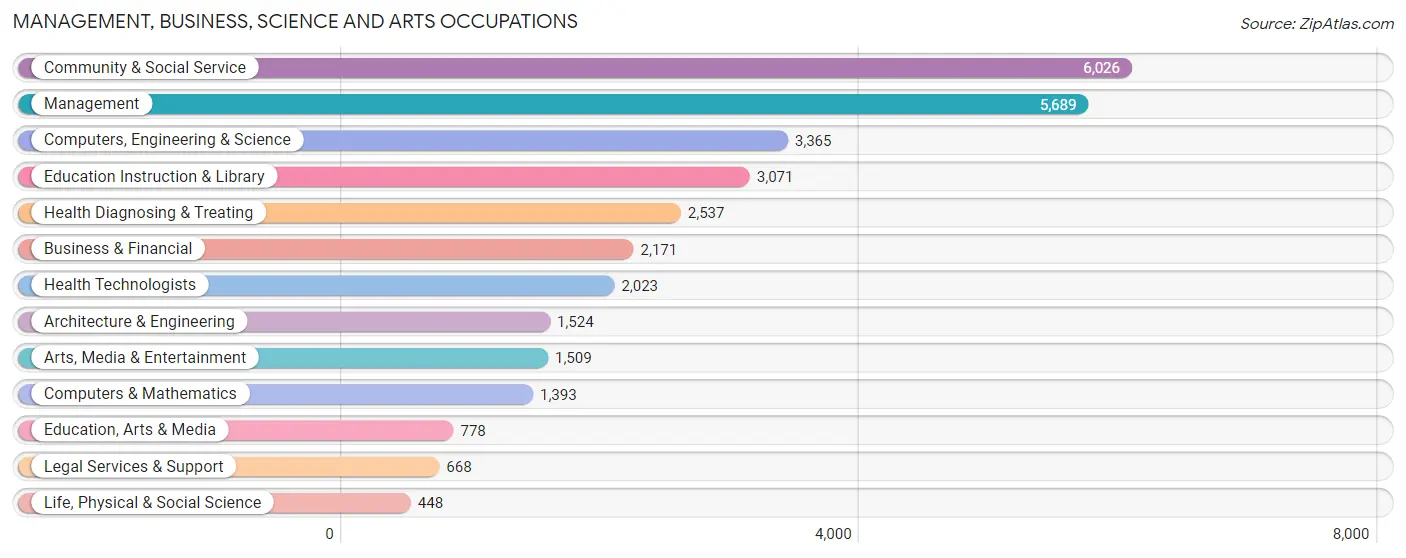
Management, Business, Science and Arts Occupations
The most common Management, Business, Science and Arts occupations in Newport County are Community & Social Service (6,026 | 14.3%), Management (5,689 | 13.5%), Computers, Engineering & Science (3,365 | 8.0%), Education Instruction & Library (3,071 | 7.3%), and Health Diagnosing & Treating (2,537 | 6.0%).
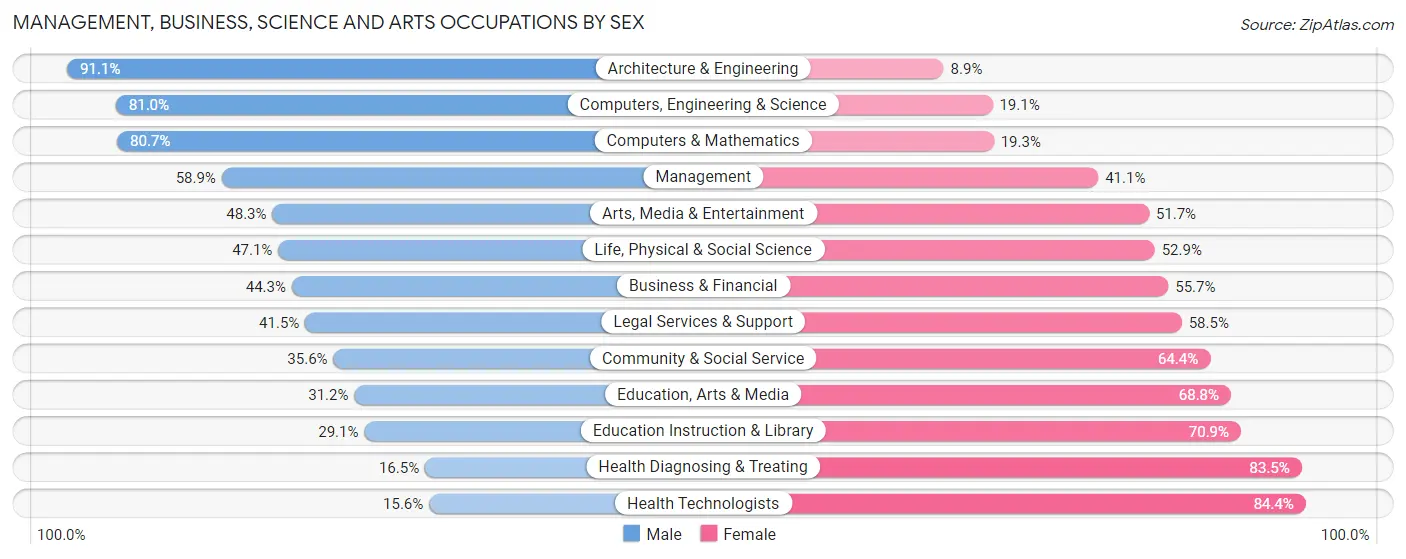
Management, Business, Science and Arts Occupations by Sex
Within the Management, Business, Science and Arts occupations in Newport County, the most male-oriented occupations are Architecture & Engineering (91.1%), Computers, Engineering & Science (80.9%), and Computers & Mathematics (80.7%), while the most female-oriented occupations are Health Technologists (84.4%), Health Diagnosing & Treating (83.5%), and Education Instruction & Library (70.9%).
| Occupation | Male | Female |
| Management | 3,350 (58.9%) | 2,339 (41.1%) |
| Business & Financial | 961 (44.3%) | 1,210 (55.7%) |
| Computers, Engineering & Science | 2,724 (80.9%) | 641 (19.1%) |
| Computers & Mathematics | 1,124 (80.7%) | 269 (19.3%) |
| Architecture & Engineering | 1,389 (91.1%) | 135 (8.9%) |
| Life, Physical & Social Science | 211 (47.1%) | 237 (52.9%) |
| Community & Social Service | 2,144 (35.6%) | 3,882 (64.4%) |
| Education, Arts & Media | 243 (31.2%) | 535 (68.8%) |
| Legal Services & Support | 277 (41.5%) | 391 (58.5%) |
| Education Instruction & Library | 895 (29.1%) | 2,176 (70.9%) |
| Arts, Media & Entertainment | 729 (48.3%) | 780 (51.7%) |
| Health Diagnosing & Treating | 418 (16.5%) | 2,119 (83.5%) |
| Health Technologists | 316 (15.6%) | 1,707 (84.4%) |
| Total (Category) | 9,597 (48.5%) | 10,191 (51.5%) |
| Total (Overall) | 21,812 (51.8%) | 20,269 (48.2%) |
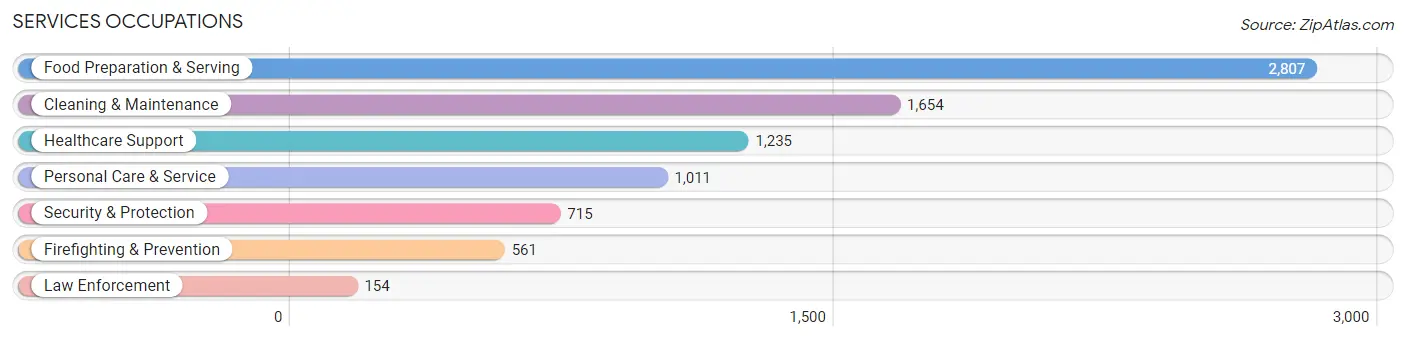
Services Occupations
The most common Services occupations in Newport County are Food Preparation & Serving (2,807 | 6.7%), Cleaning & Maintenance (1,654 | 3.9%), Healthcare Support (1,235 | 2.9%), Personal Care & Service (1,011 | 2.4%), and Security & Protection (715 | 1.7%).
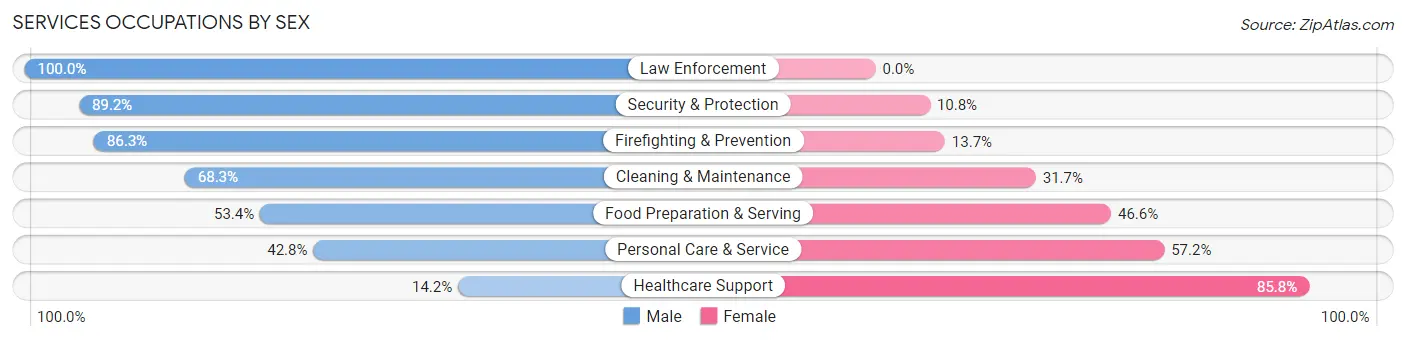
Services Occupations by Sex
Within the Services occupations in Newport County, the most male-oriented occupations are Law Enforcement (100.0%), Security & Protection (89.2%), and Firefighting & Prevention (86.3%), while the most female-oriented occupations are Healthcare Support (85.8%), Personal Care & Service (57.2%), and Food Preparation & Serving (46.6%).
| Occupation | Male | Female |
| Healthcare Support | 175 (14.2%) | 1,060 (85.8%) |
| Security & Protection | 638 (89.2%) | 77 (10.8%) |
| Firefighting & Prevention | 484 (86.3%) | 77 (13.7%) |
| Law Enforcement | 154 (100.0%) | 0 (0.0%) |
| Food Preparation & Serving | 1,498 (53.4%) | 1,309 (46.6%) |
| Cleaning & Maintenance | 1,129 (68.3%) | 525 (31.7%) |
| Personal Care & Service | 433 (42.8%) | 578 (57.2%) |
| Total (Category) | 3,873 (52.2%) | 3,549 (47.8%) |
| Total (Overall) | 21,812 (51.8%) | 20,269 (48.2%) |
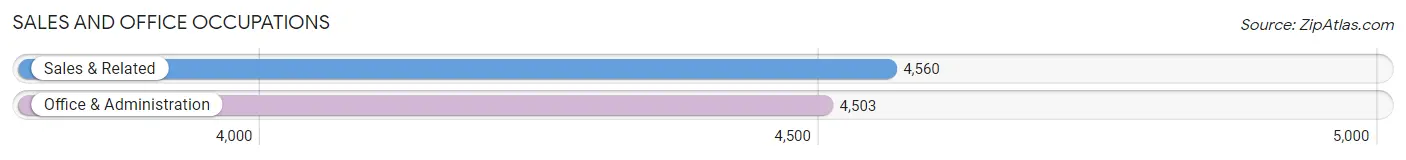
Sales and Office Occupations
The most common Sales and Office occupations in Newport County are Sales & Related (4,560 | 10.8%), and Office & Administration (4,503 | 10.7%).
Sales and Office Occupations by Sex
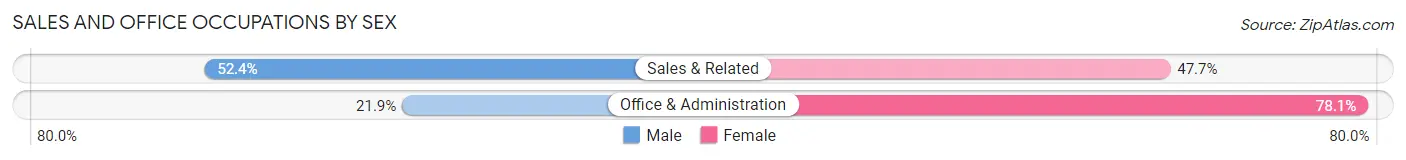
| Occupation | Male | Female |
| Sales & Related | 2,387 (52.3%) | 2,173 (47.6%) |
| Office & Administration | 987 (21.9%) | 3,516 (78.1%) |
| Total (Category) | 3,374 (37.2%) | 5,689 (62.8%) |
| Total (Overall) | 21,812 (51.8%) | 20,269 (48.2%) |
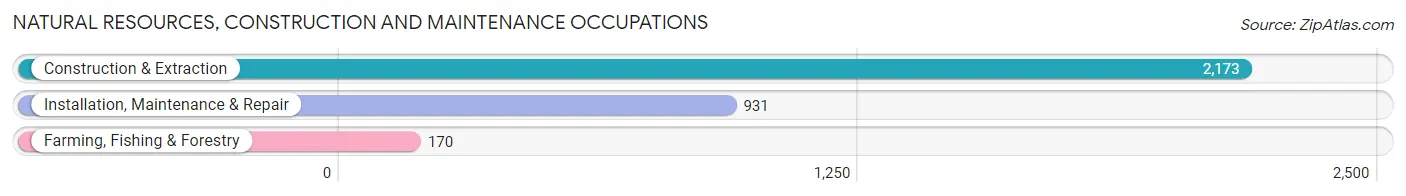
Natural Resources, Construction and Maintenance Occupations
The most common Natural Resources, Construction and Maintenance occupations in Newport County are Construction & Extraction (2,173 | 5.2%), Installation, Maintenance & Repair (931 | 2.2%), and Farming, Fishing & Forestry (170 | 0.4%).
Natural Resources, Construction and Maintenance Occupations by Sex
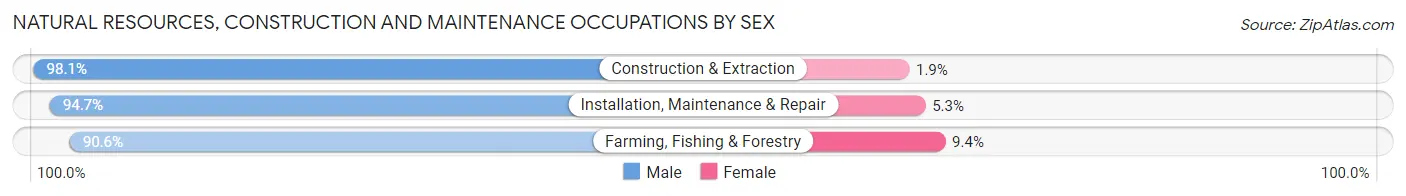
| Occupation | Male | Female |
| Farming, Fishing & Forestry | 154 (90.6%) | 16 (9.4%) |
| Construction & Extraction | 2,132 (98.1%) | 41 (1.9%) |
| Installation, Maintenance & Repair | 882 (94.7%) | 49 (5.3%) |
| Total (Category) | 3,168 (96.8%) | 106 (3.2%) |
| Total (Overall) | 21,812 (51.8%) | 20,269 (48.2%) |
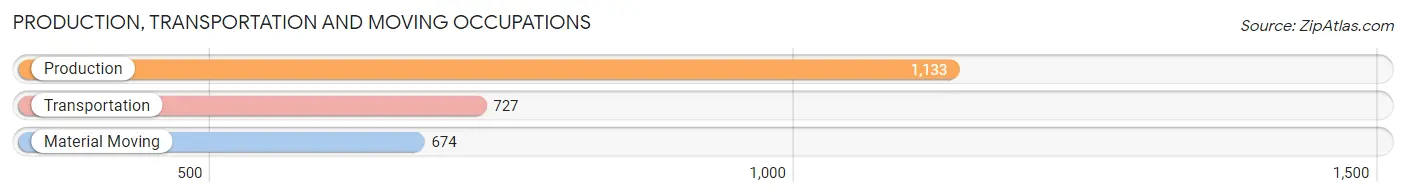
Production, Transportation and Moving Occupations
The most common Production, Transportation and Moving occupations in Newport County are Production (1,133 | 2.7%), Transportation (727 | 1.7%), and Material Moving (674 | 1.6%).
Production, Transportation and Moving Occupations by Sex
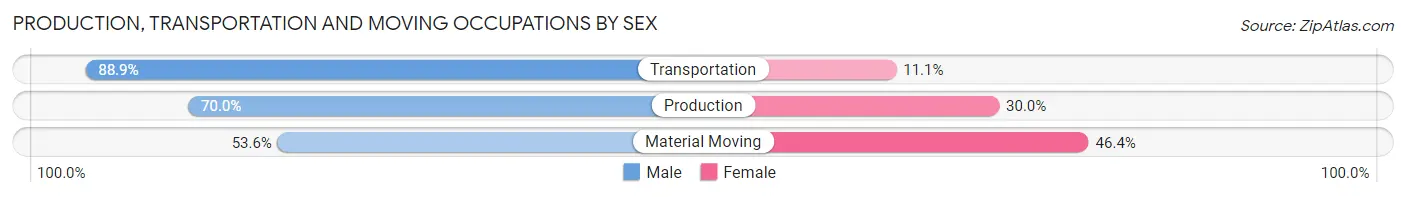
| Occupation | Male | Female |
| Production | 793 (70.0%) | 340 (30.0%) |
| Transportation | 646 (88.9%) | 81 (11.1%) |
| Material Moving | 361 (53.6%) | 313 (46.4%) |
| Total (Category) | 1,800 (71.0%) | 734 (29.0%) |
| Total (Overall) | 21,812 (51.8%) | 20,269 (48.2%) |
Employment Industries by Sex in Newport County
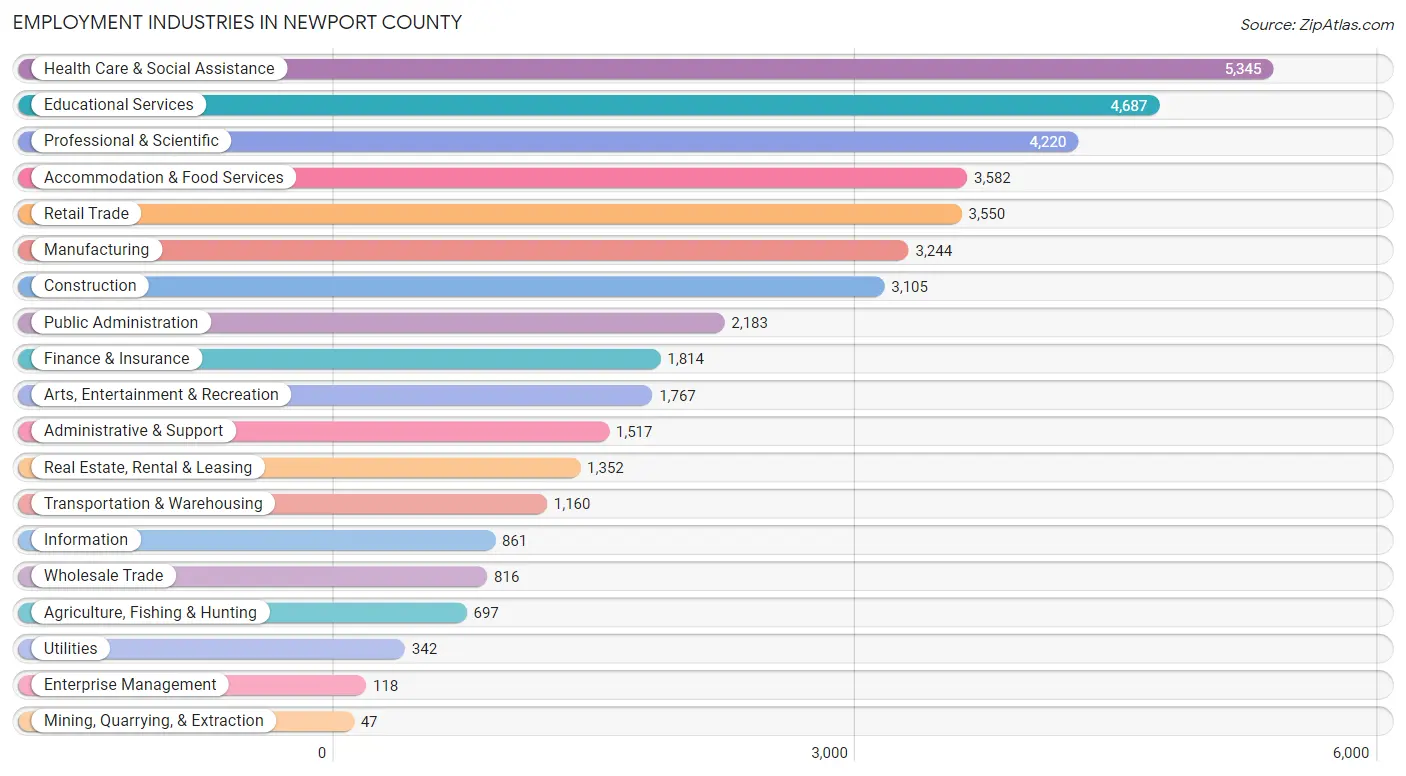
Employment Industries in Newport County
The major employment industries in Newport County include Health Care & Social Assistance (5,345 | 12.7%), Educational Services (4,687 | 11.1%), Professional & Scientific (4,220 | 10.0%), Accommodation & Food Services (3,582 | 8.5%), and Retail Trade (3,550 | 8.4%).
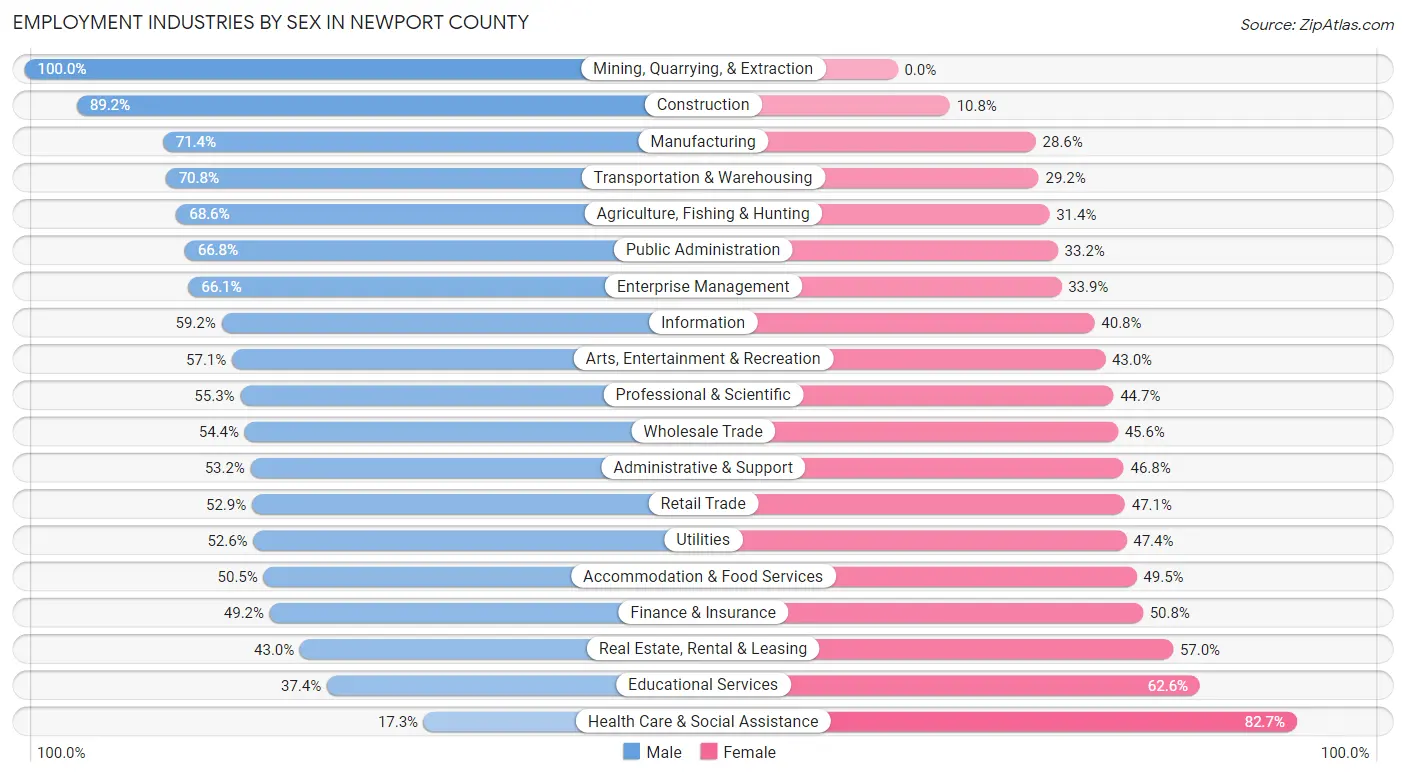
Employment Industries by Sex in Newport County
The Newport County industries that see more men than women are Mining, Quarrying, & Extraction (100.0%), Construction (89.2%), and Manufacturing (71.4%), whereas the industries that tend to have a higher number of women are Health Care & Social Assistance (82.7%), Educational Services (62.6%), and Real Estate, Rental & Leasing (57.0%).
| Industry | Male | Female |
| Agriculture, Fishing & Hunting | 478 (68.6%) | 219 (31.4%) |
| Mining, Quarrying, & Extraction | 47 (100.0%) | 0 (0.0%) |
| Construction | 2,769 (89.2%) | 336 (10.8%) |
| Manufacturing | 2,316 (71.4%) | 928 (28.6%) |
| Wholesale Trade | 444 (54.4%) | 372 (45.6%) |
| Retail Trade | 1,879 (52.9%) | 1,671 (47.1%) |
| Transportation & Warehousing | 821 (70.8%) | 339 (29.2%) |
| Utilities | 180 (52.6%) | 162 (47.4%) |
| Information | 510 (59.2%) | 351 (40.8%) |
| Finance & Insurance | 893 (49.2%) | 921 (50.8%) |
| Real Estate, Rental & Leasing | 581 (43.0%) | 771 (57.0%) |
| Professional & Scientific | 2,335 (55.3%) | 1,885 (44.7%) |
| Enterprise Management | 78 (66.1%) | 40 (33.9%) |
| Administrative & Support | 807 (53.2%) | 710 (46.8%) |
| Educational Services | 1,753 (37.4%) | 2,934 (62.6%) |
| Health Care & Social Assistance | 927 (17.3%) | 4,418 (82.7%) |
| Arts, Entertainment & Recreation | 1,008 (57.1%) | 759 (42.9%) |
| Accommodation & Food Services | 1,810 (50.5%) | 1,772 (49.5%) |
| Public Administration | 1,459 (66.8%) | 724 (33.2%) |
| Total | 21,812 (51.8%) | 20,269 (48.2%) |
Education in Newport County
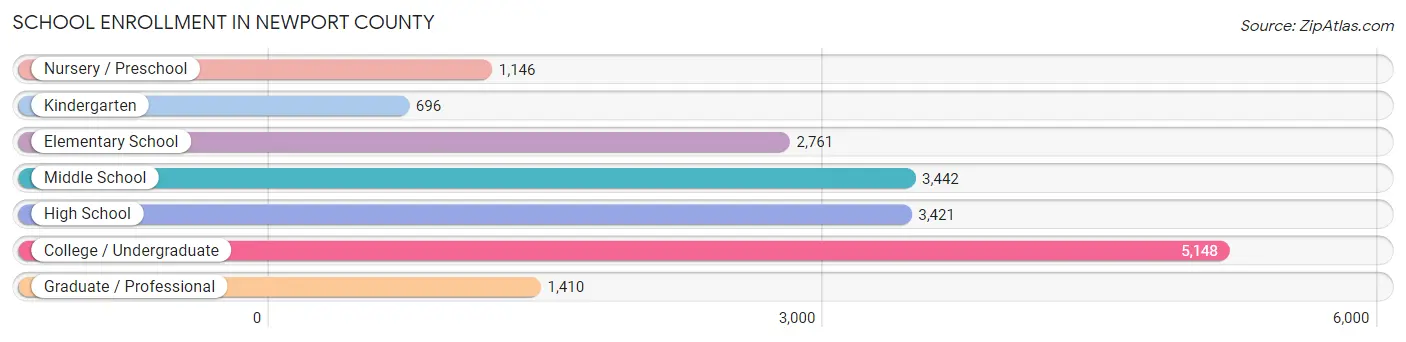
School Enrollment in Newport County
The most common levels of schooling among the 18,024 students in Newport County are college / undergraduate (5,148 | 28.6%), middle school (3,442 | 19.1%), and high school (3,421 | 19.0%).
| School Level | # Students | % Students |
| Nursery / Preschool | 1,146 | 6.4% |
| Kindergarten | 696 | 3.9% |
| Elementary School | 2,761 | 15.3% |
| Middle School | 3,442 | 19.1% |
| High School | 3,421 | 19.0% |
| College / Undergraduate | 5,148 | 28.6% |
| Graduate / Professional | 1,410 | 7.8% |
| Total | 18,024 | 100.0% |
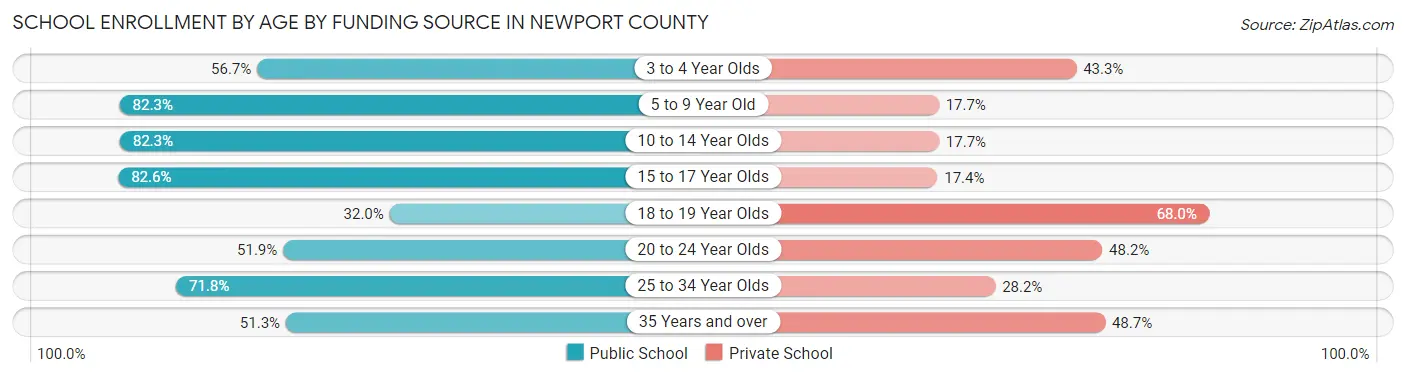
School Enrollment by Age by Funding Source in Newport County
Out of a total of 18,024 students who are enrolled in schools in Newport County, 5,750 (31.9%) attend a private institution, while the remaining 12,274 (68.1%) are enrolled in public schools. The age group of 18 to 19 year olds has the highest likelihood of being enrolled in private schools, with 1,404 (68.0% in the age bracket) enrolled. Conversely, the age group of 15 to 17 year olds has the lowest likelihood of being enrolled in a private school, with 2,177 (82.6% in the age bracket) attending a public institution.
| Age Bracket | Public School | Private School |
| 3 to 4 Year Olds | 500 (56.7%) | 382 (43.3%) |
| 5 to 9 Year Old | 2,576 (82.3%) | 554 (17.7%) |
| 10 to 14 Year Olds | 3,515 (82.3%) | 758 (17.7%) |
| 15 to 17 Year Olds | 2,177 (82.6%) | 460 (17.4%) |
| 18 to 19 Year Olds | 661 (32.0%) | 1,404 (68.0%) |
| 20 to 24 Year Olds | 1,372 (51.8%) | 1,274 (48.1%) |
| 25 to 34 Year Olds | 852 (71.8%) | 335 (28.2%) |
| 35 Years and over | 618 (51.3%) | 586 (48.7%) |
| Total | 12,274 (68.1%) | 5,750 (31.9%) |
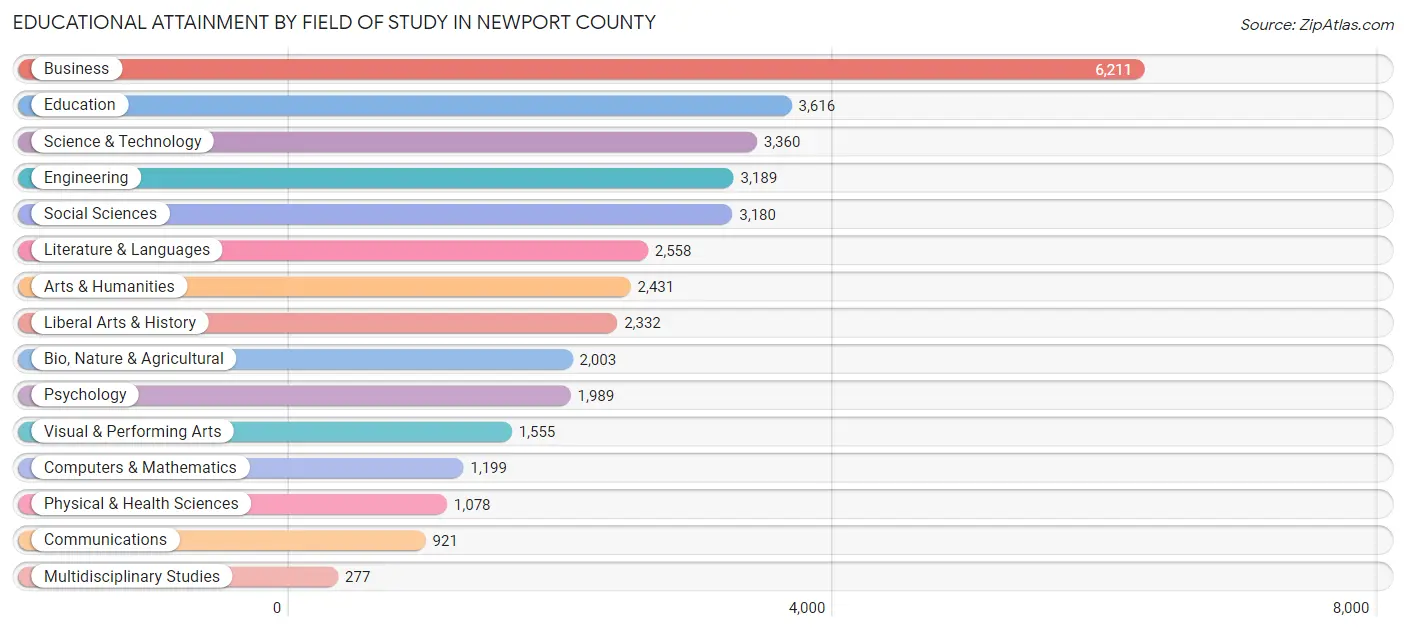
Educational Attainment by Field of Study in Newport County
Business (6,211 | 17.3%), education (3,616 | 10.1%), science & technology (3,360 | 9.4%), engineering (3,189 | 8.9%), and social sciences (3,180 | 8.9%) are the most common fields of study among 35,899 individuals in Newport County who have obtained a bachelor's degree or higher.
| Field of Study | # Graduates | % Graduates |
| Computers & Mathematics | 1,199 | 3.3% |
| Bio, Nature & Agricultural | 2,003 | 5.6% |
| Physical & Health Sciences | 1,078 | 3.0% |
| Psychology | 1,989 | 5.5% |
| Social Sciences | 3,180 | 8.9% |
| Engineering | 3,189 | 8.9% |
| Multidisciplinary Studies | 277 | 0.8% |
| Science & Technology | 3,360 | 9.4% |
| Business | 6,211 | 17.3% |
| Education | 3,616 | 10.1% |
| Literature & Languages | 2,558 | 7.1% |
| Liberal Arts & History | 2,332 | 6.5% |
| Visual & Performing Arts | 1,555 | 4.3% |
| Communications | 921 | 2.6% |
| Arts & Humanities | 2,431 | 6.8% |
| Total | 35,899 | 100.0% |
Transportation & Commute in Newport County
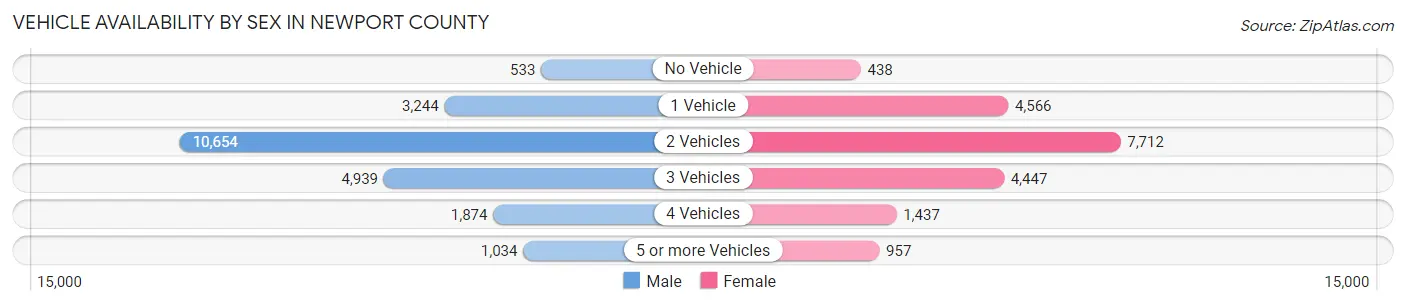
Vehicle Availability by Sex in Newport County
The most prevalent vehicle ownership categories in Newport County are males with 2 vehicles (10,654, accounting for 47.8%) and females with 2 vehicles (7,712, making up 54.5%).
| Vehicles Available | Male | Female |
| No Vehicle | 533 (2.4%) | 438 (2.2%) |
| 1 Vehicle | 3,244 (14.6%) | 4,566 (23.4%) |
| 2 Vehicles | 10,654 (47.8%) | 7,712 (39.4%) |
| 3 Vehicles | 4,939 (22.2%) | 4,447 (22.7%) |
| 4 Vehicles | 1,874 (8.4%) | 1,437 (7.3%) |
| 5 or more Vehicles | 1,034 (4.6%) | 957 (4.9%) |
| Total | 22,278 (100.0%) | 19,557 (100.0%) |
Commute Time in Newport County
The most frequently occuring commute durations in Newport County are 10 to 14 minutes (6,600 commuters, 17.3%), 5 to 9 minutes (5,873 commuters, 15.4%), and 15 to 19 minutes (5,781 commuters, 15.2%).
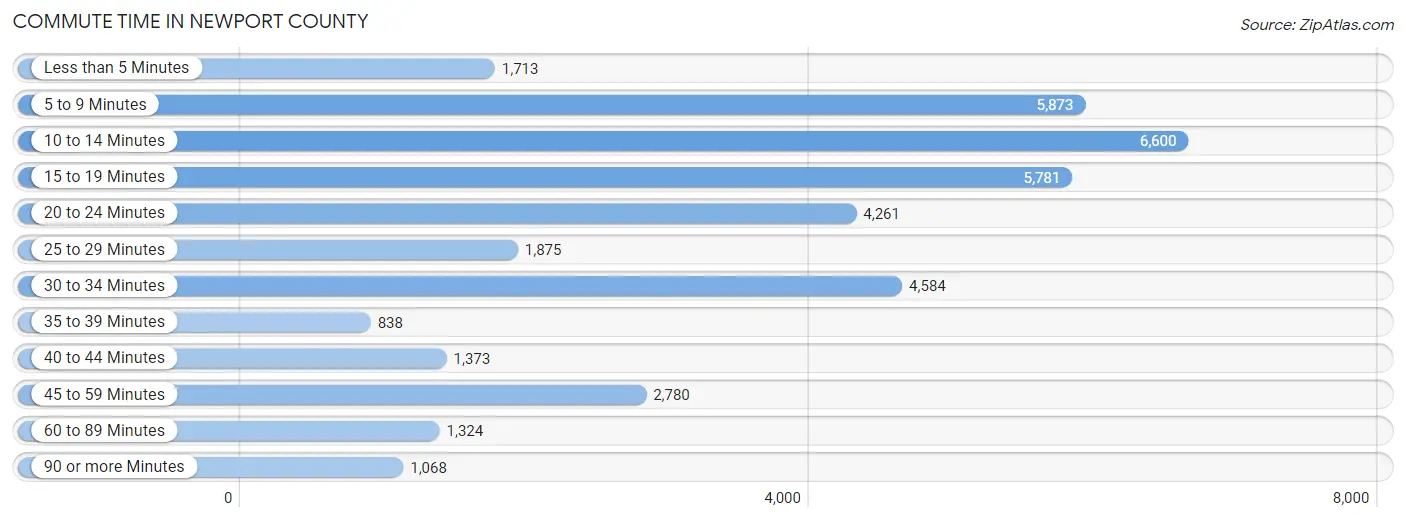
| Commute Time | # Commuters | % Commuters |
| Less than 5 Minutes | 1,713 | 4.5% |
| 5 to 9 Minutes | 5,873 | 15.4% |
| 10 to 14 Minutes | 6,600 | 17.3% |
| 15 to 19 Minutes | 5,781 | 15.2% |
| 20 to 24 Minutes | 4,261 | 11.2% |
| 25 to 29 Minutes | 1,875 | 4.9% |
| 30 to 34 Minutes | 4,584 | 12.0% |
| 35 to 39 Minutes | 838 | 2.2% |
| 40 to 44 Minutes | 1,373 | 3.6% |
| 45 to 59 Minutes | 2,780 | 7.3% |
| 60 to 89 Minutes | 1,324 | 3.5% |
| 90 or more Minutes | 1,068 | 2.8% |
Commute Time by Sex in Newport County
The most common commute times in Newport County are 10 to 14 minutes (3,514 commuters, 17.1%) for males and 10 to 14 minutes (3,086 commuters, 17.6%) for females.
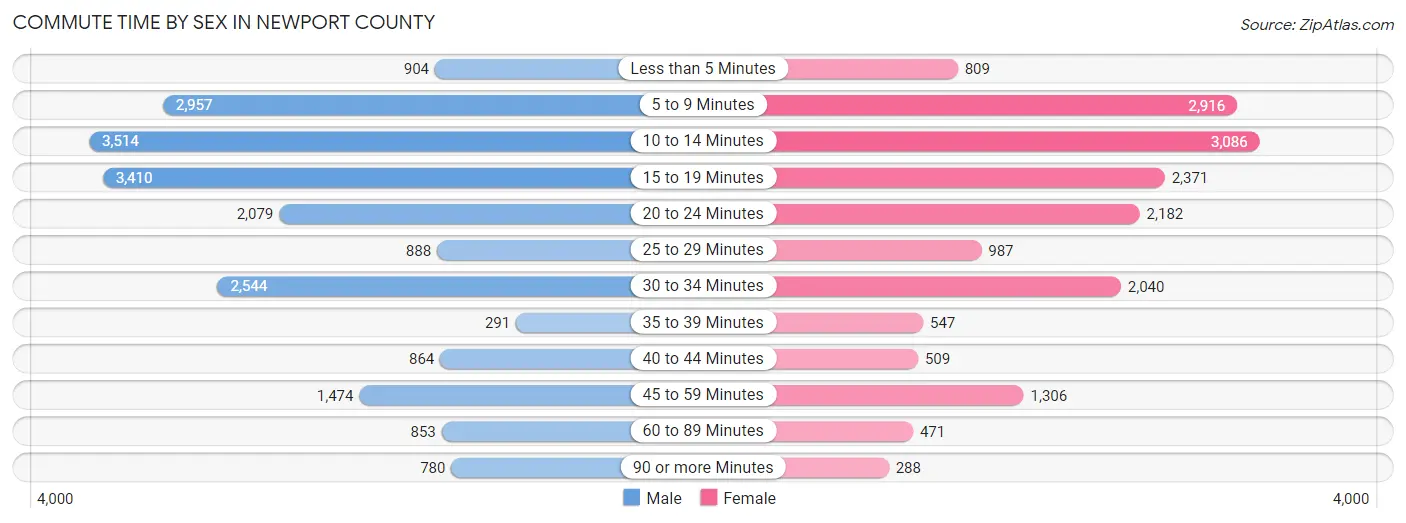
| Commute Time | Male | Female |
| Less than 5 Minutes | 904 (4.4%) | 809 (4.6%) |
| 5 to 9 Minutes | 2,957 (14.4%) | 2,916 (16.7%) |
| 10 to 14 Minutes | 3,514 (17.1%) | 3,086 (17.6%) |
| 15 to 19 Minutes | 3,410 (16.6%) | 2,371 (13.5%) |
| 20 to 24 Minutes | 2,079 (10.1%) | 2,182 (12.5%) |
| 25 to 29 Minutes | 888 (4.3%) | 987 (5.6%) |
| 30 to 34 Minutes | 2,544 (12.4%) | 2,040 (11.7%) |
| 35 to 39 Minutes | 291 (1.4%) | 547 (3.1%) |
| 40 to 44 Minutes | 864 (4.2%) | 509 (2.9%) |
| 45 to 59 Minutes | 1,474 (7.2%) | 1,306 (7.5%) |
| 60 to 89 Minutes | 853 (4.2%) | 471 (2.7%) |
| 90 or more Minutes | 780 (3.8%) | 288 (1.6%) |
Time of Departure to Work by Sex in Newport County
The most frequent times of departure to work in Newport County are 7:00 AM to 7:29 AM (3,392, 16.5%) for males and 8:00 AM to 8:29 AM (2,734, 15.6%) for females.
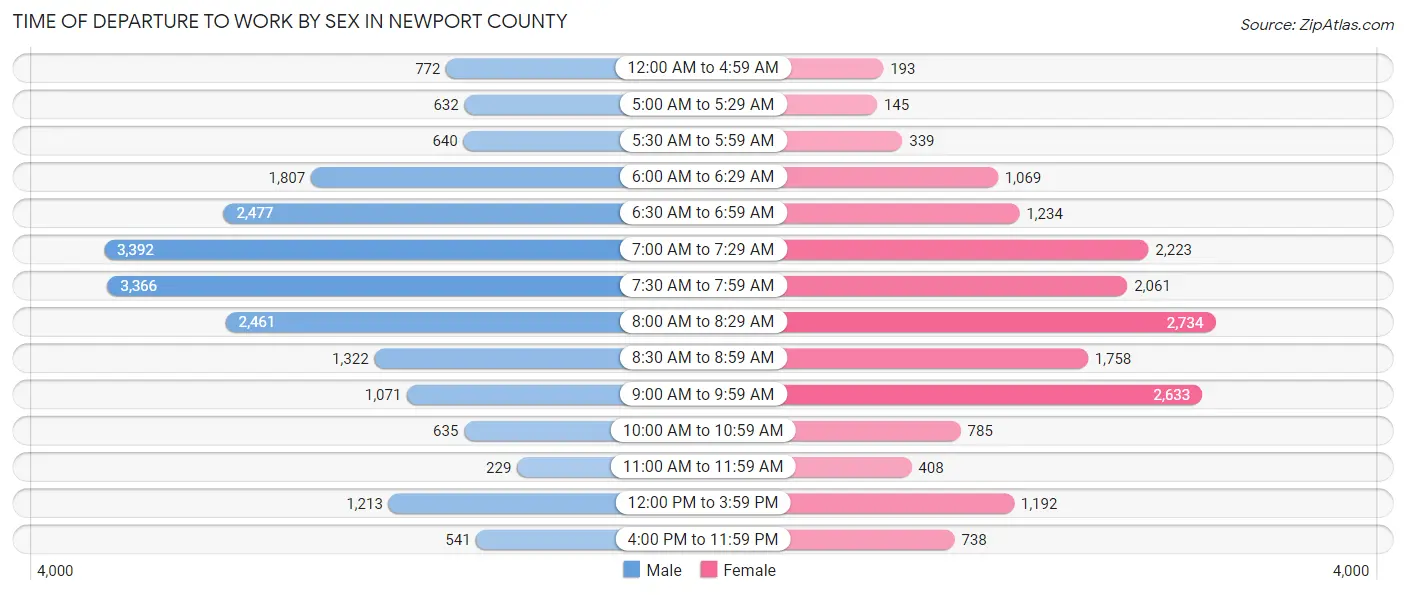
| Time of Departure | Male | Female |
| 12:00 AM to 4:59 AM | 772 (3.8%) | 193 (1.1%) |
| 5:00 AM to 5:29 AM | 632 (3.1%) | 145 (0.8%) |
| 5:30 AM to 5:59 AM | 640 (3.1%) | 339 (1.9%) |
| 6:00 AM to 6:29 AM | 1,807 (8.8%) | 1,069 (6.1%) |
| 6:30 AM to 6:59 AM | 2,477 (12.0%) | 1,234 (7.0%) |
| 7:00 AM to 7:29 AM | 3,392 (16.5%) | 2,223 (12.7%) |
| 7:30 AM to 7:59 AM | 3,366 (16.4%) | 2,061 (11.8%) |
| 8:00 AM to 8:29 AM | 2,461 (12.0%) | 2,734 (15.6%) |
| 8:30 AM to 8:59 AM | 1,322 (6.4%) | 1,758 (10.0%) |
| 9:00 AM to 9:59 AM | 1,071 (5.2%) | 2,633 (15.0%) |
| 10:00 AM to 10:59 AM | 635 (3.1%) | 785 (4.5%) |
| 11:00 AM to 11:59 AM | 229 (1.1%) | 408 (2.3%) |
| 12:00 PM to 3:59 PM | 1,213 (5.9%) | 1,192 (6.8%) |
| 4:00 PM to 11:59 PM | 541 (2.6%) | 738 (4.2%) |
| Total | 20,558 (100.0%) | 17,512 (100.0%) |
Housing Occupancy in Newport County
Occupancy by Ownership in Newport County
Of the total 35,786 dwellings in Newport County, owner-occupied units account for 23,894 (66.8%), while renter-occupied units make up 11,892 (33.2%).
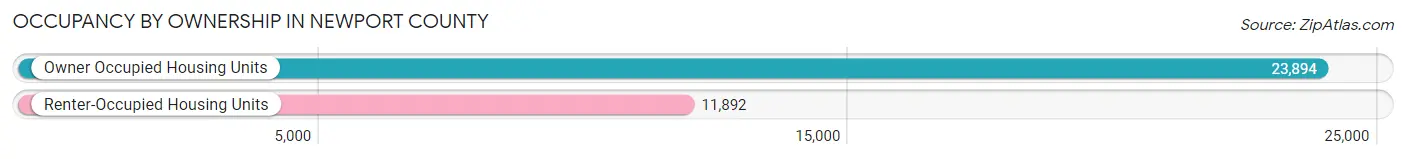
| Occupancy | # Housing Units | % Housing Units |
| Owner Occupied Housing Units | 23,894 | 66.8% |
| Renter-Occupied Housing Units | 11,892 | 33.2% |
| Total Occupied Housing Units | 35,786 | 100.0% |
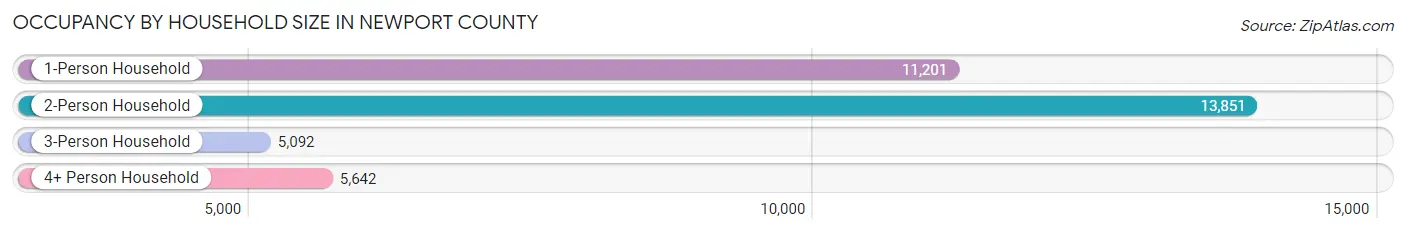
Occupancy by Household Size in Newport County
| Household Size | # Housing Units | % Housing Units |
| 1-Person Household | 11,201 | 31.3% |
| 2-Person Household | 13,851 | 38.7% |
| 3-Person Household | 5,092 | 14.2% |
| 4+ Person Household | 5,642 | 15.8% |
| Total Housing Units | 35,786 | 100.0% |
Occupancy by Ownership by Household Size in Newport County
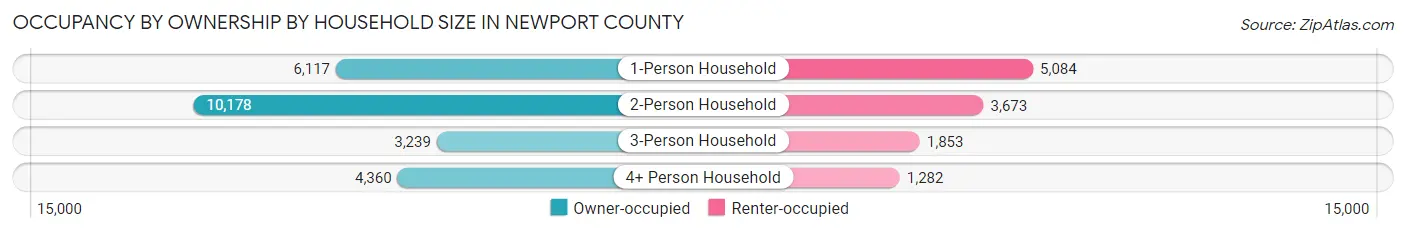
| Household Size | Owner-occupied | Renter-occupied |
| 1-Person Household | 6,117 (54.6%) | 5,084 (45.4%) |
| 2-Person Household | 10,178 (73.5%) | 3,673 (26.5%) |
| 3-Person Household | 3,239 (63.6%) | 1,853 (36.4%) |
| 4+ Person Household | 4,360 (77.3%) | 1,282 (22.7%) |
| Total Housing Units | 23,894 (66.8%) | 11,892 (33.2%) |
Occupancy by Educational Attainment in Newport County
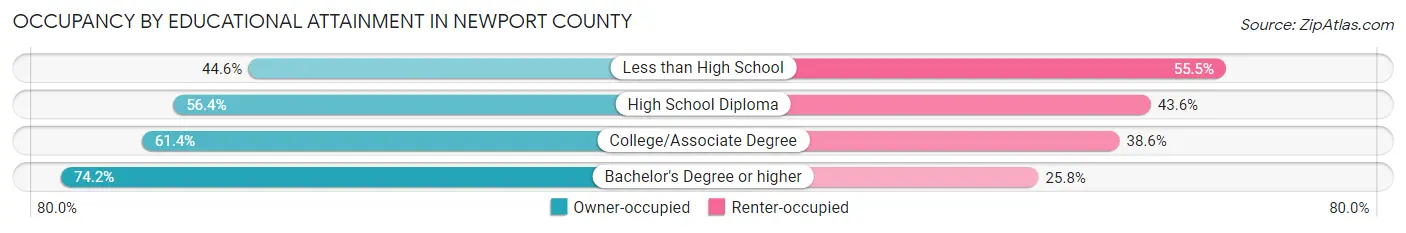
| Household Size | Owner-occupied | Renter-occupied |
| Less than High School | 727 (44.6%) | 905 (55.4%) |
| High School Diploma | 3,690 (56.4%) | 2,850 (43.6%) |
| College/Associate Degree | 4,884 (61.4%) | 3,072 (38.6%) |
| Bachelor's Degree or higher | 14,593 (74.2%) | 5,065 (25.8%) |
Occupancy by Age of Householder in Newport County
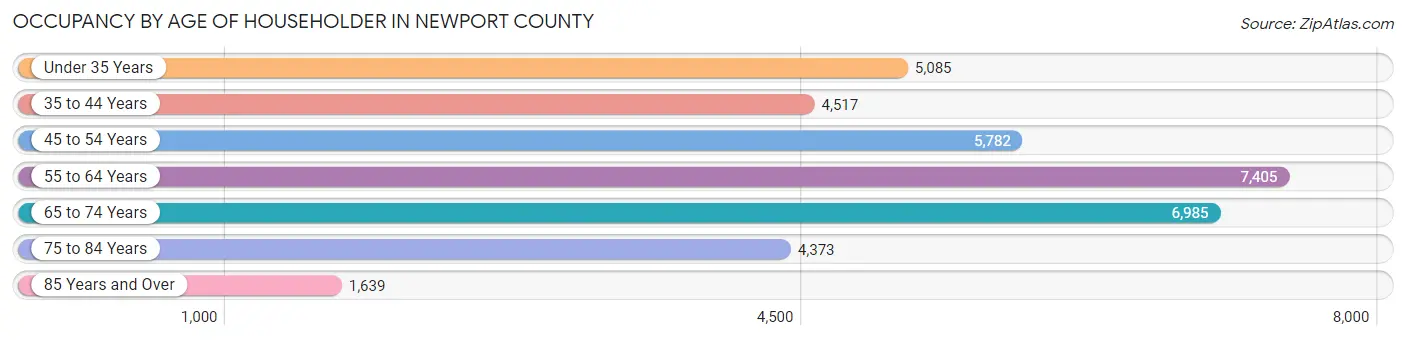
| Age Bracket | # Households | % Households |
| Under 35 Years | 5,085 | 14.2% |
| 35 to 44 Years | 4,517 | 12.6% |
| 45 to 54 Years | 5,782 | 16.2% |
| 55 to 64 Years | 7,405 | 20.7% |
| 65 to 74 Years | 6,985 | 19.5% |
| 75 to 84 Years | 4,373 | 12.2% |
| 85 Years and Over | 1,639 | 4.6% |
| Total | 35,786 | 100.0% |
Housing Finances in Newport County
Median Income by Occupancy in Newport County
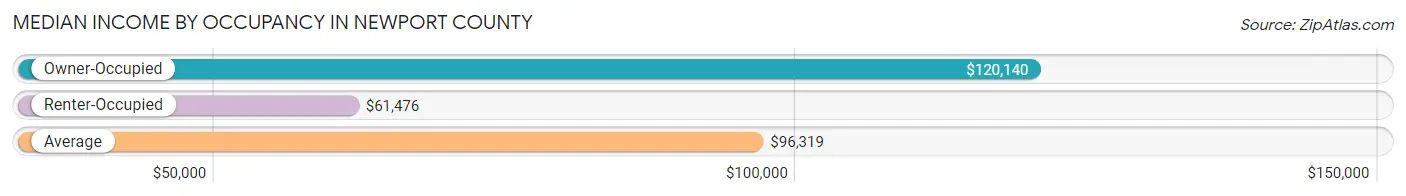
| Occupancy Type | # Households | Median Income |
| Owner-Occupied | 23,894 (66.8%) | $120,140 |
| Renter-Occupied | 11,892 (33.2%) | $61,476 |
| Average | 35,786 (100.0%) | $96,319 |
Occupancy by Householder Income Bracket in Newport County
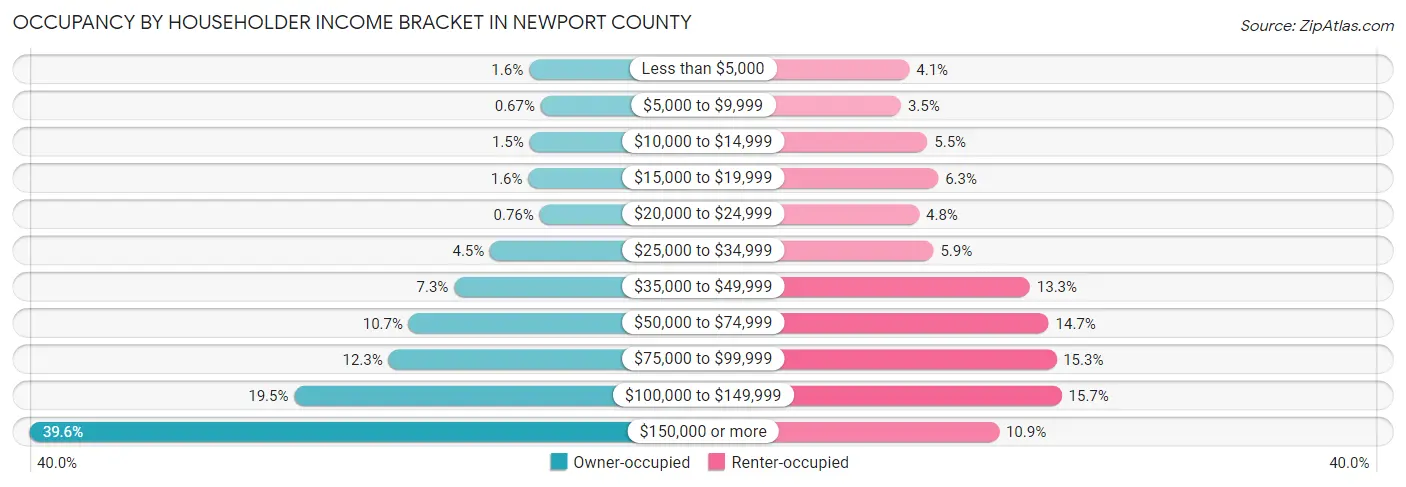
| Income Bracket | Owner-occupied | Renter-occupied |
| Less than $5,000 | 376 (1.6%) | 488 (4.1%) |
| $5,000 to $9,999 | 159 (0.7%) | 411 (3.5%) |
| $10,000 to $14,999 | 365 (1.5%) | 650 (5.5%) |
| $15,000 to $19,999 | 387 (1.6%) | 749 (6.3%) |
| $20,000 to $24,999 | 181 (0.8%) | 575 (4.8%) |
| $25,000 to $34,999 | 1,082 (4.5%) | 706 (5.9%) |
| $35,000 to $49,999 | 1,738 (7.3%) | 1,579 (13.3%) |
| $50,000 to $74,999 | 2,565 (10.7%) | 1,749 (14.7%) |
| $75,000 to $99,999 | 2,931 (12.3%) | 1,818 (15.3%) |
| $100,000 to $149,999 | 4,648 (19.5%) | 1,867 (15.7%) |
| $150,000 or more | 9,462 (39.6%) | 1,300 (10.9%) |
| Total | 23,894 (100.0%) | 11,892 (100.0%) |
Monthly Housing Cost Tiers in Newport County
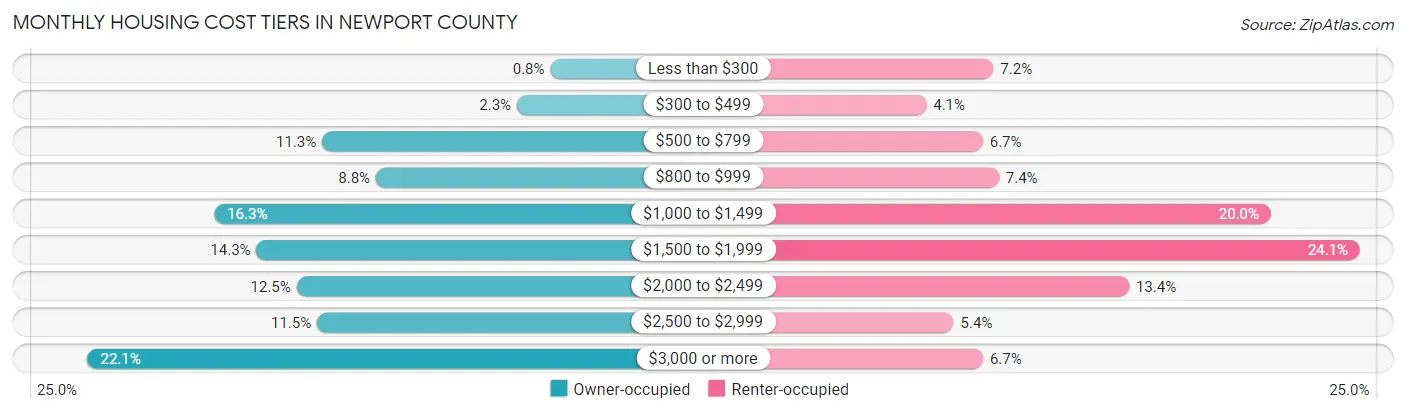
| Monthly Cost | Owner-occupied | Renter-occupied |
| Less than $300 | 191 (0.8%) | 854 (7.2%) |
| $300 to $499 | 560 (2.3%) | 486 (4.1%) |
| $500 to $799 | 2,702 (11.3%) | 795 (6.7%) |
| $800 to $999 | 2,111 (8.8%) | 883 (7.4%) |
| $1,000 to $1,499 | 3,887 (16.3%) | 2,372 (20.0%) |
| $1,500 to $1,999 | 3,424 (14.3%) | 2,860 (24.0%) |
| $2,000 to $2,499 | 2,982 (12.5%) | 1,596 (13.4%) |
| $2,500 to $2,999 | 2,757 (11.5%) | 636 (5.3%) |
| $3,000 or more | 5,280 (22.1%) | 797 (6.7%) |
| Total | 23,894 (100.0%) | 11,892 (100.0%) |
Physical Housing Characteristics in Newport County
Housing Structures in Newport County
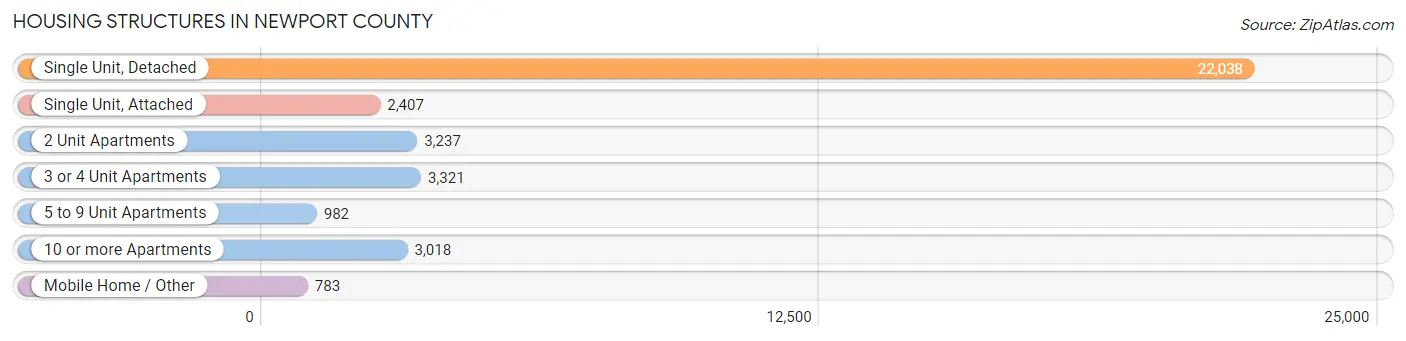
| Structure Type | # Housing Units | % Housing Units |
| Single Unit, Detached | 22,038 | 61.6% |
| Single Unit, Attached | 2,407 | 6.7% |
| 2 Unit Apartments | 3,237 | 9.0% |
| 3 or 4 Unit Apartments | 3,321 | 9.3% |
| 5 to 9 Unit Apartments | 982 | 2.7% |
| 10 or more Apartments | 3,018 | 8.4% |
| Mobile Home / Other | 783 | 2.2% |
| Total | 35,786 | 100.0% |
Housing Structures by Occupancy in Newport County
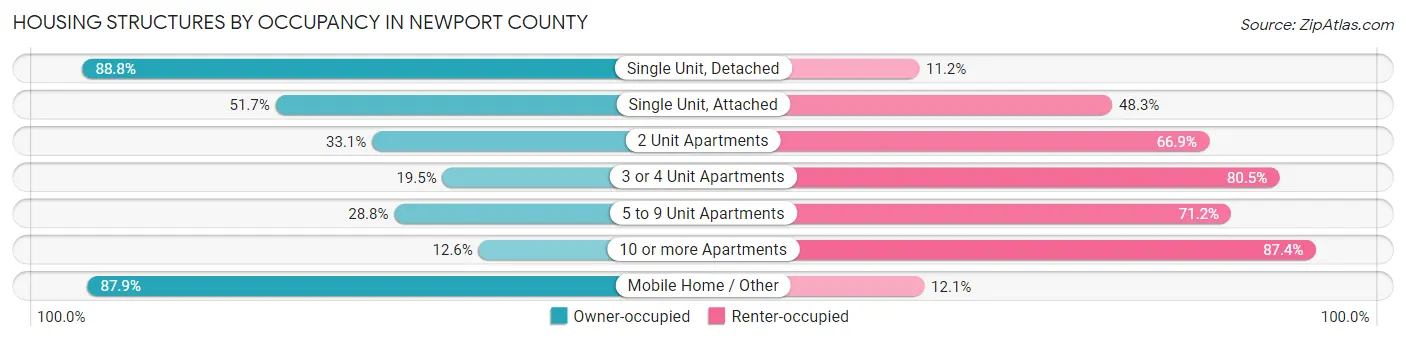
| Structure Type | Owner-occupied | Renter-occupied |
| Single Unit, Detached | 19,579 (88.8%) | 2,459 (11.2%) |
| Single Unit, Attached | 1,244 (51.7%) | 1,163 (48.3%) |
| 2 Unit Apartments | 1,071 (33.1%) | 2,166 (66.9%) |
| 3 or 4 Unit Apartments | 649 (19.5%) | 2,672 (80.5%) |
| 5 to 9 Unit Apartments | 283 (28.8%) | 699 (71.2%) |
| 10 or more Apartments | 380 (12.6%) | 2,638 (87.4%) |
| Mobile Home / Other | 688 (87.9%) | 95 (12.1%) |
| Total | 23,894 (66.8%) | 11,892 (33.2%) |
Housing Structures by Number of Rooms in Newport County
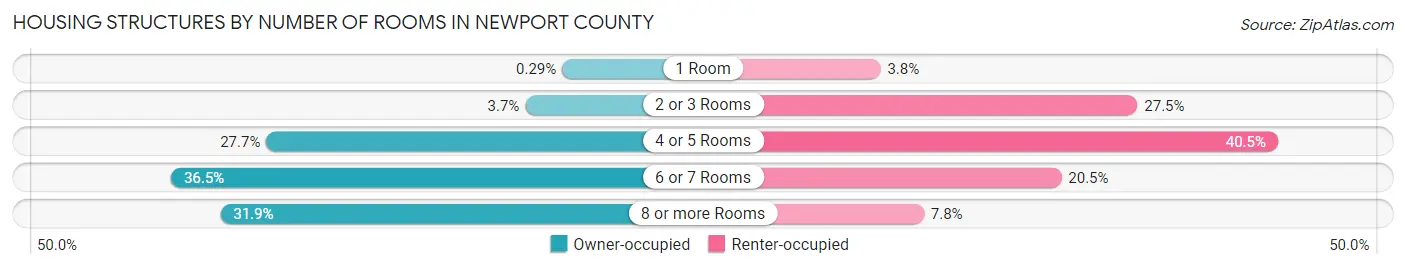
| Number of Rooms | Owner-occupied | Renter-occupied |
| 1 Room | 70 (0.3%) | 446 (3.7%) |
| 2 or 3 Rooms | 885 (3.7%) | 3,272 (27.5%) |
| 4 or 5 Rooms | 6,607 (27.7%) | 4,815 (40.5%) |
| 6 or 7 Rooms | 8,711 (36.5%) | 2,436 (20.5%) |
| 8 or more Rooms | 7,621 (31.9%) | 923 (7.8%) |
| Total | 23,894 (100.0%) | 11,892 (100.0%) |
Housing Structure by Heating Type in Newport County
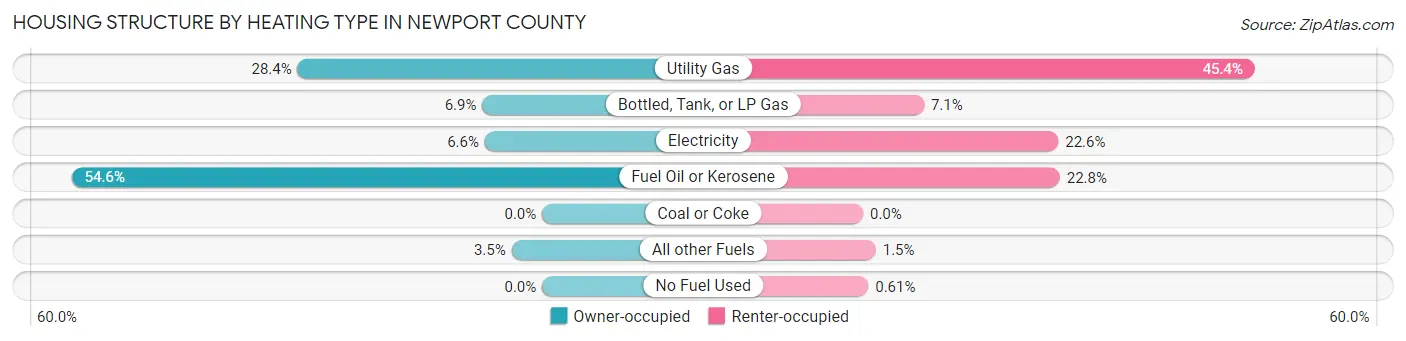
| Heating Type | Owner-occupied | Renter-occupied |
| Utility Gas | 6,774 (28.3%) | 5,400 (45.4%) |
| Bottled, Tank, or LP Gas | 1,655 (6.9%) | 840 (7.1%) |
| Electricity | 1,586 (6.6%) | 2,692 (22.6%) |
| Fuel Oil or Kerosene | 13,033 (54.5%) | 2,712 (22.8%) |
| Coal or Coke | 1 (0.0%) | 0 (0.0%) |
| All other Fuels | 845 (3.5%) | 176 (1.5%) |
| No Fuel Used | 0 (0.0%) | 72 (0.6%) |
| Total | 23,894 (100.0%) | 11,892 (100.0%) |
Household Vehicle Usage in Newport County
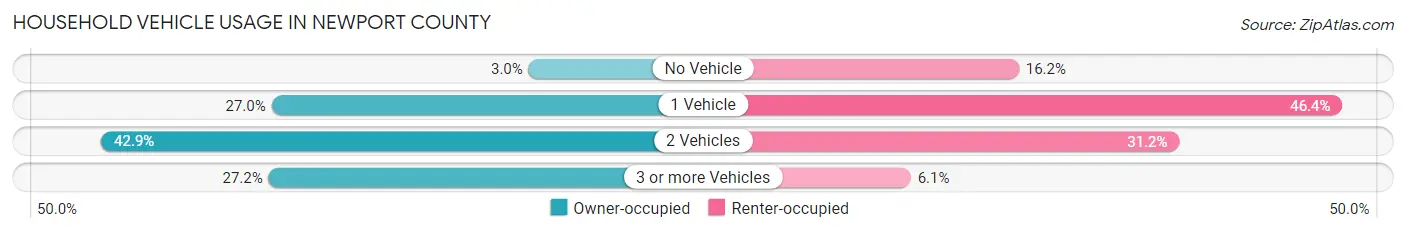
| Vehicles per Household | Owner-occupied | Renter-occupied |
| No Vehicle | 705 (2.9%) | 1,930 (16.2%) |
| 1 Vehicle | 6,440 (27.0%) | 5,521 (46.4%) |
| 2 Vehicles | 10,243 (42.9%) | 3,711 (31.2%) |
| 3 or more Vehicles | 6,506 (27.2%) | 730 (6.1%) |
| Total | 23,894 (100.0%) | 11,892 (100.0%) |
Real Estate & Mortgages in Newport County
Real Estate and Mortgage Overview in Newport County
| Characteristic | Without Mortgage | With Mortgage |
| Housing Units | 9,306 | 14,588 |
| Median Property Value | $478,700 | $523,600 |
| Median Household Income | $91,557 | $6,715 |
| Monthly Housing Costs | $963 | $5,073 |
| Real Estate Taxes | $4,870 | $81 |
Property Value by Mortgage Status in Newport County
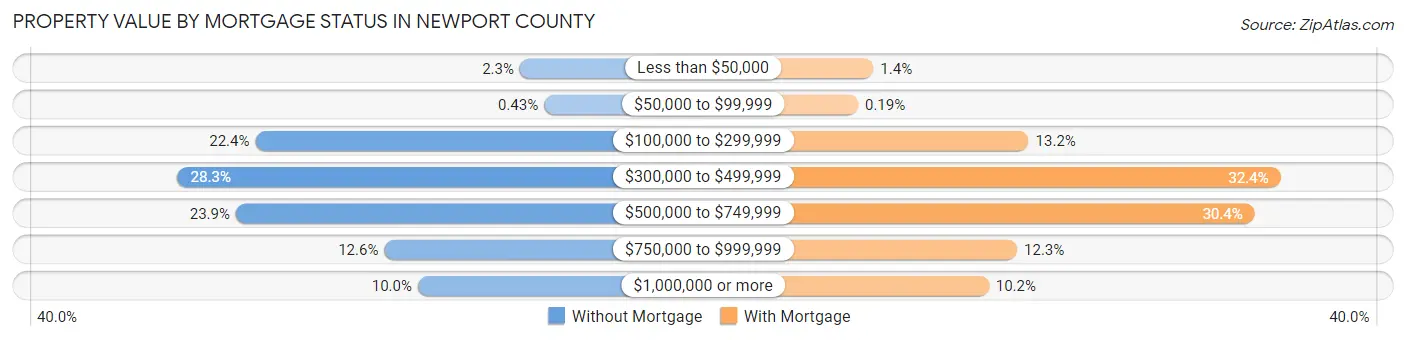
| Property Value | Without Mortgage | With Mortgage |
| Less than $50,000 | 211 (2.3%) | 199 (1.4%) |
| $50,000 to $99,999 | 40 (0.4%) | 28 (0.2%) |
| $100,000 to $299,999 | 2,086 (22.4%) | 1,924 (13.2%) |
| $300,000 to $499,999 | 2,637 (28.3%) | 4,724 (32.4%) |
| $500,000 to $749,999 | 2,225 (23.9%) | 4,436 (30.4%) |
| $750,000 to $999,999 | 1,173 (12.6%) | 1,796 (12.3%) |
| $1,000,000 or more | 934 (10.0%) | 1,481 (10.2%) |
| Total | 9,306 (100.0%) | 14,588 (100.0%) |
Household Income by Mortgage Status in Newport County
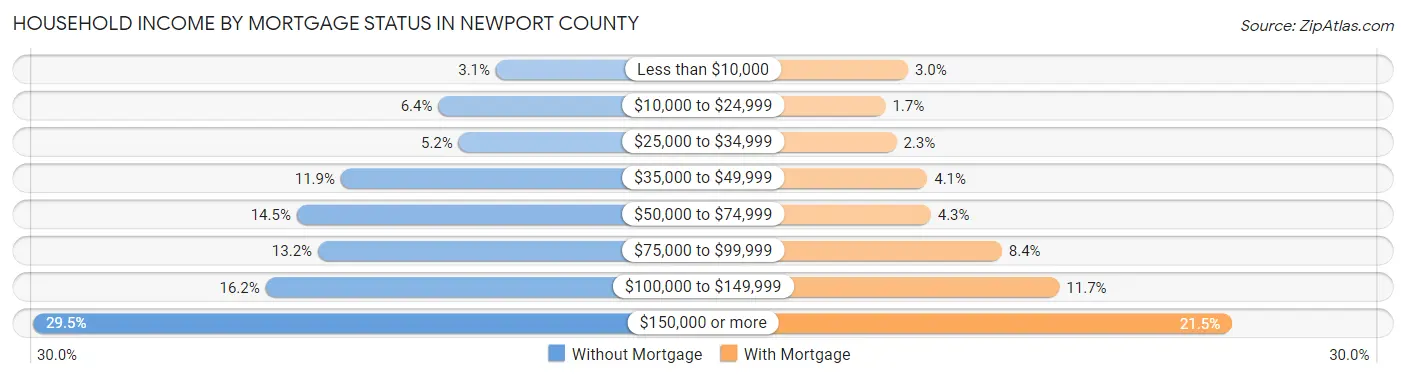
| Household Income | Without Mortgage | With Mortgage |
| Less than $10,000 | 286 (3.1%) | 438 (3.0%) |
| $10,000 to $24,999 | 592 (6.4%) | 249 (1.7%) |
| $25,000 to $34,999 | 484 (5.2%) | 341 (2.3%) |
| $35,000 to $49,999 | 1,110 (11.9%) | 598 (4.1%) |
| $50,000 to $74,999 | 1,345 (14.4%) | 628 (4.3%) |
| $75,000 to $99,999 | 1,232 (13.2%) | 1,220 (8.4%) |
| $100,000 to $149,999 | 1,510 (16.2%) | 1,699 (11.7%) |
| $150,000 or more | 2,747 (29.5%) | 3,138 (21.5%) |
| Total | 9,306 (100.0%) | 14,588 (100.0%) |
Property Value to Household Income Ratio in Newport County
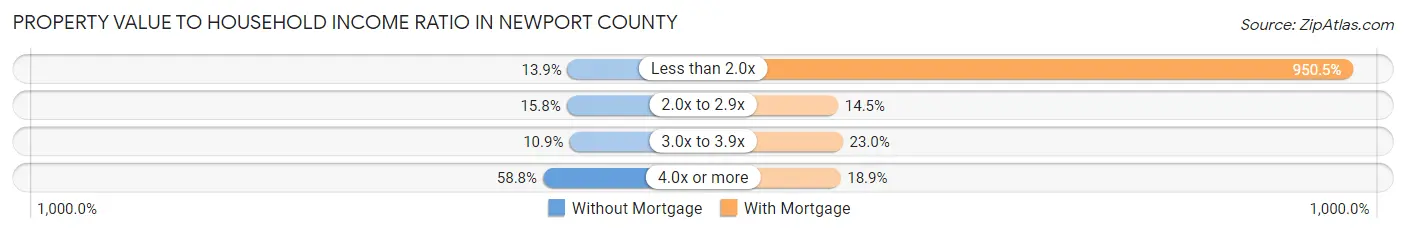
| Value-to-Income Ratio | Without Mortgage | With Mortgage |
| Less than 2.0x | 1,293 (13.9%) | 138,662 (950.5%) |
| 2.0x to 2.9x | 1,473 (15.8%) | 2,109 (14.5%) |
| 3.0x to 3.9x | 1,014 (10.9%) | 3,349 (23.0%) |
| 4.0x or more | 5,470 (58.8%) | 2,756 (18.9%) |
| Total | 9,306 (100.0%) | 14,588 (100.0%) |
Real Estate Taxes by Mortgage Status in Newport County
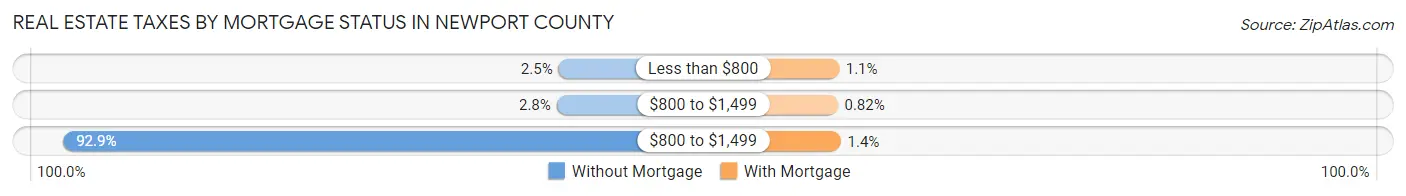
| Property Taxes | Without Mortgage | With Mortgage |
| Less than $800 | 232 (2.5%) | 153 (1.1%) |
| $800 to $1,499 | 263 (2.8%) | 119 (0.8%) |
| $800 to $1,499 | 8,649 (92.9%) | 202 (1.4%) |
| Total | 9,306 (100.0%) | 14,588 (100.0%) |
Health & Disability in Newport County
Health Insurance Coverage by Age in Newport County
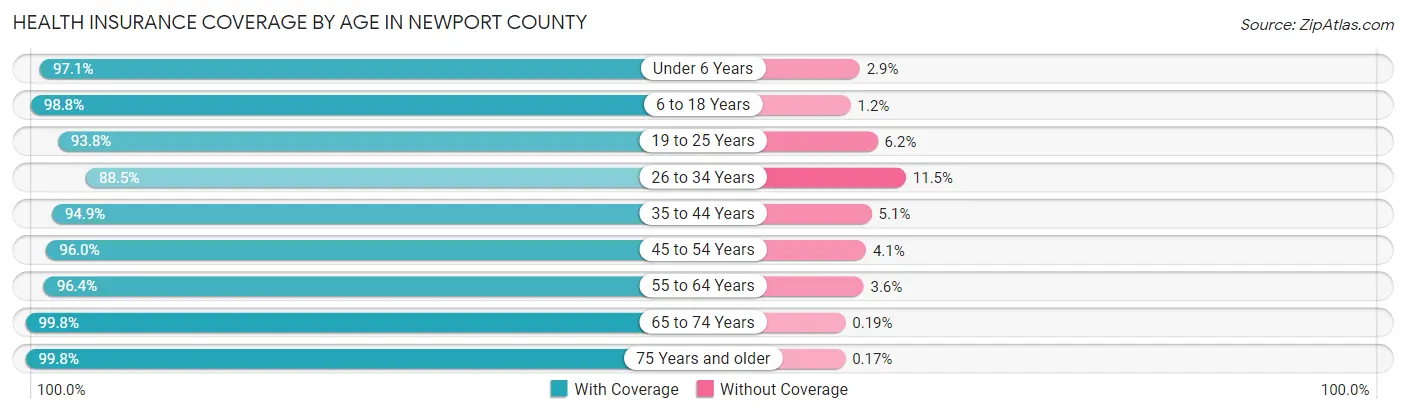
| Age Bracket | With Coverage | Without Coverage |
| Under 6 Years | 4,181 (97.1%) | 124 (2.9%) |
| 6 to 18 Years | 10,869 (98.8%) | 129 (1.2%) |
| 19 to 25 Years | 6,103 (93.8%) | 405 (6.2%) |
| 26 to 34 Years | 7,533 (88.5%) | 977 (11.5%) |
| 35 to 44 Years | 8,247 (94.9%) | 443 (5.1%) |
| 45 to 54 Years | 9,986 (96.0%) | 421 (4.1%) |
| 55 to 64 Years | 12,521 (96.4%) | 466 (3.6%) |
| 65 to 74 Years | 11,445 (99.8%) | 22 (0.2%) |
| 75 Years and older | 8,466 (99.8%) | 14 (0.2%) |
| Total | 79,351 (96.4%) | 3,001 (3.6%) |
Health Insurance Coverage by Citizenship Status in Newport County
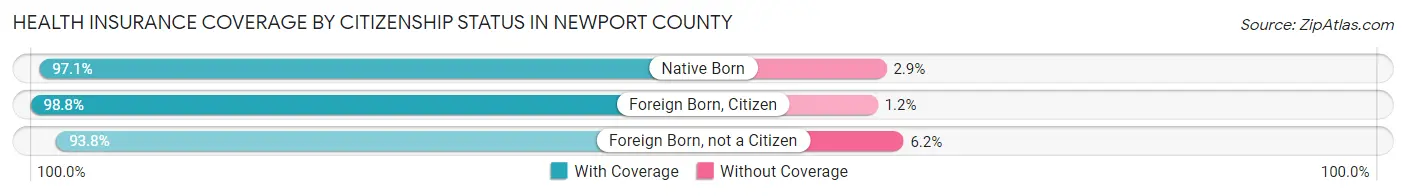
| Citizenship Status | With Coverage | Without Coverage |
| Native Born | 4,181 (97.1%) | 124 (2.9%) |
| Foreign Born, Citizen | 10,869 (98.8%) | 129 (1.2%) |
| Foreign Born, not a Citizen | 6,103 (93.8%) | 405 (6.2%) |
Health Insurance Coverage by Household Income in Newport County
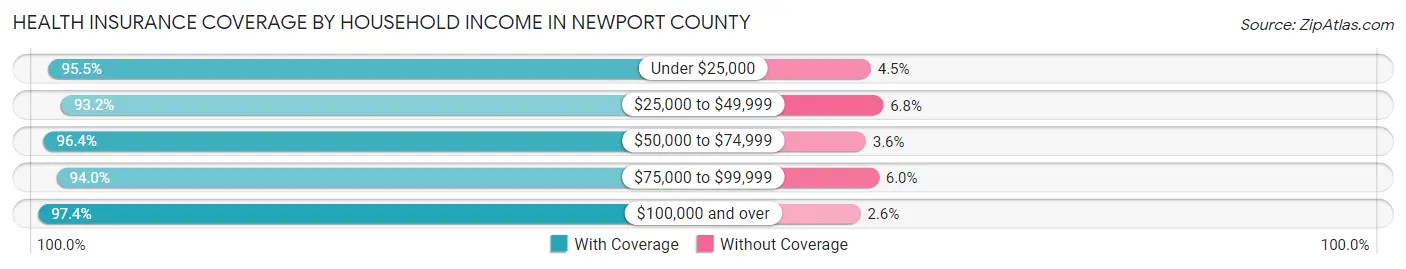
| Household Income | With Coverage | Without Coverage |
| Under $25,000 | 5,899 (95.5%) | 278 (4.5%) |
| $25,000 to $49,999 | 8,123 (93.2%) | 595 (6.8%) |
| $50,000 to $74,999 | 7,906 (96.4%) | 292 (3.6%) |
| $75,000 to $99,999 | 9,333 (94.0%) | 595 (6.0%) |
| $100,000 and over | 46,108 (97.4%) | 1,212 (2.6%) |
Public vs Private Health Insurance Coverage by Age in Newport County
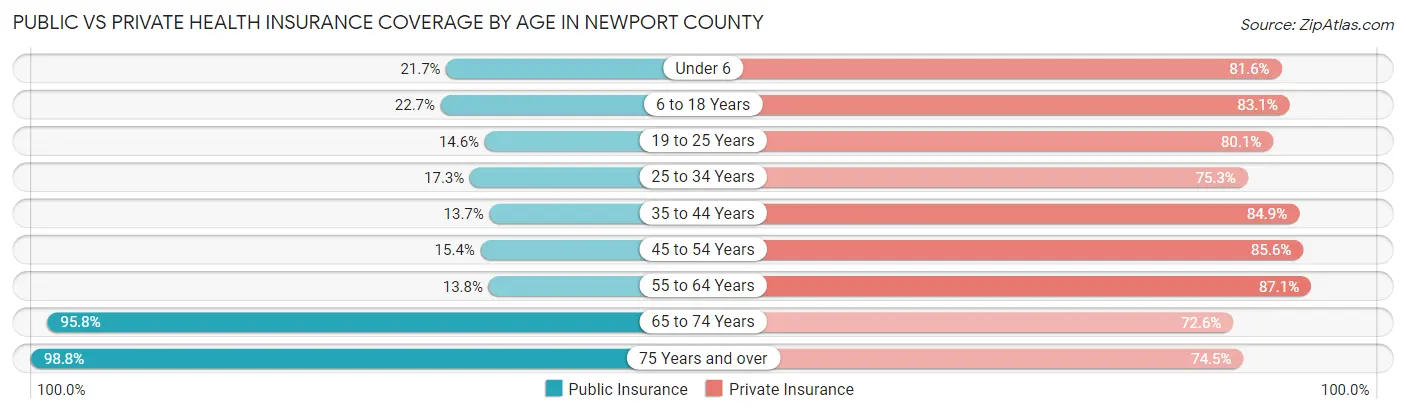
| Age Bracket | Public Insurance | Private Insurance |
| Under 6 | 934 (21.7%) | 3,513 (81.6%) |
| 6 to 18 Years | 2,501 (22.7%) | 9,140 (83.1%) |
| 19 to 25 Years | 947 (14.5%) | 5,210 (80.1%) |
| 25 to 34 Years | 1,473 (17.3%) | 6,411 (75.3%) |
| 35 to 44 Years | 1,190 (13.7%) | 7,375 (84.9%) |
| 45 to 54 Years | 1,597 (15.3%) | 8,912 (85.6%) |
| 55 to 64 Years | 1,798 (13.8%) | 11,309 (87.1%) |
| 65 to 74 Years | 10,983 (95.8%) | 8,330 (72.6%) |
| 75 Years and over | 8,381 (98.8%) | 6,319 (74.5%) |
| Total | 29,804 (36.2%) | 66,519 (80.8%) |
Disability Status by Sex by Age in Newport County
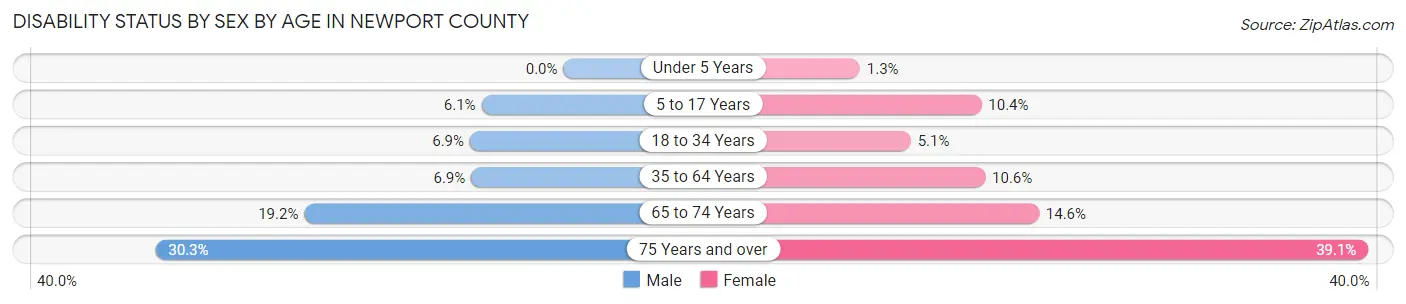
| Age Bracket | Male | Female |
| Under 5 Years | 0 (0.0%) | 23 (1.3%) |
| 5 to 17 Years | 337 (6.1%) | 505 (10.4%) |
| 18 to 34 Years | 562 (6.9%) | 429 (5.1%) |
| 35 to 64 Years | 1,070 (6.9%) | 1,752 (10.6%) |
| 65 to 74 Years | 1,067 (19.2%) | 866 (14.6%) |
| 75 Years and over | 1,069 (30.3%) | 1,935 (39.1%) |
Disability Class by Sex by Age in Newport County
Disability Class: Hearing Difficulty
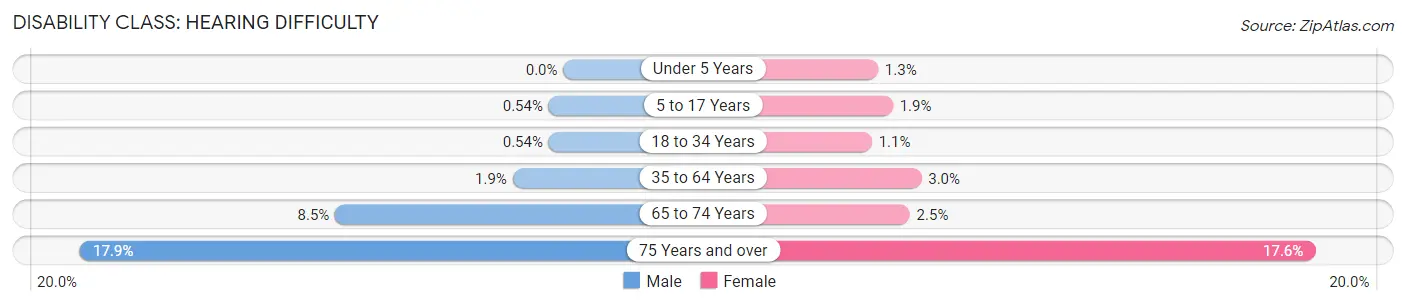
| Age Bracket | Male | Female |
| Under 5 Years | 0 (0.0%) | 23 (1.3%) |
| 5 to 17 Years | 30 (0.5%) | 92 (1.9%) |
| 18 to 34 Years | 44 (0.5%) | 93 (1.1%) |
| 35 to 64 Years | 294 (1.9%) | 485 (2.9%) |
| 65 to 74 Years | 470 (8.5%) | 149 (2.5%) |
| 75 Years and over | 633 (17.9%) | 870 (17.6%) |
Disability Class: Vision Difficulty
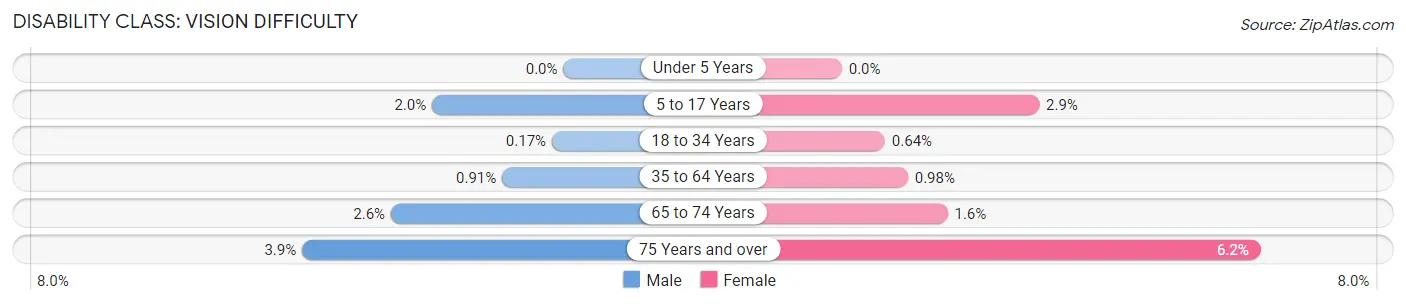
| Age Bracket | Male | Female |
| Under 5 Years | 0 (0.0%) | 0 (0.0%) |
| 5 to 17 Years | 108 (1.9%) | 143 (2.9%) |
| 18 to 34 Years | 14 (0.2%) | 54 (0.6%) |
| 35 to 64 Years | 142 (0.9%) | 161 (1.0%) |
| 65 to 74 Years | 142 (2.6%) | 93 (1.6%) |
| 75 Years and over | 137 (3.9%) | 308 (6.2%) |
Disability Class: Cognitive Difficulty
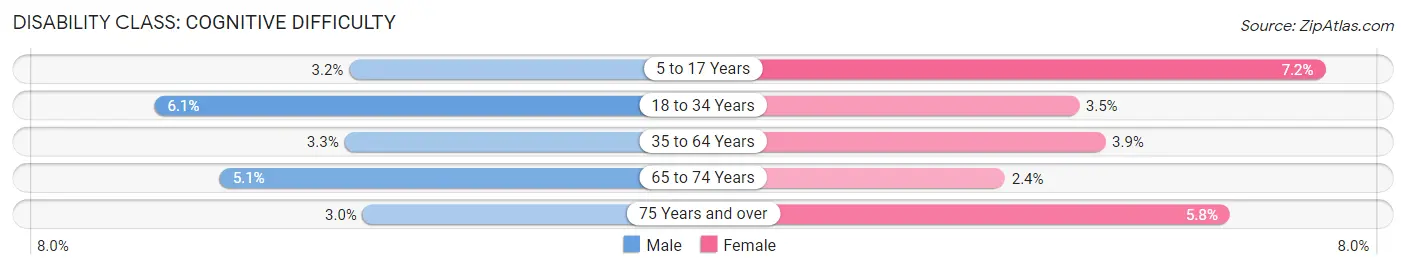
| Age Bracket | Male | Female |
| 5 to 17 Years | 176 (3.2%) | 350 (7.2%) |
| 18 to 34 Years | 491 (6.1%) | 295 (3.5%) |
| 35 to 64 Years | 507 (3.3%) | 644 (3.9%) |
| 65 to 74 Years | 283 (5.1%) | 143 (2.4%) |
| 75 Years and over | 105 (3.0%) | 285 (5.8%) |
Disability Class: Ambulatory Difficulty
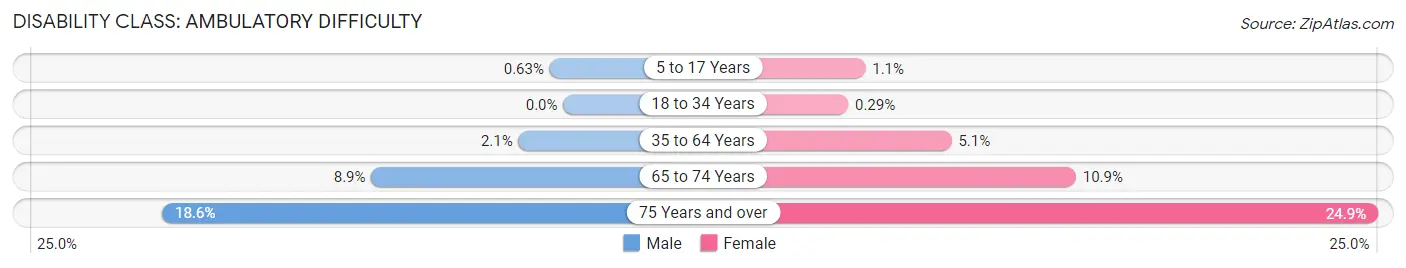
| Age Bracket | Male | Female |
| 5 to 17 Years | 35 (0.6%) | 53 (1.1%) |
| 18 to 34 Years | 0 (0.0%) | 24 (0.3%) |
| 35 to 64 Years | 325 (2.1%) | 838 (5.1%) |
| 65 to 74 Years | 494 (8.9%) | 643 (10.9%) |
| 75 Years and over | 657 (18.6%) | 1,232 (24.9%) |
Disability Class: Self-Care Difficulty
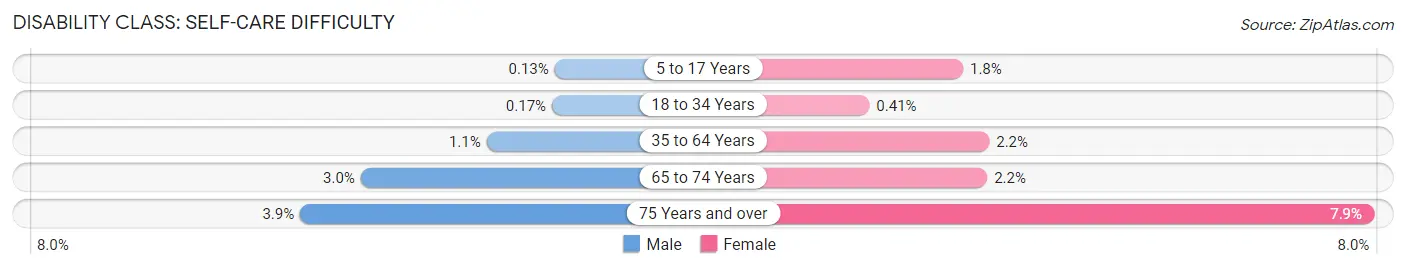
| Age Bracket | Male | Female |
| 5 to 17 Years | 7 (0.1%) | 88 (1.8%) |
| 18 to 34 Years | 14 (0.2%) | 34 (0.4%) |
| 35 to 64 Years | 178 (1.1%) | 361 (2.2%) |
| 65 to 74 Years | 167 (3.0%) | 128 (2.2%) |
| 75 Years and over | 138 (3.9%) | 391 (7.9%) |
Technology Access in Newport County
Computing Device Access in Newport County
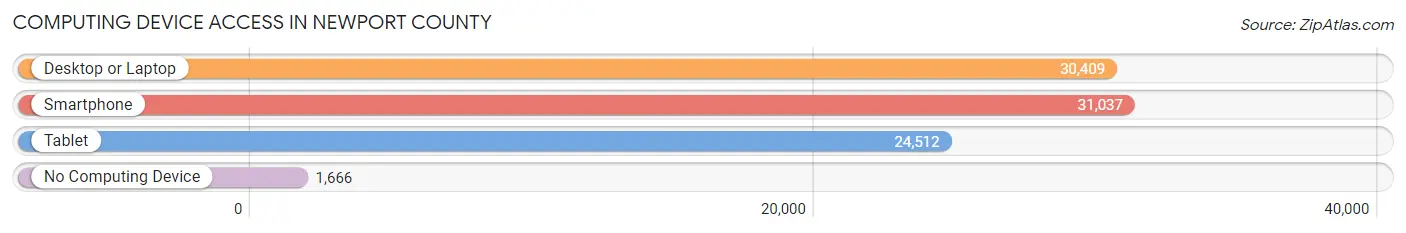
| Device Type | # Households | % Households |
| Desktop or Laptop | 30,409 | 85.0% |
| Smartphone | 31,037 | 86.7% |
| Tablet | 24,512 | 68.5% |
| No Computing Device | 1,666 | 4.7% |
| Total | 35,786 | 100.0% |
Internet Access in Newport County
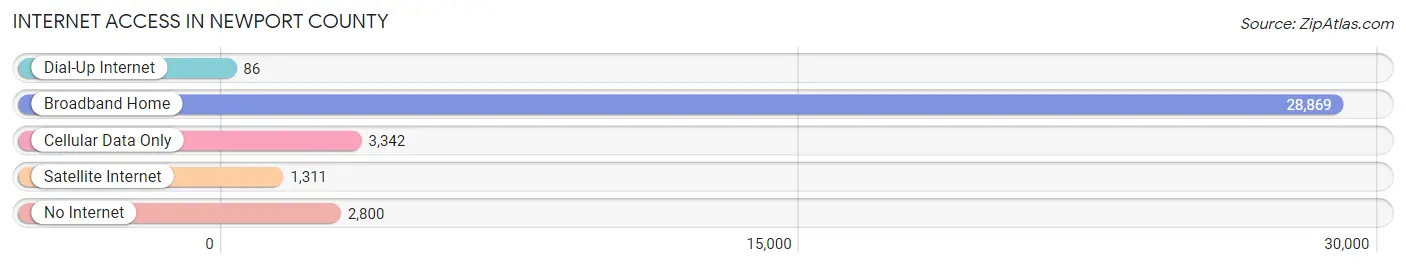
| Internet Type | # Households | % Households |
| Dial-Up Internet | 86 | 0.2% |
| Broadband Home | 28,869 | 80.7% |
| Cellular Data Only | 3,342 | 9.3% |
| Satellite Internet | 1,311 | 3.7% |
| No Internet | 2,800 | 7.8% |
| Total | 35,786 | 100.0% |
Newport County Summary
Newport County, Rhode Island is a county located in the state of Rhode Island. It is the smallest county in the state, with a population of just over 82,000 people. The county is bordered by the Atlantic Ocean to the south, and the states of Massachusetts and Connecticut to the north and west. The county seat is the city of Newport, which is also the county's largest city.
History
Newport County was established in 1703, when the Rhode Island General Assembly divided the state into three counties: Providence, Kent, and Newport. The county was named after the city of Newport, which was founded in 1639 by Roger Williams. The city was originally part of the Massachusetts Bay Colony, but was annexed by Rhode Island in 1663.
The county has a long and rich history, and was an important center of the American Revolution. During the war, Newport was the site of the first naval battle of the Revolution, the Battle of Rhode Island. The county was also the site of the first U.S. Navy base, established in 1775.
Geography
Newport County is located in the southeastern corner of Rhode Island, and is bordered by the Atlantic Ocean to the south, and the states of Massachusetts and Connecticut to the north and west. The county is made up of several islands, including Aquidneck Island, Conanicut Island, and Prudence Island. The county is also home to several small towns, including Jamestown, Middletown, and Portsmouth.
The county has a total area of 97 square miles, of which 79 square miles is land and 18 square miles is water. The county is home to several parks and nature preserves, including the Sachuest Point National Wildlife Refuge, the Norman Bird Sanctuary, and the Fort Adams State Park.
Economy
Newport County has a diverse economy, with a mix of manufacturing, tourism, and service industries. The county is home to several large employers, including the Naval Undersea Warfare Center, the Naval War College, and the Naval Station Newport.
The county is also home to several tourist attractions, including the Newport Mansions, the International Tennis Hall of Fame, and the Newport Cliff Walk. Tourism is a major industry in the county, and is responsible for millions of dollars in revenue each year.
Demographics
As of the 2010 census, Newport County had a population of 82,888 people. The racial makeup of the county was 87.3% White, 5.2% African American, 0.5% Native American, 2.2% Asian, 0.1% Pacific Islander, 1.7% from other races, and 3.0% from two or more races. Hispanic or Latino of any race were 5.2% of the population.
The median income for a household in the county was $60,837, and the median income for a family was $71,837. The per capita income for the county was $35,945. About 8.2% of families and 11.2% of the population were below the poverty line, including 15.2% of those under age 18 and 8.2% of those age 65 or over.
Newport County is a diverse and vibrant community, with a rich history and a strong economy. The county is home to several tourist attractions, and is a popular destination for visitors from around the world. With its beautiful coastline, historic sites, and vibrant culture, Newport County is a great place to live and visit.
Common Questions
What is Per Capita Income in Newport County?
Per Capita income in Newport County is $58,280.
What is the Median Family Income in Newport County?
Median Family Income in Newport County is $130,074.
What is the Median Household income in Newport County?
Median Household Income in Newport County is $96,319.
What is Income or Wage Gap in Newport County?
Income or Wage Gap in Newport County is 32.5%.
Women in Newport County earn 67.5 cents for every dollar earned by a man.
What is Family Income Deficit in Newport County?
Family Income Deficit in Newport County is $9,890.
Families that are below poverty line in Newport County earn $9,890 less on average than the poverty threshold level.
What is Inequality or Gini Index in Newport County?
Inequality or Gini Index in Newport County is 0.48.
What is the Total Population of Newport County?
Total Population of Newport County is 85,442.
What is the Total Male Population of Newport County?
Total Male Population of Newport County is 42,340.
What is the Total Female Population of Newport County?
Total Female Population of Newport County is 43,102.
What is the Ratio of Males per 100 Females in Newport County?
There are 98.23 Males per 100 Females in Newport County.
What is the Ratio of Females per 100 Males in Newport County?
There are 101.80 Females per 100 Males in Newport County.
What is the Median Population Age in Newport County?
Median Population Age in Newport County is 46.4 Years.
What is the Average Family Size in Newport County
Average Family Size in Newport County is 2.9 People.
What is the Average Household Size in Newport County
Average Household Size in Newport County is 2.3 People.
How Large is the Labor Force in Newport County?
There are 47,283 People in the Labor Forcein in Newport County.
What is the Percentage of People in the Labor Force in Newport County?
64.4% of People are in the Labor Force in Newport County.
What is the Unemployment Rate in Newport County?
Unemployment Rate in Newport County is 6.5%.