Kent County, RI Map & Demographics
Kent County Overview
$46,564
PER CAPITA INCOME
$108,061
AVG FAMILY INCOME
$85,732
AVG HOUSEHOLD INCOME
22.3%
WAGE / INCOME GAP [ % ]
77.7¢/ $1
WAGE / INCOME GAP [ $ ]
$9,664
FAMILY INCOME DEFICIT
0.44
INEQUALITY / GINI INDEX
170,168
TOTAL POPULATION
83,198
MALE POPULATION
86,970
FEMALE POPULATION
95.66
MALES / 100 FEMALES
104.53
FEMALES / 100 MALES
43.6
MEDIAN AGE
2.9
AVG FAMILY SIZE
2.3
AVG HOUSEHOLD SIZE
94,870
LABOR FORCE [ PEOPLE ]
66.4%
PERCENT IN LABOR FORCE
4.6%
UNEMPLOYMENT RATE
Kent County Area Codes
Income in Kent County
Income Overview in Kent County
Per Capita Income in Kent County is $46,564, while median incomes of families and households are $108,061 and $85,732 respectively.
| Characteristic | Number | Measure |
| Per Capita Income | 170,168 | $46,564 |
| Median Family Income | 44,926 | $108,061 |
| Mean Family Income | 44,926 | $134,550 |
| Median Household Income | 72,199 | $85,732 |
| Mean Household Income | 72,199 | $109,772 |
| Income Deficit | 44,926 | $9,664 |
| Wage / Income Gap (%) | 170,168 | 22.31% |
| Wage / Income Gap ($) | 170,168 | 77.69¢ per $1 |
| Gini / Inequality Index | 170,168 | 0.44 |
Earnings by Sex in Kent County
Average Earnings in Kent County are $51,819, $58,435 for men and $45,401 for women, a difference of 22.3%.
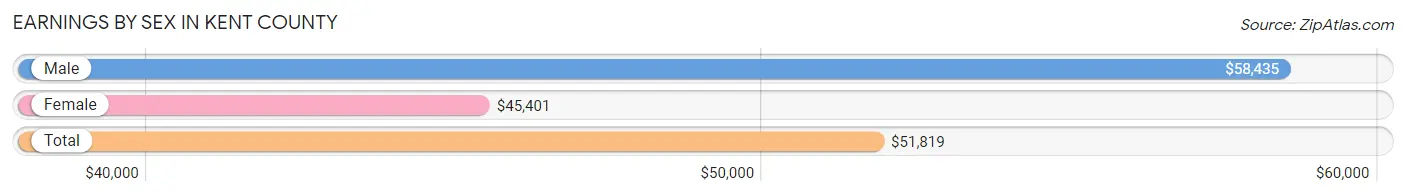
| Sex | Number | Average Earnings |
| Male | 50,412 (51.9%) | $58,435 |
| Female | 46,623 (48.0%) | $45,401 |
| Total | 97,035 (100.0%) | $51,819 |
Earnings by Sex by Income Bracket in Kent County
The most common earnings brackets in Kent County are $100,000+ for men (10,448 | 20.7%) and $75,000 to $99,999 for women (5,533 | 11.9%).
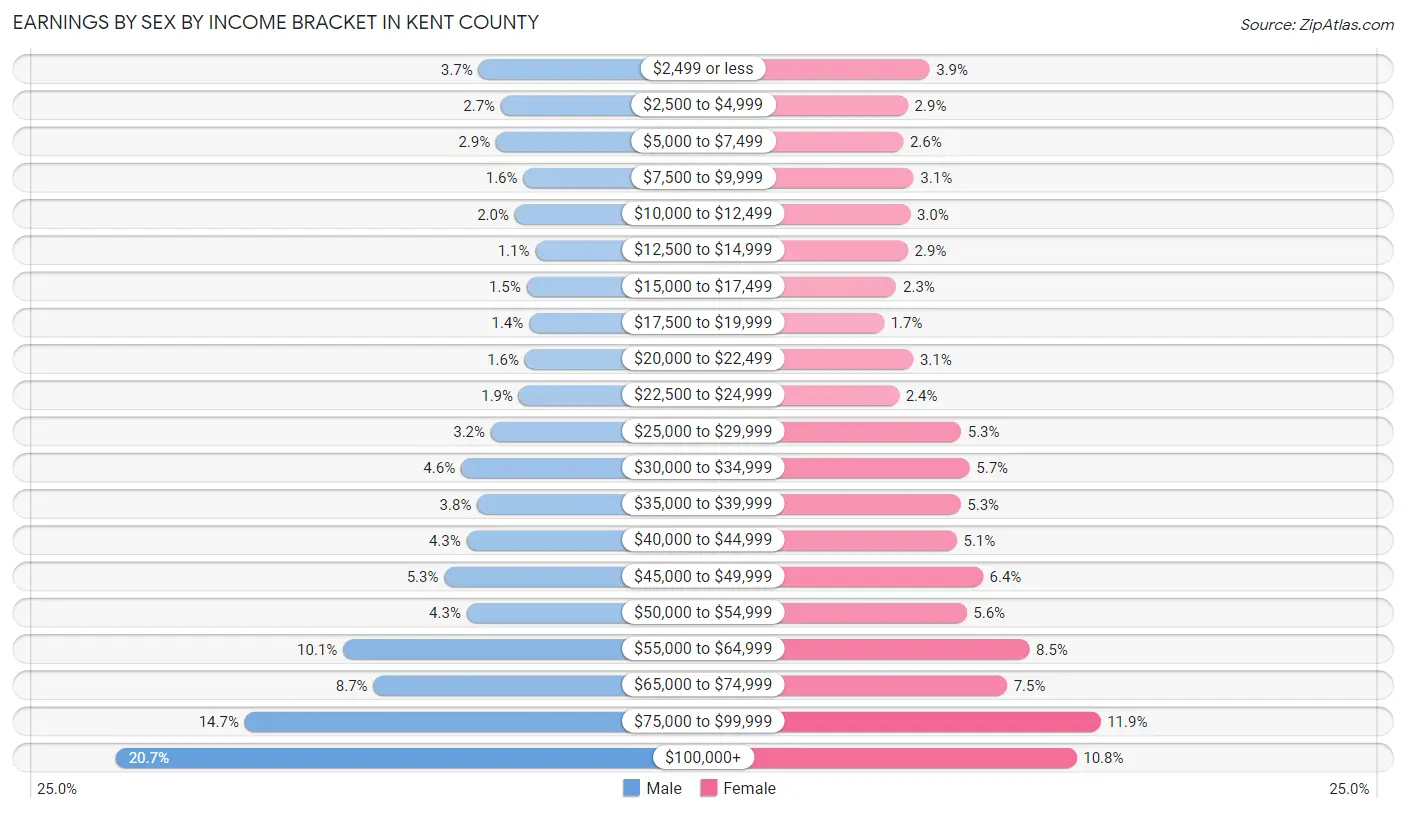
| Income | Male | Female |
| $2,499 or less | 1,884 (3.7%) | 1,801 (3.9%) |
| $2,500 to $4,999 | 1,356 (2.7%) | 1,330 (2.9%) |
| $5,000 to $7,499 | 1,470 (2.9%) | 1,228 (2.6%) |
| $7,500 to $9,999 | 826 (1.6%) | 1,456 (3.1%) |
| $10,000 to $12,499 | 1,027 (2.0%) | 1,380 (3.0%) |
| $12,500 to $14,999 | 543 (1.1%) | 1,328 (2.9%) |
| $15,000 to $17,499 | 752 (1.5%) | 1,078 (2.3%) |
| $17,500 to $19,999 | 692 (1.4%) | 808 (1.7%) |
| $20,000 to $22,499 | 790 (1.6%) | 1,445 (3.1%) |
| $22,500 to $24,999 | 932 (1.8%) | 1,133 (2.4%) |
| $25,000 to $29,999 | 1,593 (3.2%) | 2,489 (5.3%) |
| $30,000 to $34,999 | 2,301 (4.6%) | 2,674 (5.7%) |
| $35,000 to $39,999 | 1,917 (3.8%) | 2,479 (5.3%) |
| $40,000 to $44,999 | 2,166 (4.3%) | 2,397 (5.1%) |
| $45,000 to $49,999 | 2,693 (5.3%) | 2,967 (6.4%) |
| $50,000 to $54,999 | 2,164 (4.3%) | 2,609 (5.6%) |
| $55,000 to $64,999 | 5,082 (10.1%) | 3,981 (8.5%) |
| $65,000 to $74,999 | 4,368 (8.7%) | 3,494 (7.5%) |
| $75,000 to $99,999 | 7,408 (14.7%) | 5,533 (11.9%) |
| $100,000+ | 10,448 (20.7%) | 5,013 (10.7%) |
| Total | 50,412 (100.0%) | 46,623 (100.0%) |
Earnings by Sex by Educational Attainment in Kent County
Average earnings in Kent County are $64,282 for men and $49,274 for women, a difference of 23.4%. Men with an educational attainment of graduate degree enjoy the highest average annual earnings of $113,661, while those with less than high school education earn the least with $48,683. Women with an educational attainment of graduate degree earn the most with the average annual earnings of $86,299, while those with less than high school education have the smallest earnings of $27,298.
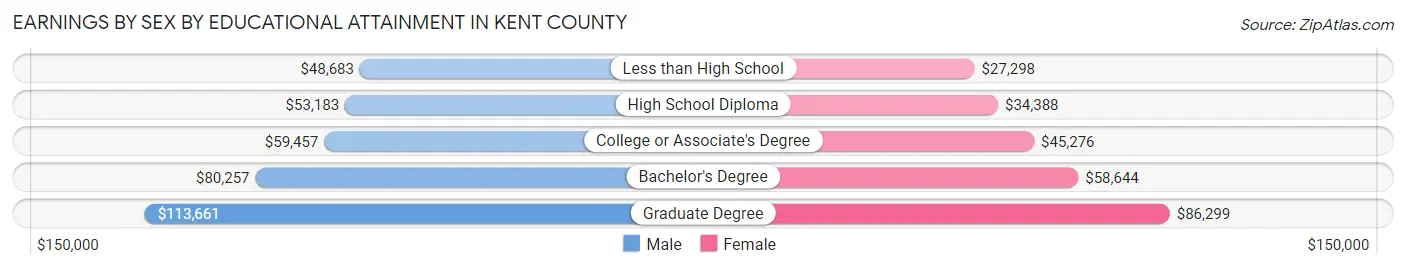
| Educational Attainment | Male Income | Female Income |
| Less than High School | $48,683 | $27,298 |
| High School Diploma | $53,183 | $34,388 |
| College or Associate's Degree | $59,457 | $45,276 |
| Bachelor's Degree | $80,257 | $58,644 |
| Graduate Degree | $113,661 | $86,299 |
| Total | $64,282 | $49,274 |
Family Income in Kent County
Family Income Brackets in Kent County
According to the Kent County family income data, there are 11,142 families falling into the $100,000 to $149,999 income range, which is the most common income bracket and makes up 24.8% of all families. Conversely, the $10,000 to $14,999 income bracket is the least frequent group with only 359 families (0.8%) belonging to this category.
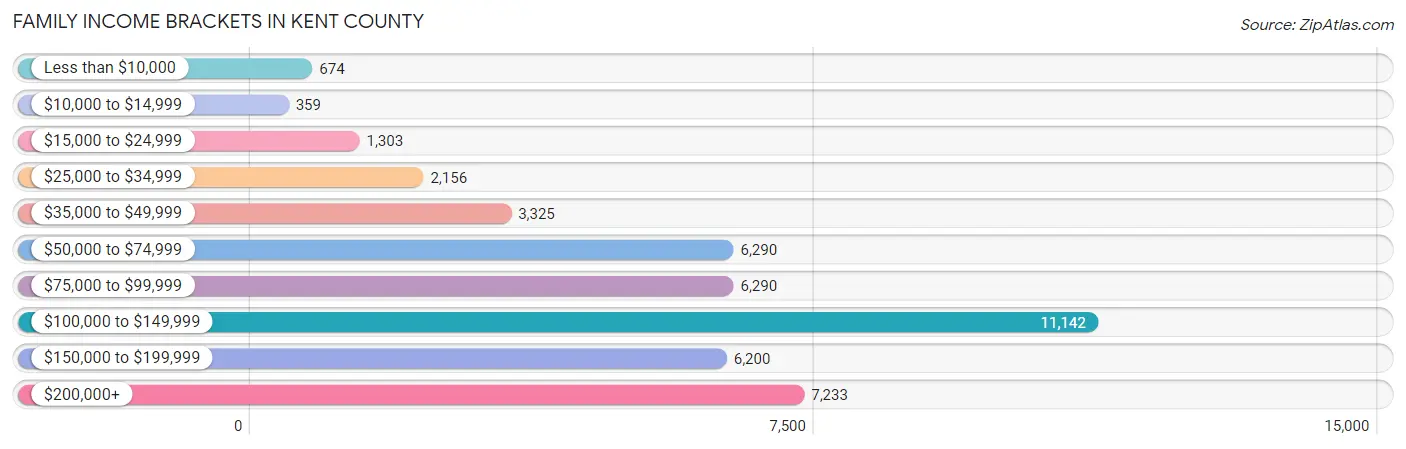
| Income Bracket | # Families | % Families |
| Less than $10,000 | 674 | 1.5% |
| $10,000 to $14,999 | 359 | 0.8% |
| $15,000 to $24,999 | 1,303 | 2.9% |
| $25,000 to $34,999 | 2,156 | 4.8% |
| $35,000 to $49,999 | 3,325 | 7.4% |
| $50,000 to $74,999 | 6,290 | 14.0% |
| $75,000 to $99,999 | 6,290 | 14.0% |
| $100,000 to $149,999 | 11,142 | 24.8% |
| $150,000 to $199,999 | 6,200 | 13.8% |
| $200,000+ | 7,233 | 16.1% |
Family Income by Famaliy Size in Kent County
7+ person families (364 | 0.8%) account for the highest median family income in Kent County with $177,234 per family, while 2-person families (21,661 | 48.2%) have the highest median income of $44,800 per family member.
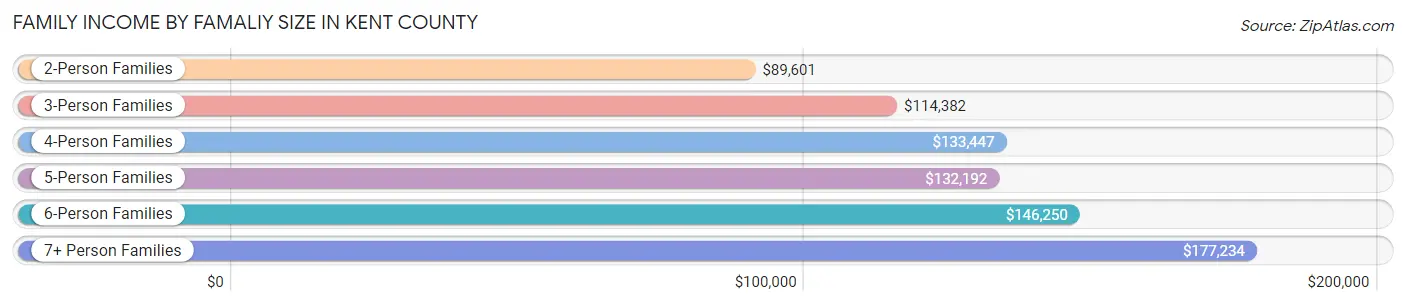
| Income Bracket | # Families | Median Income |
| 2-Person Families | 21,661 (48.2%) | $89,601 |
| 3-Person Families | 10,982 (24.4%) | $114,382 |
| 4-Person Families | 8,074 (18.0%) | $133,447 |
| 5-Person Families | 2,861 (6.4%) | $132,192 |
| 6-Person Families | 984 (2.2%) | $146,250 |
| 7+ Person Families | 364 (0.8%) | $177,234 |
| Total | 44,926 (100.0%) | $108,061 |
Family Income by Number of Earners in Kent County
The median family income in Kent County is $108,061, with families comprising 3+ earners (5,832) having the highest median family income of $167,807, while families with no earners (6,287) have the lowest median family income of $50,829, accounting for 13.0% and 14.0% of families, respectively.
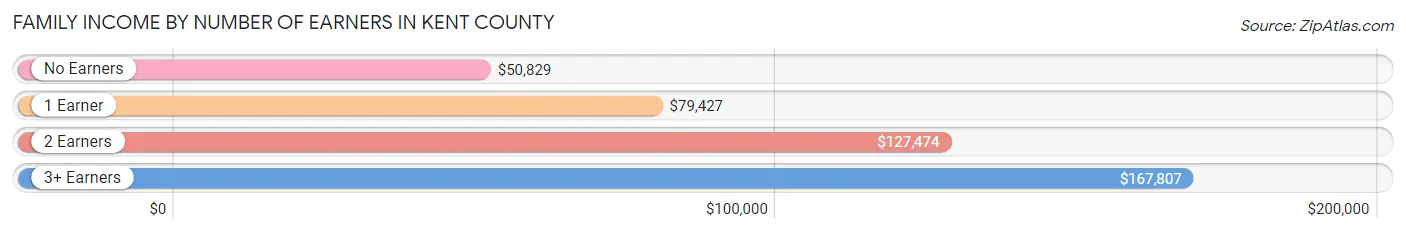
| Number of Earners | # Families | Median Income |
| No Earners | 6,287 (14.0%) | $50,829 |
| 1 Earner | 12,902 (28.7%) | $79,427 |
| 2 Earners | 19,905 (44.3%) | $127,474 |
| 3+ Earners | 5,832 (13.0%) | $167,807 |
| Total | 44,926 (100.0%) | $108,061 |
Household Income in Kent County
Household Income Brackets in Kent County
With 14,729 households falling in the category, the $100,000 to $149,999 income range is the most frequent in Kent County, accounting for 20.4% of all households. In contrast, only 2,238 households (3.1%) fall into the less than $10,000 income bracket, making it the least populous group.
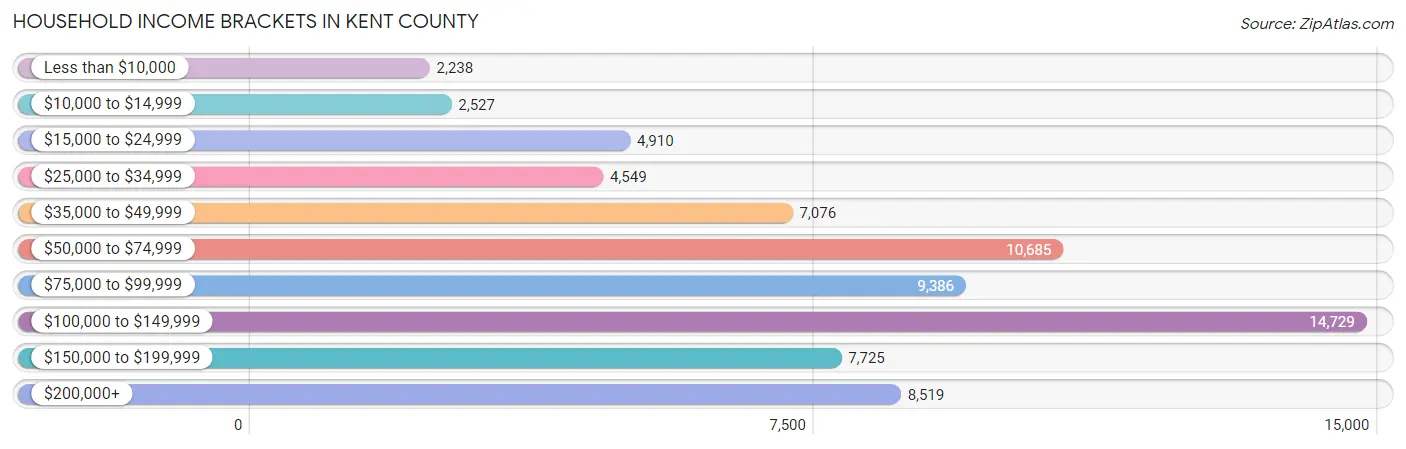
| Income Bracket | # Households | % Households |
| Less than $10,000 | 2,238 | 3.1% |
| $10,000 to $14,999 | 2,527 | 3.5% |
| $15,000 to $24,999 | 4,910 | 6.8% |
| $25,000 to $34,999 | 4,549 | 6.3% |
| $35,000 to $49,999 | 7,076 | 9.8% |
| $50,000 to $74,999 | 10,685 | 14.8% |
| $75,000 to $99,999 | 9,386 | 13.0% |
| $100,000 to $149,999 | 14,729 | 20.4% |
| $150,000 to $199,999 | 7,725 | 10.7% |
| $200,000+ | 8,519 | 11.8% |
Household Income by Householder Age in Kent County
The median household income in Kent County is $85,732, with the highest median household income of $106,510 found in the 45 to 64 years age bracket for the primary householder. A total of 29,177 households (40.4%) fall into this category. Meanwhile, the 65+ years age bracket for the primary householder has the lowest median household income of $51,807, with 20,991 households (29.1%) in this group.
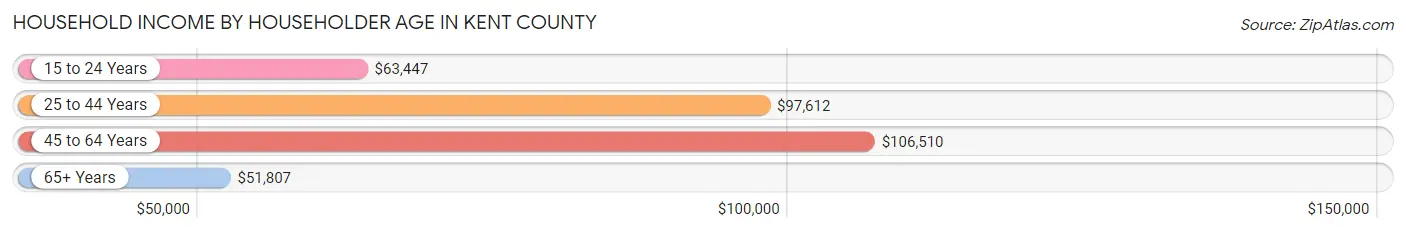
| Income Bracket | # Households | Median Income |
| 15 to 24 Years | 1,121 (1.5%) | $63,447 |
| 25 to 44 Years | 20,910 (29.0%) | $97,612 |
| 45 to 64 Years | 29,177 (40.4%) | $106,510 |
| 65+ Years | 20,991 (29.1%) | $51,807 |
| Total | 72,199 (100.0%) | $85,732 |
Poverty in Kent County
Income Below Poverty by Sex and Age in Kent County
With 6.7% poverty level for males and 8.2% for females among the residents of Kent County, 55 to 64 year old males and 15 year old females are the most vulnerable to poverty, with 1,145 males (9.0%) and 132 females (14.4%) in their respective age groups living below the poverty level.
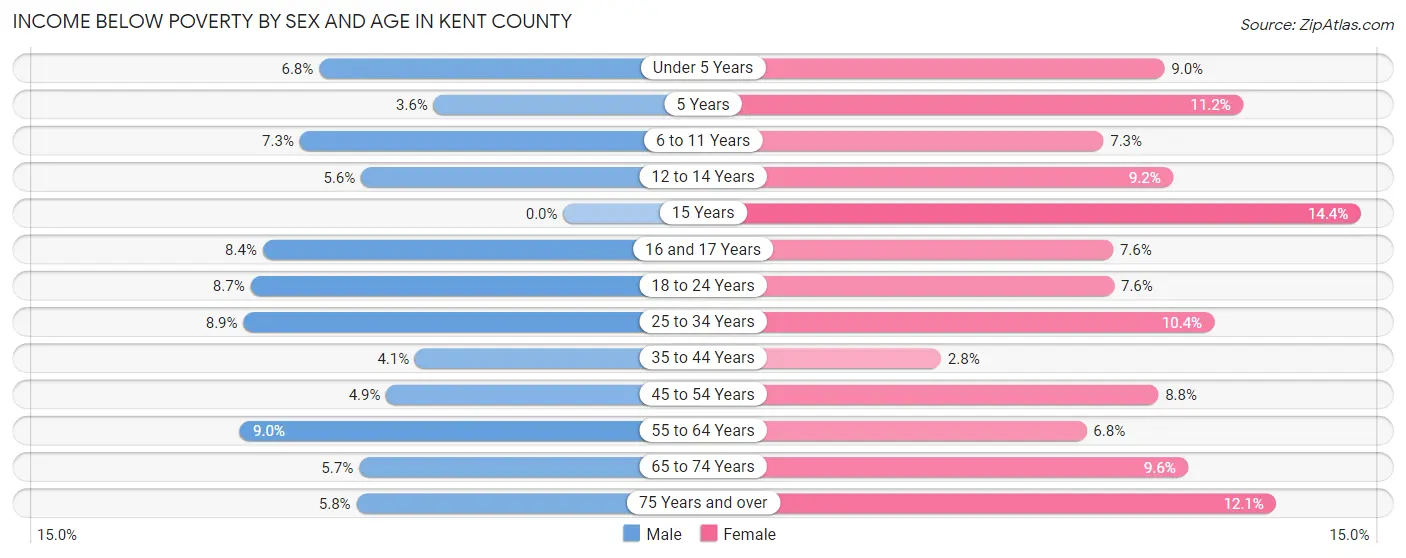
| Age Bracket | Male | Female |
| Under 5 Years | 280 (6.8%) | 339 (9.0%) |
| 5 Years | 27 (3.6%) | 106 (11.2%) |
| 6 to 11 Years | 412 (7.3%) | 385 (7.3%) |
| 12 to 14 Years | 134 (5.6%) | 196 (9.2%) |
| 15 Years | 0 (0.0%) | 132 (14.4%) |
| 16 and 17 Years | 181 (8.4%) | 139 (7.5%) |
| 18 to 24 Years | 550 (8.7%) | 450 (7.6%) |
| 25 to 34 Years | 1,031 (8.9%) | 1,155 (10.4%) |
| 35 to 44 Years | 450 (4.1%) | 293 (2.8%) |
| 45 to 54 Years | 551 (4.9%) | 1,008 (8.8%) |
| 55 to 64 Years | 1,145 (9.0%) | 936 (6.8%) |
| 65 to 74 Years | 506 (5.7%) | 999 (9.6%) |
| 75 Years and over | 296 (5.8%) | 954 (12.1%) |
| Total | 5,563 (6.7%) | 7,092 (8.2%) |
Income Above Poverty by Sex and Age in Kent County
According to the poverty statistics in Kent County, males aged 15 years and females aged 35 to 44 years are the age groups that are most secure financially, with 100.0% of males and 97.2% of females in these age groups living above the poverty line.
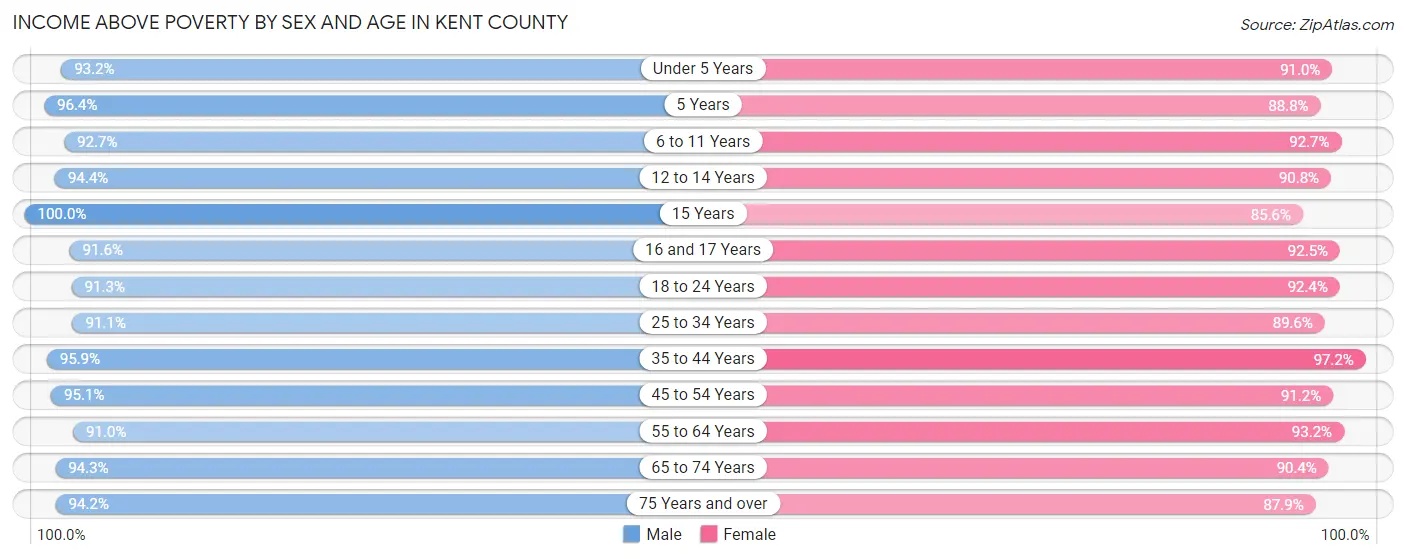
| Age Bracket | Male | Female |
| Under 5 Years | 3,835 (93.2%) | 3,434 (91.0%) |
| 5 Years | 721 (96.4%) | 844 (88.8%) |
| 6 to 11 Years | 5,199 (92.7%) | 4,906 (92.7%) |
| 12 to 14 Years | 2,248 (94.4%) | 1,931 (90.8%) |
| 15 Years | 854 (100.0%) | 783 (85.6%) |
| 16 and 17 Years | 1,982 (91.6%) | 1,701 (92.4%) |
| 18 to 24 Years | 5,762 (91.3%) | 5,485 (92.4%) |
| 25 to 34 Years | 10,542 (91.1%) | 9,994 (89.6%) |
| 35 to 44 Years | 10,445 (95.9%) | 10,329 (97.2%) |
| 45 to 54 Years | 10,616 (95.1%) | 10,439 (91.2%) |
| 55 to 64 Years | 11,584 (91.0%) | 12,805 (93.2%) |
| 65 to 74 Years | 8,381 (94.3%) | 9,373 (90.4%) |
| 75 Years and over | 4,840 (94.2%) | 6,944 (87.9%) |
| Total | 77,009 (93.3%) | 78,968 (91.8%) |
Income Below Poverty Among Married-Couple Families in Kent County
The poverty statistics for married-couple families in Kent County show that 1.9% or 640 of the total 33,647 families live below the poverty line. Families with 3 or 4 children have the highest poverty rate of 2.2%, comprising of 40 families. On the other hand, families with 5 or more children have the lowest poverty rate of 0.0%, which includes 0 families.
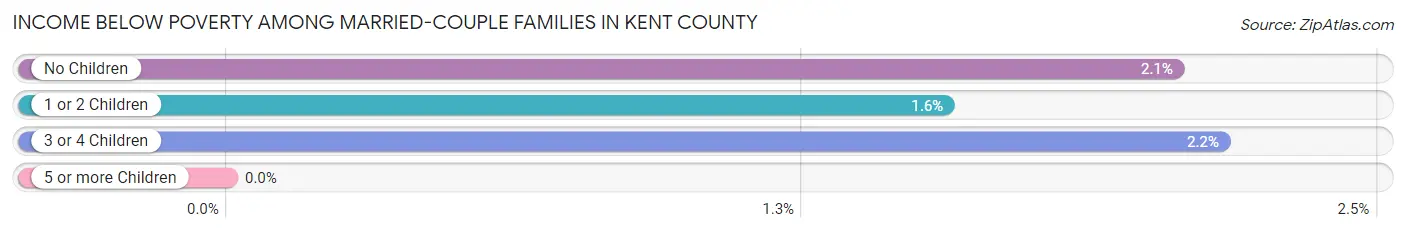
| Children | Above Poverty | Below Poverty |
| No Children | 20,472 (97.9%) | 431 (2.1%) |
| 1 or 2 Children | 10,631 (98.4%) | 169 (1.6%) |
| 3 or 4 Children | 1,813 (97.8%) | 40 (2.2%) |
| 5 or more Children | 91 (100.0%) | 0 (0.0%) |
| Total | 33,007 (98.1%) | 640 (1.9%) |
Income Below Poverty Among Single-Parent Households in Kent County
According to the poverty data in Kent County, 11.0% or 379 single-father households and 11.4% or 890 single-mother households are living below the poverty line. Among single-father households, those with 3 or 4 children have the highest poverty rate, with 173 households (80.5%) experiencing poverty. Likewise, among single-mother households, those with 3 or 4 children have the highest poverty rate, with 146 households (35.5%) falling below the poverty line.
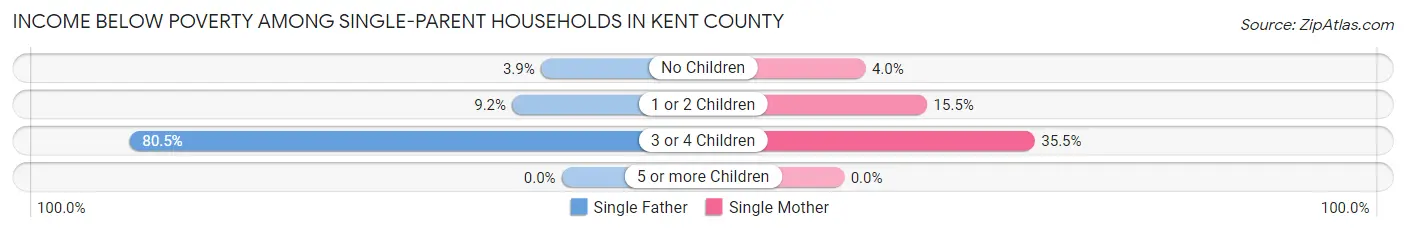
| Children | Single Father | Single Mother |
| No Children | 68 (3.9%) | 139 (4.0%) |
| 1 or 2 Children | 138 (9.2%) | 605 (15.5%) |
| 3 or 4 Children | 173 (80.5%) | 146 (35.5%) |
| 5 or more Children | 0 (0.0%) | 0 (0.0%) |
| Total | 379 (11.0%) | 890 (11.4%) |
Income Below Poverty Among Married-Couple vs Single-Parent Households in Kent County
The poverty data for Kent County shows that 640 of the married-couple family households (1.9%) and 1,269 of the single-parent households (11.3%) are living below the poverty level. Within the married-couple family households, those with 3 or 4 children have the highest poverty rate, with 40 households (2.2%) falling below the poverty line. Among the single-parent households, those with 3 or 4 children have the highest poverty rate, with 319 household (51.0%) living below poverty.
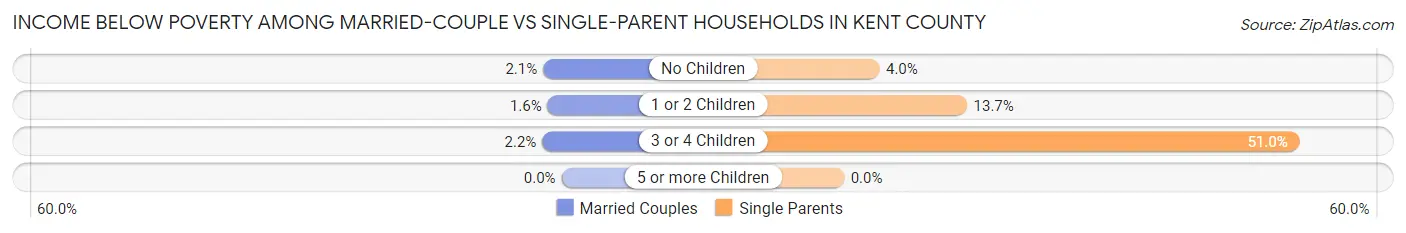
| Children | Married-Couple Families | Single-Parent Households |
| No Children | 431 (2.1%) | 207 (4.0%) |
| 1 or 2 Children | 169 (1.6%) | 743 (13.7%) |
| 3 or 4 Children | 40 (2.2%) | 319 (51.0%) |
| 5 or more Children | 0 (0.0%) | 0 (0.0%) |
| Total | 640 (1.9%) | 1,269 (11.3%) |
Race in Kent County
The most populous races in Kent County are White / Caucasian (149,362 | 87.8%), Hispanic or Latino (10,712 | 6.3%), and Two or more Races (8,449 | 5.0%).
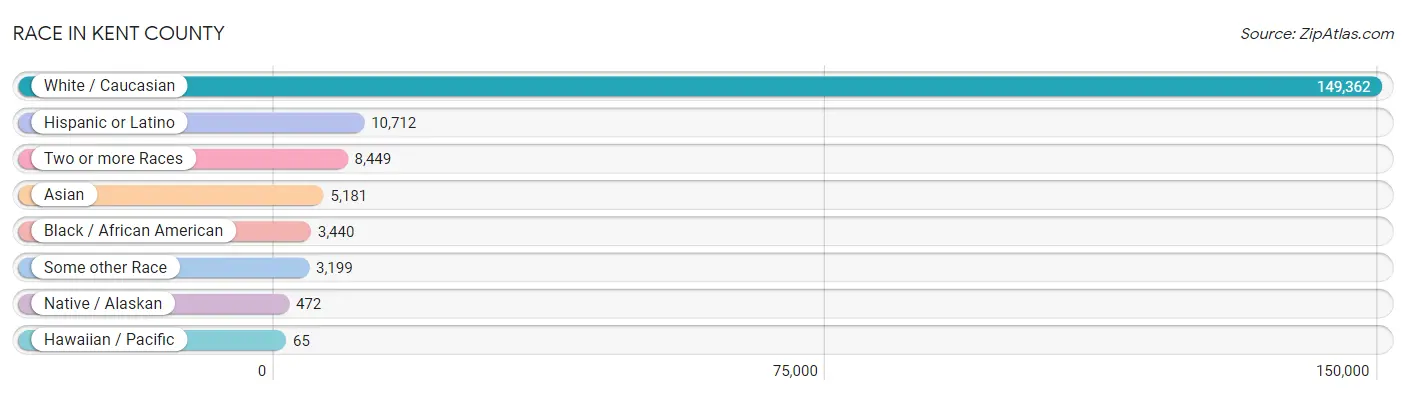
| Race | # Population | % Population |
| Asian | 5,181 | 3.0% |
| Black / African American | 3,440 | 2.0% |
| Hawaiian / Pacific | 65 | 0.0% |
| Hispanic or Latino | 10,712 | 6.3% |
| Native / Alaskan | 472 | 0.3% |
| White / Caucasian | 149,362 | 87.8% |
| Two or more Races | 8,449 | 5.0% |
| Some other Race | 3,199 | 1.9% |
| Total | 170,168 | 100.0% |
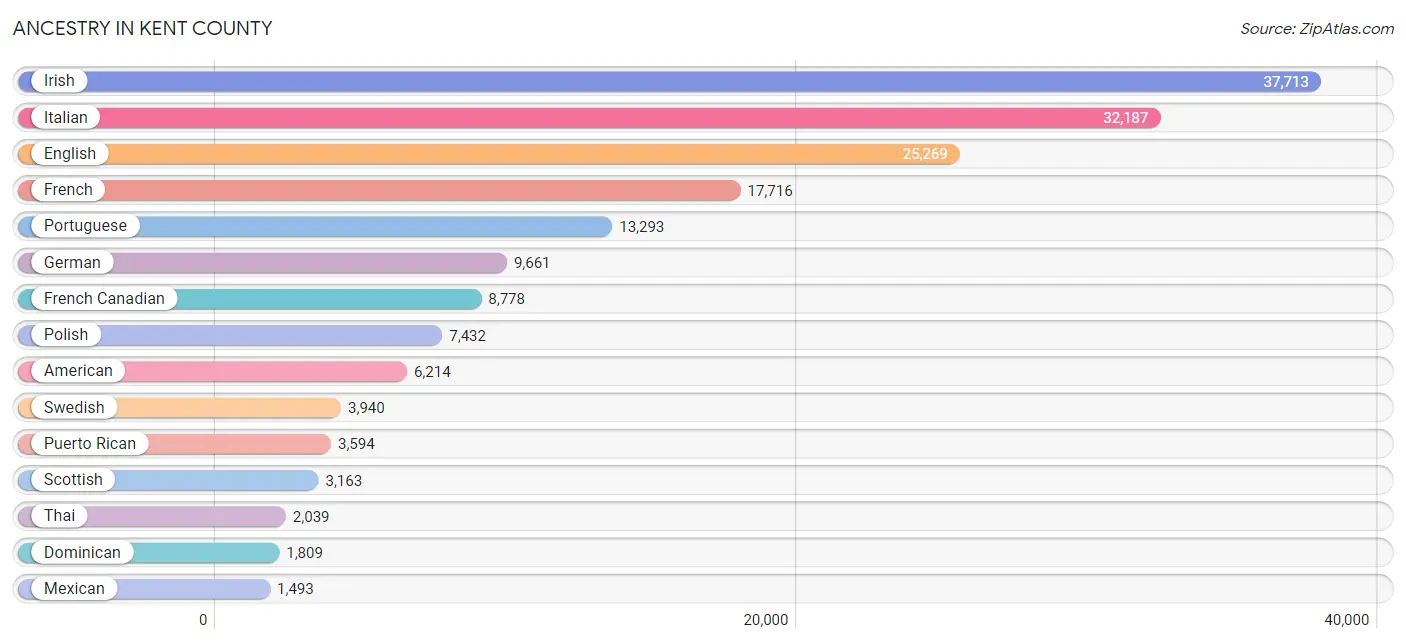
Ancestry in Kent County
The most populous ancestries reported in Kent County are Irish (37,713 | 22.2%), Italian (32,187 | 18.9%), English (25,269 | 14.8%), French (17,716 | 10.4%), and Portuguese (13,293 | 7.8%), together accounting for 74.1% of all Kent County residents.
| Ancestry | # Population | % Population |
| African | 329 | 0.2% |
| Albanian | 76 | 0.0% |
| American | 6,214 | 3.6% |
| Apache | 58 | 0.0% |
| Arab | 893 | 0.5% |
| Arapaho | 10 | 0.0% |
| Argentinean | 29 | 0.0% |
| Armenian | 948 | 0.6% |
| Australian | 86 | 0.1% |
| Austrian | 439 | 0.3% |
| Bahamian | 13 | 0.0% |
| Bangladeshi | 156 | 0.1% |
| Belgian | 167 | 0.1% |
| Bermudan | 23 | 0.0% |
| Bhutanese | 376 | 0.2% |
| Blackfeet | 41 | 0.0% |
| Bolivian | 244 | 0.1% |
| Brazilian | 249 | 0.2% |
| British | 1,012 | 0.6% |
| Burmese | 375 | 0.2% |
| Canadian | 357 | 0.2% |
| Cape Verdean | 852 | 0.5% |
| Celtic | 13 | 0.0% |
| Central American | 1,140 | 0.7% |
| Central American Indian | 179 | 0.1% |
| Cherokee | 220 | 0.1% |
| Chilean | 103 | 0.1% |
| Chinese | 25 | 0.0% |
| Chippewa | 14 | 0.0% |
| Choctaw | 5 | 0.0% |
| Colombian | 692 | 0.4% |
| Cree | 8 | 0.0% |
| Creek | 41 | 0.0% |
| Croatian | 98 | 0.1% |
| Cuban | 521 | 0.3% |
| Cypriot | 20 | 0.0% |
| Czech | 112 | 0.1% |
| Czechoslovakian | 5 | 0.0% |
| Danish | 114 | 0.1% |
| Dominican | 1,809 | 1.1% |
| Dutch | 1,087 | 0.6% |
| Dutch West Indian | 9 | 0.0% |
| Eastern European | 618 | 0.4% |
| Ecuadorian | 16 | 0.0% |
| Egyptian | 25 | 0.0% |
| English | 25,269 | 14.8% |
| Ethiopian | 4 | 0.0% |
| European | 1,200 | 0.7% |
| Filipino | 316 | 0.2% |
| Finnish | 137 | 0.1% |
| French | 17,716 | 10.4% |
| French American Indian | 56 | 0.0% |
| French Canadian | 8,778 | 5.2% |
| German | 9,661 | 5.7% |
| Greek | 869 | 0.5% |
| Guatemalan | 671 | 0.4% |
| Haitian | 487 | 0.3% |
| Honduran | 44 | 0.0% |
| Hungarian | 295 | 0.2% |
| Icelander | 20 | 0.0% |
| Indian (Asian) | 902 | 0.5% |
| Iranian | 75 | 0.0% |
| Irish | 37,713 | 22.2% |
| Iroquois | 77 | 0.1% |
| Israeli | 9 | 0.0% |
| Italian | 32,187 | 18.9% |
| Jamaican | 577 | 0.3% |
| Japanese | 444 | 0.3% |
| Jordanian | 6 | 0.0% |
| Korean | 1,028 | 0.6% |
| Latvian | 22 | 0.0% |
| Lebanese | 138 | 0.1% |
| Liberian | 52 | 0.0% |
| Lithuanian | 649 | 0.4% |
| Macedonian | 40 | 0.0% |
| Malaysian | 212 | 0.1% |
| Mexican | 1,493 | 0.9% |
| Mexican American Indian | 58 | 0.0% |
| Moroccan | 289 | 0.2% |
| Native Hawaiian | 13 | 0.0% |
| Navajo | 23 | 0.0% |
| Nigerian | 94 | 0.1% |
| Northern European | 81 | 0.1% |
| Norwegian | 357 | 0.2% |
| Ottawa | 2 | 0.0% |
| Pakistani | 118 | 0.1% |
| Palestinian | 30 | 0.0% |
| Panamanian | 219 | 0.1% |
| Pennsylvania German | 29 | 0.0% |
| Peruvian | 149 | 0.1% |
| Polish | 7,432 | 4.4% |
| Portuguese | 13,293 | 7.8% |
| Pueblo | 10 | 0.0% |
| Puerto Rican | 3,594 | 2.1% |
| Romanian | 89 | 0.1% |
| Russian | 1,205 | 0.7% |
| Salvadoran | 111 | 0.1% |
| Scandinavian | 183 | 0.1% |
| Scotch-Irish | 749 | 0.4% |
| Scottish | 3,163 | 1.9% |
| Senegalese | 96 | 0.1% |
| Slavic | 10 | 0.0% |
| Slovak | 191 | 0.1% |
| Slovene | 18 | 0.0% |
| South African | 15 | 0.0% |
| South American | 1,281 | 0.7% |
| Spaniard | 96 | 0.1% |
| Spanish | 417 | 0.3% |
| Sri Lankan | 257 | 0.2% |
| Subsaharan African | 1,456 | 0.9% |
| Swedish | 3,940 | 2.3% |
| Swiss | 193 | 0.1% |
| Syrian | 144 | 0.1% |
| Thai | 2,039 | 1.2% |
| Turkish | 177 | 0.1% |
| Ukrainian | 522 | 0.3% |
| Venezuelan | 48 | 0.0% |
| Welsh | 436 | 0.3% |
| West Indian | 75 | 0.0% |
| Yaqui | 14 | 0.0% | View All 120 Rows |
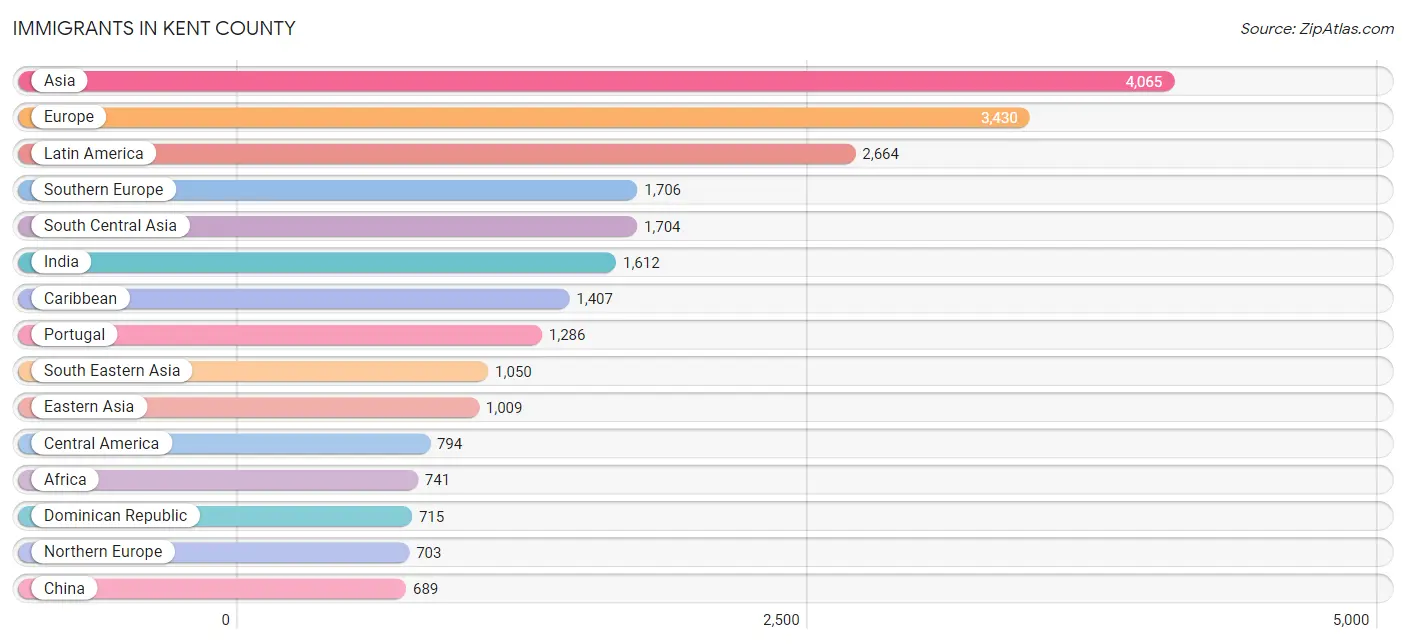
Immigrants in Kent County
The most numerous immigrant groups reported in Kent County came from Asia (4,065 | 2.4%), Europe (3,430 | 2.0%), Latin America (2,664 | 1.6%), Southern Europe (1,706 | 1.0%), and South Central Asia (1,704 | 1.0%), together accounting for 8.0% of all Kent County residents.
| Immigration Origin | # Population | % Population |
| Africa | 741 | 0.4% |
| Albania | 68 | 0.0% |
| Argentina | 13 | 0.0% |
| Armenia | 9 | 0.0% |
| Asia | 4,065 | 2.4% |
| Australia | 31 | 0.0% |
| Austria | 30 | 0.0% |
| Azores | 294 | 0.2% |
| Belarus | 13 | 0.0% |
| Belgium | 3 | 0.0% |
| Bolivia | 54 | 0.0% |
| Brazil | 186 | 0.1% |
| Cabo Verde | 200 | 0.1% |
| Cambodia | 162 | 0.1% |
| Cameroon | 31 | 0.0% |
| Canada | 370 | 0.2% |
| Caribbean | 1,407 | 0.8% |
| Central America | 794 | 0.5% |
| Chile | 25 | 0.0% |
| China | 689 | 0.4% |
| Colombia | 100 | 0.1% |
| Cuba | 117 | 0.1% |
| Denmark | 20 | 0.0% |
| Dominican Republic | 715 | 0.4% |
| Eastern Asia | 1,009 | 0.6% |
| Eastern Europe | 610 | 0.4% |
| Egypt | 58 | 0.0% |
| El Salvador | 125 | 0.1% |
| England | 283 | 0.2% |
| Europe | 3,430 | 2.0% |
| France | 64 | 0.0% |
| Germany | 257 | 0.2% |
| Greece | 41 | 0.0% |
| Guatemala | 276 | 0.2% |
| Haiti | 444 | 0.3% |
| Hong Kong | 88 | 0.1% |
| Hungary | 11 | 0.0% |
| India | 1,612 | 0.9% |
| Iran | 49 | 0.0% |
| Ireland | 129 | 0.1% |
| Israel | 12 | 0.0% |
| Italy | 379 | 0.2% |
| Jamaica | 115 | 0.1% |
| Japan | 164 | 0.1% |
| Jordan | 45 | 0.0% |
| Korea | 156 | 0.1% |
| Kuwait | 26 | 0.0% |
| Laos | 197 | 0.1% |
| Latin America | 2,664 | 1.6% |
| Lebanon | 45 | 0.0% |
| Liberia | 22 | 0.0% |
| Mexico | 393 | 0.2% |
| Middle Africa | 49 | 0.0% |
| Morocco | 83 | 0.1% |
| Netherlands | 57 | 0.0% |
| Nigeria | 53 | 0.0% |
| Northern Africa | 141 | 0.1% |
| Northern Europe | 703 | 0.4% |
| Oceania | 31 | 0.0% |
| Pakistan | 43 | 0.0% |
| Peru | 37 | 0.0% |
| Philippines | 524 | 0.3% |
| Poland | 117 | 0.1% |
| Portugal | 1,286 | 0.8% |
| Romania | 28 | 0.0% |
| Russia | 208 | 0.1% |
| Scotland | 226 | 0.1% |
| Senegal | 106 | 0.1% |
| Serbia | 19 | 0.0% |
| South Africa | 61 | 0.0% |
| South America | 463 | 0.3% |
| South Central Asia | 1,704 | 1.0% |
| South Eastern Asia | 1,050 | 0.6% |
| Southern Europe | 1,706 | 1.0% |
| Sweden | 12 | 0.0% |
| Syria | 73 | 0.0% |
| Taiwan | 96 | 0.1% |
| Thailand | 105 | 0.1% |
| Trinidad and Tobago | 16 | 0.0% |
| Turkey | 49 | 0.0% |
| Ukraine | 135 | 0.1% |
| Venezuela | 48 | 0.0% |
| Vietnam | 62 | 0.0% |
| Western Africa | 381 | 0.2% |
| Western Asia | 302 | 0.2% |
| Western Europe | 411 | 0.2% | View All 86 Rows |
Sex and Age in Kent County
Sex and Age in Kent County
The most populous age groups in Kent County are 55 to 59 Years (6,675 | 8.0%) for men and 60 to 64 Years (7,131 | 8.2%) for women.
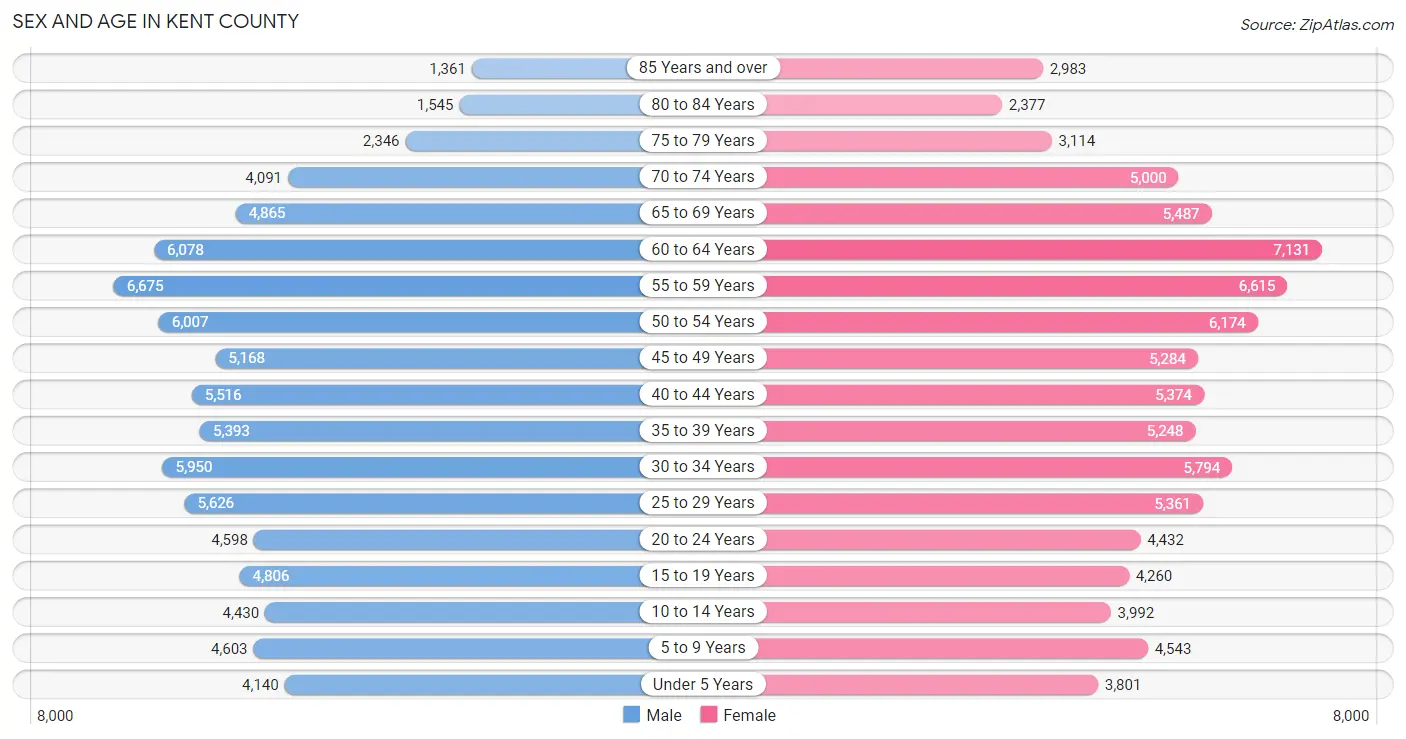
| Age Bracket | Male | Female |
| Under 5 Years | 4,140 (5.0%) | 3,801 (4.4%) |
| 5 to 9 Years | 4,603 (5.5%) | 4,543 (5.2%) |
| 10 to 14 Years | 4,430 (5.3%) | 3,992 (4.6%) |
| 15 to 19 Years | 4,806 (5.8%) | 4,260 (4.9%) |
| 20 to 24 Years | 4,598 (5.5%) | 4,432 (5.1%) |
| 25 to 29 Years | 5,626 (6.8%) | 5,361 (6.2%) |
| 30 to 34 Years | 5,950 (7.1%) | 5,794 (6.7%) |
| 35 to 39 Years | 5,393 (6.5%) | 5,248 (6.0%) |
| 40 to 44 Years | 5,516 (6.6%) | 5,374 (6.2%) |
| 45 to 49 Years | 5,168 (6.2%) | 5,284 (6.1%) |
| 50 to 54 Years | 6,007 (7.2%) | 6,174 (7.1%) |
| 55 to 59 Years | 6,675 (8.0%) | 6,615 (7.6%) |
| 60 to 64 Years | 6,078 (7.3%) | 7,131 (8.2%) |
| 65 to 69 Years | 4,865 (5.9%) | 5,487 (6.3%) |
| 70 to 74 Years | 4,091 (4.9%) | 5,000 (5.8%) |
| 75 to 79 Years | 2,346 (2.8%) | 3,114 (3.6%) |
| 80 to 84 Years | 1,545 (1.9%) | 2,377 (2.7%) |
| 85 Years and over | 1,361 (1.6%) | 2,983 (3.4%) |
| Total | 83,198 (100.0%) | 86,970 (100.0%) |
Families and Households in Kent County
Median Family Size in Kent County
The median family size in Kent County is 2.91 persons per family, with married-couple families (33,647 | 74.9%) accounting for the largest median family size of 3.02 persons per family. On the other hand, single female/mother families (7,821 | 17.4%) represent the smallest median family size with 2.58 persons per family.
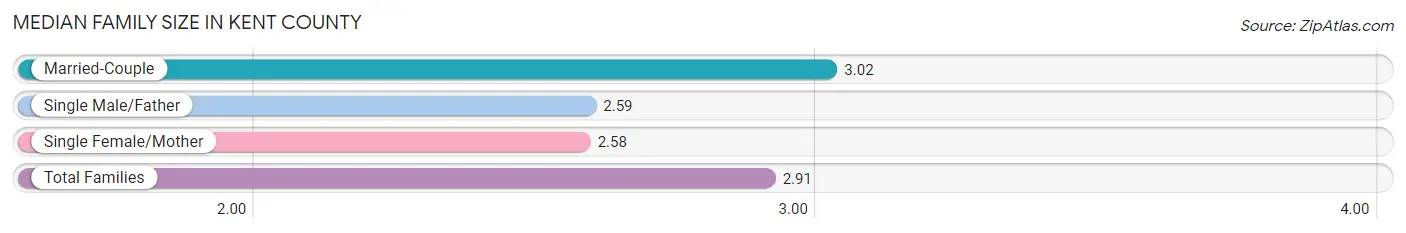
| Family Type | # Families | Family Size |
| Married-Couple | 33,647 (74.9%) | 3.02 |
| Single Male/Father | 3,458 (7.7%) | 2.59 |
| Single Female/Mother | 7,821 (17.4%) | 2.58 |
| Total Families | 44,926 (100.0%) | 2.91 |
Median Household Size in Kent County
The median household size in Kent County is 2.33 persons per household, with married-couple households (33,647 | 46.6%) accounting for the largest median household size of 3.05 persons per household. non-family households (27,273 | 37.8%) represent the smallest median household size with 1.23 persons per household.
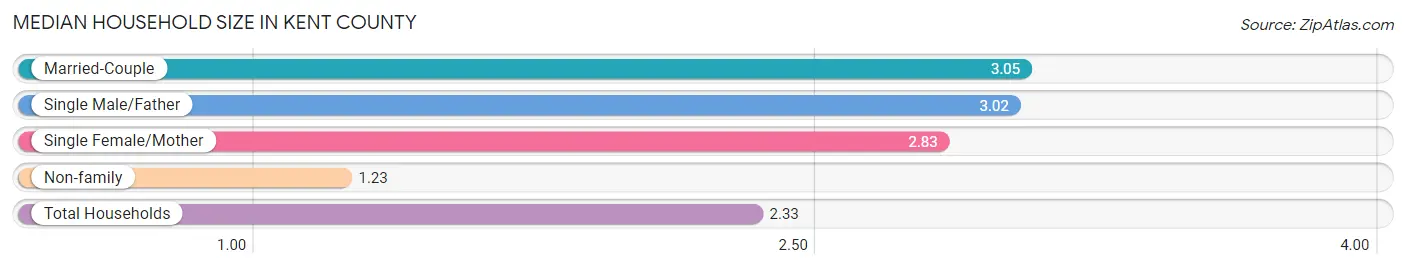
| Household Type | # Households | Household Size |
| Married-Couple | 33,647 (46.6%) | 3.05 |
| Single Male/Father | 3,458 (4.8%) | 3.02 |
| Single Female/Mother | 7,821 (10.8%) | 2.83 |
| Non-family | 27,273 (37.8%) | 1.23 |
| Total Households | 72,199 (100.0%) | 2.33 |
Household Size by Marriage Status in Kent County
Out of a total of 72,199 households in Kent County, 44,926 (62.2%) are family households, while 27,273 (37.8%) are nonfamily households. The most numerous type of family households are 2-person households, comprising 20,059, and the most common type of nonfamily households are 1-person households, comprising 21,409.
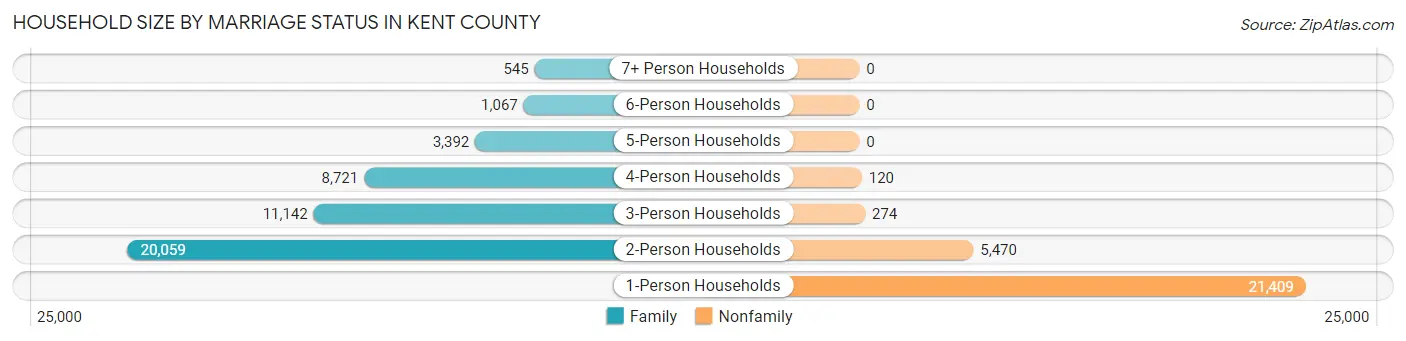
| Household Size | Family Households | Nonfamily Households |
| 1-Person Households | - | 21,409 (29.6%) |
| 2-Person Households | 20,059 (27.8%) | 5,470 (7.6%) |
| 3-Person Households | 11,142 (15.4%) | 274 (0.4%) |
| 4-Person Households | 8,721 (12.1%) | 120 (0.2%) |
| 5-Person Households | 3,392 (4.7%) | 0 (0.0%) |
| 6-Person Households | 1,067 (1.5%) | 0 (0.0%) |
| 7+ Person Households | 545 (0.7%) | 0 (0.0%) |
| Total | 44,926 (62.2%) | 27,273 (37.8%) |
Female Fertility in Kent County
Fertility by Age in Kent County
Average fertility rate in Kent County is 58.0 births per 1,000 women. Women in the age bracket of 20 to 34 years have the highest fertility rate with 97.0 births per 1,000 women. Women in the age bracket of 20 to 34 years acount for 70.2% of all women with births.
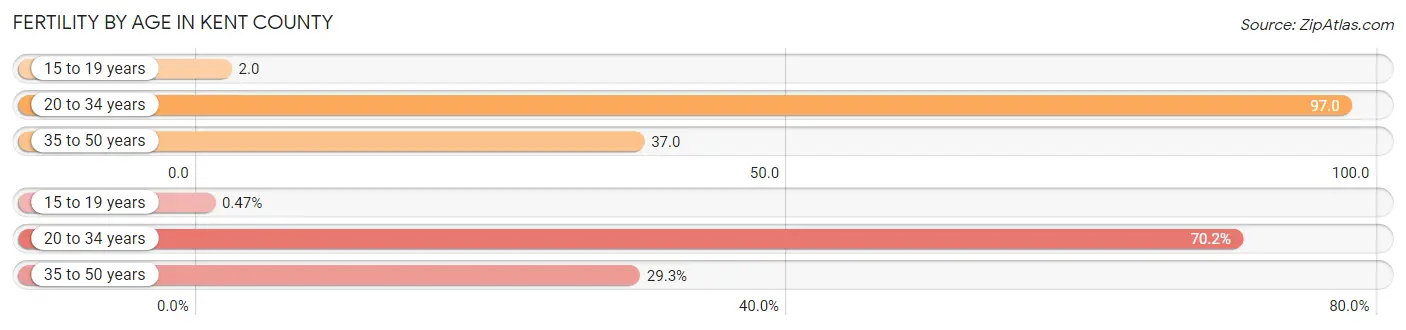
| Age Bracket | Women with Births | Births / 1,000 Women |
| 15 to 19 years | 10 (0.5%) | 2.0 |
| 20 to 34 years | 1,507 (70.2%) | 97.0 |
| 35 to 50 years | 629 (29.3%) | 37.0 |
| Total | 2,146 (100.0%) | 58.0 |
Fertility by Age by Marriage Status in Kent County
71.2% of women with births (2,146) in Kent County are married. The highest percentage of unmarried women with births falls into 15 to 19 years age bracket with 100.0% of them unmarried at the time of birth, while the lowest percentage of unmarried women with births belong to 35 to 50 years age bracket with 26.1% of them unmarried.
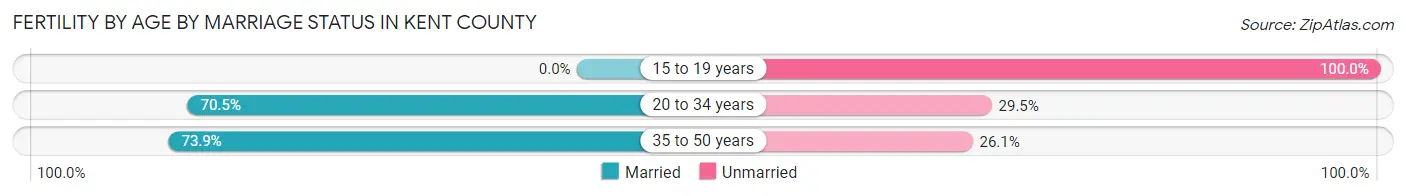
| Age Bracket | Married | Unmarried |
| 15 to 19 years | 0 (0.0%) | 10 (100.0%) |
| 20 to 34 years | 1,062 (70.5%) | 445 (29.5%) |
| 35 to 50 years | 465 (73.9%) | 164 (26.1%) |
| Total | 1,528 (71.2%) | 618 (28.8%) |
Fertility by Education in Kent County
Average fertility rate in Kent County is 58.0 births per 1,000 women. Women with the education attainment of graduate degree have the highest fertility rate of 118.0 births per 1,000 women, while women with the education attainment of less than high school have the lowest fertility at 3.0 births per 1,000 women. Women with the education attainment of bachelor's degree represent 30.4% of all women with births.
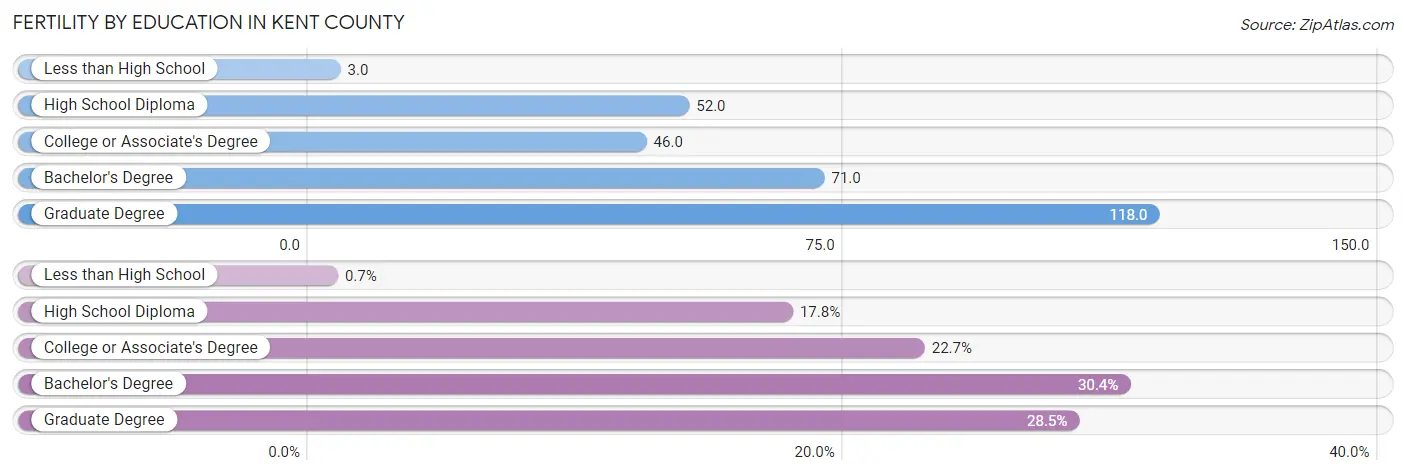
| Educational Attainment | Women with Births | Births / 1,000 Women |
| Less than High School | 15 (0.7%) | 3.0 |
| High School Diploma | 381 (17.7%) | 52.0 |
| College or Associate's Degree | 487 (22.7%) | 46.0 |
| Bachelor's Degree | 652 (30.4%) | 71.0 |
| Graduate Degree | 611 (28.5%) | 118.0 |
| Total | 2,146 (100.0%) | 58.0 |
Fertility by Education by Marriage Status in Kent County
28.8% of women with births in Kent County are unmarried. Women with the educational attainment of less than high school are most likely to be married with 100.0% of them married at childbirth, while women with the educational attainment of high school diploma are least likely to be married with 79.5% of them unmarried at childbirth.
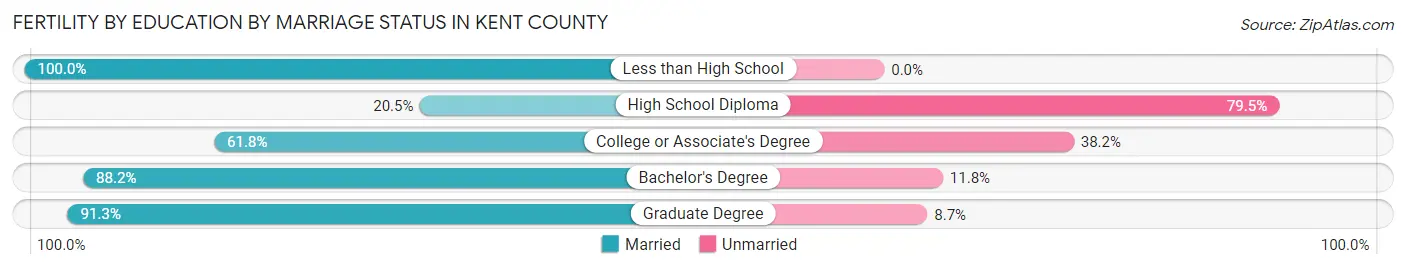
| Educational Attainment | Married | Unmarried |
| Less than High School | 15 (100.0%) | 0 (0.0%) |
| High School Diploma | 78 (20.5%) | 303 (79.5%) |
| College or Associate's Degree | 301 (61.8%) | 186 (38.2%) |
| Bachelor's Degree | 575 (88.2%) | 77 (11.8%) |
| Graduate Degree | 558 (91.3%) | 53 (8.7%) |
| Total | 1,528 (71.2%) | 618 (28.8%) |
Employment Characteristics in Kent County
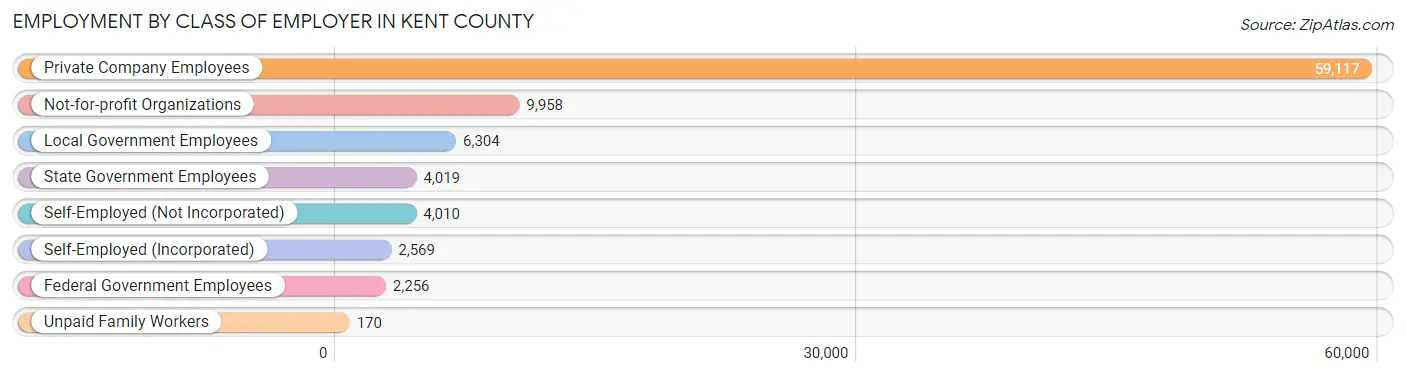
Employment by Class of Employer in Kent County
Among the 88,403 employed individuals in Kent County, private company employees (59,117 | 66.9%), not-for-profit organizations (9,958 | 11.3%), and local government employees (6,304 | 7.1%) make up the most common classes of employment.
| Employer Class | # Employees | % Employees |
| Private Company Employees | 59,117 | 66.9% |
| Self-Employed (Incorporated) | 2,569 | 2.9% |
| Self-Employed (Not Incorporated) | 4,010 | 4.5% |
| Not-for-profit Organizations | 9,958 | 11.3% |
| Local Government Employees | 6,304 | 7.1% |
| State Government Employees | 4,019 | 4.5% |
| Federal Government Employees | 2,256 | 2.5% |
| Unpaid Family Workers | 170 | 0.2% |
| Total | 88,403 | 100.0% |
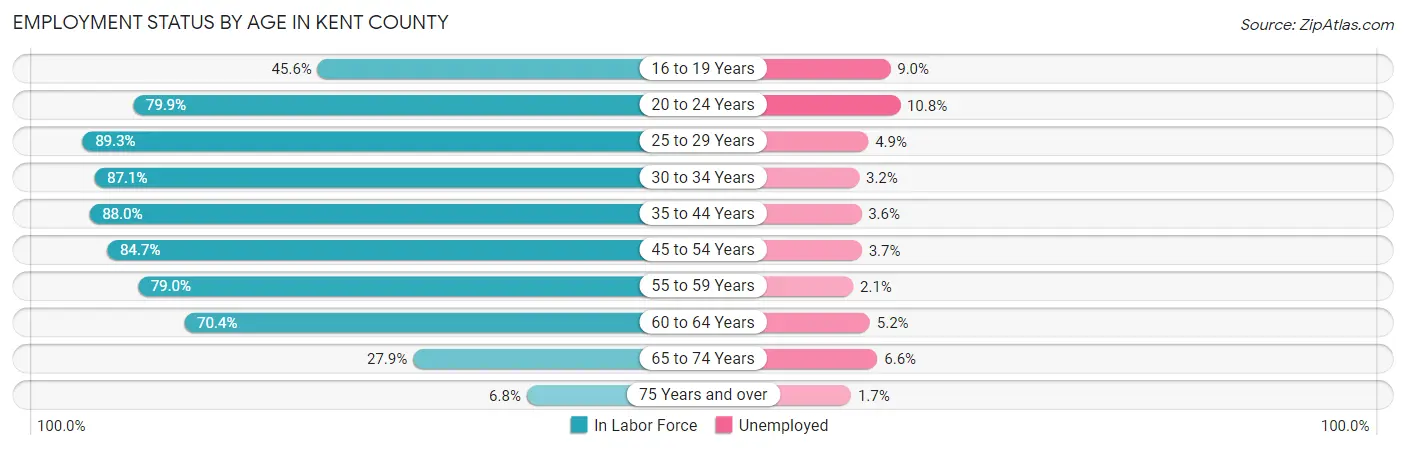
Employment Status by Age in Kent County
According to the labor force statistics for Kent County, out of the total population over 16 years of age (142,876), 66.4% or 94,870 individuals are in the labor force, with 4.6% or 4,364 of them unemployed. The age group with the highest labor force participation rate is 25 to 29 years, with 89.3% or 9,811 individuals in the labor force. Within the labor force, the 20 to 24 years age range has the highest percentage of unemployed individuals, with 10.8% or 779 of them being unemployed.
| Age Bracket | In Labor Force | Unemployed |
| 16 to 19 Years | 3,321 (45.6%) | 299 (9.0%) |
| 20 to 24 Years | 7,215 (79.9%) | 779 (10.8%) |
| 25 to 29 Years | 9,811 (89.3%) | 481 (4.9%) |
| 30 to 34 Years | 10,229 (87.1%) | 327 (3.2%) |
| 35 to 44 Years | 18,947 (88.0%) | 682 (3.6%) |
| 45 to 54 Years | 19,170 (84.7%) | 709 (3.7%) |
| 55 to 59 Years | 10,499 (79.0%) | 220 (2.1%) |
| 60 to 64 Years | 9,299 (70.4%) | 484 (5.2%) |
| 65 to 74 Years | 5,425 (27.9%) | 358 (6.6%) |
| 75 Years and over | 933 (6.8%) | 16 (1.7%) |
| Total | 94,870 (66.4%) | 4,364 (4.6%) |
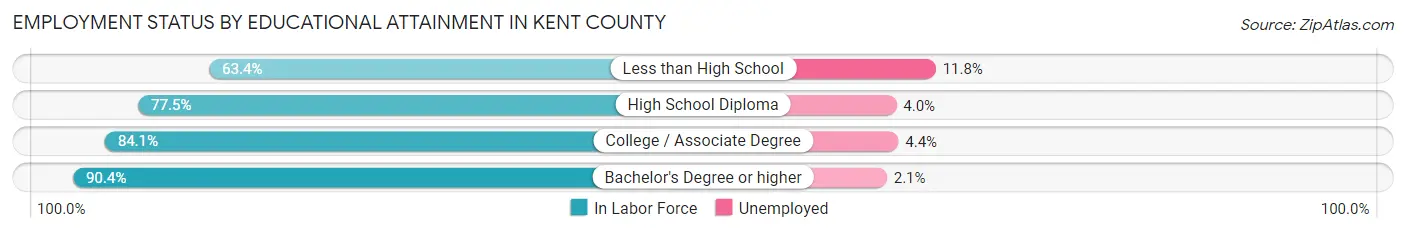
Employment Status by Educational Attainment in Kent County
According to labor force statistics for Kent County, 83.5% of individuals (77,984) out of the total population between 25 and 64 years of age (93,394) are in the labor force, with 3.7% or 2,885 of them being unemployed. The group with the highest labor force participation rate are those with the educational attainment of bachelor's degree or higher, with 90.4% or 30,634 individuals in the labor force. Within the labor force, individuals with less than high school education have the highest percentage of unemployment, with 11.8% or 404 of them being unemployed.
| Educational Attainment | In Labor Force | Unemployed |
| Less than High School | 3,427 (63.4%) | 638 (11.8%) |
| High School Diploma | 19,010 (77.5%) | 981 (4.0%) |
| College / Associate Degree | 24,870 (84.1%) | 1,301 (4.4%) |
| Bachelor's Degree or higher | 30,634 (90.4%) | 712 (2.1%) |
| Total | 77,984 (83.5%) | 3,456 (3.7%) |
Employment Occupations by Sex in Kent County
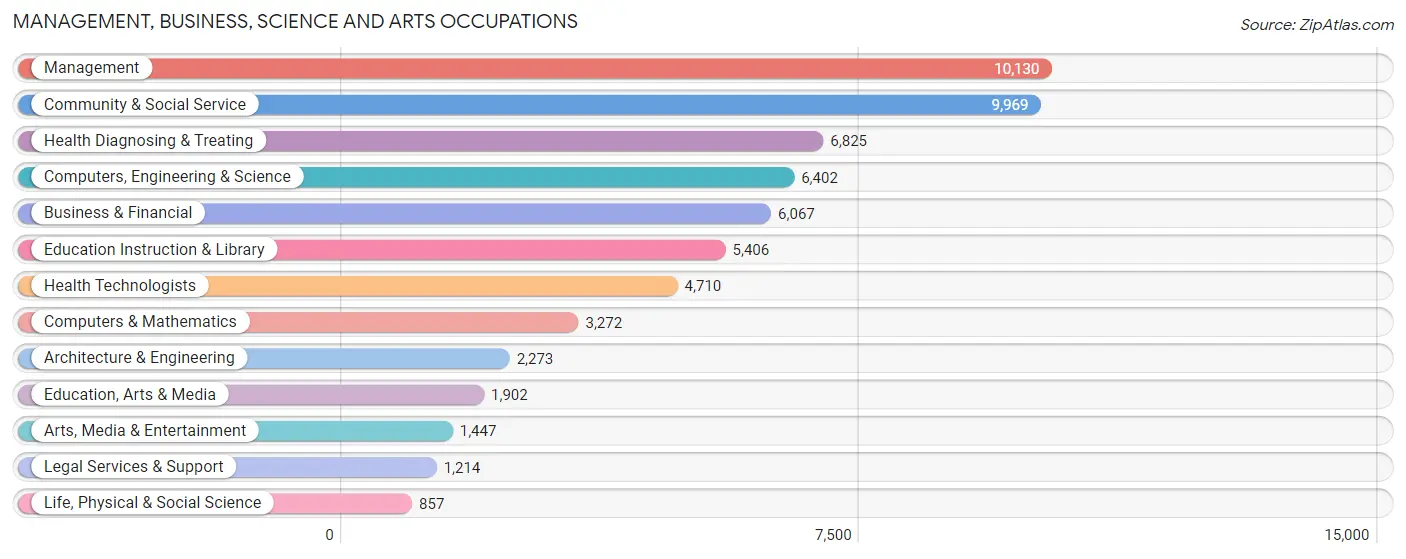
Management, Business, Science and Arts Occupations
The most common Management, Business, Science and Arts occupations in Kent County are Management (10,130 | 11.2%), Community & Social Service (9,969 | 11.1%), Health Diagnosing & Treating (6,825 | 7.6%), Computers, Engineering & Science (6,402 | 7.1%), and Business & Financial (6,067 | 6.7%).
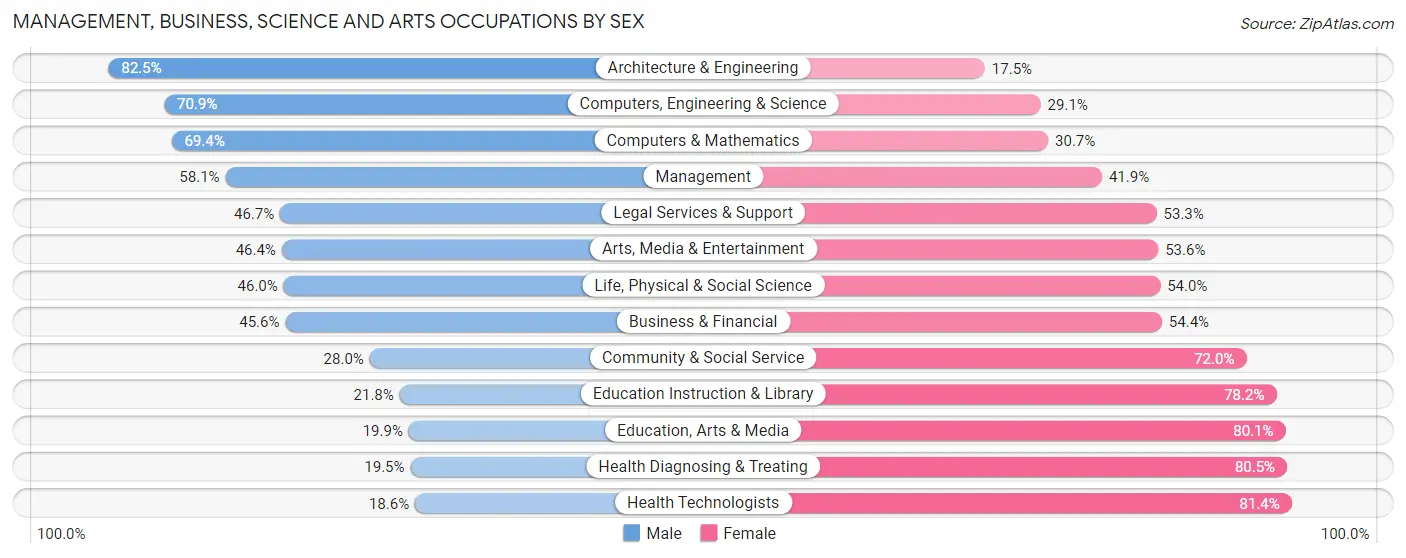
Management, Business, Science and Arts Occupations by Sex
Within the Management, Business, Science and Arts occupations in Kent County, the most male-oriented occupations are Architecture & Engineering (82.5%), Computers, Engineering & Science (70.9%), and Computers & Mathematics (69.4%), while the most female-oriented occupations are Health Technologists (81.4%), Health Diagnosing & Treating (80.5%), and Education, Arts & Media (80.1%).
| Occupation | Male | Female |
| Management | 5,887 (58.1%) | 4,243 (41.9%) |
| Business & Financial | 2,767 (45.6%) | 3,300 (54.4%) |
| Computers, Engineering & Science | 4,539 (70.9%) | 1,863 (29.1%) |
| Computers & Mathematics | 2,269 (69.4%) | 1,003 (30.6%) |
| Architecture & Engineering | 1,876 (82.5%) | 397 (17.5%) |
| Life, Physical & Social Science | 394 (46.0%) | 463 (54.0%) |
| Community & Social Service | 2,793 (28.0%) | 7,176 (72.0%) |
| Education, Arts & Media | 378 (19.9%) | 1,524 (80.1%) |
| Legal Services & Support | 567 (46.7%) | 647 (53.3%) |
| Education Instruction & Library | 1,177 (21.8%) | 4,229 (78.2%) |
| Arts, Media & Entertainment | 671 (46.4%) | 776 (53.6%) |
| Health Diagnosing & Treating | 1,333 (19.5%) | 5,492 (80.5%) |
| Health Technologists | 874 (18.6%) | 3,836 (81.4%) |
| Total (Category) | 17,319 (44.0%) | 22,074 (56.0%) |
| Total (Overall) | 46,941 (52.0%) | 43,273 (48.0%) |
Services Occupations
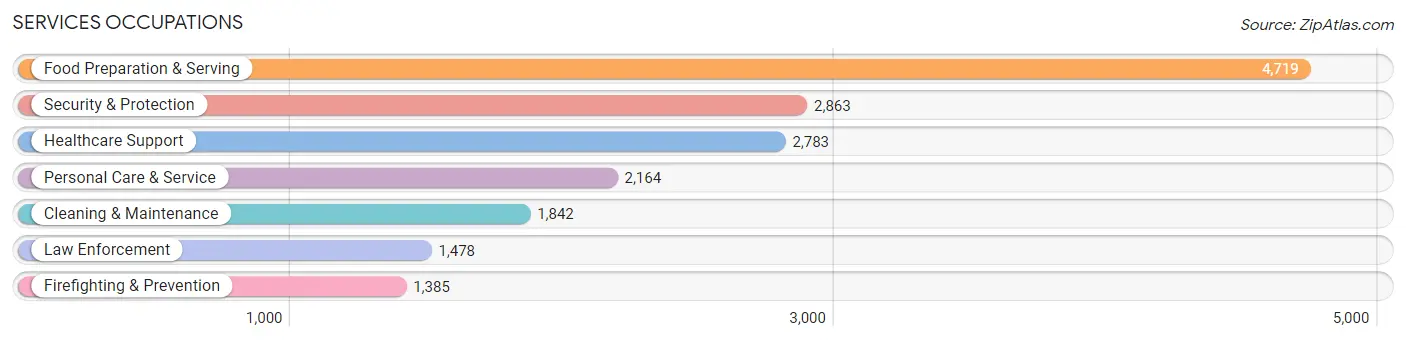
The most common Services occupations in Kent County are Food Preparation & Serving (4,719 | 5.2%), Security & Protection (2,863 | 3.2%), Healthcare Support (2,783 | 3.1%), Personal Care & Service (2,164 | 2.4%), and Cleaning & Maintenance (1,842 | 2.0%).
Services Occupations by Sex
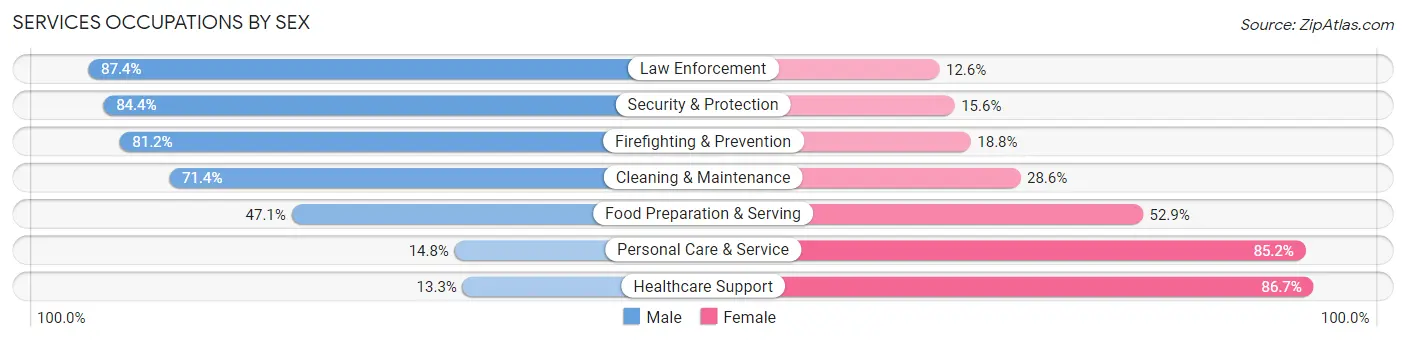
Within the Services occupations in Kent County, the most male-oriented occupations are Law Enforcement (87.4%), Security & Protection (84.4%), and Firefighting & Prevention (81.2%), while the most female-oriented occupations are Healthcare Support (86.7%), Personal Care & Service (85.2%), and Food Preparation & Serving (52.9%).
| Occupation | Male | Female |
| Healthcare Support | 369 (13.3%) | 2,414 (86.7%) |
| Security & Protection | 2,417 (84.4%) | 446 (15.6%) |
| Firefighting & Prevention | 1,125 (81.2%) | 260 (18.8%) |
| Law Enforcement | 1,292 (87.4%) | 186 (12.6%) |
| Food Preparation & Serving | 2,224 (47.1%) | 2,495 (52.9%) |
| Cleaning & Maintenance | 1,315 (71.4%) | 527 (28.6%) |
| Personal Care & Service | 321 (14.8%) | 1,843 (85.2%) |
| Total (Category) | 6,646 (46.3%) | 7,725 (53.7%) |
| Total (Overall) | 46,941 (52.0%) | 43,273 (48.0%) |
Sales and Office Occupations
The most common Sales and Office occupations in Kent County are Office & Administration (10,251 | 11.4%), and Sales & Related (9,468 | 10.5%).

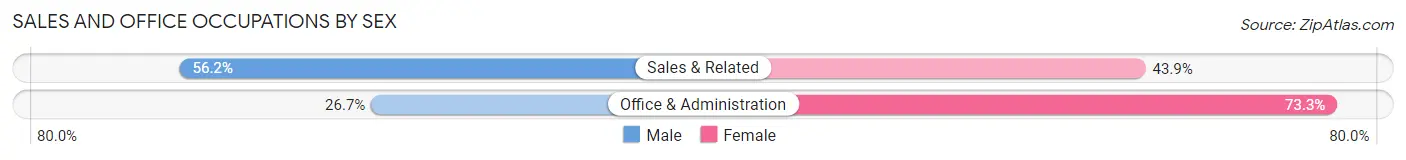
Sales and Office Occupations by Sex
| Occupation | Male | Female |
| Sales & Related | 5,316 (56.1%) | 4,152 (43.9%) |
| Office & Administration | 2,735 (26.7%) | 7,516 (73.3%) |
| Total (Category) | 8,051 (40.8%) | 11,668 (59.2%) |
| Total (Overall) | 46,941 (52.0%) | 43,273 (48.0%) |
Natural Resources, Construction and Maintenance Occupations
The most common Natural Resources, Construction and Maintenance occupations in Kent County are Construction & Extraction (4,047 | 4.5%), Installation, Maintenance & Repair (3,007 | 3.3%), and Farming, Fishing & Forestry (116 | 0.1%).

Natural Resources, Construction and Maintenance Occupations by Sex
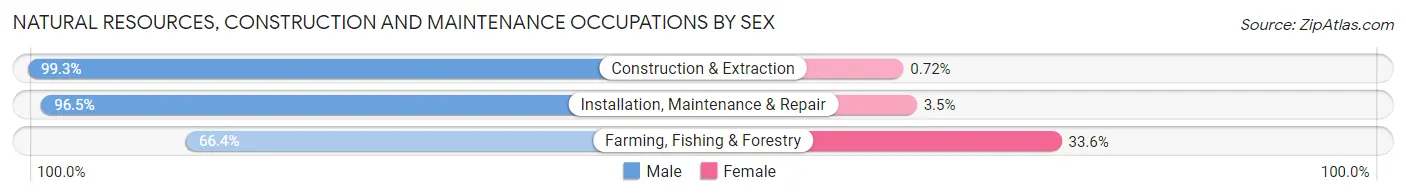
| Occupation | Male | Female |
| Farming, Fishing & Forestry | 77 (66.4%) | 39 (33.6%) |
| Construction & Extraction | 4,018 (99.3%) | 29 (0.7%) |
| Installation, Maintenance & Repair | 2,902 (96.5%) | 105 (3.5%) |
| Total (Category) | 6,997 (97.6%) | 173 (2.4%) |
| Total (Overall) | 46,941 (52.0%) | 43,273 (48.0%) |
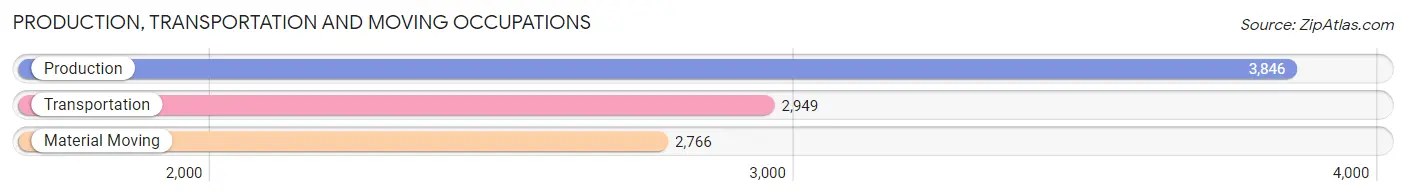
Production, Transportation and Moving Occupations
The most common Production, Transportation and Moving occupations in Kent County are Production (3,846 | 4.3%), Transportation (2,949 | 3.3%), and Material Moving (2,766 | 3.1%).
Production, Transportation and Moving Occupations by Sex
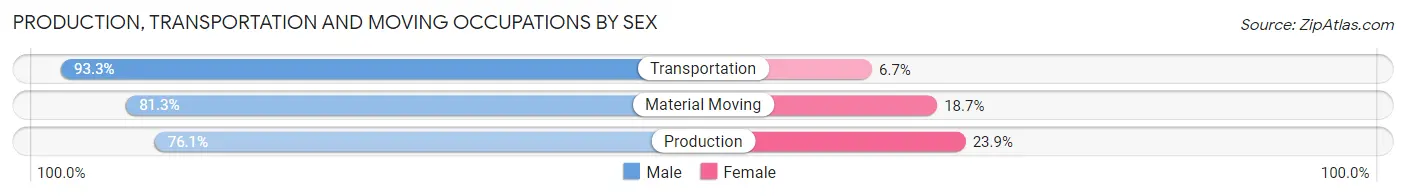
| Occupation | Male | Female |
| Production | 2,927 (76.1%) | 919 (23.9%) |
| Transportation | 2,751 (93.3%) | 198 (6.7%) |
| Material Moving | 2,250 (81.3%) | 516 (18.7%) |
| Total (Category) | 7,928 (82.9%) | 1,633 (17.1%) |
| Total (Overall) | 46,941 (52.0%) | 43,273 (48.0%) |
Employment Industries by Sex in Kent County
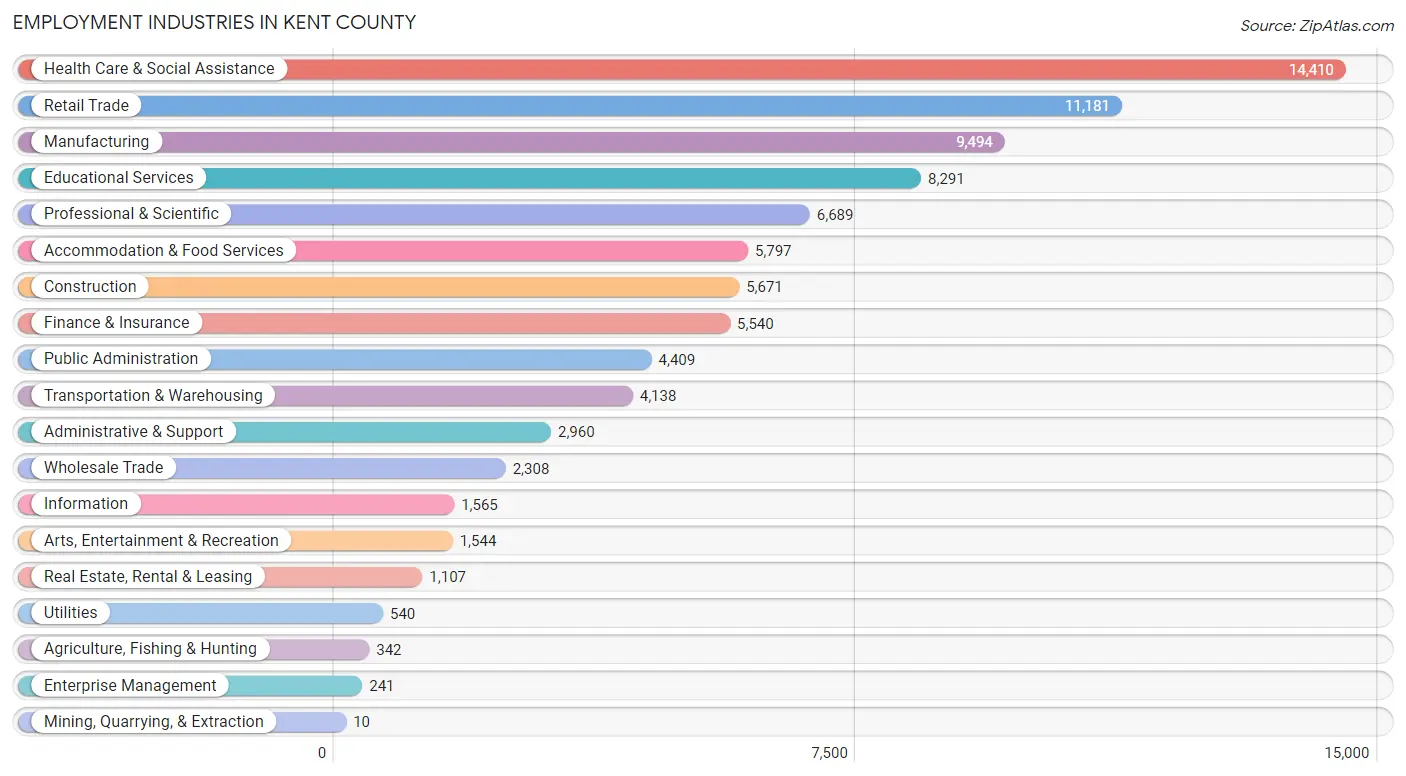
Employment Industries in Kent County
The major employment industries in Kent County include Health Care & Social Assistance (14,410 | 16.0%), Retail Trade (11,181 | 12.4%), Manufacturing (9,494 | 10.5%), Educational Services (8,291 | 9.2%), and Professional & Scientific (6,689 | 7.4%).
Employment Industries by Sex in Kent County
The Kent County industries that see more men than women are Construction (94.8%), Manufacturing (77.3%), and Utilities (76.8%), whereas the industries that tend to have a higher number of women are Mining, Quarrying, & Extraction (100.0%), Health Care & Social Assistance (82.8%), and Enterprise Management (77.6%).
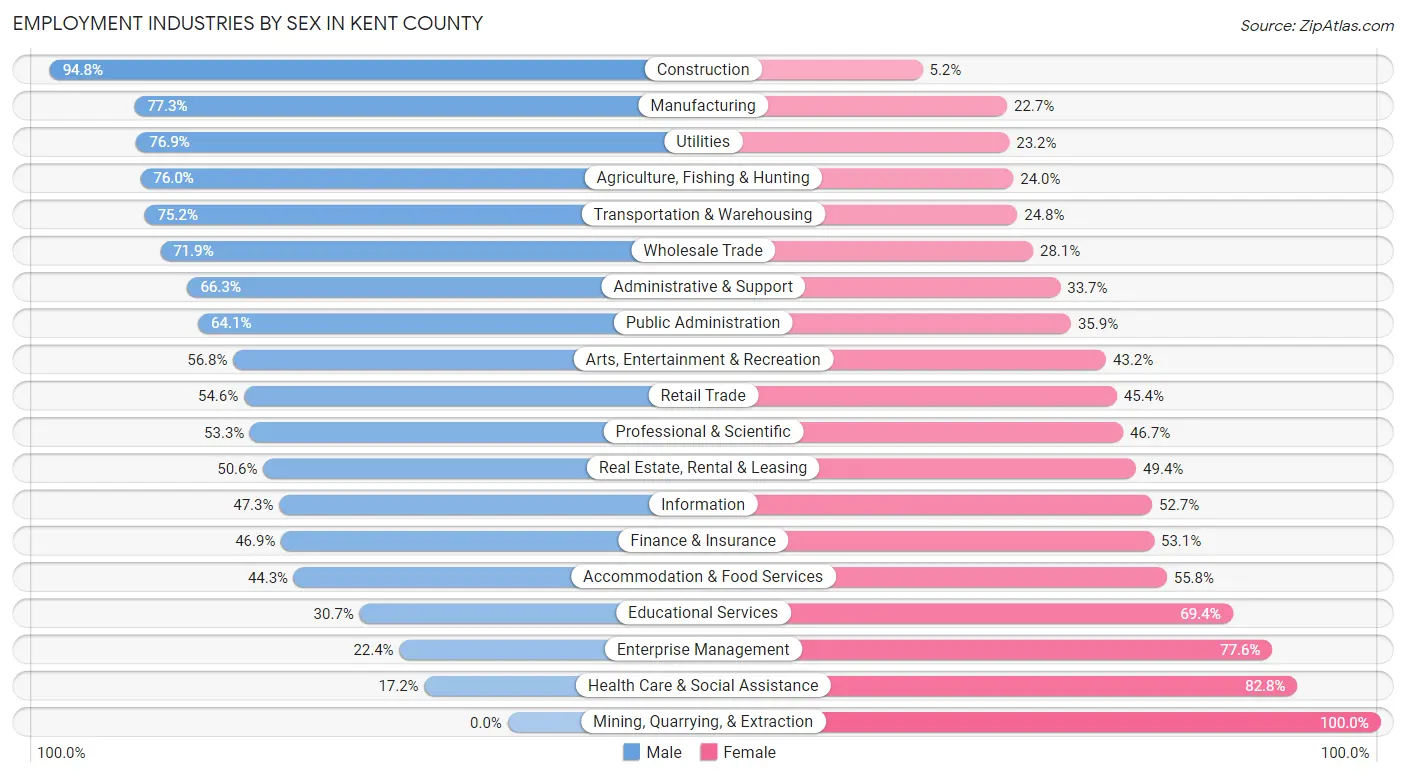
| Industry | Male | Female |
| Agriculture, Fishing & Hunting | 260 (76.0%) | 82 (24.0%) |
| Mining, Quarrying, & Extraction | 0 (0.0%) | 10 (100.0%) |
| Construction | 5,376 (94.8%) | 295 (5.2%) |
| Manufacturing | 7,340 (77.3%) | 2,154 (22.7%) |
| Wholesale Trade | 1,660 (71.9%) | 648 (28.1%) |
| Retail Trade | 6,103 (54.6%) | 5,078 (45.4%) |
| Transportation & Warehousing | 3,111 (75.2%) | 1,027 (24.8%) |
| Utilities | 415 (76.8%) | 125 (23.2%) |
| Information | 740 (47.3%) | 825 (52.7%) |
| Finance & Insurance | 2,597 (46.9%) | 2,943 (53.1%) |
| Real Estate, Rental & Leasing | 560 (50.6%) | 547 (49.4%) |
| Professional & Scientific | 3,566 (53.3%) | 3,123 (46.7%) |
| Enterprise Management | 54 (22.4%) | 187 (77.6%) |
| Administrative & Support | 1,962 (66.3%) | 998 (33.7%) |
| Educational Services | 2,541 (30.6%) | 5,750 (69.4%) |
| Health Care & Social Assistance | 2,485 (17.2%) | 11,925 (82.8%) |
| Arts, Entertainment & Recreation | 877 (56.8%) | 667 (43.2%) |
| Accommodation & Food Services | 2,565 (44.3%) | 3,232 (55.7%) |
| Public Administration | 2,825 (64.1%) | 1,584 (35.9%) |
| Total | 46,941 (52.0%) | 43,273 (48.0%) |
Education in Kent County
School Enrollment in Kent County
The most common levels of schooling among the 34,492 students in Kent County are high school (7,356 | 21.3%), elementary school (7,327 | 21.2%), and college / undergraduate (7,295 | 21.1%).
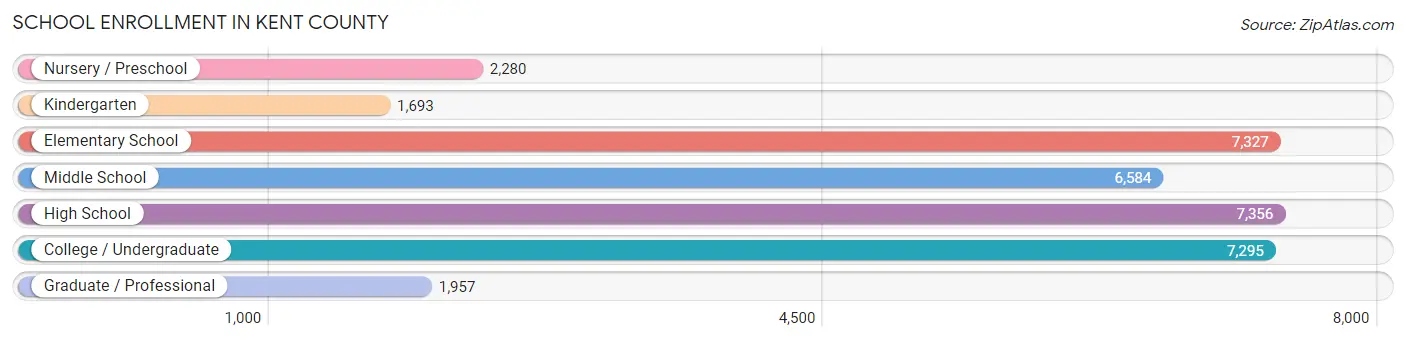
| School Level | # Students | % Students |
| Nursery / Preschool | 2,280 | 6.6% |
| Kindergarten | 1,693 | 4.9% |
| Elementary School | 7,327 | 21.2% |
| Middle School | 6,584 | 19.1% |
| High School | 7,356 | 21.3% |
| College / Undergraduate | 7,295 | 21.1% |
| Graduate / Professional | 1,957 | 5.7% |
| Total | 34,492 | 100.0% |
School Enrollment by Age by Funding Source in Kent County
Out of a total of 34,492 students who are enrolled in schools in Kent County, 7,140 (20.7%) attend a private institution, while the remaining 27,352 (79.3%) are enrolled in public schools. The age group of 35 years and over has the highest likelihood of being enrolled in private schools, with 765 (40.5% in the age bracket) enrolled. Conversely, the age group of 15 to 17 year olds has the lowest likelihood of being enrolled in a private school, with 4,841 (87.5% in the age bracket) attending a public institution.
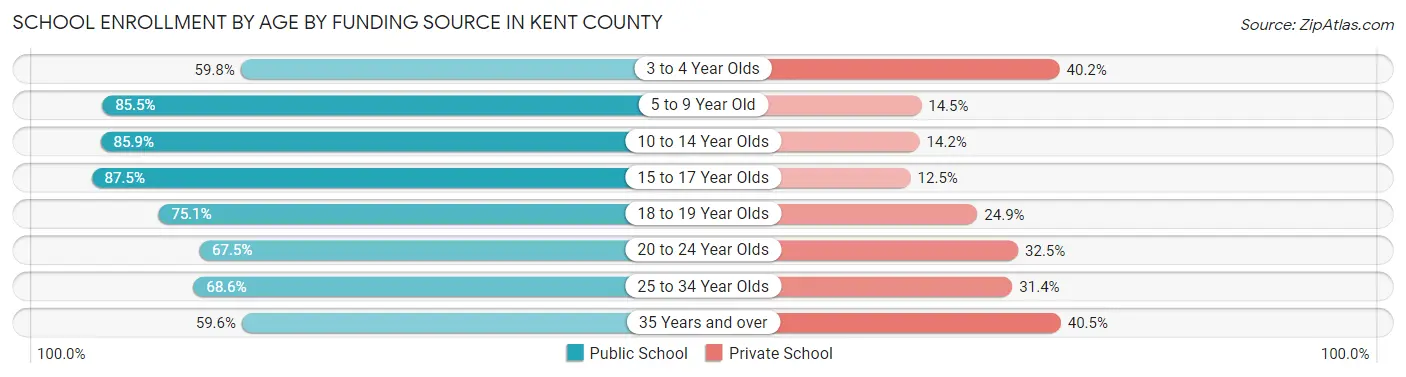
| Age Bracket | Public School | Private School |
| 3 to 4 Year Olds | 1,103 (59.8%) | 742 (40.2%) |
| 5 to 9 Year Old | 7,342 (85.5%) | 1,241 (14.5%) |
| 10 to 14 Year Olds | 6,993 (85.9%) | 1,153 (14.1%) |
| 15 to 17 Year Olds | 4,841 (87.5%) | 690 (12.5%) |
| 18 to 19 Year Olds | 1,914 (75.1%) | 635 (24.9%) |
| 20 to 24 Year Olds | 2,350 (67.5%) | 1,131 (32.5%) |
| 25 to 34 Year Olds | 1,691 (68.6%) | 775 (31.4%) |
| 35 Years and over | 1,126 (59.6%) | 765 (40.5%) |
| Total | 27,352 (79.3%) | 7,140 (20.7%) |
Educational Attainment by Field of Study in Kent County
Business (8,662 | 18.8%), education (5,518 | 12.0%), science & technology (5,136 | 11.1%), social sciences (3,649 | 7.9%), and arts & humanities (3,414 | 7.4%) are the most common fields of study among 46,122 individuals in Kent County who have obtained a bachelor's degree or higher.
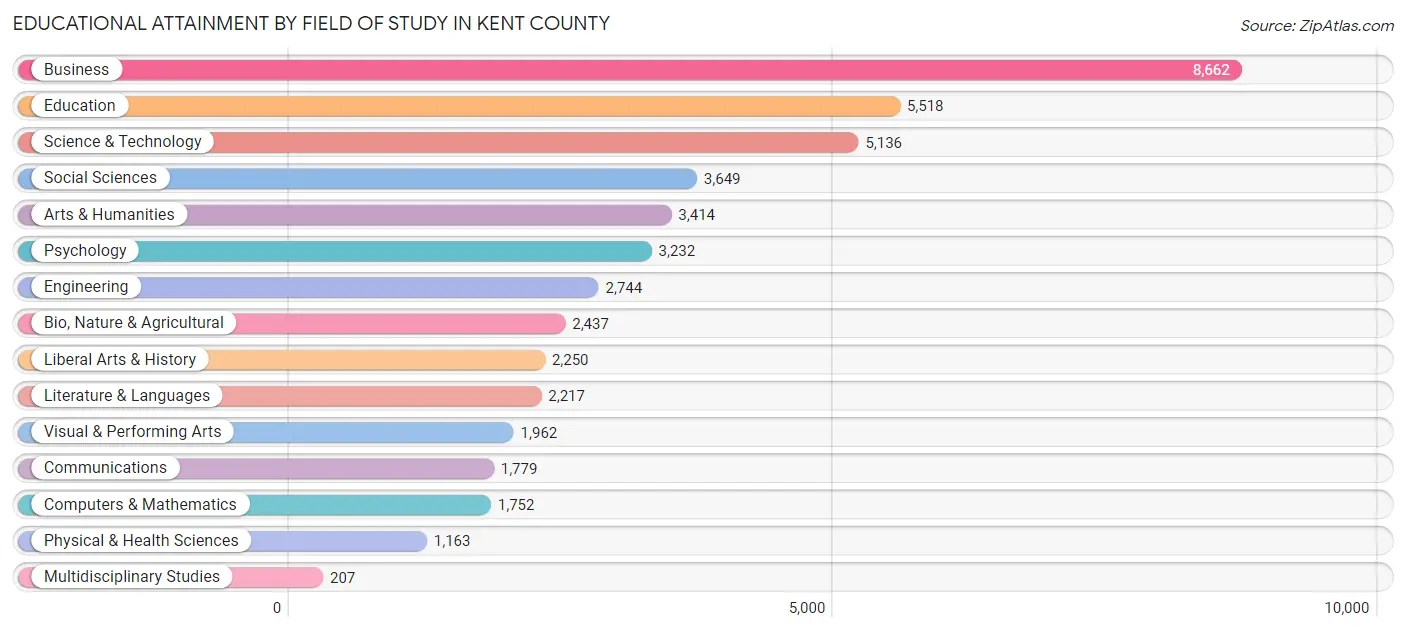
| Field of Study | # Graduates | % Graduates |
| Computers & Mathematics | 1,752 | 3.8% |
| Bio, Nature & Agricultural | 2,437 | 5.3% |
| Physical & Health Sciences | 1,163 | 2.5% |
| Psychology | 3,232 | 7.0% |
| Social Sciences | 3,649 | 7.9% |
| Engineering | 2,744 | 5.9% |
| Multidisciplinary Studies | 207 | 0.4% |
| Science & Technology | 5,136 | 11.1% |
| Business | 8,662 | 18.8% |
| Education | 5,518 | 12.0% |
| Literature & Languages | 2,217 | 4.8% |
| Liberal Arts & History | 2,250 | 4.9% |
| Visual & Performing Arts | 1,962 | 4.3% |
| Communications | 1,779 | 3.9% |
| Arts & Humanities | 3,414 | 7.4% |
| Total | 46,122 | 100.0% |
Transportation & Commute in Kent County
Vehicle Availability by Sex in Kent County
The most prevalent vehicle ownership categories in Kent County are males with 2 vehicles (21,401, accounting for 46.4%) and females with 2 vehicles (18,865, making up 50.8%).
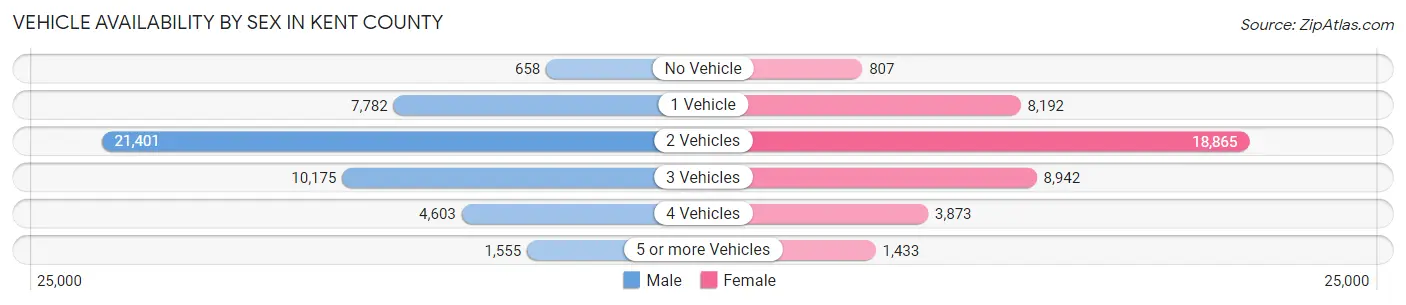
| Vehicles Available | Male | Female |
| No Vehicle | 658 (1.4%) | 807 (1.9%) |
| 1 Vehicle | 7,782 (16.9%) | 8,192 (19.5%) |
| 2 Vehicles | 21,401 (46.4%) | 18,865 (44.8%) |
| 3 Vehicles | 10,175 (22.0%) | 8,942 (21.2%) |
| 4 Vehicles | 4,603 (10.0%) | 3,873 (9.2%) |
| 5 or more Vehicles | 1,555 (3.4%) | 1,433 (3.4%) |
| Total | 46,174 (100.0%) | 42,112 (100.0%) |
Commute Time in Kent County
The most frequently occuring commute durations in Kent County are 20 to 24 minutes (14,054 commuters, 17.5%), 15 to 19 minutes (12,607 commuters, 15.7%), and 30 to 34 minutes (12,382 commuters, 15.4%).
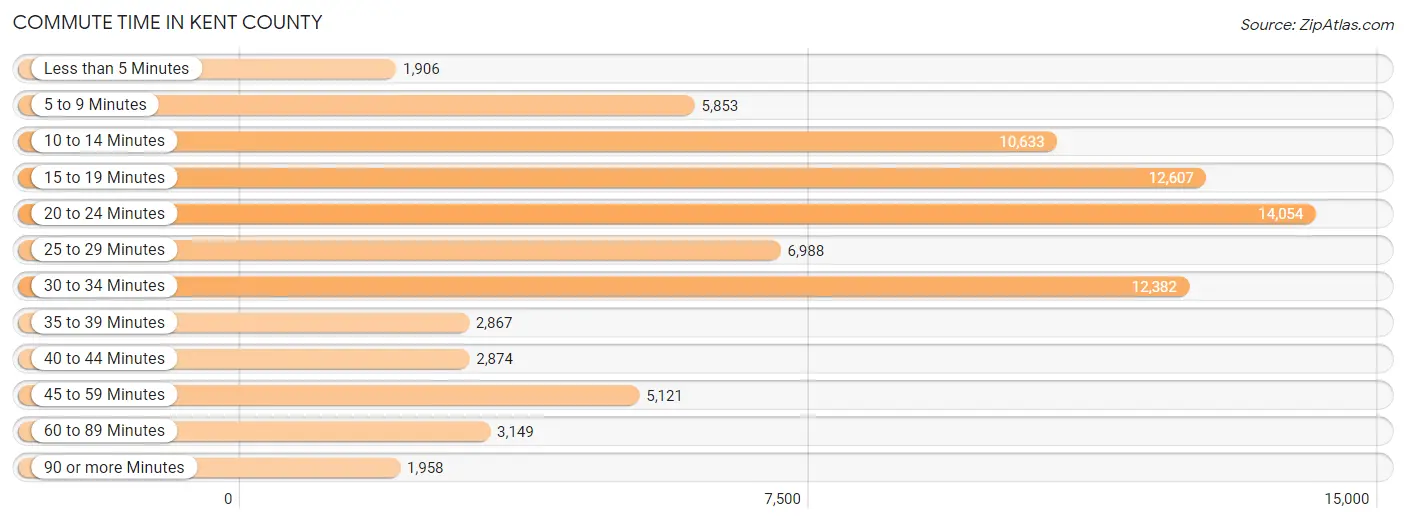
| Commute Time | # Commuters | % Commuters |
| Less than 5 Minutes | 1,906 | 2.4% |
| 5 to 9 Minutes | 5,853 | 7.3% |
| 10 to 14 Minutes | 10,633 | 13.2% |
| 15 to 19 Minutes | 12,607 | 15.7% |
| 20 to 24 Minutes | 14,054 | 17.5% |
| 25 to 29 Minutes | 6,988 | 8.7% |
| 30 to 34 Minutes | 12,382 | 15.4% |
| 35 to 39 Minutes | 2,867 | 3.6% |
| 40 to 44 Minutes | 2,874 | 3.6% |
| 45 to 59 Minutes | 5,121 | 6.4% |
| 60 to 89 Minutes | 3,149 | 3.9% |
| 90 or more Minutes | 1,958 | 2.4% |
Commute Time by Sex in Kent County
The most common commute times in Kent County are 20 to 24 minutes (7,387 commuters, 17.4%) for males and 20 to 24 minutes (6,667 commuters, 17.5%) for females.
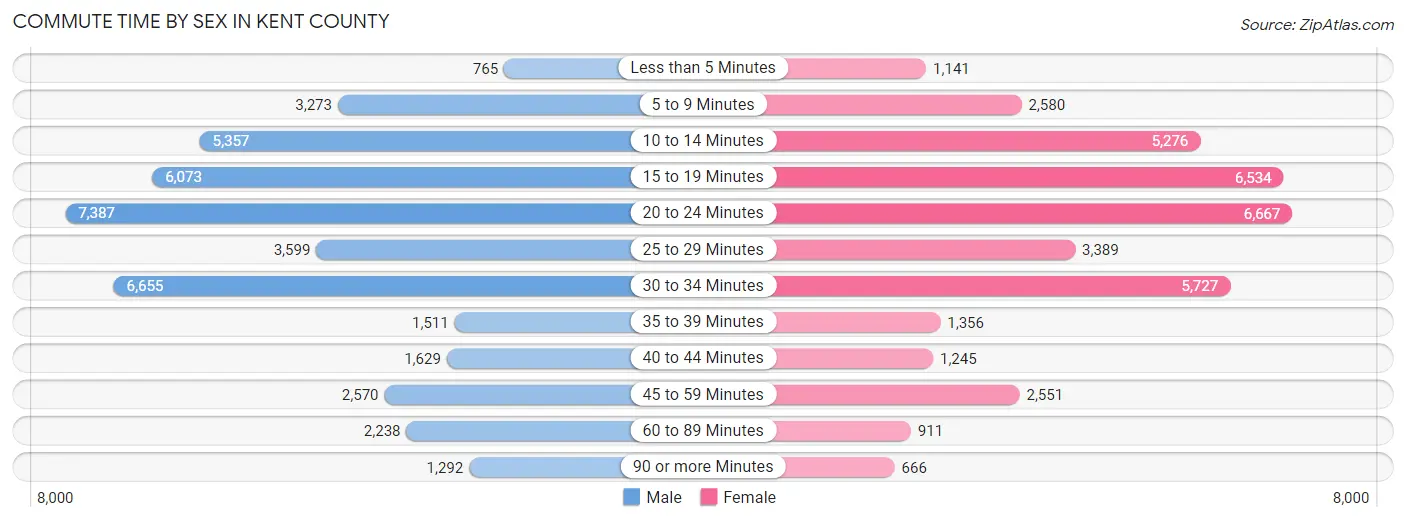
| Commute Time | Male | Female |
| Less than 5 Minutes | 765 (1.8%) | 1,141 (3.0%) |
| 5 to 9 Minutes | 3,273 (7.7%) | 2,580 (6.8%) |
| 10 to 14 Minutes | 5,357 (12.7%) | 5,276 (13.9%) |
| 15 to 19 Minutes | 6,073 (14.3%) | 6,534 (17.2%) |
| 20 to 24 Minutes | 7,387 (17.4%) | 6,667 (17.5%) |
| 25 to 29 Minutes | 3,599 (8.5%) | 3,389 (8.9%) |
| 30 to 34 Minutes | 6,655 (15.7%) | 5,727 (15.0%) |
| 35 to 39 Minutes | 1,511 (3.6%) | 1,356 (3.6%) |
| 40 to 44 Minutes | 1,629 (3.8%) | 1,245 (3.3%) |
| 45 to 59 Minutes | 2,570 (6.1%) | 2,551 (6.7%) |
| 60 to 89 Minutes | 2,238 (5.3%) | 911 (2.4%) |
| 90 or more Minutes | 1,292 (3.0%) | 666 (1.8%) |
Time of Departure to Work by Sex in Kent County
The most frequent times of departure to work in Kent County are 7:00 AM to 7:29 AM (5,850, 13.8%) for males and 7:00 AM to 7:29 AM (6,911, 18.2%) for females.
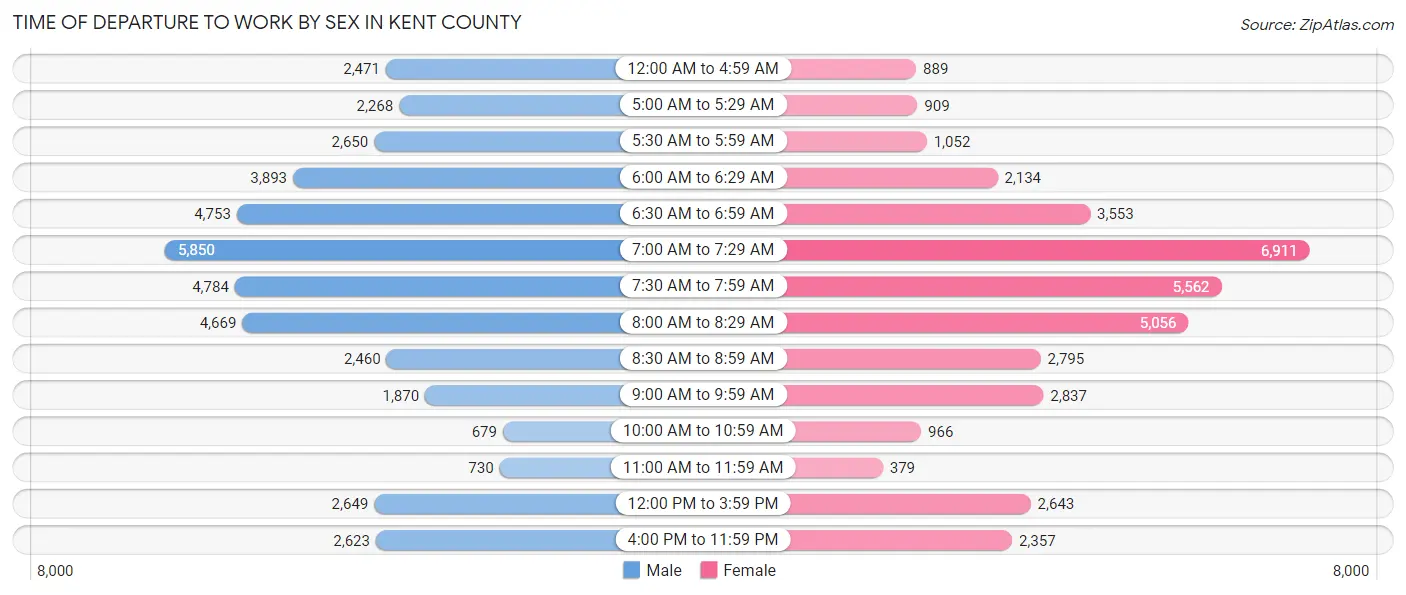
| Time of Departure | Male | Female |
| 12:00 AM to 4:59 AM | 2,471 (5.8%) | 889 (2.3%) |
| 5:00 AM to 5:29 AM | 2,268 (5.4%) | 909 (2.4%) |
| 5:30 AM to 5:59 AM | 2,650 (6.3%) | 1,052 (2.8%) |
| 6:00 AM to 6:29 AM | 3,893 (9.2%) | 2,134 (5.6%) |
| 6:30 AM to 6:59 AM | 4,753 (11.2%) | 3,553 (9.3%) |
| 7:00 AM to 7:29 AM | 5,850 (13.8%) | 6,911 (18.2%) |
| 7:30 AM to 7:59 AM | 4,784 (11.3%) | 5,562 (14.6%) |
| 8:00 AM to 8:29 AM | 4,669 (11.0%) | 5,056 (13.3%) |
| 8:30 AM to 8:59 AM | 2,460 (5.8%) | 2,795 (7.3%) |
| 9:00 AM to 9:59 AM | 1,870 (4.4%) | 2,837 (7.5%) |
| 10:00 AM to 10:59 AM | 679 (1.6%) | 966 (2.5%) |
| 11:00 AM to 11:59 AM | 730 (1.7%) | 379 (1.0%) |
| 12:00 PM to 3:59 PM | 2,649 (6.3%) | 2,643 (7.0%) |
| 4:00 PM to 11:59 PM | 2,623 (6.2%) | 2,357 (6.2%) |
| Total | 42,349 (100.0%) | 38,043 (100.0%) |
Housing Occupancy in Kent County
Occupancy by Ownership in Kent County
Of the total 72,199 dwellings in Kent County, owner-occupied units account for 52,058 (72.1%), while renter-occupied units make up 20,141 (27.9%).
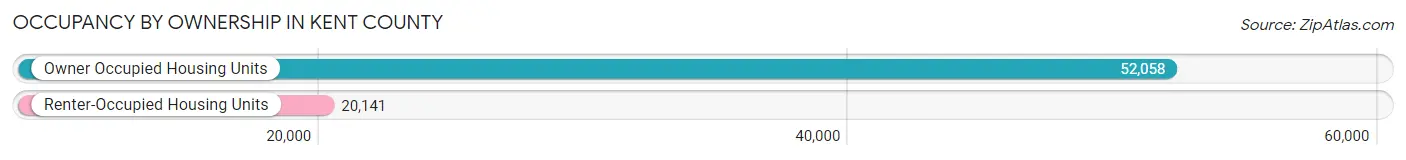
| Occupancy | # Housing Units | % Housing Units |
| Owner Occupied Housing Units | 52,058 | 72.1% |
| Renter-Occupied Housing Units | 20,141 | 27.9% |
| Total Occupied Housing Units | 72,199 | 100.0% |
Occupancy by Household Size in Kent County
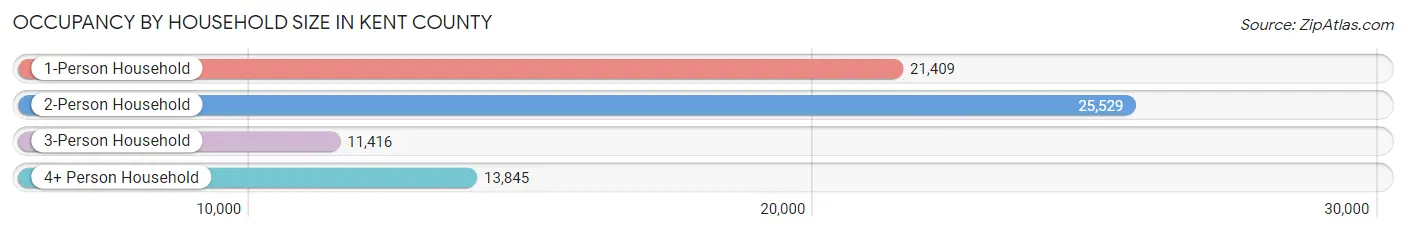
| Household Size | # Housing Units | % Housing Units |
| 1-Person Household | 21,409 | 29.6% |
| 2-Person Household | 25,529 | 35.4% |
| 3-Person Household | 11,416 | 15.8% |
| 4+ Person Household | 13,845 | 19.2% |
| Total Housing Units | 72,199 | 100.0% |
Occupancy by Ownership by Household Size in Kent County
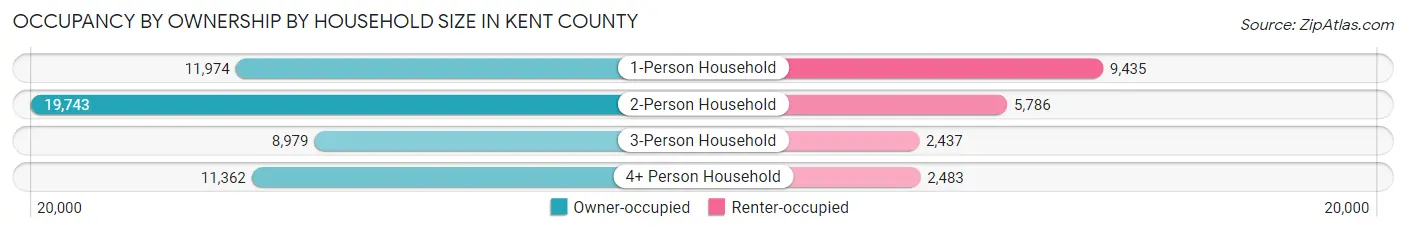
| Household Size | Owner-occupied | Renter-occupied |
| 1-Person Household | 11,974 (55.9%) | 9,435 (44.1%) |
| 2-Person Household | 19,743 (77.3%) | 5,786 (22.7%) |
| 3-Person Household | 8,979 (78.6%) | 2,437 (21.3%) |
| 4+ Person Household | 11,362 (82.1%) | 2,483 (17.9%) |
| Total Housing Units | 52,058 (72.1%) | 20,141 (27.9%) |
Occupancy by Educational Attainment in Kent County
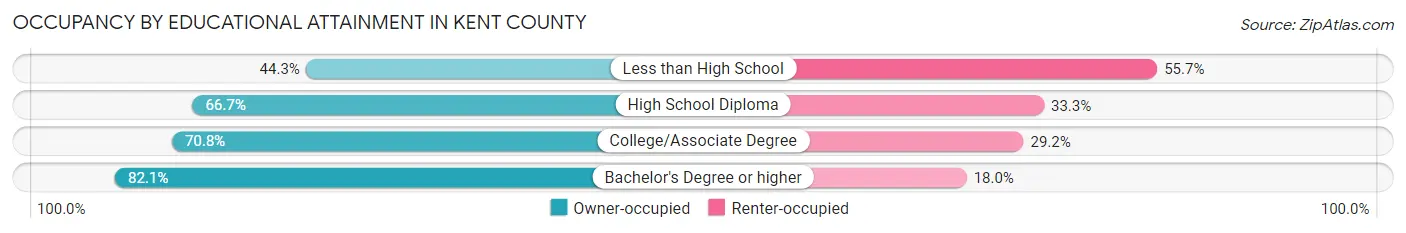
| Household Size | Owner-occupied | Renter-occupied |
| Less than High School | 2,012 (44.3%) | 2,532 (55.7%) |
| High School Diploma | 11,986 (66.7%) | 5,982 (33.3%) |
| College/Associate Degree | 17,020 (70.8%) | 7,025 (29.2%) |
| Bachelor's Degree or higher | 21,040 (82.1%) | 4,602 (17.9%) |
Occupancy by Age of Householder in Kent County
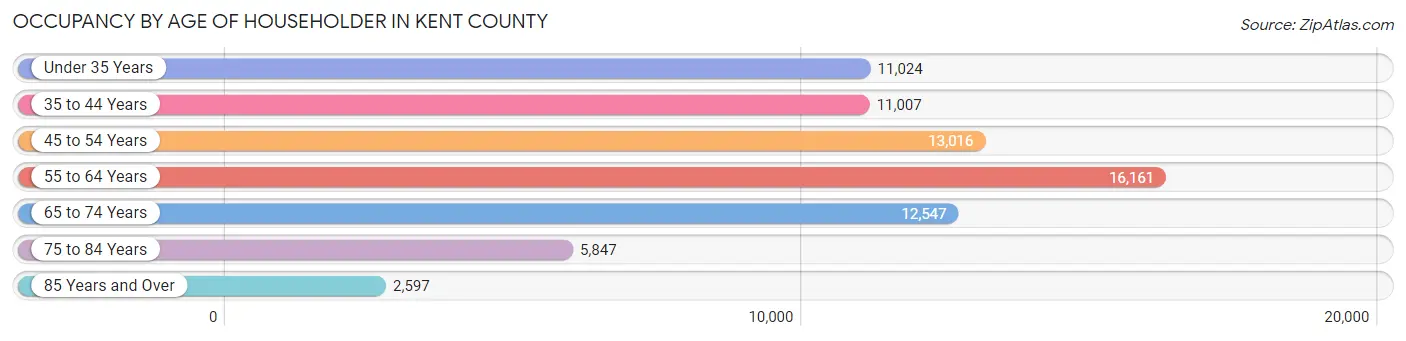
| Age Bracket | # Households | % Households |
| Under 35 Years | 11,024 | 15.3% |
| 35 to 44 Years | 11,007 | 15.2% |
| 45 to 54 Years | 13,016 | 18.0% |
| 55 to 64 Years | 16,161 | 22.4% |
| 65 to 74 Years | 12,547 | 17.4% |
| 75 to 84 Years | 5,847 | 8.1% |
| 85 Years and Over | 2,597 | 3.6% |
| Total | 72,199 | 100.0% |
Housing Finances in Kent County
Median Income by Occupancy in Kent County
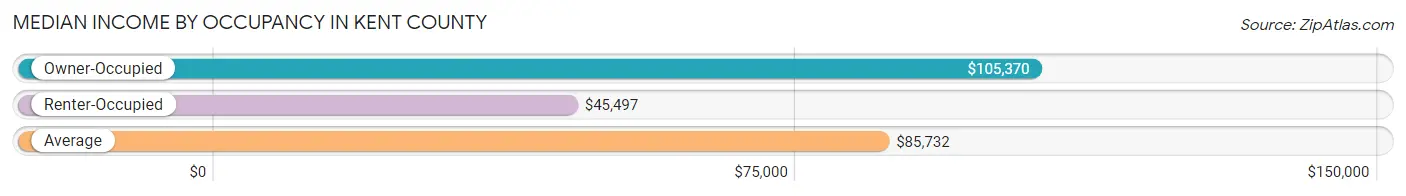
| Occupancy Type | # Households | Median Income |
| Owner-Occupied | 52,058 (72.1%) | $105,370 |
| Renter-Occupied | 20,141 (27.9%) | $45,497 |
| Average | 72,199 (100.0%) | $85,732 |
Occupancy by Householder Income Bracket in Kent County
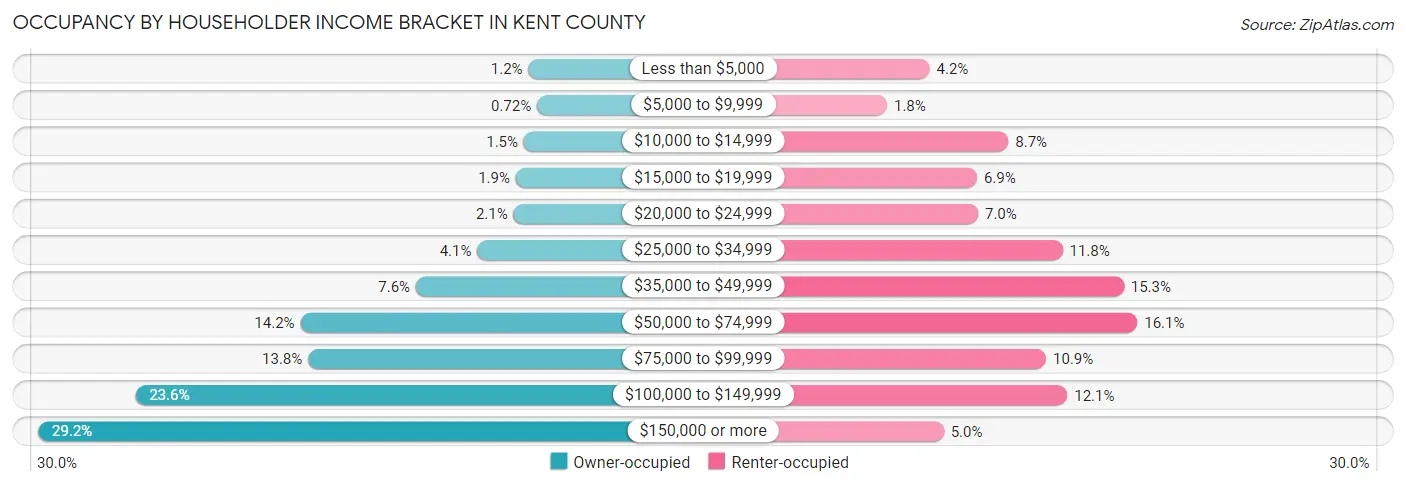
| Income Bracket | Owner-occupied | Renter-occupied |
| Less than $5,000 | 631 (1.2%) | 852 (4.2%) |
| $5,000 to $9,999 | 374 (0.7%) | 363 (1.8%) |
| $10,000 to $14,999 | 766 (1.5%) | 1,758 (8.7%) |
| $15,000 to $19,999 | 1,003 (1.9%) | 1,398 (6.9%) |
| $20,000 to $24,999 | 1,070 (2.1%) | 1,410 (7.0%) |
| $25,000 to $34,999 | 2,148 (4.1%) | 2,382 (11.8%) |
| $35,000 to $49,999 | 3,975 (7.6%) | 3,088 (15.3%) |
| $50,000 to $74,999 | 7,415 (14.2%) | 3,243 (16.1%) |
| $75,000 to $99,999 | 7,186 (13.8%) | 2,194 (10.9%) |
| $100,000 to $149,999 | 12,298 (23.6%) | 2,437 (12.1%) |
| $150,000 or more | 15,192 (29.2%) | 1,016 (5.0%) |
| Total | 52,058 (100.0%) | 20,141 (100.0%) |
Monthly Housing Cost Tiers in Kent County
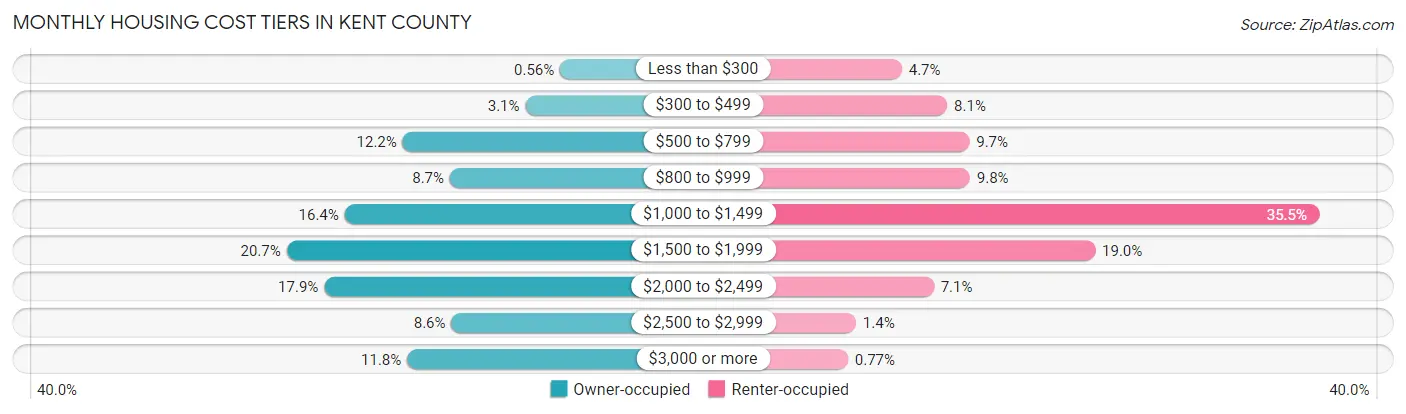
| Monthly Cost | Owner-occupied | Renter-occupied |
| Less than $300 | 294 (0.6%) | 954 (4.7%) |
| $300 to $499 | 1,625 (3.1%) | 1,628 (8.1%) |
| $500 to $799 | 6,329 (12.2%) | 1,955 (9.7%) |
| $800 to $999 | 4,521 (8.7%) | 1,964 (9.8%) |
| $1,000 to $1,499 | 8,552 (16.4%) | 7,139 (35.4%) |
| $1,500 to $1,999 | 10,779 (20.7%) | 3,822 (19.0%) |
| $2,000 to $2,499 | 9,340 (17.9%) | 1,427 (7.1%) |
| $2,500 to $2,999 | 4,462 (8.6%) | 274 (1.4%) |
| $3,000 or more | 6,156 (11.8%) | 155 (0.8%) |
| Total | 52,058 (100.0%) | 20,141 (100.0%) |
Physical Housing Characteristics in Kent County
Housing Structures in Kent County
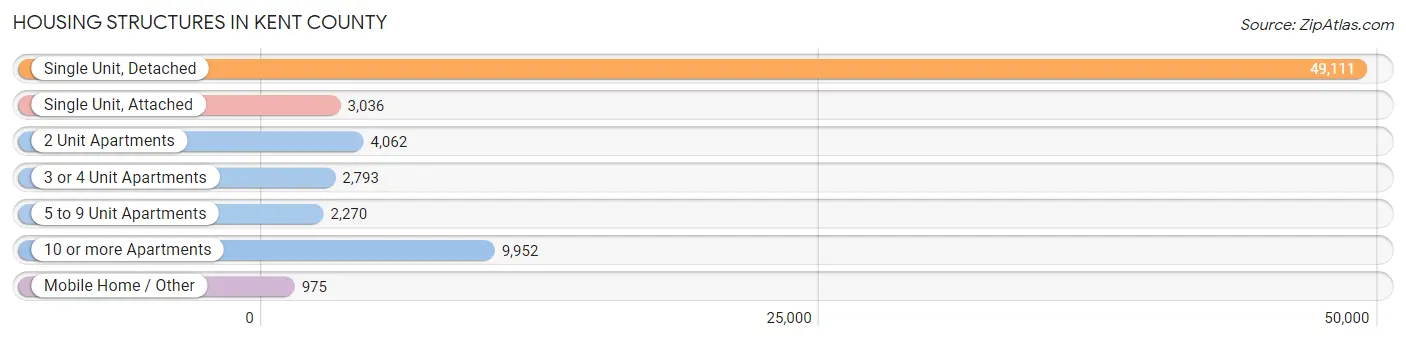
| Structure Type | # Housing Units | % Housing Units |
| Single Unit, Detached | 49,111 | 68.0% |
| Single Unit, Attached | 3,036 | 4.2% |
| 2 Unit Apartments | 4,062 | 5.6% |
| 3 or 4 Unit Apartments | 2,793 | 3.9% |
| 5 to 9 Unit Apartments | 2,270 | 3.1% |
| 10 or more Apartments | 9,952 | 13.8% |
| Mobile Home / Other | 975 | 1.3% |
| Total | 72,199 | 100.0% |
Housing Structures by Occupancy in Kent County
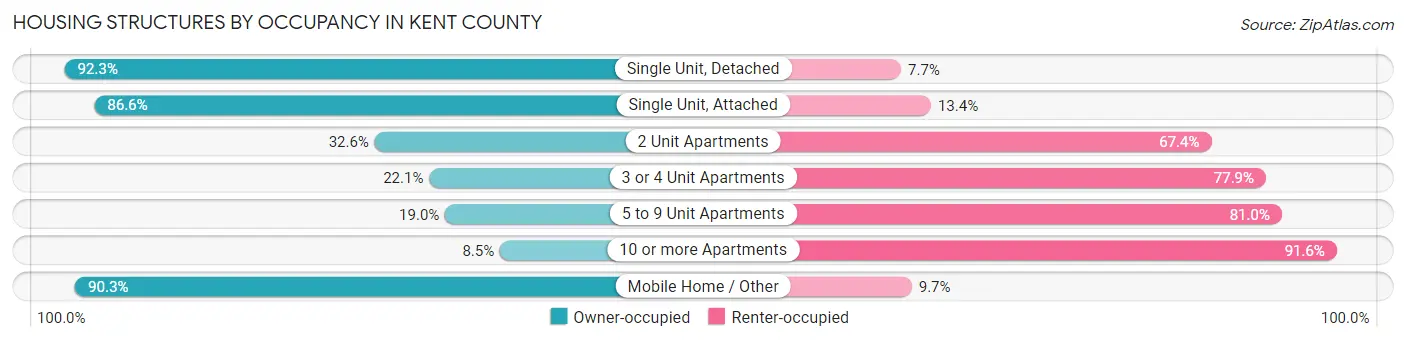
| Structure Type | Owner-occupied | Renter-occupied |
| Single Unit, Detached | 45,336 (92.3%) | 3,775 (7.7%) |
| Single Unit, Attached | 2,628 (86.6%) | 408 (13.4%) |
| 2 Unit Apartments | 1,324 (32.6%) | 2,738 (67.4%) |
| 3 or 4 Unit Apartments | 617 (22.1%) | 2,176 (77.9%) |
| 5 to 9 Unit Apartments | 432 (19.0%) | 1,838 (81.0%) |
| 10 or more Apartments | 841 (8.5%) | 9,111 (91.5%) |
| Mobile Home / Other | 880 (90.3%) | 95 (9.7%) |
| Total | 52,058 (72.1%) | 20,141 (27.9%) |
Housing Structures by Number of Rooms in Kent County
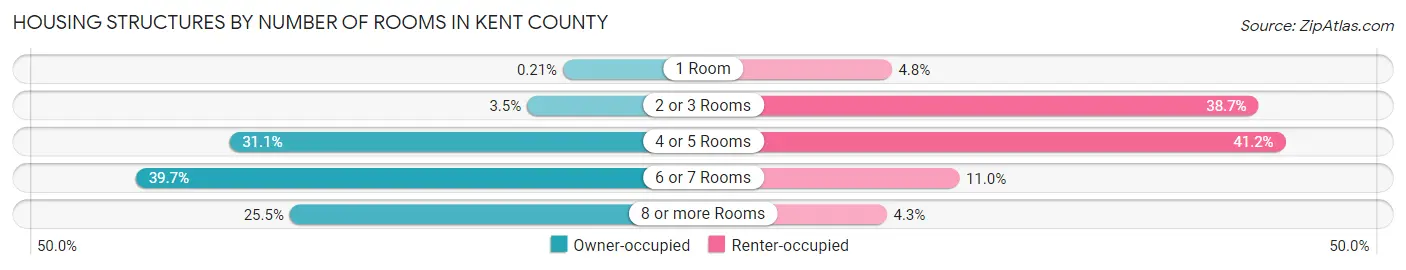
| Number of Rooms | Owner-occupied | Renter-occupied |
| 1 Room | 110 (0.2%) | 961 (4.8%) |
| 2 or 3 Rooms | 1,836 (3.5%) | 7,794 (38.7%) |
| 4 or 5 Rooms | 16,172 (31.1%) | 8,299 (41.2%) |
| 6 or 7 Rooms | 20,677 (39.7%) | 2,218 (11.0%) |
| 8 or more Rooms | 13,263 (25.5%) | 869 (4.3%) |
| Total | 52,058 (100.0%) | 20,141 (100.0%) |
Housing Structure by Heating Type in Kent County
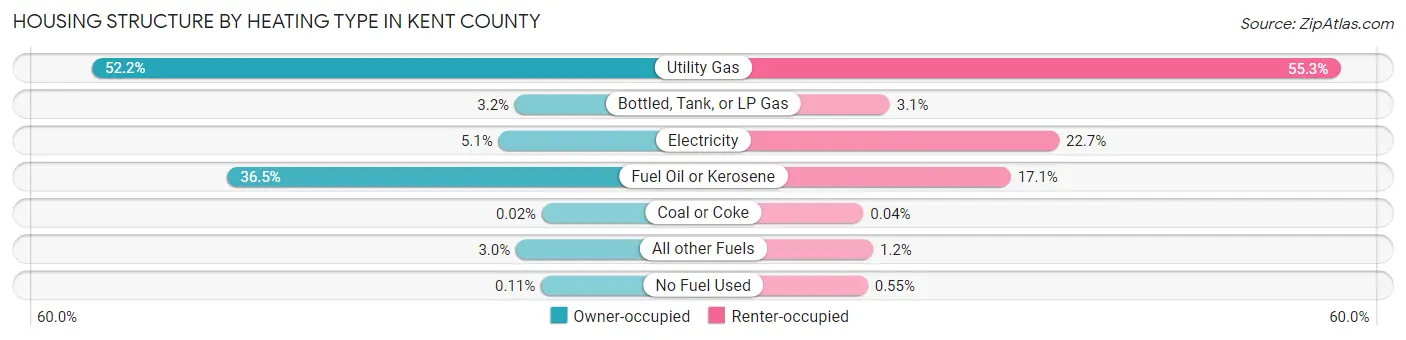
| Heating Type | Owner-occupied | Renter-occupied |
| Utility Gas | 27,159 (52.2%) | 11,139 (55.3%) |
| Bottled, Tank, or LP Gas | 1,640 (3.2%) | 624 (3.1%) |
| Electricity | 2,628 (5.1%) | 4,576 (22.7%) |
| Fuel Oil or Kerosene | 18,992 (36.5%) | 3,449 (17.1%) |
| Coal or Coke | 11 (0.0%) | 8 (0.0%) |
| All other Fuels | 1,573 (3.0%) | 235 (1.2%) |
| No Fuel Used | 55 (0.1%) | 110 (0.5%) |
| Total | 52,058 (100.0%) | 20,141 (100.0%) |
Household Vehicle Usage in Kent County
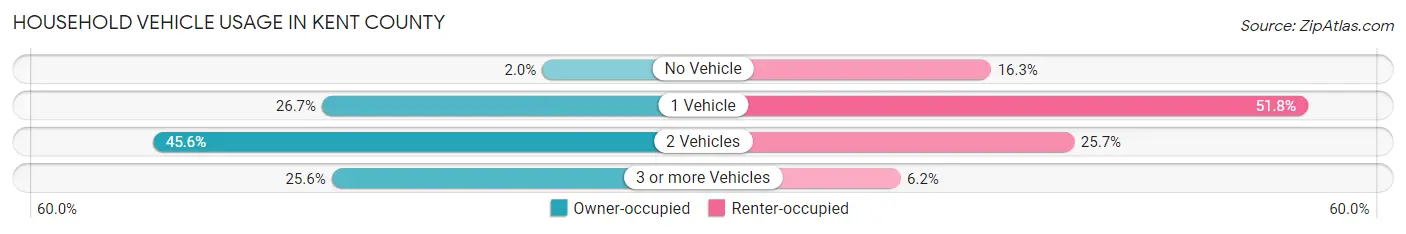
| Vehicles per Household | Owner-occupied | Renter-occupied |
| No Vehicle | 1,059 (2.0%) | 3,289 (16.3%) |
| 1 Vehicle | 13,902 (26.7%) | 10,442 (51.8%) |
| 2 Vehicles | 23,760 (45.6%) | 5,166 (25.7%) |
| 3 or more Vehicles | 13,337 (25.6%) | 1,244 (6.2%) |
| Total | 52,058 (100.0%) | 20,141 (100.0%) |
Real Estate & Mortgages in Kent County
Real Estate and Mortgage Overview in Kent County
| Characteristic | Without Mortgage | With Mortgage |
| Housing Units | 16,134 | 35,924 |
| Median Property Value | $297,200 | $310,300 |
| Median Household Income | $74,984 | $11,757 |
| Monthly Housing Costs | $821 | $6,097 |
| Real Estate Taxes | $4,769 | $285 |
Property Value by Mortgage Status in Kent County
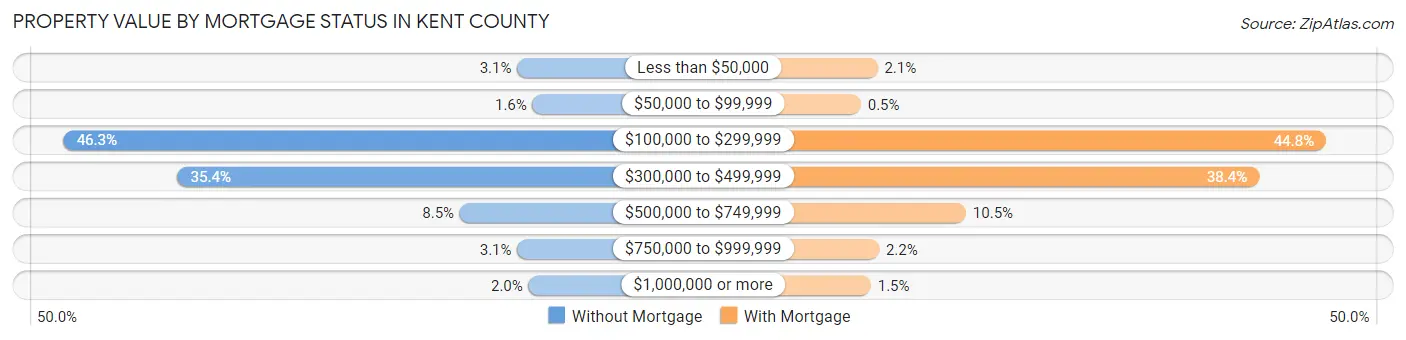
| Property Value | Without Mortgage | With Mortgage |
| Less than $50,000 | 497 (3.1%) | 751 (2.1%) |
| $50,000 to $99,999 | 261 (1.6%) | 180 (0.5%) |
| $100,000 to $299,999 | 7,465 (46.3%) | 16,093 (44.8%) |
| $300,000 to $499,999 | 5,715 (35.4%) | 13,803 (38.4%) |
| $500,000 to $749,999 | 1,378 (8.5%) | 3,775 (10.5%) |
| $750,000 to $999,999 | 496 (3.1%) | 802 (2.2%) |
| $1,000,000 or more | 322 (2.0%) | 520 (1.5%) |
| Total | 16,134 (100.0%) | 35,924 (100.0%) |
Household Income by Mortgage Status in Kent County
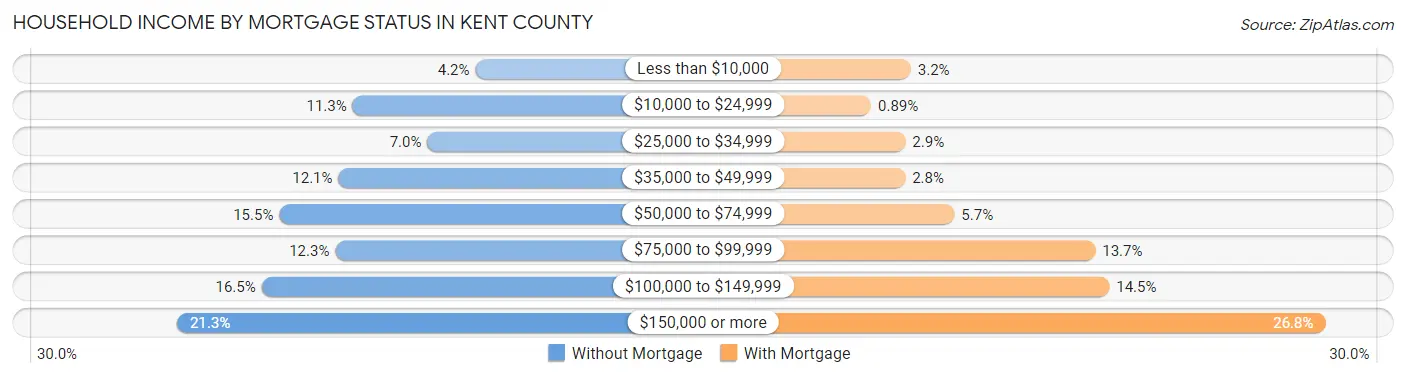
| Household Income | Without Mortgage | With Mortgage |
| Less than $10,000 | 684 (4.2%) | 1,136 (3.2%) |
| $10,000 to $24,999 | 1,816 (11.3%) | 321 (0.9%) |
| $25,000 to $34,999 | 1,128 (7.0%) | 1,023 (2.9%) |
| $35,000 to $49,999 | 1,947 (12.1%) | 1,020 (2.8%) |
| $50,000 to $74,999 | 2,493 (15.4%) | 2,028 (5.7%) |
| $75,000 to $99,999 | 1,976 (12.2%) | 4,922 (13.7%) |
| $100,000 to $149,999 | 2,655 (16.5%) | 5,210 (14.5%) |
| $150,000 or more | 3,435 (21.3%) | 9,643 (26.8%) |
| Total | 16,134 (100.0%) | 35,924 (100.0%) |
Property Value to Household Income Ratio in Kent County
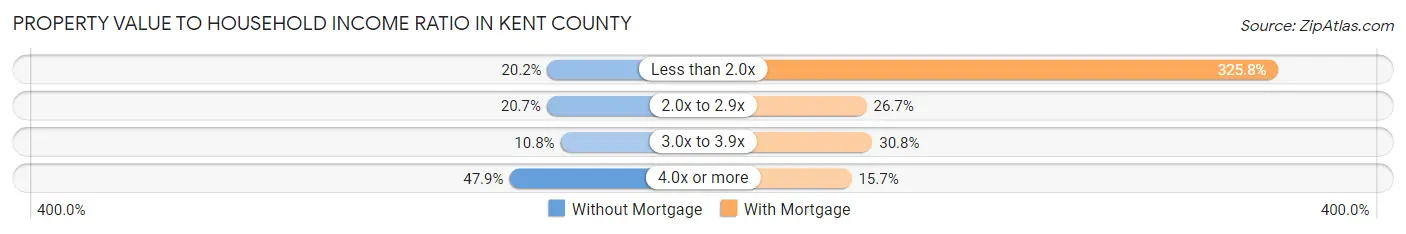
| Value-to-Income Ratio | Without Mortgage | With Mortgage |
| Less than 2.0x | 3,254 (20.2%) | 117,032 (325.8%) |
| 2.0x to 2.9x | 3,331 (20.6%) | 9,582 (26.7%) |
| 3.0x to 3.9x | 1,736 (10.8%) | 11,061 (30.8%) |
| 4.0x or more | 7,726 (47.9%) | 5,624 (15.7%) |
| Total | 16,134 (100.0%) | 35,924 (100.0%) |
Real Estate Taxes by Mortgage Status in Kent County
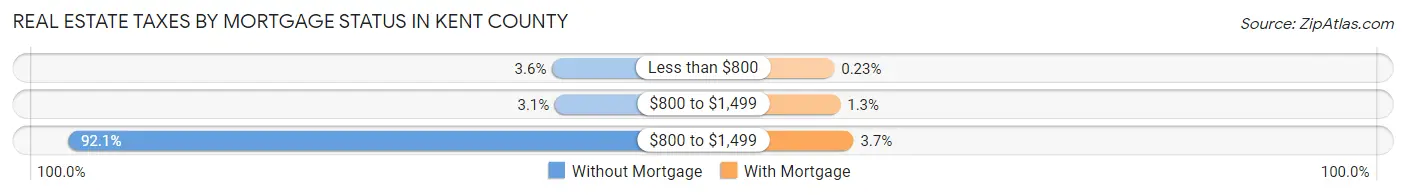
| Property Taxes | Without Mortgage | With Mortgage |
| Less than $800 | 586 (3.6%) | 83 (0.2%) |
| $800 to $1,499 | 500 (3.1%) | 475 (1.3%) |
| $800 to $1,499 | 14,854 (92.1%) | 1,341 (3.7%) |
| Total | 16,134 (100.0%) | 35,924 (100.0%) |
Health & Disability in Kent County
Health Insurance Coverage by Age in Kent County

| Age Bracket | With Coverage | Without Coverage |
| Under 6 Years | 9,397 (97.4%) | 252 (2.6%) |
| 6 to 18 Years | 22,965 (98.3%) | 388 (1.7%) |
| 19 to 25 Years | 12,170 (95.1%) | 623 (4.9%) |
| 26 to 34 Years | 18,831 (93.0%) | 1,426 (7.0%) |
| 35 to 44 Years | 20,602 (95.9%) | 877 (4.1%) |
| 45 to 54 Years | 21,872 (96.8%) | 715 (3.2%) |
| 55 to 64 Years | 25,548 (96.5%) | 922 (3.5%) |
| 65 to 74 Years | 19,202 (99.7%) | 57 (0.3%) |
| 75 Years and older | 12,990 (99.7%) | 44 (0.3%) |
| Total | 163,577 (96.9%) | 5,304 (3.1%) |
Health Insurance Coverage by Citizenship Status in Kent County
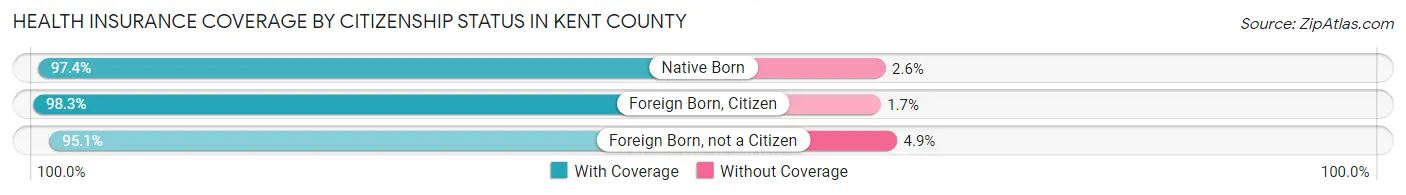
| Citizenship Status | With Coverage | Without Coverage |
| Native Born | 9,397 (97.4%) | 252 (2.6%) |
| Foreign Born, Citizen | 22,965 (98.3%) | 388 (1.7%) |
| Foreign Born, not a Citizen | 12,170 (95.1%) | 623 (4.9%) |
Health Insurance Coverage by Household Income in Kent County
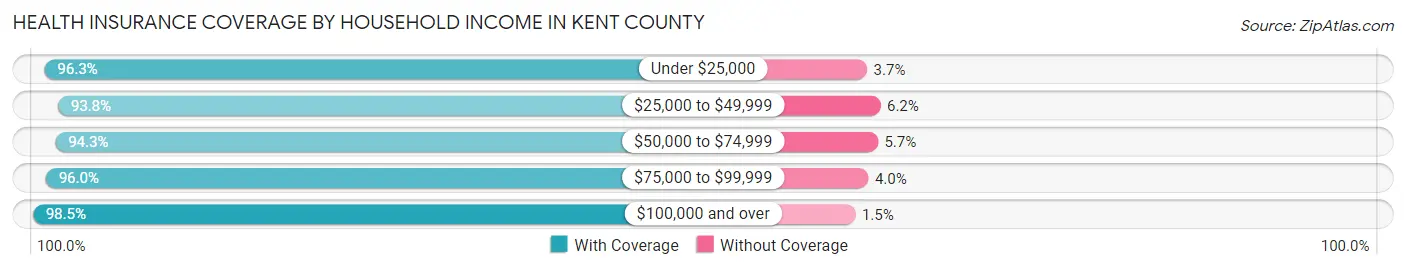
| Household Income | With Coverage | Without Coverage |
| Under $25,000 | 12,876 (96.3%) | 498 (3.7%) |
| $25,000 to $49,999 | 18,741 (93.8%) | 1,246 (6.2%) |
| $50,000 to $74,999 | 20,852 (94.3%) | 1,269 (5.7%) |
| $75,000 to $99,999 | 21,913 (96.0%) | 903 (4.0%) |
| $100,000 and over | 88,564 (98.5%) | 1,380 (1.5%) |
Public vs Private Health Insurance Coverage by Age in Kent County
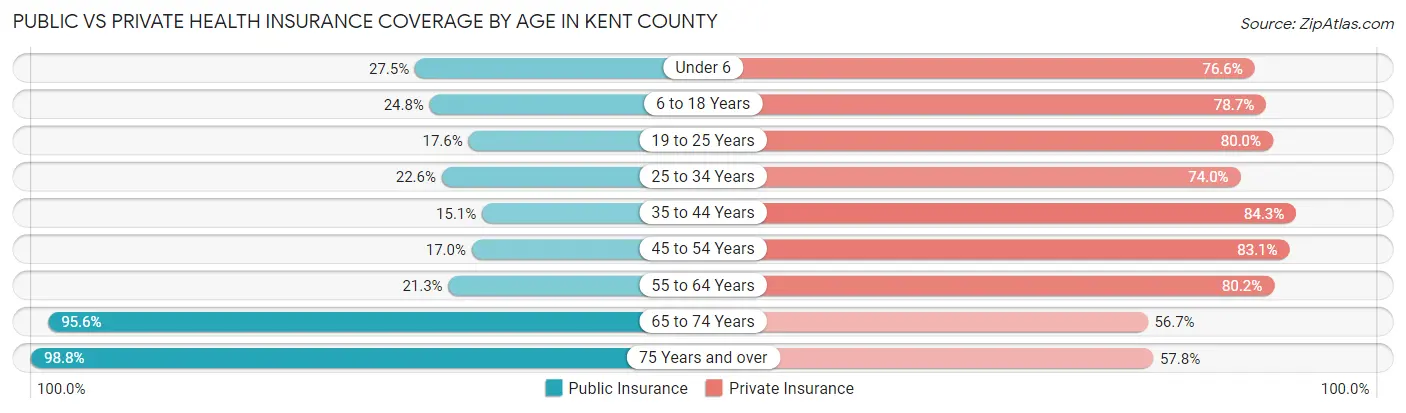
| Age Bracket | Public Insurance | Private Insurance |
| Under 6 | 2,655 (27.5%) | 7,393 (76.6%) |
| 6 to 18 Years | 5,795 (24.8%) | 18,388 (78.7%) |
| 19 to 25 Years | 2,252 (17.6%) | 10,236 (80.0%) |
| 25 to 34 Years | 4,573 (22.6%) | 14,986 (74.0%) |
| 35 to 44 Years | 3,240 (15.1%) | 18,111 (84.3%) |
| 45 to 54 Years | 3,840 (17.0%) | 18,764 (83.1%) |
| 55 to 64 Years | 5,645 (21.3%) | 21,240 (80.2%) |
| 65 to 74 Years | 18,413 (95.6%) | 10,925 (56.7%) |
| 75 Years and over | 12,875 (98.8%) | 7,528 (57.8%) |
| Total | 59,288 (35.1%) | 127,571 (75.5%) |
Disability Status by Sex by Age in Kent County
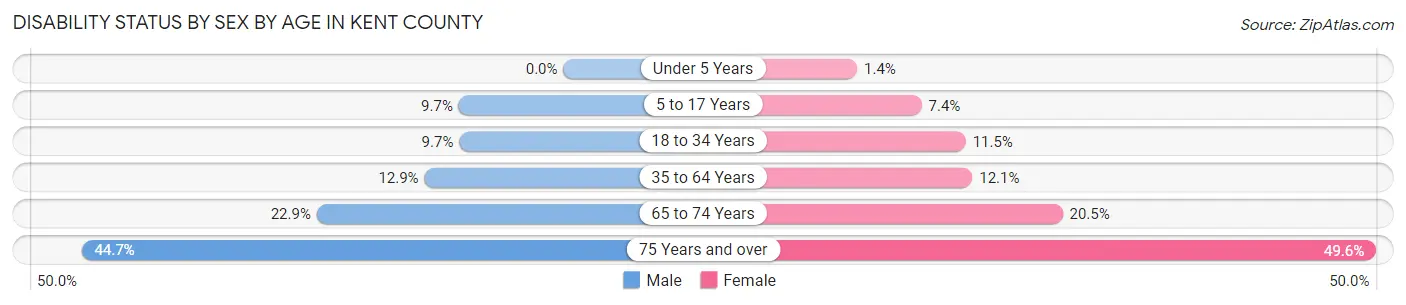
| Age Bracket | Male | Female |
| Under 5 Years | 0 (0.0%) | 54 (1.4%) |
| 5 to 17 Years | 1,169 (9.7%) | 837 (7.4%) |
| 18 to 34 Years | 1,712 (9.7%) | 1,961 (11.5%) |
| 35 to 64 Years | 4,476 (12.9%) | 4,335 (12.1%) |
| 65 to 74 Years | 2,034 (22.9%) | 2,125 (20.5%) |
| 75 Years and over | 2,297 (44.7%) | 3,916 (49.6%) |
Disability Class by Sex by Age in Kent County
Disability Class: Hearing Difficulty
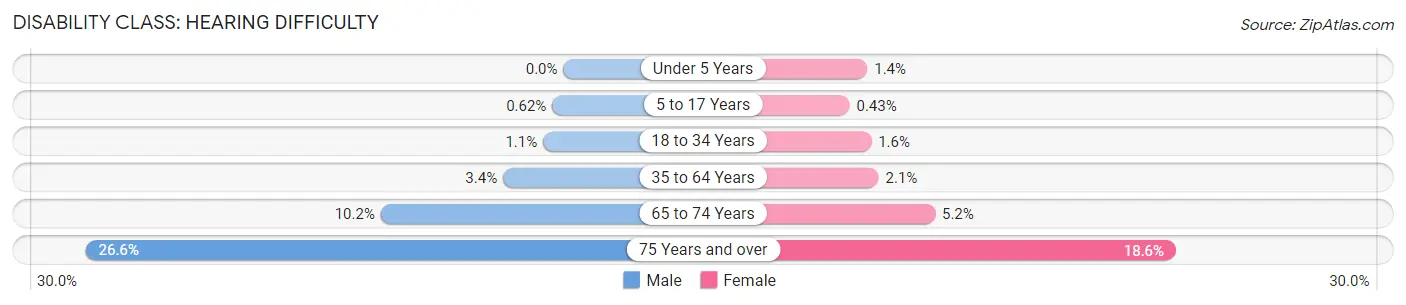
| Age Bracket | Male | Female |
| Under 5 Years | 0 (0.0%) | 54 (1.4%) |
| 5 to 17 Years | 75 (0.6%) | 49 (0.4%) |
| 18 to 34 Years | 201 (1.1%) | 280 (1.6%) |
| 35 to 64 Years | 1,166 (3.4%) | 733 (2.1%) |
| 65 to 74 Years | 904 (10.2%) | 538 (5.2%) |
| 75 Years and over | 1,366 (26.6%) | 1,469 (18.6%) |
Disability Class: Vision Difficulty
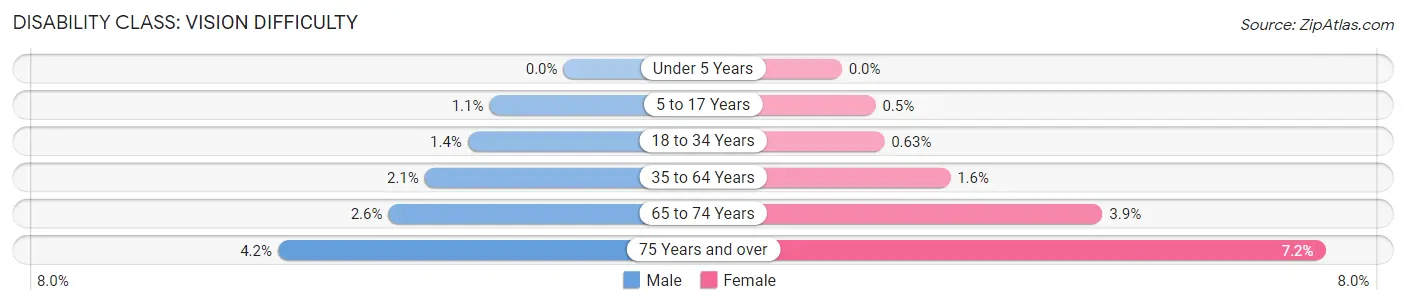
| Age Bracket | Male | Female |
| Under 5 Years | 0 (0.0%) | 0 (0.0%) |
| 5 to 17 Years | 133 (1.1%) | 57 (0.5%) |
| 18 to 34 Years | 252 (1.4%) | 108 (0.6%) |
| 35 to 64 Years | 716 (2.1%) | 578 (1.6%) |
| 65 to 74 Years | 231 (2.6%) | 401 (3.9%) |
| 75 Years and over | 218 (4.2%) | 567 (7.2%) |
Disability Class: Cognitive Difficulty
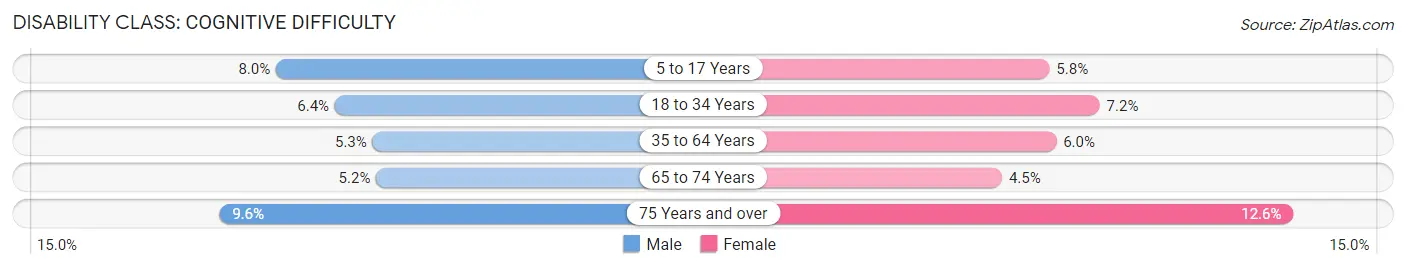
| Age Bracket | Male | Female |
| 5 to 17 Years | 963 (8.0%) | 652 (5.8%) |
| 18 to 34 Years | 1,128 (6.4%) | 1,225 (7.2%) |
| 35 to 64 Years | 1,843 (5.3%) | 2,139 (6.0%) |
| 65 to 74 Years | 463 (5.2%) | 463 (4.5%) |
| 75 Years and over | 492 (9.6%) | 993 (12.6%) |
Disability Class: Ambulatory Difficulty
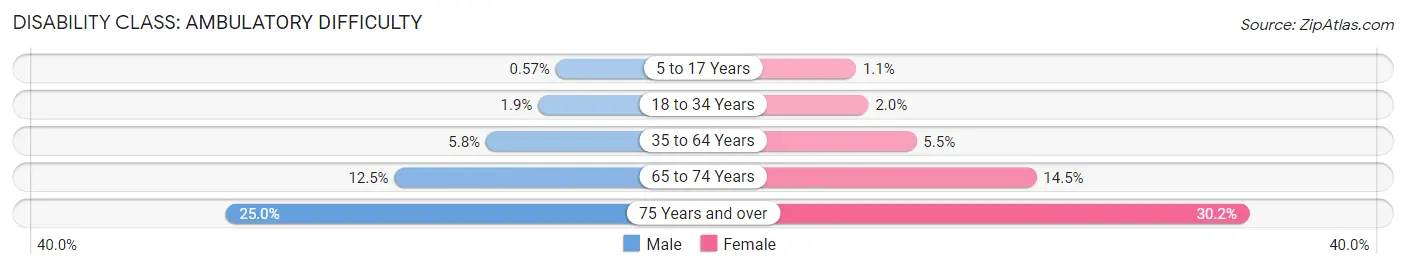
| Age Bracket | Male | Female |
| 5 to 17 Years | 69 (0.6%) | 119 (1.1%) |
| 18 to 34 Years | 332 (1.9%) | 337 (2.0%) |
| 35 to 64 Years | 1,998 (5.8%) | 1,984 (5.5%) |
| 65 to 74 Years | 1,114 (12.5%) | 1,499 (14.4%) |
| 75 Years and over | 1,285 (25.0%) | 2,386 (30.2%) |
Disability Class: Self-Care Difficulty
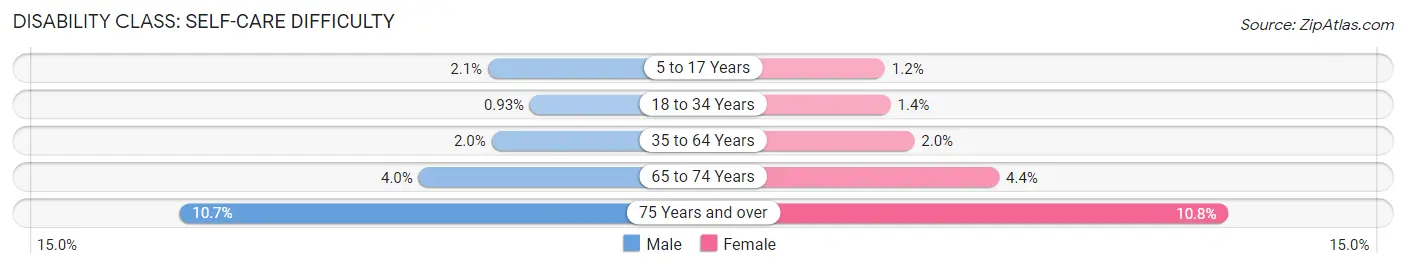
| Age Bracket | Male | Female |
| 5 to 17 Years | 253 (2.1%) | 136 (1.2%) |
| 18 to 34 Years | 164 (0.9%) | 232 (1.4%) |
| 35 to 64 Years | 695 (2.0%) | 724 (2.0%) |
| 65 to 74 Years | 358 (4.0%) | 454 (4.4%) |
| 75 Years and over | 549 (10.7%) | 850 (10.8%) |
Technology Access in Kent County
Computing Device Access in Kent County
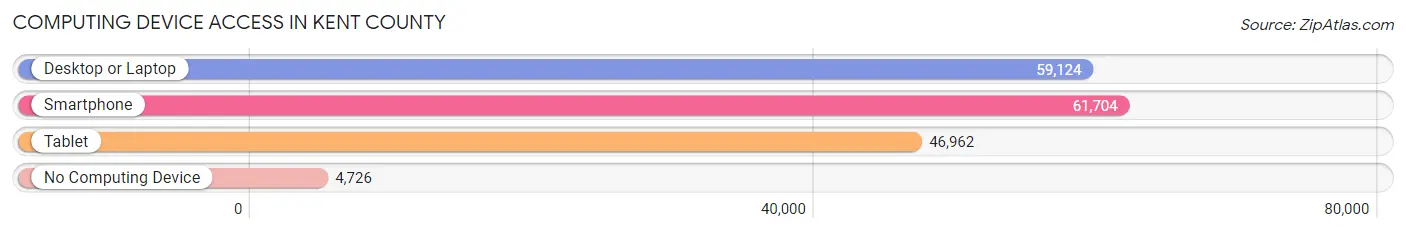
| Device Type | # Households | % Households |
| Desktop or Laptop | 59,124 | 81.9% |
| Smartphone | 61,704 | 85.5% |
| Tablet | 46,962 | 65.0% |
| No Computing Device | 4,726 | 6.6% |
| Total | 72,199 | 100.0% |
Internet Access in Kent County
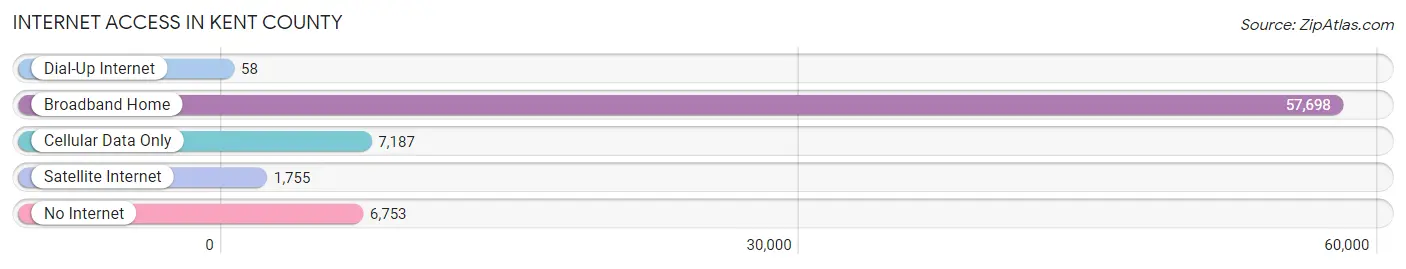
| Internet Type | # Households | % Households |
| Dial-Up Internet | 58 | 0.1% |
| Broadband Home | 57,698 | 79.9% |
| Cellular Data Only | 7,187 | 10.0% |
| Satellite Internet | 1,755 | 2.4% |
| No Internet | 6,753 | 9.3% |
| Total | 72,199 | 100.0% |
Kent County Summary
Kent County is a county located in the state of Rhode Island in the United States. It is the second smallest county in the state, with a total area of just over 200 square miles. As of the 2010 census, the population was 166,158, making it the most populous county in the state.
Geography
Kent County is located in the southeastern corner of Rhode Island, bordered by Washington County to the north, Providence County to the east, and Bristol County to the south. The county is divided into two distinct regions: the East Bay and the West Bay. The East Bay is the larger of the two regions, and is home to the cities of Warwick, East Greenwich, and West Warwick. The West Bay is home to the cities of Cranston, Johnston, and North Providence. The county is also home to several small towns, including Coventry, West Greenwich, and Exeter.
The county is mostly flat, with some rolling hills in the western part of the county. The highest point in the county is located in the town of Coventry, at an elevation of 545 feet. The county is drained by several rivers, including the Pawtuxet, the Blackstone, and the Seekonk.
Climate
Kent County has a humid continental climate, with warm summers and cold winters. The average annual temperature is around 50 degrees Fahrenheit, with temperatures ranging from the low 30s in the winter to the mid-80s in the summer. The county receives an average of around 40 inches of precipitation per year, with the majority of it falling in the form of snow in the winter months.
Demographics
As of the 2010 census, the population of Kent County was 166,158, making it the most populous county in the state. The population is spread out across the county, with the largest cities being Warwick (82,672), Cranston (80,387), and East Greenwich (13,146). The population is predominantly white (90.2%), with smaller percentages of African Americans (3.3%), Asians (2.2%), and Hispanics (2.1%).
The median household income in the county is $60,845, and the median family income is $71,845. The per capita income is $30,845. The unemployment rate in the county is 5.2%, slightly lower than the national average of 5.5%.
Economy
The economy of Kent County is largely based on the service industry, with the largest employers being healthcare, retail, and education. The county is home to several large employers, including the University of Rhode Island, Rhode Island Hospital, and the Rhode Island Department of Education. The county is also home to several large manufacturing companies, including Textron, Amgen, and Hasbro.
The county is also home to several tourist attractions, including the Roger Williams Park Zoo, the Providence Performing Arts Center, and the Newport Mansions.
Conclusion
Kent County is a county located in the southeastern corner of Rhode Island. It is the most populous county in the state, with a population of 166,158 as of the 2010 census. The county is largely based on the service industry, with the largest employers being healthcare, retail, and education. The county is also home to several tourist attractions, including the Roger Williams Park Zoo, the Providence Performing Arts Center, and the Newport Mansions.
Common Questions
What is Per Capita Income in Kent County?
Per Capita income in Kent County is $46,564.
What is the Median Family Income in Kent County?
Median Family Income in Kent County is $108,061.
What is the Median Household income in Kent County?
Median Household Income in Kent County is $85,732.
What is Income or Wage Gap in Kent County?
Income or Wage Gap in Kent County is 22.3%.
Women in Kent County earn 77.7 cents for every dollar earned by a man.
What is Family Income Deficit in Kent County?
Family Income Deficit in Kent County is $9,664.
Families that are below poverty line in Kent County earn $9,664 less on average than the poverty threshold level.
What is Inequality or Gini Index in Kent County?
Inequality or Gini Index in Kent County is 0.44.
What is the Total Population of Kent County?
Total Population of Kent County is 170,168.
What is the Total Male Population of Kent County?
Total Male Population of Kent County is 83,198.
What is the Total Female Population of Kent County?
Total Female Population of Kent County is 86,970.
What is the Ratio of Males per 100 Females in Kent County?
There are 95.66 Males per 100 Females in Kent County.
What is the Ratio of Females per 100 Males in Kent County?
There are 104.53 Females per 100 Males in Kent County.
What is the Median Population Age in Kent County?
Median Population Age in Kent County is 43.6 Years.
What is the Average Family Size in Kent County
Average Family Size in Kent County is 2.9 People.
What is the Average Household Size in Kent County
Average Household Size in Kent County is 2.3 People.
How Large is the Labor Force in Kent County?
There are 94,870 People in the Labor Forcein in Kent County.
What is the Percentage of People in the Labor Force in Kent County?
66.4% of People are in the Labor Force in Kent County.
What is the Unemployment Rate in Kent County?
Unemployment Rate in Kent County is 4.6%.