Bristol County, RI Map & Demographics
Bristol County Map

Bristol County Overview
$56,739
PER CAPITA INCOME
$135,125
AVG FAMILY INCOME
$105,875
AVG HOUSEHOLD INCOME
38.3%
WAGE / INCOME GAP [ % ]
61.7¢/ $1
WAGE / INCOME GAP [ $ ]
$8,692
FAMILY INCOME DEFICIT
0.48
INEQUALITY / GINI INDEX
50,658
TOTAL POPULATION
24,571
MALE POPULATION
26,087
FEMALE POPULATION
94.19
MALES / 100 FEMALES
106.17
FEMALES / 100 MALES
43.9
MEDIAN AGE
3.0
AVG FAMILY SIZE
2.4
AVG HOUSEHOLD SIZE
27,206
LABOR FORCE [ PEOPLE ]
63.6%
PERCENT IN LABOR FORCE
4.1%
UNEMPLOYMENT RATE
Bristol County Area Codes
Income in Bristol County
Income Overview in Bristol County
Per Capita Income in Bristol County is $56,739, while median incomes of families and households are $135,125 and $105,875 respectively.
| Characteristic | Number | Measure |
| Per Capita Income | 50,658 | $56,739 |
| Median Family Income | 12,546 | $135,125 |
| Mean Family Income | 12,546 | $182,382 |
| Median Household Income | 19,173 | $105,875 |
| Mean Household Income | 19,173 | $145,356 |
| Income Deficit | 12,546 | $8,692 |
| Wage / Income Gap (%) | 50,658 | 38.27% |
| Wage / Income Gap ($) | 50,658 | 61.73¢ per $1 |
| Gini / Inequality Index | 50,658 | 0.48 |
Earnings by Sex in Bristol County
Average Earnings in Bristol County are $49,695, $64,000 for men and $39,510 for women, a difference of 38.3%.
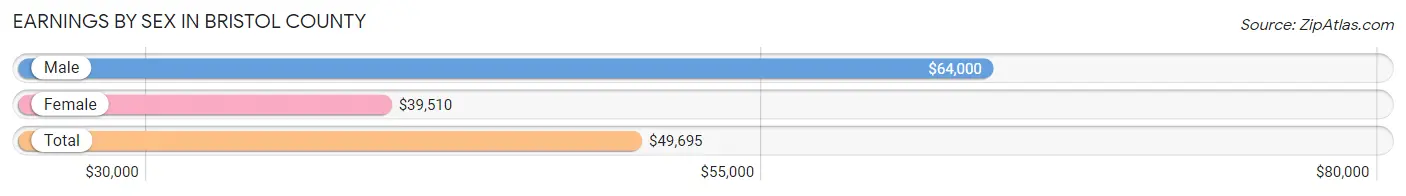
| Sex | Number | Average Earnings |
| Male | 14,852 (49.6%) | $64,000 |
| Female | 15,099 (50.4%) | $39,510 |
| Total | 29,951 (100.0%) | $49,695 |
Earnings by Sex by Income Bracket in Bristol County
The most common earnings brackets in Bristol County are $100,000+ for men (4,967 | 33.4%) and $100,000+ for women (2,131 | 14.1%).
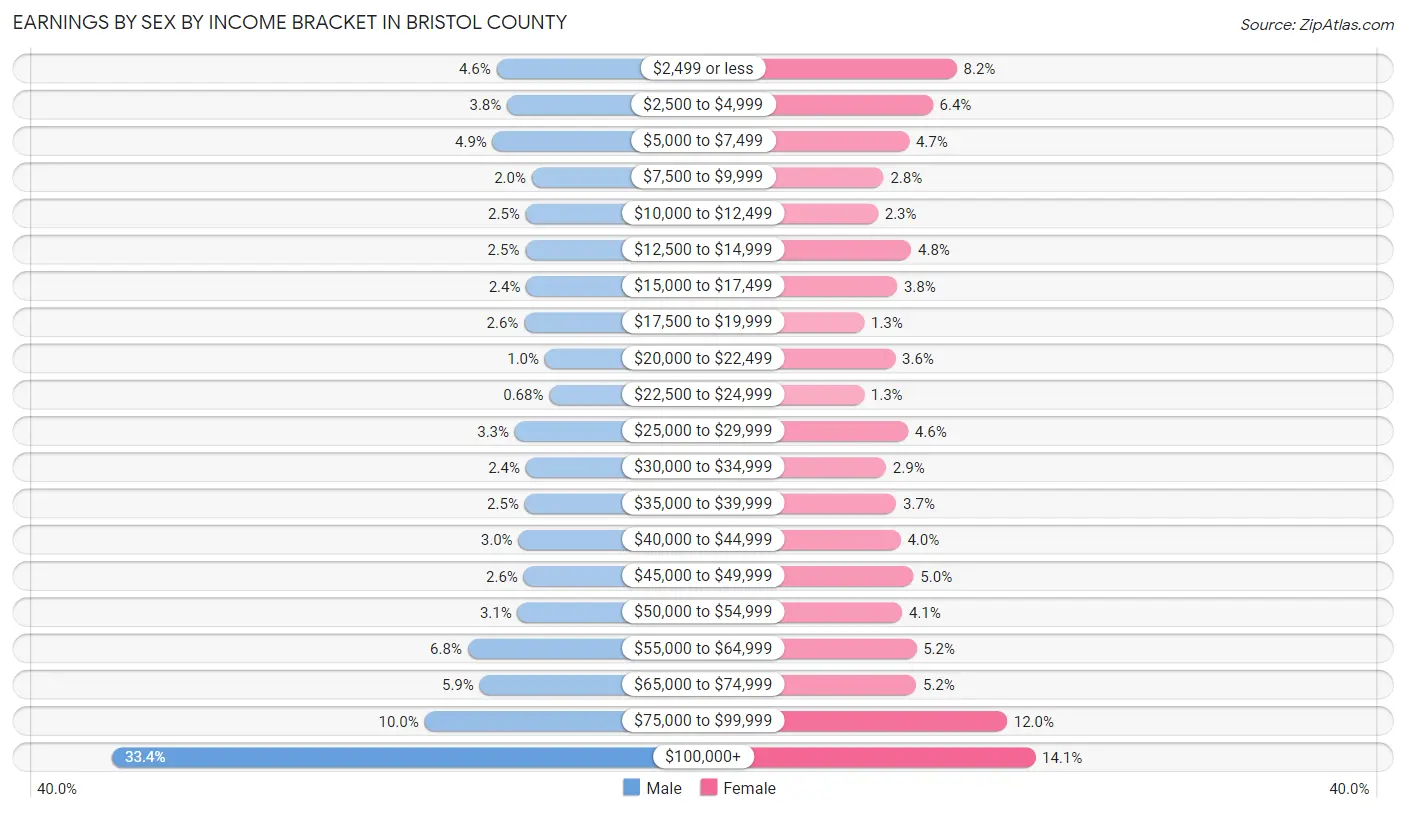
| Income | Male | Female |
| $2,499 or less | 687 (4.6%) | 1,242 (8.2%) |
| $2,500 to $4,999 | 570 (3.8%) | 971 (6.4%) |
| $5,000 to $7,499 | 731 (4.9%) | 703 (4.7%) |
| $7,500 to $9,999 | 296 (2.0%) | 415 (2.8%) |
| $10,000 to $12,499 | 364 (2.5%) | 351 (2.3%) |
| $12,500 to $14,999 | 369 (2.5%) | 728 (4.8%) |
| $15,000 to $17,499 | 356 (2.4%) | 568 (3.8%) |
| $17,500 to $19,999 | 380 (2.6%) | 195 (1.3%) |
| $20,000 to $22,499 | 150 (1.0%) | 546 (3.6%) |
| $22,500 to $24,999 | 101 (0.7%) | 194 (1.3%) |
| $25,000 to $29,999 | 484 (3.3%) | 691 (4.6%) |
| $30,000 to $34,999 | 363 (2.4%) | 442 (2.9%) |
| $35,000 to $39,999 | 375 (2.5%) | 558 (3.7%) |
| $40,000 to $44,999 | 444 (3.0%) | 607 (4.0%) |
| $45,000 to $49,999 | 386 (2.6%) | 753 (5.0%) |
| $50,000 to $54,999 | 455 (3.1%) | 625 (4.1%) |
| $55,000 to $64,999 | 1,009 (6.8%) | 785 (5.2%) |
| $65,000 to $74,999 | 876 (5.9%) | 784 (5.2%) |
| $75,000 to $99,999 | 1,489 (10.0%) | 1,810 (12.0%) |
| $100,000+ | 4,967 (33.4%) | 2,131 (14.1%) |
| Total | 14,852 (100.0%) | 15,099 (100.0%) |
Earnings by Sex by Educational Attainment in Bristol County
Average earnings in Bristol County are $81,745 for men and $50,170 for women, a difference of 38.6%. Men with an educational attainment of graduate degree enjoy the highest average annual earnings of $120,884, while those with high school diploma education earn the least with $50,511. Women with an educational attainment of graduate degree earn the most with the average annual earnings of $82,746, while those with less than high school education have the smallest earnings of $28,625.
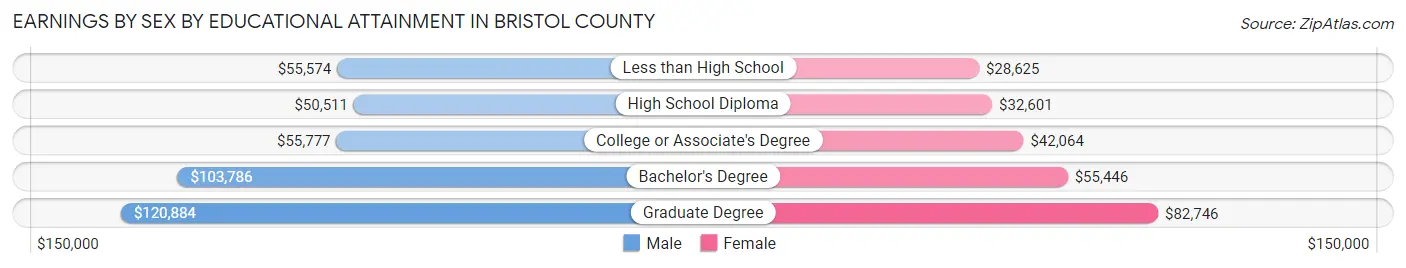
| Educational Attainment | Male Income | Female Income |
| Less than High School | $55,574 | $28,625 |
| High School Diploma | $50,511 | $32,601 |
| College or Associate's Degree | $55,777 | $42,064 |
| Bachelor's Degree | $103,786 | $55,446 |
| Graduate Degree | $120,884 | $82,746 |
| Total | $81,745 | $50,170 |
Family Income in Bristol County
Family Income Brackets in Bristol County
According to the Bristol County family income data, there are 3,475 families falling into the $200,000+ income range, which is the most common income bracket and makes up 27.7% of all families. Conversely, the $10,000 to $14,999 income bracket is the least frequent group with only 63 families (0.5%) belonging to this category.
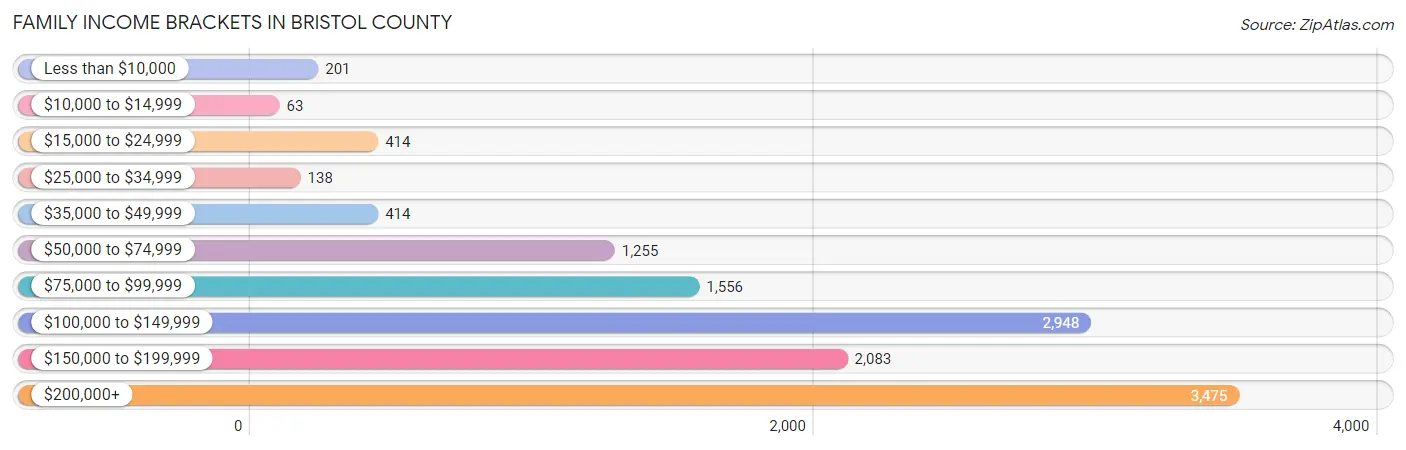
| Income Bracket | # Families | % Families |
| Less than $10,000 | 201 | 1.6% |
| $10,000 to $14,999 | 63 | 0.5% |
| $15,000 to $24,999 | 414 | 3.3% |
| $25,000 to $34,999 | 138 | 1.1% |
| $35,000 to $49,999 | 414 | 3.3% |
| $50,000 to $74,999 | 1,255 | 10.0% |
| $75,000 to $99,999 | 1,556 | 12.4% |
| $100,000 to $149,999 | 2,948 | 23.5% |
| $150,000 to $199,999 | 2,083 | 16.6% |
| $200,000+ | 3,475 | 27.7% |
Family Income by Famaliy Size in Bristol County
7+ person families (102 | 0.8%) account for the highest median family income in Bristol County with $230,942 per family, while 2-person families (5,899 | 47.0%) have the highest median income of $56,898 per family member.
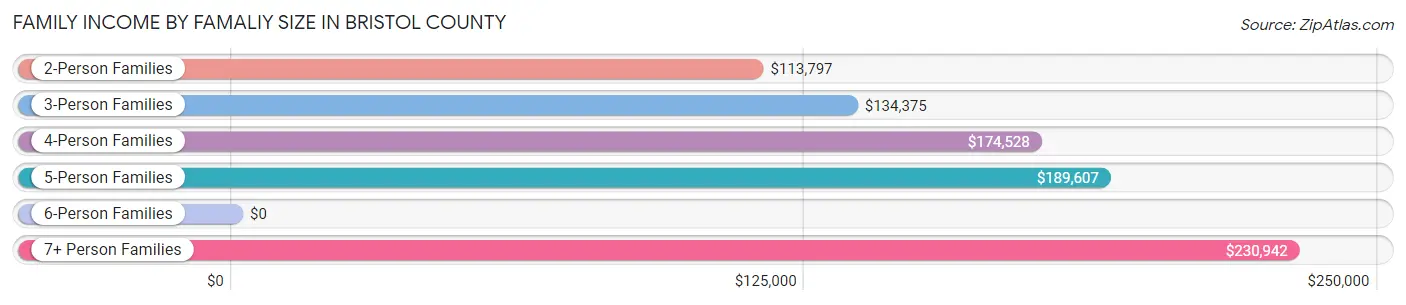
| Income Bracket | # Families | Median Income |
| 2-Person Families | 5,899 (47.0%) | $113,797 |
| 3-Person Families | 2,986 (23.8%) | $134,375 |
| 4-Person Families | 2,770 (22.1%) | $174,528 |
| 5-Person Families | 657 (5.2%) | $189,607 |
| 6-Person Families | 132 (1.1%) | $0 |
| 7+ Person Families | 102 (0.8%) | $230,942 |
| Total | 12,546 (100.0%) | $135,125 |
Family Income by Number of Earners in Bristol County
The median family income in Bristol County is $135,125, with families comprising 3+ earners (1,964) having the highest median family income of $186,923, while families with no earners (1,559) have the lowest median family income of $71,875, accounting for 15.7% and 12.4% of families, respectively.
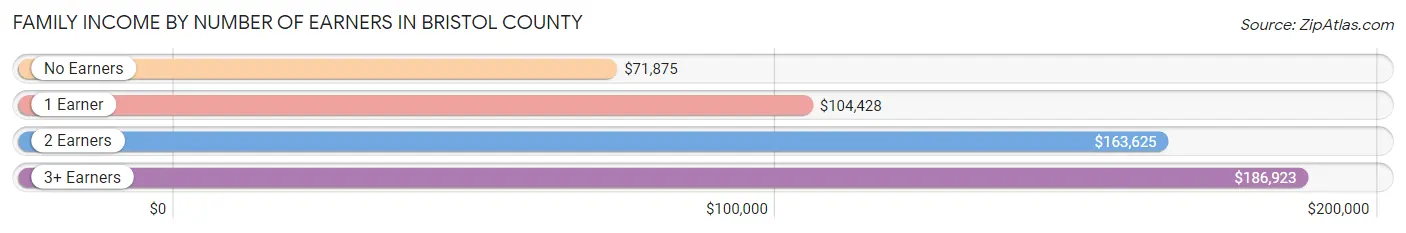
| Number of Earners | # Families | Median Income |
| No Earners | 1,559 (12.4%) | $71,875 |
| 1 Earner | 3,468 (27.6%) | $104,428 |
| 2 Earners | 5,555 (44.3%) | $163,625 |
| 3+ Earners | 1,964 (15.7%) | $186,923 |
| Total | 12,546 (100.0%) | $135,125 |
Household Income in Bristol County
Household Income Brackets in Bristol County
With 3,969 households falling in the category, the $200,000+ income range is the most frequent in Bristol County, accounting for 20.7% of all households. In contrast, only 575 households (3.0%) fall into the $10,000 to $14,999 income bracket, making it the least populous group.
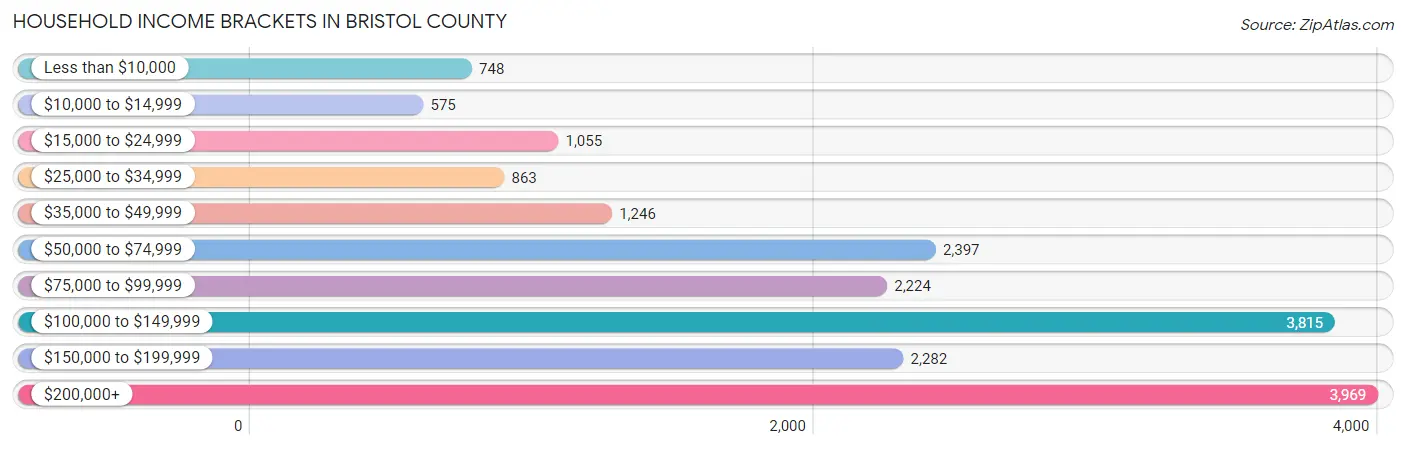
| Income Bracket | # Households | % Households |
| Less than $10,000 | 748 | 3.9% |
| $10,000 to $14,999 | 575 | 3.0% |
| $15,000 to $24,999 | 1,055 | 5.5% |
| $25,000 to $34,999 | 863 | 4.5% |
| $35,000 to $49,999 | 1,246 | 6.5% |
| $50,000 to $74,999 | 2,397 | 12.5% |
| $75,000 to $99,999 | 2,224 | 11.6% |
| $100,000 to $149,999 | 3,815 | 19.9% |
| $150,000 to $199,999 | 2,282 | 11.9% |
| $200,000+ | 3,969 | 20.7% |
Household Income by Householder Age in Bristol County
The median household income in Bristol County is $105,875, with the highest median household income of $123,704 found in the 45 to 64 years age bracket for the primary householder. A total of 8,045 households (42.0%) fall into this category. Meanwhile, the 15 to 24 years age bracket for the primary householder has the lowest median household income of $0, with 278 households (1.5%) in this group.
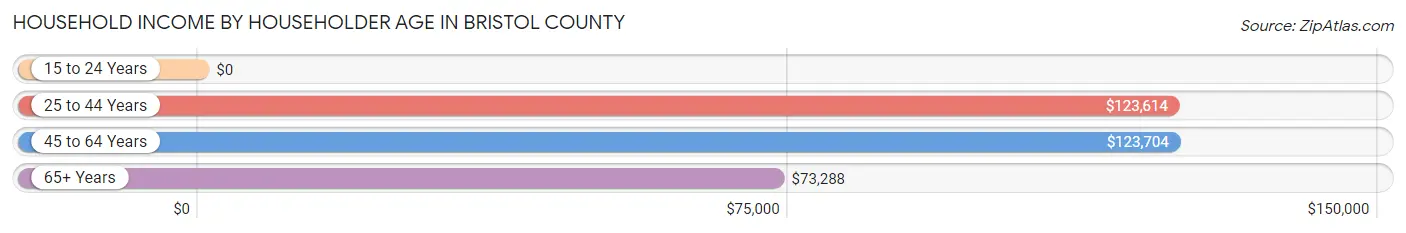
| Income Bracket | # Households | Median Income |
| 15 to 24 Years | 278 (1.5%) | $0 |
| 25 to 44 Years | 4,655 (24.3%) | $123,614 |
| 45 to 64 Years | 8,045 (42.0%) | $123,704 |
| 65+ Years | 6,195 (32.3%) | $73,288 |
| Total | 19,173 (100.0%) | $105,875 |
Poverty in Bristol County
Income Below Poverty by Sex and Age in Bristol County
With 6.2% poverty level for males and 8.2% for females among the residents of Bristol County, 25 to 34 year old males and 75 year old and over females are the most vulnerable to poverty, with 360 males (13.5%) and 517 females (20.5%) in their respective age groups living below the poverty level.
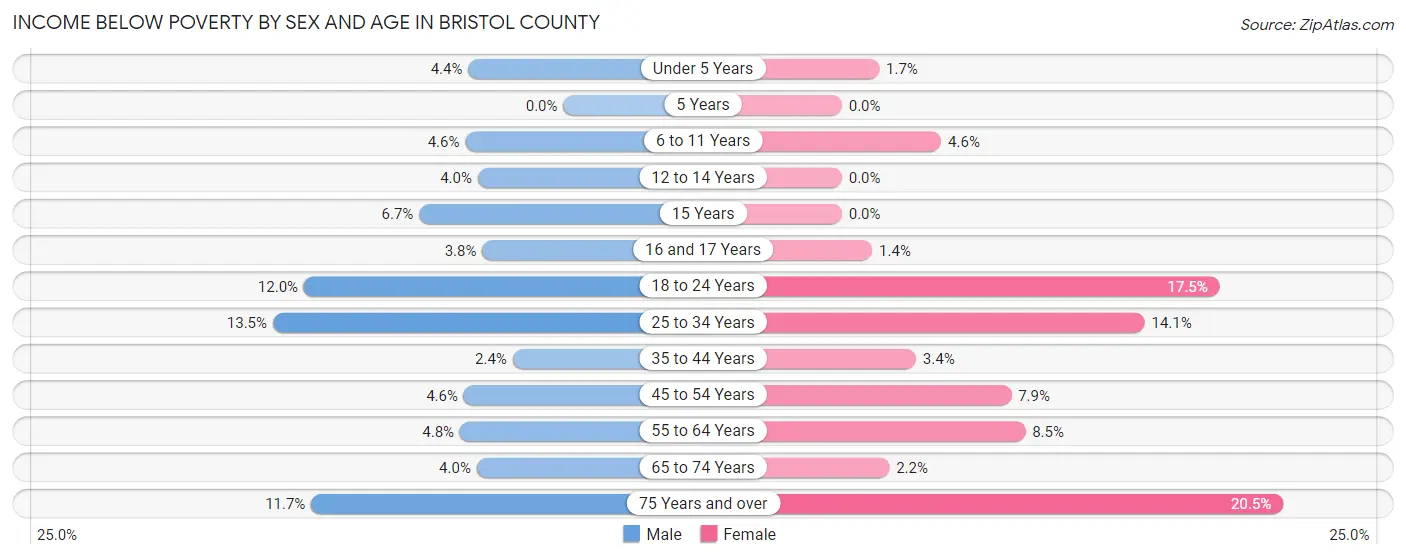
| Age Bracket | Male | Female |
| Under 5 Years | 43 (4.4%) | 17 (1.7%) |
| 5 Years | 0 (0.0%) | 0 (0.0%) |
| 6 to 11 Years | 58 (4.5%) | 66 (4.6%) |
| 12 to 14 Years | 42 (4.0%) | 0 (0.0%) |
| 15 Years | 19 (6.7%) | 0 (0.0%) |
| 16 and 17 Years | 25 (3.8%) | 9 (1.4%) |
| 18 to 24 Years | 187 (12.0%) | 241 (17.5%) |
| 25 to 34 Years | 360 (13.5%) | 365 (14.1%) |
| 35 to 44 Years | 64 (2.4%) | 98 (3.4%) |
| 45 to 54 Years | 150 (4.6%) | 259 (7.9%) |
| 55 to 64 Years | 182 (4.8%) | 346 (8.5%) |
| 65 to 74 Years | 105 (4.0%) | 65 (2.2%) |
| 75 Years and over | 176 (11.7%) | 517 (20.5%) |
| Total | 1,411 (6.2%) | 1,983 (8.2%) |
Income Above Poverty by Sex and Age in Bristol County
According to the poverty statistics in Bristol County, males aged 5 years and females aged 5 years are the age groups that are most secure financially, with 100.0% of males and 100.0% of females in these age groups living above the poverty line.
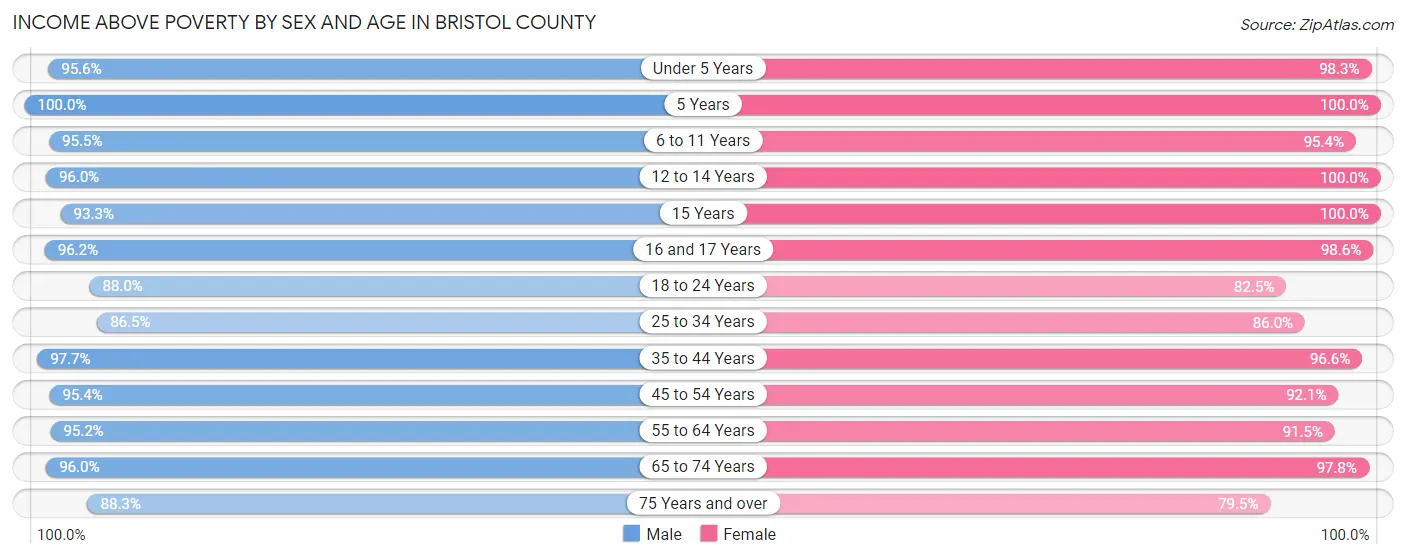
| Age Bracket | Male | Female |
| Under 5 Years | 931 (95.6%) | 964 (98.3%) |
| 5 Years | 348 (100.0%) | 283 (100.0%) |
| 6 to 11 Years | 1,218 (95.5%) | 1,367 (95.4%) |
| 12 to 14 Years | 1,016 (96.0%) | 942 (100.0%) |
| 15 Years | 265 (93.3%) | 251 (100.0%) |
| 16 and 17 Years | 640 (96.2%) | 628 (98.6%) |
| 18 to 24 Years | 1,366 (88.0%) | 1,134 (82.5%) |
| 25 to 34 Years | 2,311 (86.5%) | 2,233 (86.0%) |
| 35 to 44 Years | 2,663 (97.7%) | 2,749 (96.6%) |
| 45 to 54 Years | 3,094 (95.4%) | 3,038 (92.1%) |
| 55 to 64 Years | 3,609 (95.2%) | 3,720 (91.5%) |
| 65 to 74 Years | 2,510 (96.0%) | 2,893 (97.8%) |
| 75 Years and over | 1,328 (88.3%) | 2,007 (79.5%) |
| Total | 21,299 (93.8%) | 22,209 (91.8%) |
Income Below Poverty Among Married-Couple Families in Bristol County
The poverty statistics for married-couple families in Bristol County show that 1.5% or 150 of the total 10,114 families live below the poverty line. Families with no children have the highest poverty rate of 2.3%, comprising of 138 families. On the other hand, families with 3 or 4 children have the lowest poverty rate of 0.0%, which includes 0 families.
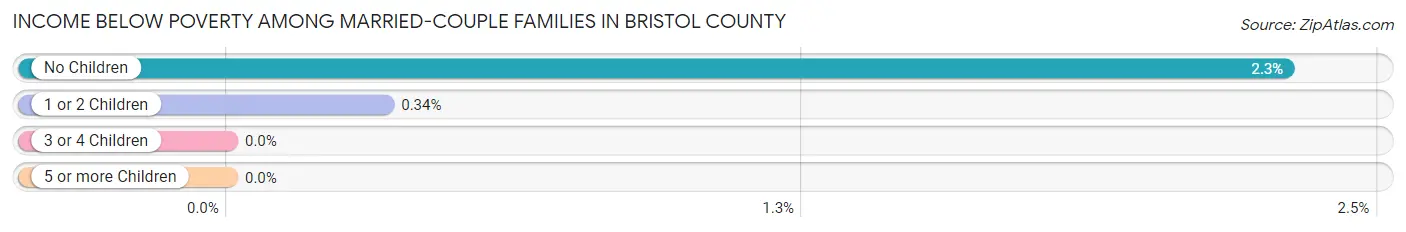
| Children | Above Poverty | Below Poverty |
| No Children | 5,871 (97.7%) | 138 (2.3%) |
| 1 or 2 Children | 3,544 (99.7%) | 12 (0.3%) |
| 3 or 4 Children | 548 (100.0%) | 0 (0.0%) |
| 5 or more Children | 1 (100.0%) | 0 (0.0%) |
| Total | 9,964 (98.5%) | 150 (1.5%) |
Income Below Poverty Among Single-Parent Households in Bristol County
According to the poverty data in Bristol County, 11.9% or 79 single-father households and 15.0% or 265 single-mother households are living below the poverty line. Among single-father households, those with no children have the highest poverty rate, with 35 households (13.5%) experiencing poverty. Likewise, among single-mother households, those with 1 or 2 children have the highest poverty rate, with 218 households (26.6%) falling below the poverty line.
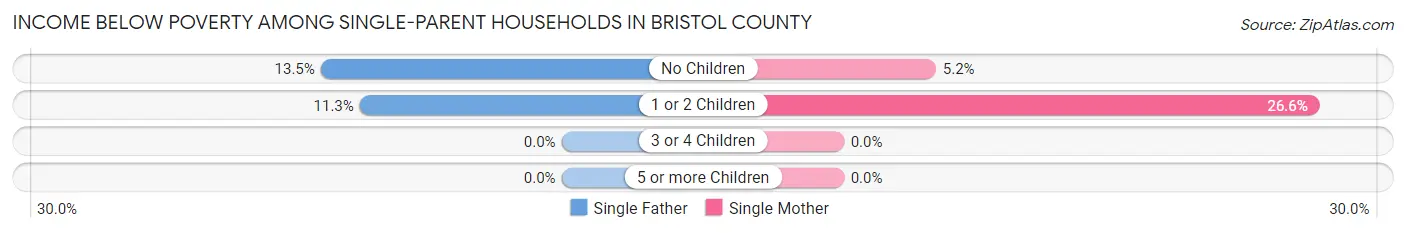
| Children | Single Father | Single Mother |
| No Children | 35 (13.5%) | 47 (5.1%) |
| 1 or 2 Children | 44 (11.3%) | 218 (26.6%) |
| 3 or 4 Children | 0 (0.0%) | 0 (0.0%) |
| 5 or more Children | 0 (0.0%) | 0 (0.0%) |
| Total | 79 (11.9%) | 265 (15.0%) |
Income Below Poverty Among Married-Couple vs Single-Parent Households in Bristol County
The poverty data for Bristol County shows that 150 of the married-couple family households (1.5%) and 344 of the single-parent households (14.1%) are living below the poverty level. Within the married-couple family households, those with no children have the highest poverty rate, with 138 households (2.3%) falling below the poverty line. Among the single-parent households, those with 1 or 2 children have the highest poverty rate, with 262 household (21.6%) living below poverty.
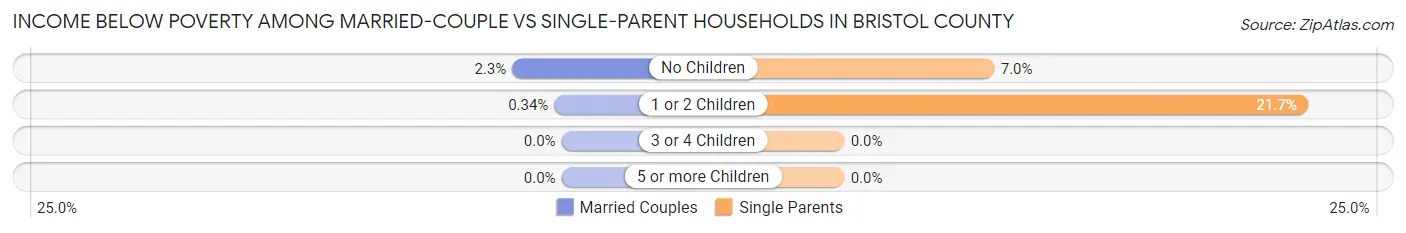
| Children | Married-Couple Families | Single-Parent Households |
| No Children | 138 (2.3%) | 82 (7.0%) |
| 1 or 2 Children | 12 (0.3%) | 262 (21.6%) |
| 3 or 4 Children | 0 (0.0%) | 0 (0.0%) |
| 5 or more Children | 0 (0.0%) | 0 (0.0%) |
| Total | 150 (1.5%) | 344 (14.1%) |
Race in Bristol County
The most populous races in Bristol County are White / Caucasian (46,374 | 91.5%), Two or more Races (2,012 | 4.0%), and Hispanic or Latino (1,728 | 3.4%).
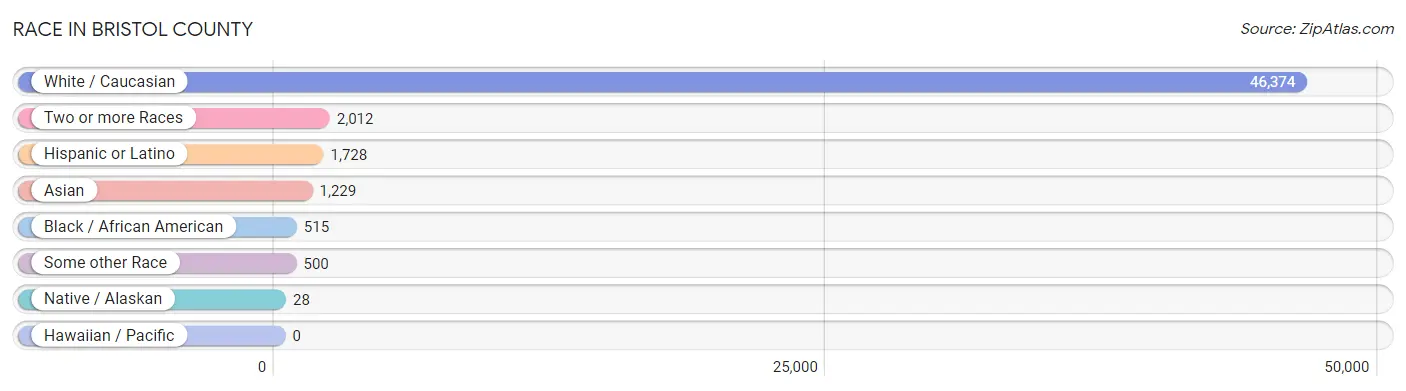
| Race | # Population | % Population |
| Asian | 1,229 | 2.4% |
| Black / African American | 515 | 1.0% |
| Hawaiian / Pacific | 0 | 0.0% |
| Hispanic or Latino | 1,728 | 3.4% |
| Native / Alaskan | 28 | 0.1% |
| White / Caucasian | 46,374 | 91.5% |
| Two or more Races | 2,012 | 4.0% |
| Some other Race | 500 | 1.0% |
| Total | 50,658 | 100.0% |
Ancestry in Bristol County
The most populous ancestries reported in Bristol County are Irish (9,440 | 18.6%), Italian (8,646 | 17.1%), Portuguese (8,585 | 17.0%), English (6,142 | 12.1%), and American (3,514 | 6.9%), together accounting for 71.7% of all Bristol County residents.
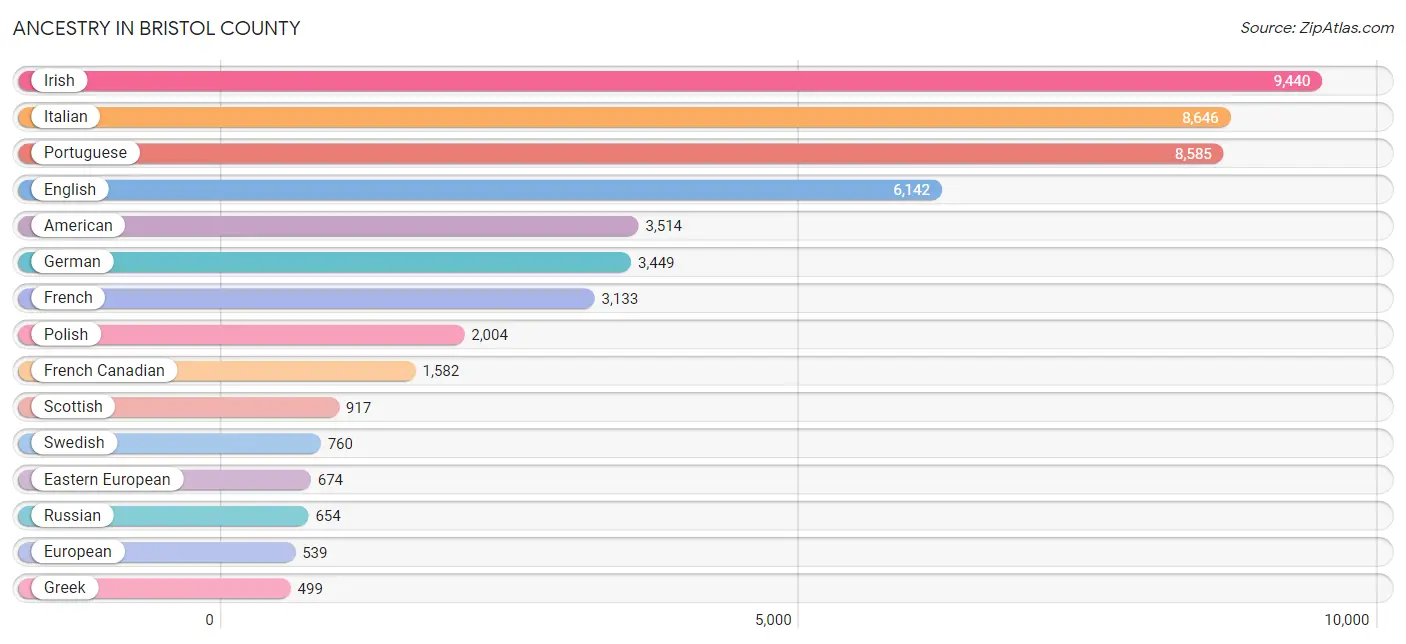
| Ancestry | # Population | % Population |
| American | 3,514 | 6.9% |
| Arab | 175 | 0.4% |
| Argentinean | 5 | 0.0% |
| Armenian | 132 | 0.3% |
| Australian | 9 | 0.0% |
| Austrian | 38 | 0.1% |
| Belgian | 93 | 0.2% |
| Bhutanese | 57 | 0.1% |
| Brazilian | 105 | 0.2% |
| British | 290 | 0.6% |
| British West Indian | 12 | 0.0% |
| Burmese | 140 | 0.3% |
| Cajun | 12 | 0.0% |
| Canadian | 399 | 0.8% |
| Cape Verdean | 221 | 0.4% |
| Central American | 79 | 0.2% |
| Central American Indian | 45 | 0.1% |
| Cherokee | 23 | 0.1% |
| Colombian | 158 | 0.3% |
| Costa Rican | 47 | 0.1% |
| Croatian | 64 | 0.1% |
| Cuban | 197 | 0.4% |
| Cypriot | 13 | 0.0% |
| Czech | 74 | 0.2% |
| Danish | 149 | 0.3% |
| Dominican | 5 | 0.0% |
| Dutch | 437 | 0.9% |
| Eastern European | 674 | 1.3% |
| Ecuadorian | 32 | 0.1% |
| Egyptian | 55 | 0.1% |
| English | 6,142 | 12.1% |
| Ethiopian | 10 | 0.0% |
| European | 539 | 1.1% |
| Filipino | 26 | 0.1% |
| Finnish | 213 | 0.4% |
| French | 3,133 | 6.2% |
| French American Indian | 5 | 0.0% |
| French Canadian | 1,582 | 3.1% |
| German | 3,449 | 6.8% |
| Greek | 499 | 1.0% |
| Guatemalan | 28 | 0.1% |
| Hungarian | 170 | 0.3% |
| Indian (Asian) | 325 | 0.6% |
| Iranian | 60 | 0.1% |
| Iraqi | 11 | 0.0% |
| Irish | 9,440 | 18.6% |
| Iroquois | 10 | 0.0% |
| Israeli | 36 | 0.1% |
| Italian | 8,646 | 17.1% |
| Jordanian | 13 | 0.0% |
| Korean | 200 | 0.4% |
| Lebanese | 80 | 0.2% |
| Lithuanian | 241 | 0.5% |
| Malaysian | 18 | 0.0% |
| Mexican | 441 | 0.9% |
| New Zealander | 25 | 0.1% |
| Nicaraguan | 1 | 0.0% |
| Nigerian | 15 | 0.0% |
| Northern European | 112 | 0.2% |
| Norwegian | 249 | 0.5% |
| Pakistani | 213 | 0.4% |
| Pennsylvania German | 8 | 0.0% |
| Peruvian | 80 | 0.2% |
| Polish | 2,004 | 4.0% |
| Portuguese | 8,585 | 17.0% |
| Puerto Rican | 465 | 0.9% |
| Romanian | 27 | 0.1% |
| Russian | 654 | 1.3% |
| Salvadoran | 3 | 0.0% |
| Scandinavian | 96 | 0.2% |
| Scotch-Irish | 321 | 0.6% |
| Scottish | 917 | 1.8% |
| Senegalese | 5 | 0.0% |
| Slovak | 19 | 0.0% |
| Slovene | 7 | 0.0% |
| South American | 316 | 0.6% |
| South American Indian | 58 | 0.1% |
| Spaniard | 142 | 0.3% |
| Spanish | 35 | 0.1% |
| Sri Lankan | 16 | 0.0% |
| Subsaharan African | 254 | 0.5% |
| Swedish | 760 | 1.5% |
| Swiss | 143 | 0.3% |
| Thai | 251 | 0.5% |
| Tohono O'Odham | 6 | 0.0% |
| Turkish | 94 | 0.2% |
| Ukrainian | 152 | 0.3% |
| Venezuelan | 41 | 0.1% |
| Vietnamese | 108 | 0.2% |
| Welsh | 152 | 0.3% |
| West Indian | 15 | 0.0% | View All 91 Rows |
Immigrants in Bristol County
The most numerous immigrant groups reported in Bristol County came from Europe (3,165 | 6.2%), Southern Europe (2,620 | 5.2%), Portugal (2,553 | 5.0%), Asia (1,156 | 2.3%), and Azores (1,049 | 2.1%), together accounting for 20.8% of all Bristol County residents.
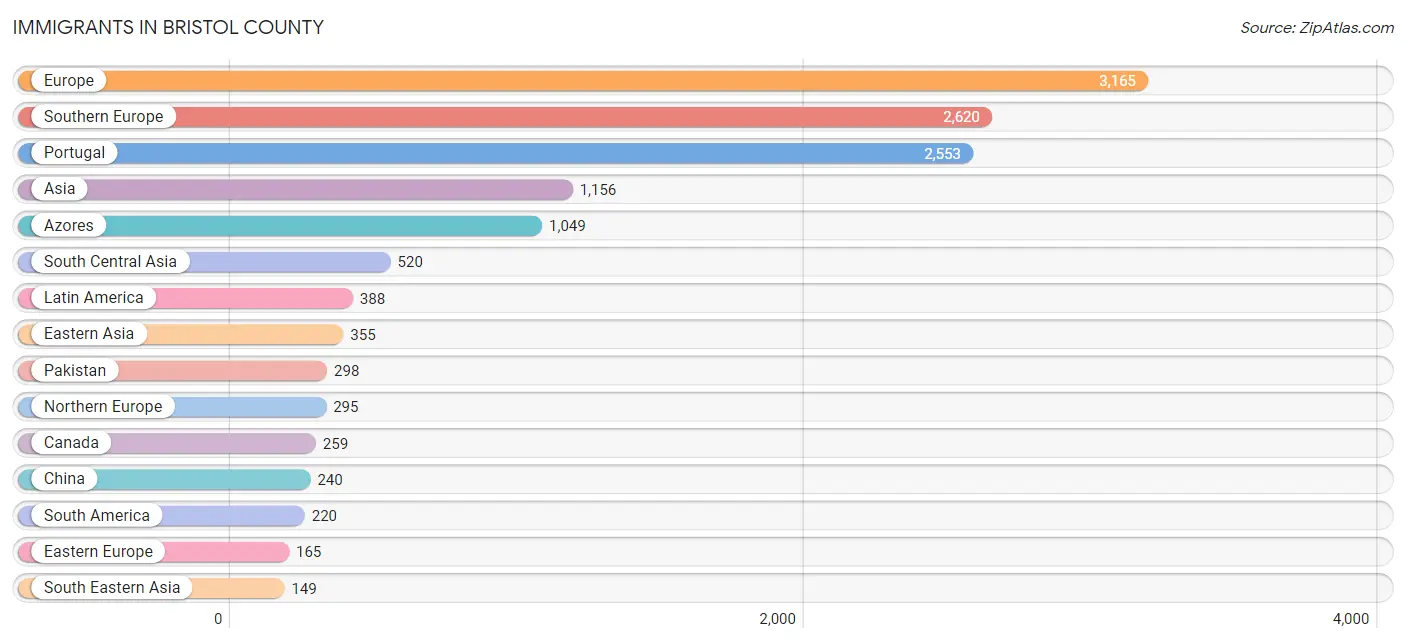
| Immigration Origin | # Population | % Population |
| Africa | 43 | 0.1% |
| Argentina | 21 | 0.0% |
| Asia | 1,156 | 2.3% |
| Australia | 9 | 0.0% |
| Austria | 7 | 0.0% |
| Azores | 1,049 | 2.1% |
| Bangladesh | 43 | 0.1% |
| Belgium | 11 | 0.0% |
| Brazil | 115 | 0.2% |
| Cabo Verde | 10 | 0.0% |
| Canada | 259 | 0.5% |
| Caribbean | 81 | 0.2% |
| Central America | 87 | 0.2% |
| China | 240 | 0.5% |
| Costa Rica | 10 | 0.0% |
| Cuba | 50 | 0.1% |
| Denmark | 10 | 0.0% |
| Eastern Africa | 25 | 0.1% |
| Eastern Asia | 355 | 0.7% |
| Eastern Europe | 165 | 0.3% |
| Ecuador | 16 | 0.0% |
| El Salvador | 3 | 0.0% |
| England | 88 | 0.2% |
| Ethiopia | 9 | 0.0% |
| Europe | 3,165 | 6.2% |
| France | 31 | 0.1% |
| Germany | 11 | 0.0% |
| Greece | 10 | 0.0% |
| Guatemala | 28 | 0.1% |
| Guyana | 8 | 0.0% |
| Haiti | 7 | 0.0% |
| Hong Kong | 17 | 0.0% |
| Hungary | 29 | 0.1% |
| India | 123 | 0.2% |
| Indonesia | 11 | 0.0% |
| Iran | 28 | 0.1% |
| Ireland | 60 | 0.1% |
| Israel | 43 | 0.1% |
| Italy | 10 | 0.0% |
| Jamaica | 15 | 0.0% |
| Japan | 52 | 0.1% |
| Korea | 63 | 0.1% |
| Latin America | 388 | 0.8% |
| Mexico | 46 | 0.1% |
| Netherlands | 12 | 0.0% |
| Nigeria | 8 | 0.0% |
| Northern Europe | 295 | 0.6% |
| Oceania | 19 | 0.0% |
| Pakistan | 298 | 0.6% |
| Peru | 52 | 0.1% |
| Philippines | 112 | 0.2% |
| Poland | 42 | 0.1% |
| Portugal | 2,553 | 5.0% |
| Russia | 62 | 0.1% |
| Scotland | 14 | 0.0% |
| South America | 220 | 0.4% |
| South Central Asia | 520 | 1.0% |
| South Eastern Asia | 149 | 0.3% |
| Southern Europe | 2,620 | 5.2% |
| Spain | 33 | 0.1% |
| Sri Lanka | 28 | 0.1% |
| Sweden | 36 | 0.1% |
| Switzerland | 13 | 0.0% |
| Thailand | 10 | 0.0% |
| Turkey | 89 | 0.2% |
| Ukraine | 32 | 0.1% |
| Uruguay | 8 | 0.0% |
| Vietnam | 16 | 0.0% |
| Western Africa | 18 | 0.0% |
| Western Asia | 132 | 0.3% |
| Western Europe | 85 | 0.2% |
| Zimbabwe | 13 | 0.0% | View All 72 Rows |
Sex and Age in Bristol County
Sex and Age in Bristol County
The most populous age groups in Bristol County are 15 to 19 Years (2,012 | 8.2%) for men and 15 to 19 Years (2,472 | 9.5%) for women.
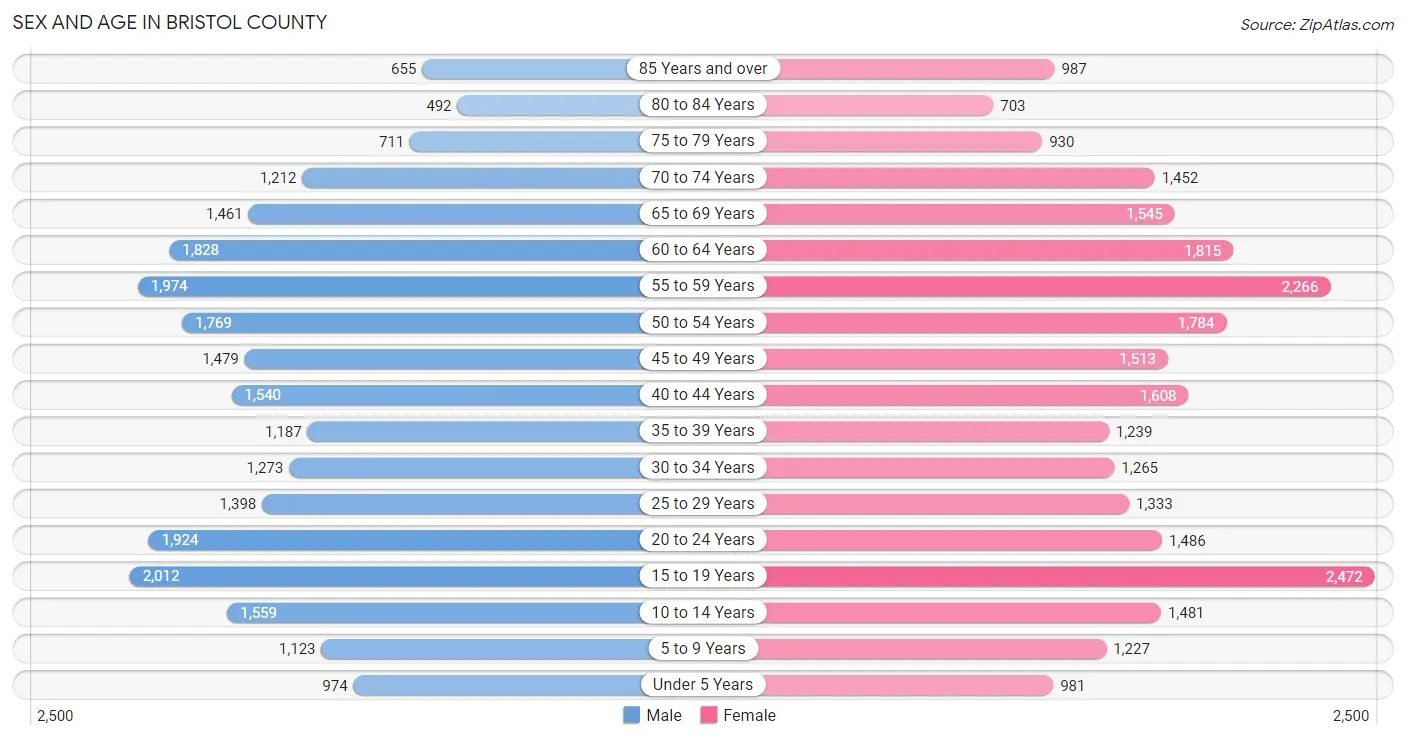
| Age Bracket | Male | Female |
| Under 5 Years | 974 (4.0%) | 981 (3.8%) |
| 5 to 9 Years | 1,123 (4.6%) | 1,227 (4.7%) |
| 10 to 14 Years | 1,559 (6.3%) | 1,481 (5.7%) |
| 15 to 19 Years | 2,012 (8.2%) | 2,472 (9.5%) |
| 20 to 24 Years | 1,924 (7.8%) | 1,486 (5.7%) |
| 25 to 29 Years | 1,398 (5.7%) | 1,333 (5.1%) |
| 30 to 34 Years | 1,273 (5.2%) | 1,265 (4.9%) |
| 35 to 39 Years | 1,187 (4.8%) | 1,239 (4.8%) |
| 40 to 44 Years | 1,540 (6.3%) | 1,608 (6.2%) |
| 45 to 49 Years | 1,479 (6.0%) | 1,513 (5.8%) |
| 50 to 54 Years | 1,769 (7.2%) | 1,784 (6.8%) |
| 55 to 59 Years | 1,974 (8.0%) | 2,266 (8.7%) |
| 60 to 64 Years | 1,828 (7.4%) | 1,815 (7.0%) |
| 65 to 69 Years | 1,461 (5.9%) | 1,545 (5.9%) |
| 70 to 74 Years | 1,212 (4.9%) | 1,452 (5.6%) |
| 75 to 79 Years | 711 (2.9%) | 930 (3.6%) |
| 80 to 84 Years | 492 (2.0%) | 703 (2.7%) |
| 85 Years and over | 655 (2.7%) | 987 (3.8%) |
| Total | 24,571 (100.0%) | 26,087 (100.0%) |
Families and Households in Bristol County
Median Family Size in Bristol County
The median family size in Bristol County is 3.04 persons per family, with married-couple families (10,114 | 80.6%) accounting for the largest median family size of 3.16 persons per family. On the other hand, single male/father families (665 | 5.3%) represent the smallest median family size with 2.44 persons per family.
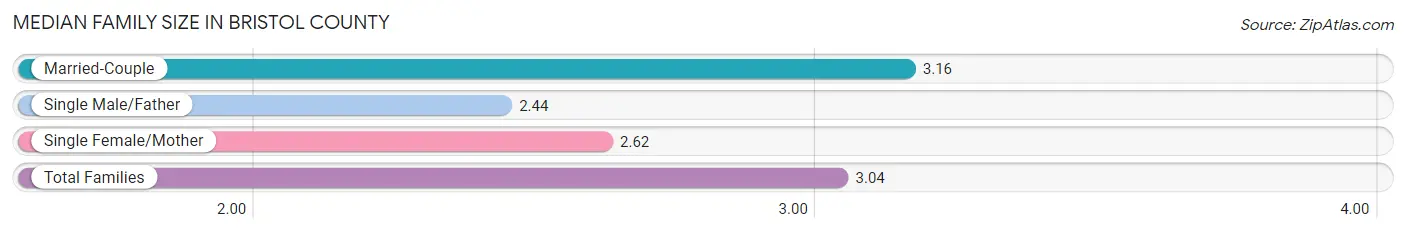
| Family Type | # Families | Family Size |
| Married-Couple | 10,114 (80.6%) | 3.16 |
| Single Male/Father | 665 (5.3%) | 2.44 |
| Single Female/Mother | 1,767 (14.1%) | 2.62 |
| Total Families | 12,546 (100.0%) | 3.04 |
Median Household Size in Bristol County
The median household size in Bristol County is 2.44 persons per household, with married-couple households (10,114 | 52.7%) accounting for the largest median household size of 3.18 persons per household. non-family households (6,627 | 34.6%) represent the smallest median household size with 1.19 persons per household.
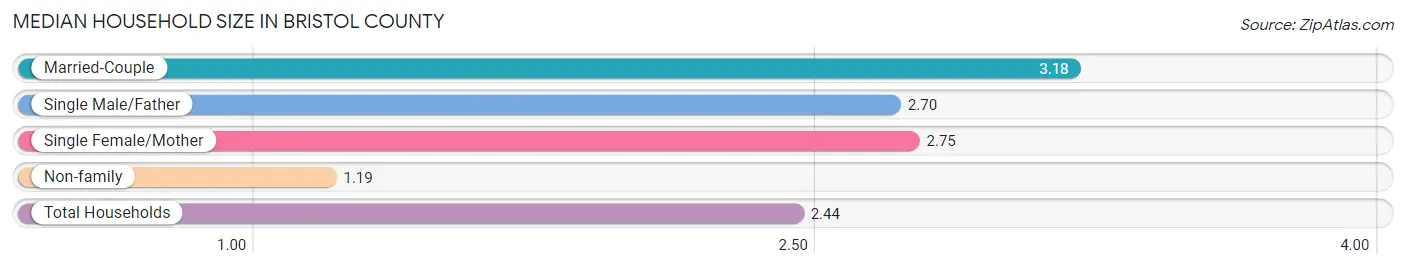
| Household Type | # Households | Household Size |
| Married-Couple | 10,114 (52.7%) | 3.18 |
| Single Male/Father | 665 (3.5%) | 2.70 |
| Single Female/Mother | 1,767 (9.2%) | 2.75 |
| Non-family | 6,627 (34.6%) | 1.19 |
| Total Households | 19,173 (100.0%) | 2.44 |
Household Size by Marriage Status in Bristol County
Out of a total of 19,173 households in Bristol County, 12,546 (65.4%) are family households, while 6,627 (34.6%) are nonfamily households. The most numerous type of family households are 2-person households, comprising 5,516, and the most common type of nonfamily households are 1-person households, comprising 5,657.
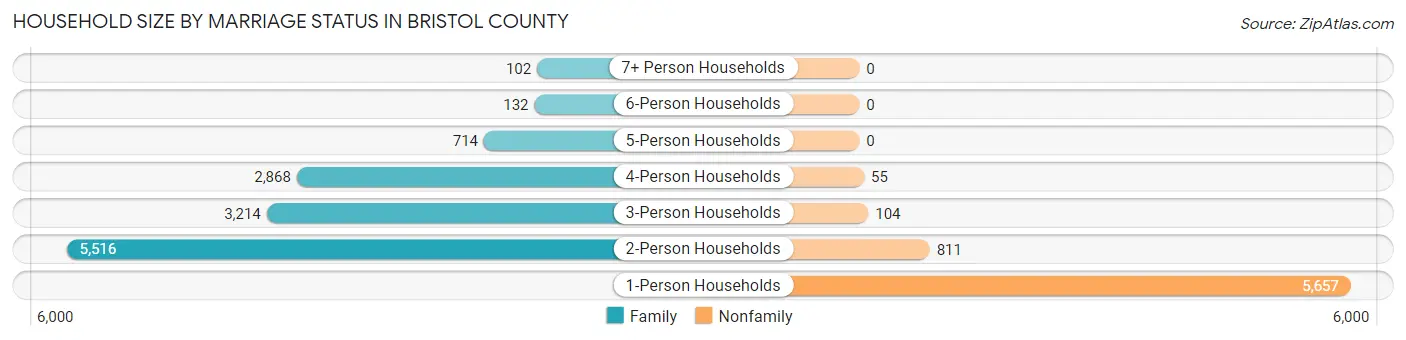
| Household Size | Family Households | Nonfamily Households |
| 1-Person Households | - | 5,657 (29.5%) |
| 2-Person Households | 5,516 (28.8%) | 811 (4.2%) |
| 3-Person Households | 3,214 (16.8%) | 104 (0.5%) |
| 4-Person Households | 2,868 (15.0%) | 55 (0.3%) |
| 5-Person Households | 714 (3.7%) | 0 (0.0%) |
| 6-Person Households | 132 (0.7%) | 0 (0.0%) |
| 7+ Person Households | 102 (0.5%) | 0 (0.0%) |
| Total | 12,546 (65.4%) | 6,627 (34.6%) |
Female Fertility in Bristol County
Fertility by Age in Bristol County
Average fertility rate in Bristol County is 27.0 births per 1,000 women. Women in the age bracket of 20 to 34 years have the highest fertility rate with 53.0 births per 1,000 women. Women in the age bracket of 20 to 34 years acount for 70.3% of all women with births.
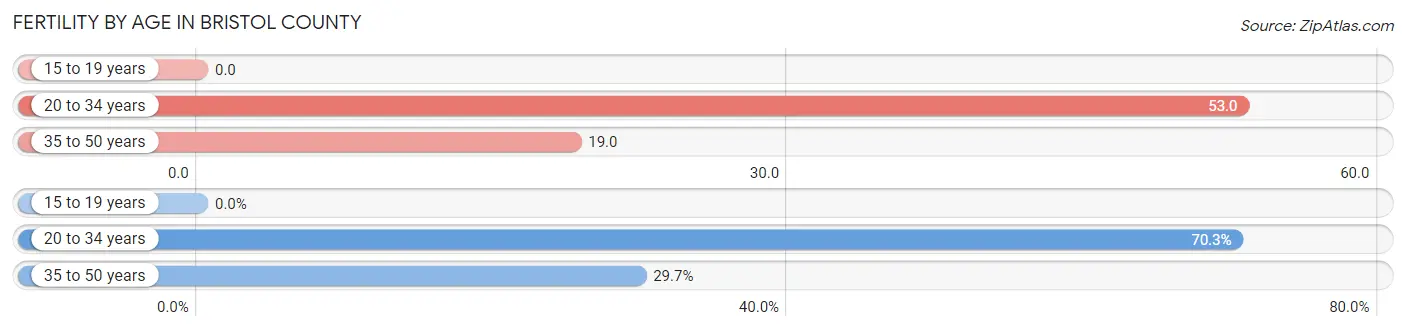
| Age Bracket | Women with Births | Births / 1,000 Women |
| 15 to 19 years | 0 (0.0%) | 0.0 |
| 20 to 34 years | 215 (70.3%) | 53.0 |
| 35 to 50 years | 91 (29.7%) | 19.0 |
| Total | 306 (100.0%) | 27.0 |
Fertility by Age by Marriage Status in Bristol County
82.4% of women with births (306) in Bristol County are married. The highest percentage of unmarried women with births falls into 20 to 34 years age bracket with 25.1% of them unmarried at the time of birth, while the lowest percentage of unmarried women with births belong to 35 to 50 years age bracket with 0.0% of them unmarried.
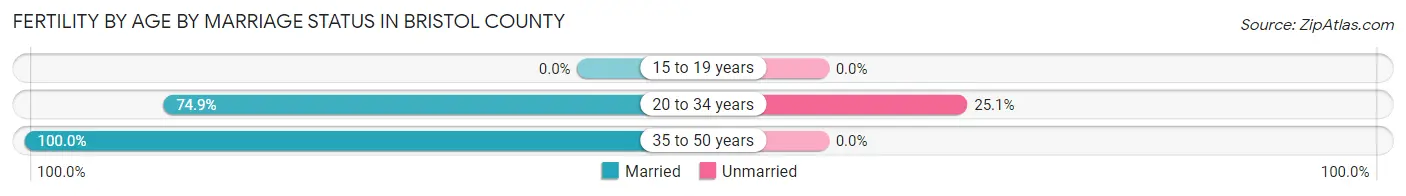
| Age Bracket | Married | Unmarried |
| 15 to 19 years | 0 (0.0%) | 0 (0.0%) |
| 20 to 34 years | 161 (74.9%) | 54 (25.1%) |
| 35 to 50 years | 91 (100.0%) | 0 (0.0%) |
| Total | 252 (82.4%) | 54 (17.6%) |
Fertility by Education in Bristol County
Average fertility rate in Bristol County is 27.0 births per 1,000 women. Women with the education attainment of bachelor's degree have the highest fertility rate of 55.0 births per 1,000 women, while women with the education attainment of college or associate's degree have the lowest fertility at 3.0 births per 1,000 women. Women with the education attainment of bachelor's degree represent 53.3% of all women with births.
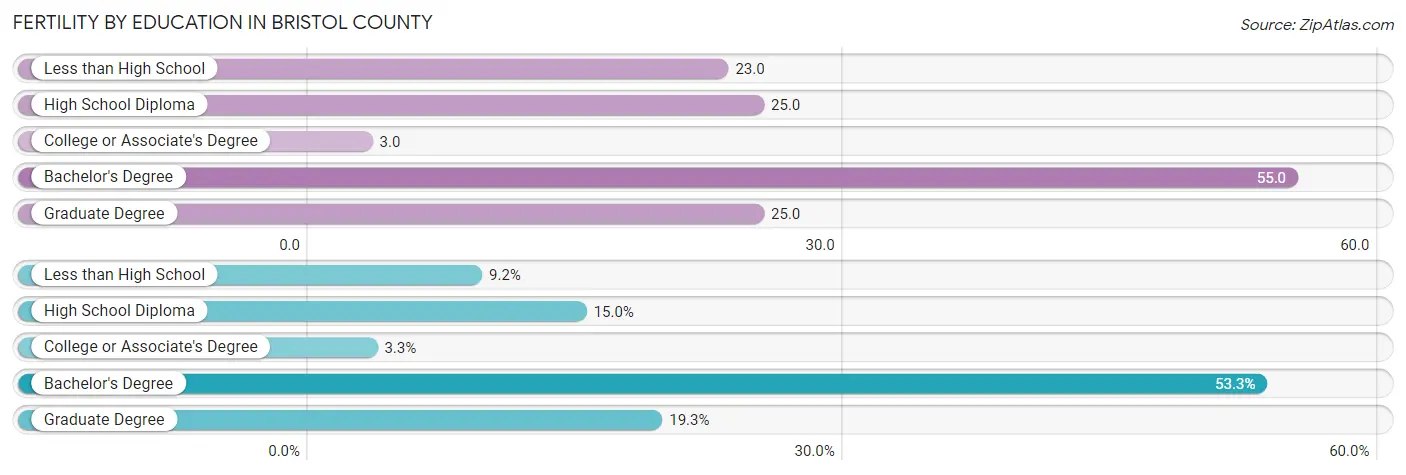
| Educational Attainment | Women with Births | Births / 1,000 Women |
| Less than High School | 28 (9.1%) | 23.0 |
| High School Diploma | 46 (15.0%) | 25.0 |
| College or Associate's Degree | 10 (3.3%) | 3.0 |
| Bachelor's Degree | 163 (53.3%) | 55.0 |
| Graduate Degree | 59 (19.3%) | 25.0 |
| Total | 306 (100.0%) | 27.0 |
Fertility by Education by Marriage Status in Bristol County
17.6% of women with births in Bristol County are unmarried. Women with the educational attainment of less than high school are most likely to be married with 100.0% of them married at childbirth, while women with the educational attainment of high school diploma are least likely to be married with 80.4% of them unmarried at childbirth.
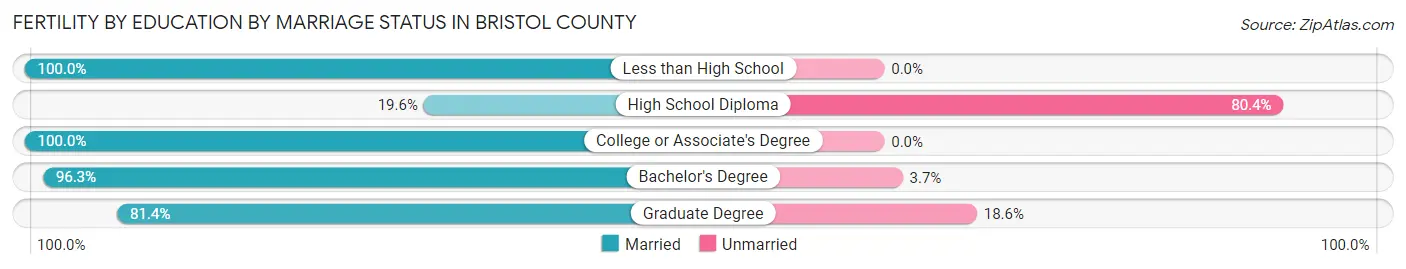
| Educational Attainment | Married | Unmarried |
| Less than High School | 28 (100.0%) | 0 (0.0%) |
| High School Diploma | 9 (19.6%) | 37 (80.4%) |
| College or Associate's Degree | 10 (100.0%) | 0 (0.0%) |
| Bachelor's Degree | 157 (96.3%) | 6 (3.7%) |
| Graduate Degree | 48 (81.4%) | 11 (18.6%) |
| Total | 252 (82.4%) | 54 (17.6%) |
Employment Characteristics in Bristol County
Employment by Class of Employer in Bristol County
Among the 25,343 employed individuals in Bristol County, private company employees (15,122 | 59.7%), not-for-profit organizations (3,562 | 14.1%), and local government employees (1,891 | 7.5%) make up the most common classes of employment.
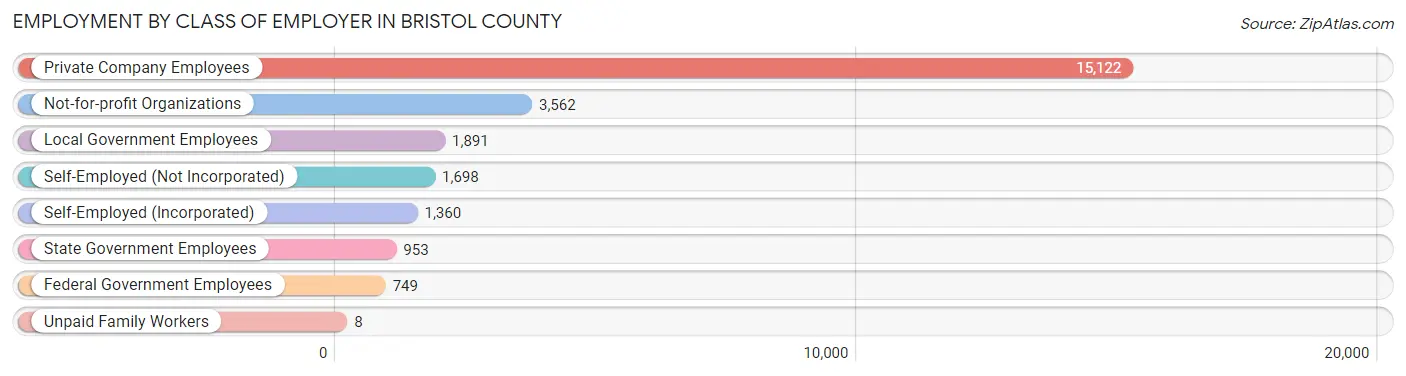
| Employer Class | # Employees | % Employees |
| Private Company Employees | 15,122 | 59.7% |
| Self-Employed (Incorporated) | 1,360 | 5.4% |
| Self-Employed (Not Incorporated) | 1,698 | 6.7% |
| Not-for-profit Organizations | 3,562 | 14.1% |
| Local Government Employees | 1,891 | 7.5% |
| State Government Employees | 953 | 3.8% |
| Federal Government Employees | 749 | 3.0% |
| Unpaid Family Workers | 8 | 0.0% |
| Total | 25,343 | 100.0% |
Employment Status by Age in Bristol County
According to the labor force statistics for Bristol County, out of the total population over 16 years of age (42,777), 63.6% or 27,206 individuals are in the labor force, with 4.1% or 1,115 of them unemployed. The age group with the highest labor force participation rate is 35 to 44 years, with 89.9% or 5,011 individuals in the labor force. Within the labor force, the 25 to 29 years age range has the highest percentage of unemployed individuals, with 10.6% or 197 of them being unemployed.
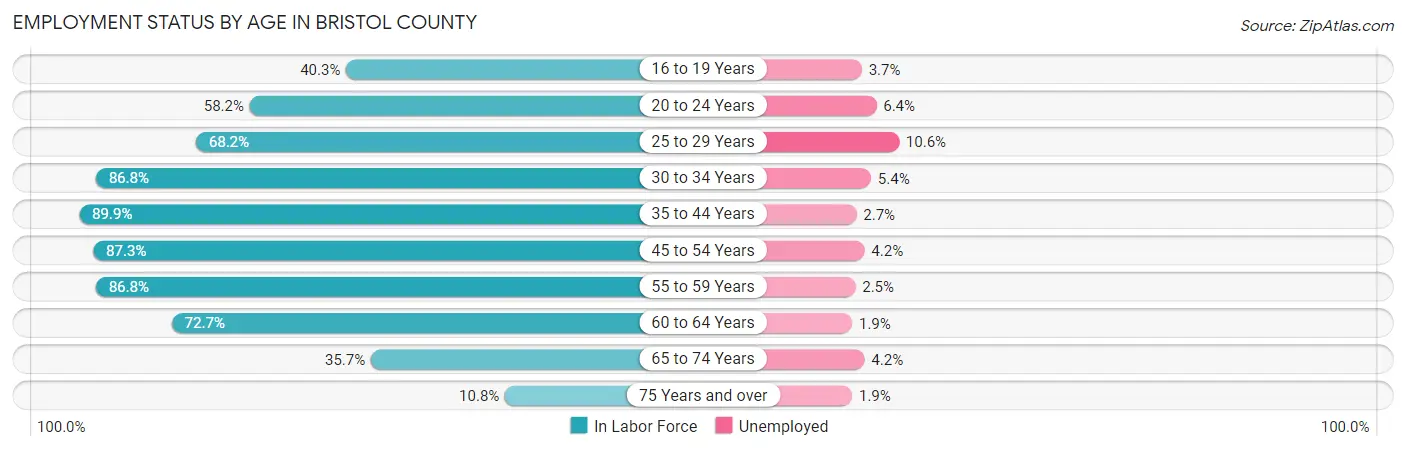
| Age Bracket | In Labor Force | Unemployed |
| 16 to 19 Years | 1,591 (40.3%) | 59 (3.7%) |
| 20 to 24 Years | 1,985 (58.2%) | 127 (6.4%) |
| 25 to 29 Years | 1,863 (68.2%) | 197 (10.6%) |
| 30 to 34 Years | 2,203 (86.8%) | 119 (5.4%) |
| 35 to 44 Years | 5,011 (89.9%) | 135 (2.7%) |
| 45 to 54 Years | 5,714 (87.3%) | 240 (4.2%) |
| 55 to 59 Years | 3,680 (86.8%) | 92 (2.5%) |
| 60 to 64 Years | 2,648 (72.7%) | 50 (1.9%) |
| 65 to 74 Years | 2,024 (35.7%) | 85 (4.2%) |
| 75 Years and over | 484 (10.8%) | 9 (1.9%) |
| Total | 27,206 (63.6%) | 1,115 (4.1%) |
Employment Status by Educational Attainment in Bristol County
According to labor force statistics for Bristol County, 83.6% of individuals (21,127) out of the total population between 25 and 64 years of age (25,271) are in the labor force, with 4.0% or 845 of them being unemployed. The group with the highest labor force participation rate are those with the educational attainment of bachelor's degree or higher, with 87.8% or 12,237 individuals in the labor force. Within the labor force, individuals with less than high school education have the highest percentage of unemployment, with 12.0% or 108 of them being unemployed.
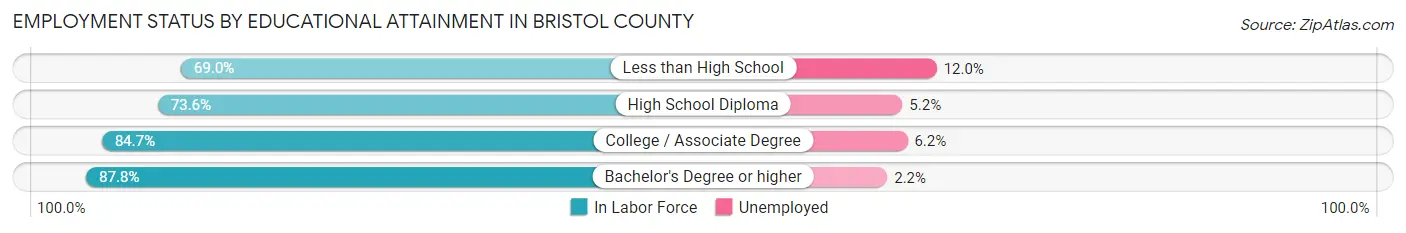
| Educational Attainment | In Labor Force | Unemployed |
| Less than High School | 900 (69.0%) | 157 (12.0%) |
| High School Diploma | 3,380 (73.6%) | 239 (5.2%) |
| College / Associate Degree | 4,605 (84.7%) | 337 (6.2%) |
| Bachelor's Degree or higher | 12,237 (87.8%) | 307 (2.2%) |
| Total | 21,127 (83.6%) | 1,011 (4.0%) |
Employment Occupations by Sex in Bristol County
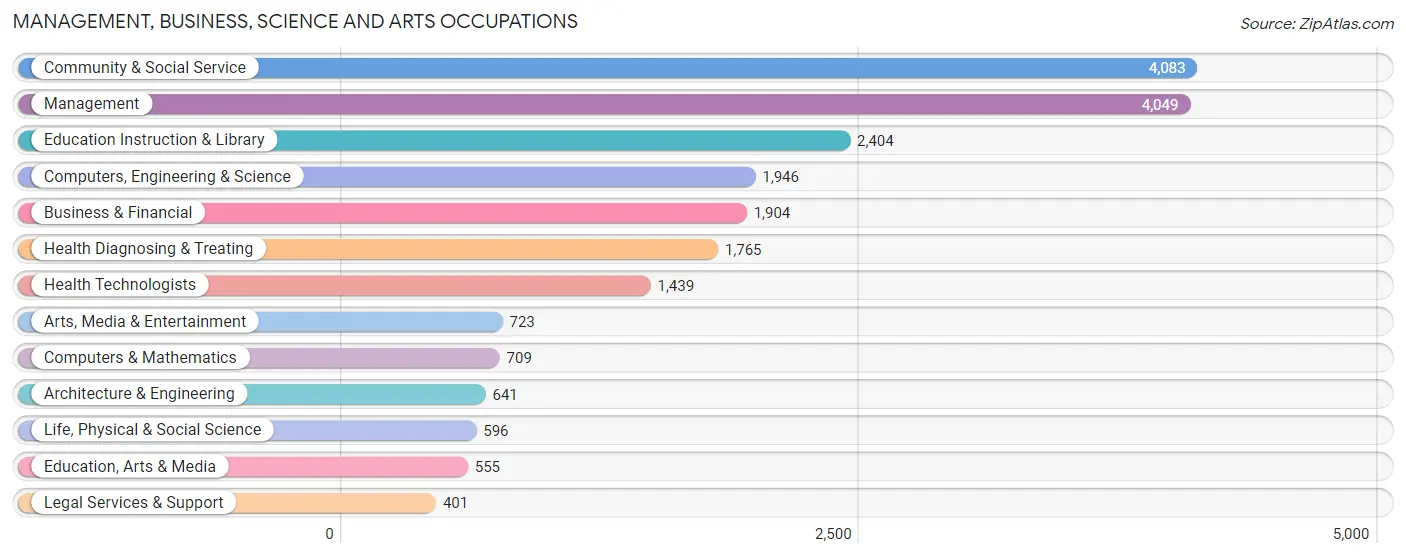
Management, Business, Science and Arts Occupations
The most common Management, Business, Science and Arts occupations in Bristol County are Community & Social Service (4,083 | 15.7%), Management (4,049 | 15.6%), Education Instruction & Library (2,404 | 9.2%), Computers, Engineering & Science (1,946 | 7.5%), and Business & Financial (1,904 | 7.3%).
Management, Business, Science and Arts Occupations by Sex
Within the Management, Business, Science and Arts occupations in Bristol County, the most male-oriented occupations are Architecture & Engineering (80.0%), Computers & Mathematics (67.0%), and Computers, Engineering & Science (63.7%), while the most female-oriented occupations are Health Diagnosing & Treating (64.3%), Education Instruction & Library (64.1%), and Education, Arts & Media (64.0%).
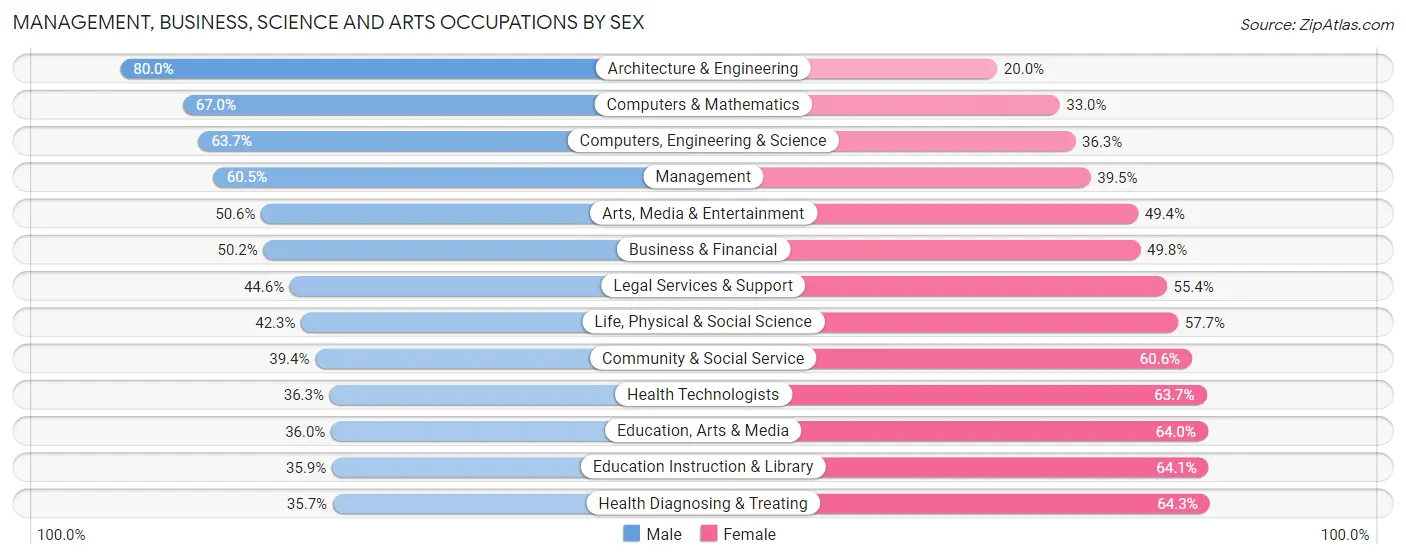
| Occupation | Male | Female |
| Management | 2,451 (60.5%) | 1,598 (39.5%) |
| Business & Financial | 955 (50.2%) | 949 (49.8%) |
| Computers, Engineering & Science | 1,240 (63.7%) | 706 (36.3%) |
| Computers & Mathematics | 475 (67.0%) | 234 (33.0%) |
| Architecture & Engineering | 513 (80.0%) | 128 (20.0%) |
| Life, Physical & Social Science | 252 (42.3%) | 344 (57.7%) |
| Community & Social Service | 1,607 (39.4%) | 2,476 (60.6%) |
| Education, Arts & Media | 200 (36.0%) | 355 (64.0%) |
| Legal Services & Support | 179 (44.6%) | 222 (55.4%) |
| Education Instruction & Library | 862 (35.9%) | 1,542 (64.1%) |
| Arts, Media & Entertainment | 366 (50.6%) | 357 (49.4%) |
| Health Diagnosing & Treating | 630 (35.7%) | 1,135 (64.3%) |
| Health Technologists | 523 (36.3%) | 916 (63.7%) |
| Total (Category) | 6,883 (50.1%) | 6,864 (49.9%) |
| Total (Overall) | 12,958 (49.8%) | 13,047 (50.2%) |
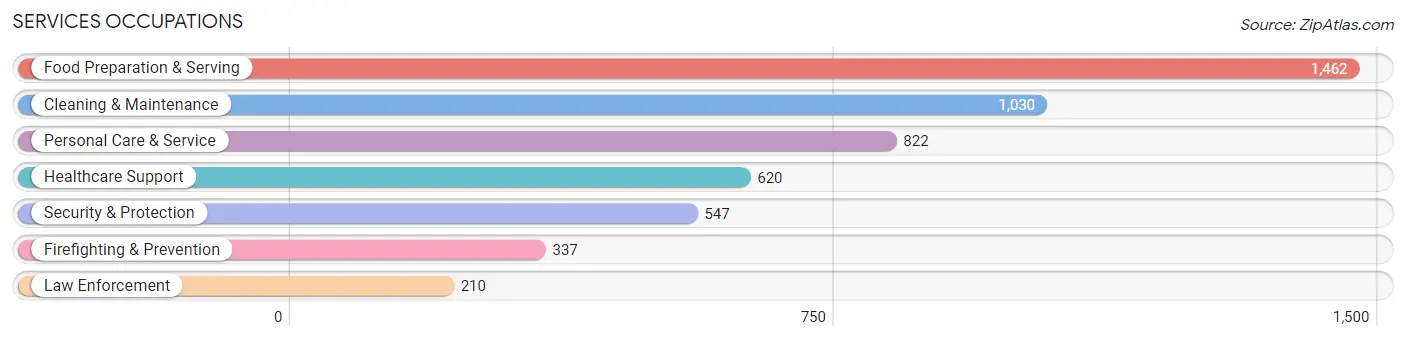
Services Occupations
The most common Services occupations in Bristol County are Food Preparation & Serving (1,462 | 5.6%), Cleaning & Maintenance (1,030 | 4.0%), Personal Care & Service (822 | 3.2%), Healthcare Support (620 | 2.4%), and Security & Protection (547 | 2.1%).
Services Occupations by Sex
Within the Services occupations in Bristol County, the most male-oriented occupations are Law Enforcement (94.8%), Cleaning & Maintenance (70.0%), and Security & Protection (60.2%), while the most female-oriented occupations are Healthcare Support (93.2%), Personal Care & Service (76.3%), and Firefighting & Prevention (61.4%).
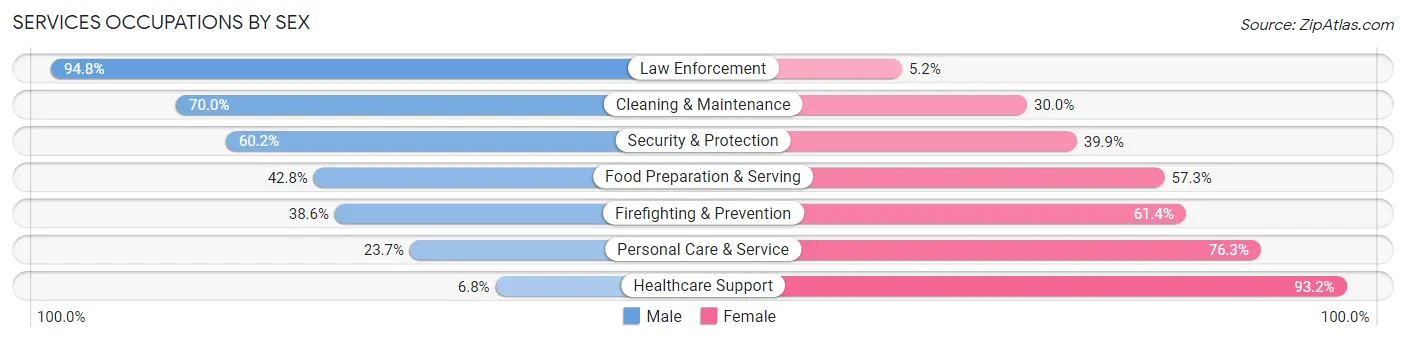
| Occupation | Male | Female |
| Healthcare Support | 42 (6.8%) | 578 (93.2%) |
| Security & Protection | 329 (60.2%) | 218 (39.9%) |
| Firefighting & Prevention | 130 (38.6%) | 207 (61.4%) |
| Law Enforcement | 199 (94.8%) | 11 (5.2%) |
| Food Preparation & Serving | 625 (42.7%) | 837 (57.3%) |
| Cleaning & Maintenance | 721 (70.0%) | 309 (30.0%) |
| Personal Care & Service | 195 (23.7%) | 627 (76.3%) |
| Total (Category) | 1,912 (42.7%) | 2,569 (57.3%) |
| Total (Overall) | 12,958 (49.8%) | 13,047 (50.2%) |
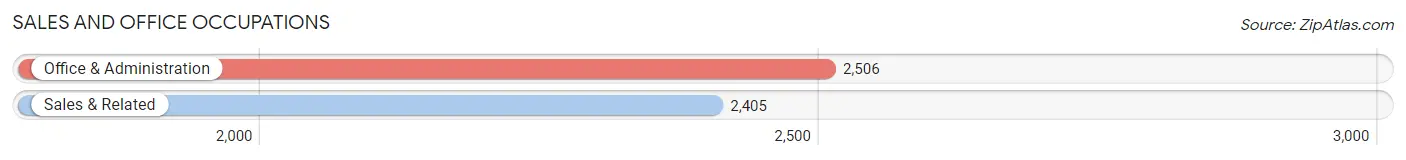
Sales and Office Occupations
The most common Sales and Office occupations in Bristol County are Office & Administration (2,506 | 9.6%), and Sales & Related (2,405 | 9.2%).
Sales and Office Occupations by Sex
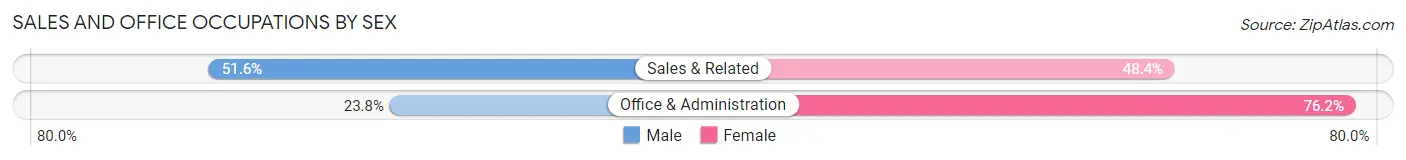
| Occupation | Male | Female |
| Sales & Related | 1,242 (51.6%) | 1,163 (48.4%) |
| Office & Administration | 597 (23.8%) | 1,909 (76.2%) |
| Total (Category) | 1,839 (37.4%) | 3,072 (62.5%) |
| Total (Overall) | 12,958 (49.8%) | 13,047 (50.2%) |
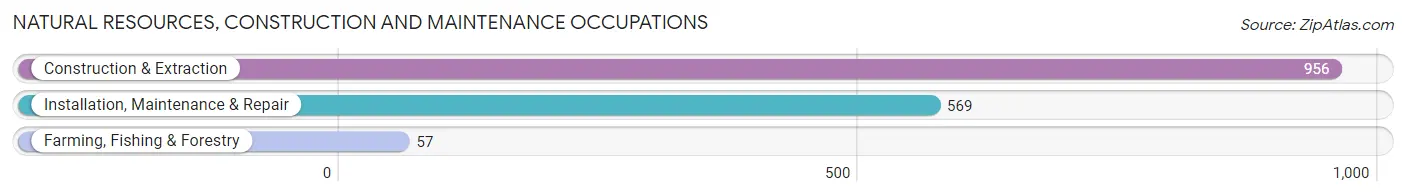
Natural Resources, Construction and Maintenance Occupations
The most common Natural Resources, Construction and Maintenance occupations in Bristol County are Construction & Extraction (956 | 3.7%), Installation, Maintenance & Repair (569 | 2.2%), and Farming, Fishing & Forestry (57 | 0.2%).
Natural Resources, Construction and Maintenance Occupations by Sex
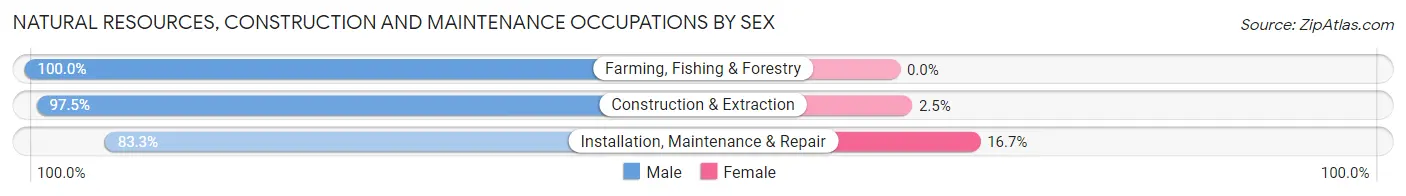
| Occupation | Male | Female |
| Farming, Fishing & Forestry | 57 (100.0%) | 0 (0.0%) |
| Construction & Extraction | 932 (97.5%) | 24 (2.5%) |
| Installation, Maintenance & Repair | 474 (83.3%) | 95 (16.7%) |
| Total (Category) | 1,463 (92.5%) | 119 (7.5%) |
| Total (Overall) | 12,958 (49.8%) | 13,047 (50.2%) |
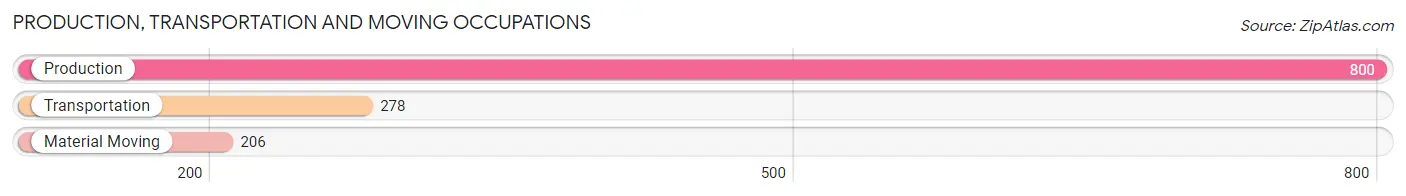
Production, Transportation and Moving Occupations
The most common Production, Transportation and Moving occupations in Bristol County are Production (800 | 3.1%), Transportation (278 | 1.1%), and Material Moving (206 | 0.8%).
Production, Transportation and Moving Occupations by Sex
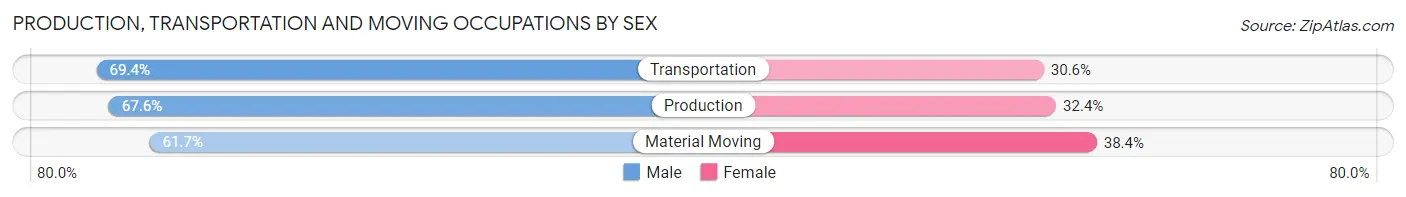
| Occupation | Male | Female |
| Production | 541 (67.6%) | 259 (32.4%) |
| Transportation | 193 (69.4%) | 85 (30.6%) |
| Material Moving | 127 (61.7%) | 79 (38.4%) |
| Total (Category) | 861 (67.1%) | 423 (32.9%) |
| Total (Overall) | 12,958 (49.8%) | 13,047 (50.2%) |
Employment Industries by Sex in Bristol County
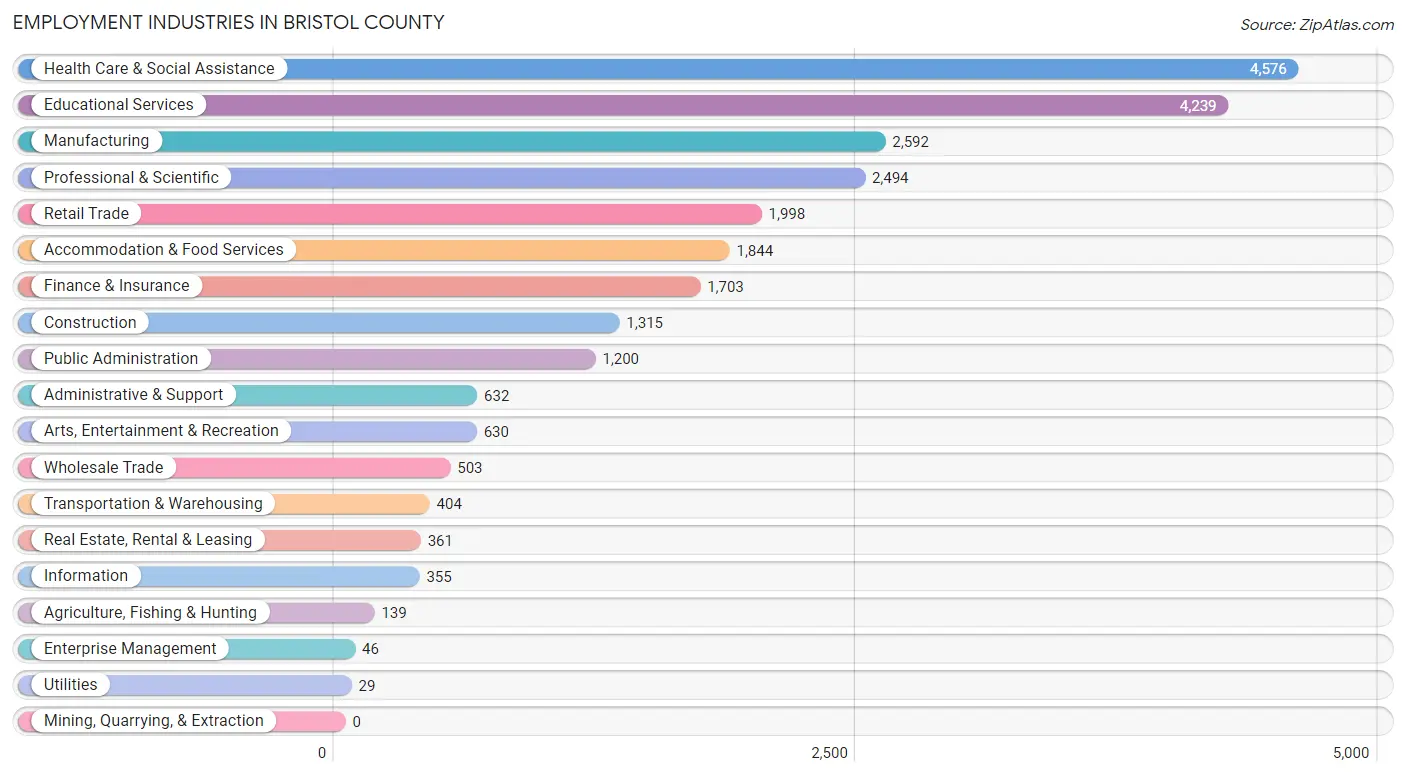
Employment Industries in Bristol County
The major employment industries in Bristol County include Health Care & Social Assistance (4,576 | 17.6%), Educational Services (4,239 | 16.3%), Manufacturing (2,592 | 10.0%), Professional & Scientific (2,494 | 9.6%), and Retail Trade (1,998 | 7.7%).
Employment Industries by Sex in Bristol County
The Bristol County industries that see more men than women are Construction (96.3%), Agriculture, Fishing & Hunting (85.6%), and Administrative & Support (73.1%), whereas the industries that tend to have a higher number of women are Utilities (86.2%), Enterprise Management (78.3%), and Health Care & Social Assistance (71.8%).
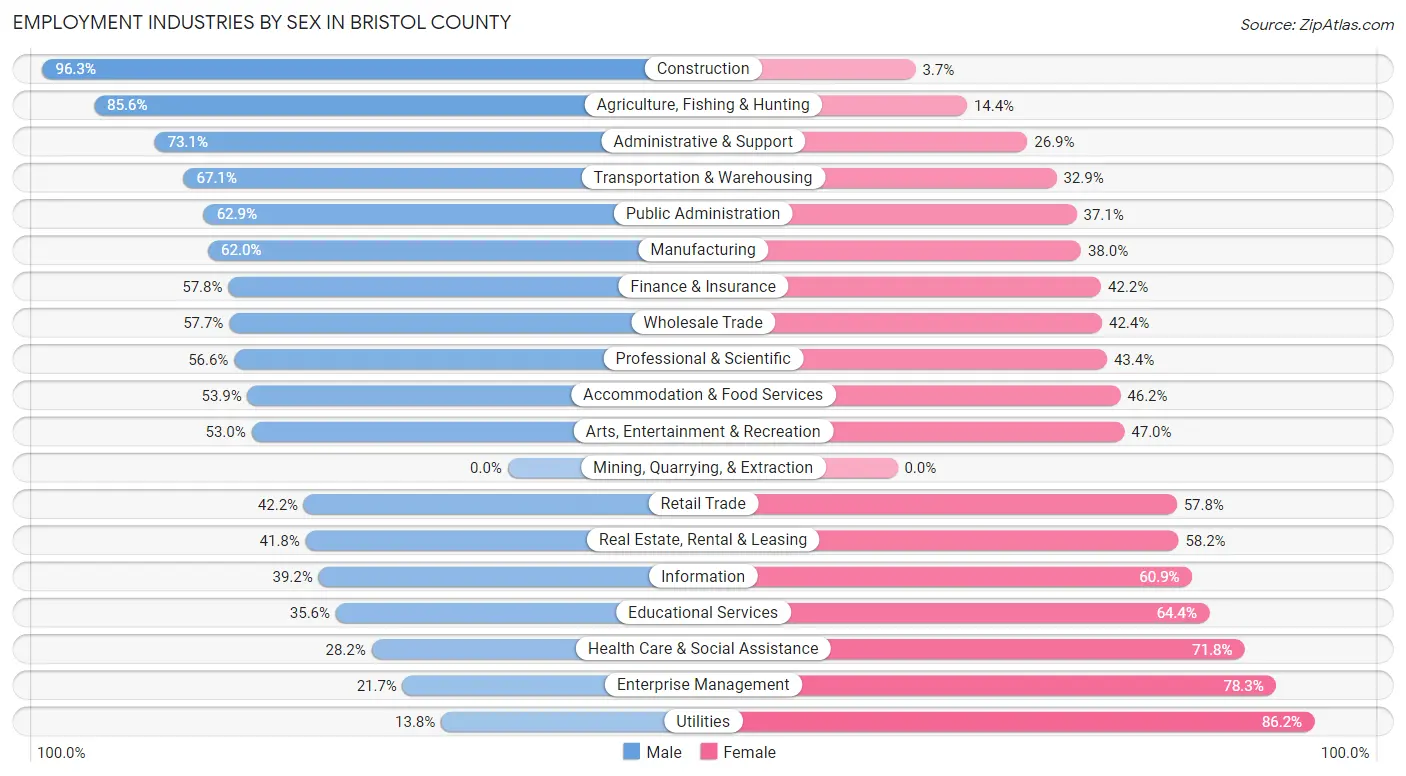
| Industry | Male | Female |
| Agriculture, Fishing & Hunting | 119 (85.6%) | 20 (14.4%) |
| Mining, Quarrying, & Extraction | 0 (0.0%) | 0 (0.0%) |
| Construction | 1,266 (96.3%) | 49 (3.7%) |
| Manufacturing | 1,607 (62.0%) | 985 (38.0%) |
| Wholesale Trade | 290 (57.7%) | 213 (42.3%) |
| Retail Trade | 843 (42.2%) | 1,155 (57.8%) |
| Transportation & Warehousing | 271 (67.1%) | 133 (32.9%) |
| Utilities | 4 (13.8%) | 25 (86.2%) |
| Information | 139 (39.2%) | 216 (60.9%) |
| Finance & Insurance | 985 (57.8%) | 718 (42.2%) |
| Real Estate, Rental & Leasing | 151 (41.8%) | 210 (58.2%) |
| Professional & Scientific | 1,412 (56.6%) | 1,082 (43.4%) |
| Enterprise Management | 10 (21.7%) | 36 (78.3%) |
| Administrative & Support | 462 (73.1%) | 170 (26.9%) |
| Educational Services | 1,508 (35.6%) | 2,731 (64.4%) |
| Health Care & Social Assistance | 1,290 (28.2%) | 3,286 (71.8%) |
| Arts, Entertainment & Recreation | 334 (53.0%) | 296 (47.0%) |
| Accommodation & Food Services | 993 (53.8%) | 851 (46.2%) |
| Public Administration | 755 (62.9%) | 445 (37.1%) |
| Total | 12,958 (49.8%) | 13,047 (50.2%) |
Education in Bristol County
School Enrollment in Bristol County
The most common levels of schooling among the 13,813 students in Bristol County are college / undergraduate (4,960 | 35.9%), middle school (2,502 | 18.1%), and high school (2,439 | 17.7%).
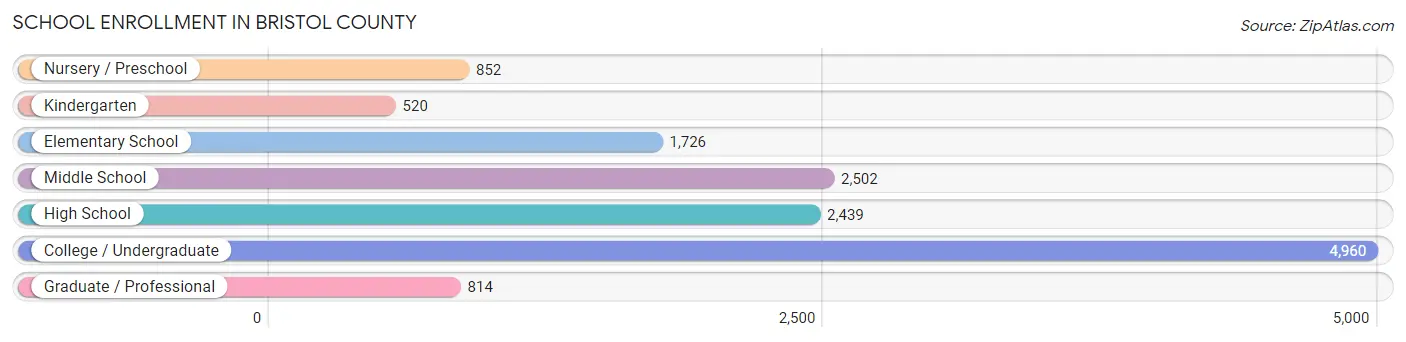
| School Level | # Students | % Students |
| Nursery / Preschool | 852 | 6.2% |
| Kindergarten | 520 | 3.8% |
| Elementary School | 1,726 | 12.5% |
| Middle School | 2,502 | 18.1% |
| High School | 2,439 | 17.7% |
| College / Undergraduate | 4,960 | 35.9% |
| Graduate / Professional | 814 | 5.9% |
| Total | 13,813 | 100.0% |
School Enrollment by Age by Funding Source in Bristol County
Out of a total of 13,813 students who are enrolled in schools in Bristol County, 5,801 (42.0%) attend a private institution, while the remaining 8,012 (58.0%) are enrolled in public schools. The age group of 18 to 19 year olds has the highest likelihood of being enrolled in private schools, with 2,007 (80.2% in the age bracket) enrolled. Conversely, the age group of 10 to 14 year olds has the lowest likelihood of being enrolled in a private school, with 2,682 (88.7% in the age bracket) attending a public institution.
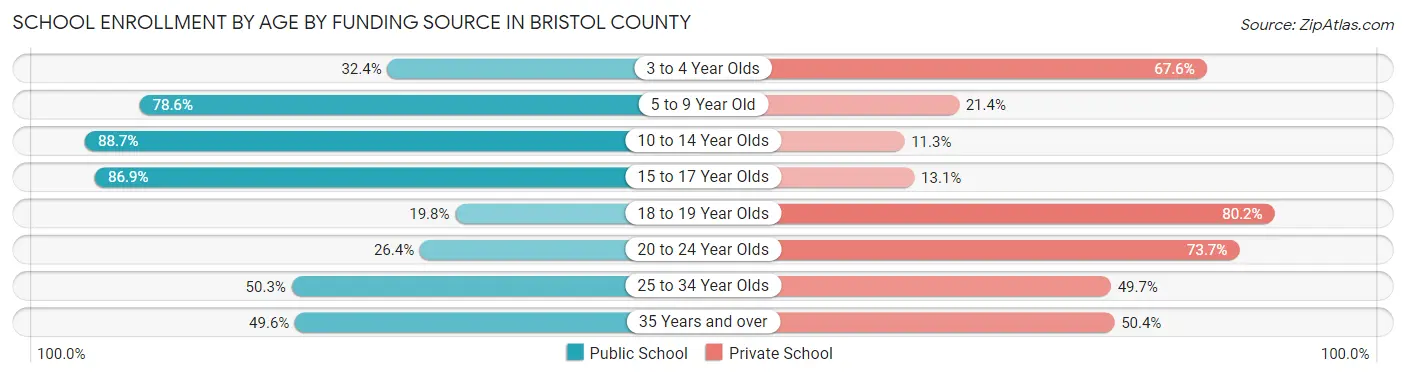
| Age Bracket | Public School | Private School |
| 3 to 4 Year Olds | 188 (32.4%) | 392 (67.6%) |
| 5 to 9 Year Old | 1,778 (78.6%) | 485 (21.4%) |
| 10 to 14 Year Olds | 2,682 (88.7%) | 341 (11.3%) |
| 15 to 17 Year Olds | 1,615 (86.9%) | 244 (13.1%) |
| 18 to 19 Year Olds | 495 (19.8%) | 2,007 (80.2%) |
| 20 to 24 Year Olds | 606 (26.4%) | 1,694 (73.7%) |
| 25 to 34 Year Olds | 390 (50.3%) | 386 (49.7%) |
| 35 Years and over | 253 (49.6%) | 257 (50.4%) |
| Total | 8,012 (58.0%) | 5,801 (42.0%) |
Educational Attainment by Field of Study in Bristol County
Business (2,464 | 12.6%), education (1,971 | 10.0%), literature & languages (1,929 | 9.8%), social sciences (1,762 | 9.0%), and bio, nature & agricultural (1,556 | 7.9%) are the most common fields of study among 19,626 individuals in Bristol County who have obtained a bachelor's degree or higher.
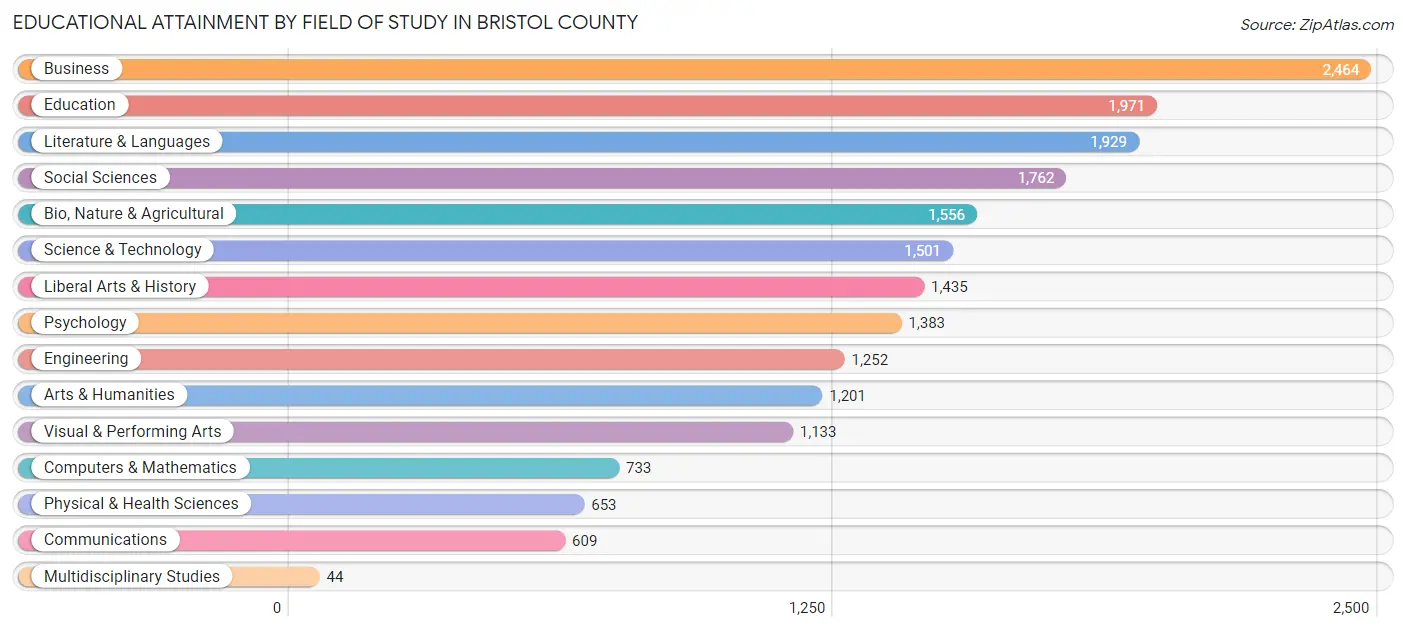
| Field of Study | # Graduates | % Graduates |
| Computers & Mathematics | 733 | 3.7% |
| Bio, Nature & Agricultural | 1,556 | 7.9% |
| Physical & Health Sciences | 653 | 3.3% |
| Psychology | 1,383 | 7.0% |
| Social Sciences | 1,762 | 9.0% |
| Engineering | 1,252 | 6.4% |
| Multidisciplinary Studies | 44 | 0.2% |
| Science & Technology | 1,501 | 7.6% |
| Business | 2,464 | 12.6% |
| Education | 1,971 | 10.0% |
| Literature & Languages | 1,929 | 9.8% |
| Liberal Arts & History | 1,435 | 7.3% |
| Visual & Performing Arts | 1,133 | 5.8% |
| Communications | 609 | 3.1% |
| Arts & Humanities | 1,201 | 6.1% |
| Total | 19,626 | 100.0% |
Transportation & Commute in Bristol County
Vehicle Availability by Sex in Bristol County
The most prevalent vehicle ownership categories in Bristol County are males with 2 vehicles (5,546, accounting for 44.6%) and females with 2 vehicles (4,928, making up 47.1%).
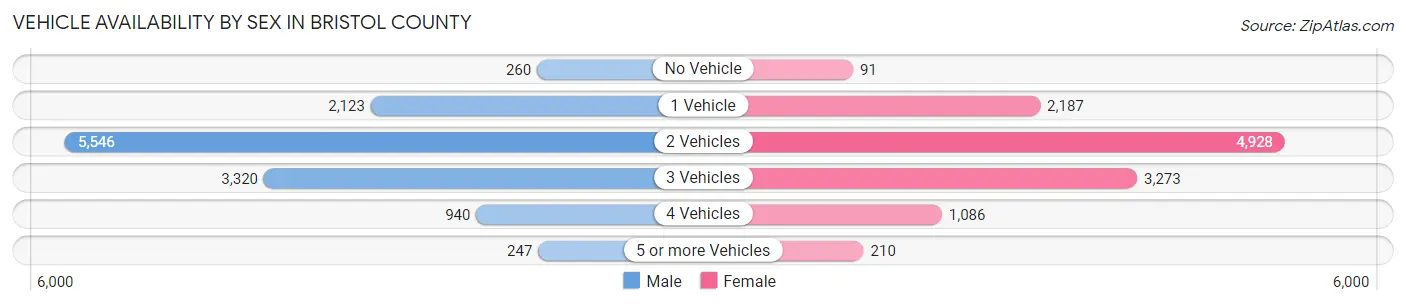
| Vehicles Available | Male | Female |
| No Vehicle | 260 (2.1%) | 91 (0.8%) |
| 1 Vehicle | 2,123 (17.1%) | 2,187 (18.6%) |
| 2 Vehicles | 5,546 (44.6%) | 4,928 (41.8%) |
| 3 Vehicles | 3,320 (26.7%) | 3,273 (27.8%) |
| 4 Vehicles | 940 (7.6%) | 1,086 (9.2%) |
| 5 or more Vehicles | 247 (2.0%) | 210 (1.8%) |
| Total | 12,436 (100.0%) | 11,775 (100.0%) |
Commute Time in Bristol County
The most frequently occuring commute durations in Bristol County are 5 to 9 minutes (3,116 commuters, 13.8%), 10 to 14 minutes (3,091 commuters, 13.7%), and 30 to 34 minutes (3,001 commuters, 13.3%).
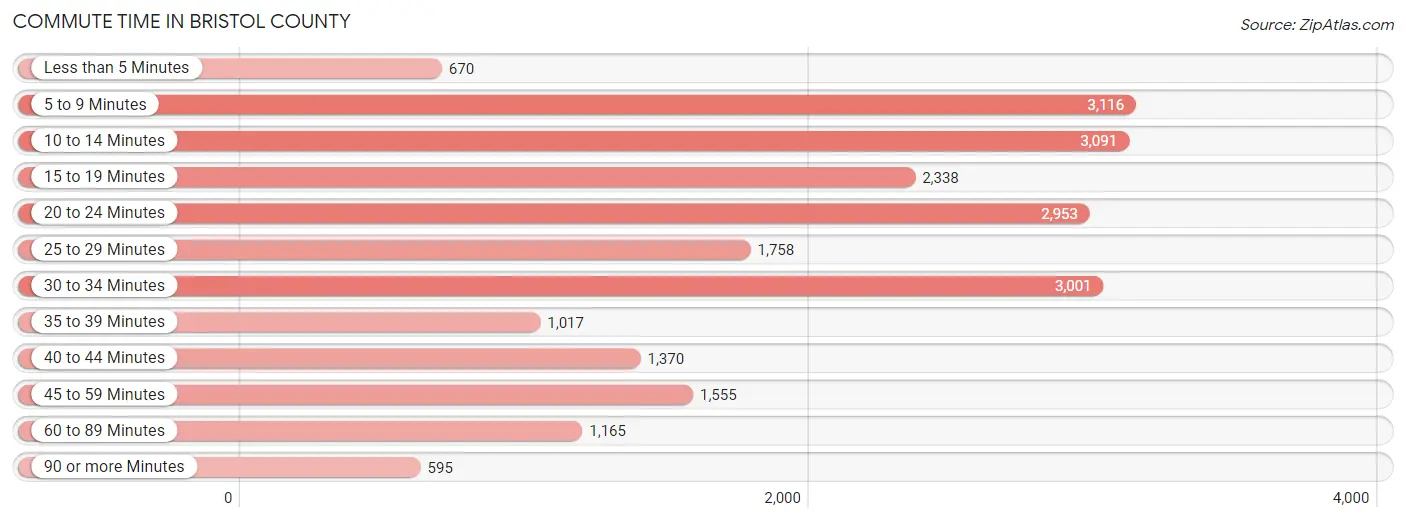
| Commute Time | # Commuters | % Commuters |
| Less than 5 Minutes | 670 | 3.0% |
| 5 to 9 Minutes | 3,116 | 13.8% |
| 10 to 14 Minutes | 3,091 | 13.7% |
| 15 to 19 Minutes | 2,338 | 10.3% |
| 20 to 24 Minutes | 2,953 | 13.1% |
| 25 to 29 Minutes | 1,758 | 7.8% |
| 30 to 34 Minutes | 3,001 | 13.3% |
| 35 to 39 Minutes | 1,017 | 4.5% |
| 40 to 44 Minutes | 1,370 | 6.0% |
| 45 to 59 Minutes | 1,555 | 6.9% |
| 60 to 89 Minutes | 1,165 | 5.1% |
| 90 or more Minutes | 595 | 2.6% |
Commute Time by Sex in Bristol County
The most common commute times in Bristol County are 30 to 34 minutes (1,636 commuters, 14.2%) for males and 5 to 9 minutes (1,706 commuters, 15.4%) for females.
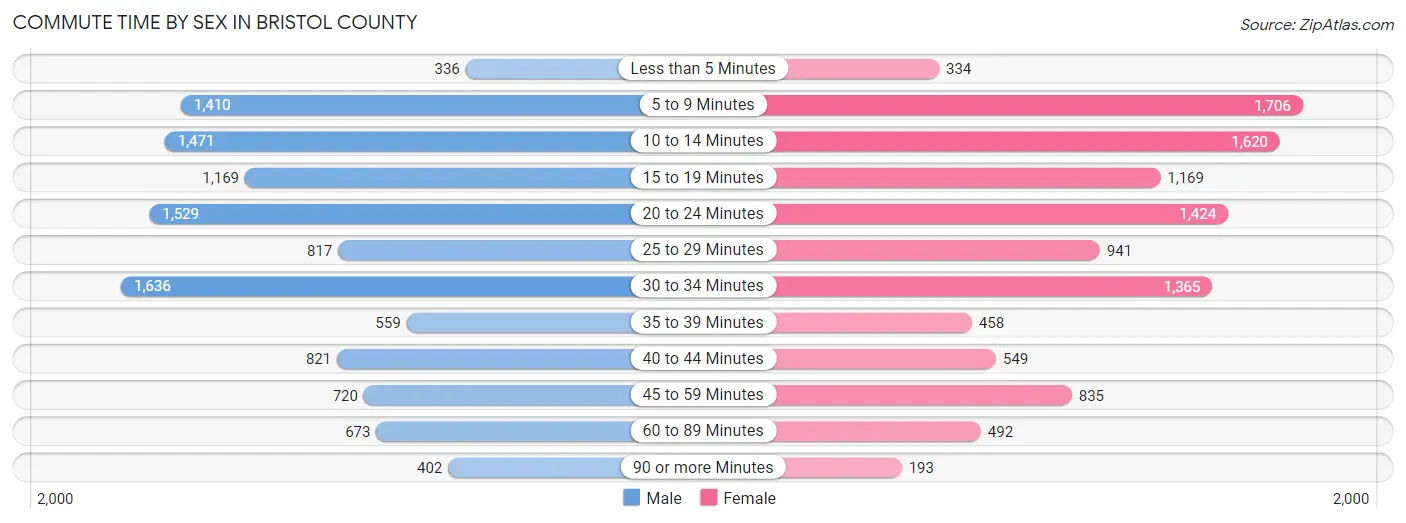
| Commute Time | Male | Female |
| Less than 5 Minutes | 336 (2.9%) | 334 (3.0%) |
| 5 to 9 Minutes | 1,410 (12.2%) | 1,706 (15.4%) |
| 10 to 14 Minutes | 1,471 (12.7%) | 1,620 (14.6%) |
| 15 to 19 Minutes | 1,169 (10.1%) | 1,169 (10.5%) |
| 20 to 24 Minutes | 1,529 (13.3%) | 1,424 (12.9%) |
| 25 to 29 Minutes | 817 (7.1%) | 941 (8.5%) |
| 30 to 34 Minutes | 1,636 (14.2%) | 1,365 (12.3%) |
| 35 to 39 Minutes | 559 (4.8%) | 458 (4.1%) |
| 40 to 44 Minutes | 821 (7.1%) | 549 (5.0%) |
| 45 to 59 Minutes | 720 (6.2%) | 835 (7.5%) |
| 60 to 89 Minutes | 673 (5.8%) | 492 (4.4%) |
| 90 or more Minutes | 402 (3.5%) | 193 (1.7%) |
Time of Departure to Work by Sex in Bristol County
The most frequent times of departure to work in Bristol County are 7:00 AM to 7:29 AM (2,364, 20.5%) for males and 7:00 AM to 7:29 AM (2,072, 18.7%) for females.
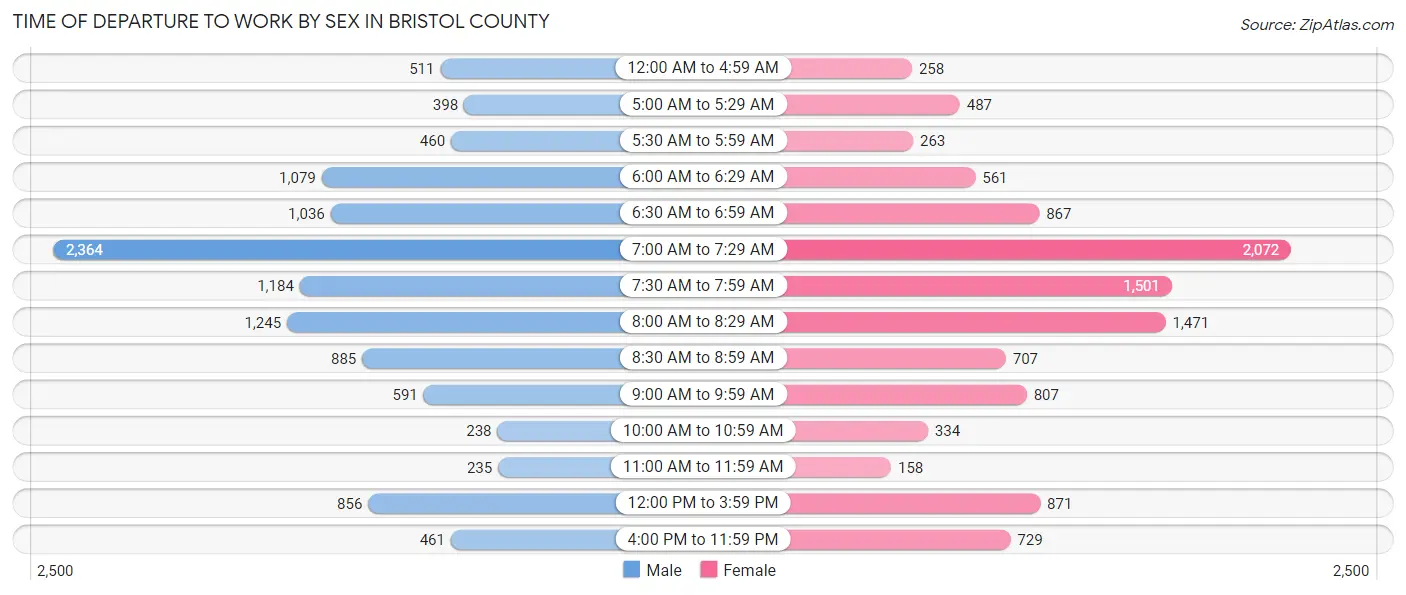
| Time of Departure | Male | Female |
| 12:00 AM to 4:59 AM | 511 (4.4%) | 258 (2.3%) |
| 5:00 AM to 5:29 AM | 398 (3.5%) | 487 (4.4%) |
| 5:30 AM to 5:59 AM | 460 (4.0%) | 263 (2.4%) |
| 6:00 AM to 6:29 AM | 1,079 (9.3%) | 561 (5.1%) |
| 6:30 AM to 6:59 AM | 1,036 (9.0%) | 867 (7.8%) |
| 7:00 AM to 7:29 AM | 2,364 (20.5%) | 2,072 (18.7%) |
| 7:30 AM to 7:59 AM | 1,184 (10.3%) | 1,501 (13.5%) |
| 8:00 AM to 8:29 AM | 1,245 (10.8%) | 1,471 (13.3%) |
| 8:30 AM to 8:59 AM | 885 (7.7%) | 707 (6.4%) |
| 9:00 AM to 9:59 AM | 591 (5.1%) | 807 (7.3%) |
| 10:00 AM to 10:59 AM | 238 (2.1%) | 334 (3.0%) |
| 11:00 AM to 11:59 AM | 235 (2.0%) | 158 (1.4%) |
| 12:00 PM to 3:59 PM | 856 (7.4%) | 871 (7.9%) |
| 4:00 PM to 11:59 PM | 461 (4.0%) | 729 (6.6%) |
| Total | 11,543 (100.0%) | 11,086 (100.0%) |
Housing Occupancy in Bristol County
Occupancy by Ownership in Bristol County
Of the total 19,173 dwellings in Bristol County, owner-occupied units account for 14,038 (73.2%), while renter-occupied units make up 5,135 (26.8%).
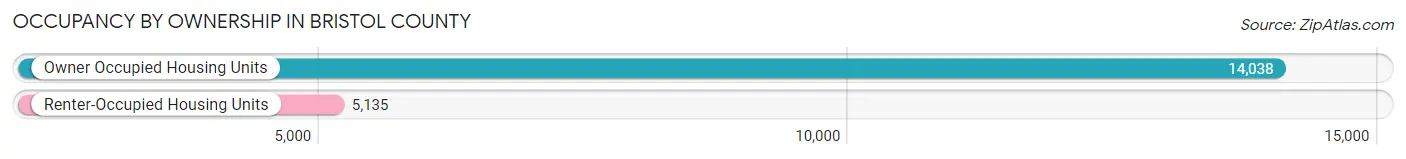
| Occupancy | # Housing Units | % Housing Units |
| Owner Occupied Housing Units | 14,038 | 73.2% |
| Renter-Occupied Housing Units | 5,135 | 26.8% |
| Total Occupied Housing Units | 19,173 | 100.0% |
Occupancy by Household Size in Bristol County
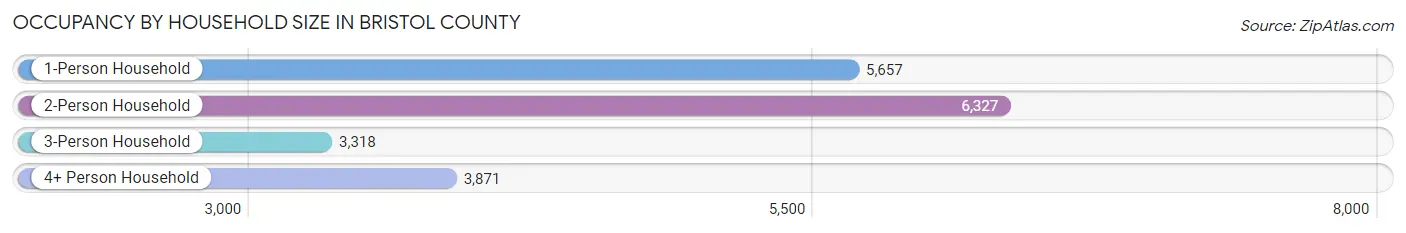
| Household Size | # Housing Units | % Housing Units |
| 1-Person Household | 5,657 | 29.5% |
| 2-Person Household | 6,327 | 33.0% |
| 3-Person Household | 3,318 | 17.3% |
| 4+ Person Household | 3,871 | 20.2% |
| Total Housing Units | 19,173 | 100.0% |
Occupancy by Ownership by Household Size in Bristol County
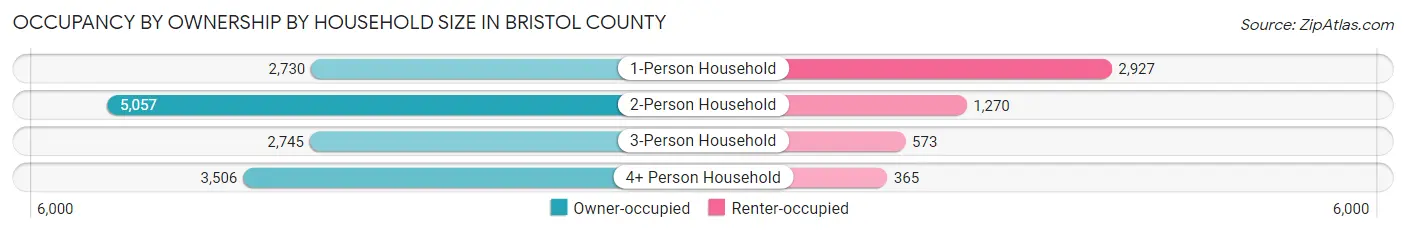
| Household Size | Owner-occupied | Renter-occupied |
| 1-Person Household | 2,730 (48.3%) | 2,927 (51.7%) |
| 2-Person Household | 5,057 (79.9%) | 1,270 (20.1%) |
| 3-Person Household | 2,745 (82.7%) | 573 (17.3%) |
| 4+ Person Household | 3,506 (90.6%) | 365 (9.4%) |
| Total Housing Units | 14,038 (73.2%) | 5,135 (26.8%) |
Occupancy by Educational Attainment in Bristol County
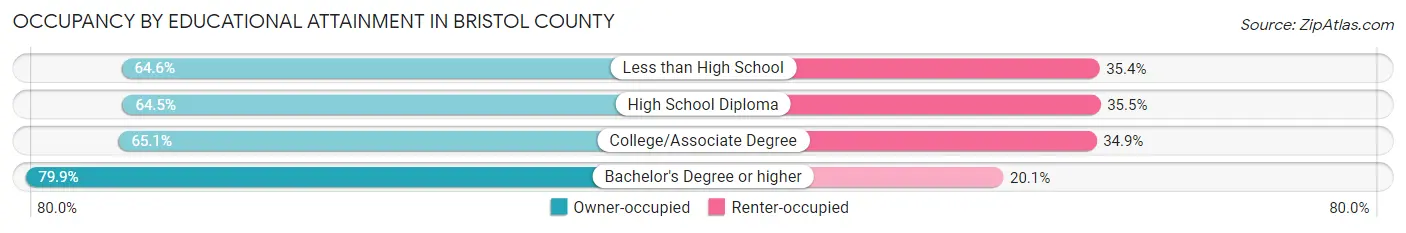
| Household Size | Owner-occupied | Renter-occupied |
| Less than High School | 683 (64.6%) | 374 (35.4%) |
| High School Diploma | 2,207 (64.5%) | 1,217 (35.5%) |
| College/Associate Degree | 2,591 (65.1%) | 1,389 (34.9%) |
| Bachelor's Degree or higher | 8,557 (79.9%) | 2,155 (20.1%) |
Occupancy by Age of Householder in Bristol County
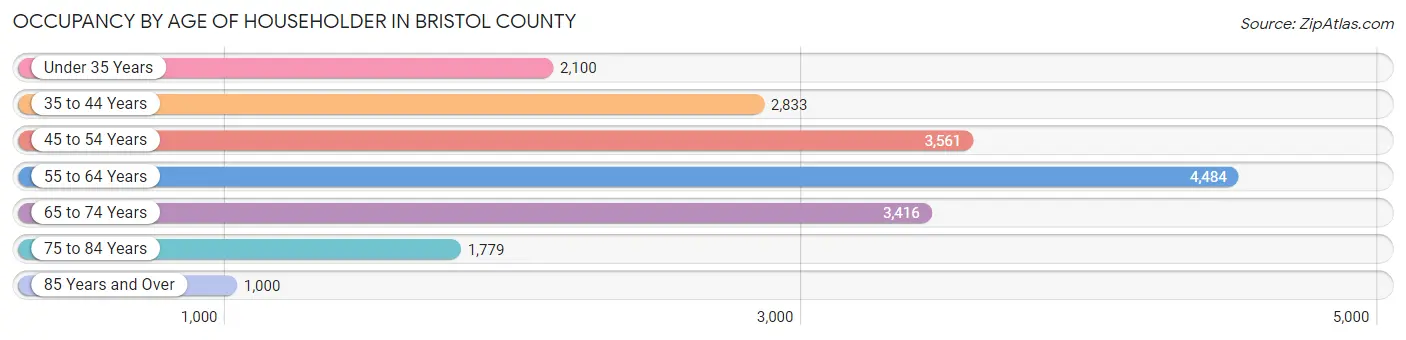
| Age Bracket | # Households | % Households |
| Under 35 Years | 2,100 | 11.0% |
| 35 to 44 Years | 2,833 | 14.8% |
| 45 to 54 Years | 3,561 | 18.6% |
| 55 to 64 Years | 4,484 | 23.4% |
| 65 to 74 Years | 3,416 | 17.8% |
| 75 to 84 Years | 1,779 | 9.3% |
| 85 Years and Over | 1,000 | 5.2% |
| Total | 19,173 | 100.0% |
Housing Finances in Bristol County
Median Income by Occupancy in Bristol County
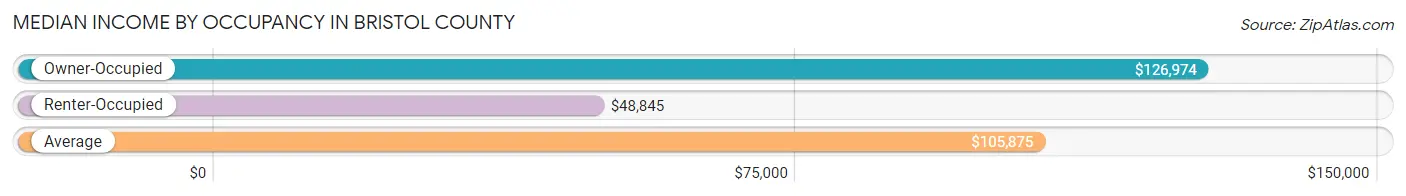
| Occupancy Type | # Households | Median Income |
| Owner-Occupied | 14,038 (73.2%) | $126,974 |
| Renter-Occupied | 5,135 (26.8%) | $48,845 |
| Average | 19,173 (100.0%) | $105,875 |
Occupancy by Householder Income Bracket in Bristol County
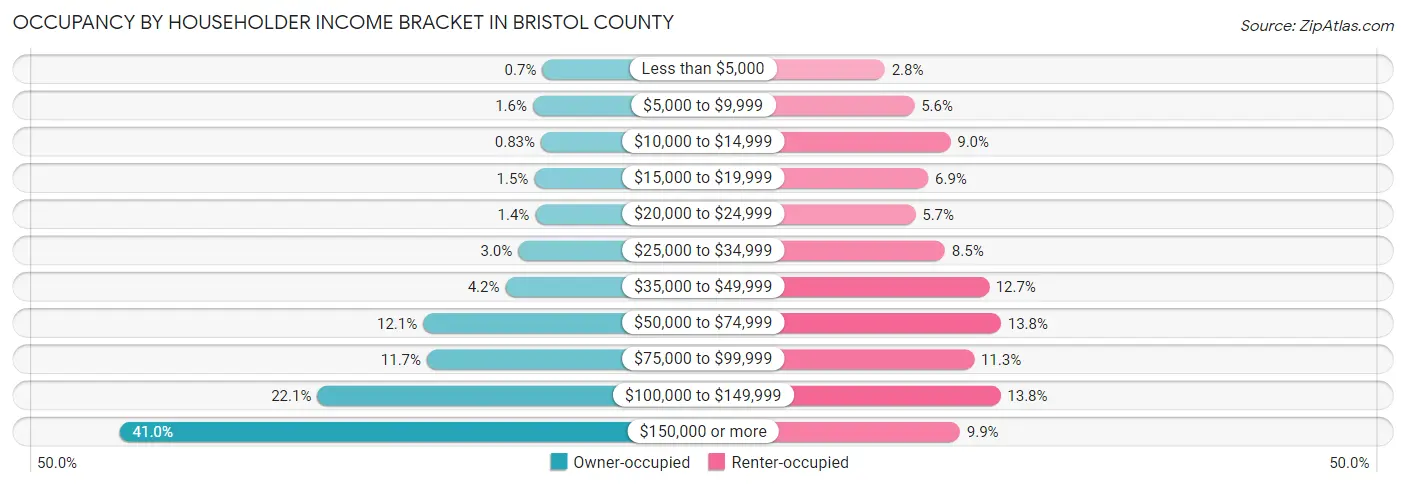
| Income Bracket | Owner-occupied | Renter-occupied |
| Less than $5,000 | 98 (0.7%) | 143 (2.8%) |
| $5,000 to $9,999 | 224 (1.6%) | 287 (5.6%) |
| $10,000 to $14,999 | 117 (0.8%) | 463 (9.0%) |
| $15,000 to $19,999 | 207 (1.5%) | 355 (6.9%) |
| $20,000 to $24,999 | 192 (1.4%) | 292 (5.7%) |
| $25,000 to $34,999 | 421 (3.0%) | 437 (8.5%) |
| $35,000 to $49,999 | 592 (4.2%) | 651 (12.7%) |
| $50,000 to $74,999 | 1,692 (12.0%) | 710 (13.8%) |
| $75,000 to $99,999 | 1,641 (11.7%) | 579 (11.3%) |
| $100,000 to $149,999 | 3,106 (22.1%) | 708 (13.8%) |
| $150,000 or more | 5,748 (40.9%) | 510 (9.9%) |
| Total | 14,038 (100.0%) | 5,135 (100.0%) |
Monthly Housing Cost Tiers in Bristol County
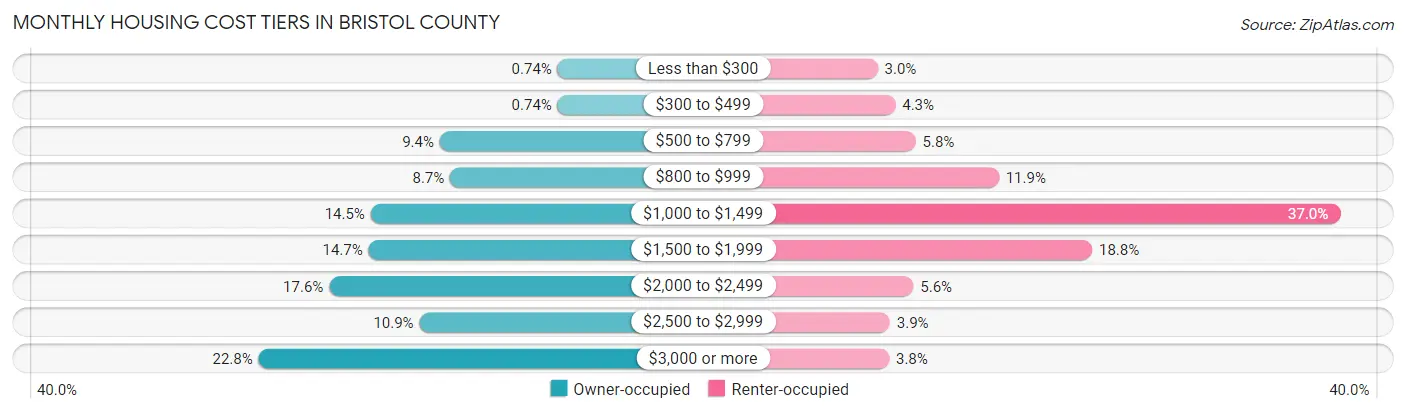
| Monthly Cost | Owner-occupied | Renter-occupied |
| Less than $300 | 104 (0.7%) | 152 (3.0%) |
| $300 to $499 | 104 (0.7%) | 219 (4.3%) |
| $500 to $799 | 1,322 (9.4%) | 296 (5.8%) |
| $800 to $999 | 1,215 (8.7%) | 610 (11.9%) |
| $1,000 to $1,499 | 2,037 (14.5%) | 1,901 (37.0%) |
| $1,500 to $1,999 | 2,060 (14.7%) | 963 (18.8%) |
| $2,000 to $2,499 | 2,467 (17.6%) | 287 (5.6%) |
| $2,500 to $2,999 | 1,533 (10.9%) | 198 (3.9%) |
| $3,000 or more | 3,196 (22.8%) | 195 (3.8%) |
| Total | 14,038 (100.0%) | 5,135 (100.0%) |
Physical Housing Characteristics in Bristol County
Housing Structures in Bristol County
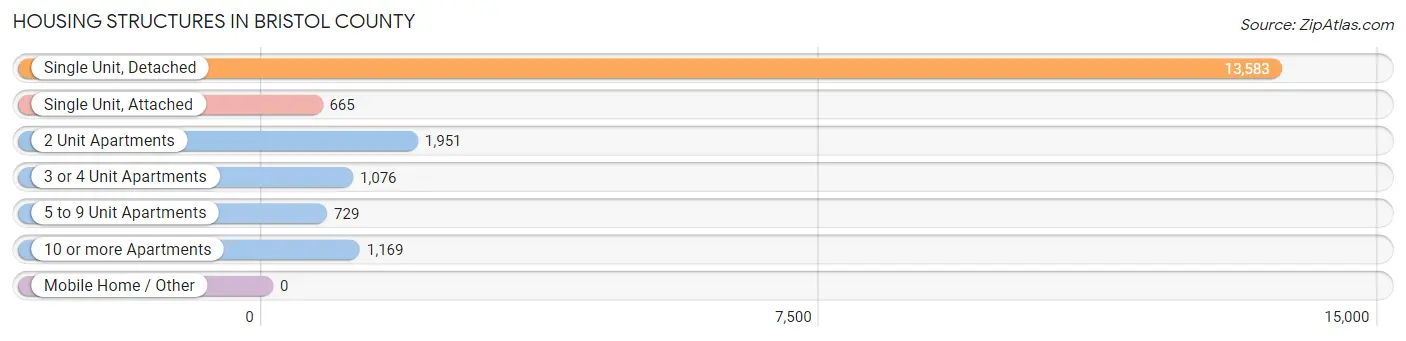
| Structure Type | # Housing Units | % Housing Units |
| Single Unit, Detached | 13,583 | 70.8% |
| Single Unit, Attached | 665 | 3.5% |
| 2 Unit Apartments | 1,951 | 10.2% |
| 3 or 4 Unit Apartments | 1,076 | 5.6% |
| 5 to 9 Unit Apartments | 729 | 3.8% |
| 10 or more Apartments | 1,169 | 6.1% |
| Mobile Home / Other | 0 | 0.0% |
| Total | 19,173 | 100.0% |
Housing Structures by Occupancy in Bristol County
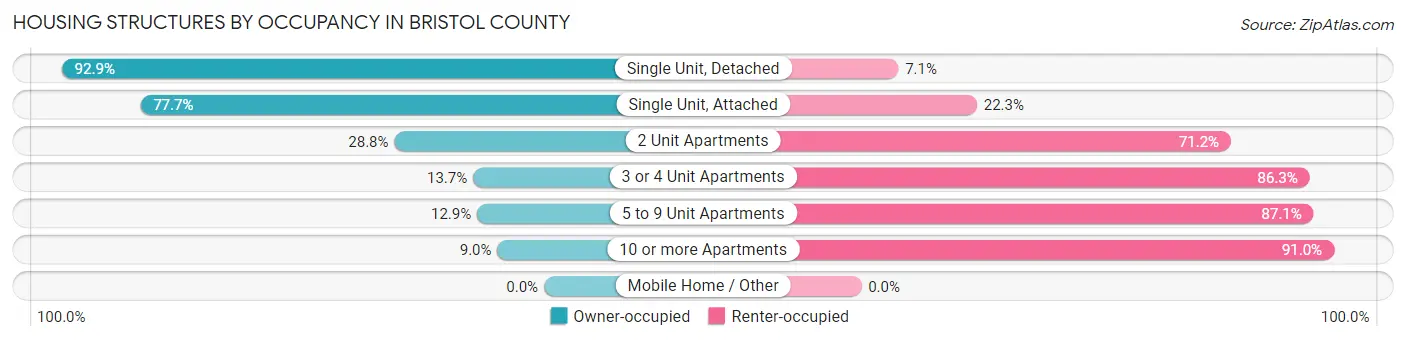
| Structure Type | Owner-occupied | Renter-occupied |
| Single Unit, Detached | 12,613 (92.9%) | 970 (7.1%) |
| Single Unit, Attached | 517 (77.7%) | 148 (22.3%) |
| 2 Unit Apartments | 562 (28.8%) | 1,389 (71.2%) |
| 3 or 4 Unit Apartments | 147 (13.7%) | 929 (86.3%) |
| 5 to 9 Unit Apartments | 94 (12.9%) | 635 (87.1%) |
| 10 or more Apartments | 105 (9.0%) | 1,064 (91.0%) |
| Mobile Home / Other | 0 (0.0%) | 0 (0.0%) |
| Total | 14,038 (73.2%) | 5,135 (26.8%) |
Housing Structures by Number of Rooms in Bristol County
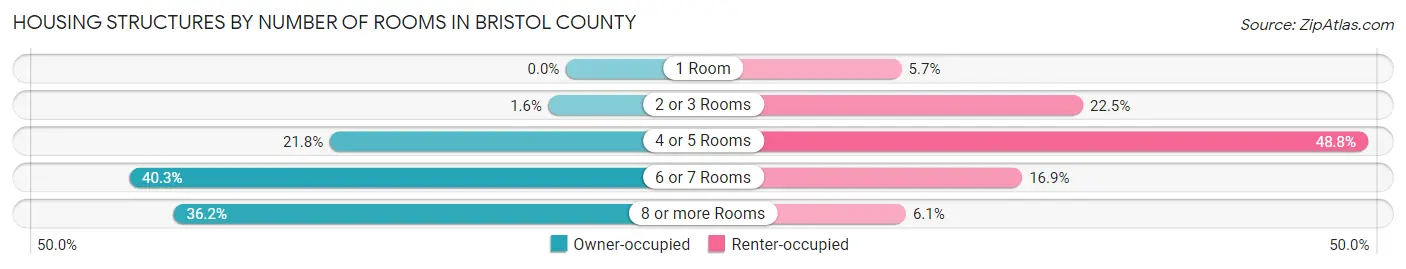
| Number of Rooms | Owner-occupied | Renter-occupied |
| 1 Room | 0 (0.0%) | 293 (5.7%) |
| 2 or 3 Rooms | 226 (1.6%) | 1,155 (22.5%) |
| 4 or 5 Rooms | 3,066 (21.8%) | 2,507 (48.8%) |
| 6 or 7 Rooms | 5,662 (40.3%) | 866 (16.9%) |
| 8 or more Rooms | 5,084 (36.2%) | 314 (6.1%) |
| Total | 14,038 (100.0%) | 5,135 (100.0%) |
Housing Structure by Heating Type in Bristol County
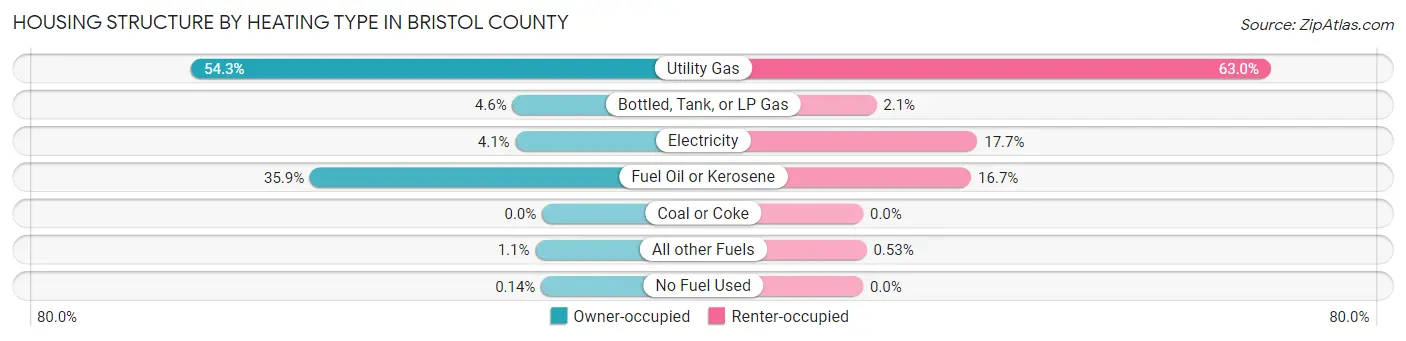
| Heating Type | Owner-occupied | Renter-occupied |
| Utility Gas | 7,615 (54.2%) | 3,237 (63.0%) |
| Bottled, Tank, or LP Gas | 643 (4.6%) | 106 (2.1%) |
| Electricity | 578 (4.1%) | 907 (17.7%) |
| Fuel Oil or Kerosene | 5,035 (35.9%) | 858 (16.7%) |
| Coal or Coke | 0 (0.0%) | 0 (0.0%) |
| All other Fuels | 148 (1.1%) | 27 (0.5%) |
| No Fuel Used | 19 (0.1%) | 0 (0.0%) |
| Total | 14,038 (100.0%) | 5,135 (100.0%) |
Household Vehicle Usage in Bristol County
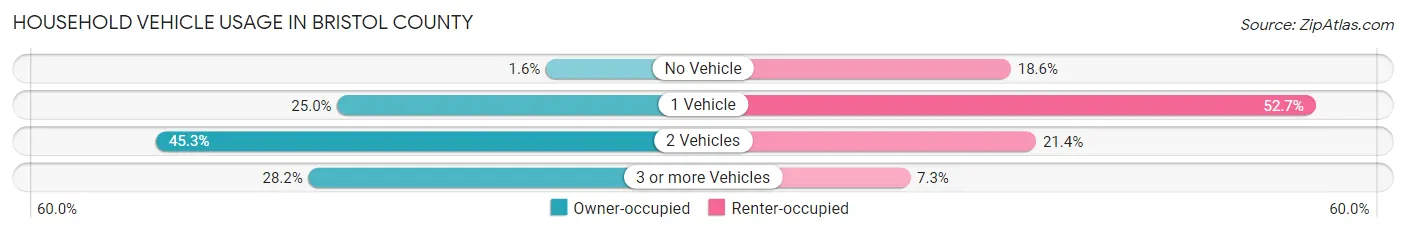
| Vehicles per Household | Owner-occupied | Renter-occupied |
| No Vehicle | 221 (1.6%) | 954 (18.6%) |
| 1 Vehicle | 3,504 (25.0%) | 2,707 (52.7%) |
| 2 Vehicles | 6,356 (45.3%) | 1,099 (21.4%) |
| 3 or more Vehicles | 3,957 (28.2%) | 375 (7.3%) |
| Total | 14,038 (100.0%) | 5,135 (100.0%) |
Real Estate & Mortgages in Bristol County
Real Estate and Mortgage Overview in Bristol County
| Characteristic | Without Mortgage | With Mortgage |
| Housing Units | 5,059 | 8,979 |
| Median Property Value | $410,700 | $459,500 |
| Median Household Income | $90,920 | $4,321 |
| Monthly Housing Costs | $972 | $3,082 |
| Real Estate Taxes | $5,791 | $27 |
Property Value by Mortgage Status in Bristol County
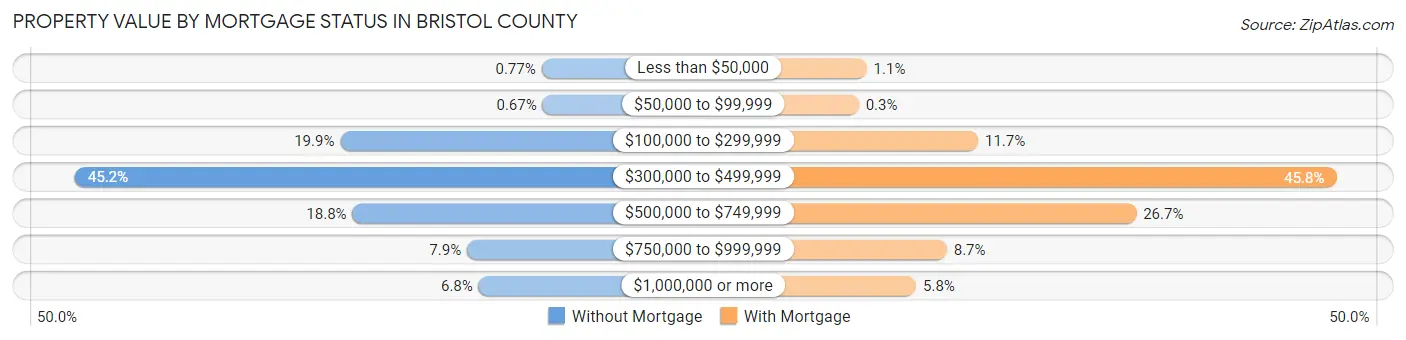
| Property Value | Without Mortgage | With Mortgage |
| Less than $50,000 | 39 (0.8%) | 95 (1.1%) |
| $50,000 to $99,999 | 34 (0.7%) | 27 (0.3%) |
| $100,000 to $299,999 | 1,009 (19.9%) | 1,048 (11.7%) |
| $300,000 to $499,999 | 2,287 (45.2%) | 4,111 (45.8%) |
| $500,000 to $749,999 | 950 (18.8%) | 2,400 (26.7%) |
| $750,000 to $999,999 | 398 (7.9%) | 780 (8.7%) |
| $1,000,000 or more | 342 (6.8%) | 518 (5.8%) |
| Total | 5,059 (100.0%) | 8,979 (100.0%) |
Household Income by Mortgage Status in Bristol County
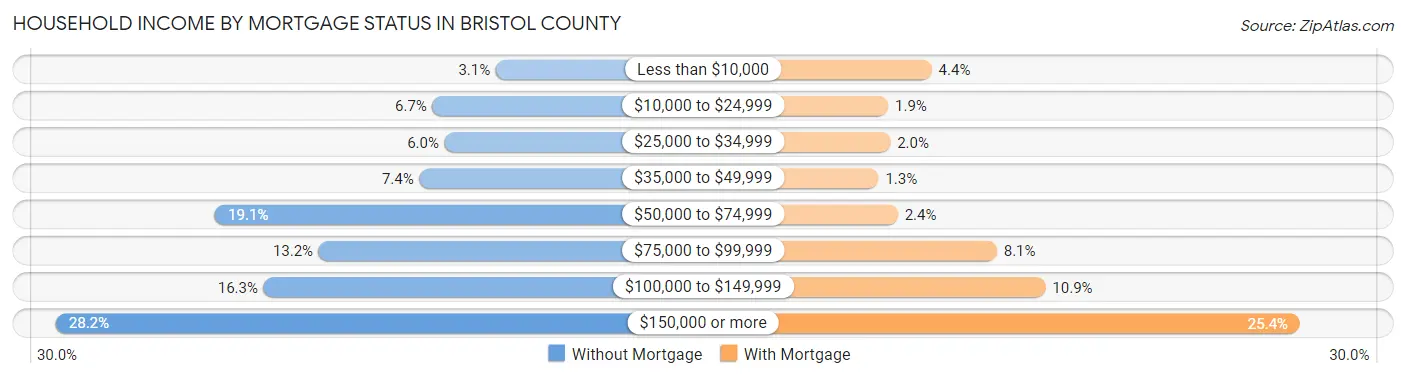
| Household Income | Without Mortgage | With Mortgage |
| Less than $10,000 | 155 (3.1%) | 391 (4.3%) |
| $10,000 to $24,999 | 338 (6.7%) | 167 (1.9%) |
| $25,000 to $34,999 | 303 (6.0%) | 178 (2.0%) |
| $35,000 to $49,999 | 376 (7.4%) | 118 (1.3%) |
| $50,000 to $74,999 | 967 (19.1%) | 216 (2.4%) |
| $75,000 to $99,999 | 667 (13.2%) | 725 (8.1%) |
| $100,000 to $149,999 | 826 (16.3%) | 974 (10.8%) |
| $150,000 or more | 1,427 (28.2%) | 2,280 (25.4%) |
| Total | 5,059 (100.0%) | 8,979 (100.0%) |
Property Value to Household Income Ratio in Bristol County
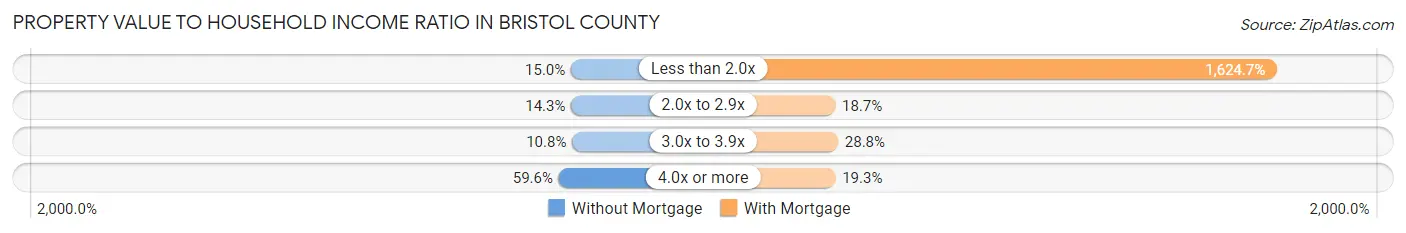
| Value-to-Income Ratio | Without Mortgage | With Mortgage |
| Less than 2.0x | 758 (15.0%) | 145,883 (1,624.7%) |
| 2.0x to 2.9x | 722 (14.3%) | 1,679 (18.7%) |
| 3.0x to 3.9x | 547 (10.8%) | 2,586 (28.8%) |
| 4.0x or more | 3,013 (59.6%) | 1,730 (19.3%) |
| Total | 5,059 (100.0%) | 8,979 (100.0%) |
Real Estate Taxes by Mortgage Status in Bristol County
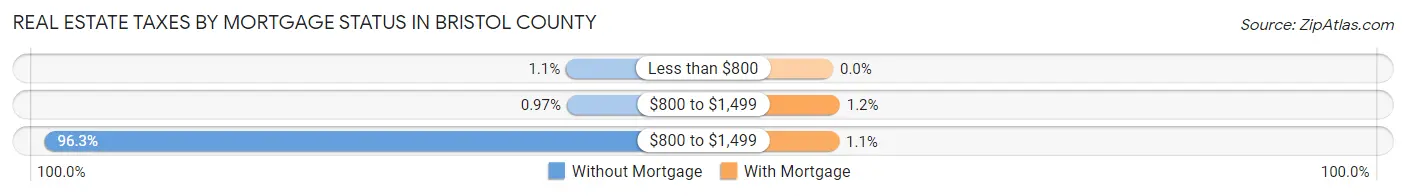
| Property Taxes | Without Mortgage | With Mortgage |
| Less than $800 | 56 (1.1%) | 0 (0.0%) |
| $800 to $1,499 | 49 (1.0%) | 110 (1.2%) |
| $800 to $1,499 | 4,874 (96.3%) | 100 (1.1%) |
| Total | 5,059 (100.0%) | 8,979 (100.0%) |
Health & Disability in Bristol County
Health Insurance Coverage by Age in Bristol County
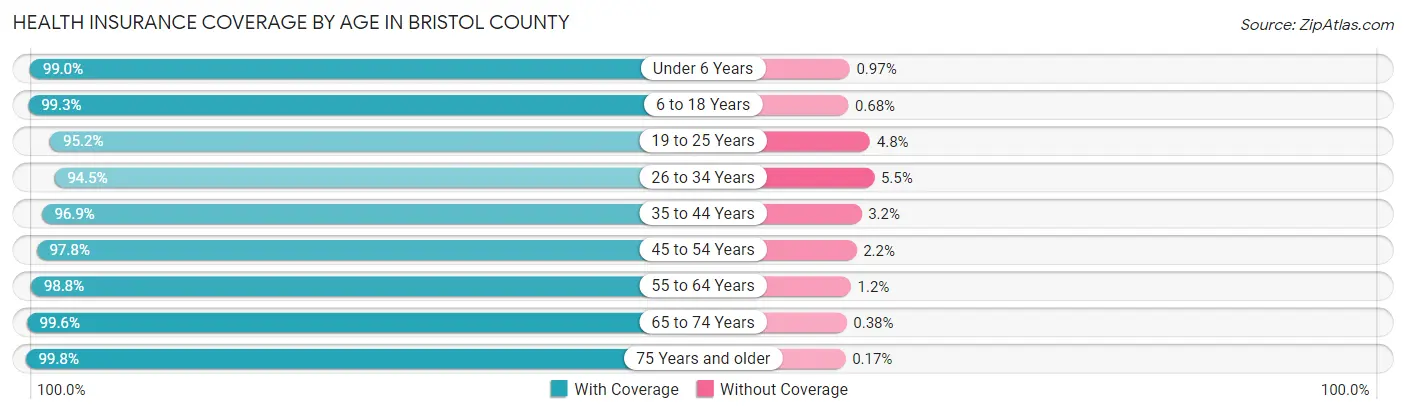
| Age Bracket | With Coverage | Without Coverage |
| Under 6 Years | 2,561 (99.0%) | 25 (1.0%) |
| 6 to 18 Years | 7,575 (99.3%) | 52 (0.7%) |
| 19 to 25 Years | 5,222 (95.2%) | 261 (4.8%) |
| 26 to 34 Years | 4,525 (94.5%) | 265 (5.5%) |
| 35 to 44 Years | 5,325 (96.9%) | 173 (3.2%) |
| 45 to 54 Years | 6,396 (97.8%) | 145 (2.2%) |
| 55 to 64 Years | 7,765 (98.8%) | 92 (1.2%) |
| 65 to 74 Years | 5,552 (99.6%) | 21 (0.4%) |
| 75 Years and older | 4,021 (99.8%) | 7 (0.2%) |
| Total | 48,942 (97.9%) | 1,041 (2.1%) |
Health Insurance Coverage by Citizenship Status in Bristol County
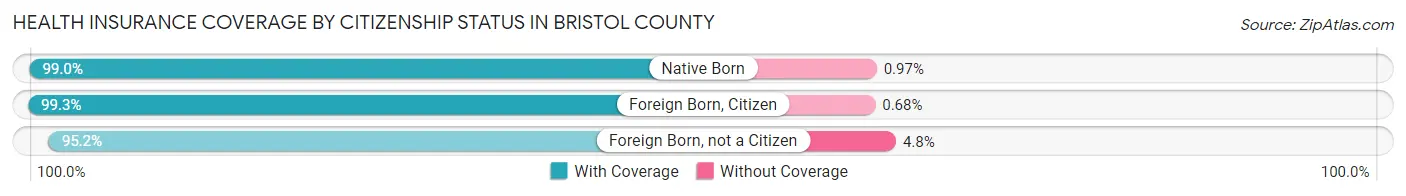
| Citizenship Status | With Coverage | Without Coverage |
| Native Born | 2,561 (99.0%) | 25 (1.0%) |
| Foreign Born, Citizen | 7,575 (99.3%) | 52 (0.7%) |
| Foreign Born, not a Citizen | 5,222 (95.2%) | 261 (4.8%) |
Health Insurance Coverage by Household Income in Bristol County
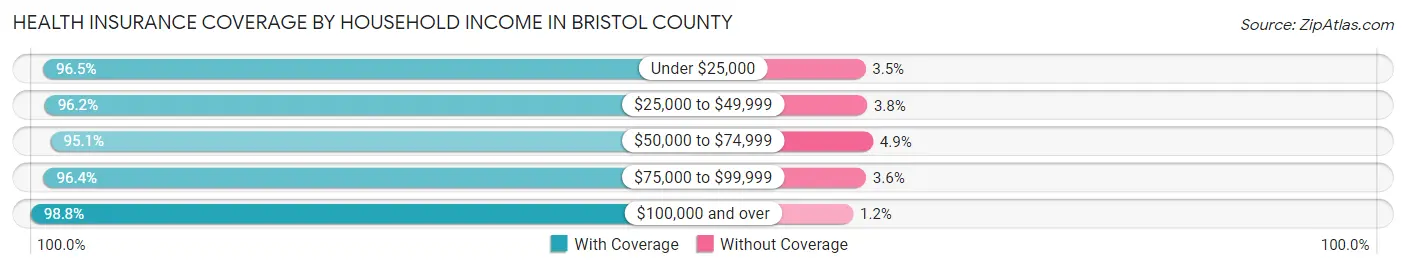
| Household Income | With Coverage | Without Coverage |
| Under $25,000 | 3,397 (96.5%) | 122 (3.5%) |
| $25,000 to $49,999 | 2,979 (96.2%) | 117 (3.8%) |
| $50,000 to $74,999 | 4,551 (95.1%) | 234 (4.9%) |
| $75,000 to $99,999 | 4,827 (96.4%) | 179 (3.6%) |
| $100,000 and over | 29,833 (98.8%) | 357 (1.2%) |
Public vs Private Health Insurance Coverage by Age in Bristol County
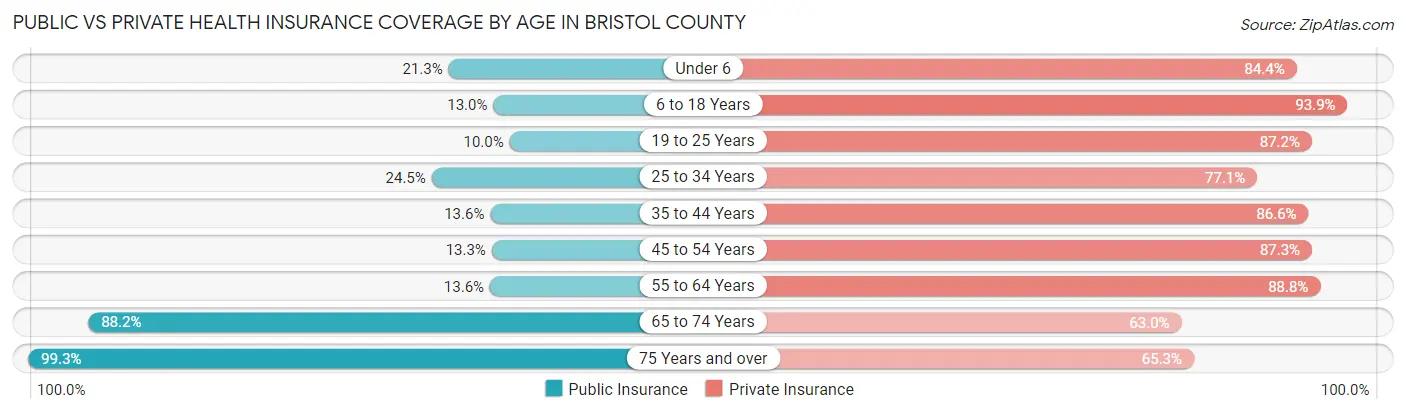
| Age Bracket | Public Insurance | Private Insurance |
| Under 6 | 551 (21.3%) | 2,183 (84.4%) |
| 6 to 18 Years | 992 (13.0%) | 7,158 (93.9%) |
| 19 to 25 Years | 548 (10.0%) | 4,783 (87.2%) |
| 25 to 34 Years | 1,171 (24.4%) | 3,692 (77.1%) |
| 35 to 44 Years | 746 (13.6%) | 4,762 (86.6%) |
| 45 to 54 Years | 870 (13.3%) | 5,708 (87.3%) |
| 55 to 64 Years | 1,071 (13.6%) | 6,976 (88.8%) |
| 65 to 74 Years | 4,915 (88.2%) | 3,513 (63.0%) |
| 75 Years and over | 4,001 (99.3%) | 2,632 (65.3%) |
| Total | 14,865 (29.7%) | 41,407 (82.8%) |
Disability Status by Sex by Age in Bristol County
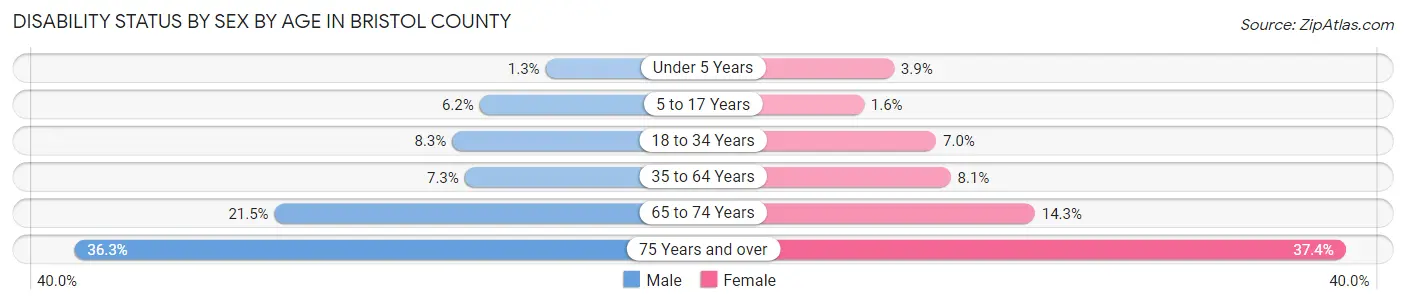
| Age Bracket | Male | Female |
| Under 5 Years | 13 (1.3%) | 38 (3.9%) |
| 5 to 17 Years | 227 (6.2%) | 59 (1.6%) |
| 18 to 34 Years | 464 (8.3%) | 397 (7.0%) |
| 35 to 64 Years | 710 (7.3%) | 825 (8.1%) |
| 65 to 74 Years | 561 (21.4%) | 424 (14.3%) |
| 75 Years and over | 546 (36.3%) | 944 (37.4%) |
Disability Class by Sex by Age in Bristol County
Disability Class: Hearing Difficulty
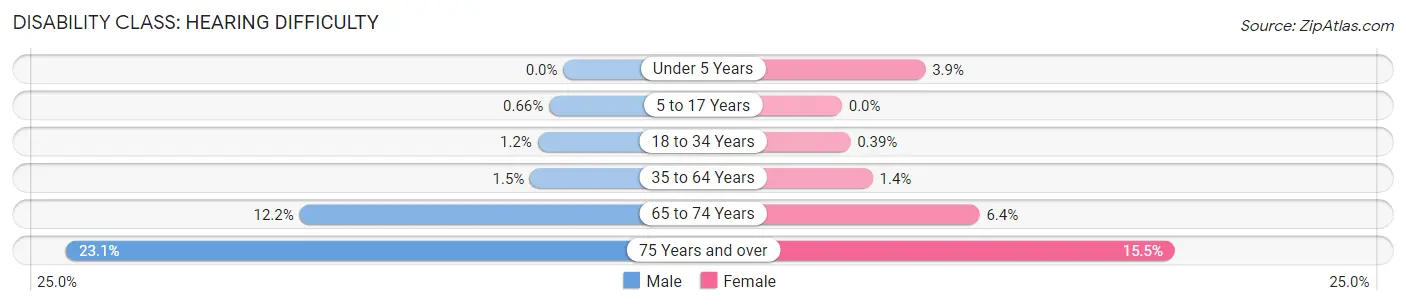
| Age Bracket | Male | Female |
| Under 5 Years | 0 (0.0%) | 38 (3.9%) |
| 5 to 17 Years | 24 (0.7%) | 0 (0.0%) |
| 18 to 34 Years | 67 (1.2%) | 22 (0.4%) |
| 35 to 64 Years | 149 (1.5%) | 146 (1.4%) |
| 65 to 74 Years | 320 (12.2%) | 189 (6.4%) |
| 75 Years and over | 347 (23.1%) | 390 (15.4%) |
Disability Class: Vision Difficulty
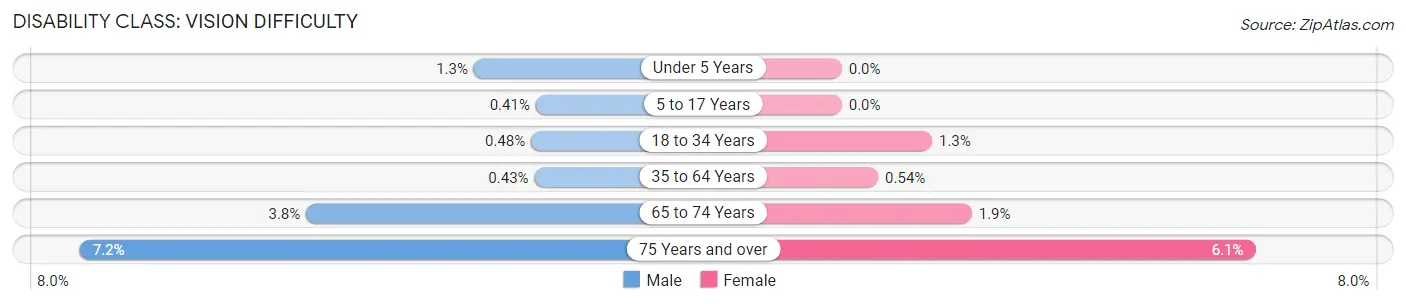
| Age Bracket | Male | Female |
| Under 5 Years | 13 (1.3%) | 0 (0.0%) |
| 5 to 17 Years | 15 (0.4%) | 0 (0.0%) |
| 18 to 34 Years | 27 (0.5%) | 76 (1.3%) |
| 35 to 64 Years | 42 (0.4%) | 55 (0.5%) |
| 65 to 74 Years | 100 (3.8%) | 57 (1.9%) |
| 75 Years and over | 108 (7.2%) | 155 (6.1%) |
Disability Class: Cognitive Difficulty
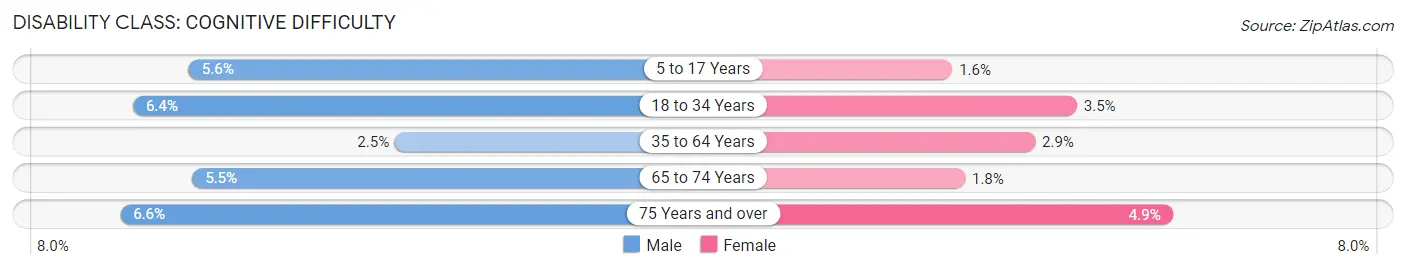
| Age Bracket | Male | Female |
| 5 to 17 Years | 203 (5.6%) | 59 (1.6%) |
| 18 to 34 Years | 359 (6.4%) | 198 (3.5%) |
| 35 to 64 Years | 242 (2.5%) | 293 (2.9%) |
| 65 to 74 Years | 144 (5.5%) | 54 (1.8%) |
| 75 Years and over | 99 (6.6%) | 124 (4.9%) |
Disability Class: Ambulatory Difficulty
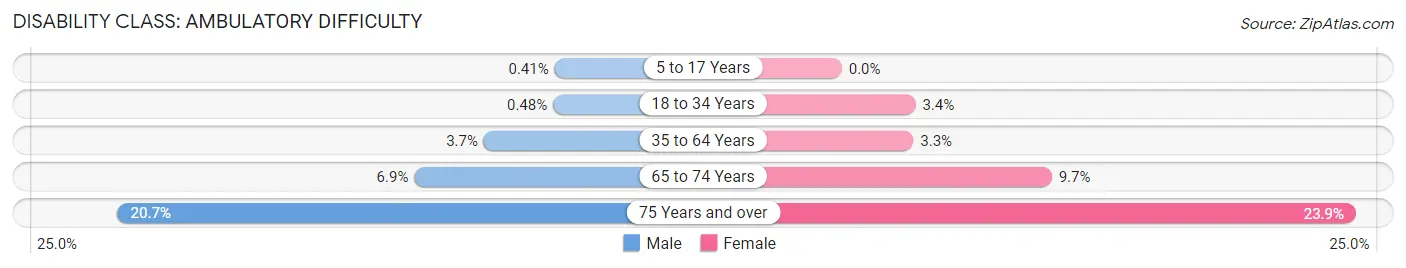
| Age Bracket | Male | Female |
| 5 to 17 Years | 15 (0.4%) | 0 (0.0%) |
| 18 to 34 Years | 27 (0.5%) | 194 (3.4%) |
| 35 to 64 Years | 357 (3.7%) | 339 (3.3%) |
| 65 to 74 Years | 181 (6.9%) | 288 (9.7%) |
| 75 Years and over | 311 (20.7%) | 602 (23.8%) |
Disability Class: Self-Care Difficulty
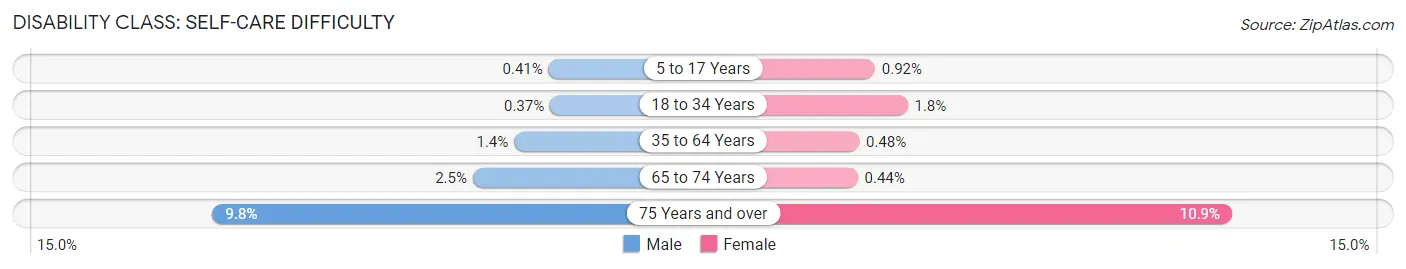
| Age Bracket | Male | Female |
| 5 to 17 Years | 15 (0.4%) | 33 (0.9%) |
| 18 to 34 Years | 21 (0.4%) | 104 (1.8%) |
| 35 to 64 Years | 133 (1.4%) | 49 (0.5%) |
| 65 to 74 Years | 66 (2.5%) | 13 (0.4%) |
| 75 Years and over | 147 (9.8%) | 274 (10.9%) |
Technology Access in Bristol County
Computing Device Access in Bristol County
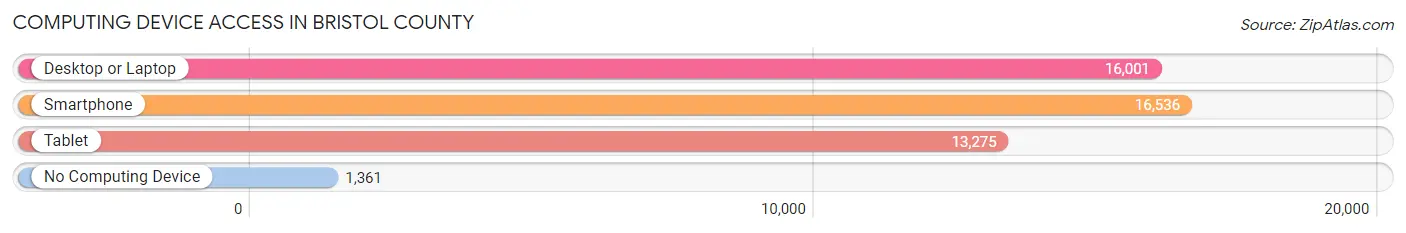
| Device Type | # Households | % Households |
| Desktop or Laptop | 16,001 | 83.5% |
| Smartphone | 16,536 | 86.3% |
| Tablet | 13,275 | 69.2% |
| No Computing Device | 1,361 | 7.1% |
| Total | 19,173 | 100.0% |
Internet Access in Bristol County
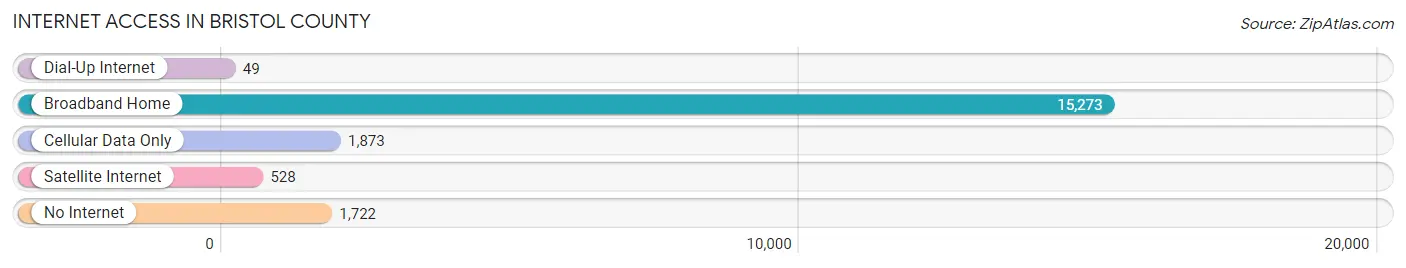
| Internet Type | # Households | % Households |
| Dial-Up Internet | 49 | 0.3% |
| Broadband Home | 15,273 | 79.7% |
| Cellular Data Only | 1,873 | 9.8% |
| Satellite Internet | 528 | 2.8% |
| No Internet | 1,722 | 9.0% |
| Total | 19,173 | 100.0% |
Bristol County Summary
Bristol County, Rhode Island is located in the southeastern corner of the state and is bordered by Massachusetts to the north and east, and the Narragansett Bay to the south. The county is comprised of seven towns, including Barrington, Bristol, Warren, Little Compton, Tiverton, Portsmouth, and East Providence. Bristol County is the smallest county in Rhode Island, covering an area of only 144 square miles.
History
Bristol County was established in 1747 and was named after the city of Bristol, England. The county was originally part of Massachusetts, but was annexed to Rhode Island in 1747. The county was originally home to the Wampanoag tribe, who were the first inhabitants of the area. The Wampanoag were a peaceful tribe who lived off the land and were known for their fishing and farming skills.
In the late 1700s, Bristol County became a popular destination for wealthy merchants and sea captains from Providence and Newport. These wealthy individuals built large estates and mansions in the area, which still stand today.
In the early 1800s, Bristol County was a major center for the whaling industry. The county was home to several whaling ships, which sailed around the world in search of whales. The whaling industry was a major source of income for the county until the mid-1800s, when the industry began to decline.
Geography
Bristol County is located in the southeastern corner of Rhode Island and is bordered by Massachusetts to the north and east, and the Narragansett Bay to the south. The county is comprised of seven towns, including Barrington, Bristol, Warren, Little Compton, Tiverton, Portsmouth, and East Providence. Bristol County is the smallest county in Rhode Island, covering an area of only 144 square miles.
The county is mostly rural, with rolling hills and forests. The highest point in the county is Mount Hope, which is located in Bristol and stands at an elevation of 545 feet. The county is also home to several rivers, including the Blackstone, Taunton, and Warren Rivers.
Economy
Bristol County has a diverse economy, with a mix of manufacturing, retail, and service industries. The county is home to several large employers, including the Naval Undersea Warfare Center, Raytheon, and the Rhode Island Department of Transportation.
The county is also home to several small businesses, including restaurants, retail stores, and professional services. Tourism is also an important part of the county’s economy, with many visitors coming to the area to enjoy the beaches, parks, and other attractions.
Demographics
As of the 2010 census, Bristol County had a population of 49,875. The population is mostly white (90.2%), with small percentages of African American (3.3%), Asian (2.2%), and Hispanic (2.1%) residents. The median household income in the county is $60,845, and the median home value is $269,400.
Conclusion
Bristol County, Rhode Island is a small county located in the southeastern corner of the state. The county is home to seven towns, including Barrington, Bristol, Warren, Little Compton, Tiverton, Portsmouth, and East Providence. The county has a diverse economy, with a mix of manufacturing, retail, and service industries. The county also has a diverse population, with a mix of white, African American, Asian, and Hispanic residents.
Common Questions
What is Per Capita Income in Bristol County?
Per Capita income in Bristol County is $56,739.
What is the Median Family Income in Bristol County?
Median Family Income in Bristol County is $135,125.
What is the Median Household income in Bristol County?
Median Household Income in Bristol County is $105,875.
What is Income or Wage Gap in Bristol County?
Income or Wage Gap in Bristol County is 38.3%.
Women in Bristol County earn 61.7 cents for every dollar earned by a man.
What is Family Income Deficit in Bristol County?
Family Income Deficit in Bristol County is $8,692.
Families that are below poverty line in Bristol County earn $8,692 less on average than the poverty threshold level.
What is Inequality or Gini Index in Bristol County?
Inequality or Gini Index in Bristol County is 0.48.
What is the Total Population of Bristol County?
Total Population of Bristol County is 50,658.
What is the Total Male Population of Bristol County?
Total Male Population of Bristol County is 24,571.
What is the Total Female Population of Bristol County?
Total Female Population of Bristol County is 26,087.
What is the Ratio of Males per 100 Females in Bristol County?
There are 94.19 Males per 100 Females in Bristol County.
What is the Ratio of Females per 100 Males in Bristol County?
There are 106.17 Females per 100 Males in Bristol County.
What is the Median Population Age in Bristol County?
Median Population Age in Bristol County is 43.9 Years.
What is the Average Family Size in Bristol County
Average Family Size in Bristol County is 3.0 People.
What is the Average Household Size in Bristol County
Average Household Size in Bristol County is 2.4 People.
How Large is the Labor Force in Bristol County?
There are 27,206 People in the Labor Forcein in Bristol County.
What is the Percentage of People in the Labor Force in Bristol County?
63.6% of People are in the Labor Force in Bristol County.
What is the Unemployment Rate in Bristol County?
Unemployment Rate in Bristol County is 4.1%.