Vieques, PR Map & Demographics
Vieques Map
Vieques Overview
$5,692
PER CAPITA INCOME
$16,607
AVG FAMILY INCOME
$12,377
AVG HOUSEHOLD INCOME
22.6%
WAGE / INCOME GAP [ % ]
77.4¢/ $1
WAGE / INCOME GAP [ $ ]
0.42
INEQUALITY / GINI INDEX
1,892
TOTAL POPULATION
1,034
MALE POPULATION
858
FEMALE POPULATION
120.51
MALES / 100 FEMALES
82.98
FEMALES / 100 MALES
26.3
MEDIAN AGE
4.7
AVG FAMILY SIZE
2.9
AVG HOUSEHOLD SIZE
471
LABOR FORCE [ PEOPLE ]
38.2%
PERCENT IN LABOR FORCE
23.3%
UNEMPLOYMENT RATE
Vieques Zip Codes
Vieques Area Codes
Income in Vieques
Income Overview in Vieques
Per Capita Income in Vieques is $5,692, while median incomes of families and households are $16,607 and $12,377 respectively.
| Characteristic | Number | Measure |
| Per Capita Income | 1,892 | $5,692 |
| Median Family Income | 309 | $16,607 |
| Mean Family Income | 309 | $18,297 |
| Median Household Income | 656 | $12,377 |
| Mean Household Income | 656 | $14,289 |
| Income Deficit | 309 | $0 |
| Wage / Income Gap (%) | 1,892 | 22.62% |
| Wage / Income Gap ($) | 1,892 | 77.38¢ per $1 |
| Gini / Inequality Index | 1,892 | 0.42 |
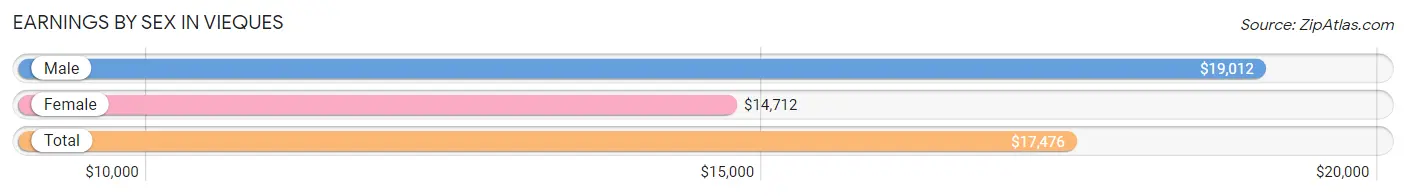
Earnings by Sex in Vieques
Average Earnings in Vieques are $17,476, $19,012 for men and $14,712 for women, a difference of 22.6%.
| Sex | Number | Average Earnings |
| Male | 158 (35.2%) | $19,012 |
| Female | 291 (64.8%) | $14,712 |
| Total | 449 (100.0%) | $17,476 |
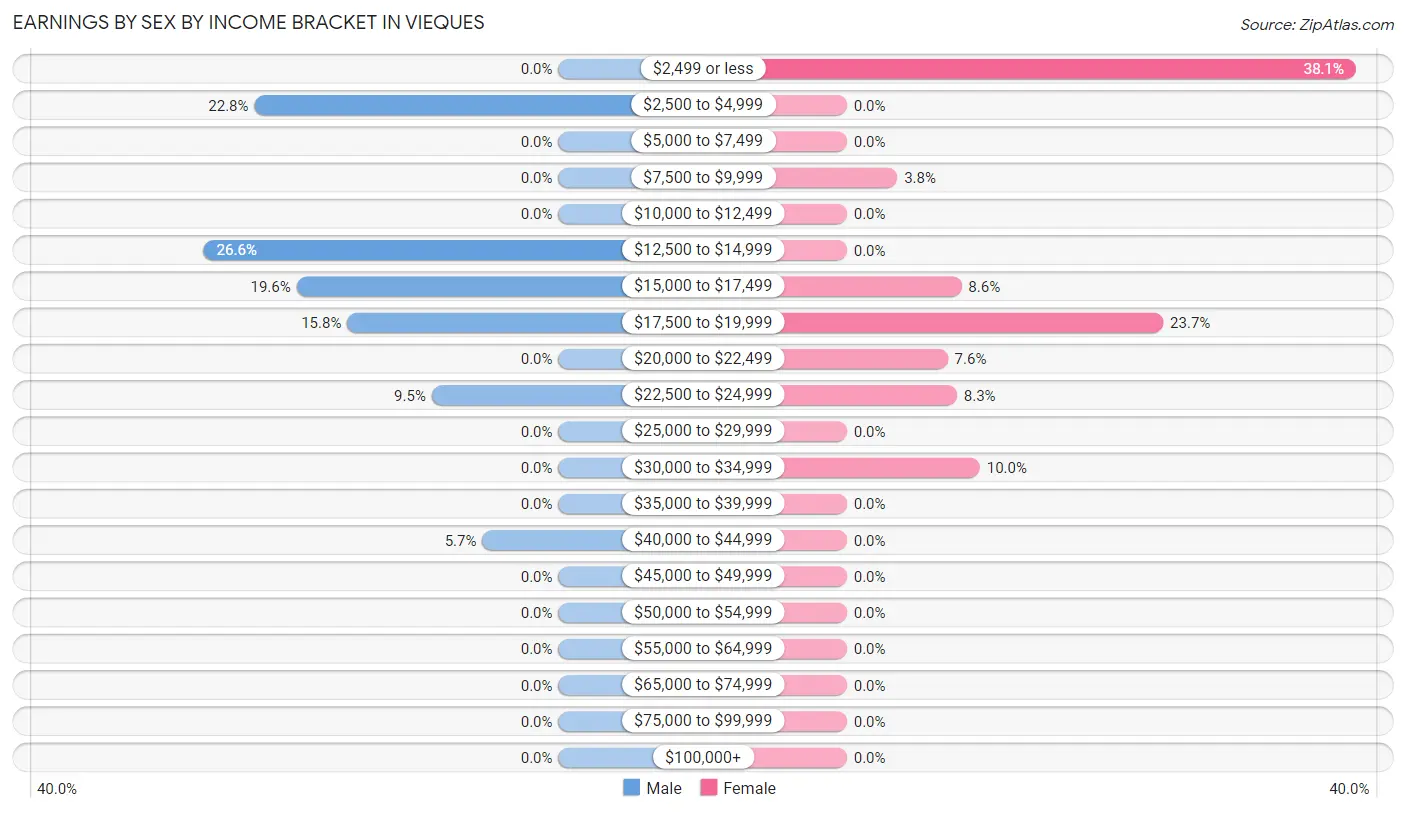
Earnings by Sex by Income Bracket in Vieques
The most common earnings brackets in Vieques are $12,500 to $14,999 for men (42 | 26.6%) and $2,499 or less for women (111 | 38.1%).
| Income | Male | Female |
| $2,499 or less | 0 (0.0%) | 111 (38.1%) |
| $2,500 to $4,999 | 36 (22.8%) | 0 (0.0%) |
| $5,000 to $7,499 | 0 (0.0%) | 0 (0.0%) |
| $7,500 to $9,999 | 0 (0.0%) | 11 (3.8%) |
| $10,000 to $12,499 | 0 (0.0%) | 0 (0.0%) |
| $12,500 to $14,999 | 42 (26.6%) | 0 (0.0%) |
| $15,000 to $17,499 | 31 (19.6%) | 25 (8.6%) |
| $17,500 to $19,999 | 25 (15.8%) | 69 (23.7%) |
| $20,000 to $22,499 | 0 (0.0%) | 22 (7.6%) |
| $22,500 to $24,999 | 15 (9.5%) | 24 (8.3%) |
| $25,000 to $29,999 | 0 (0.0%) | 0 (0.0%) |
| $30,000 to $34,999 | 0 (0.0%) | 29 (10.0%) |
| $35,000 to $39,999 | 0 (0.0%) | 0 (0.0%) |
| $40,000 to $44,999 | 9 (5.7%) | 0 (0.0%) |
| $45,000 to $49,999 | 0 (0.0%) | 0 (0.0%) |
| $50,000 to $54,999 | 0 (0.0%) | 0 (0.0%) |
| $55,000 to $64,999 | 0 (0.0%) | 0 (0.0%) |
| $65,000 to $74,999 | 0 (0.0%) | 0 (0.0%) |
| $75,000 to $99,999 | 0 (0.0%) | 0 (0.0%) |
| $100,000+ | 0 (0.0%) | 0 (0.0%) |
| Total | 158 (100.0%) | 291 (100.0%) |
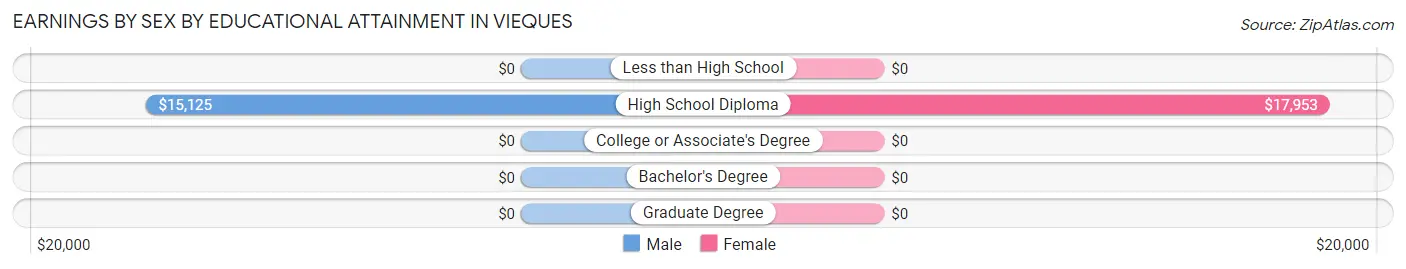
Earnings by Sex by Educational Attainment in Vieques
| Educational Attainment | Male Income | Female Income |
| Less than High School | - | - |
| High School Diploma | $15,125 | $17,953 |
| College or Associate's Degree | - | - |
| Bachelor's Degree | - | - |
| Graduate Degree | - | - |
| Total | $16,532 | $0 |
Family Income in Vieques
Family Income Brackets in Vieques
According to the Vieques family income data, there are 97 families falling into the $25,000 to $34,999 income range, which is the most common income bracket and makes up 31.4% of all families.
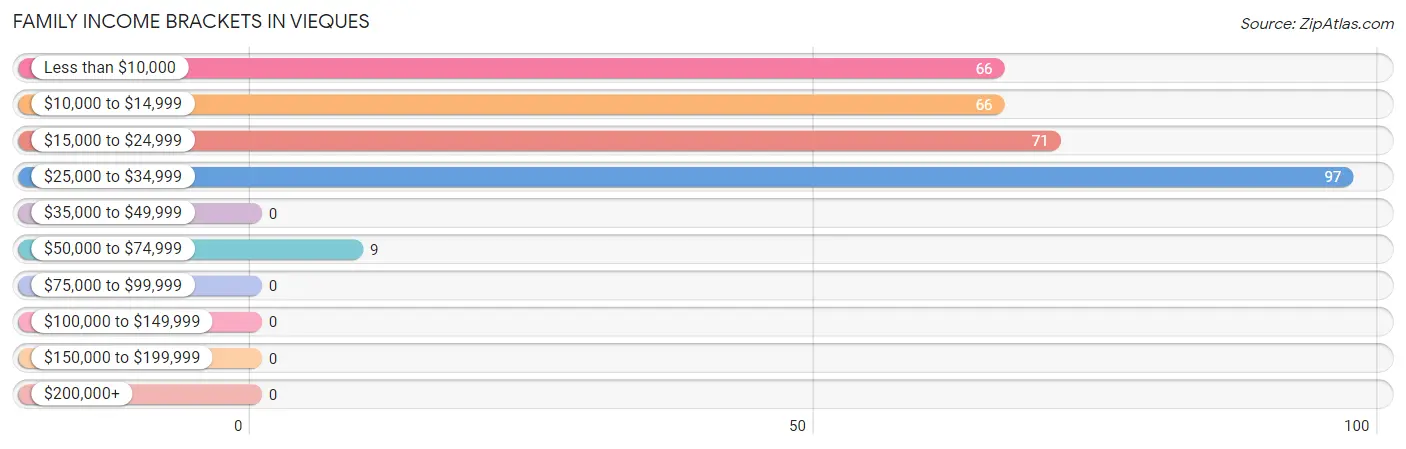
| Income Bracket | # Families | % Families |
| Less than $10,000 | 66 | 21.4% |
| $10,000 to $14,999 | 66 | 21.4% |
| $15,000 to $24,999 | 71 | 23.0% |
| $25,000 to $34,999 | 97 | 31.4% |
| $35,000 to $49,999 | 0 | 0.0% |
| $50,000 to $74,999 | 9 | 2.9% |
| $75,000 to $99,999 | 0 | 0.0% |
| $100,000 to $149,999 | 0 | 0.0% |
| $150,000 to $199,999 | 0 | 0.0% |
| $200,000+ | 0 | 0.0% |
Family Income by Famaliy Size in Vieques
3-person families (109 | 35.3%) account for the highest median family income in Vieques with $19,375 per family, while 3-person families (109 | 35.3%) have the highest median income of $6,458 per family member.
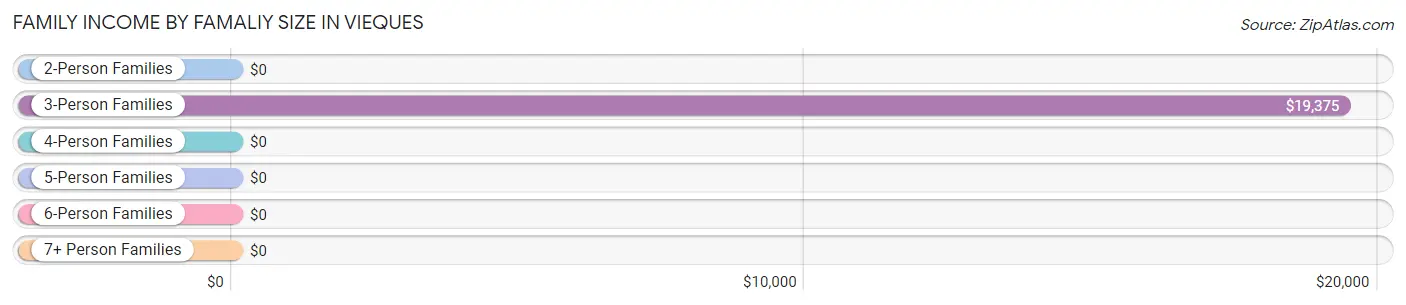
| Income Bracket | # Families | Median Income |
| 2-Person Families | 157 (50.8%) | $0 |
| 3-Person Families | 109 (35.3%) | $19,375 |
| 4-Person Families | 24 (7.8%) | $0 |
| 5-Person Families | 0 (0.0%) | $0 |
| 6-Person Families | 0 (0.0%) | $0 |
| 7+ Person Families | 19 (6.1%) | $0 |
| Total | 309 (100.0%) | $16,607 |
Family Income by Number of Earners in Vieques
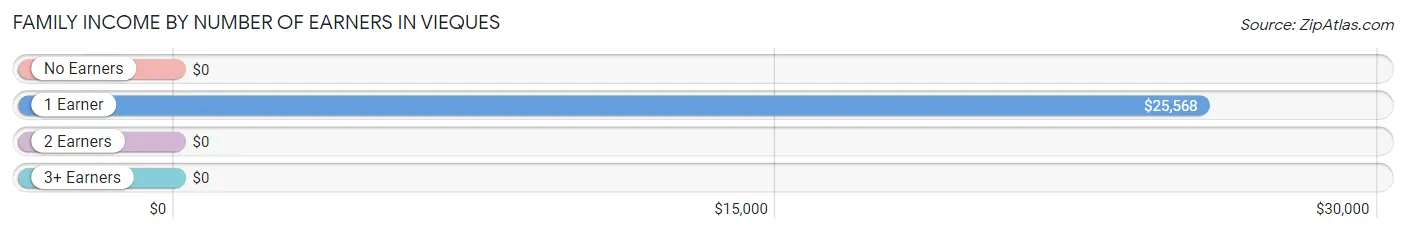
| Number of Earners | # Families | Median Income |
| No Earners | 121 (39.2%) | $0 |
| 1 Earner | 179 (57.9%) | $25,568 |
| 2 Earners | 9 (2.9%) | $0 |
| 3+ Earners | 0 (0.0%) | $0 |
| Total | 309 (100.0%) | $16,607 |
Household Income in Vieques
Household Income Brackets in Vieques
With 251 households falling in the category, the less than $10,000 income range is the most frequent in Vieques, accounting for 38.3% of all households.
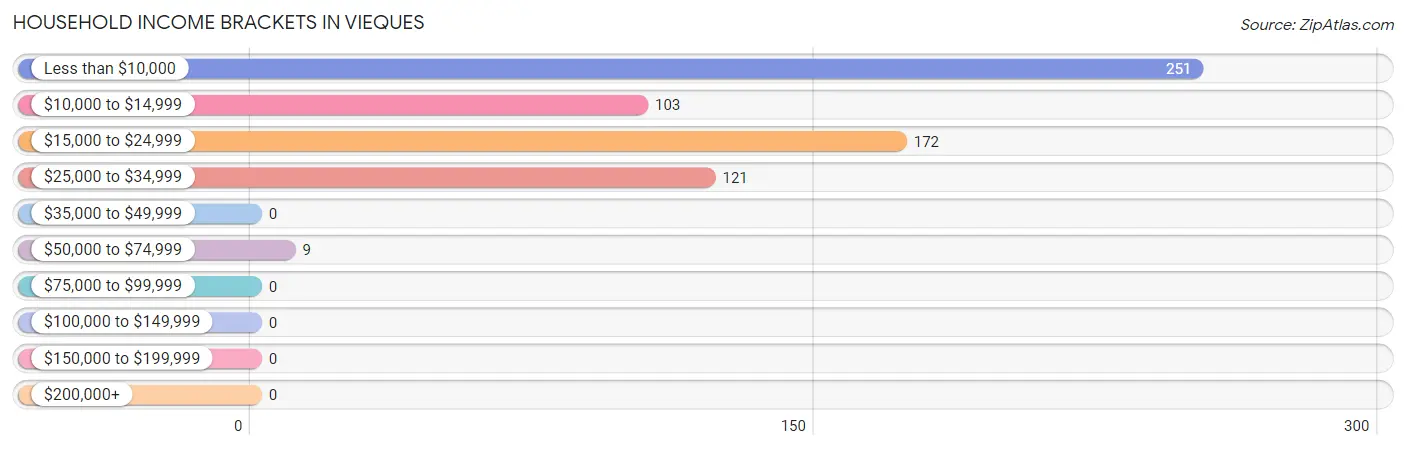
| Income Bracket | # Households | % Households |
| Less than $10,000 | 251 | 38.3% |
| $10,000 to $14,999 | 103 | 15.7% |
| $15,000 to $24,999 | 172 | 26.2% |
| $25,000 to $34,999 | 121 | 18.4% |
| $35,000 to $49,999 | 0 | 0.0% |
| $50,000 to $74,999 | 9 | 1.4% |
| $75,000 to $99,999 | 0 | 0.0% |
| $100,000 to $149,999 | 0 | 0.0% |
| $150,000 to $199,999 | 0 | 0.0% |
| $200,000+ | 0 | 0.0% |
Household Income by Householder Age in Vieques
The median household income in Vieques is $12,377, with the highest median household income of $18,800 found in the 45 to 64 years age bracket for the primary householder. A total of 270 households (41.2%) fall into this category. Meanwhile, the 15 to 24 years age bracket for the primary householder has the lowest median household income of $0, with 29 households (4.4%) in this group.
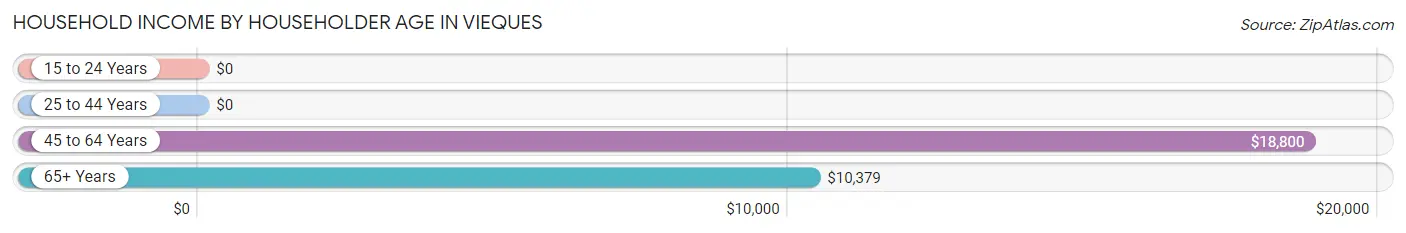
| Income Bracket | # Households | Median Income |
| 15 to 24 Years | 29 (4.4%) | $0 |
| 25 to 44 Years | 67 (10.2%) | $0 |
| 45 to 64 Years | 270 (41.2%) | $18,800 |
| 65+ Years | 290 (44.2%) | $10,379 |
| Total | 656 (100.0%) | $12,377 |
Poverty in Vieques
Income Below Poverty by Sex and Age in Vieques
With 75.7% poverty level for males and 80.5% for females among the residents of Vieques, under 5 year old males and under 5 year old females are the most vulnerable to poverty, with 119 males (100.0%) and 71 females (100.0%) in their respective age groups living below the poverty level.
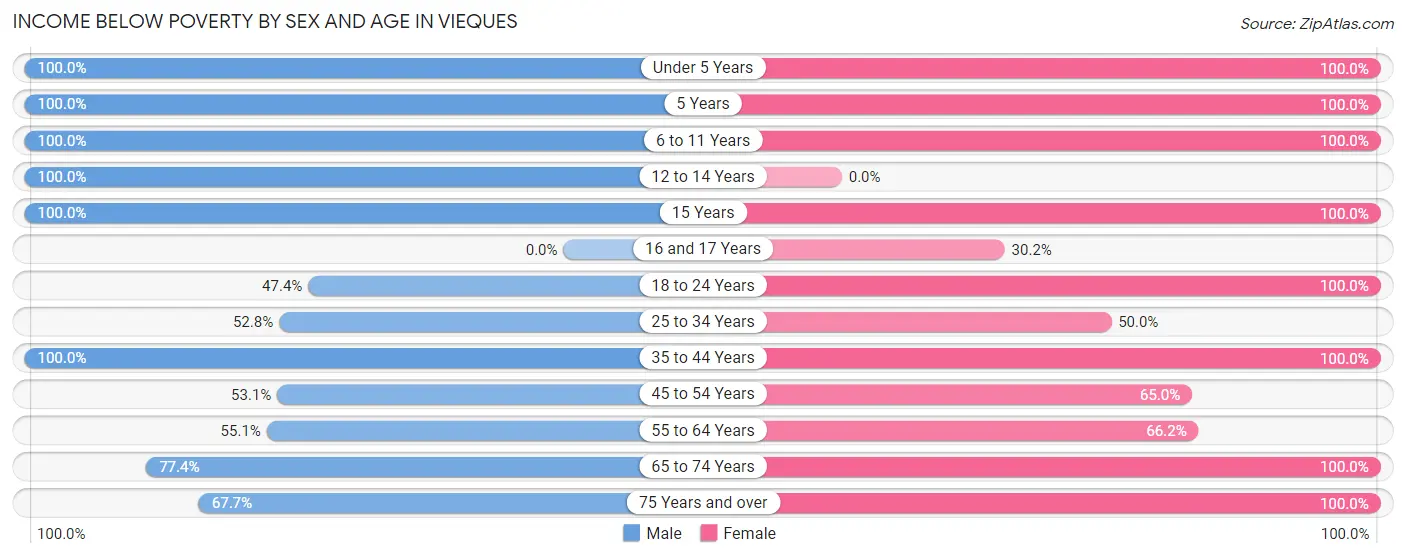
| Age Bracket | Male | Female |
| Under 5 Years | 119 (100.0%) | 71 (100.0%) |
| 5 Years | 77 (100.0%) | 46 (100.0%) |
| 6 to 11 Years | 157 (100.0%) | 111 (100.0%) |
| 12 to 14 Years | 47 (100.0%) | 0 (0.0%) |
| 15 Years | 17 (100.0%) | 13 (100.0%) |
| 16 and 17 Years | 0 (0.0%) | 13 (30.2%) |
| 18 to 24 Years | 36 (47.4%) | 29 (100.0%) |
| 25 to 34 Years | 57 (52.8%) | 36 (50.0%) |
| 35 to 44 Years | 14 (100.0%) | 34 (100.0%) |
| 45 to 54 Years | 17 (53.1%) | 143 (65.0%) |
| 55 to 64 Years | 76 (55.1%) | 47 (66.2%) |
| 65 to 74 Years | 120 (77.4%) | 61 (100.0%) |
| 75 Years and over | 46 (67.6%) | 87 (100.0%) |
| Total | 783 (75.7%) | 691 (80.5%) |
Income Above Poverty by Sex and Age in Vieques
According to the poverty statistics in Vieques, males aged 16 and 17 years and females aged 16 and 17 years are the age groups that are most secure financially, with 100.0% of males and 69.8% of females in these age groups living above the poverty line.
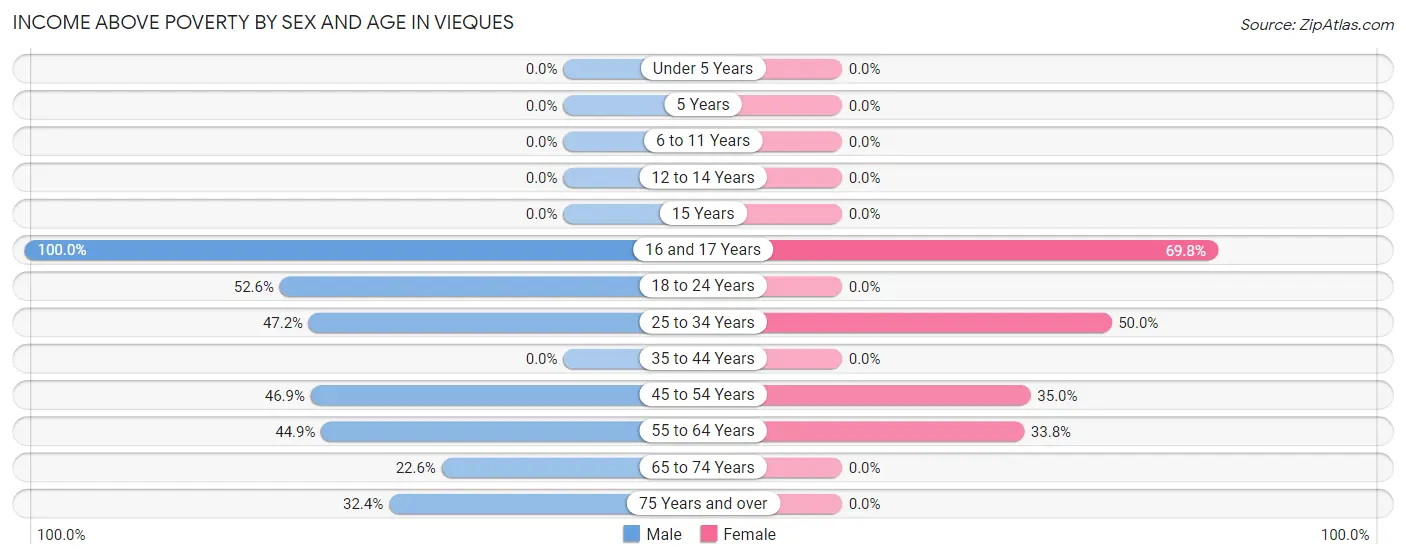
| Age Bracket | Male | Female |
| Under 5 Years | 0 (0.0%) | 0 (0.0%) |
| 5 Years | 0 (0.0%) | 0 (0.0%) |
| 6 to 11 Years | 0 (0.0%) | 0 (0.0%) |
| 12 to 14 Years | 0 (0.0%) | 0 (0.0%) |
| 15 Years | 0 (0.0%) | 0 (0.0%) |
| 16 and 17 Years | 26 (100.0%) | 30 (69.8%) |
| 18 to 24 Years | 40 (52.6%) | 0 (0.0%) |
| 25 to 34 Years | 51 (47.2%) | 36 (50.0%) |
| 35 to 44 Years | 0 (0.0%) | 0 (0.0%) |
| 45 to 54 Years | 15 (46.9%) | 77 (35.0%) |
| 55 to 64 Years | 62 (44.9%) | 24 (33.8%) |
| 65 to 74 Years | 35 (22.6%) | 0 (0.0%) |
| 75 Years and over | 22 (32.4%) | 0 (0.0%) |
| Total | 251 (24.3%) | 167 (19.5%) |
Income Below Poverty Among Married-Couple Families in Vieques
The poverty statistics for married-couple families in Vieques show that 67.8% or 61 of the total 90 families live below the poverty line. Families with no children have the highest poverty rate of 100.0%, comprising of 61 families. On the other hand, families with 1 or 2 children have the lowest poverty rate of 0.0%, which includes 0 families.
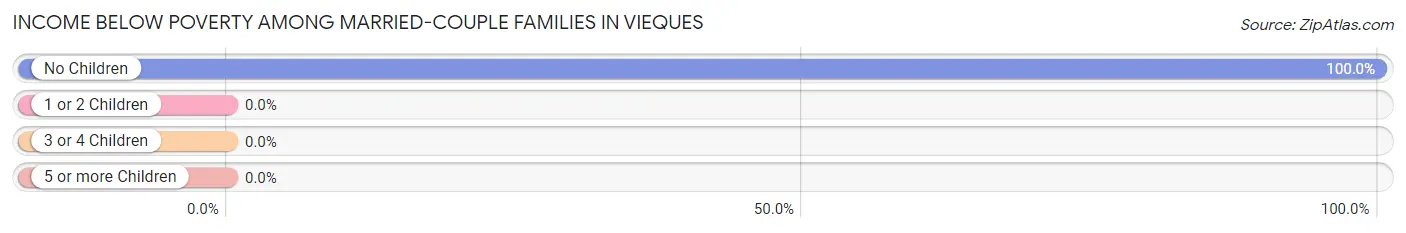
| Children | Above Poverty | Below Poverty |
| No Children | 0 (0.0%) | 61 (100.0%) |
| 1 or 2 Children | 29 (100.0%) | 0 (0.0%) |
| 3 or 4 Children | 0 (0.0%) | 0 (0.0%) |
| 5 or more Children | 0 (0.0%) | 0 (0.0%) |
| Total | 29 (32.2%) | 61 (67.8%) |
Income Below Poverty Among Single-Parent Households in Vieques
According to the poverty data in Vieques, 35.5% or 11 single-father households and 69.7% or 131 single-mother households are living below the poverty line. Among single-father households, those with no children have the highest poverty rate, with 11 households (35.5%) experiencing poverty. Likewise, among single-mother households, those with 3 or 4 children have the highest poverty rate, with 24 households (100.0%) falling below the poverty line.
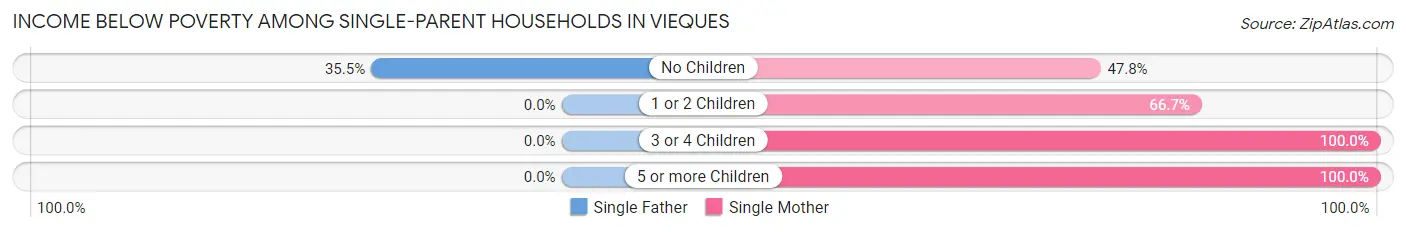
| Children | Single Father | Single Mother |
| No Children | 11 (35.5%) | 22 (47.8%) |
| 1 or 2 Children | 0 (0.0%) | 66 (66.7%) |
| 3 or 4 Children | 0 (0.0%) | 24 (100.0%) |
| 5 or more Children | 0 (0.0%) | 19 (100.0%) |
| Total | 11 (35.5%) | 131 (69.7%) |
Income Below Poverty Among Married-Couple vs Single-Parent Households in Vieques
The poverty data for Vieques shows that 61 of the married-couple family households (67.8%) and 142 of the single-parent households (64.8%) are living below the poverty level. Within the married-couple family households, those with no children have the highest poverty rate, with 61 households (100.0%) falling below the poverty line. Among the single-parent households, those with 3 or 4 children have the highest poverty rate, with 24 household (100.0%) living below poverty.
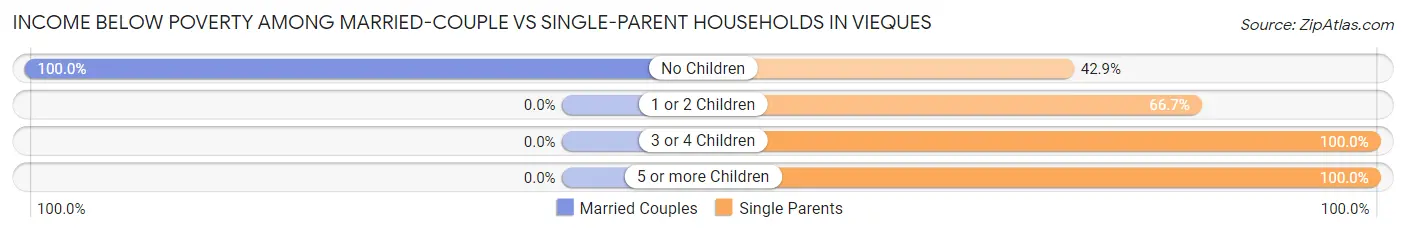
| Children | Married-Couple Families | Single-Parent Households |
| No Children | 61 (100.0%) | 33 (42.9%) |
| 1 or 2 Children | 0 (0.0%) | 66 (66.7%) |
| 3 or 4 Children | 0 (0.0%) | 24 (100.0%) |
| 5 or more Children | 0 (0.0%) | 19 (100.0%) |
| Total | 61 (67.8%) | 142 (64.8%) |
Race in Vieques
The most populous races in Vieques are Hispanic or Latino (1,879 | 99.3%), Some other Race (1,375 | 72.7%), and White / Caucasian (392 | 20.7%).
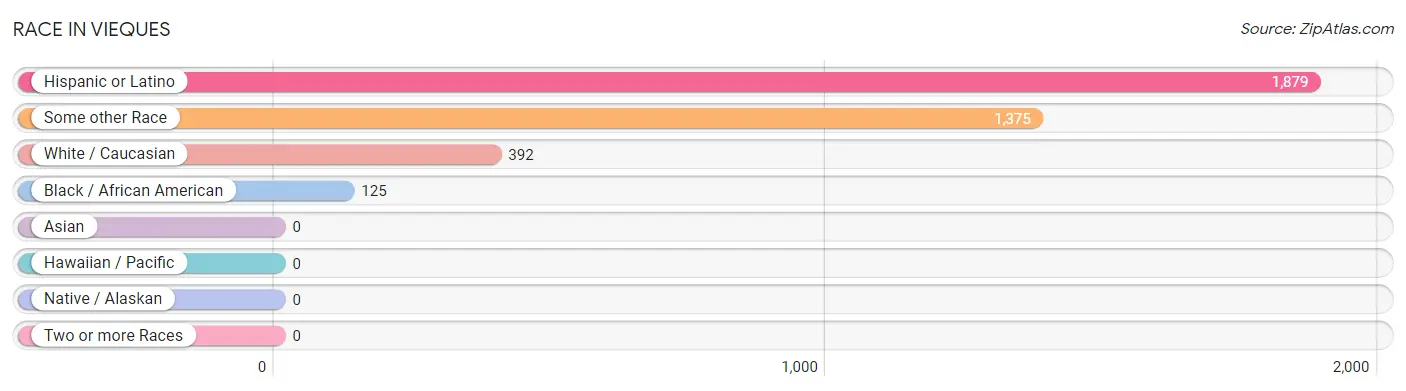
| Race | # Population | % Population |
| Asian | 0 | 0.0% |
| Black / African American | 125 | 6.6% |
| Hawaiian / Pacific | 0 | 0.0% |
| Hispanic or Latino | 1,879 | 99.3% |
| Native / Alaskan | 0 | 0.0% |
| White / Caucasian | 392 | 20.7% |
| Two or more Races | 0 | 0.0% |
| Some other Race | 1,375 | 72.7% |
| Total | 1,892 | 100.0% |
Ancestry in Vieques
The most populous ancestries reported in Vieques are Puerto Rican (1,879 | 99.3%), and American (13 | 0.7%), together accounting for 100.0% of all Vieques residents.
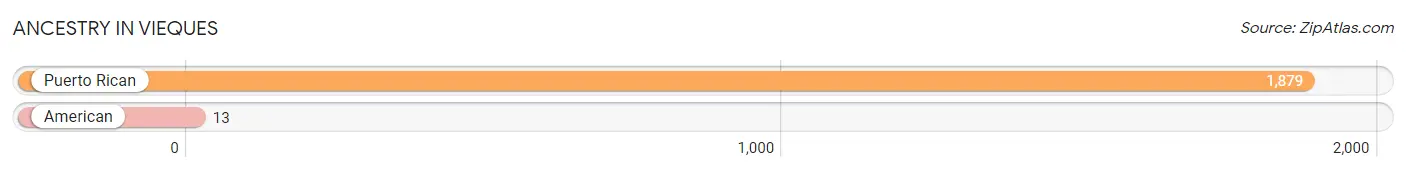
| Ancestry | # Population | % Population |
| American | 13 | 0.7% |
| Puerto Rican | 1,879 | 99.3% | View All 2 Rows |
Immigrants in Vieques

| Immigration Origin | # Population | % Population | View All 0 Rows |
Sex and Age in Vieques
Sex and Age in Vieques
The most populous age groups in Vieques are 5 to 9 Years (234 | 22.6%) for men and 50 to 54 Years (195 | 22.7%) for women.
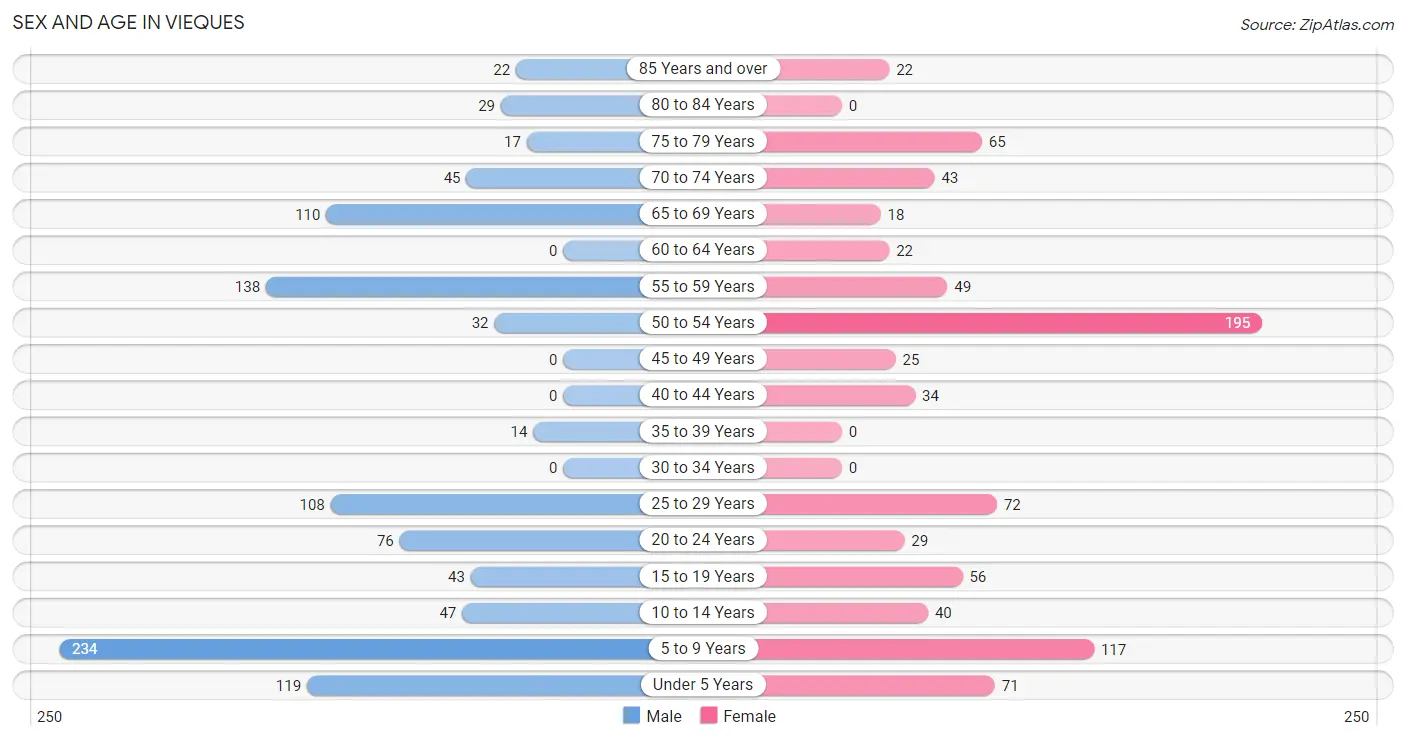
| Age Bracket | Male | Female |
| Under 5 Years | 119 (11.5%) | 71 (8.3%) |
| 5 to 9 Years | 234 (22.6%) | 117 (13.6%) |
| 10 to 14 Years | 47 (4.5%) | 40 (4.7%) |
| 15 to 19 Years | 43 (4.2%) | 56 (6.5%) |
| 20 to 24 Years | 76 (7.3%) | 29 (3.4%) |
| 25 to 29 Years | 108 (10.4%) | 72 (8.4%) |
| 30 to 34 Years | 0 (0.0%) | 0 (0.0%) |
| 35 to 39 Years | 14 (1.3%) | 0 (0.0%) |
| 40 to 44 Years | 0 (0.0%) | 34 (4.0%) |
| 45 to 49 Years | 0 (0.0%) | 25 (2.9%) |
| 50 to 54 Years | 32 (3.1%) | 195 (22.7%) |
| 55 to 59 Years | 138 (13.4%) | 49 (5.7%) |
| 60 to 64 Years | 0 (0.0%) | 22 (2.6%) |
| 65 to 69 Years | 110 (10.6%) | 18 (2.1%) |
| 70 to 74 Years | 45 (4.3%) | 43 (5.0%) |
| 75 to 79 Years | 17 (1.6%) | 65 (7.6%) |
| 80 to 84 Years | 29 (2.8%) | 0 (0.0%) |
| 85 Years and over | 22 (2.1%) | 22 (2.6%) |
| Total | 1,034 (100.0%) | 858 (100.0%) |
Families and Households in Vieques
Median Family Size in Vieques
The median family size in Vieques is 4.66 persons per family, with single female/mother families (188 | 60.8%) accounting for the largest median family size of 5.53 persons per family. On the other hand, married-couple families (90 | 29.1%) represent the smallest median family size with 2.62 persons per family.
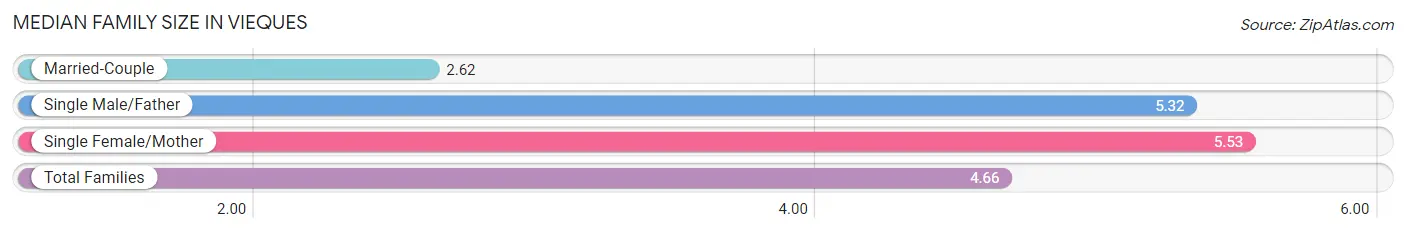
| Family Type | # Families | Family Size |
| Married-Couple | 90 (29.1%) | 2.62 |
| Single Male/Father | 31 (10.0%) | 5.32 |
| Single Female/Mother | 188 (60.8%) | 5.53 |
| Total Families | 309 (100.0%) | 4.66 |
Median Household Size in Vieques
The median household size in Vieques is 2.88 persons per household, with single female/mother households (188 | 28.7%) accounting for the largest median household size of 5.67 persons per household. non-family households (347 | 52.9%) represent the smallest median household size with 1.22 persons per household.
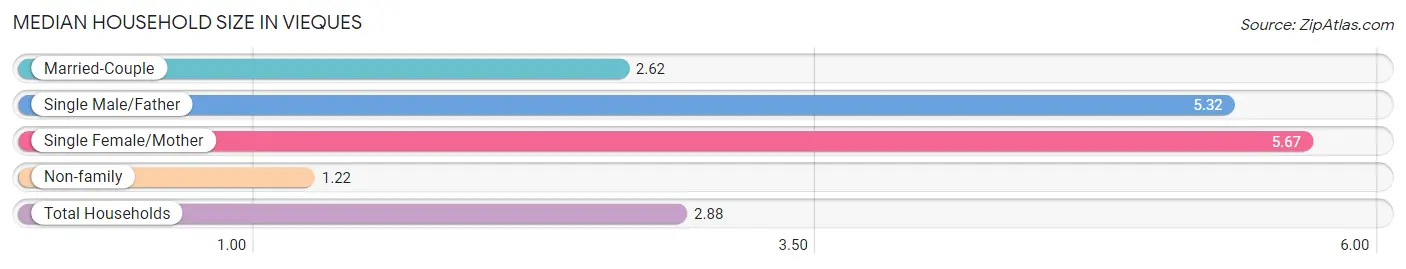
| Household Type | # Households | Household Size |
| Married-Couple | 90 (13.7%) | 2.62 |
| Single Male/Father | 31 (4.7%) | 5.32 |
| Single Female/Mother | 188 (28.7%) | 5.67 |
| Non-family | 347 (52.9%) | 1.22 |
| Total Households | 656 (100.0%) | 2.88 |
Household Size by Marriage Status in Vieques
Out of a total of 656 households in Vieques, 309 (47.1%) are family households, while 347 (52.9%) are nonfamily households. The most numerous type of family households are 2-person households, comprising 157, and the most common type of nonfamily households are 1-person households, comprising 323.
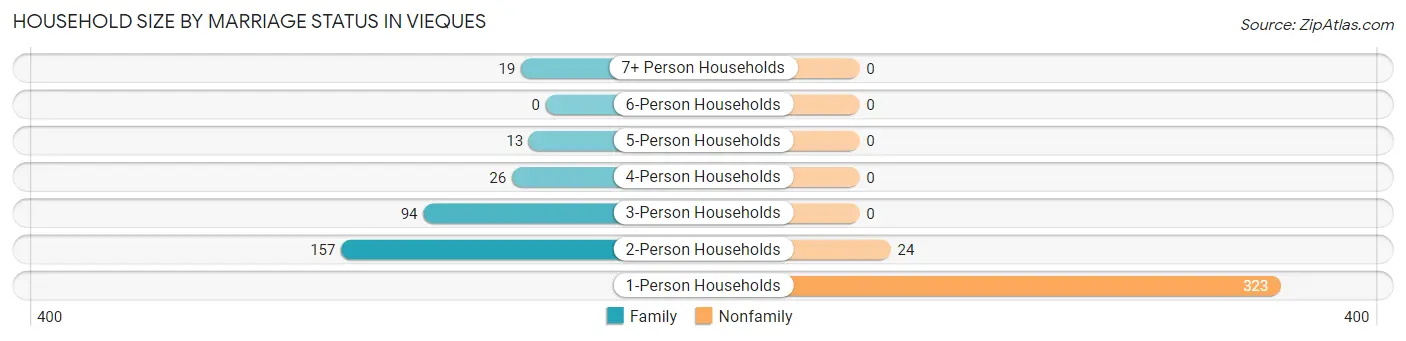
| Household Size | Family Households | Nonfamily Households |
| 1-Person Households | - | 323 (49.2%) |
| 2-Person Households | 157 (23.9%) | 24 (3.7%) |
| 3-Person Households | 94 (14.3%) | 0 (0.0%) |
| 4-Person Households | 26 (4.0%) | 0 (0.0%) |
| 5-Person Households | 13 (2.0%) | 0 (0.0%) |
| 6-Person Households | 0 (0.0%) | 0 (0.0%) |
| 7+ Person Households | 19 (2.9%) | 0 (0.0%) |
| Total | 309 (47.1%) | 347 (52.9%) |
Female Fertility in Vieques
Fertility by Age in Vieques
| Age Bracket | Women with Births | Births / 1,000 Women |
| 15 to 19 years | 0 (0.0%) | 0.0 |
| 20 to 34 years | 0 (0.0%) | 0.0 |
| 35 to 50 years | 0 (0.0%) | 0.0 |
| Total | 0 (0.0%) | 0.0 |
Fertility by Age by Marriage Status in Vieques
| Age Bracket | Married | Unmarried |
| 15 to 19 years | 0 (0.0%) | 0 (0.0%) |
| 20 to 34 years | 0 (0.0%) | 0 (0.0%) |
| 35 to 50 years | 0 (0.0%) | 0 (0.0%) |
| Total | 0 (0.0%) | 0 (0.0%) |
Fertility by Education in Vieques
| Educational Attainment | Women with Births | Births / 1,000 Women |
| Less than High School | 0 (0.0%) | 0.0 |
| High School Diploma | 0 (0.0%) | 0.0 |
| College or Associate's Degree | 0 (0.0%) | 0.0 |
| Bachelor's Degree | 0 (0.0%) | 0.0 |
| Graduate Degree | 0 (0.0%) | 0.0 |
| Total | 0 (0.0%) | 0.0 |
Fertility by Education by Marriage Status in Vieques
| Educational Attainment | Married | Unmarried |
| Less than High School | 0 (0.0%) | 0 (0.0%) |
| High School Diploma | 0 (0.0%) | 0 (0.0%) |
| College or Associate's Degree | 0 (0.0%) | 0 (0.0%) |
| Bachelor's Degree | 0 (0.0%) | 0 (0.0%) |
| Graduate Degree | 0 (0.0%) | 0 (0.0%) |
| Total | 0 (0.0%) | 0 (0.0%) |
Employment Characteristics in Vieques
Employment by Class of Employer in Vieques
Among the 362 employed individuals in Vieques, private company employees (140 | 38.7%), state government employees (101 | 27.9%), and self-employed (not incorporated) (88 | 24.3%) make up the most common classes of employment.
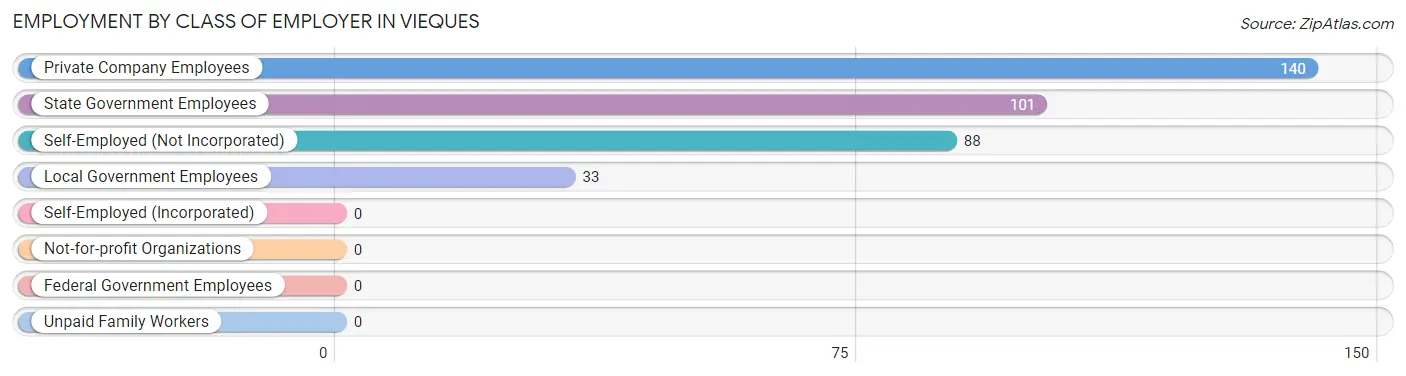
| Employer Class | # Employees | % Employees |
| Private Company Employees | 140 | 38.7% |
| Self-Employed (Incorporated) | 0 | 0.0% |
| Self-Employed (Not Incorporated) | 88 | 24.3% |
| Not-for-profit Organizations | 0 | 0.0% |
| Local Government Employees | 33 | 9.1% |
| State Government Employees | 101 | 27.9% |
| Federal Government Employees | 0 | 0.0% |
| Unpaid Family Workers | 0 | 0.0% |
| Total | 362 | 100.0% |
Employment Status by Age in Vieques
According to the labor force statistics for Vieques, out of the total population over 16 years of age (1,234), 38.2% or 471 individuals are in the labor force, with 23.3% or 110 of them unemployed. The age group with the highest labor force participation rate is 45 to 54 years, with 89.3% or 225 individuals in the labor force. Within the labor force, the 35 to 44 years age range has the highest percentage of unemployed individuals, with 100.0% or 19 of them being unemployed.
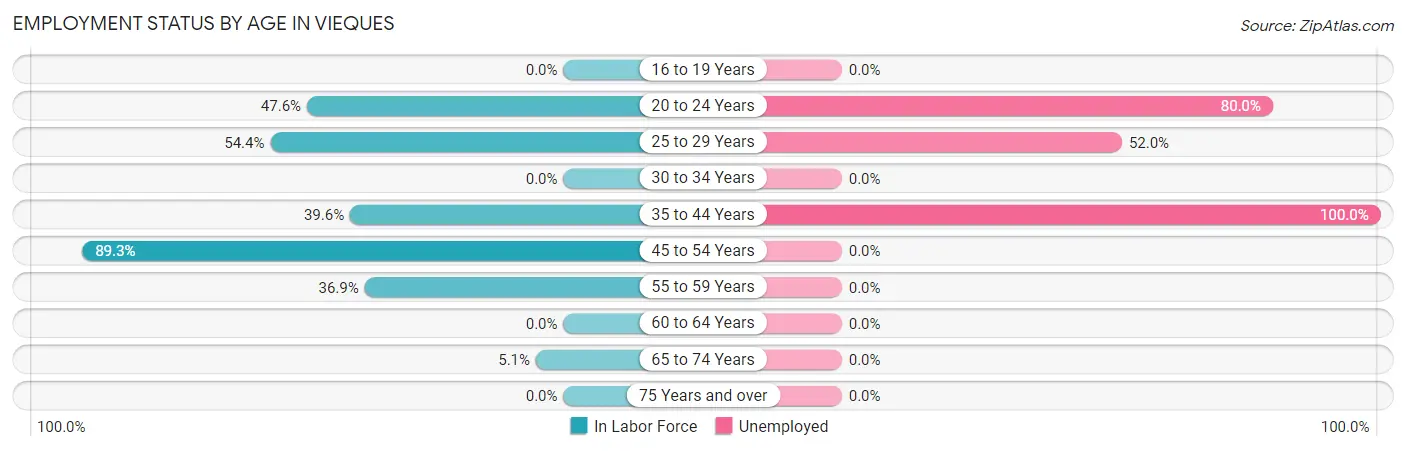
| Age Bracket | In Labor Force | Unemployed |
| 16 to 19 Years | 0 (0.0%) | 0 (0.0%) |
| 20 to 24 Years | 50 (47.6%) | 40 (80.0%) |
| 25 to 29 Years | 98 (54.4%) | 51 (52.0%) |
| 30 to 34 Years | 0 (0.0%) | 0 (0.0%) |
| 35 to 44 Years | 19 (39.6%) | 19 (100.0%) |
| 45 to 54 Years | 225 (89.3%) | 0 (0.0%) |
| 55 to 59 Years | 69 (36.9%) | 0 (0.0%) |
| 60 to 64 Years | 0 (0.0%) | 0 (0.0%) |
| 65 to 74 Years | 11 (5.1%) | 0 (0.0%) |
| 75 Years and over | 0 (0.0%) | 0 (0.0%) |
| Total | 471 (38.2%) | 110 (23.3%) |
Employment Status by Educational Attainment in Vieques
According to labor force statistics for Vieques, 59.7% of individuals (411) out of the total population between 25 and 64 years of age (689) are in the labor force, with 17.0% or 70 of them being unemployed. The group with the highest labor force participation rate are those with the educational attainment of bachelor's degree or higher, with 100.0% or 53 individuals in the labor force. Within the labor force, individuals with high school diploma education have the highest percentage of unemployment, with 32.1% or 70 of them being unemployed.
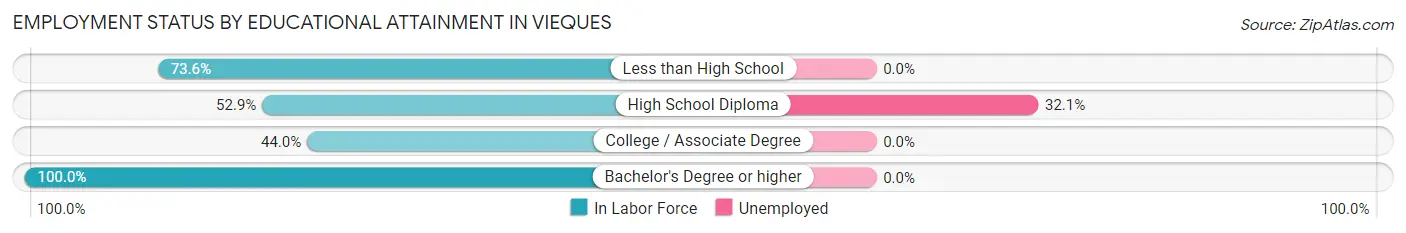
| Educational Attainment | In Labor Force | Unemployed |
| Less than High School | 103 (73.6%) | 0 (0.0%) |
| High School Diploma | 218 (52.9%) | 132 (32.1%) |
| College / Associate Degree | 37 (44.0%) | 0 (0.0%) |
| Bachelor's Degree or higher | 53 (100.0%) | 0 (0.0%) |
| Total | 411 (59.7%) | 117 (17.0%) |
Employment Occupations by Sex in Vieques
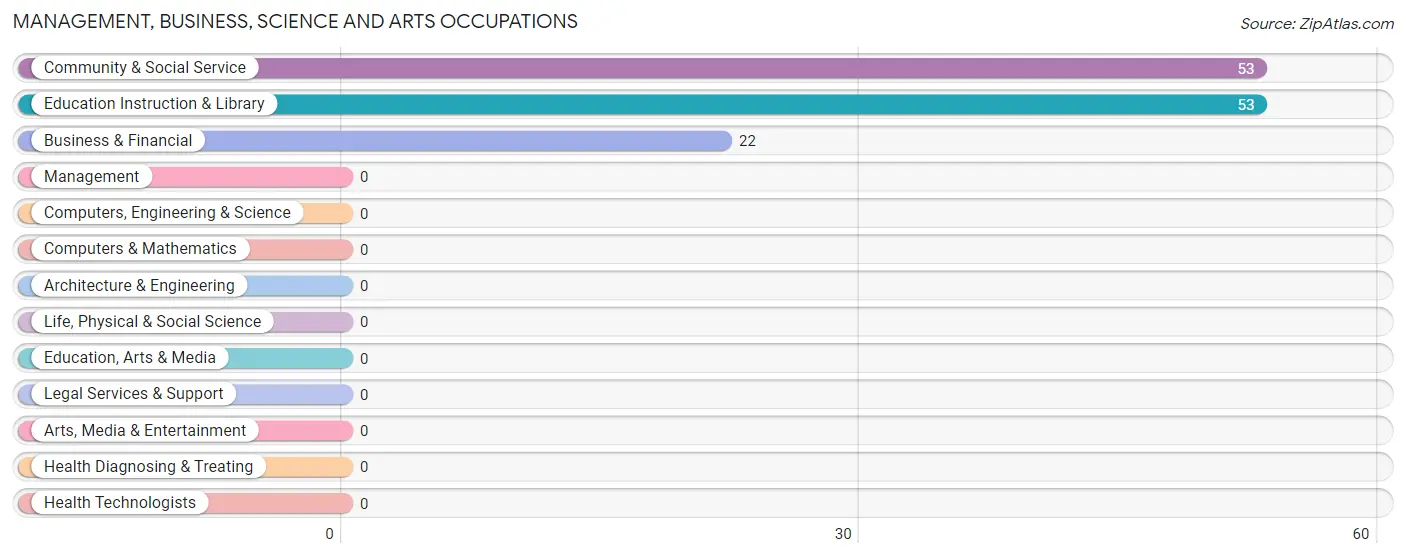
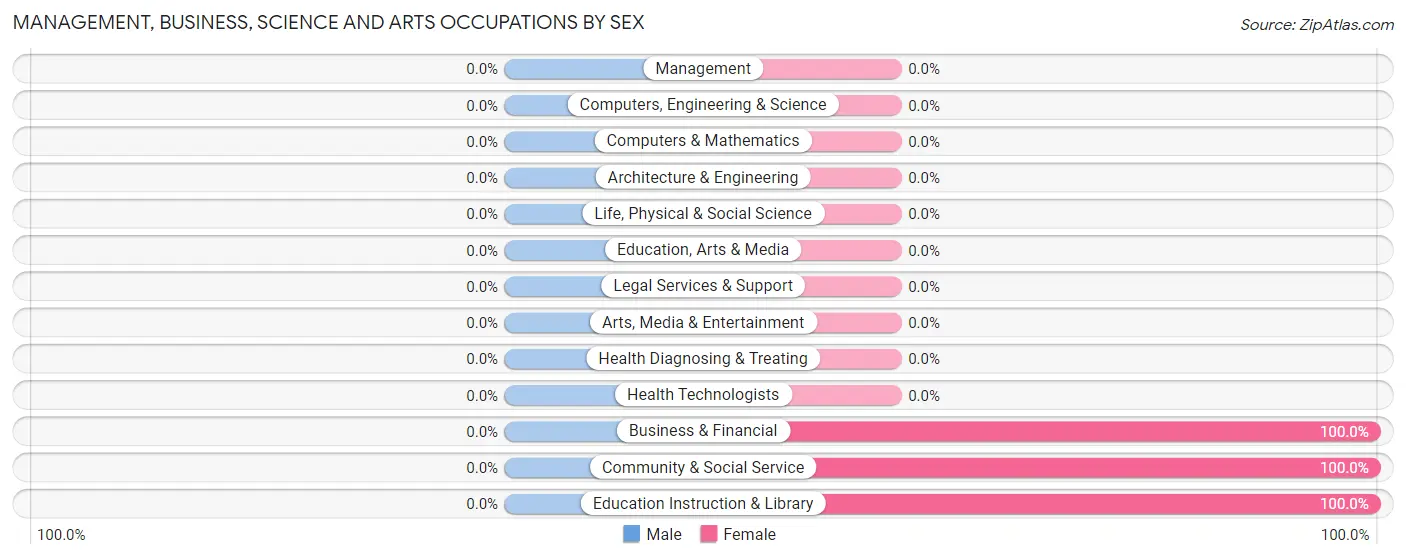
Management, Business, Science and Arts Occupations
The most common Management, Business, Science and Arts occupations in Vieques are Community & Social Service (53 | 14.6%), Education Instruction & Library (53 | 14.6%), and Business & Financial (22 | 6.1%).
Management, Business, Science and Arts Occupations by Sex
| Occupation | Male | Female |
| Management | 0 (0.0%) | 0 (0.0%) |
| Business & Financial | 0 (0.0%) | 22 (100.0%) |
| Computers, Engineering & Science | 0 (0.0%) | 0 (0.0%) |
| Computers & Mathematics | 0 (0.0%) | 0 (0.0%) |
| Architecture & Engineering | 0 (0.0%) | 0 (0.0%) |
| Life, Physical & Social Science | 0 (0.0%) | 0 (0.0%) |
| Community & Social Service | 0 (0.0%) | 53 (100.0%) |
| Education, Arts & Media | 0 (0.0%) | 0 (0.0%) |
| Legal Services & Support | 0 (0.0%) | 0 (0.0%) |
| Education Instruction & Library | 0 (0.0%) | 53 (100.0%) |
| Arts, Media & Entertainment | 0 (0.0%) | 0 (0.0%) |
| Health Diagnosing & Treating | 0 (0.0%) | 0 (0.0%) |
| Health Technologists | 0 (0.0%) | 0 (0.0%) |
| Total (Category) | 0 (0.0%) | 75 (100.0%) |
| Total (Overall) | 71 (19.6%) | 291 (80.4%) |
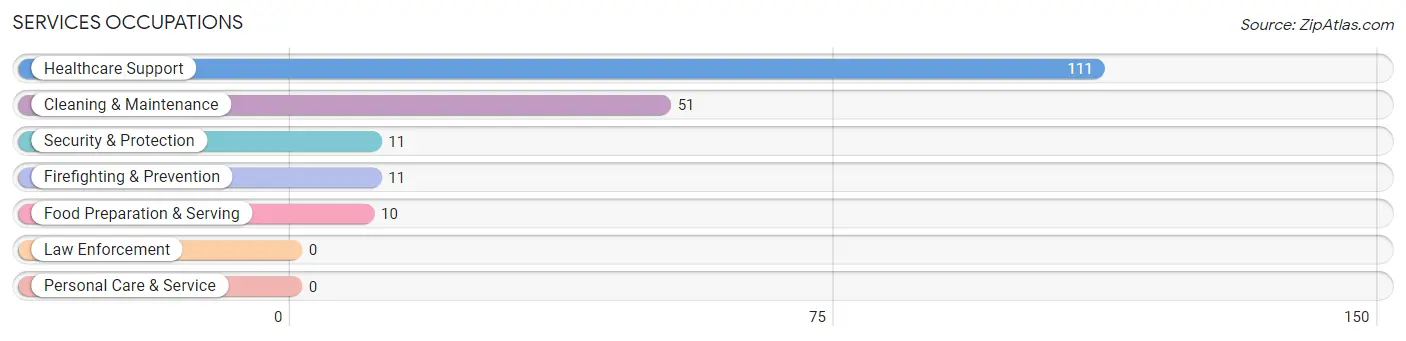
Services Occupations
The most common Services occupations in Vieques are Healthcare Support (111 | 30.7%), Cleaning & Maintenance (51 | 14.1%), Security & Protection (11 | 3.0%), Firefighting & Prevention (11 | 3.0%), and Food Preparation & Serving (10 | 2.8%).
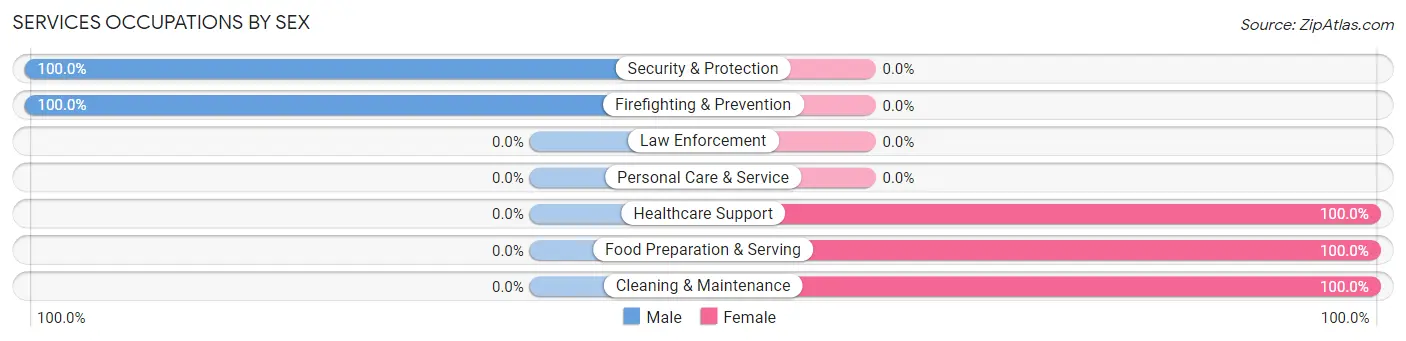
Services Occupations by Sex
Within the Services occupations in Vieques, the most male-oriented occupations are Security & Protection (100.0%), and Firefighting & Prevention (100.0%), while the most female-oriented occupations are Healthcare Support (100.0%), Food Preparation & Serving (100.0%), and Cleaning & Maintenance (100.0%).
| Occupation | Male | Female |
| Healthcare Support | 0 (0.0%) | 111 (100.0%) |
| Security & Protection | 11 (100.0%) | 0 (0.0%) |
| Firefighting & Prevention | 11 (100.0%) | 0 (0.0%) |
| Law Enforcement | 0 (0.0%) | 0 (0.0%) |
| Food Preparation & Serving | 0 (0.0%) | 10 (100.0%) |
| Cleaning & Maintenance | 0 (0.0%) | 51 (100.0%) |
| Personal Care & Service | 0 (0.0%) | 0 (0.0%) |
| Total (Category) | 11 (6.0%) | 172 (94.0%) |
| Total (Overall) | 71 (19.6%) | 291 (80.4%) |
Sales and Office Occupations
The most common Sales and Office occupations in Vieques are , and Sales & Related (44 | 12.1%).
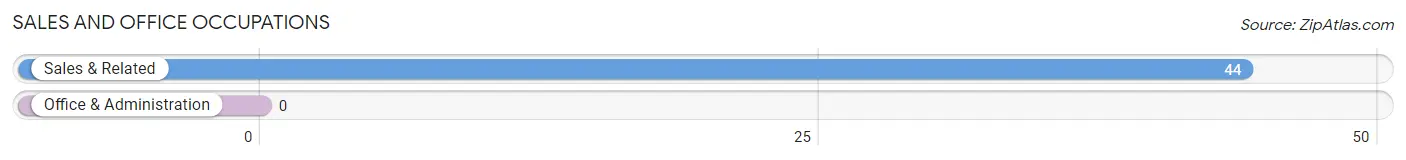
Sales and Office Occupations by Sex
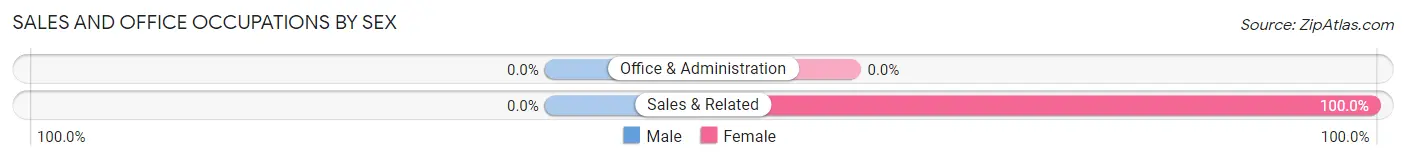
| Occupation | Male | Female |
| Sales & Related | 0 (0.0%) | 44 (100.0%) |
| Office & Administration | 0 (0.0%) | 0 (0.0%) |
| Total (Category) | 0 (0.0%) | 44 (100.0%) |
| Total (Overall) | 71 (19.6%) | 291 (80.4%) |
Natural Resources, Construction and Maintenance Occupations
The most common Natural Resources, Construction and Maintenance occupations in Vieques are , and Construction & Extraction (40 | 11.1%).
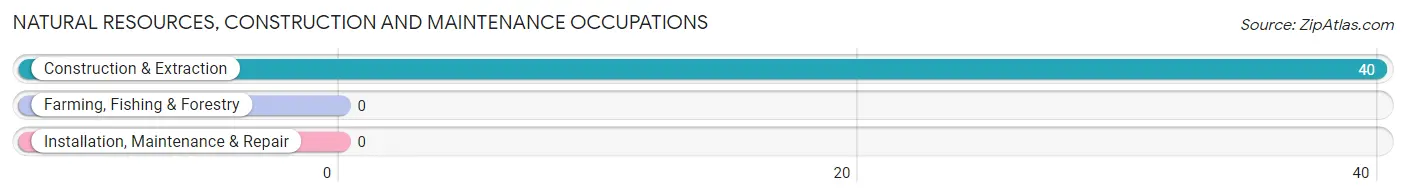
Natural Resources, Construction and Maintenance Occupations by Sex
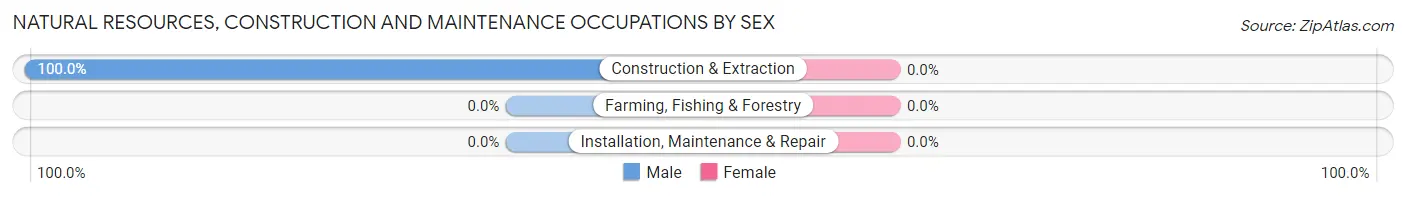
| Occupation | Male | Female |
| Farming, Fishing & Forestry | 0 (0.0%) | 0 (0.0%) |
| Construction & Extraction | 40 (100.0%) | 0 (0.0%) |
| Installation, Maintenance & Repair | 0 (0.0%) | 0 (0.0%) |
| Total (Category) | 40 (100.0%) | 0 (0.0%) |
| Total (Overall) | 71 (19.6%) | 291 (80.4%) |
Production, Transportation and Moving Occupations
The most common Production, Transportation and Moving occupations in Vieques are , and Production (20 | 5.5%).
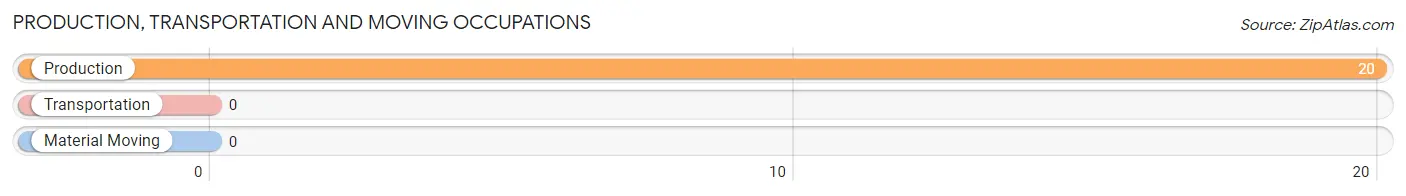
Production, Transportation and Moving Occupations by Sex
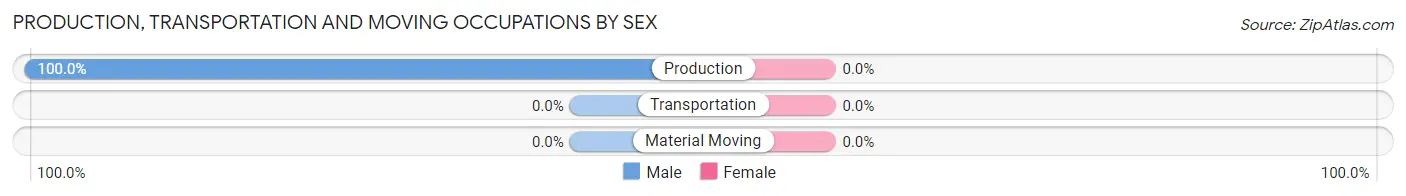
| Occupation | Male | Female |
| Production | 20 (100.0%) | 0 (0.0%) |
| Transportation | 0 (0.0%) | 0 (0.0%) |
| Material Moving | 0 (0.0%) | 0 (0.0%) |
| Total (Category) | 20 (100.0%) | 0 (0.0%) |
| Total (Overall) | 71 (19.6%) | 291 (80.4%) |
Employment Industries by Sex in Vieques
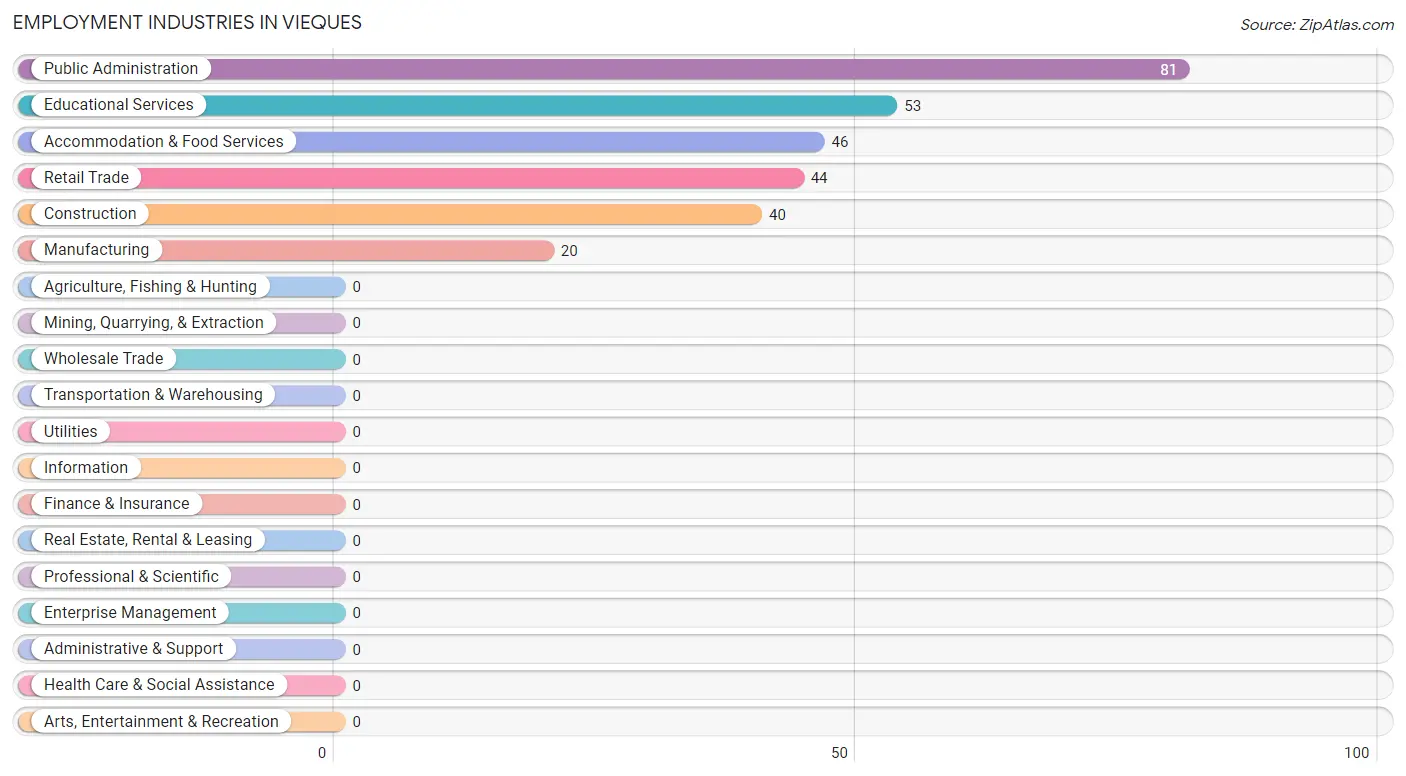
Employment Industries in Vieques
The major employment industries in Vieques include Public Administration (81 | 22.4%), Educational Services (53 | 14.6%), Accommodation & Food Services (46 | 12.7%), Retail Trade (44 | 12.1%), and Construction (40 | 11.1%).
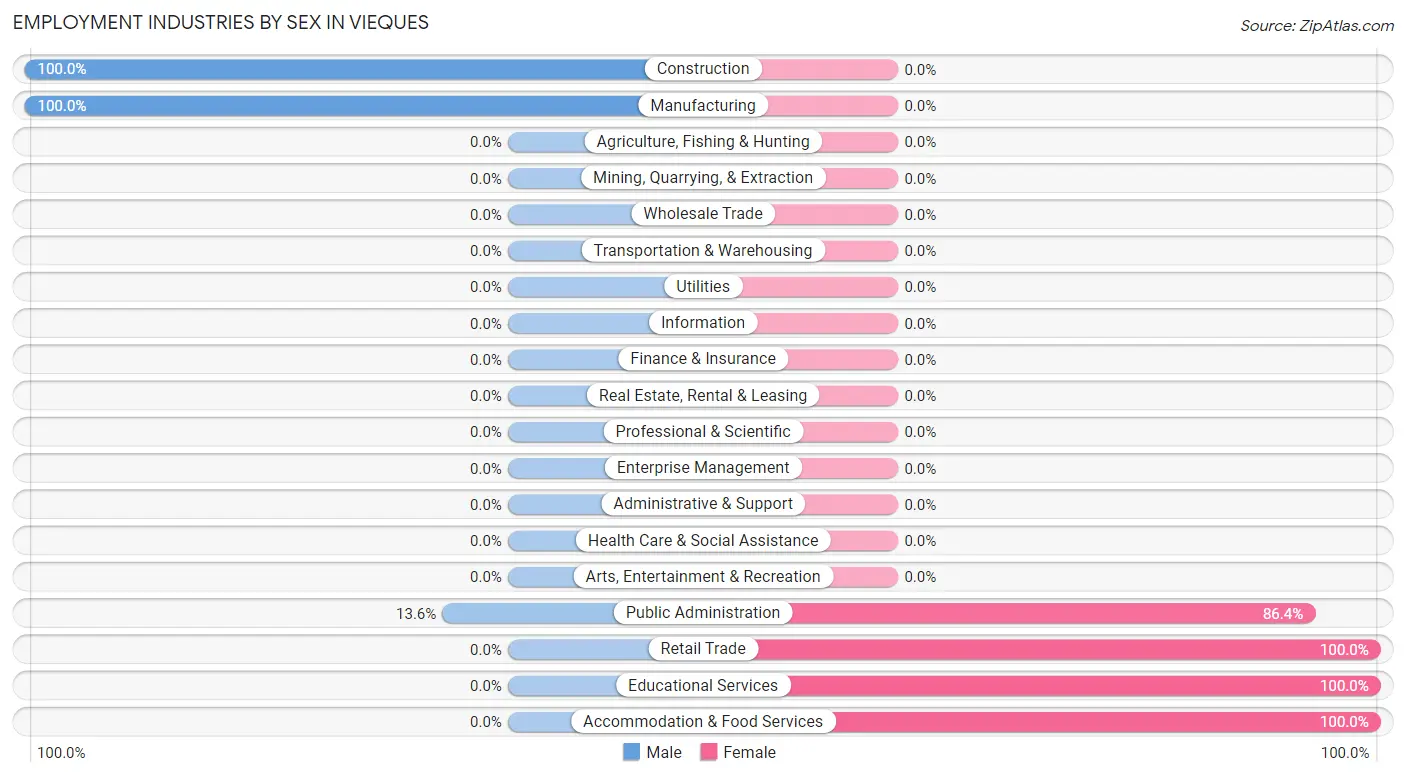
Employment Industries by Sex in Vieques
The Vieques industries that see more men than women are Construction (100.0%), Manufacturing (100.0%), and Public Administration (13.6%), whereas the industries that tend to have a higher number of women are Retail Trade (100.0%), Educational Services (100.0%), and Accommodation & Food Services (100.0%).
| Industry | Male | Female |
| Agriculture, Fishing & Hunting | 0 (0.0%) | 0 (0.0%) |
| Mining, Quarrying, & Extraction | 0 (0.0%) | 0 (0.0%) |
| Construction | 40 (100.0%) | 0 (0.0%) |
| Manufacturing | 20 (100.0%) | 0 (0.0%) |
| Wholesale Trade | 0 (0.0%) | 0 (0.0%) |
| Retail Trade | 0 (0.0%) | 44 (100.0%) |
| Transportation & Warehousing | 0 (0.0%) | 0 (0.0%) |
| Utilities | 0 (0.0%) | 0 (0.0%) |
| Information | 0 (0.0%) | 0 (0.0%) |
| Finance & Insurance | 0 (0.0%) | 0 (0.0%) |
| Real Estate, Rental & Leasing | 0 (0.0%) | 0 (0.0%) |
| Professional & Scientific | 0 (0.0%) | 0 (0.0%) |
| Enterprise Management | 0 (0.0%) | 0 (0.0%) |
| Administrative & Support | 0 (0.0%) | 0 (0.0%) |
| Educational Services | 0 (0.0%) | 53 (100.0%) |
| Health Care & Social Assistance | 0 (0.0%) | 0 (0.0%) |
| Arts, Entertainment & Recreation | 0 (0.0%) | 0 (0.0%) |
| Accommodation & Food Services | 0 (0.0%) | 46 (100.0%) |
| Public Administration | 11 (13.6%) | 70 (86.4%) |
| Total | 71 (19.6%) | 291 (80.4%) |
Education in Vieques
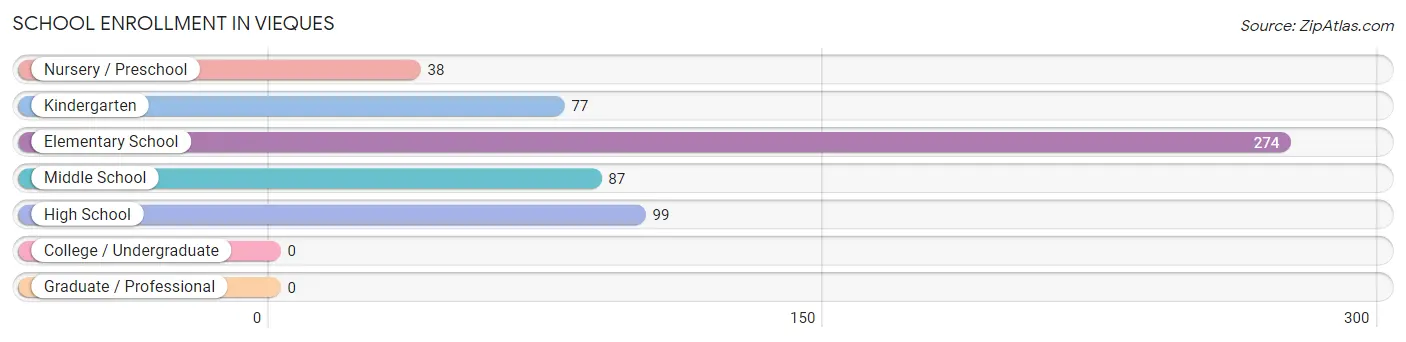
School Enrollment in Vieques
The most common levels of schooling among the 575 students in Vieques are elementary school (274 | 47.6%), high school (99 | 17.2%), and middle school (87 | 15.1%).
| School Level | # Students | % Students |
| Nursery / Preschool | 38 | 6.6% |
| Kindergarten | 77 | 13.4% |
| Elementary School | 274 | 47.6% |
| Middle School | 87 | 15.1% |
| High School | 99 | 17.2% |
| College / Undergraduate | 0 | 0.0% |
| Graduate / Professional | 0 | 0.0% |
| Total | 575 | 100.0% |
School Enrollment by Age by Funding Source in Vieques
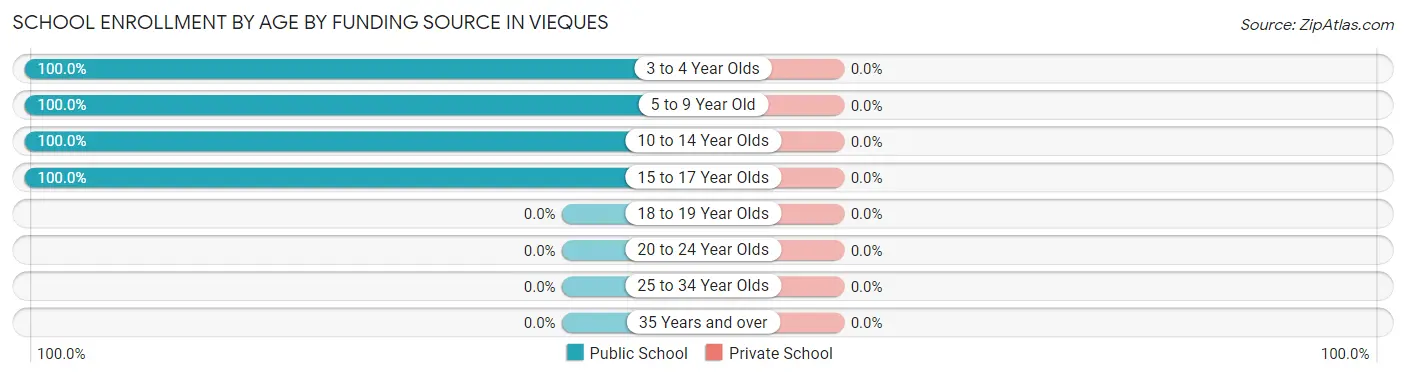
| Age Bracket | Public School | Private School |
| 3 to 4 Year Olds | 38 (100.0%) | 0 (0.0%) |
| 5 to 9 Year Old | 351 (100.0%) | 0 (0.0%) |
| 10 to 14 Year Olds | 87 (100.0%) | 0 (0.0%) |
| 15 to 17 Year Olds | 99 (100.0%) | 0 (0.0%) |
| 18 to 19 Year Olds | 0 (0.0%) | 0 (0.0%) |
| 20 to 24 Year Olds | 0 (0.0%) | 0 (0.0%) |
| 25 to 34 Year Olds | 0 (0.0%) | 0 (0.0%) |
| 35 Years and over | 0 (0.0%) | 0 (0.0%) |
| Total | 575 (100.0%) | 0 (0.0%) |
Educational Attainment by Field of Study in Vieques
, and education (53 | 100.0%) are the most common fields of study among 53 individuals in Vieques who have obtained a bachelor's degree or higher.
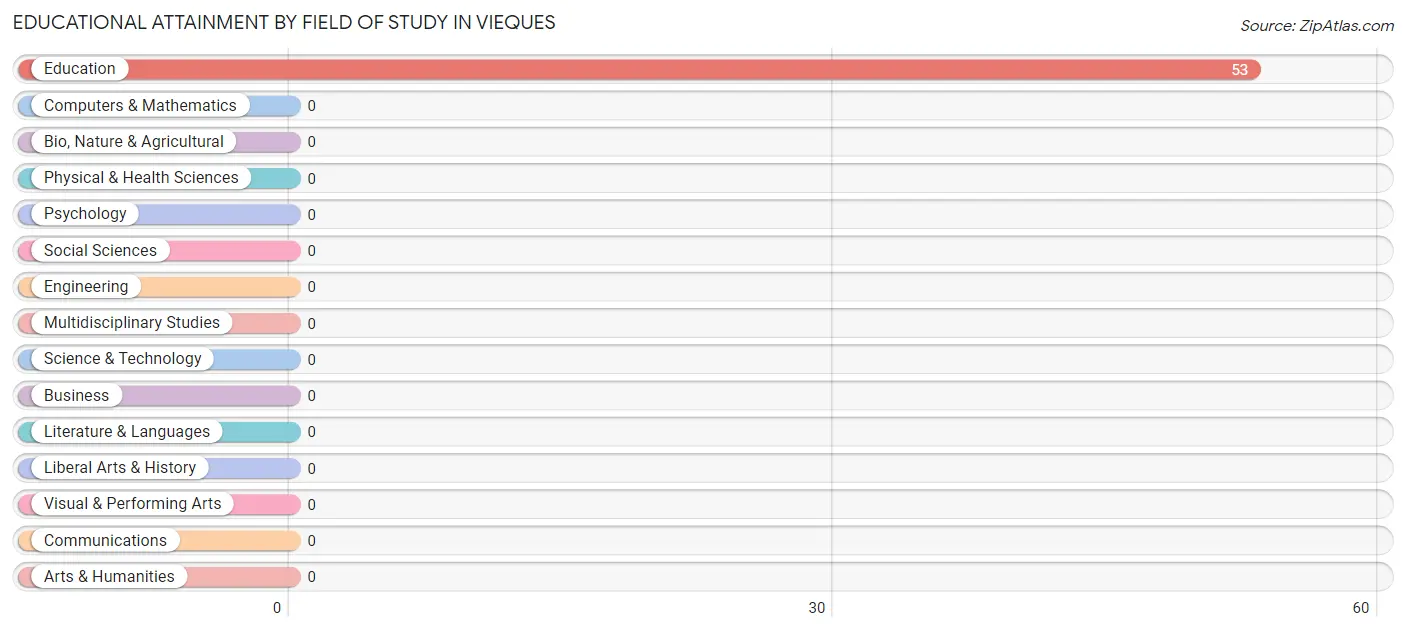
| Field of Study | # Graduates | % Graduates |
| Computers & Mathematics | 0 | 0.0% |
| Bio, Nature & Agricultural | 0 | 0.0% |
| Physical & Health Sciences | 0 | 0.0% |
| Psychology | 0 | 0.0% |
| Social Sciences | 0 | 0.0% |
| Engineering | 0 | 0.0% |
| Multidisciplinary Studies | 0 | 0.0% |
| Science & Technology | 0 | 0.0% |
| Business | 0 | 0.0% |
| Education | 53 | 100.0% |
| Literature & Languages | 0 | 0.0% |
| Liberal Arts & History | 0 | 0.0% |
| Visual & Performing Arts | 0 | 0.0% |
| Communications | 0 | 0.0% |
| Arts & Humanities | 0 | 0.0% |
| Total | 53 | 100.0% |
Transportation & Commute in Vieques
Vehicle Availability by Sex in Vieques
The most prevalent vehicle ownership categories in Vieques are males with 1 vehicle (26, accounting for 36.6%) and females with 1 vehicle (148, making up 8.9%).
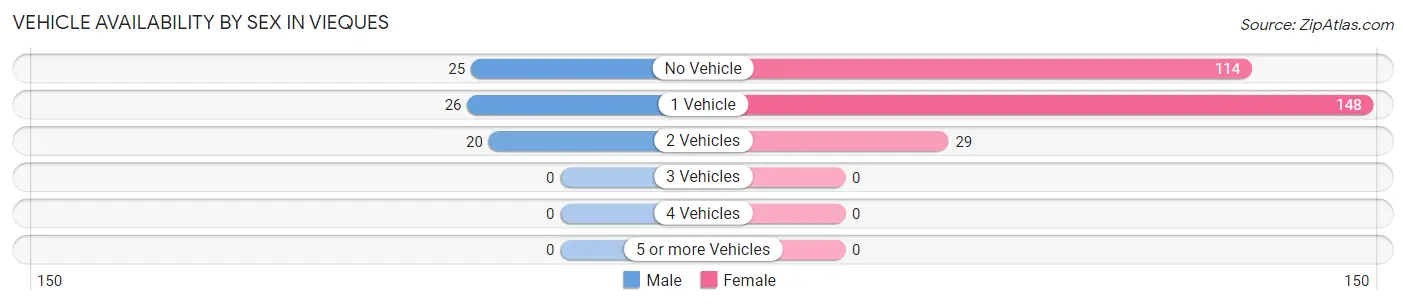
| Vehicles Available | Male | Female |
| No Vehicle | 25 (35.2%) | 114 (39.2%) |
| 1 Vehicle | 26 (36.6%) | 148 (50.9%) |
| 2 Vehicles | 20 (28.2%) | 29 (10.0%) |
| 3 Vehicles | 0 (0.0%) | 0 (0.0%) |
| 4 Vehicles | 0 (0.0%) | 0 (0.0%) |
| 5 or more Vehicles | 0 (0.0%) | 0 (0.0%) |
| Total | 71 (100.0%) | 291 (100.0%) |
Commute Time in Vieques
The most frequently occuring commute durations in Vieques are 10 to 14 minutes (208 commuters, 81.6%), 30 to 34 minutes (25 commuters, 9.8%), and 15 to 19 minutes (11 commuters, 4.3%).
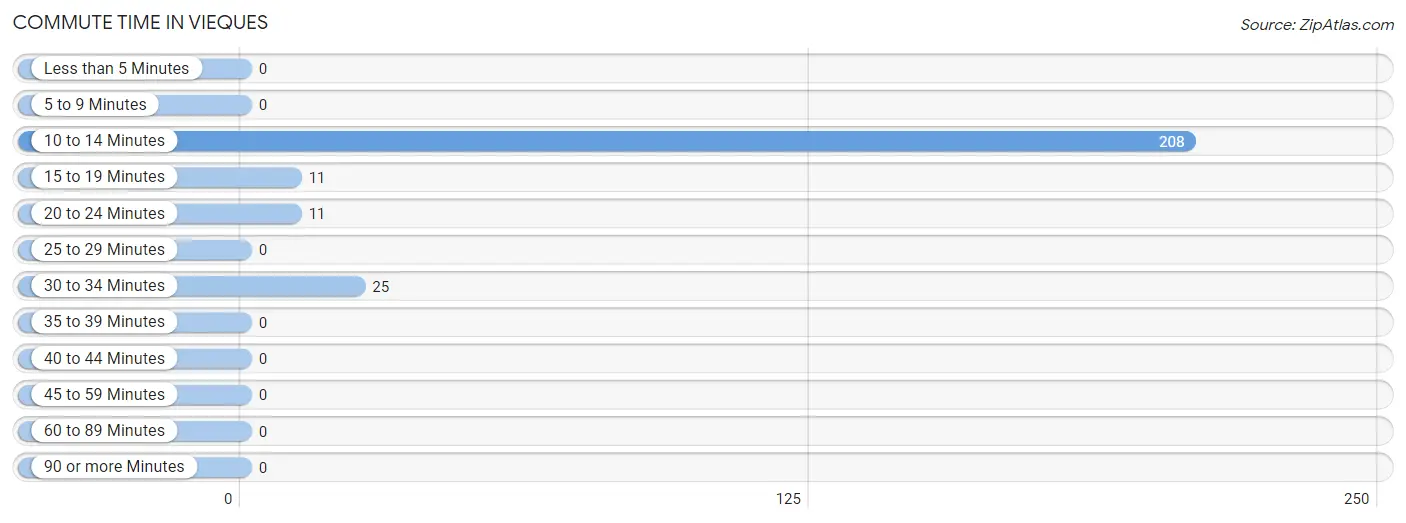
| Commute Time | # Commuters | % Commuters |
| Less than 5 Minutes | 0 | 0.0% |
| 5 to 9 Minutes | 0 | 0.0% |
| 10 to 14 Minutes | 208 | 81.6% |
| 15 to 19 Minutes | 11 | 4.3% |
| 20 to 24 Minutes | 11 | 4.3% |
| 25 to 29 Minutes | 0 | 0.0% |
| 30 to 34 Minutes | 25 | 9.8% |
| 35 to 39 Minutes | 0 | 0.0% |
| 40 to 44 Minutes | 0 | 0.0% |
| 45 to 59 Minutes | 0 | 0.0% |
| 60 to 89 Minutes | 0 | 0.0% |
| 90 or more Minutes | 0 | 0.0% |
Commute Time by Sex in Vieques
The most common commute times in Vieques are 10 to 14 minutes (35 commuters, 49.3%) for males and 10 to 14 minutes (173 commuters, 94.0%) for females.
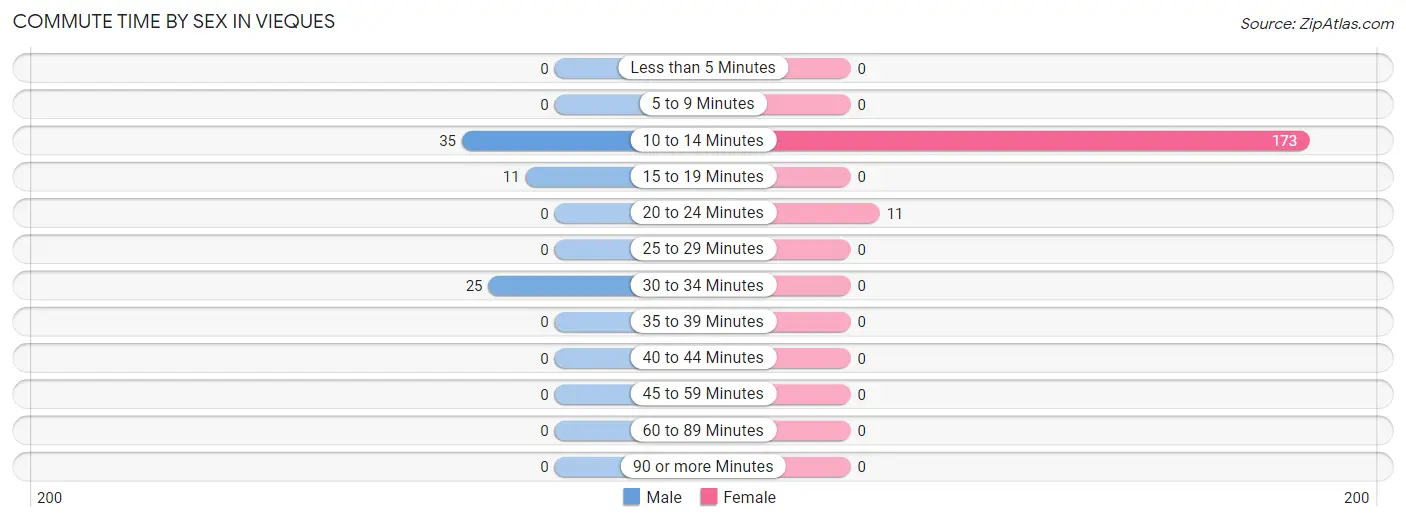
| Commute Time | Male | Female |
| Less than 5 Minutes | 0 (0.0%) | 0 (0.0%) |
| 5 to 9 Minutes | 0 (0.0%) | 0 (0.0%) |
| 10 to 14 Minutes | 35 (49.3%) | 173 (94.0%) |
| 15 to 19 Minutes | 11 (15.5%) | 0 (0.0%) |
| 20 to 24 Minutes | 0 (0.0%) | 11 (6.0%) |
| 25 to 29 Minutes | 0 (0.0%) | 0 (0.0%) |
| 30 to 34 Minutes | 25 (35.2%) | 0 (0.0%) |
| 35 to 39 Minutes | 0 (0.0%) | 0 (0.0%) |
| 40 to 44 Minutes | 0 (0.0%) | 0 (0.0%) |
| 45 to 59 Minutes | 0 (0.0%) | 0 (0.0%) |
| 60 to 89 Minutes | 0 (0.0%) | 0 (0.0%) |
| 90 or more Minutes | 0 (0.0%) | 0 (0.0%) |
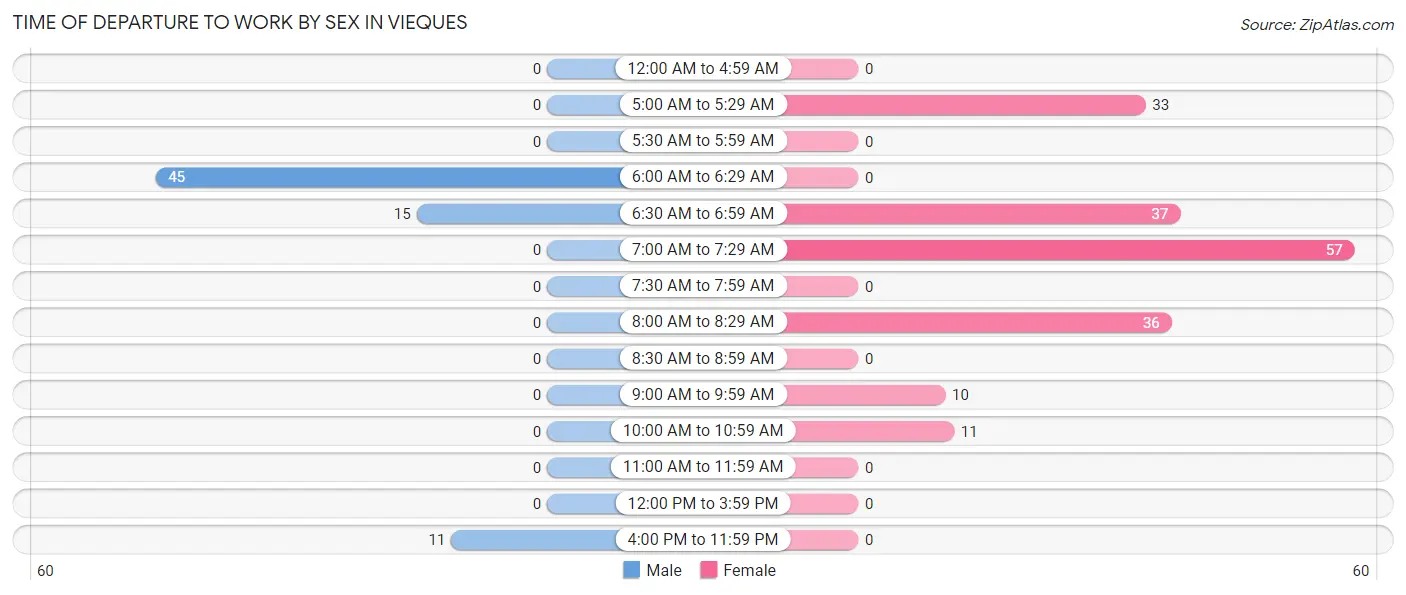
Time of Departure to Work by Sex in Vieques
The most frequent times of departure to work in Vieques are 6:00 AM to 6:29 AM (45, 63.4%) for males and 7:00 AM to 7:29 AM (57, 31.0%) for females.
| Time of Departure | Male | Female |
| 12:00 AM to 4:59 AM | 0 (0.0%) | 0 (0.0%) |
| 5:00 AM to 5:29 AM | 0 (0.0%) | 33 (17.9%) |
| 5:30 AM to 5:59 AM | 0 (0.0%) | 0 (0.0%) |
| 6:00 AM to 6:29 AM | 45 (63.4%) | 0 (0.0%) |
| 6:30 AM to 6:59 AM | 15 (21.1%) | 37 (20.1%) |
| 7:00 AM to 7:29 AM | 0 (0.0%) | 57 (31.0%) |
| 7:30 AM to 7:59 AM | 0 (0.0%) | 0 (0.0%) |
| 8:00 AM to 8:29 AM | 0 (0.0%) | 36 (19.6%) |
| 8:30 AM to 8:59 AM | 0 (0.0%) | 0 (0.0%) |
| 9:00 AM to 9:59 AM | 0 (0.0%) | 10 (5.4%) |
| 10:00 AM to 10:59 AM | 0 (0.0%) | 11 (6.0%) |
| 11:00 AM to 11:59 AM | 0 (0.0%) | 0 (0.0%) |
| 12:00 PM to 3:59 PM | 0 (0.0%) | 0 (0.0%) |
| 4:00 PM to 11:59 PM | 11 (15.5%) | 0 (0.0%) |
| Total | 71 (100.0%) | 184 (100.0%) |
Housing Occupancy in Vieques
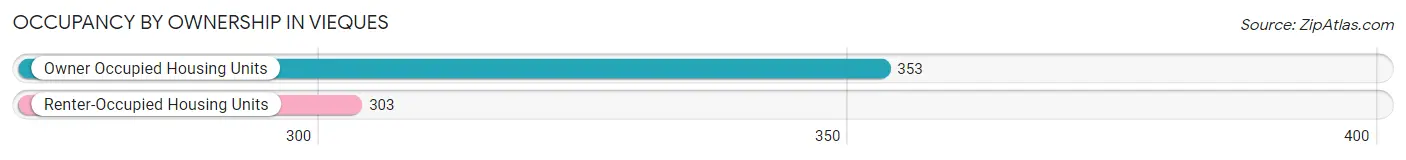
Occupancy by Ownership in Vieques
Of the total 656 dwellings in Vieques, owner-occupied units account for 353 (53.8%), while renter-occupied units make up 303 (46.2%).
| Occupancy | # Housing Units | % Housing Units |
| Owner Occupied Housing Units | 353 | 53.8% |
| Renter-Occupied Housing Units | 303 | 46.2% |
| Total Occupied Housing Units | 656 | 100.0% |
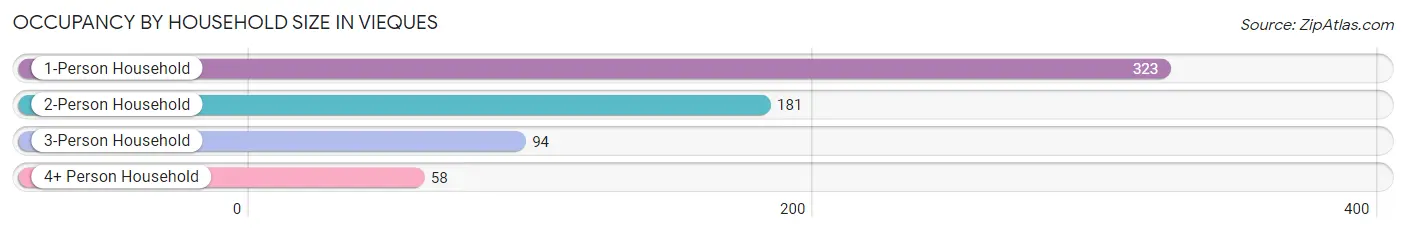
Occupancy by Household Size in Vieques
| Household Size | # Housing Units | % Housing Units |
| 1-Person Household | 323 | 49.2% |
| 2-Person Household | 181 | 27.6% |
| 3-Person Household | 94 | 14.3% |
| 4+ Person Household | 58 | 8.8% |
| Total Housing Units | 656 | 100.0% |
Occupancy by Ownership by Household Size in Vieques
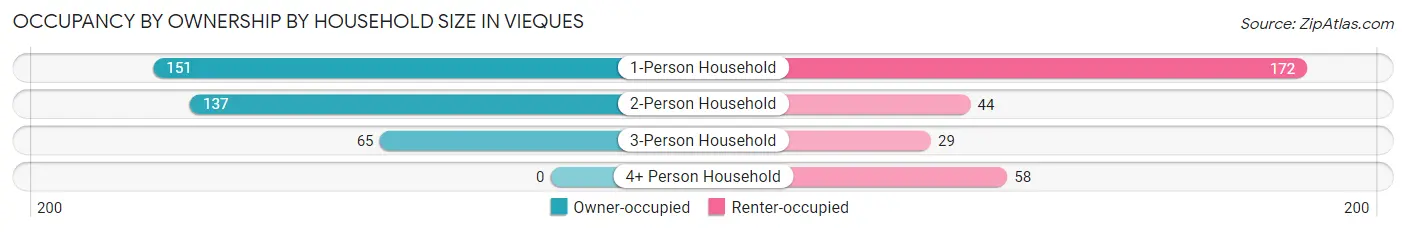
| Household Size | Owner-occupied | Renter-occupied |
| 1-Person Household | 151 (46.8%) | 172 (53.2%) |
| 2-Person Household | 137 (75.7%) | 44 (24.3%) |
| 3-Person Household | 65 (69.2%) | 29 (30.8%) |
| 4+ Person Household | 0 (0.0%) | 58 (100.0%) |
| Total Housing Units | 353 (53.8%) | 303 (46.2%) |
Occupancy by Educational Attainment in Vieques
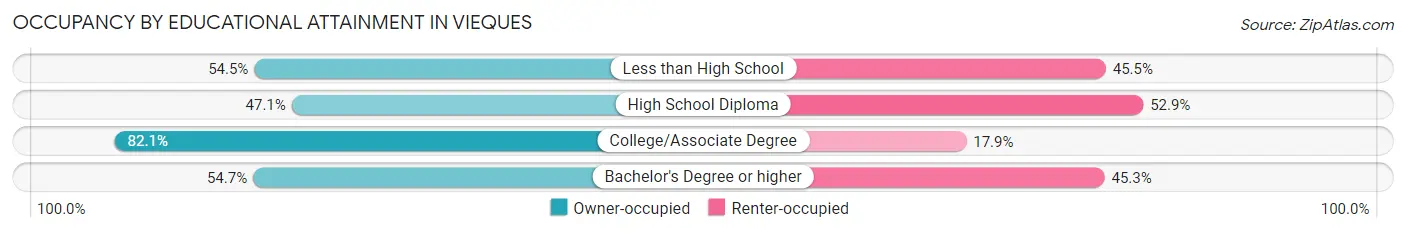
| Household Size | Owner-occupied | Renter-occupied |
| Less than High School | 79 (54.5%) | 66 (45.5%) |
| High School Diploma | 176 (47.1%) | 198 (52.9%) |
| College/Associate Degree | 69 (82.1%) | 15 (17.9%) |
| Bachelor's Degree or higher | 29 (54.7%) | 24 (45.3%) |
Occupancy by Age of Householder in Vieques
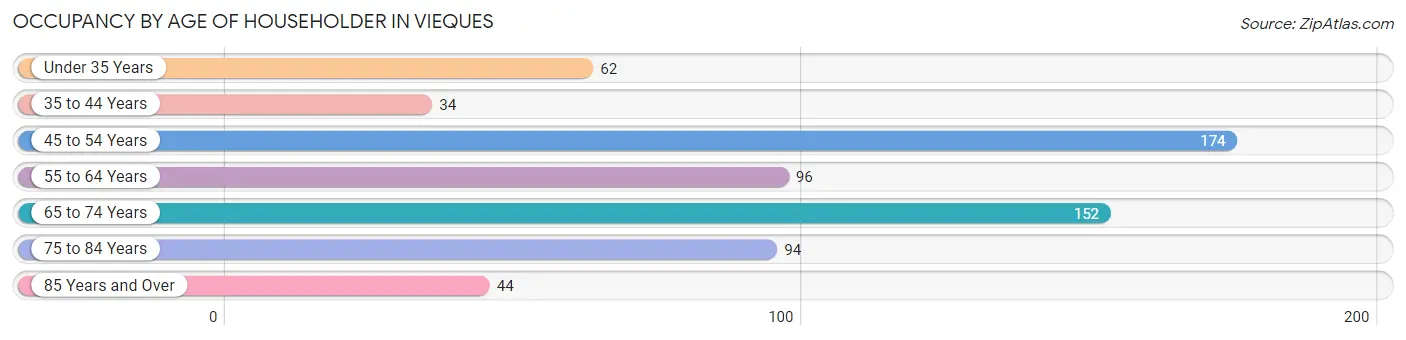
| Age Bracket | # Households | % Households |
| Under 35 Years | 62 | 9.5% |
| 35 to 44 Years | 34 | 5.2% |
| 45 to 54 Years | 174 | 26.5% |
| 55 to 64 Years | 96 | 14.6% |
| 65 to 74 Years | 152 | 23.2% |
| 75 to 84 Years | 94 | 14.3% |
| 85 Years and Over | 44 | 6.7% |
| Total | 656 | 100.0% |
Housing Finances in Vieques
Median Income by Occupancy in Vieques
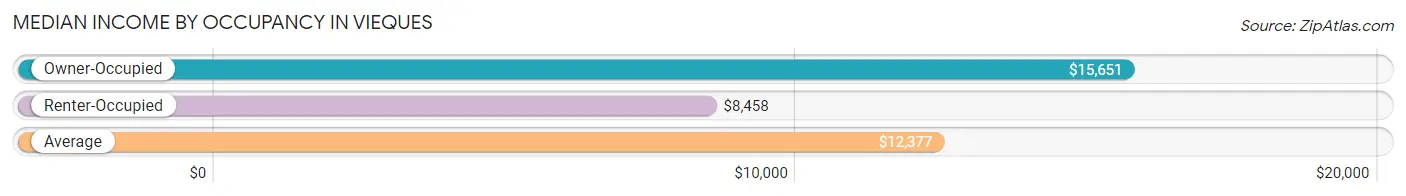
| Occupancy Type | # Households | Median Income |
| Owner-Occupied | 353 (53.8%) | $15,651 |
| Renter-Occupied | 303 (46.2%) | $8,458 |
| Average | 656 (100.0%) | $12,377 |
Occupancy by Householder Income Bracket in Vieques
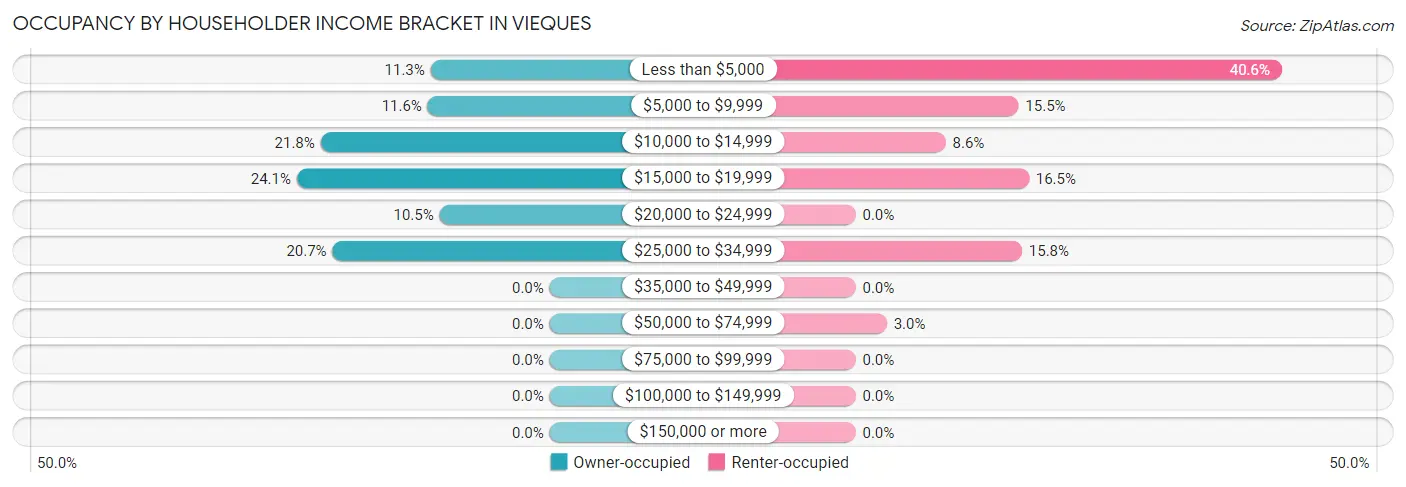
| Income Bracket | Owner-occupied | Renter-occupied |
| Less than $5,000 | 40 (11.3%) | 123 (40.6%) |
| $5,000 to $9,999 | 41 (11.6%) | 47 (15.5%) |
| $10,000 to $14,999 | 77 (21.8%) | 26 (8.6%) |
| $15,000 to $19,999 | 85 (24.1%) | 50 (16.5%) |
| $20,000 to $24,999 | 37 (10.5%) | 0 (0.0%) |
| $25,000 to $34,999 | 73 (20.7%) | 48 (15.8%) |
| $35,000 to $49,999 | 0 (0.0%) | 0 (0.0%) |
| $50,000 to $74,999 | 0 (0.0%) | 9 (3.0%) |
| $75,000 to $99,999 | 0 (0.0%) | 0 (0.0%) |
| $100,000 to $149,999 | 0 (0.0%) | 0 (0.0%) |
| $150,000 or more | 0 (0.0%) | 0 (0.0%) |
| Total | 353 (100.0%) | 303 (100.0%) |
Monthly Housing Cost Tiers in Vieques
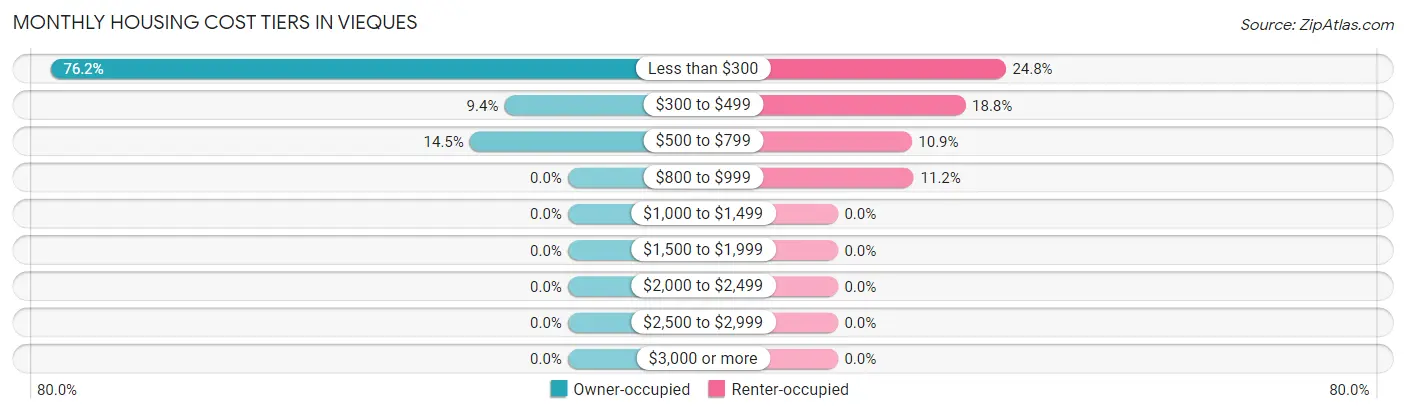
| Monthly Cost | Owner-occupied | Renter-occupied |
| Less than $300 | 269 (76.2%) | 75 (24.7%) |
| $300 to $499 | 33 (9.3%) | 57 (18.8%) |
| $500 to $799 | 51 (14.4%) | 33 (10.9%) |
| $800 to $999 | 0 (0.0%) | 34 (11.2%) |
| $1,000 to $1,499 | 0 (0.0%) | 0 (0.0%) |
| $1,500 to $1,999 | 0 (0.0%) | 0 (0.0%) |
| $2,000 to $2,499 | 0 (0.0%) | 0 (0.0%) |
| $2,500 to $2,999 | 0 (0.0%) | 0 (0.0%) |
| $3,000 or more | 0 (0.0%) | 0 (0.0%) |
| Total | 353 (100.0%) | 303 (100.0%) |
Physical Housing Characteristics in Vieques
Housing Structures in Vieques
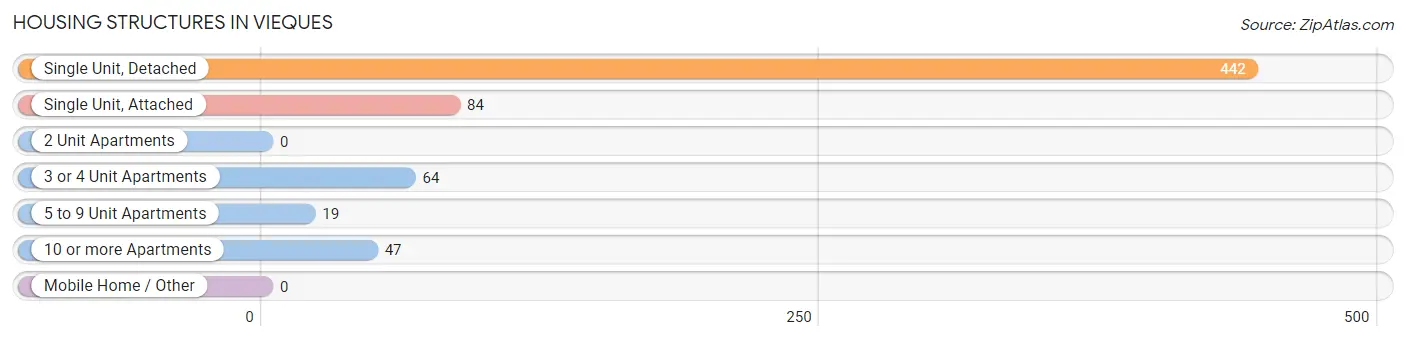
| Structure Type | # Housing Units | % Housing Units |
| Single Unit, Detached | 442 | 67.4% |
| Single Unit, Attached | 84 | 12.8% |
| 2 Unit Apartments | 0 | 0.0% |
| 3 or 4 Unit Apartments | 64 | 9.8% |
| 5 to 9 Unit Apartments | 19 | 2.9% |
| 10 or more Apartments | 47 | 7.2% |
| Mobile Home / Other | 0 | 0.0% |
| Total | 656 | 100.0% |
Housing Structures by Occupancy in Vieques
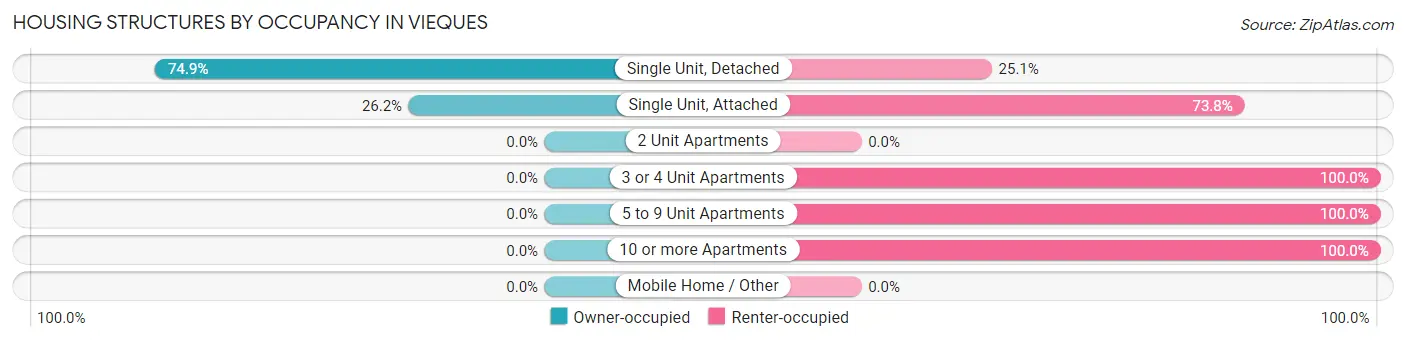
| Structure Type | Owner-occupied | Renter-occupied |
| Single Unit, Detached | 331 (74.9%) | 111 (25.1%) |
| Single Unit, Attached | 22 (26.2%) | 62 (73.8%) |
| 2 Unit Apartments | 0 (0.0%) | 0 (0.0%) |
| 3 or 4 Unit Apartments | 0 (0.0%) | 64 (100.0%) |
| 5 to 9 Unit Apartments | 0 (0.0%) | 19 (100.0%) |
| 10 or more Apartments | 0 (0.0%) | 47 (100.0%) |
| Mobile Home / Other | 0 (0.0%) | 0 (0.0%) |
| Total | 353 (53.8%) | 303 (46.2%) |
Housing Structures by Number of Rooms in Vieques
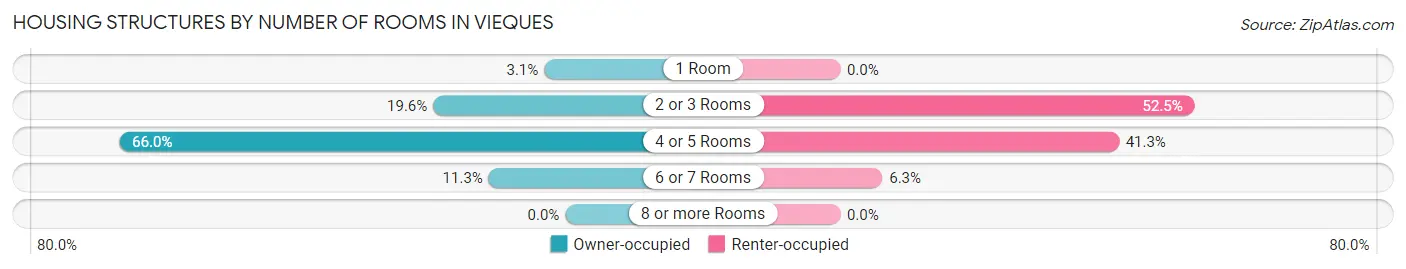
| Number of Rooms | Owner-occupied | Renter-occupied |
| 1 Room | 11 (3.1%) | 0 (0.0%) |
| 2 or 3 Rooms | 69 (19.6%) | 159 (52.5%) |
| 4 or 5 Rooms | 233 (66.0%) | 125 (41.2%) |
| 6 or 7 Rooms | 40 (11.3%) | 19 (6.3%) |
| 8 or more Rooms | 0 (0.0%) | 0 (0.0%) |
| Total | 353 (100.0%) | 303 (100.0%) |
Housing Structure by Heating Type in Vieques
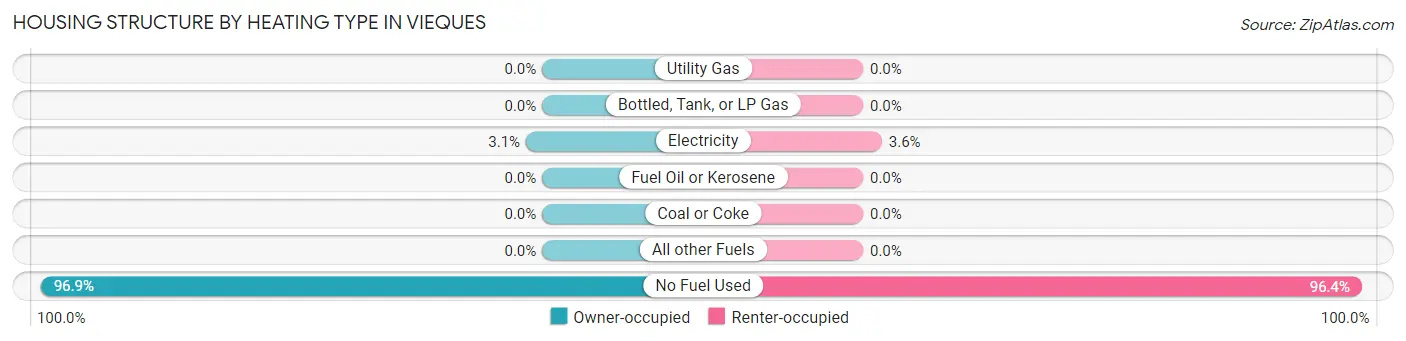
| Heating Type | Owner-occupied | Renter-occupied |
| Utility Gas | 0 (0.0%) | 0 (0.0%) |
| Bottled, Tank, or LP Gas | 0 (0.0%) | 0 (0.0%) |
| Electricity | 11 (3.1%) | 11 (3.6%) |
| Fuel Oil or Kerosene | 0 (0.0%) | 0 (0.0%) |
| Coal or Coke | 0 (0.0%) | 0 (0.0%) |
| All other Fuels | 0 (0.0%) | 0 (0.0%) |
| No Fuel Used | 342 (96.9%) | 292 (96.4%) |
| Total | 353 (100.0%) | 303 (100.0%) |
Household Vehicle Usage in Vieques
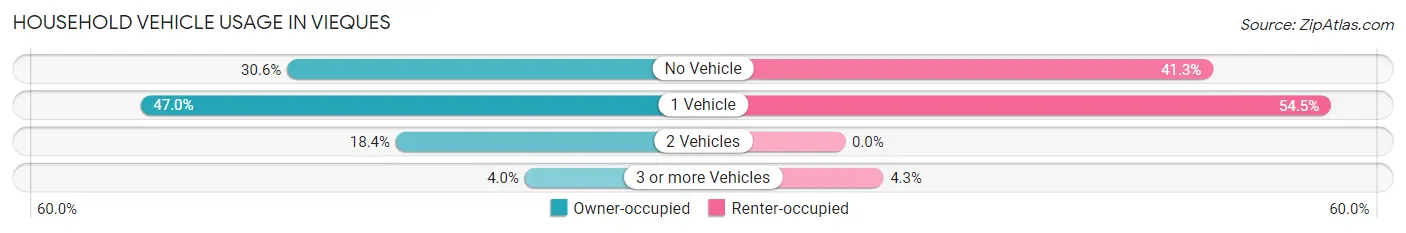
| Vehicles per Household | Owner-occupied | Renter-occupied |
| No Vehicle | 108 (30.6%) | 125 (41.2%) |
| 1 Vehicle | 166 (47.0%) | 165 (54.5%) |
| 2 Vehicles | 65 (18.4%) | 0 (0.0%) |
| 3 or more Vehicles | 14 (4.0%) | 13 (4.3%) |
| Total | 353 (100.0%) | 303 (100.0%) |
Real Estate & Mortgages in Vieques
Real Estate and Mortgage Overview in Vieques
| Characteristic | Without Mortgage | With Mortgage |
| Housing Units | 302 | 51 |
| Median Property Value | $58,000 | $0 |
| Median Household Income | $14,205 | $0 |
| Monthly Housing Costs | $119 | $0 |
| Real Estate Taxes | - | - |
Property Value by Mortgage Status in Vieques
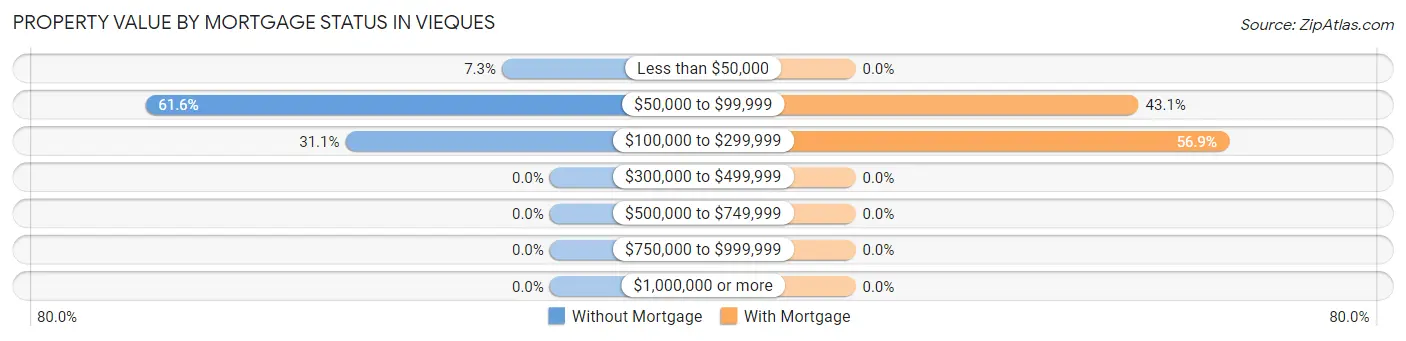
| Property Value | Without Mortgage | With Mortgage |
| Less than $50,000 | 22 (7.3%) | 0 (0.0%) |
| $50,000 to $99,999 | 186 (61.6%) | 22 (43.1%) |
| $100,000 to $299,999 | 94 (31.1%) | 29 (56.9%) |
| $300,000 to $499,999 | 0 (0.0%) | 0 (0.0%) |
| $500,000 to $749,999 | 0 (0.0%) | 0 (0.0%) |
| $750,000 to $999,999 | 0 (0.0%) | 0 (0.0%) |
| $1,000,000 or more | 0 (0.0%) | 0 (0.0%) |
| Total | 302 (100.0%) | 51 (100.0%) |
Household Income by Mortgage Status in Vieques
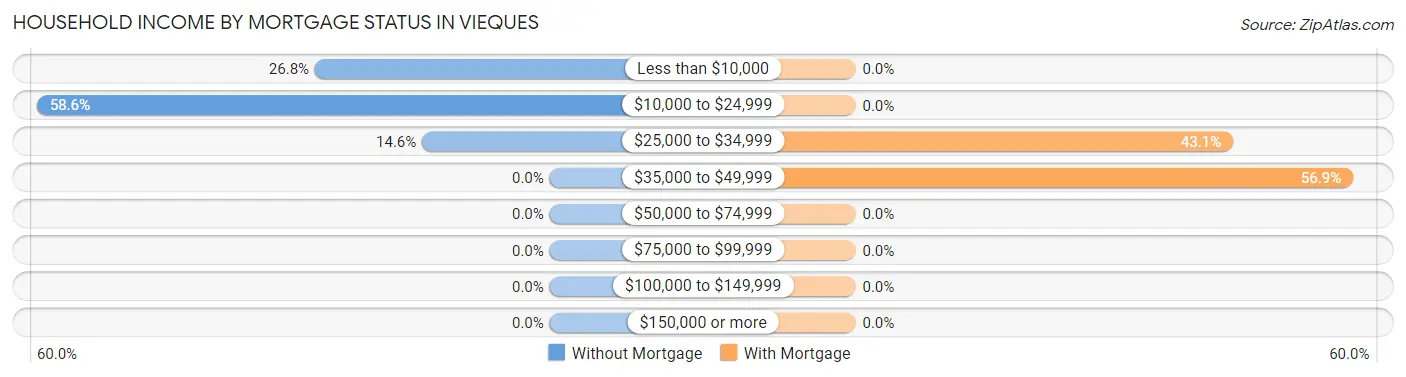
| Household Income | Without Mortgage | With Mortgage |
| Less than $10,000 | 81 (26.8%) | 0 (0.0%) |
| $10,000 to $24,999 | 177 (58.6%) | 0 (0.0%) |
| $25,000 to $34,999 | 44 (14.6%) | 22 (43.1%) |
| $35,000 to $49,999 | 0 (0.0%) | 29 (56.9%) |
| $50,000 to $74,999 | 0 (0.0%) | 0 (0.0%) |
| $75,000 to $99,999 | 0 (0.0%) | 0 (0.0%) |
| $100,000 to $149,999 | 0 (0.0%) | 0 (0.0%) |
| $150,000 or more | 0 (0.0%) | 0 (0.0%) |
| Total | 302 (100.0%) | 51 (100.0%) |
Property Value to Household Income Ratio in Vieques
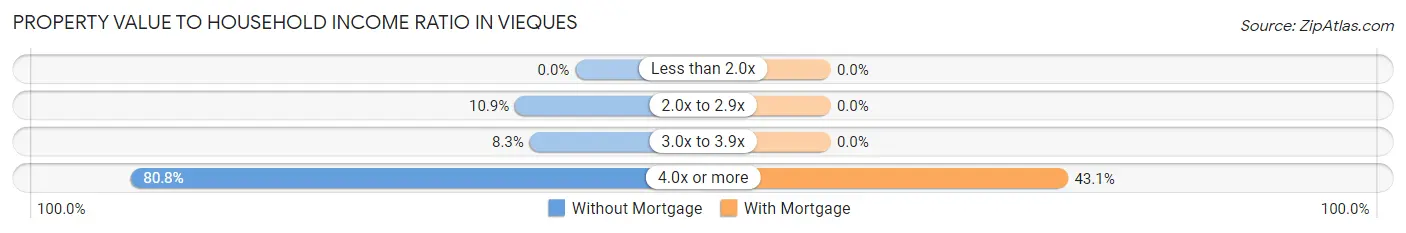
| Value-to-Income Ratio | Without Mortgage | With Mortgage |
| Less than 2.0x | 0 (0.0%) | 0 (0.0%) |
| 2.0x to 2.9x | 33 (10.9%) | 0 (0.0%) |
| 3.0x to 3.9x | 25 (8.3%) | 0 (0.0%) |
| 4.0x or more | 244 (80.8%) | 22 (43.1%) |
| Total | 302 (100.0%) | 51 (100.0%) |
Real Estate Taxes by Mortgage Status in Vieques
| Property Taxes | Without Mortgage | With Mortgage |
| Less than $800 | 0 (0.0%) | 0 (0.0%) |
| $800 to $1,499 | 0 (0.0%) | 0 (0.0%) |
| $800 to $1,499 | 0 (0.0%) | 0 (0.0%) |
| Total | 302 (100.0%) | 51 (100.0%) |
Health & Disability in Vieques
Health Insurance Coverage by Age in Vieques
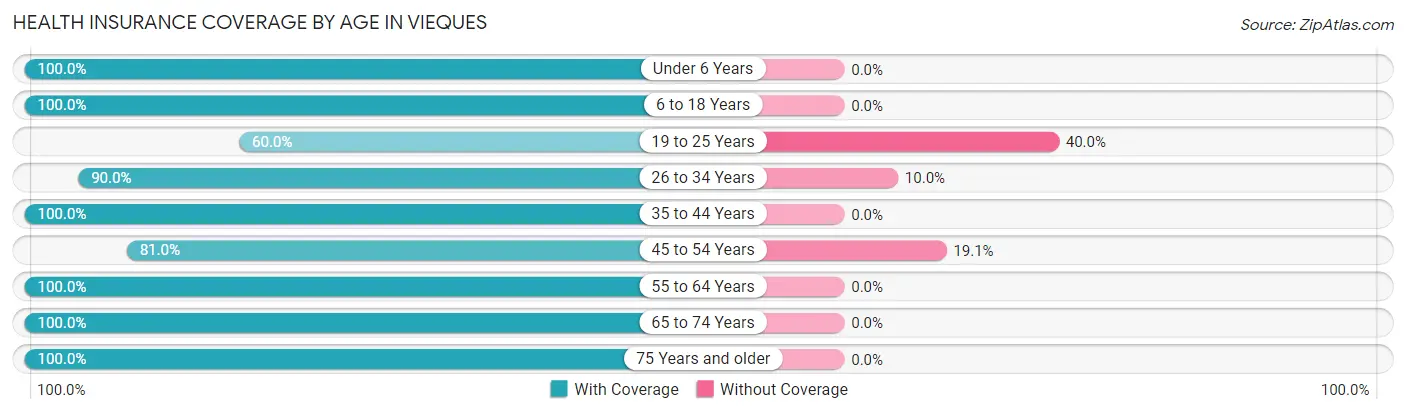
| Age Bracket | With Coverage | Without Coverage |
| Under 6 Years | 313 (100.0%) | 0 (0.0%) |
| 6 to 18 Years | 414 (100.0%) | 0 (0.0%) |
| 19 to 25 Years | 117 (60.0%) | 78 (40.0%) |
| 26 to 34 Years | 81 (90.0%) | 9 (10.0%) |
| 35 to 44 Years | 48 (100.0%) | 0 (0.0%) |
| 45 to 54 Years | 204 (80.9%) | 48 (19.1%) |
| 55 to 64 Years | 209 (100.0%) | 0 (0.0%) |
| 65 to 74 Years | 216 (100.0%) | 0 (0.0%) |
| 75 Years and older | 155 (100.0%) | 0 (0.0%) |
| Total | 1,757 (92.9%) | 135 (7.1%) |
Health Insurance Coverage by Citizenship Status in Vieques
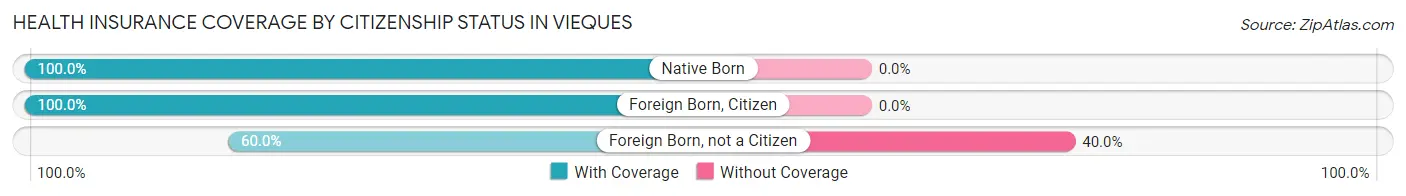
| Citizenship Status | With Coverage | Without Coverage |
| Native Born | 313 (100.0%) | 0 (0.0%) |
| Foreign Born, Citizen | 414 (100.0%) | 0 (0.0%) |
| Foreign Born, not a Citizen | 117 (60.0%) | 78 (40.0%) |
Health Insurance Coverage by Household Income in Vieques
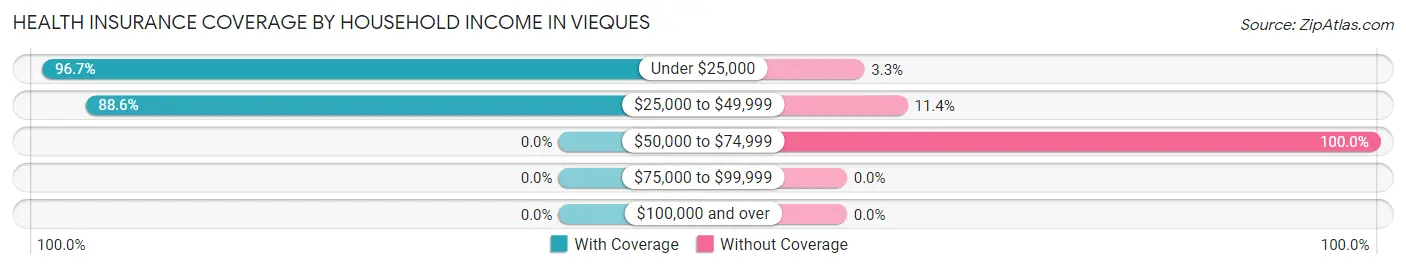
| Household Income | With Coverage | Without Coverage |
| Under $25,000 | 1,500 (96.7%) | 51 (3.3%) |
| $25,000 to $49,999 | 257 (88.6%) | 33 (11.4%) |
| $50,000 to $74,999 | 0 (0.0%) | 51 (100.0%) |
| $75,000 to $99,999 | 0 (0.0%) | 0 (0.0%) |
| $100,000 and over | 0 (0.0%) | 0 (0.0%) |
Public vs Private Health Insurance Coverage by Age in Vieques
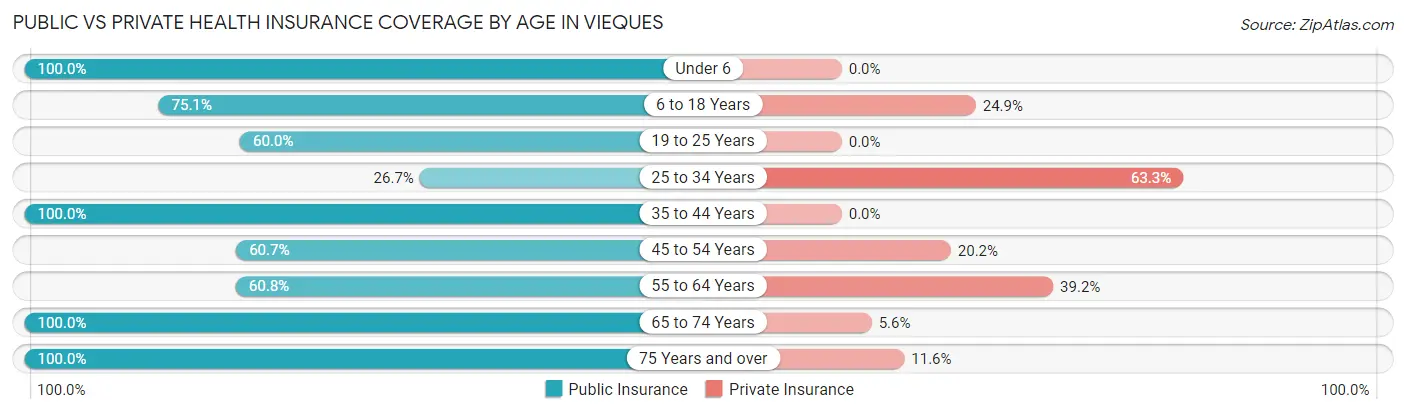
| Age Bracket | Public Insurance | Private Insurance |
| Under 6 | 313 (100.0%) | 0 (0.0%) |
| 6 to 18 Years | 311 (75.1%) | 103 (24.9%) |
| 19 to 25 Years | 117 (60.0%) | 0 (0.0%) |
| 25 to 34 Years | 24 (26.7%) | 57 (63.3%) |
| 35 to 44 Years | 48 (100.0%) | 0 (0.0%) |
| 45 to 54 Years | 153 (60.7%) | 51 (20.2%) |
| 55 to 64 Years | 127 (60.8%) | 82 (39.2%) |
| 65 to 74 Years | 216 (100.0%) | 12 (5.6%) |
| 75 Years and over | 155 (100.0%) | 18 (11.6%) |
| Total | 1,464 (77.4%) | 323 (17.1%) |
Disability Status by Sex by Age in Vieques
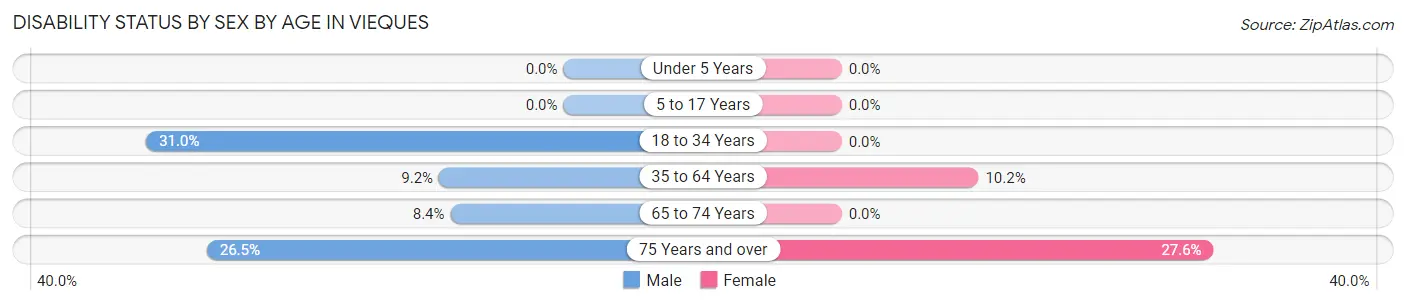
| Age Bracket | Male | Female |
| Under 5 Years | 0 (0.0%) | 0 (0.0%) |
| 5 to 17 Years | 0 (0.0%) | 0 (0.0%) |
| 18 to 34 Years | 57 (31.0%) | 0 (0.0%) |
| 35 to 64 Years | 17 (9.2%) | 33 (10.2%) |
| 65 to 74 Years | 13 (8.4%) | 0 (0.0%) |
| 75 Years and over | 18 (26.5%) | 24 (27.6%) |
Disability Class by Sex by Age in Vieques
Disability Class: Hearing Difficulty
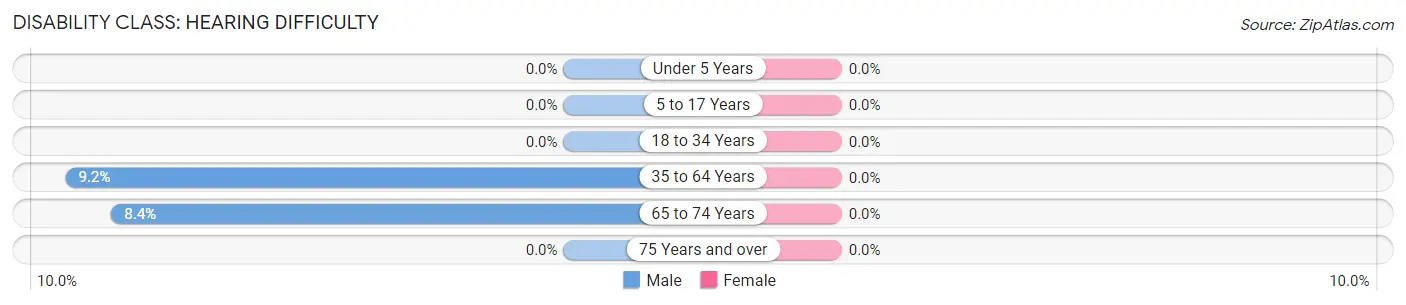
| Age Bracket | Male | Female |
| Under 5 Years | 0 (0.0%) | 0 (0.0%) |
| 5 to 17 Years | 0 (0.0%) | 0 (0.0%) |
| 18 to 34 Years | 0 (0.0%) | 0 (0.0%) |
| 35 to 64 Years | 17 (9.2%) | 0 (0.0%) |
| 65 to 74 Years | 13 (8.4%) | 0 (0.0%) |
| 75 Years and over | 0 (0.0%) | 0 (0.0%) |
Disability Class: Vision Difficulty
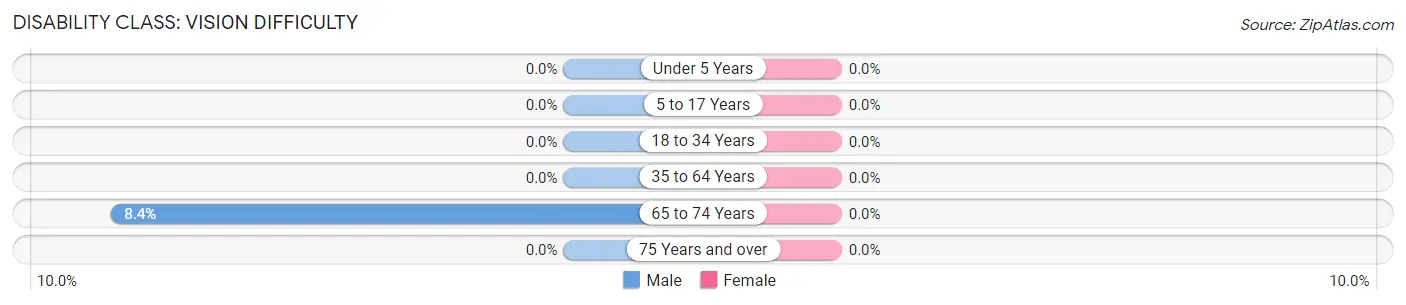
| Age Bracket | Male | Female |
| Under 5 Years | 0 (0.0%) | 0 (0.0%) |
| 5 to 17 Years | 0 (0.0%) | 0 (0.0%) |
| 18 to 34 Years | 0 (0.0%) | 0 (0.0%) |
| 35 to 64 Years | 0 (0.0%) | 0 (0.0%) |
| 65 to 74 Years | 13 (8.4%) | 0 (0.0%) |
| 75 Years and over | 0 (0.0%) | 0 (0.0%) |
Disability Class: Cognitive Difficulty
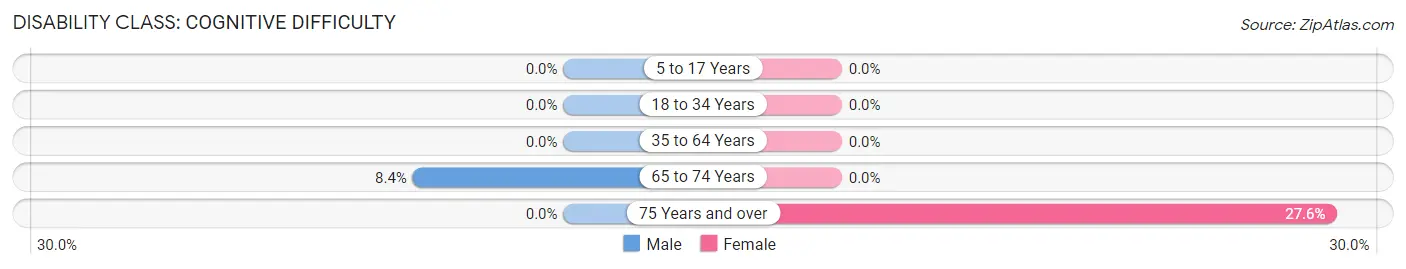
| Age Bracket | Male | Female |
| 5 to 17 Years | 0 (0.0%) | 0 (0.0%) |
| 18 to 34 Years | 0 (0.0%) | 0 (0.0%) |
| 35 to 64 Years | 0 (0.0%) | 0 (0.0%) |
| 65 to 74 Years | 13 (8.4%) | 0 (0.0%) |
| 75 Years and over | 0 (0.0%) | 24 (27.6%) |
Disability Class: Ambulatory Difficulty
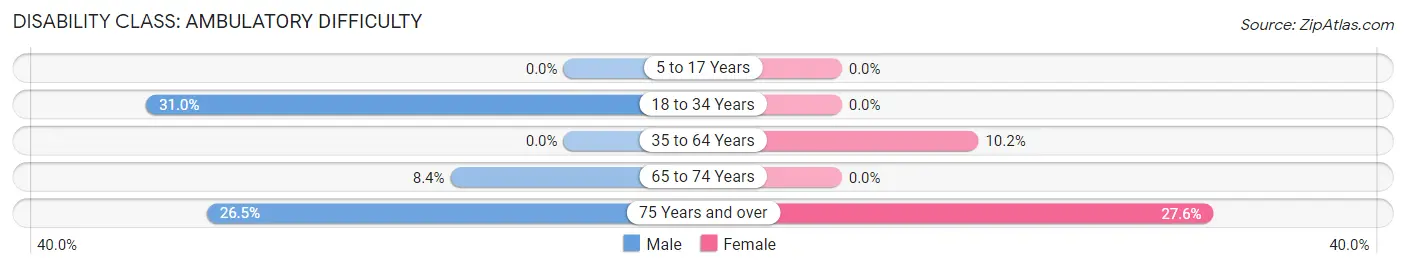
| Age Bracket | Male | Female |
| 5 to 17 Years | 0 (0.0%) | 0 (0.0%) |
| 18 to 34 Years | 57 (31.0%) | 0 (0.0%) |
| 35 to 64 Years | 0 (0.0%) | 33 (10.2%) |
| 65 to 74 Years | 13 (8.4%) | 0 (0.0%) |
| 75 Years and over | 18 (26.5%) | 24 (27.6%) |
Disability Class: Self-Care Difficulty
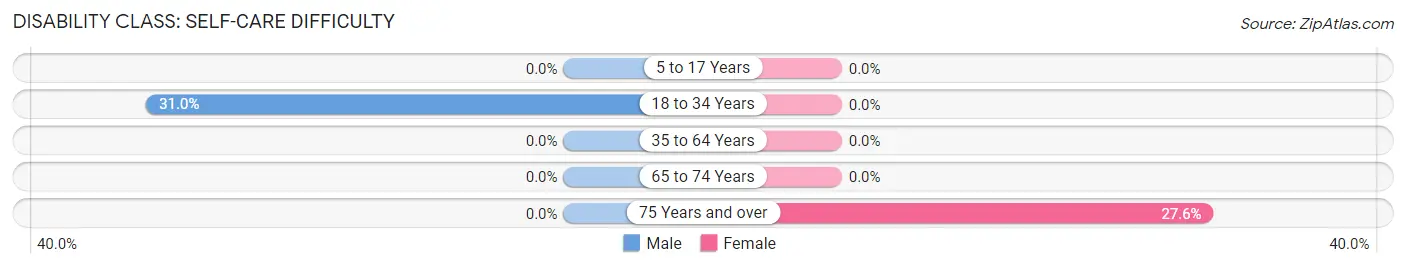
| Age Bracket | Male | Female |
| 5 to 17 Years | 0 (0.0%) | 0 (0.0%) |
| 18 to 34 Years | 57 (31.0%) | 0 (0.0%) |
| 35 to 64 Years | 0 (0.0%) | 0 (0.0%) |
| 65 to 74 Years | 0 (0.0%) | 0 (0.0%) |
| 75 Years and over | 0 (0.0%) | 24 (27.6%) |
Technology Access in Vieques
Computing Device Access in Vieques
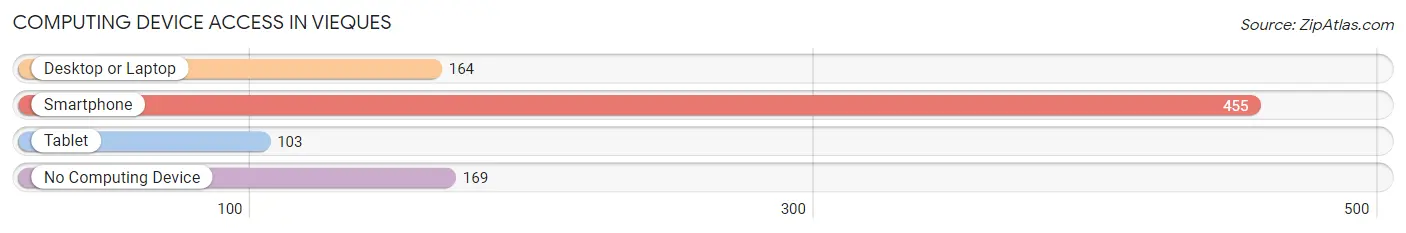
| Device Type | # Households | % Households |
| Desktop or Laptop | 164 | 25.0% |
| Smartphone | 455 | 69.4% |
| Tablet | 103 | 15.7% |
| No Computing Device | 169 | 25.8% |
| Total | 656 | 100.0% |
Internet Access in Vieques
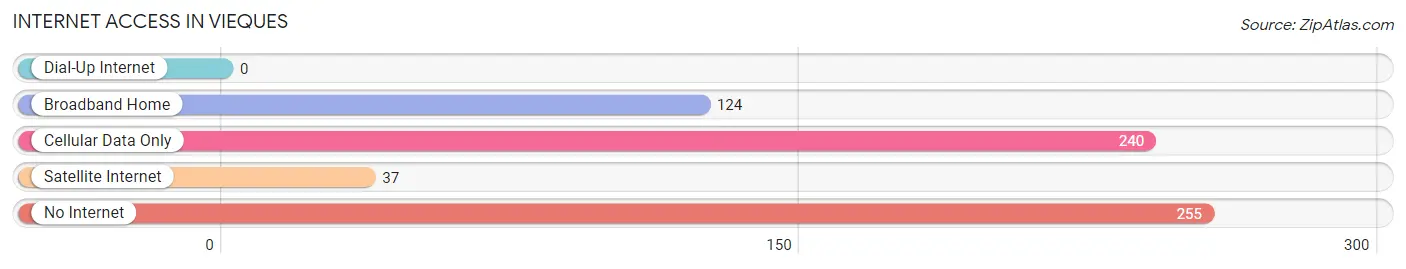
| Internet Type | # Households | % Households |
| Dial-Up Internet | 0 | 0.0% |
| Broadband Home | 124 | 18.9% |
| Cellular Data Only | 240 | 36.6% |
| Satellite Internet | 37 | 5.6% |
| No Internet | 255 | 38.9% |
| Total | 656 | 100.0% |
Vieques Summary
Vieques is a small island municipality located off the east coast of Puerto Rico. It is part of the archipelago of the Spanish Virgin Islands and is the largest island in the group. Vieques is approximately 21 miles long and 4 miles wide, with a total area of about 34 square miles. It is located about 8 miles east of the main island of Puerto Rico and is separated from it by the Vieques Sound. The island is home to approximately 9,000 people, most of whom are of Puerto Rican descent.
Vieques has a long and varied history. It was first inhabited by the Taino Indians, who were the indigenous people of the Caribbean. The island was later colonized by the Spanish in the 16th century, and it remained under Spanish rule until 1898, when it was ceded to the United States as part of the Treaty of Paris. During the early 20th century, the island was used as a military training ground by the U.S. Navy, and it remained under their control until 2003.
Vieques is a tropical island with a humid subtropical climate. The average temperature is around 80°F (27°C) year-round, and the island receives an average of about 60 inches (152 cm) of rain per year. The terrain is mostly flat, with some hills and valleys. The highest point on the island is Monte Pirata, which rises to an elevation of 908 feet (277 m).
The economy of Vieques is largely based on tourism and fishing. The island is a popular destination for tourists from the mainland United States and Puerto Rico, and it is also a popular spot for fishing and boating. Other industries on the island include agriculture, manufacturing, and construction.
The population of Vieques is approximately 9,000 people, with a median age of 36.5 years. The population is mostly of Puerto Rican descent, with a small minority of other ethnicities. The majority of the population is Roman Catholic, and Spanish is the primary language spoken on the island.
Vieques is a unique and beautiful island with a rich history and culture. It is a popular tourist destination, and its economy is largely based on tourism and fishing. The island is home to a diverse population, and its people are proud of their heritage and culture.
Common Questions
What is Per Capita Income in Vieques?
Per Capita income in Vieques is $5,692.
What is the Median Family Income in Vieques?
Median Family Income in Vieques is $16,607.
What is the Median Household income in Vieques?
Median Household Income in Vieques is $12,377.
What is Income or Wage Gap in Vieques?
Income or Wage Gap in Vieques is 22.6%.
Women in Vieques earn 77.4 cents for every dollar earned by a man.
What is Inequality or Gini Index in Vieques?
Inequality or Gini Index in Vieques is 0.42.
What is the Total Population of Vieques?
Total Population of Vieques is 1,892.
What is the Total Male Population of Vieques?
Total Male Population of Vieques is 1,034.
What is the Total Female Population of Vieques?
Total Female Population of Vieques is 858.
What is the Ratio of Males per 100 Females in Vieques?
There are 120.51 Males per 100 Females in Vieques.
What is the Ratio of Females per 100 Males in Vieques?
There are 82.98 Females per 100 Males in Vieques.
What is the Median Population Age in Vieques?
Median Population Age in Vieques is 26.3 Years.
What is the Average Family Size in Vieques
Average Family Size in Vieques is 4.7 People.
What is the Average Household Size in Vieques
Average Household Size in Vieques is 2.9 People.
How Large is the Labor Force in Vieques?
There are 471 People in the Labor Forcein in Vieques.
What is the Percentage of People in the Labor Force in Vieques?
38.2% of People are in the Labor Force in Vieques.
What is the Unemployment Rate in Vieques?
Unemployment Rate in Vieques is 23.3%.