Salinas, PR Map & Demographics
Salinas Map
Salinas Overview
$14,769
PER CAPITA INCOME
$25,112
AVG FAMILY INCOME
$21,023
AVG HOUSEHOLD INCOME
7.2%
WAGE / INCOME GAP [ % ]
92.8¢/ $1
WAGE / INCOME GAP [ $ ]
$11,785
FAMILY INCOME DEFICIT
0.54
INEQUALITY / GINI INDEX
4,358
TOTAL POPULATION
1,898
MALE POPULATION
2,460
FEMALE POPULATION
77.15
MALES / 100 FEMALES
129.61
FEMALES / 100 MALES
47.7
MEDIAN AGE
3.1
AVG FAMILY SIZE
2.5
AVG HOUSEHOLD SIZE
1,189
LABOR FORCE [ PEOPLE ]
32.8%
PERCENT IN LABOR FORCE
2.1%
UNEMPLOYMENT RATE
Salinas Zip Codes
Salinas Area Codes
Income in Salinas
Income Overview in Salinas
Per Capita Income in Salinas is $14,769, while median incomes of families and households are $25,112 and $21,023 respectively.
| Characteristic | Number | Measure |
| Per Capita Income | 4,358 | $14,769 |
| Median Family Income | 1,102 | $25,112 |
| Mean Family Income | 1,102 | $36,197 |
| Median Household Income | 1,738 | $21,023 |
| Mean Household Income | 1,738 | $32,883 |
| Income Deficit | 1,102 | $11,785 |
| Wage / Income Gap (%) | 4,358 | 7.21% |
| Wage / Income Gap ($) | 4,358 | 92.79¢ per $1 |
| Gini / Inequality Index | 4,358 | 0.54 |
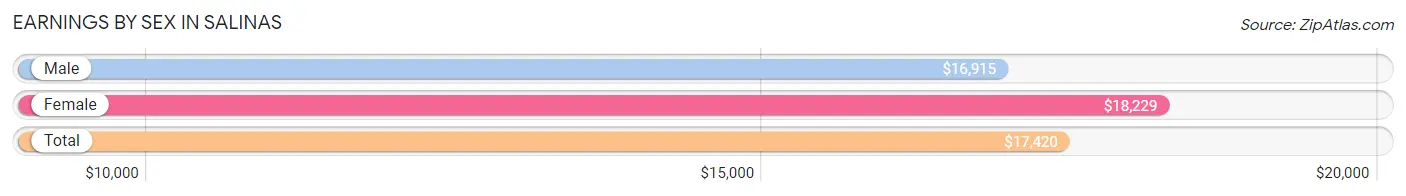
Earnings by Sex in Salinas
Average Earnings in Salinas are $17,420, $16,915 for men and $18,229 for women, a difference of 7.2%.
| Sex | Number | Average Earnings |
| Male | 652 (54.9%) | $16,915 |
| Female | 535 (45.1%) | $18,229 |
| Total | 1,187 (100.0%) | $17,420 |
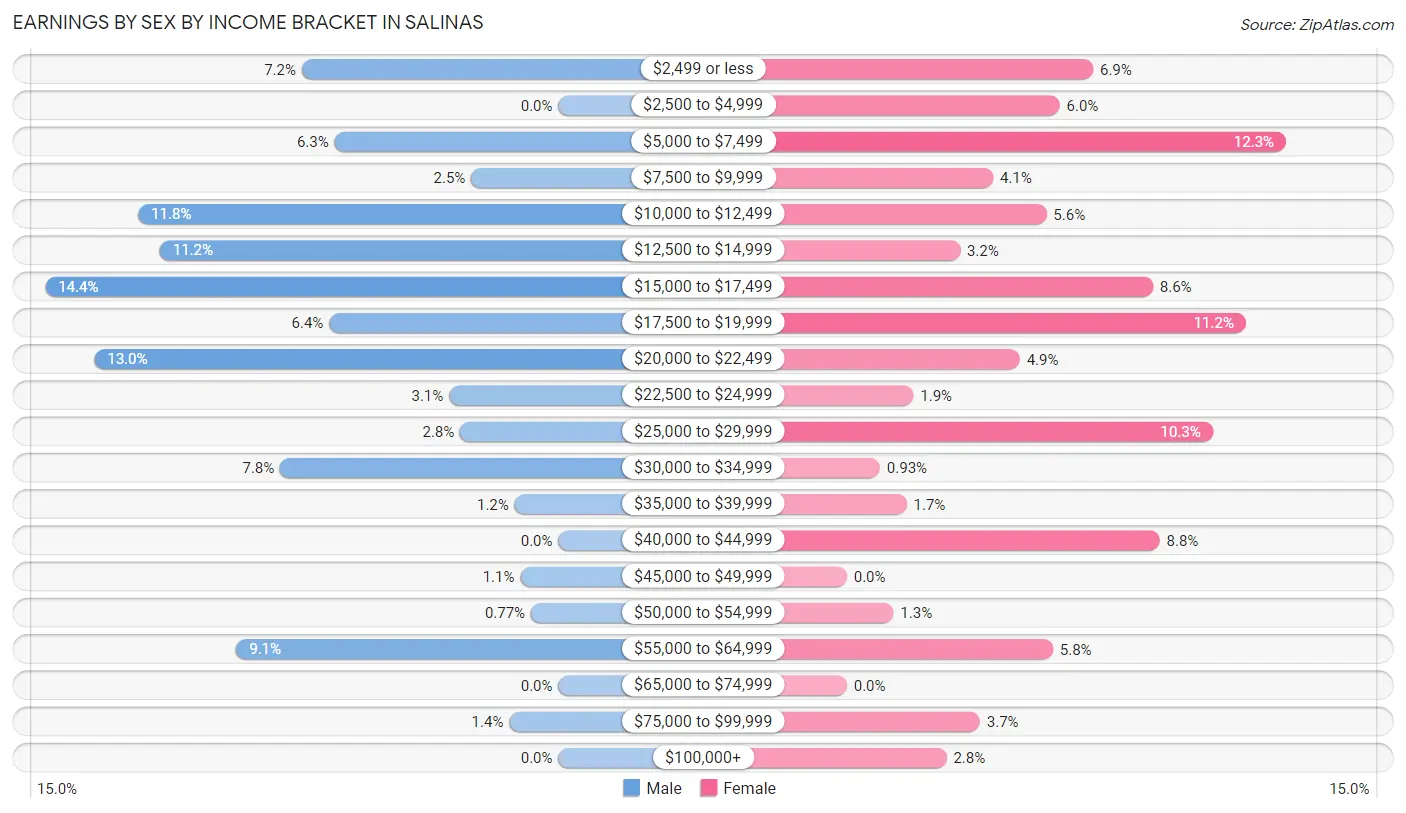
Earnings by Sex by Income Bracket in Salinas
The most common earnings brackets in Salinas are $15,000 to $17,499 for men (94 | 14.4%) and $5,000 to $7,499 for women (66 | 12.3%).
| Income | Male | Female |
| $2,499 or less | 47 (7.2%) | 37 (6.9%) |
| $2,500 to $4,999 | 0 (0.0%) | 32 (6.0%) |
| $5,000 to $7,499 | 41 (6.3%) | 66 (12.3%) |
| $7,500 to $9,999 | 16 (2.5%) | 22 (4.1%) |
| $10,000 to $12,499 | 77 (11.8%) | 30 (5.6%) |
| $12,500 to $14,999 | 73 (11.2%) | 17 (3.2%) |
| $15,000 to $17,499 | 94 (14.4%) | 46 (8.6%) |
| $17,500 to $19,999 | 42 (6.4%) | 60 (11.2%) |
| $20,000 to $22,499 | 85 (13.0%) | 26 (4.9%) |
| $22,500 to $24,999 | 20 (3.1%) | 10 (1.9%) |
| $25,000 to $29,999 | 18 (2.8%) | 55 (10.3%) |
| $30,000 to $34,999 | 51 (7.8%) | 5 (0.9%) |
| $35,000 to $39,999 | 8 (1.2%) | 9 (1.7%) |
| $40,000 to $44,999 | 0 (0.0%) | 47 (8.8%) |
| $45,000 to $49,999 | 7 (1.1%) | 0 (0.0%) |
| $50,000 to $54,999 | 5 (0.8%) | 7 (1.3%) |
| $55,000 to $64,999 | 59 (9.0%) | 31 (5.8%) |
| $65,000 to $74,999 | 0 (0.0%) | 0 (0.0%) |
| $75,000 to $99,999 | 9 (1.4%) | 20 (3.7%) |
| $100,000+ | 0 (0.0%) | 15 (2.8%) |
| Total | 652 (100.0%) | 535 (100.0%) |
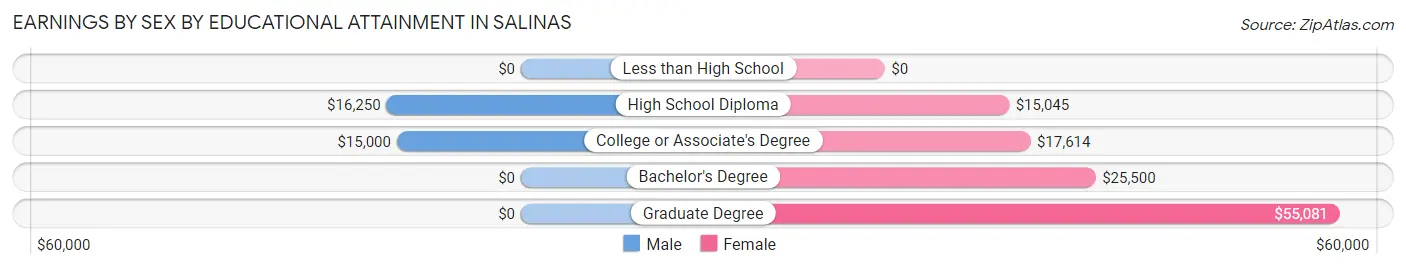
Earnings by Sex by Educational Attainment in Salinas
Average earnings in Salinas are $17,354 for men and $19,229 for women, a difference of 9.8%. Men with an educational attainment of high school diploma enjoy the highest average annual earnings of $16,250, while those with college or associate's degree education earn the least with $15,000. Women with an educational attainment of graduate degree earn the most with the average annual earnings of $55,081, while those with high school diploma education have the smallest earnings of $15,045.
| Educational Attainment | Male Income | Female Income |
| Less than High School | - | - |
| High School Diploma | $16,250 | $15,045 |
| College or Associate's Degree | $15,000 | $17,614 |
| Bachelor's Degree | - | - |
| Graduate Degree | - | - |
| Total | $17,354 | $19,229 |
Family Income in Salinas
Family Income Brackets in Salinas
According to the Salinas family income data, there are 248 families falling into the less than $10,000 income range, which is the most common income bracket and makes up 22.5% of all families.
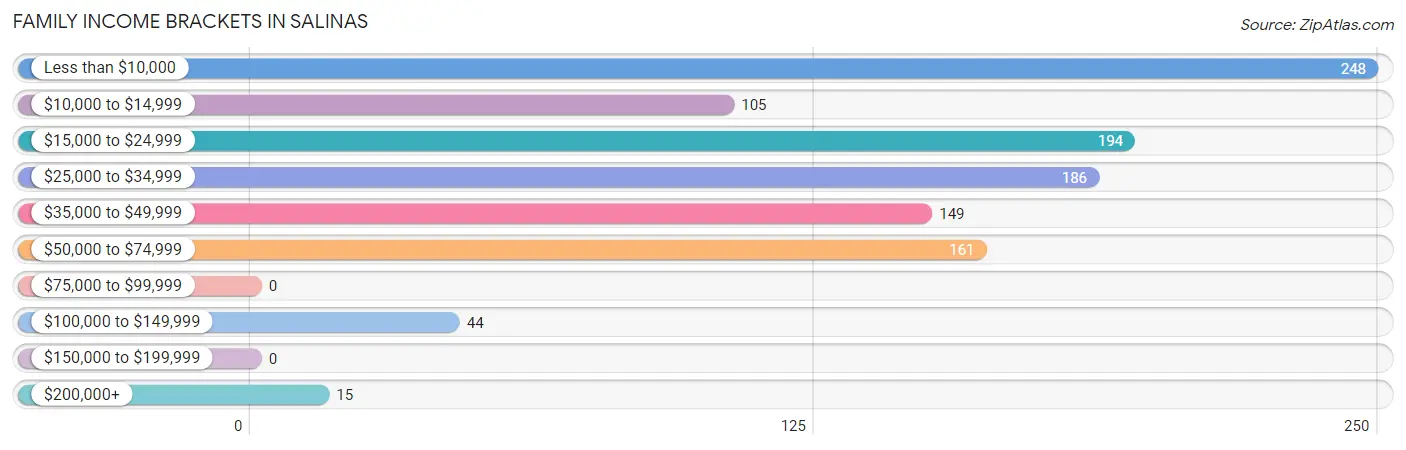
| Income Bracket | # Families | % Families |
| Less than $10,000 | 248 | 22.5% |
| $10,000 to $14,999 | 105 | 9.5% |
| $15,000 to $24,999 | 194 | 17.6% |
| $25,000 to $34,999 | 186 | 16.9% |
| $35,000 to $49,999 | 149 | 13.5% |
| $50,000 to $74,999 | 161 | 14.6% |
| $75,000 to $99,999 | 0 | 0.0% |
| $100,000 to $149,999 | 44 | 4.0% |
| $150,000 to $199,999 | 0 | 0.0% |
| $200,000+ | 15 | 1.4% |
Family Income by Famaliy Size in Salinas
3-person families (329 | 29.8%) account for the highest median family income in Salinas with $31,078 per family, while 2-person families (647 | 58.7%) have the highest median income of $12,630 per family member.
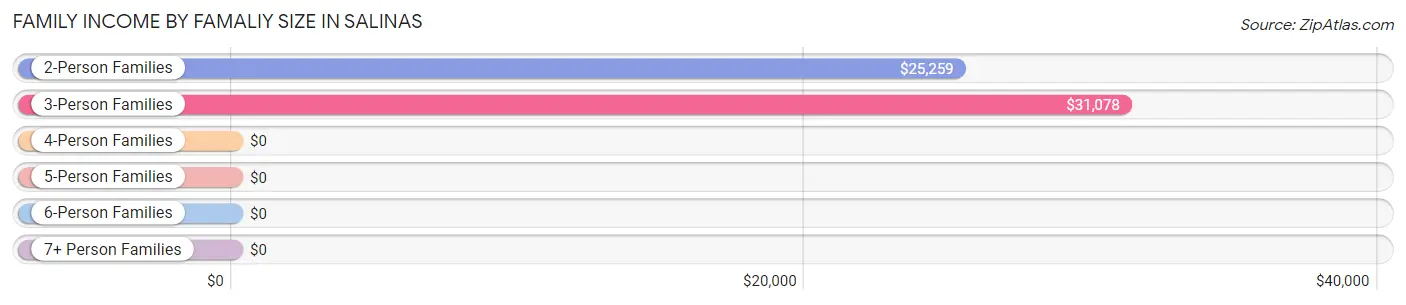
| Income Bracket | # Families | Median Income |
| 2-Person Families | 647 (58.7%) | $25,259 |
| 3-Person Families | 329 (29.8%) | $31,078 |
| 4-Person Families | 86 (7.8%) | $0 |
| 5-Person Families | 29 (2.6%) | $0 |
| 6-Person Families | 11 (1.0%) | $0 |
| 7+ Person Families | 0 (0.0%) | $0 |
| Total | 1,102 (100.0%) | $25,112 |
Family Income by Number of Earners in Salinas
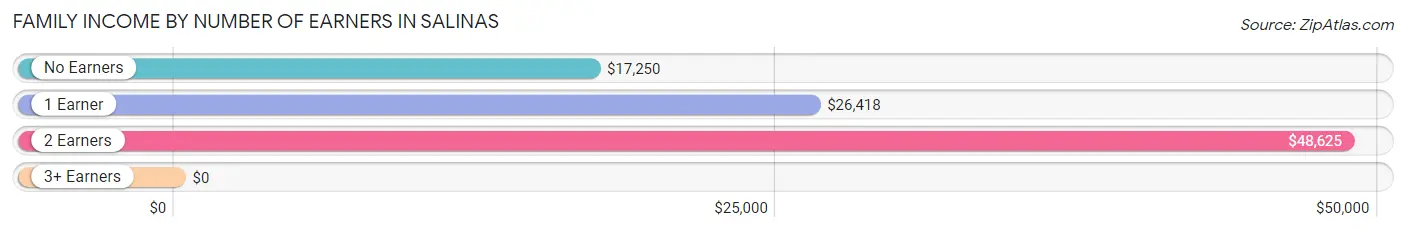
| Number of Earners | # Families | Median Income |
| No Earners | 526 (47.7%) | $17,250 |
| 1 Earner | 407 (36.9%) | $26,418 |
| 2 Earners | 169 (15.3%) | $48,625 |
| 3+ Earners | 0 (0.0%) | $0 |
| Total | 1,102 (100.0%) | $25,112 |
Household Income in Salinas
Household Income Brackets in Salinas
With 457 households falling in the category, the less than $10,000 income range is the most frequent in Salinas, accounting for 26.3% of all households. In contrast, only 16 households (0.9%) fall into the $200,000+ income bracket, making it the least populous group.
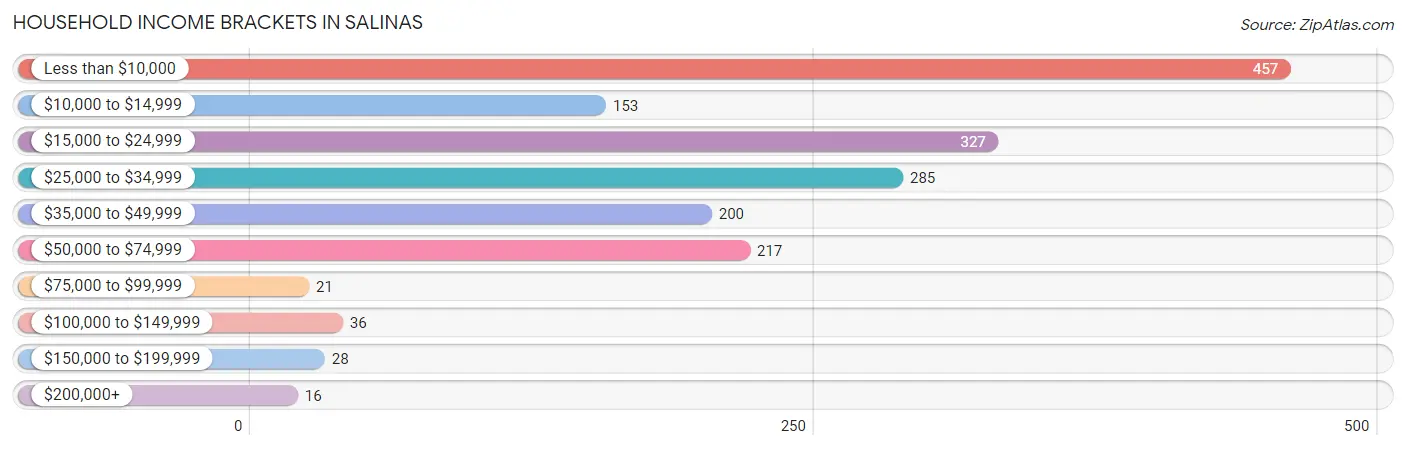
| Income Bracket | # Households | % Households |
| Less than $10,000 | 457 | 26.3% |
| $10,000 to $14,999 | 153 | 8.8% |
| $15,000 to $24,999 | 327 | 18.8% |
| $25,000 to $34,999 | 285 | 16.4% |
| $35,000 to $49,999 | 200 | 11.5% |
| $50,000 to $74,999 | 217 | 12.5% |
| $75,000 to $99,999 | 21 | 1.2% |
| $100,000 to $149,999 | 36 | 2.1% |
| $150,000 to $199,999 | 28 | 1.6% |
| $200,000+ | 16 | 0.9% |
Household Income by Householder Age in Salinas
The median household income in Salinas is $21,023, with the highest median household income of $26,129 found in the 45 to 64 years age bracket for the primary householder. A total of 528 households (30.4%) fall into this category. Meanwhile, the 15 to 24 years age bracket for the primary householder has the lowest median household income of $0, with 11 households (0.6%) in this group.
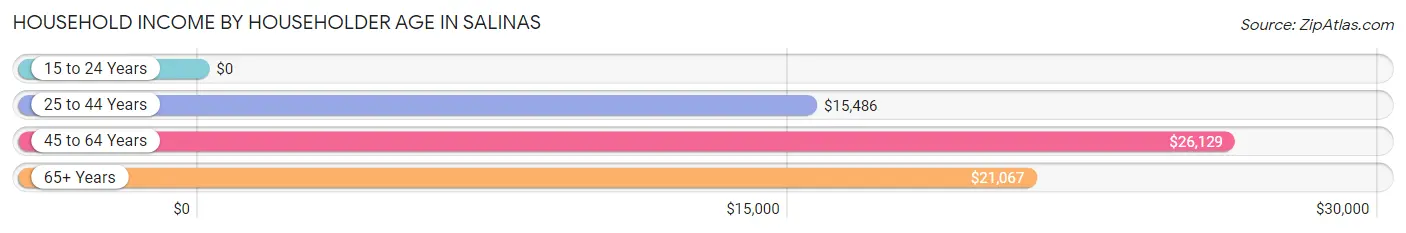
| Income Bracket | # Households | Median Income |
| 15 to 24 Years | 11 (0.6%) | $0 |
| 25 to 44 Years | 342 (19.7%) | $15,486 |
| 45 to 64 Years | 528 (30.4%) | $26,129 |
| 65+ Years | 857 (49.3%) | $21,067 |
| Total | 1,738 (100.0%) | $21,023 |
Poverty in Salinas
Income Below Poverty by Sex and Age in Salinas
With 44.1% poverty level for males and 47.1% for females among the residents of Salinas, 5 year old males and under 5 year old females are the most vulnerable to poverty, with 33 males (100.0%) and 72 females (100.0%) in their respective age groups living below the poverty level.
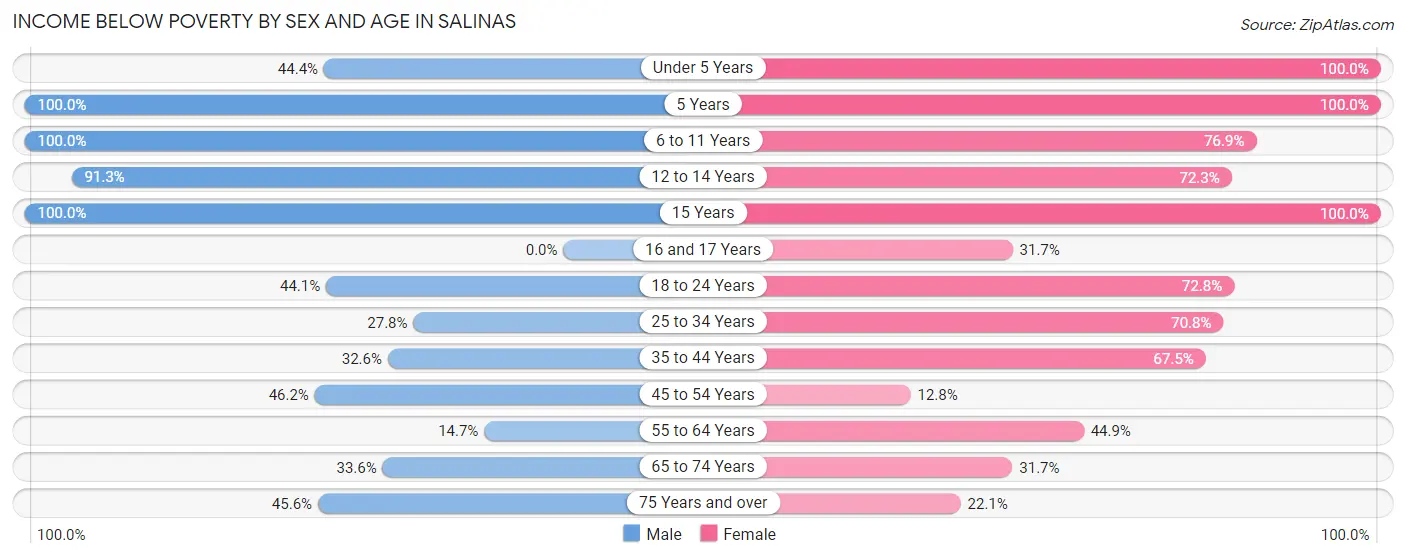
| Age Bracket | Male | Female |
| Under 5 Years | 40 (44.4%) | 72 (100.0%) |
| 5 Years | 33 (100.0%) | 18 (100.0%) |
| 6 to 11 Years | 113 (100.0%) | 110 (76.9%) |
| 12 to 14 Years | 84 (91.3%) | 68 (72.3%) |
| 15 Years | 41 (100.0%) | 13 (100.0%) |
| 16 and 17 Years | 0 (0.0%) | 13 (31.7%) |
| 18 to 24 Years | 37 (44.1%) | 91 (72.8%) |
| 25 to 34 Years | 49 (27.8%) | 211 (70.8%) |
| 35 to 44 Years | 102 (32.6%) | 131 (67.5%) |
| 45 to 54 Years | 126 (46.2%) | 25 (12.8%) |
| 55 to 64 Years | 31 (14.7%) | 154 (44.9%) |
| 65 to 74 Years | 98 (33.6%) | 145 (31.7%) |
| 75 Years and over | 82 (45.6%) | 97 (22.1%) |
| Total | 836 (44.1%) | 1,148 (47.1%) |
Income Above Poverty by Sex and Age in Salinas
According to the poverty statistics in Salinas, males aged 55 to 64 years and females aged 45 to 54 years are the age groups that are most secure financially, with 85.3% of males and 87.2% of females in these age groups living above the poverty line.
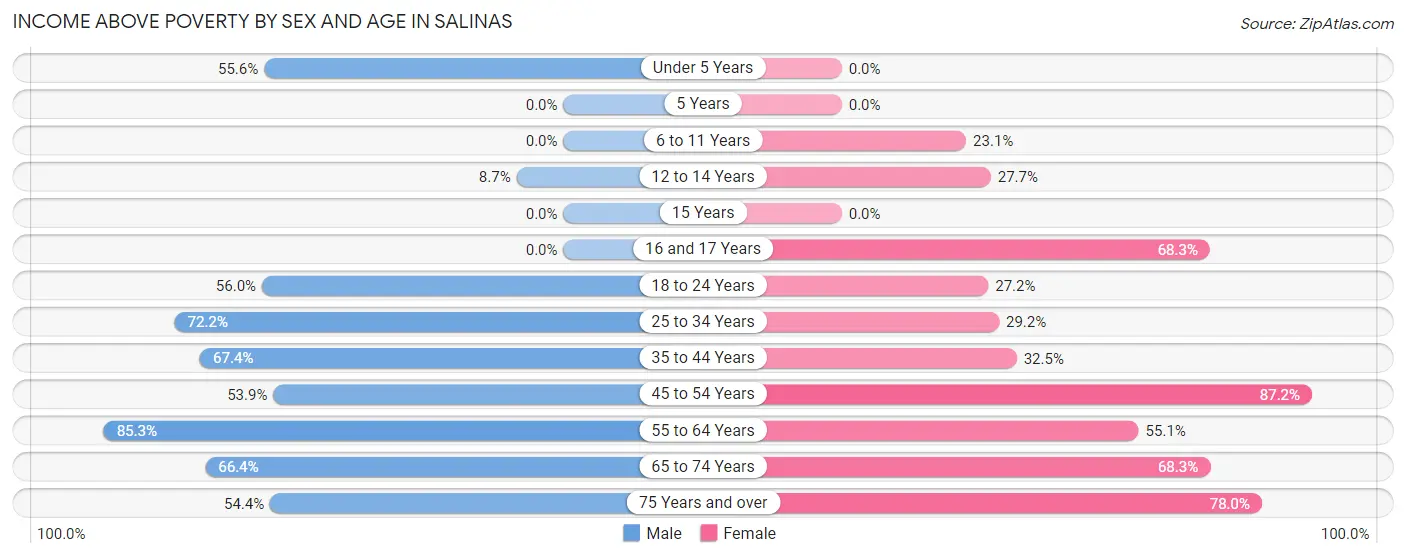
| Age Bracket | Male | Female |
| Under 5 Years | 50 (55.6%) | 0 (0.0%) |
| 5 Years | 0 (0.0%) | 0 (0.0%) |
| 6 to 11 Years | 0 (0.0%) | 33 (23.1%) |
| 12 to 14 Years | 8 (8.7%) | 26 (27.7%) |
| 15 Years | 0 (0.0%) | 0 (0.0%) |
| 16 and 17 Years | 0 (0.0%) | 28 (68.3%) |
| 18 to 24 Years | 47 (55.9%) | 34 (27.2%) |
| 25 to 34 Years | 127 (72.2%) | 87 (29.2%) |
| 35 to 44 Years | 211 (67.4%) | 63 (32.5%) |
| 45 to 54 Years | 147 (53.8%) | 171 (87.2%) |
| 55 to 64 Years | 180 (85.3%) | 189 (55.1%) |
| 65 to 74 Years | 194 (66.4%) | 313 (68.3%) |
| 75 Years and over | 98 (54.4%) | 343 (77.9%) |
| Total | 1,062 (55.9%) | 1,287 (52.8%) |
Income Below Poverty Among Married-Couple Families in Salinas
The poverty statistics for married-couple families in Salinas show that 20.9% or 105 of the total 502 families live below the poverty line. Families with no children have the highest poverty rate of 21.0%, comprising of 94 families. On the other hand, families with 1 or 2 children have the lowest poverty rate of 20.0%, which includes 11 families.
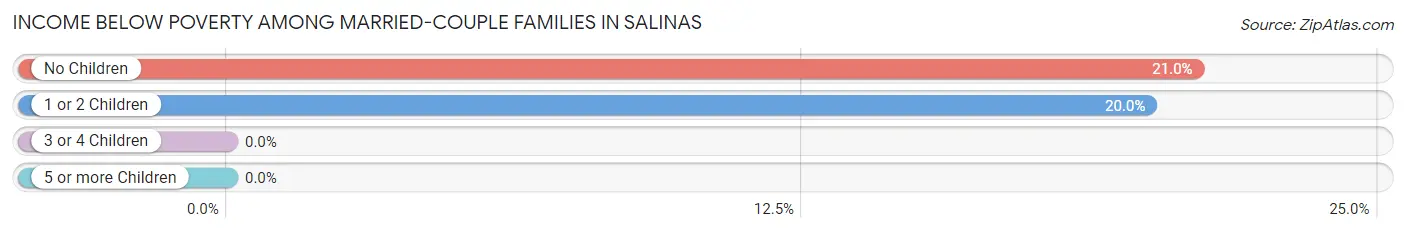
| Children | Above Poverty | Below Poverty |
| No Children | 353 (79.0%) | 94 (21.0%) |
| 1 or 2 Children | 44 (80.0%) | 11 (20.0%) |
| 3 or 4 Children | 0 (0.0%) | 0 (0.0%) |
| 5 or more Children | 0 (0.0%) | 0 (0.0%) |
| Total | 397 (79.1%) | 105 (20.9%) |
Income Below Poverty Among Single-Parent Households in Salinas
According to the poverty data in Salinas, 71.7% or 114 single-father households and 55.3% or 244 single-mother households are living below the poverty line. Among single-father households, those with 1 or 2 children have the highest poverty rate, with 66 households (100.0%) experiencing poverty. Likewise, among single-mother households, those with 3 or 4 children have the highest poverty rate, with 34 households (100.0%) falling below the poverty line.
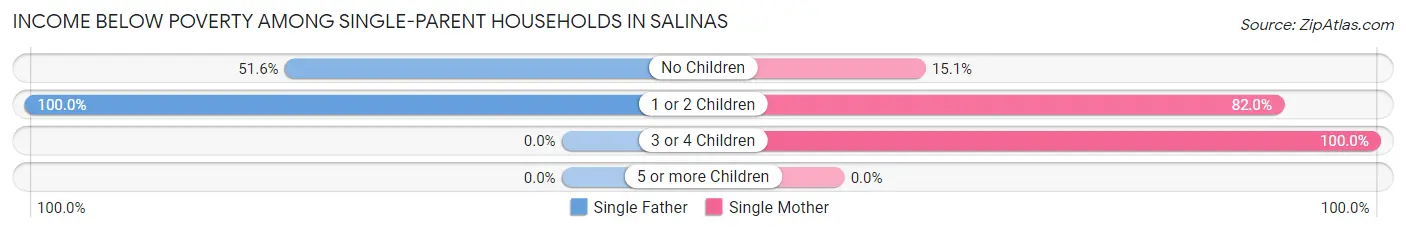
| Children | Single Father | Single Mother |
| No Children | 48 (51.6%) | 28 (15.1%) |
| 1 or 2 Children | 66 (100.0%) | 182 (82.0%) |
| 3 or 4 Children | 0 (0.0%) | 34 (100.0%) |
| 5 or more Children | 0 (0.0%) | 0 (0.0%) |
| Total | 114 (71.7%) | 244 (55.3%) |
Income Below Poverty Among Married-Couple vs Single-Parent Households in Salinas
The poverty data for Salinas shows that 105 of the married-couple family households (20.9%) and 358 of the single-parent households (59.7%) are living below the poverty level. Within the married-couple family households, those with no children have the highest poverty rate, with 94 households (21.0%) falling below the poverty line. Among the single-parent households, those with 3 or 4 children have the highest poverty rate, with 34 household (100.0%) living below poverty.
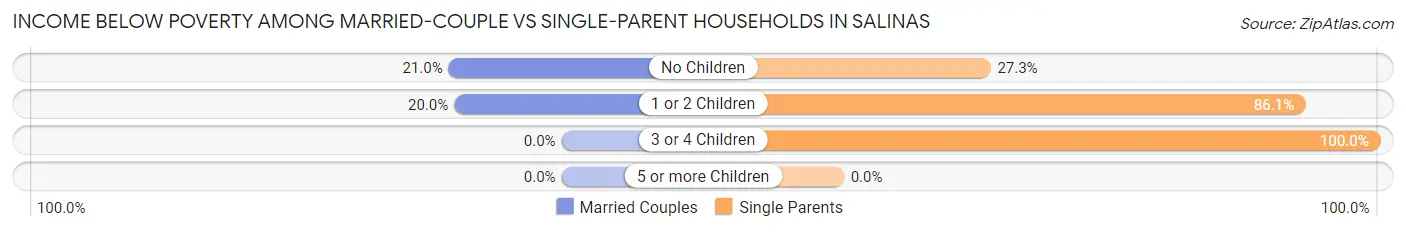
| Children | Married-Couple Families | Single-Parent Households |
| No Children | 94 (21.0%) | 76 (27.3%) |
| 1 or 2 Children | 11 (20.0%) | 248 (86.1%) |
| 3 or 4 Children | 0 (0.0%) | 34 (100.0%) |
| 5 or more Children | 0 (0.0%) | 0 (0.0%) |
| Total | 105 (20.9%) | 358 (59.7%) |
Race in Salinas
The most populous races in Salinas are Hispanic or Latino (4,338 | 99.5%), Two or more Races (1,831 | 42.0%), and White / Caucasian (1,346 | 30.9%).
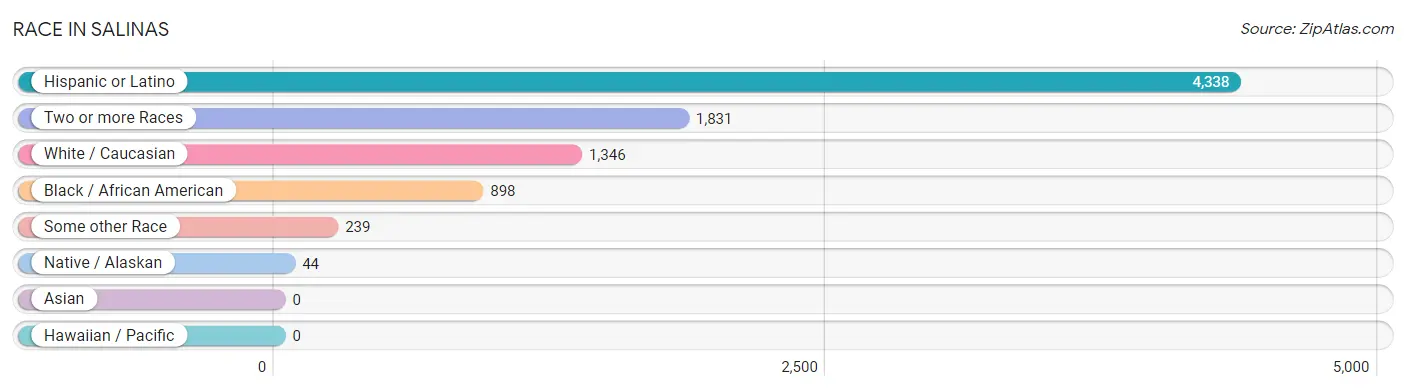
| Race | # Population | % Population |
| Asian | 0 | 0.0% |
| Black / African American | 898 | 20.6% |
| Hawaiian / Pacific | 0 | 0.0% |
| Hispanic or Latino | 4,338 | 99.5% |
| Native / Alaskan | 44 | 1.0% |
| White / Caucasian | 1,346 | 30.9% |
| Two or more Races | 1,831 | 42.0% |
| Some other Race | 239 | 5.5% |
| Total | 4,358 | 100.0% |
Ancestry in Salinas
The most populous ancestries reported in Salinas are Puerto Rican (4,330 | 99.4%), American (75 | 1.7%), Central American Indian (44 | 1.0%), Arab (20 | 0.5%), and Central American (8 | 0.2%), together accounting for 102.7% of all Salinas residents.
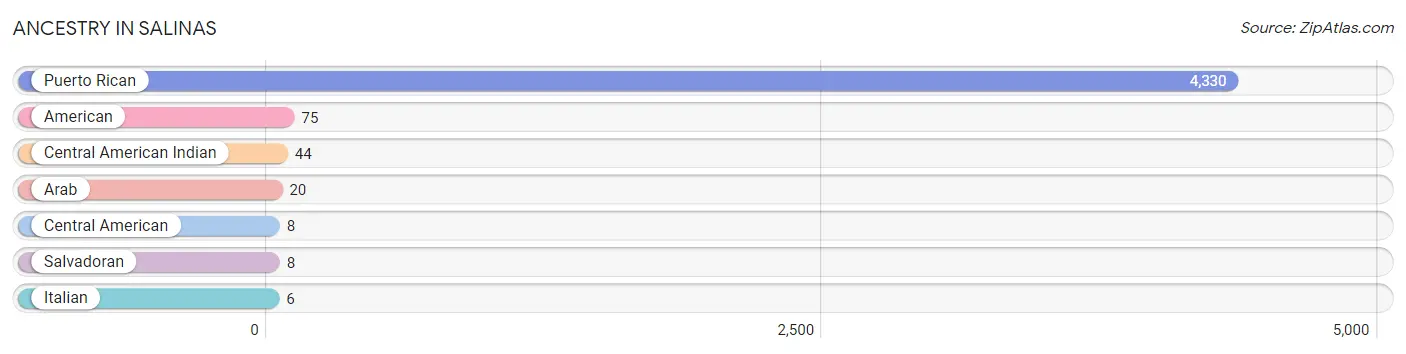
| Ancestry | # Population | % Population |
| American | 75 | 1.7% |
| Arab | 20 | 0.5% |
| Central American | 8 | 0.2% |
| Central American Indian | 44 | 1.0% |
| Italian | 6 | 0.1% |
| Puerto Rican | 4,330 | 99.4% |
| Salvadoran | 8 | 0.2% | View All 7 Rows |
Immigrants in Salinas

| Immigration Origin | # Population | % Population | View All 0 Rows |
Sex and Age in Salinas
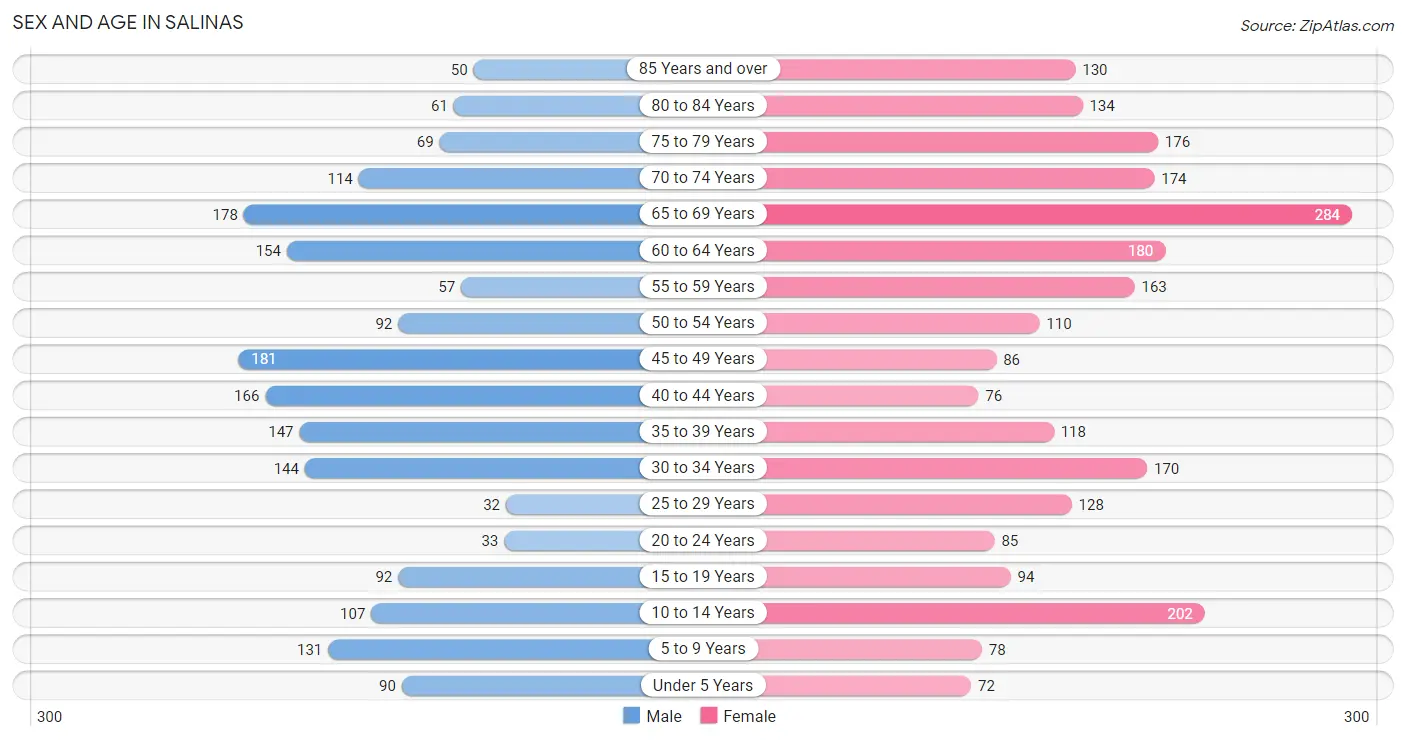
Sex and Age in Salinas
The most populous age groups in Salinas are 45 to 49 Years (181 | 9.5%) for men and 65 to 69 Years (284 | 11.5%) for women.
| Age Bracket | Male | Female |
| Under 5 Years | 90 (4.7%) | 72 (2.9%) |
| 5 to 9 Years | 131 (6.9%) | 78 (3.2%) |
| 10 to 14 Years | 107 (5.6%) | 202 (8.2%) |
| 15 to 19 Years | 92 (4.9%) | 94 (3.8%) |
| 20 to 24 Years | 33 (1.7%) | 85 (3.5%) |
| 25 to 29 Years | 32 (1.7%) | 128 (5.2%) |
| 30 to 34 Years | 144 (7.6%) | 170 (6.9%) |
| 35 to 39 Years | 147 (7.7%) | 118 (4.8%) |
| 40 to 44 Years | 166 (8.7%) | 76 (3.1%) |
| 45 to 49 Years | 181 (9.5%) | 86 (3.5%) |
| 50 to 54 Years | 92 (4.9%) | 110 (4.5%) |
| 55 to 59 Years | 57 (3.0%) | 163 (6.6%) |
| 60 to 64 Years | 154 (8.1%) | 180 (7.3%) |
| 65 to 69 Years | 178 (9.4%) | 284 (11.5%) |
| 70 to 74 Years | 114 (6.0%) | 174 (7.1%) |
| 75 to 79 Years | 69 (3.6%) | 176 (7.1%) |
| 80 to 84 Years | 61 (3.2%) | 134 (5.4%) |
| 85 Years and over | 50 (2.6%) | 130 (5.3%) |
| Total | 1,898 (100.0%) | 2,460 (100.0%) |
Families and Households in Salinas
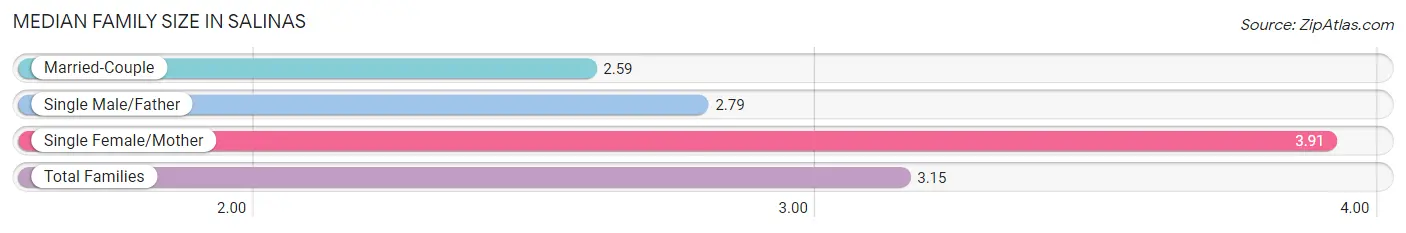
Median Family Size in Salinas
The median family size in Salinas is 3.15 persons per family, with single female/mother families (441 | 40.0%) accounting for the largest median family size of 3.91 persons per family. On the other hand, married-couple families (502 | 45.6%) represent the smallest median family size with 2.59 persons per family.
| Family Type | # Families | Family Size |
| Married-Couple | 502 (45.6%) | 2.59 |
| Single Male/Father | 159 (14.4%) | 2.79 |
| Single Female/Mother | 441 (40.0%) | 3.91 |
| Total Families | 1,102 (100.0%) | 3.15 |
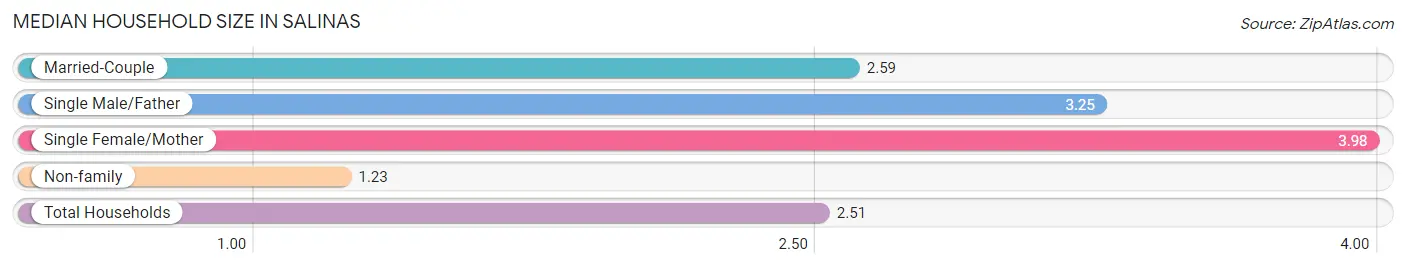
Median Household Size in Salinas
The median household size in Salinas is 2.51 persons per household, with single female/mother households (441 | 25.4%) accounting for the largest median household size of 3.98 persons per household. non-family households (636 | 36.6%) represent the smallest median household size with 1.23 persons per household.
| Household Type | # Households | Household Size |
| Married-Couple | 502 (28.9%) | 2.59 |
| Single Male/Father | 159 (9.1%) | 3.25 |
| Single Female/Mother | 441 (25.4%) | 3.98 |
| Non-family | 636 (36.6%) | 1.23 |
| Total Households | 1,738 (100.0%) | 2.51 |
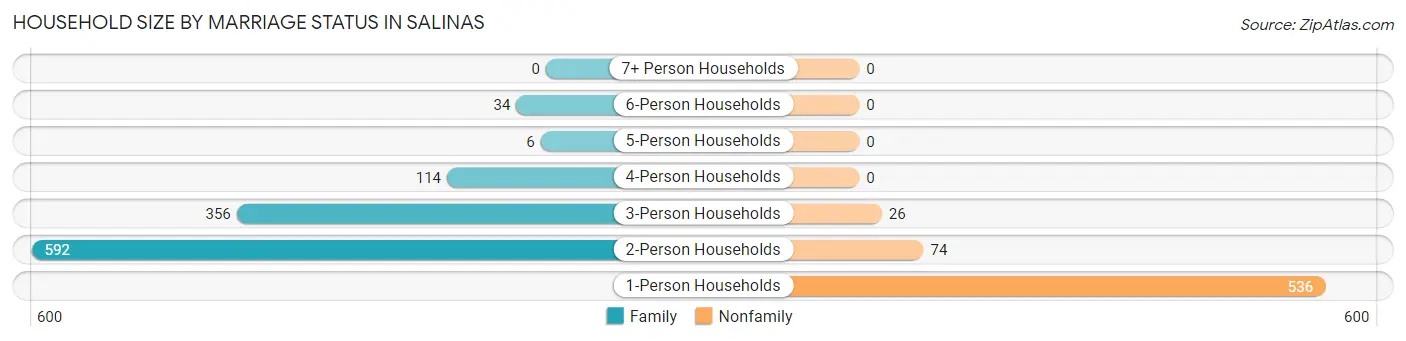
Household Size by Marriage Status in Salinas
Out of a total of 1,738 households in Salinas, 1,102 (63.4%) are family households, while 636 (36.6%) are nonfamily households. The most numerous type of family households are 2-person households, comprising 592, and the most common type of nonfamily households are 1-person households, comprising 536.
| Household Size | Family Households | Nonfamily Households |
| 1-Person Households | - | 536 (30.8%) |
| 2-Person Households | 592 (34.1%) | 74 (4.3%) |
| 3-Person Households | 356 (20.5%) | 26 (1.5%) |
| 4-Person Households | 114 (6.6%) | 0 (0.0%) |
| 5-Person Households | 6 (0.4%) | 0 (0.0%) |
| 6-Person Households | 34 (2.0%) | 0 (0.0%) |
| 7+ Person Households | 0 (0.0%) | 0 (0.0%) |
| Total | 1,102 (63.4%) | 636 (36.6%) |
Female Fertility in Salinas
Fertility by Age in Salinas
Average fertility rate in Salinas is 28.0 births per 1,000 women. Women in the age bracket of 20 to 34 years have the highest fertility rate with 57.0 births per 1,000 women. Women in the age bracket of 20 to 34 years acount for 100.0% of all women with births.
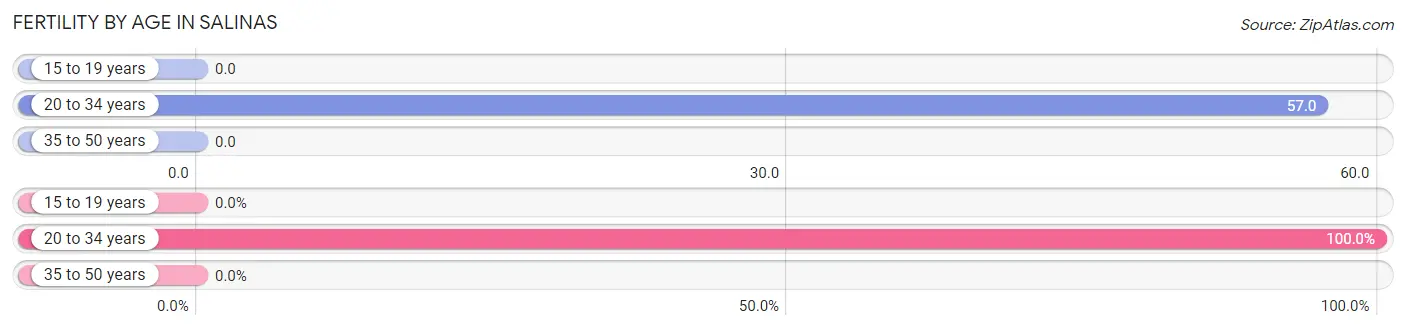
| Age Bracket | Women with Births | Births / 1,000 Women |
| 15 to 19 years | 0 (0.0%) | 0.0 |
| 20 to 34 years | 22 (100.0%) | 57.0 |
| 35 to 50 years | 0 (0.0%) | 0.0 |
| Total | 22 (100.0%) | 28.0 |
Fertility by Age by Marriage Status in Salinas
50.0% of women with births (22) in Salinas are married. The highest percentage of unmarried women with births falls into 20 to 34 years age bracket with 50.0% of them unmarried at the time of birth, while the lowest percentage of unmarried women with births belong to 20 to 34 years age bracket with 50.0% of them unmarried.
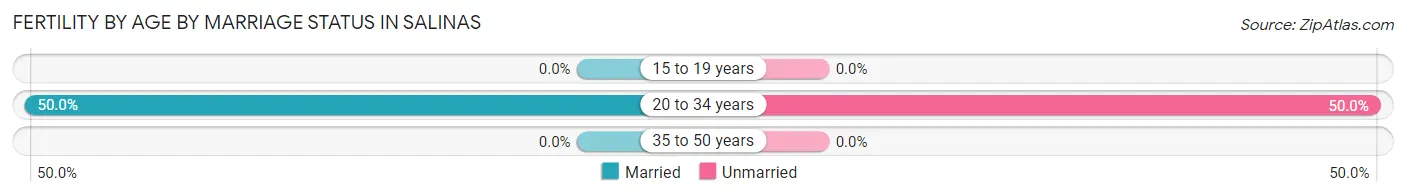
| Age Bracket | Married | Unmarried |
| 15 to 19 years | 0 (0.0%) | 0 (0.0%) |
| 20 to 34 years | 11 (50.0%) | 11 (50.0%) |
| 35 to 50 years | 0 (0.0%) | 0 (0.0%) |
| Total | 11 (50.0%) | 11 (50.0%) |
Fertility by Education in Salinas
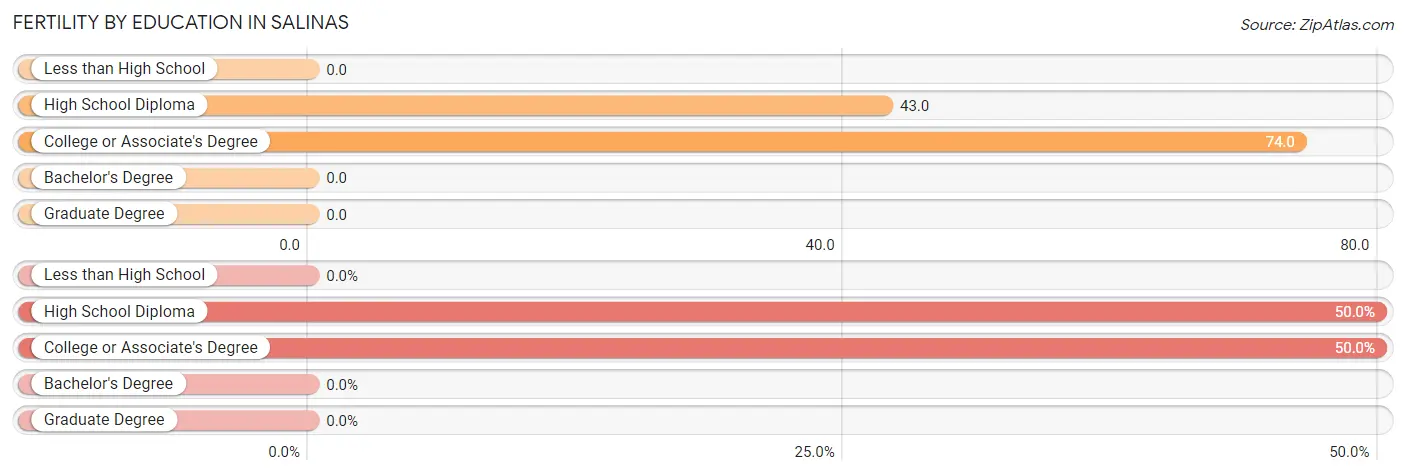
| Educational Attainment | Women with Births | Births / 1,000 Women |
| Less than High School | 0 (0.0%) | 0.0 |
| High School Diploma | 11 (50.0%) | 43.0 |
| College or Associate's Degree | 11 (50.0%) | 74.0 |
| Bachelor's Degree | 0 (0.0%) | 0.0 |
| Graduate Degree | 0 (0.0%) | 0.0 |
| Total | 22 (100.0%) | 28.0 |
Fertility by Education by Marriage Status in Salinas
50.0% of women with births in Salinas are unmarried. Women with the educational attainment of college or associate's degree are most likely to be married with 100.0% of them married at childbirth, while women with the educational attainment of high school diploma are least likely to be married with 100.0% of them unmarried at childbirth.
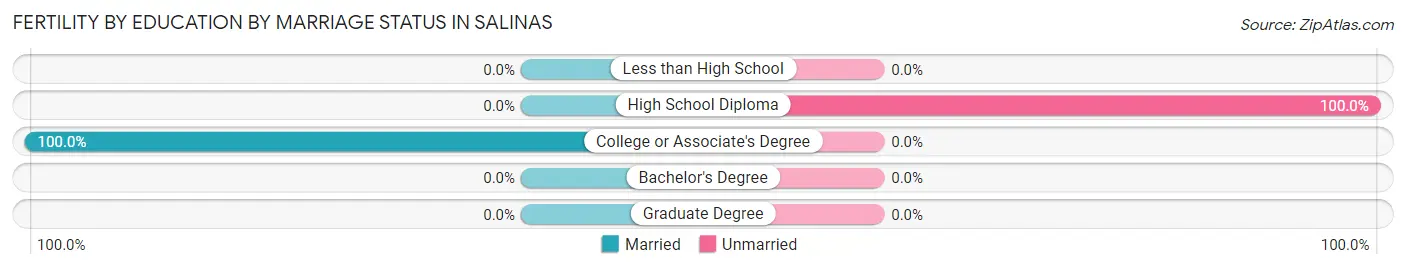
| Educational Attainment | Married | Unmarried |
| Less than High School | 0 (0.0%) | 0 (0.0%) |
| High School Diploma | 0 (0.0%) | 11 (100.0%) |
| College or Associate's Degree | 11 (100.0%) | 0 (0.0%) |
| Bachelor's Degree | 0 (0.0%) | 0 (0.0%) |
| Graduate Degree | 0 (0.0%) | 0 (0.0%) |
| Total | 11 (50.0%) | 11 (50.0%) |
Employment Characteristics in Salinas
Employment by Class of Employer in Salinas
Among the 1,040 employed individuals in Salinas, private company employees (642 | 61.7%), state government employees (150 | 14.4%), and self-employed (not incorporated) (117 | 11.3%) make up the most common classes of employment.
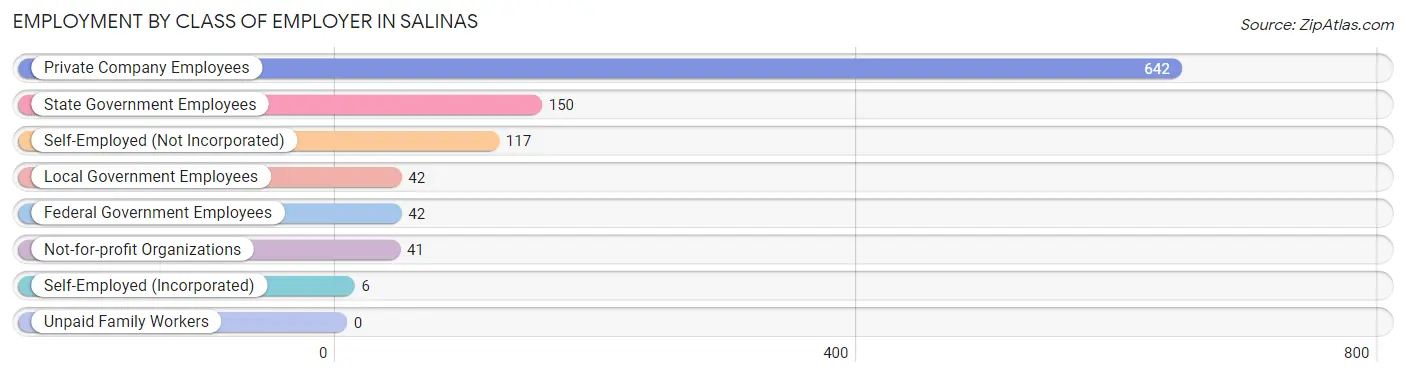
| Employer Class | # Employees | % Employees |
| Private Company Employees | 642 | 61.7% |
| Self-Employed (Incorporated) | 6 | 0.6% |
| Self-Employed (Not Incorporated) | 117 | 11.3% |
| Not-for-profit Organizations | 41 | 3.9% |
| Local Government Employees | 42 | 4.0% |
| State Government Employees | 150 | 14.4% |
| Federal Government Employees | 42 | 4.0% |
| Unpaid Family Workers | 0 | 0.0% |
| Total | 1,040 | 100.0% |
Employment Status by Age in Salinas
According to the labor force statistics for Salinas, out of the total population over 16 years of age (3,624), 32.8% or 1,189 individuals are in the labor force, with 2.1% or 25 of them unemployed. The age group with the highest labor force participation rate is 30 to 34 years, with 72.6% or 228 individuals in the labor force. Within the labor force, the 20 to 24 years age range has the highest percentage of unemployed individuals, with 13.6% or 11 of them being unemployed.
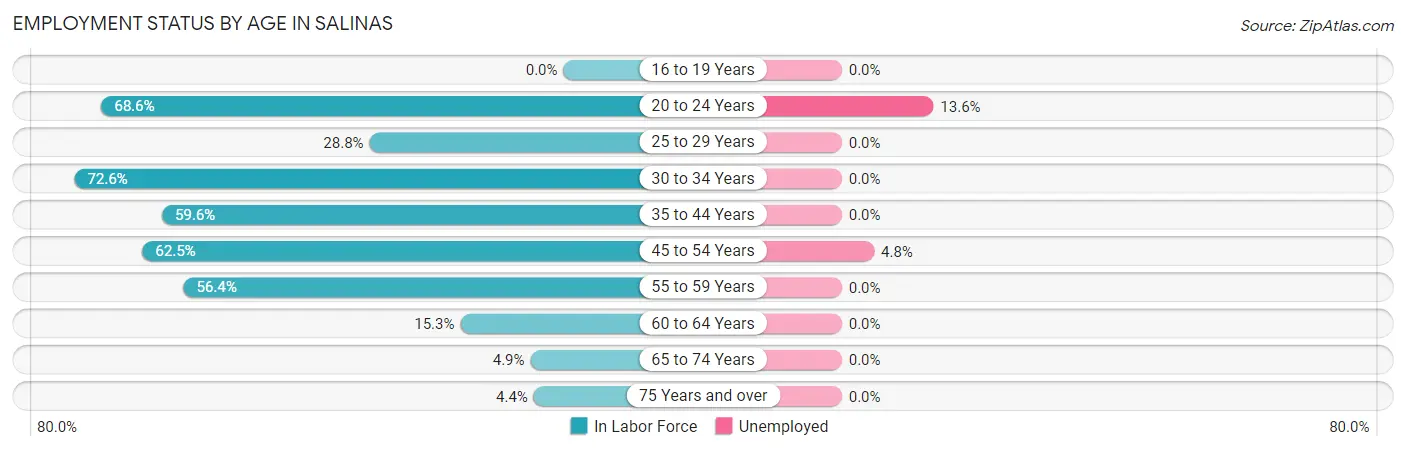
| Age Bracket | In Labor Force | Unemployed |
| 16 to 19 Years | 0 (0.0%) | 0 (0.0%) |
| 20 to 24 Years | 81 (68.6%) | 11 (13.6%) |
| 25 to 29 Years | 46 (28.8%) | 0 (0.0%) |
| 30 to 34 Years | 228 (72.6%) | 0 (0.0%) |
| 35 to 44 Years | 302 (59.6%) | 0 (0.0%) |
| 45 to 54 Years | 293 (62.5%) | 14 (4.8%) |
| 55 to 59 Years | 124 (56.4%) | 0 (0.0%) |
| 60 to 64 Years | 51 (15.3%) | 0 (0.0%) |
| 65 to 74 Years | 37 (4.9%) | 0 (0.0%) |
| 75 Years and over | 27 (4.4%) | 0 (0.0%) |
| Total | 1,189 (32.8%) | 25 (2.1%) |
Employment Status by Educational Attainment in Salinas
According to labor force statistics for Salinas, 52.1% of individuals (1,044) out of the total population between 25 and 64 years of age (2,004) are in the labor force, with 1.3% or 14 of them being unemployed. The group with the highest labor force participation rate are those with the educational attainment of bachelor's degree or higher, with 69.1% or 356 individuals in the labor force. Within the labor force, individuals with college / associate degree education have the highest percentage of unemployment, with 4.4% or 14 of them being unemployed.
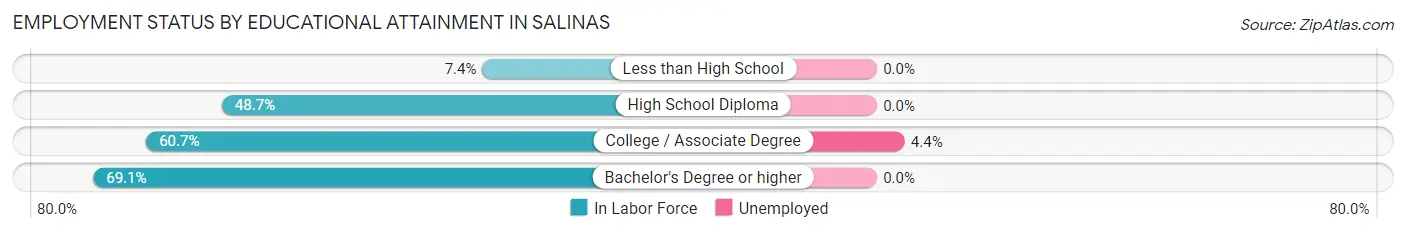
| Educational Attainment | In Labor Force | Unemployed |
| Less than High School | 18 (7.4%) | 0 (0.0%) |
| High School Diploma | 350 (48.7%) | 0 (0.0%) |
| College / Associate Degree | 320 (60.7%) | 23 (4.4%) |
| Bachelor's Degree or higher | 356 (69.1%) | 0 (0.0%) |
| Total | 1,044 (52.1%) | 26 (1.3%) |
Employment Occupations by Sex in Salinas
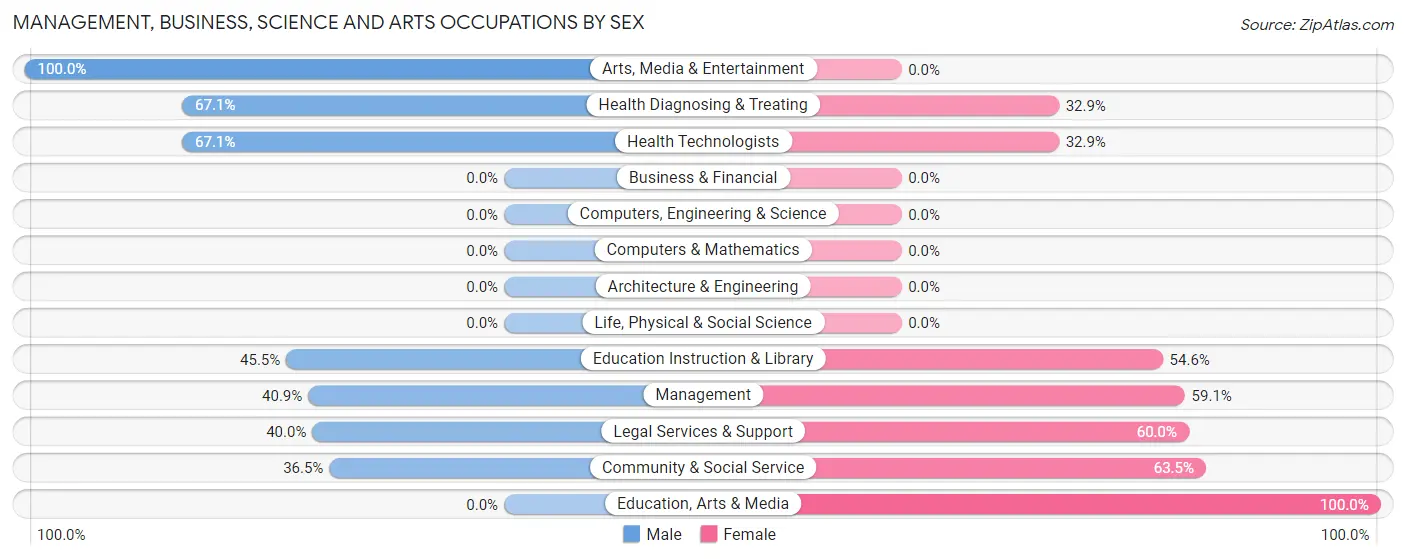
Management, Business, Science and Arts Occupations
The most common Management, Business, Science and Arts occupations in Salinas are Community & Social Service (96 | 8.3%), Management (93 | 8.0%), Health Diagnosing & Treating (70 | 6.0%), Health Technologists (70 | 6.0%), and Education, Arts & Media (40 | 3.4%).
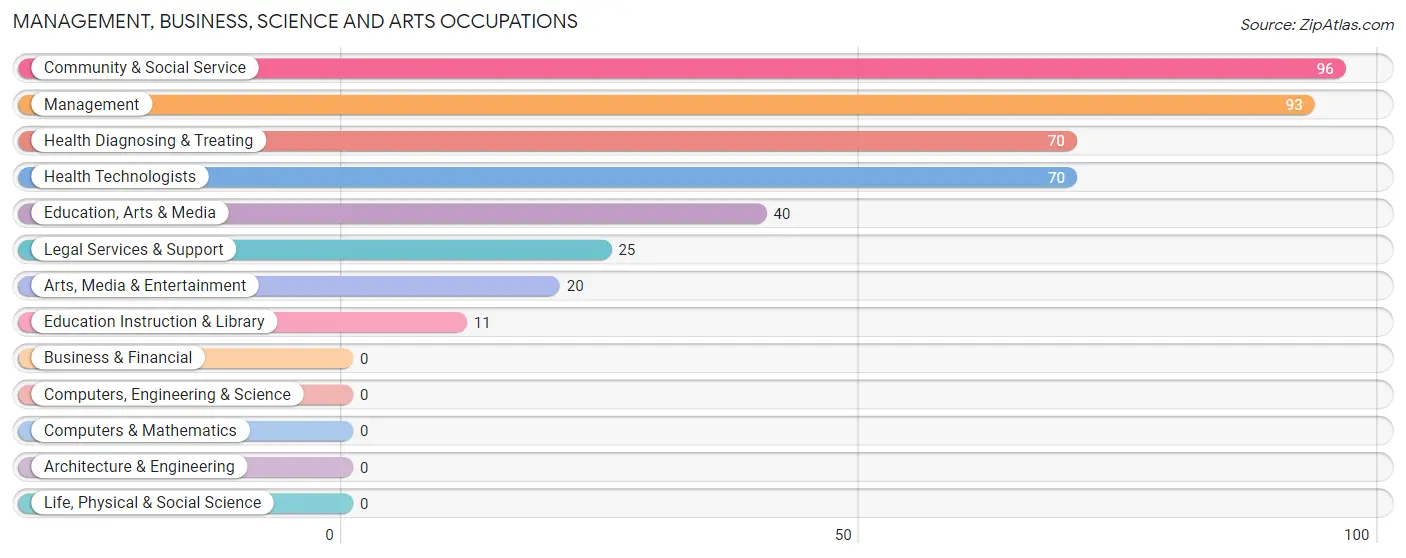
Management, Business, Science and Arts Occupations by Sex
Within the Management, Business, Science and Arts occupations in Salinas, the most male-oriented occupations are Arts, Media & Entertainment (100.0%), Health Diagnosing & Treating (67.1%), and Health Technologists (67.1%), while the most female-oriented occupations are Education, Arts & Media (100.0%), Community & Social Service (63.5%), and Legal Services & Support (60.0%).
| Occupation | Male | Female |
| Management | 38 (40.9%) | 55 (59.1%) |
| Business & Financial | 0 (0.0%) | 0 (0.0%) |
| Computers, Engineering & Science | 0 (0.0%) | 0 (0.0%) |
| Computers & Mathematics | 0 (0.0%) | 0 (0.0%) |
| Architecture & Engineering | 0 (0.0%) | 0 (0.0%) |
| Life, Physical & Social Science | 0 (0.0%) | 0 (0.0%) |
| Community & Social Service | 35 (36.5%) | 61 (63.5%) |
| Education, Arts & Media | 0 (0.0%) | 40 (100.0%) |
| Legal Services & Support | 10 (40.0%) | 15 (60.0%) |
| Education Instruction & Library | 5 (45.5%) | 6 (54.5%) |
| Arts, Media & Entertainment | 20 (100.0%) | 0 (0.0%) |
| Health Diagnosing & Treating | 47 (67.1%) | 23 (32.9%) |
| Health Technologists | 47 (67.1%) | 23 (32.9%) |
| Total (Category) | 120 (46.3%) | 139 (53.7%) |
| Total (Overall) | 652 (56.0%) | 512 (44.0%) |
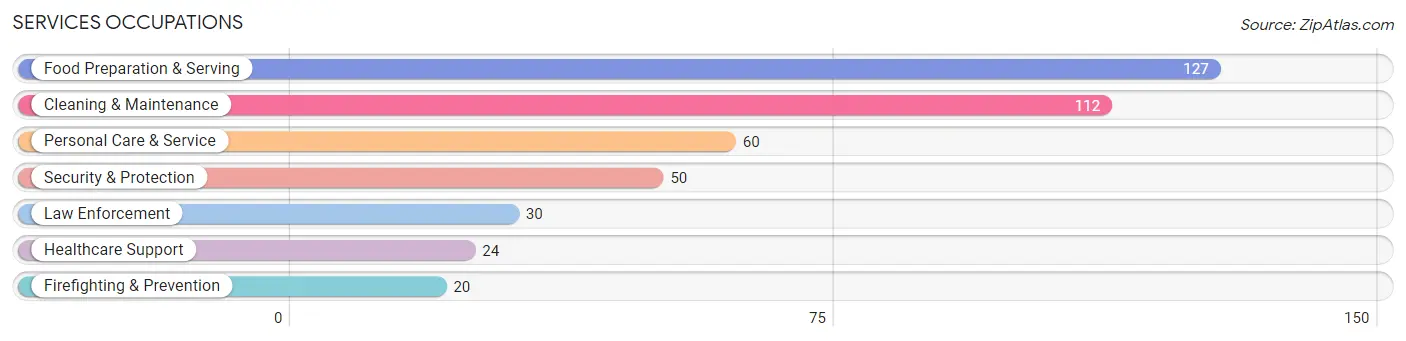
Services Occupations
The most common Services occupations in Salinas are Food Preparation & Serving (127 | 10.9%), Cleaning & Maintenance (112 | 9.6%), Personal Care & Service (60 | 5.1%), Security & Protection (50 | 4.3%), and Law Enforcement (30 | 2.6%).
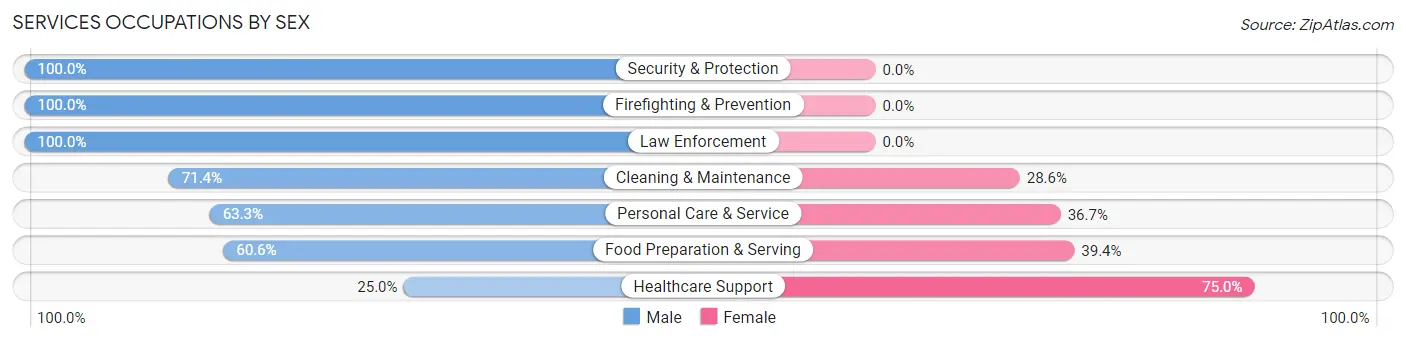
Services Occupations by Sex
Within the Services occupations in Salinas, the most male-oriented occupations are Security & Protection (100.0%), Firefighting & Prevention (100.0%), and Law Enforcement (100.0%), while the most female-oriented occupations are Healthcare Support (75.0%), Food Preparation & Serving (39.4%), and Personal Care & Service (36.7%).
| Occupation | Male | Female |
| Healthcare Support | 6 (25.0%) | 18 (75.0%) |
| Security & Protection | 50 (100.0%) | 0 (0.0%) |
| Firefighting & Prevention | 20 (100.0%) | 0 (0.0%) |
| Law Enforcement | 30 (100.0%) | 0 (0.0%) |
| Food Preparation & Serving | 77 (60.6%) | 50 (39.4%) |
| Cleaning & Maintenance | 80 (71.4%) | 32 (28.6%) |
| Personal Care & Service | 38 (63.3%) | 22 (36.7%) |
| Total (Category) | 251 (67.3%) | 122 (32.7%) |
| Total (Overall) | 652 (56.0%) | 512 (44.0%) |
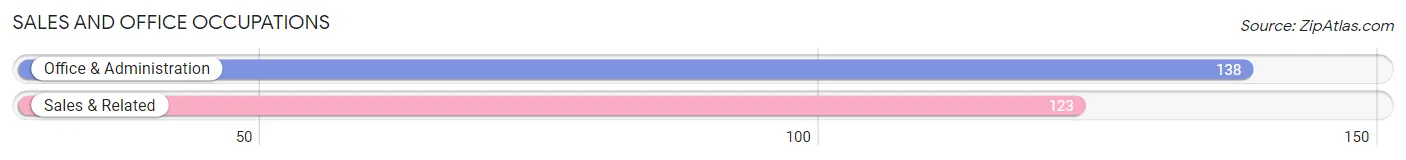
Sales and Office Occupations
The most common Sales and Office occupations in Salinas are Office & Administration (138 | 11.9%), and Sales & Related (123 | 10.6%).
Sales and Office Occupations by Sex
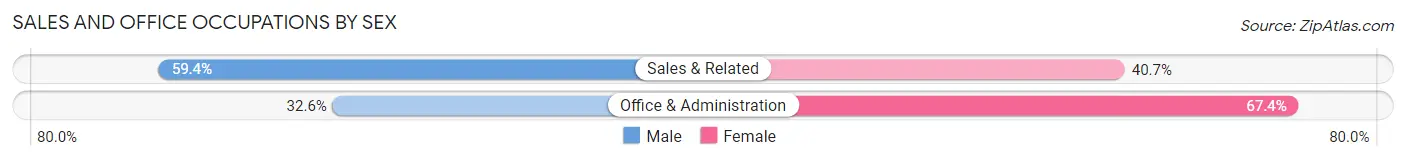
| Occupation | Male | Female |
| Sales & Related | 73 (59.4%) | 50 (40.6%) |
| Office & Administration | 45 (32.6%) | 93 (67.4%) |
| Total (Category) | 118 (45.2%) | 143 (54.8%) |
| Total (Overall) | 652 (56.0%) | 512 (44.0%) |
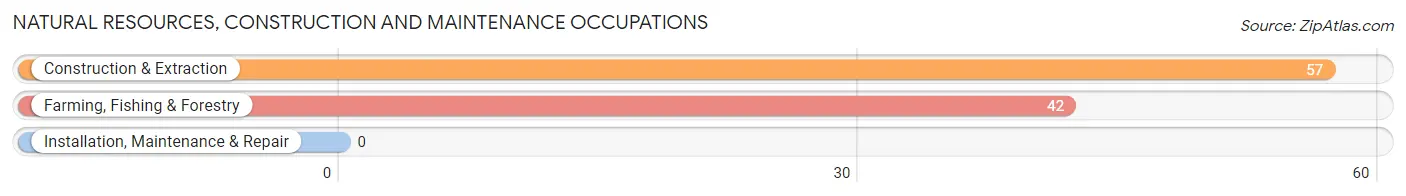
Natural Resources, Construction and Maintenance Occupations
The most common Natural Resources, Construction and Maintenance occupations in Salinas are Construction & Extraction (57 | 4.9%), and Farming, Fishing & Forestry (42 | 3.6%).
Natural Resources, Construction and Maintenance Occupations by Sex
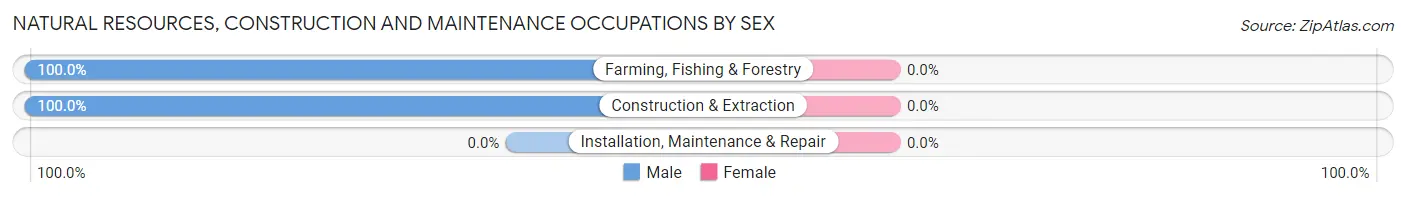
| Occupation | Male | Female |
| Farming, Fishing & Forestry | 42 (100.0%) | 0 (0.0%) |
| Construction & Extraction | 57 (100.0%) | 0 (0.0%) |
| Installation, Maintenance & Repair | 0 (0.0%) | 0 (0.0%) |
| Total (Category) | 99 (100.0%) | 0 (0.0%) |
| Total (Overall) | 652 (56.0%) | 512 (44.0%) |
Production, Transportation and Moving Occupations
The most common Production, Transportation and Moving occupations in Salinas are Production (117 | 10.1%), and Material Moving (55 | 4.7%).
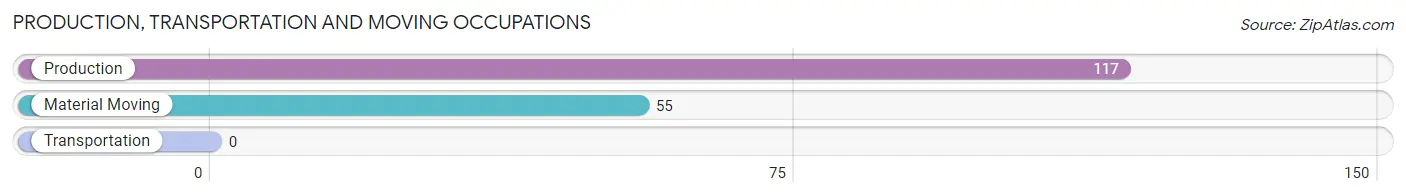
Production, Transportation and Moving Occupations by Sex
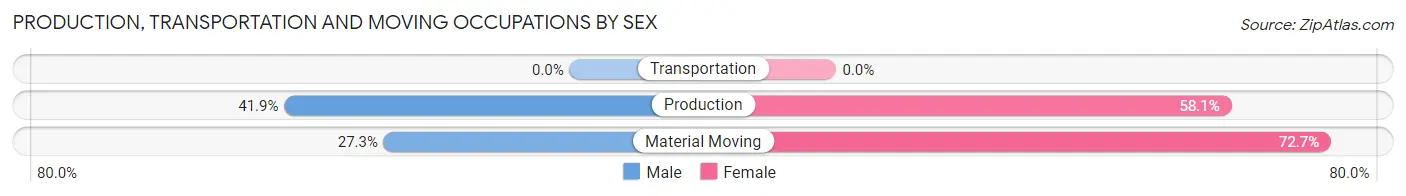
| Occupation | Male | Female |
| Production | 49 (41.9%) | 68 (58.1%) |
| Transportation | 0 (0.0%) | 0 (0.0%) |
| Material Moving | 15 (27.3%) | 40 (72.7%) |
| Total (Category) | 64 (37.2%) | 108 (62.8%) |
| Total (Overall) | 652 (56.0%) | 512 (44.0%) |
Employment Industries by Sex in Salinas
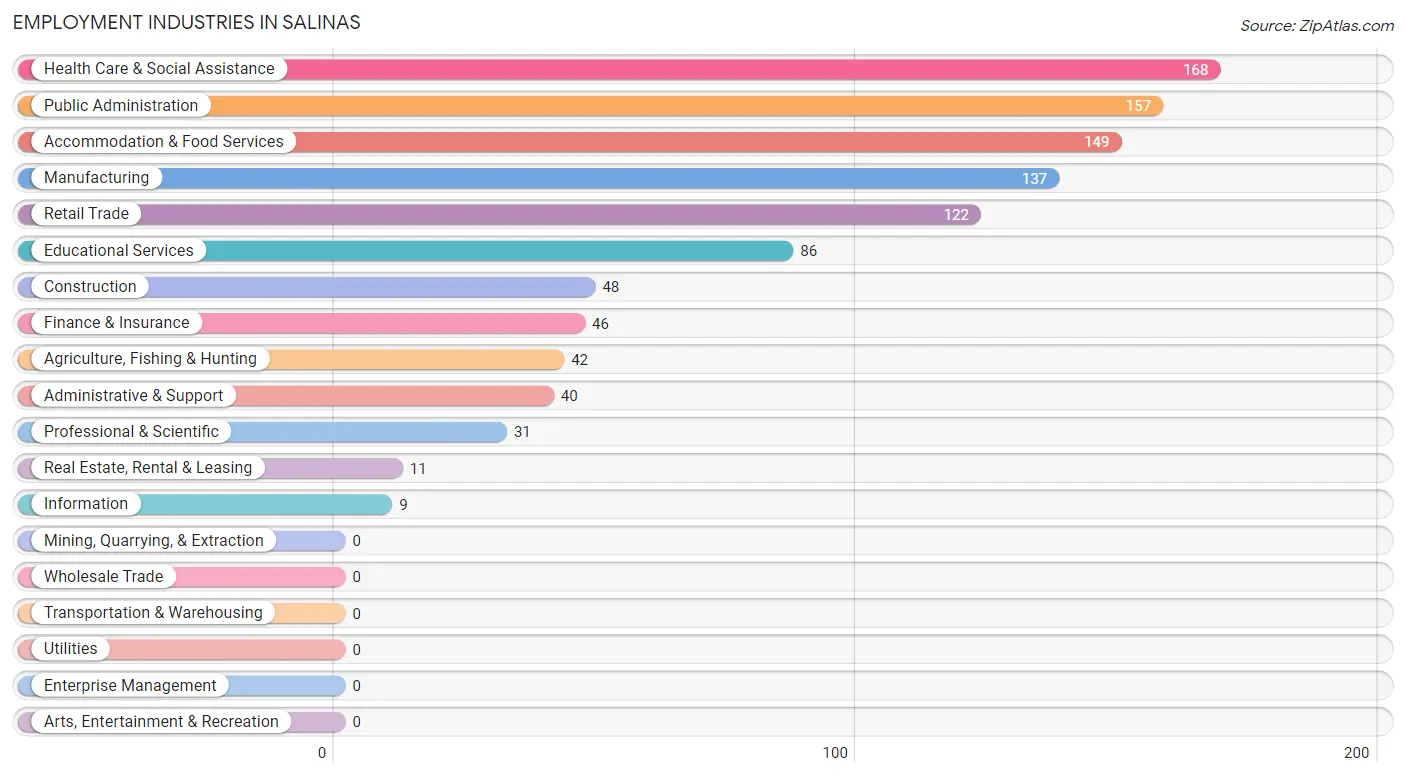
Employment Industries in Salinas
The major employment industries in Salinas include Health Care & Social Assistance (168 | 14.4%), Public Administration (157 | 13.5%), Accommodation & Food Services (149 | 12.8%), Manufacturing (137 | 11.8%), and Retail Trade (122 | 10.5%).
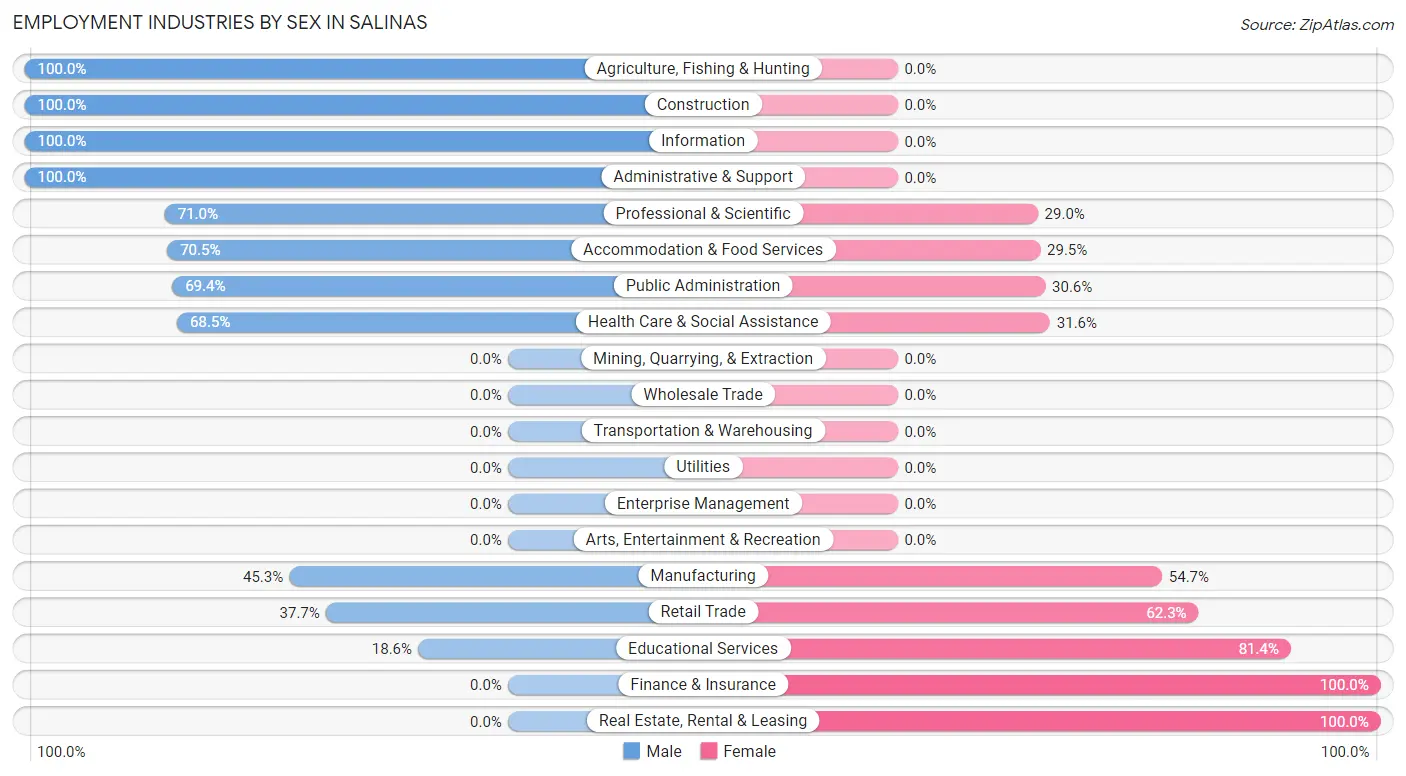
Employment Industries by Sex in Salinas
The Salinas industries that see more men than women are Agriculture, Fishing & Hunting (100.0%), Construction (100.0%), and Information (100.0%), whereas the industries that tend to have a higher number of women are Finance & Insurance (100.0%), Real Estate, Rental & Leasing (100.0%), and Educational Services (81.4%).
| Industry | Male | Female |
| Agriculture, Fishing & Hunting | 42 (100.0%) | 0 (0.0%) |
| Mining, Quarrying, & Extraction | 0 (0.0%) | 0 (0.0%) |
| Construction | 48 (100.0%) | 0 (0.0%) |
| Manufacturing | 62 (45.3%) | 75 (54.7%) |
| Wholesale Trade | 0 (0.0%) | 0 (0.0%) |
| Retail Trade | 46 (37.7%) | 76 (62.3%) |
| Transportation & Warehousing | 0 (0.0%) | 0 (0.0%) |
| Utilities | 0 (0.0%) | 0 (0.0%) |
| Information | 9 (100.0%) | 0 (0.0%) |
| Finance & Insurance | 0 (0.0%) | 46 (100.0%) |
| Real Estate, Rental & Leasing | 0 (0.0%) | 11 (100.0%) |
| Professional & Scientific | 22 (71.0%) | 9 (29.0%) |
| Enterprise Management | 0 (0.0%) | 0 (0.0%) |
| Administrative & Support | 40 (100.0%) | 0 (0.0%) |
| Educational Services | 16 (18.6%) | 70 (81.4%) |
| Health Care & Social Assistance | 115 (68.4%) | 53 (31.6%) |
| Arts, Entertainment & Recreation | 0 (0.0%) | 0 (0.0%) |
| Accommodation & Food Services | 105 (70.5%) | 44 (29.5%) |
| Public Administration | 109 (69.4%) | 48 (30.6%) |
| Total | 652 (56.0%) | 512 (44.0%) |
Education in Salinas
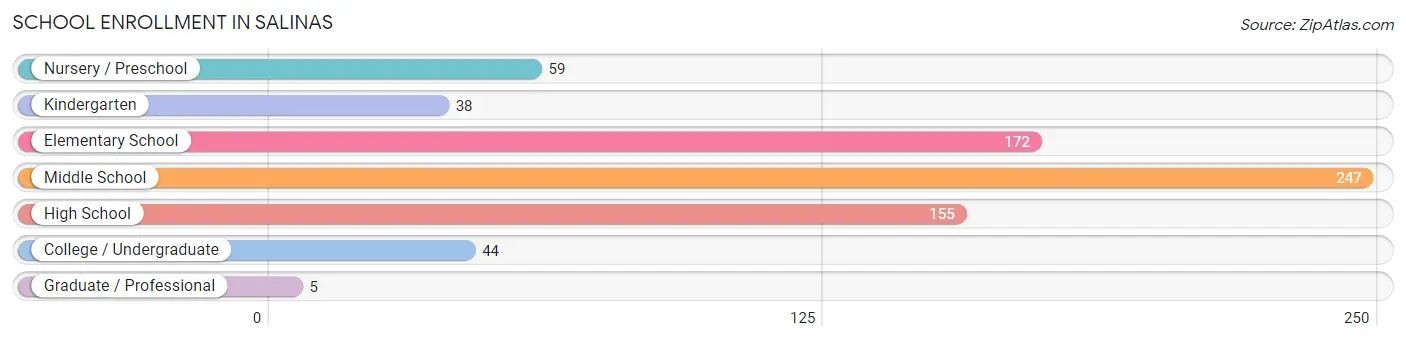
School Enrollment in Salinas
The most common levels of schooling among the 720 students in Salinas are middle school (247 | 34.3%), elementary school (172 | 23.9%), and high school (155 | 21.5%).
| School Level | # Students | % Students |
| Nursery / Preschool | 59 | 8.2% |
| Kindergarten | 38 | 5.3% |
| Elementary School | 172 | 23.9% |
| Middle School | 247 | 34.3% |
| High School | 155 | 21.5% |
| College / Undergraduate | 44 | 6.1% |
| Graduate / Professional | 5 | 0.7% |
| Total | 720 | 100.0% |
School Enrollment by Age by Funding Source in Salinas
Out of a total of 720 students who are enrolled in schools in Salinas, 102 (14.2%) attend a private institution, while the remaining 618 (85.8%) are enrolled in public schools. The age group of 25 to 34 year olds has the highest likelihood of being enrolled in private schools, with 10 (100.0% in the age bracket) enrolled. Conversely, the age group of 18 to 19 year olds has the lowest likelihood of being enrolled in a private school, with 36 (100.0% in the age bracket) attending a public institution.
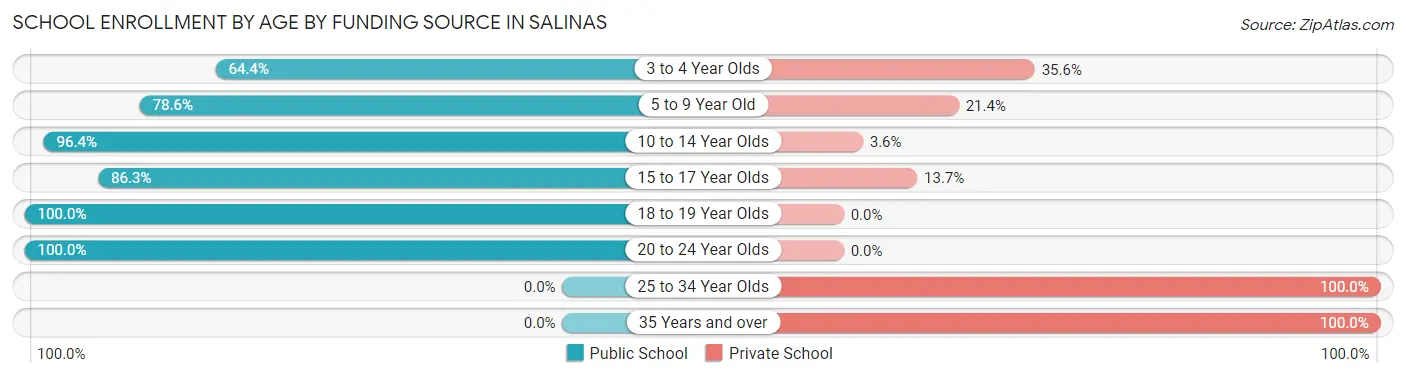
| Age Bracket | Public School | Private School |
| 3 to 4 Year Olds | 38 (64.4%) | 21 (35.6%) |
| 5 to 9 Year Old | 154 (78.6%) | 42 (21.4%) |
| 10 to 14 Year Olds | 298 (96.4%) | 11 (3.6%) |
| 15 to 17 Year Olds | 82 (86.3%) | 13 (13.7%) |
| 18 to 19 Year Olds | 36 (100.0%) | 0 (0.0%) |
| 20 to 24 Year Olds | 10 (100.0%) | 0 (0.0%) |
| 25 to 34 Year Olds | 0 (0.0%) | 10 (100.0%) |
| 35 Years and over | 0 (0.0%) | 5 (100.0%) |
| Total | 618 (85.8%) | 102 (14.2%) |
Educational Attainment by Field of Study in Salinas
Education (269 | 33.7%), business (118 | 14.8%), science & technology (82 | 10.3%), arts & humanities (75 | 9.4%), and psychology (64 | 8.0%) are the most common fields of study among 799 individuals in Salinas who have obtained a bachelor's degree or higher.
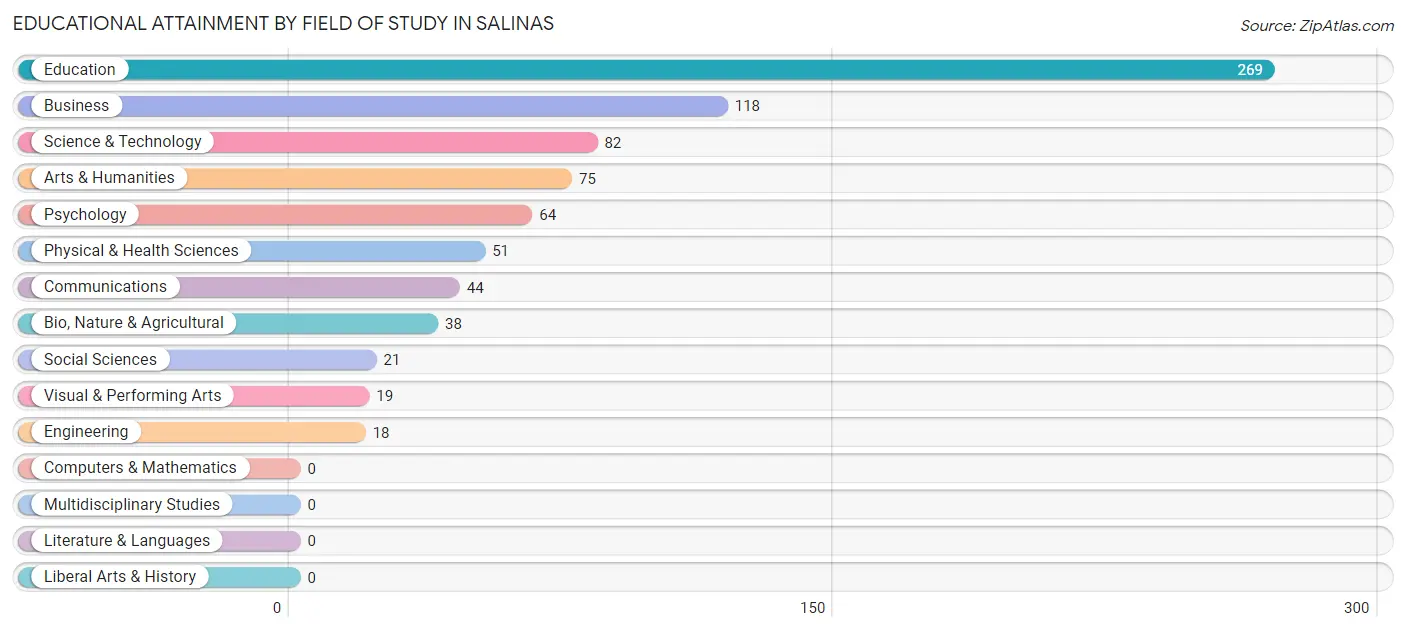
| Field of Study | # Graduates | % Graduates |
| Computers & Mathematics | 0 | 0.0% |
| Bio, Nature & Agricultural | 38 | 4.8% |
| Physical & Health Sciences | 51 | 6.4% |
| Psychology | 64 | 8.0% |
| Social Sciences | 21 | 2.6% |
| Engineering | 18 | 2.2% |
| Multidisciplinary Studies | 0 | 0.0% |
| Science & Technology | 82 | 10.3% |
| Business | 118 | 14.8% |
| Education | 269 | 33.7% |
| Literature & Languages | 0 | 0.0% |
| Liberal Arts & History | 0 | 0.0% |
| Visual & Performing Arts | 19 | 2.4% |
| Communications | 44 | 5.5% |
| Arts & Humanities | 75 | 9.4% |
| Total | 799 | 100.0% |
Transportation & Commute in Salinas
Vehicle Availability by Sex in Salinas
The most prevalent vehicle ownership categories in Salinas are males with 2 vehicles (255, accounting for 45.3%) and females with 2 vehicles (217, making up 53.6%).
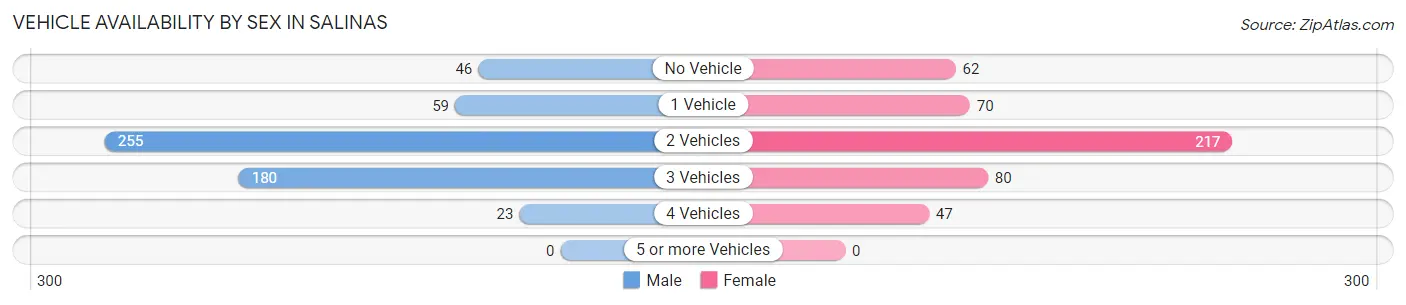
| Vehicles Available | Male | Female |
| No Vehicle | 46 (8.2%) | 62 (13.0%) |
| 1 Vehicle | 59 (10.5%) | 70 (14.7%) |
| 2 Vehicles | 255 (45.3%) | 217 (45.6%) |
| 3 Vehicles | 180 (32.0%) | 80 (16.8%) |
| 4 Vehicles | 23 (4.1%) | 47 (9.9%) |
| 5 or more Vehicles | 0 (0.0%) | 0 (0.0%) |
| Total | 563 (100.0%) | 476 (100.0%) |
Commute Time in Salinas
The most frequently occuring commute durations in Salinas are 5 to 9 minutes (240 commuters, 24.8%), 10 to 14 minutes (162 commuters, 16.8%), and 30 to 34 minutes (120 commuters, 12.4%).
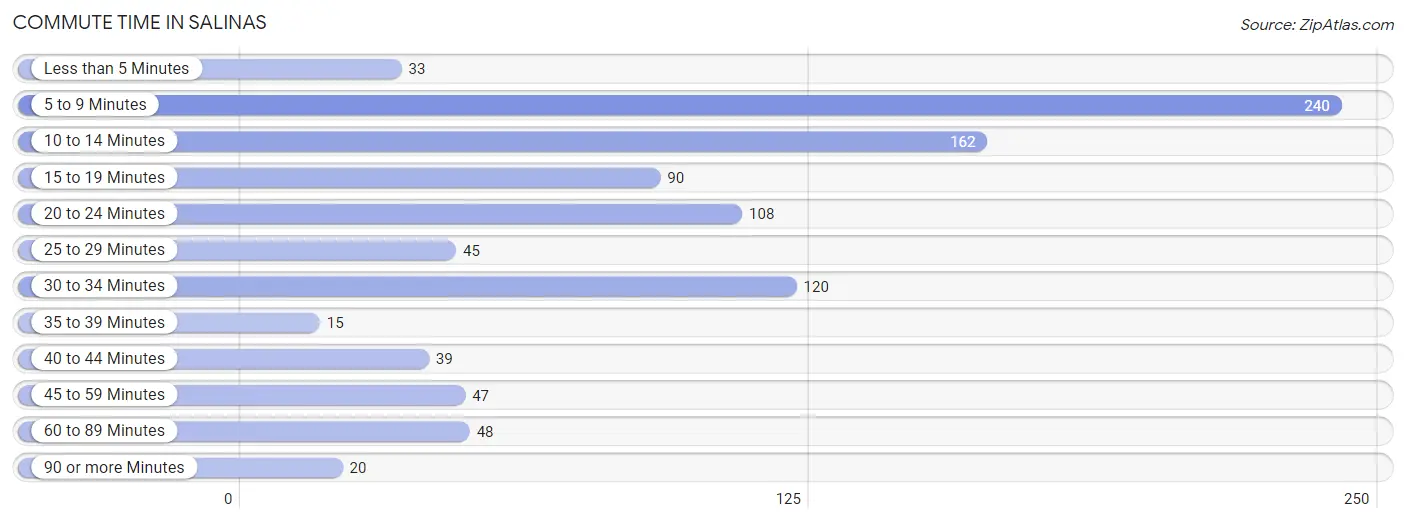
| Commute Time | # Commuters | % Commuters |
| Less than 5 Minutes | 33 | 3.4% |
| 5 to 9 Minutes | 240 | 24.8% |
| 10 to 14 Minutes | 162 | 16.8% |
| 15 to 19 Minutes | 90 | 9.3% |
| 20 to 24 Minutes | 108 | 11.2% |
| 25 to 29 Minutes | 45 | 4.6% |
| 30 to 34 Minutes | 120 | 12.4% |
| 35 to 39 Minutes | 15 | 1.5% |
| 40 to 44 Minutes | 39 | 4.0% |
| 45 to 59 Minutes | 47 | 4.9% |
| 60 to 89 Minutes | 48 | 5.0% |
| 90 or more Minutes | 20 | 2.1% |
Commute Time by Sex in Salinas
The most common commute times in Salinas are 5 to 9 minutes (167 commuters, 33.0%) for males and 30 to 34 minutes (90 commuters, 19.5%) for females.
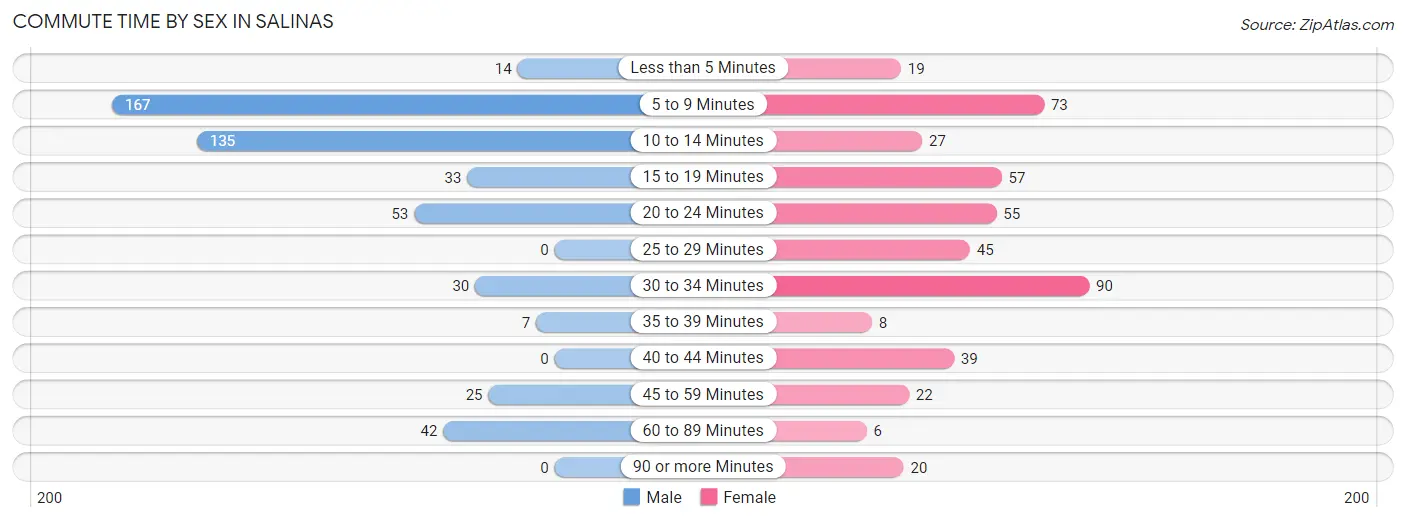
| Commute Time | Male | Female |
| Less than 5 Minutes | 14 (2.8%) | 19 (4.1%) |
| 5 to 9 Minutes | 167 (33.0%) | 73 (15.8%) |
| 10 to 14 Minutes | 135 (26.7%) | 27 (5.9%) |
| 15 to 19 Minutes | 33 (6.5%) | 57 (12.4%) |
| 20 to 24 Minutes | 53 (10.5%) | 55 (11.9%) |
| 25 to 29 Minutes | 0 (0.0%) | 45 (9.8%) |
| 30 to 34 Minutes | 30 (5.9%) | 90 (19.5%) |
| 35 to 39 Minutes | 7 (1.4%) | 8 (1.7%) |
| 40 to 44 Minutes | 0 (0.0%) | 39 (8.5%) |
| 45 to 59 Minutes | 25 (4.9%) | 22 (4.8%) |
| 60 to 89 Minutes | 42 (8.3%) | 6 (1.3%) |
| 90 or more Minutes | 0 (0.0%) | 20 (4.3%) |
Time of Departure to Work by Sex in Salinas
The most frequent times of departure to work in Salinas are 9:00 AM to 9:59 AM (78, 15.4%) for males and 12:00 PM to 3:59 PM (64, 13.9%) for females.
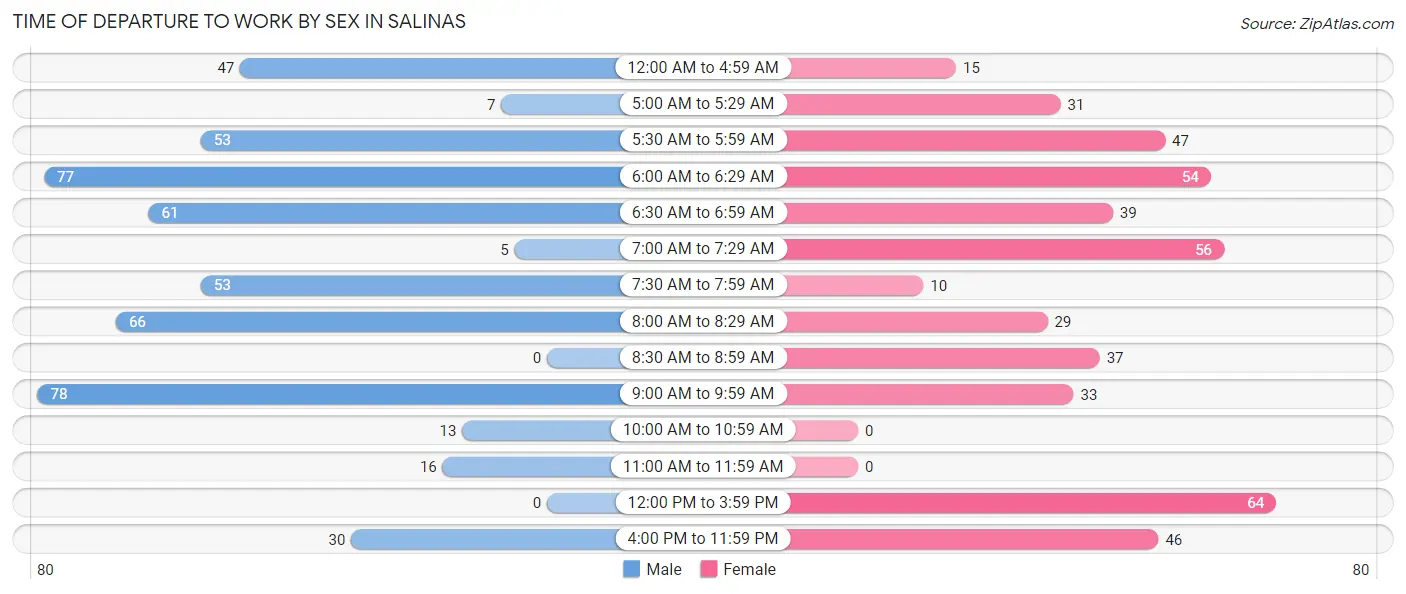
| Time of Departure | Male | Female |
| 12:00 AM to 4:59 AM | 47 (9.3%) | 15 (3.3%) |
| 5:00 AM to 5:29 AM | 7 (1.4%) | 31 (6.7%) |
| 5:30 AM to 5:59 AM | 53 (10.5%) | 47 (10.2%) |
| 6:00 AM to 6:29 AM | 77 (15.2%) | 54 (11.7%) |
| 6:30 AM to 6:59 AM | 61 (12.1%) | 39 (8.5%) |
| 7:00 AM to 7:29 AM | 5 (1.0%) | 56 (12.1%) |
| 7:30 AM to 7:59 AM | 53 (10.5%) | 10 (2.2%) |
| 8:00 AM to 8:29 AM | 66 (13.0%) | 29 (6.3%) |
| 8:30 AM to 8:59 AM | 0 (0.0%) | 37 (8.0%) |
| 9:00 AM to 9:59 AM | 78 (15.4%) | 33 (7.2%) |
| 10:00 AM to 10:59 AM | 13 (2.6%) | 0 (0.0%) |
| 11:00 AM to 11:59 AM | 16 (3.2%) | 0 (0.0%) |
| 12:00 PM to 3:59 PM | 0 (0.0%) | 64 (13.9%) |
| 4:00 PM to 11:59 PM | 30 (5.9%) | 46 (10.0%) |
| Total | 506 (100.0%) | 461 (100.0%) |
Housing Occupancy in Salinas
Occupancy by Ownership in Salinas
Of the total 1,738 dwellings in Salinas, owner-occupied units account for 1,245 (71.6%), while renter-occupied units make up 493 (28.4%).
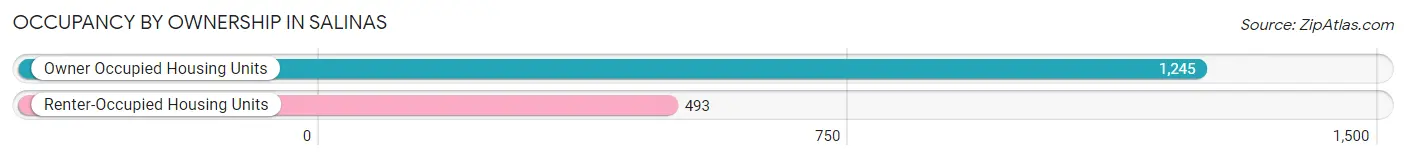
| Occupancy | # Housing Units | % Housing Units |
| Owner Occupied Housing Units | 1,245 | 71.6% |
| Renter-Occupied Housing Units | 493 | 28.4% |
| Total Occupied Housing Units | 1,738 | 100.0% |
Occupancy by Household Size in Salinas
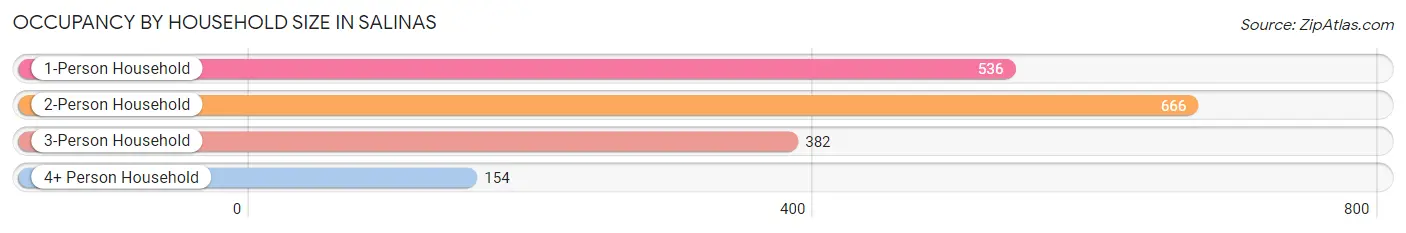
| Household Size | # Housing Units | % Housing Units |
| 1-Person Household | 536 | 30.8% |
| 2-Person Household | 666 | 38.3% |
| 3-Person Household | 382 | 22.0% |
| 4+ Person Household | 154 | 8.9% |
| Total Housing Units | 1,738 | 100.0% |
Occupancy by Ownership by Household Size in Salinas
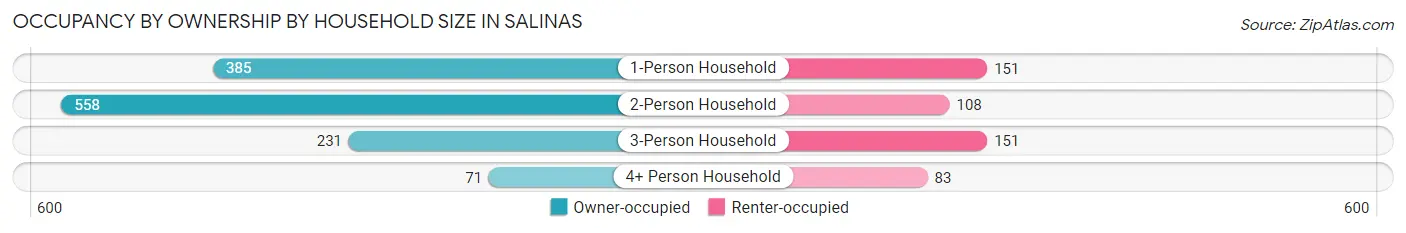
| Household Size | Owner-occupied | Renter-occupied |
| 1-Person Household | 385 (71.8%) | 151 (28.2%) |
| 2-Person Household | 558 (83.8%) | 108 (16.2%) |
| 3-Person Household | 231 (60.5%) | 151 (39.5%) |
| 4+ Person Household | 71 (46.1%) | 83 (53.9%) |
| Total Housing Units | 1,245 (71.6%) | 493 (28.4%) |
Occupancy by Educational Attainment in Salinas
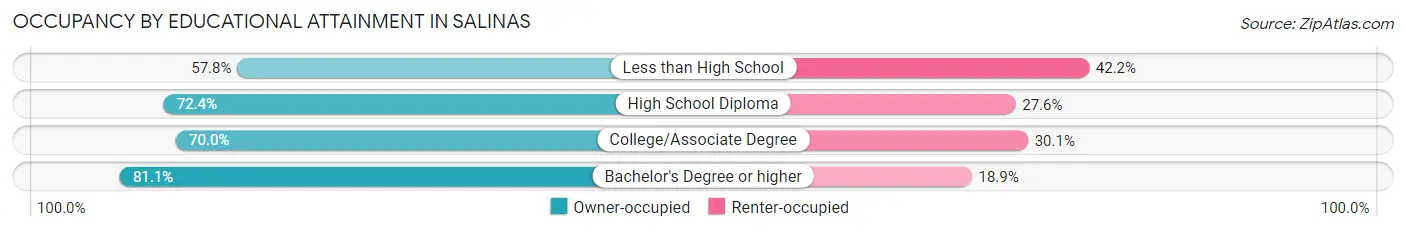
| Household Size | Owner-occupied | Renter-occupied |
| Less than High School | 144 (57.8%) | 105 (42.2%) |
| High School Diploma | 483 (72.4%) | 184 (27.6%) |
| College/Associate Degree | 305 (70.0%) | 131 (30.0%) |
| Bachelor's Degree or higher | 313 (81.1%) | 73 (18.9%) |
Occupancy by Age of Householder in Salinas
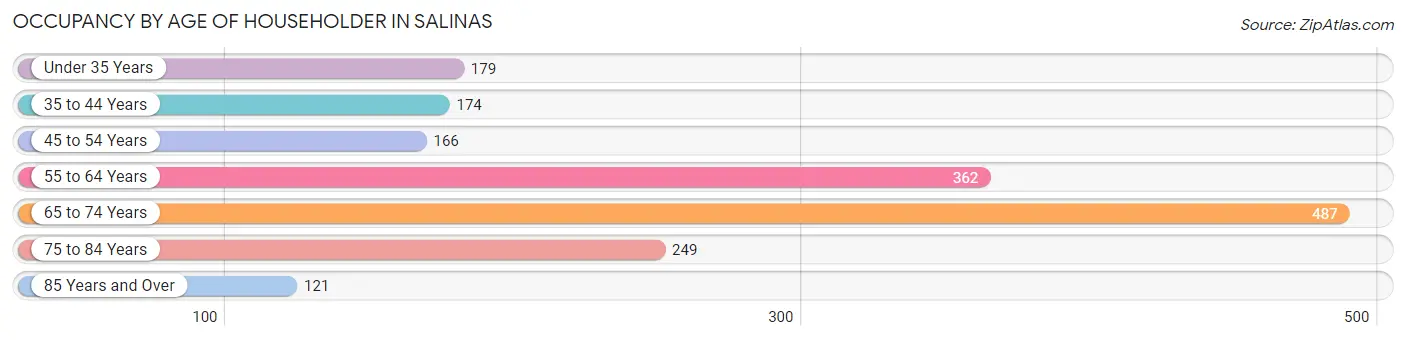
| Age Bracket | # Households | % Households |
| Under 35 Years | 179 | 10.3% |
| 35 to 44 Years | 174 | 10.0% |
| 45 to 54 Years | 166 | 9.6% |
| 55 to 64 Years | 362 | 20.8% |
| 65 to 74 Years | 487 | 28.0% |
| 75 to 84 Years | 249 | 14.3% |
| 85 Years and Over | 121 | 7.0% |
| Total | 1,738 | 100.0% |
Housing Finances in Salinas
Median Income by Occupancy in Salinas
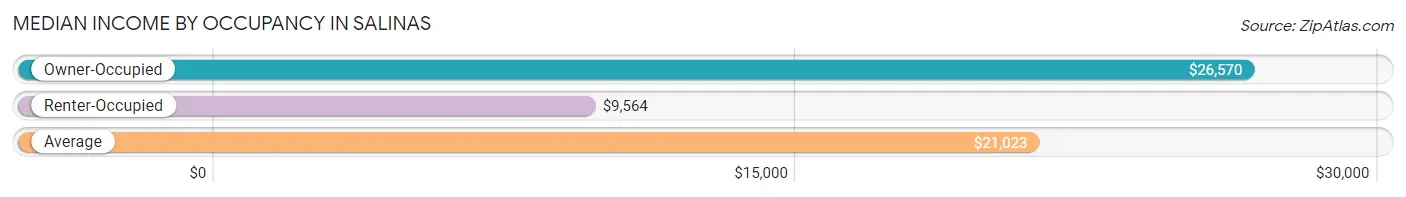
| Occupancy Type | # Households | Median Income |
| Owner-Occupied | 1,245 (71.6%) | $26,570 |
| Renter-Occupied | 493 (28.4%) | $9,564 |
| Average | 1,738 (100.0%) | $21,023 |
Occupancy by Householder Income Bracket in Salinas
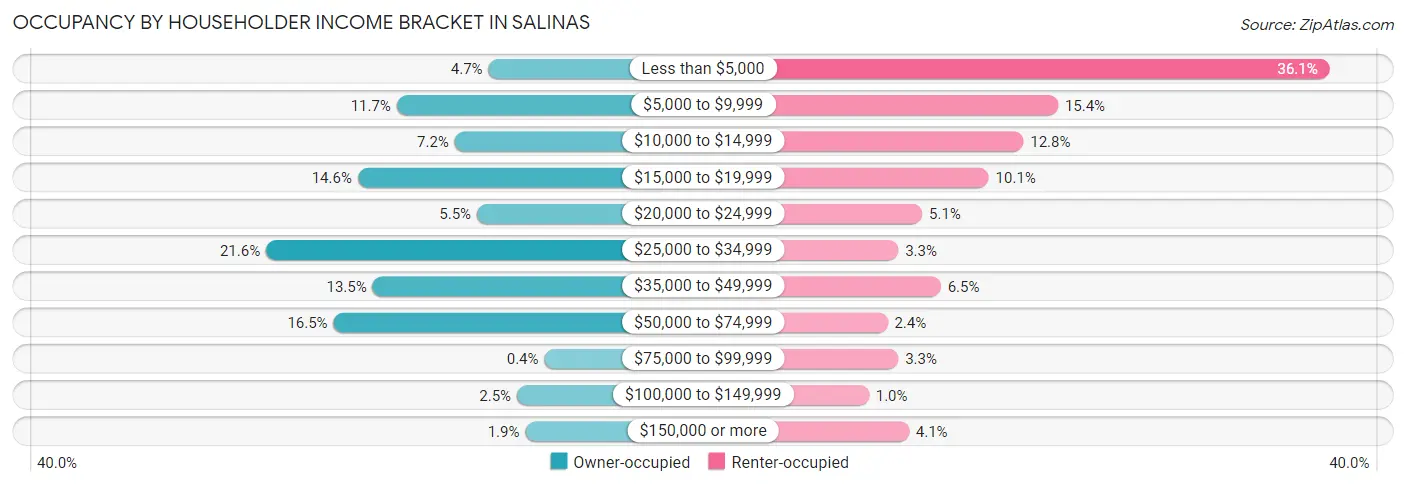
| Income Bracket | Owner-occupied | Renter-occupied |
| Less than $5,000 | 58 (4.7%) | 178 (36.1%) |
| $5,000 to $9,999 | 145 (11.7%) | 76 (15.4%) |
| $10,000 to $14,999 | 90 (7.2%) | 63 (12.8%) |
| $15,000 to $19,999 | 182 (14.6%) | 50 (10.1%) |
| $20,000 to $24,999 | 69 (5.5%) | 25 (5.1%) |
| $25,000 to $34,999 | 269 (21.6%) | 16 (3.3%) |
| $35,000 to $49,999 | 168 (13.5%) | 32 (6.5%) |
| $50,000 to $74,999 | 205 (16.5%) | 12 (2.4%) |
| $75,000 to $99,999 | 5 (0.4%) | 16 (3.3%) |
| $100,000 to $149,999 | 31 (2.5%) | 5 (1.0%) |
| $150,000 or more | 23 (1.8%) | 20 (4.1%) |
| Total | 1,245 (100.0%) | 493 (100.0%) |
Monthly Housing Cost Tiers in Salinas
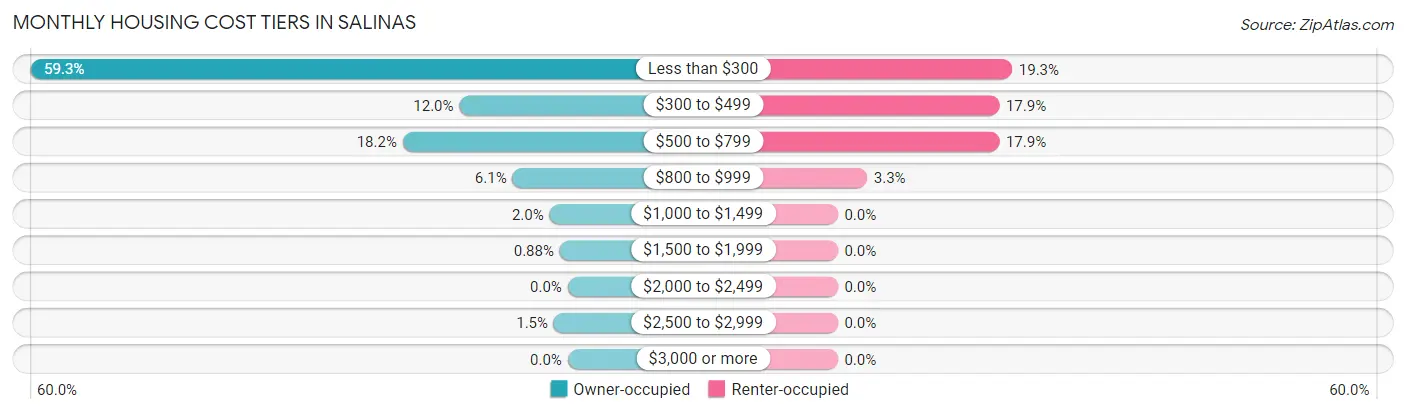
| Monthly Cost | Owner-occupied | Renter-occupied |
| Less than $300 | 738 (59.3%) | 95 (19.3%) |
| $300 to $499 | 149 (12.0%) | 88 (17.8%) |
| $500 to $799 | 227 (18.2%) | 88 (17.8%) |
| $800 to $999 | 76 (6.1%) | 16 (3.3%) |
| $1,000 to $1,499 | 25 (2.0%) | 0 (0.0%) |
| $1,500 to $1,999 | 11 (0.9%) | 0 (0.0%) |
| $2,000 to $2,499 | 0 (0.0%) | 0 (0.0%) |
| $2,500 to $2,999 | 19 (1.5%) | 0 (0.0%) |
| $3,000 or more | 0 (0.0%) | 0 (0.0%) |
| Total | 1,245 (100.0%) | 493 (100.0%) |
Physical Housing Characteristics in Salinas
Housing Structures in Salinas
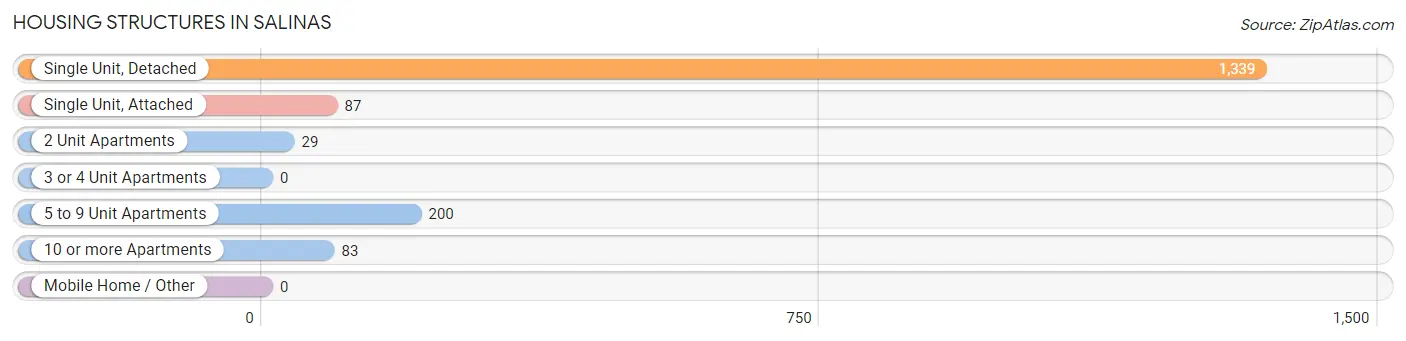
| Structure Type | # Housing Units | % Housing Units |
| Single Unit, Detached | 1,339 | 77.0% |
| Single Unit, Attached | 87 | 5.0% |
| 2 Unit Apartments | 29 | 1.7% |
| 3 or 4 Unit Apartments | 0 | 0.0% |
| 5 to 9 Unit Apartments | 200 | 11.5% |
| 10 or more Apartments | 83 | 4.8% |
| Mobile Home / Other | 0 | 0.0% |
| Total | 1,738 | 100.0% |
Housing Structures by Occupancy in Salinas
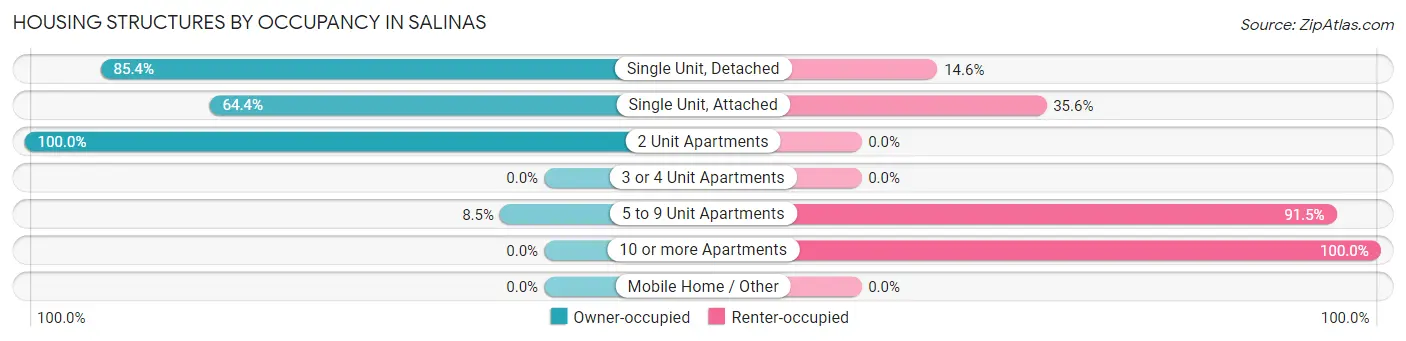
| Structure Type | Owner-occupied | Renter-occupied |
| Single Unit, Detached | 1,143 (85.4%) | 196 (14.6%) |
| Single Unit, Attached | 56 (64.4%) | 31 (35.6%) |
| 2 Unit Apartments | 29 (100.0%) | 0 (0.0%) |
| 3 or 4 Unit Apartments | 0 (0.0%) | 0 (0.0%) |
| 5 to 9 Unit Apartments | 17 (8.5%) | 183 (91.5%) |
| 10 or more Apartments | 0 (0.0%) | 83 (100.0%) |
| Mobile Home / Other | 0 (0.0%) | 0 (0.0%) |
| Total | 1,245 (71.6%) | 493 (28.4%) |
Housing Structures by Number of Rooms in Salinas
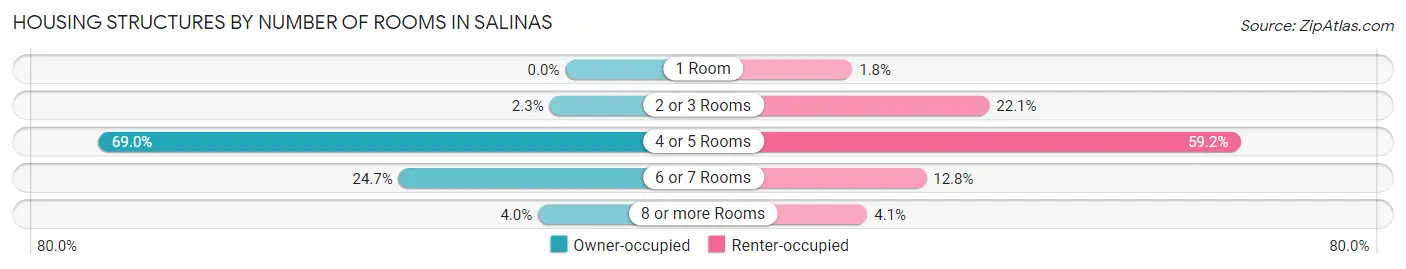
| Number of Rooms | Owner-occupied | Renter-occupied |
| 1 Room | 0 (0.0%) | 9 (1.8%) |
| 2 or 3 Rooms | 29 (2.3%) | 109 (22.1%) |
| 4 or 5 Rooms | 859 (69.0%) | 292 (59.2%) |
| 6 or 7 Rooms | 307 (24.7%) | 63 (12.8%) |
| 8 or more Rooms | 50 (4.0%) | 20 (4.1%) |
| Total | 1,245 (100.0%) | 493 (100.0%) |
Housing Structure by Heating Type in Salinas
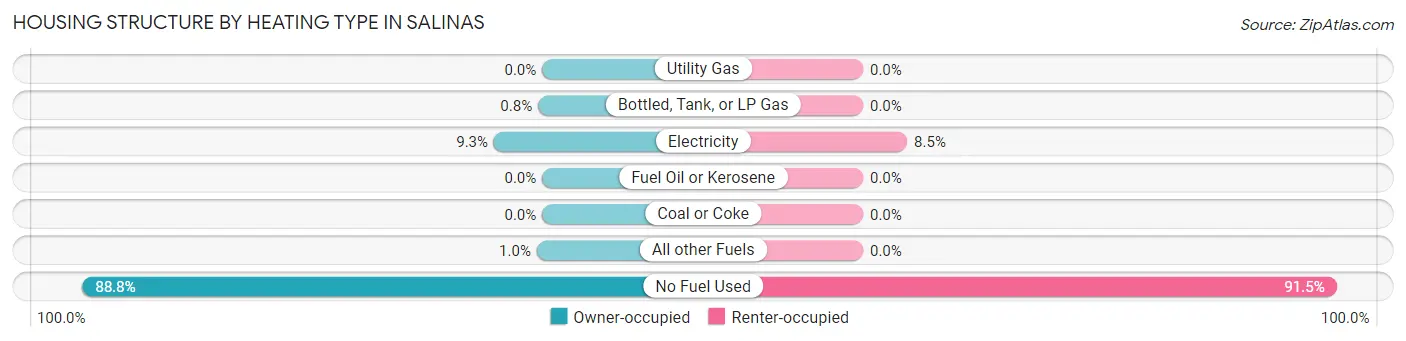
| Heating Type | Owner-occupied | Renter-occupied |
| Utility Gas | 0 (0.0%) | 0 (0.0%) |
| Bottled, Tank, or LP Gas | 10 (0.8%) | 0 (0.0%) |
| Electricity | 116 (9.3%) | 42 (8.5%) |
| Fuel Oil or Kerosene | 0 (0.0%) | 0 (0.0%) |
| Coal or Coke | 0 (0.0%) | 0 (0.0%) |
| All other Fuels | 13 (1.0%) | 0 (0.0%) |
| No Fuel Used | 1,106 (88.8%) | 451 (91.5%) |
| Total | 1,245 (100.0%) | 493 (100.0%) |
Household Vehicle Usage in Salinas
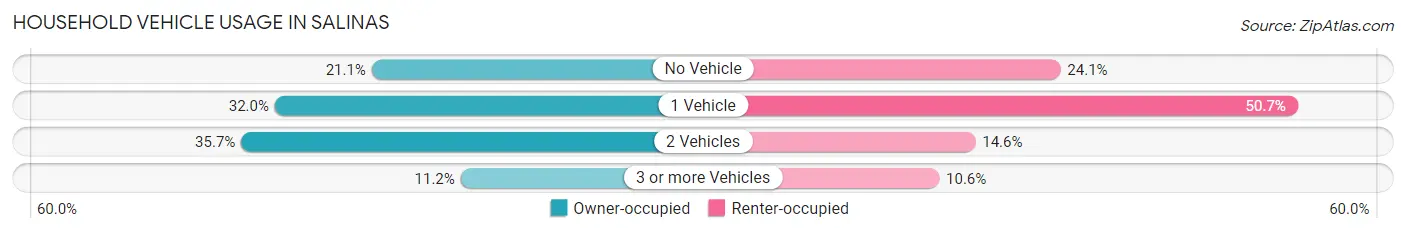
| Vehicles per Household | Owner-occupied | Renter-occupied |
| No Vehicle | 263 (21.1%) | 119 (24.1%) |
| 1 Vehicle | 398 (32.0%) | 250 (50.7%) |
| 2 Vehicles | 445 (35.7%) | 72 (14.6%) |
| 3 or more Vehicles | 139 (11.2%) | 52 (10.5%) |
| Total | 1,245 (100.0%) | 493 (100.0%) |
Real Estate & Mortgages in Salinas
Real Estate and Mortgage Overview in Salinas
| Characteristic | Without Mortgage | With Mortgage |
| Housing Units | 857 | 388 |
| Median Property Value | $91,700 | $99,900 |
| Median Household Income | $22,470 | $8 |
| Monthly Housing Costs | $172 | $0 |
| Real Estate Taxes | $253 | $371 |
Property Value by Mortgage Status in Salinas
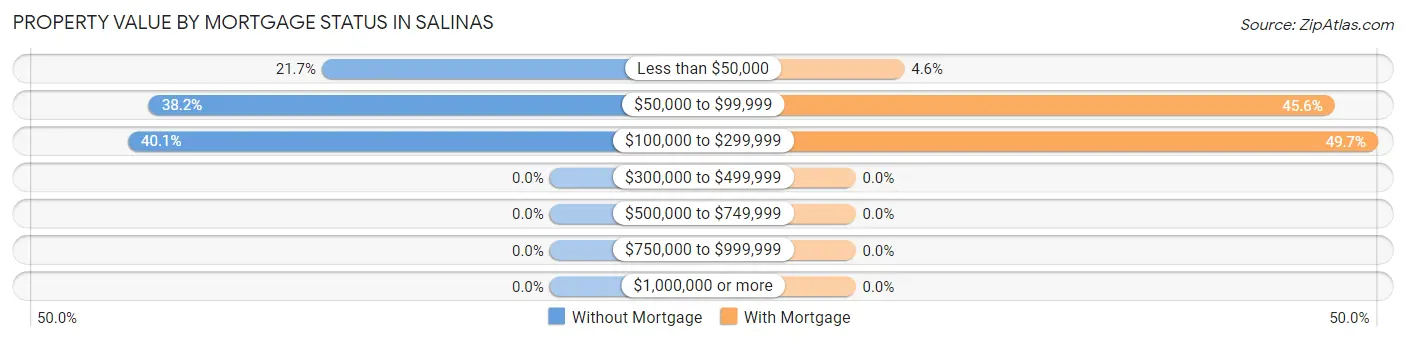
| Property Value | Without Mortgage | With Mortgage |
| Less than $50,000 | 186 (21.7%) | 18 (4.6%) |
| $50,000 to $99,999 | 327 (38.2%) | 177 (45.6%) |
| $100,000 to $299,999 | 344 (40.1%) | 193 (49.7%) |
| $300,000 to $499,999 | 0 (0.0%) | 0 (0.0%) |
| $500,000 to $749,999 | 0 (0.0%) | 0 (0.0%) |
| $750,000 to $999,999 | 0 (0.0%) | 0 (0.0%) |
| $1,000,000 or more | 0 (0.0%) | 0 (0.0%) |
| Total | 857 (100.0%) | 388 (100.0%) |
Household Income by Mortgage Status in Salinas
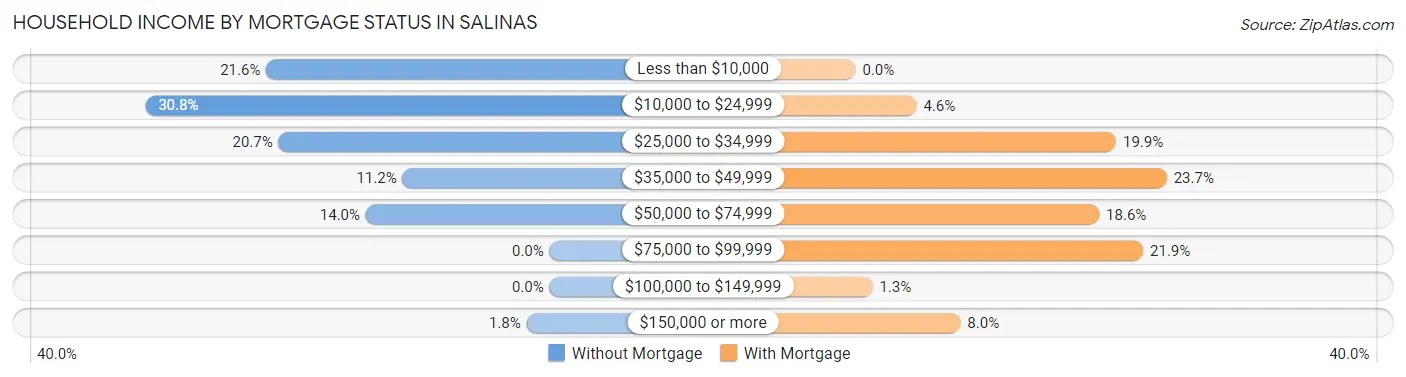
| Household Income | Without Mortgage | With Mortgage |
| Less than $10,000 | 185 (21.6%) | 0 (0.0%) |
| $10,000 to $24,999 | 264 (30.8%) | 18 (4.6%) |
| $25,000 to $34,999 | 177 (20.6%) | 77 (19.9%) |
| $35,000 to $49,999 | 96 (11.2%) | 92 (23.7%) |
| $50,000 to $74,999 | 120 (14.0%) | 72 (18.6%) |
| $75,000 to $99,999 | 0 (0.0%) | 85 (21.9%) |
| $100,000 to $149,999 | 0 (0.0%) | 5 (1.3%) |
| $150,000 or more | 15 (1.8%) | 31 (8.0%) |
| Total | 857 (100.0%) | 388 (100.0%) |
Property Value to Household Income Ratio in Salinas
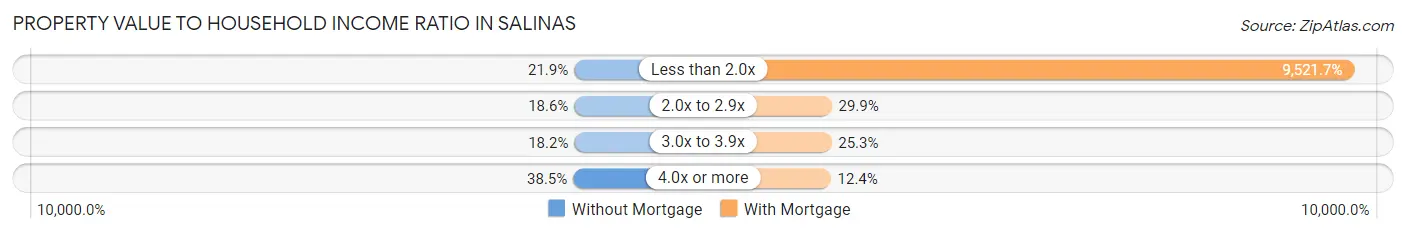
| Value-to-Income Ratio | Without Mortgage | With Mortgage |
| Less than 2.0x | 188 (21.9%) | 36,944 (9,521.6%) |
| 2.0x to 2.9x | 159 (18.5%) | 116 (29.9%) |
| 3.0x to 3.9x | 156 (18.2%) | 98 (25.3%) |
| 4.0x or more | 330 (38.5%) | 48 (12.4%) |
| Total | 857 (100.0%) | 388 (100.0%) |
Real Estate Taxes by Mortgage Status in Salinas
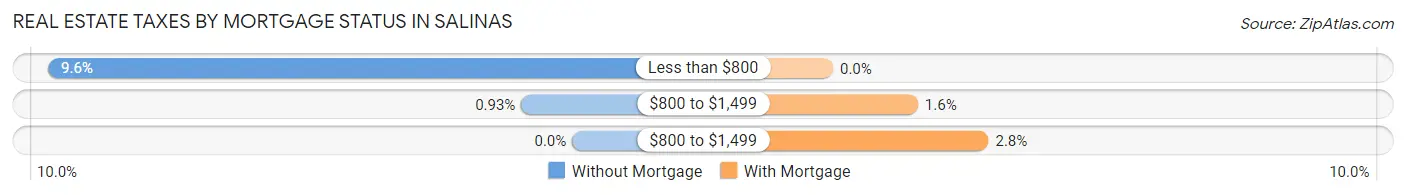
| Property Taxes | Without Mortgage | With Mortgage |
| Less than $800 | 82 (9.6%) | 0 (0.0%) |
| $800 to $1,499 | 8 (0.9%) | 6 (1.5%) |
| $800 to $1,499 | 0 (0.0%) | 11 (2.8%) |
| Total | 857 (100.0%) | 388 (100.0%) |
Health & Disability in Salinas
Health Insurance Coverage by Age in Salinas
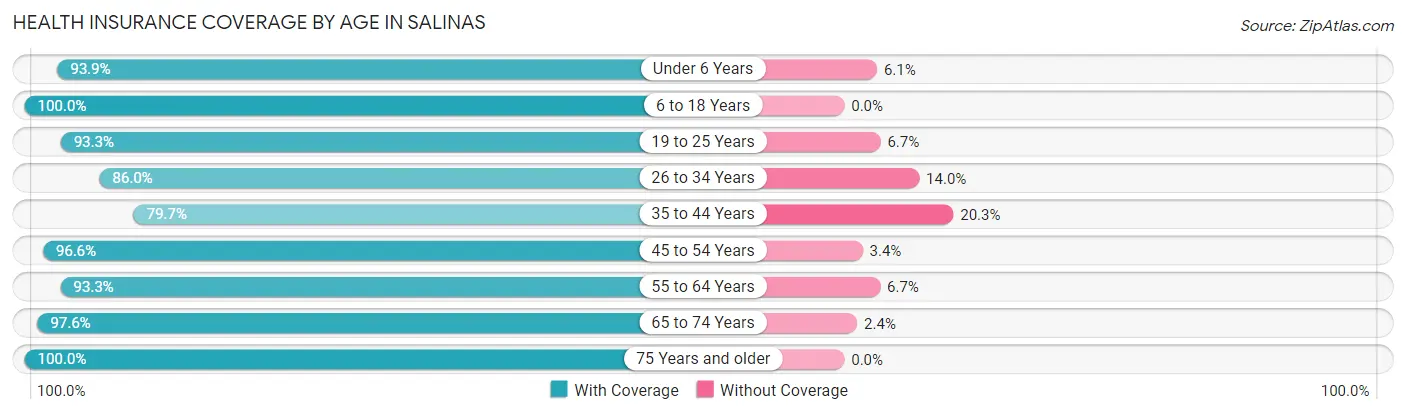
| Age Bracket | With Coverage | Without Coverage |
| Under 6 Years | 200 (93.9%) | 13 (6.1%) |
| 6 to 18 Years | 623 (100.0%) | 0 (0.0%) |
| 19 to 25 Years | 166 (93.3%) | 12 (6.7%) |
| 26 to 34 Years | 382 (86.0%) | 62 (14.0%) |
| 35 to 44 Years | 404 (79.7%) | 103 (20.3%) |
| 45 to 54 Years | 453 (96.6%) | 16 (3.4%) |
| 55 to 64 Years | 517 (93.3%) | 37 (6.7%) |
| 65 to 74 Years | 732 (97.6%) | 18 (2.4%) |
| 75 Years and older | 620 (100.0%) | 0 (0.0%) |
| Total | 4,097 (94.0%) | 261 (6.0%) |
Health Insurance Coverage by Citizenship Status in Salinas
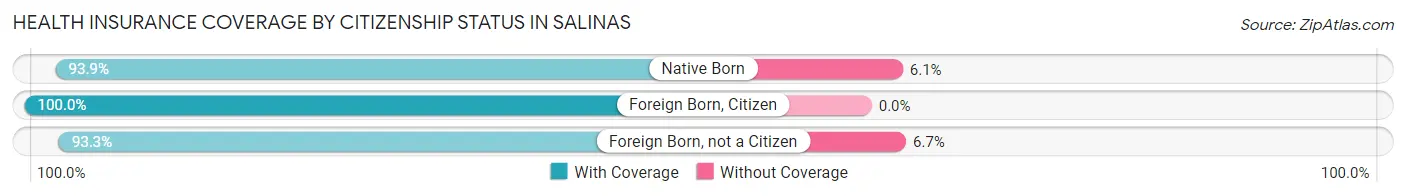
| Citizenship Status | With Coverage | Without Coverage |
| Native Born | 200 (93.9%) | 13 (6.1%) |
| Foreign Born, Citizen | 623 (100.0%) | 0 (0.0%) |
| Foreign Born, not a Citizen | 166 (93.3%) | 12 (6.7%) |
Health Insurance Coverage by Household Income in Salinas

| Household Income | With Coverage | Without Coverage |
| Under $25,000 | 2,028 (93.3%) | 145 (6.7%) |
| $25,000 to $49,999 | 1,195 (95.5%) | 56 (4.5%) |
| $50,000 to $74,999 | 616 (93.3%) | 44 (6.7%) |
| $75,000 to $99,999 | 26 (100.0%) | 0 (0.0%) |
| $100,000 and over | 231 (93.5%) | 16 (6.5%) |
Public vs Private Health Insurance Coverage by Age in Salinas
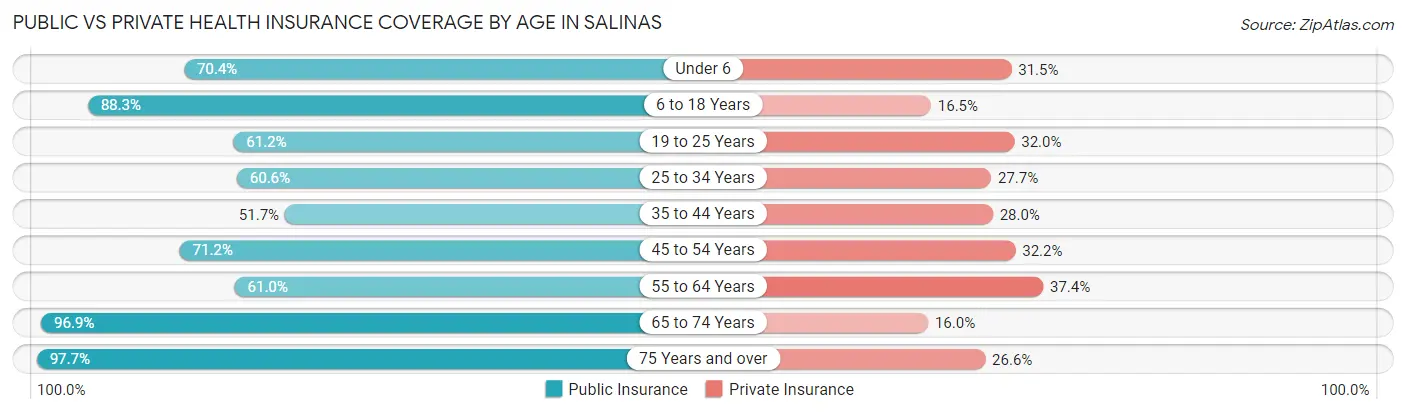
| Age Bracket | Public Insurance | Private Insurance |
| Under 6 | 150 (70.4%) | 67 (31.5%) |
| 6 to 18 Years | 550 (88.3%) | 103 (16.5%) |
| 19 to 25 Years | 109 (61.2%) | 57 (32.0%) |
| 25 to 34 Years | 269 (60.6%) | 123 (27.7%) |
| 35 to 44 Years | 262 (51.7%) | 142 (28.0%) |
| 45 to 54 Years | 334 (71.2%) | 151 (32.2%) |
| 55 to 64 Years | 338 (61.0%) | 207 (37.4%) |
| 65 to 74 Years | 727 (96.9%) | 120 (16.0%) |
| 75 Years and over | 606 (97.7%) | 165 (26.6%) |
| Total | 3,345 (76.8%) | 1,135 (26.0%) |
Disability Status by Sex by Age in Salinas
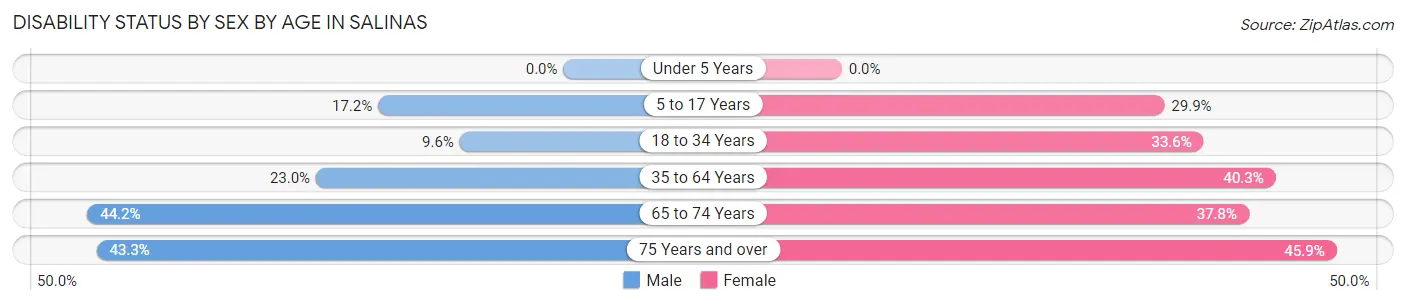
| Age Bracket | Male | Female |
| Under 5 Years | 0 (0.0%) | 0 (0.0%) |
| 5 to 17 Years | 48 (17.2%) | 100 (29.9%) |
| 18 to 34 Years | 25 (9.6%) | 142 (33.6%) |
| 35 to 64 Years | 183 (23.0%) | 295 (40.3%) |
| 65 to 74 Years | 129 (44.2%) | 173 (37.8%) |
| 75 Years and over | 78 (43.3%) | 202 (45.9%) |
Disability Class by Sex by Age in Salinas
Disability Class: Hearing Difficulty
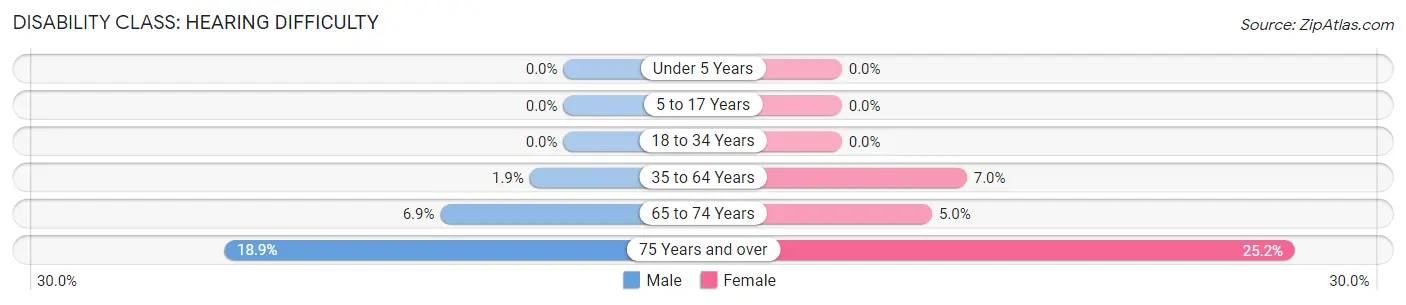
| Age Bracket | Male | Female |
| Under 5 Years | 0 (0.0%) | 0 (0.0%) |
| 5 to 17 Years | 0 (0.0%) | 0 (0.0%) |
| 18 to 34 Years | 0 (0.0%) | 0 (0.0%) |
| 35 to 64 Years | 15 (1.9%) | 51 (7.0%) |
| 65 to 74 Years | 20 (6.9%) | 23 (5.0%) |
| 75 Years and over | 34 (18.9%) | 111 (25.2%) |
Disability Class: Vision Difficulty
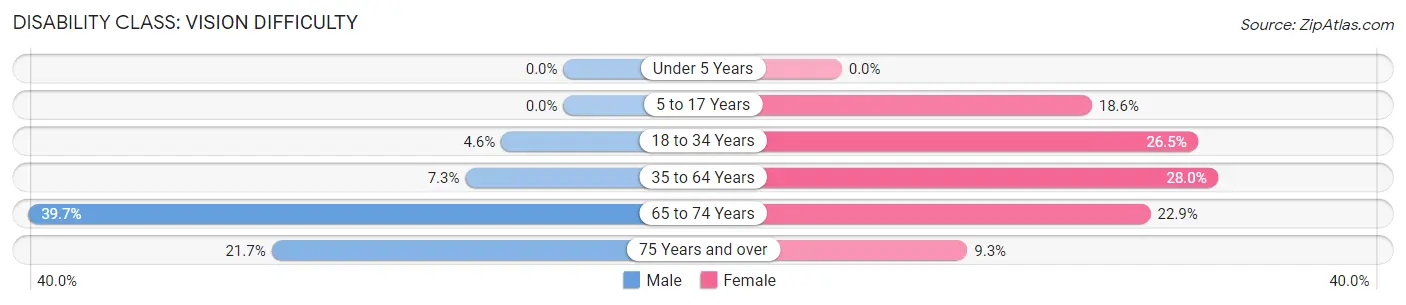
| Age Bracket | Male | Female |
| Under 5 Years | 0 (0.0%) | 0 (0.0%) |
| 5 to 17 Years | 0 (0.0%) | 62 (18.6%) |
| 18 to 34 Years | 12 (4.6%) | 112 (26.5%) |
| 35 to 64 Years | 58 (7.3%) | 205 (28.0%) |
| 65 to 74 Years | 116 (39.7%) | 105 (22.9%) |
| 75 Years and over | 39 (21.7%) | 41 (9.3%) |
Disability Class: Cognitive Difficulty
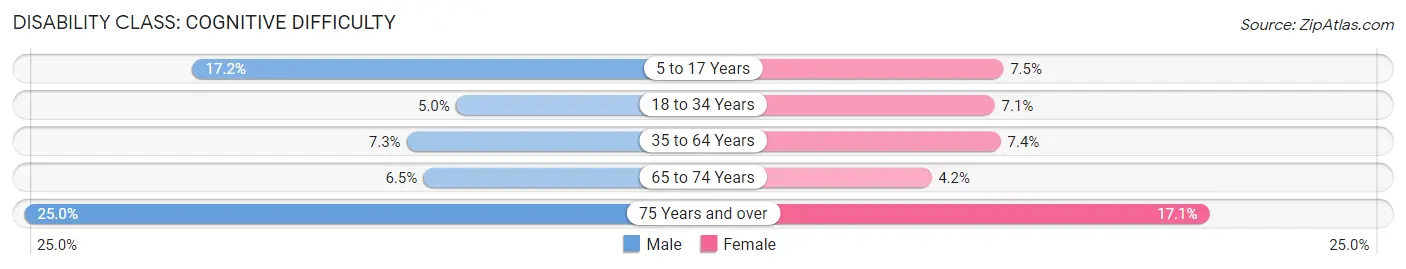
| Age Bracket | Male | Female |
| 5 to 17 Years | 48 (17.2%) | 25 (7.5%) |
| 18 to 34 Years | 13 (5.0%) | 30 (7.1%) |
| 35 to 64 Years | 58 (7.3%) | 54 (7.4%) |
| 65 to 74 Years | 19 (6.5%) | 19 (4.2%) |
| 75 Years and over | 45 (25.0%) | 75 (17.1%) |
Disability Class: Ambulatory Difficulty
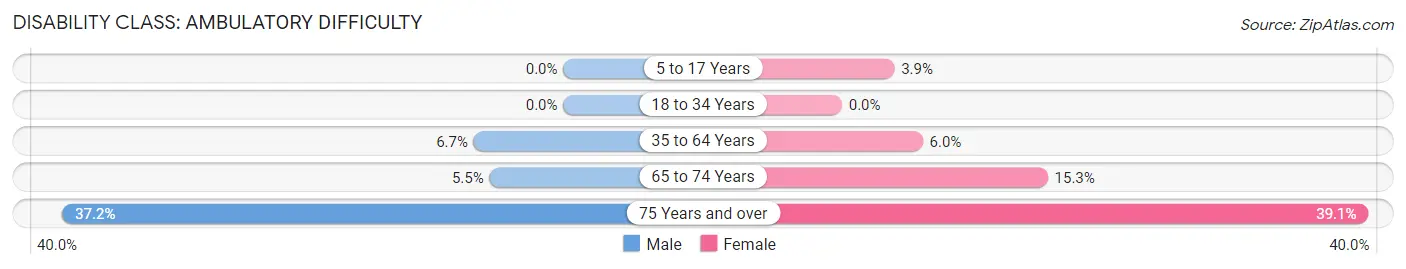
| Age Bracket | Male | Female |
| 5 to 17 Years | 0 (0.0%) | 13 (3.9%) |
| 18 to 34 Years | 0 (0.0%) | 0 (0.0%) |
| 35 to 64 Years | 53 (6.7%) | 44 (6.0%) |
| 65 to 74 Years | 16 (5.5%) | 70 (15.3%) |
| 75 Years and over | 67 (37.2%) | 172 (39.1%) |
Disability Class: Self-Care Difficulty
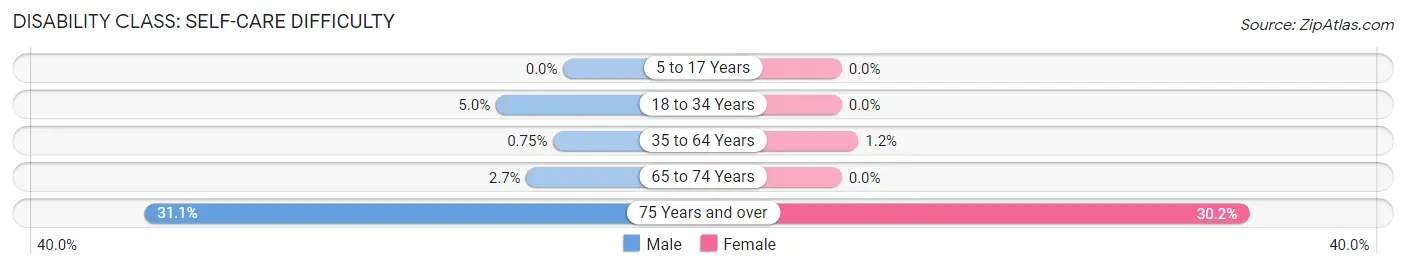
| Age Bracket | Male | Female |
| 5 to 17 Years | 0 (0.0%) | 0 (0.0%) |
| 18 to 34 Years | 13 (5.0%) | 0 (0.0%) |
| 35 to 64 Years | 6 (0.7%) | 9 (1.2%) |
| 65 to 74 Years | 8 (2.7%) | 0 (0.0%) |
| 75 Years and over | 56 (31.1%) | 133 (30.2%) |
Technology Access in Salinas
Computing Device Access in Salinas
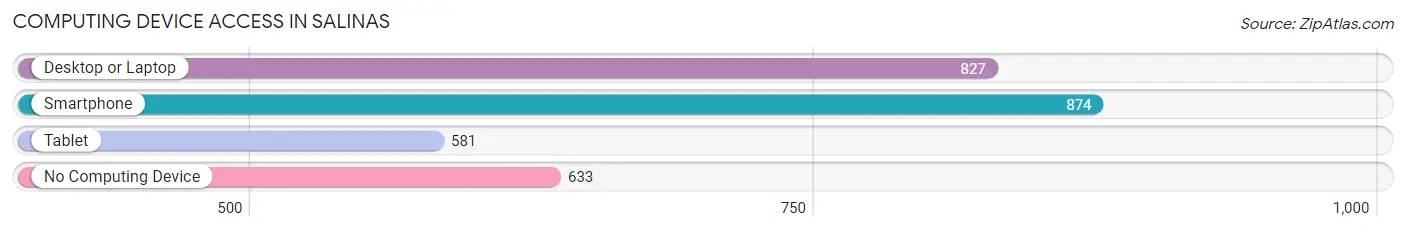
| Device Type | # Households | % Households |
| Desktop or Laptop | 827 | 47.6% |
| Smartphone | 874 | 50.3% |
| Tablet | 581 | 33.4% |
| No Computing Device | 633 | 36.4% |
| Total | 1,738 | 100.0% |
Internet Access in Salinas
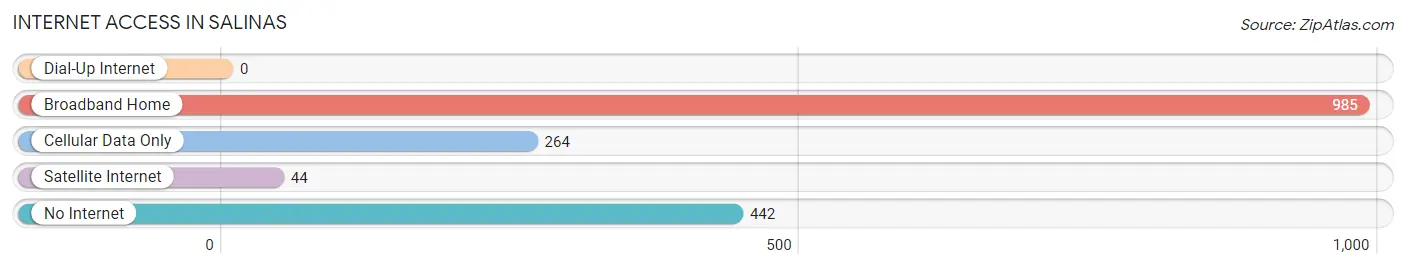
| Internet Type | # Households | % Households |
| Dial-Up Internet | 0 | 0.0% |
| Broadband Home | 985 | 56.7% |
| Cellular Data Only | 264 | 15.2% |
| Satellite Internet | 44 | 2.5% |
| No Internet | 442 | 25.4% |
| Total | 1,738 | 100.0% |
Salinas Summary
Salinas is a municipality located in the southern coast of Puerto Rico, in the region known as the Southern Coastal Plain. It is bordered by the municipalities of Guayama, Arroyo, Patillas, and Yabucoa. Salinas is known as the “City of the Sun” due to its location in the Caribbean Sea, which gives it a warm climate year-round.
History
Salinas was founded in 1815 by Don Francisco de Salinas, a Spanish military officer. The town was originally called “Villa de Salinas” and was part of the municipality of Guayama. In 1831, Salinas was separated from Guayama and became its own municipality.
In the 19th century, Salinas was an important port for the export of sugar cane and other agricultural products. The town was also known for its salt production, which gave it its name.
In the 20th century, Salinas experienced a period of economic growth due to the development of the local sugar industry. The town also became a popular tourist destination due to its beaches and its proximity to San Juan.
Geography
Salinas is located in the southern coast of Puerto Rico, in the region known as the Southern Coastal Plain. It is bordered by the municipalities of Guayama, Arroyo, Patillas, and Yabucoa. The municipality covers an area of approximately 40 square miles and has a population of approximately 40,000 people.
The terrain of Salinas is mostly flat, with some hills in the northern part of the municipality. The town is located near the Caribbean Sea, which gives it a warm climate year-round.
Economy
Salinas’ economy is mainly based on agriculture and tourism. The town is known for its production of sugar cane, which is exported to other countries. Other agricultural products produced in Salinas include coffee, tobacco, and fruits.
The town is also a popular tourist destination due to its beaches and its proximity to San Juan. The local economy benefits from the influx of tourists, who come to enjoy the warm climate and the beautiful beaches.
Demographics
As of the 2010 census, Salinas had a population of 39,945 people. The population is mostly of Puerto Rican descent, with a small percentage of people of other ethnic backgrounds. The median age of the population is 37.7 years.
The majority of the population (90.3%) speaks Spanish as their first language, while the remaining 9.7% speaks English. The majority of the population (90.3%) is Roman Catholic, while the remaining 9.7% is of other religious backgrounds.
Conclusion
Salinas is a municipality located in the southern coast of Puerto Rico, in the region known as the Southern Coastal Plain. It is bordered by the municipalities of Guayama, Arroyo, Patillas, and Yabucoa. Salinas is known as the “City of the Sun” due to its location in the Caribbean Sea, which gives it a warm climate year-round. The town’s economy is mainly based on agriculture and tourism, and it is a popular tourist destination due to its beaches and its proximity to San Juan. The population of Salinas is mostly of Puerto Rican descent, with a small percentage of people of other ethnic backgrounds. The majority of the population speaks Spanish as their first language, while the remaining 9.7% speaks English.
Common Questions
What is Per Capita Income in Salinas?
Per Capita income in Salinas is $14,769.
What is the Median Family Income in Salinas?
Median Family Income in Salinas is $25,112.
What is the Median Household income in Salinas?
Median Household Income in Salinas is $21,023.
What is Income or Wage Gap in Salinas?
Income or Wage Gap in Salinas is 7.2%.
Women in Salinas earn 92.8 cents for every dollar earned by a man.
What is Family Income Deficit in Salinas?
Family Income Deficit in Salinas is $11,785.
Families that are below poverty line in Salinas earn $11,785 less on average than the poverty threshold level.
What is Inequality or Gini Index in Salinas?
Inequality or Gini Index in Salinas is 0.54.
What is the Total Population of Salinas?
Total Population of Salinas is 4,358.
What is the Total Male Population of Salinas?
Total Male Population of Salinas is 1,898.
What is the Total Female Population of Salinas?
Total Female Population of Salinas is 2,460.
What is the Ratio of Males per 100 Females in Salinas?
There are 77.15 Males per 100 Females in Salinas.
What is the Ratio of Females per 100 Males in Salinas?
There are 129.61 Females per 100 Males in Salinas.
What is the Median Population Age in Salinas?
Median Population Age in Salinas is 47.7 Years.
What is the Average Family Size in Salinas
Average Family Size in Salinas is 3.1 People.
What is the Average Household Size in Salinas
Average Household Size in Salinas is 2.5 People.
How Large is the Labor Force in Salinas?
There are 1,189 People in the Labor Forcein in Salinas.
What is the Percentage of People in the Labor Force in Salinas?
32.8% of People are in the Labor Force in Salinas.
What is the Unemployment Rate in Salinas?
Unemployment Rate in Salinas is 2.1%.