Sabana Hoyos, PR Map & Demographics
Sabana Hoyos Map
Sabana Hoyos Overview
$15,689
PER CAPITA INCOME
$28,071
AVG FAMILY INCOME
$26,582
AVG HOUSEHOLD INCOME
35.9%
WAGE / INCOME GAP [ % ]
64.1¢/ $1
WAGE / INCOME GAP [ $ ]
$8,529
FAMILY INCOME DEFICIT
0.52
INEQUALITY / GINI INDEX
3,154
TOTAL POPULATION
1,563
MALE POPULATION
1,591
FEMALE POPULATION
98.24
MALES / 100 FEMALES
101.79
FEMALES / 100 MALES
47.7
MEDIAN AGE
3.2
AVG FAMILY SIZE
2.7
AVG HOUSEHOLD SIZE
1,100
LABOR FORCE [ PEOPLE ]
40.1%
PERCENT IN LABOR FORCE
13.8%
UNEMPLOYMENT RATE
Sabana Hoyos Zip Codes
Sabana Hoyos Area Codes
Income in Sabana Hoyos
Income Overview in Sabana Hoyos
Per Capita Income in Sabana Hoyos is $15,689, while median incomes of families and households are $28,071 and $26,582 respectively.
| Characteristic | Number | Measure |
| Per Capita Income | 3,154 | $15,689 |
| Median Family Income | 840 | $28,071 |
| Mean Family Income | 840 | $42,281 |
| Median Household Income | 1,154 | $26,582 |
| Mean Household Income | 1,154 | $37,027 |
| Income Deficit | 840 | $8,529 |
| Wage / Income Gap (%) | 3,154 | 35.87% |
| Wage / Income Gap ($) | 3,154 | 64.13¢ per $1 |
| Gini / Inequality Index | 3,154 | 0.52 |
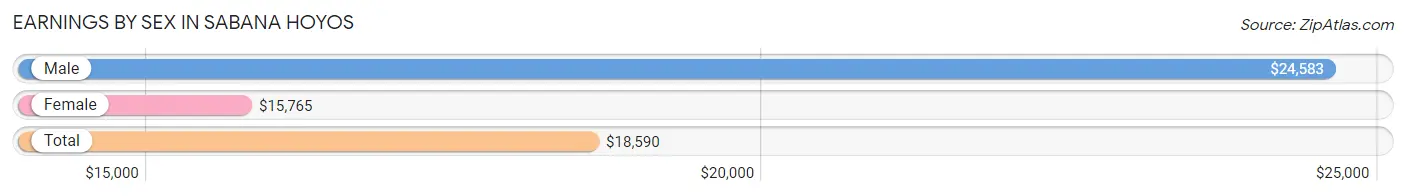
Earnings by Sex in Sabana Hoyos
Average Earnings in Sabana Hoyos are $18,590, $24,583 for men and $15,765 for women, a difference of 35.9%.
| Sex | Number | Average Earnings |
| Male | 600 (58.3%) | $24,583 |
| Female | 430 (41.7%) | $15,765 |
| Total | 1,030 (100.0%) | $18,590 |
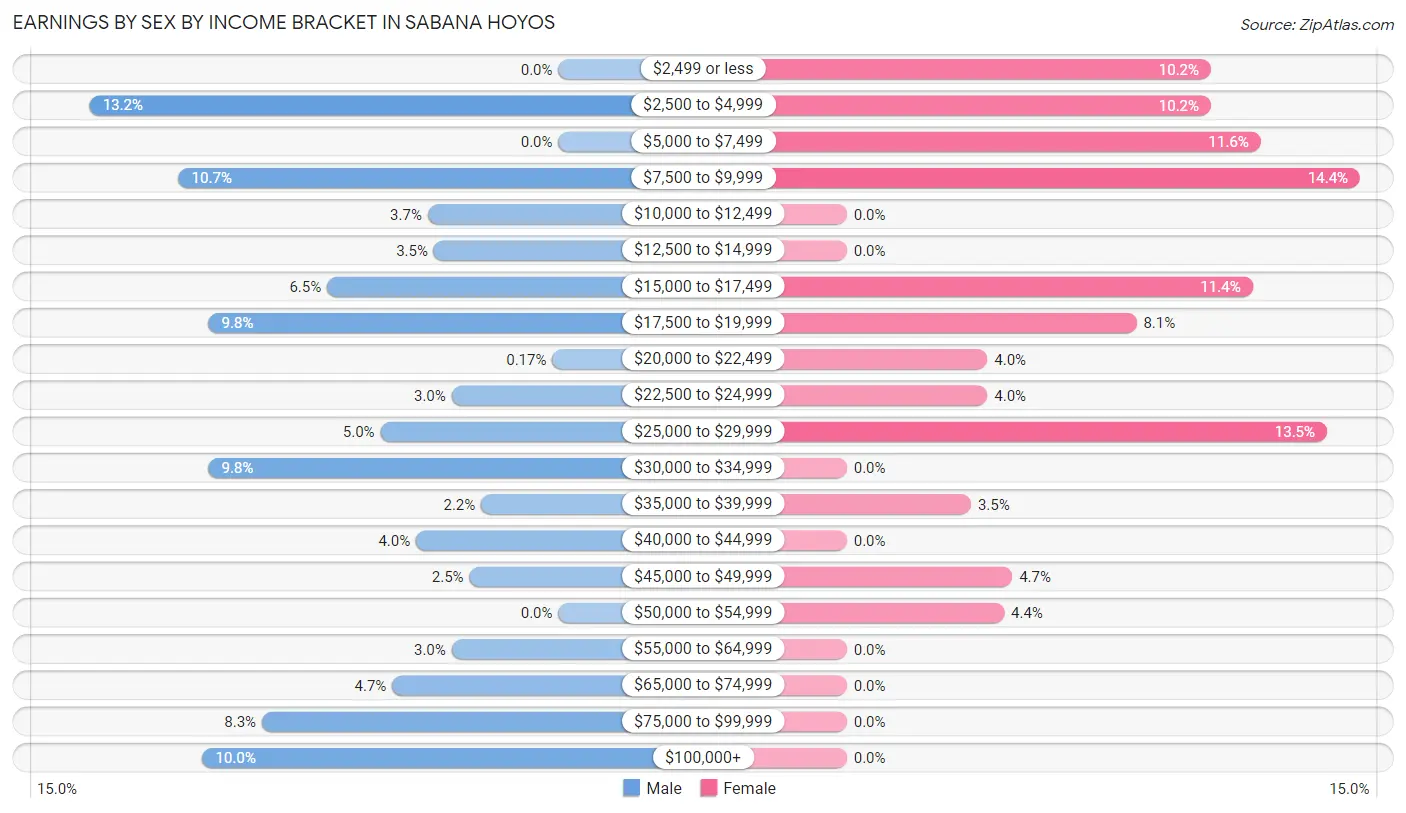
Earnings by Sex by Income Bracket in Sabana Hoyos
The most common earnings brackets in Sabana Hoyos are $2,500 to $4,999 for men (79 | 13.2%) and $7,500 to $9,999 for women (62 | 14.4%).
| Income | Male | Female |
| $2,499 or less | 0 (0.0%) | 44 (10.2%) |
| $2,500 to $4,999 | 79 (13.2%) | 44 (10.2%) |
| $5,000 to $7,499 | 0 (0.0%) | 50 (11.6%) |
| $7,500 to $9,999 | 64 (10.7%) | 62 (14.4%) |
| $10,000 to $12,499 | 22 (3.7%) | 0 (0.0%) |
| $12,500 to $14,999 | 21 (3.5%) | 0 (0.0%) |
| $15,000 to $17,499 | 39 (6.5%) | 49 (11.4%) |
| $17,500 to $19,999 | 59 (9.8%) | 35 (8.1%) |
| $20,000 to $22,499 | 1 (0.2%) | 17 (4.0%) |
| $22,500 to $24,999 | 18 (3.0%) | 17 (4.0%) |
| $25,000 to $29,999 | 30 (5.0%) | 58 (13.5%) |
| $30,000 to $34,999 | 59 (9.8%) | 0 (0.0%) |
| $35,000 to $39,999 | 13 (2.2%) | 15 (3.5%) |
| $40,000 to $44,999 | 24 (4.0%) | 0 (0.0%) |
| $45,000 to $49,999 | 15 (2.5%) | 20 (4.6%) |
| $50,000 to $54,999 | 0 (0.0%) | 19 (4.4%) |
| $55,000 to $64,999 | 18 (3.0%) | 0 (0.0%) |
| $65,000 to $74,999 | 28 (4.7%) | 0 (0.0%) |
| $75,000 to $99,999 | 50 (8.3%) | 0 (0.0%) |
| $100,000+ | 60 (10.0%) | 0 (0.0%) |
| Total | 600 (100.0%) | 430 (100.0%) |
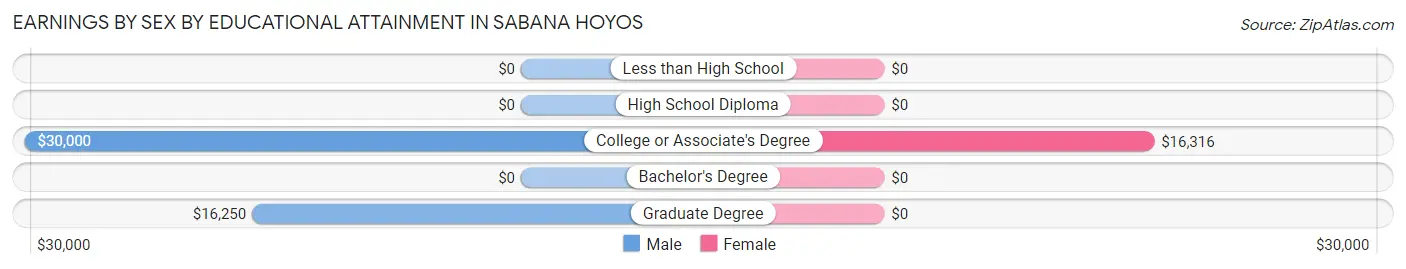
Earnings by Sex by Educational Attainment in Sabana Hoyos
Average earnings in Sabana Hoyos are $30,804 for men and $18,286 for women, a difference of 40.6%. Men with an educational attainment of college or associate's degree enjoy the highest average annual earnings of $30,000, while those with graduate degree education earn the least with $16,250. Women with an educational attainment of college or associate's degree earn the most with the average annual earnings of $16,316, while those with college or associate's degree education have the smallest earnings of $16,316.
| Educational Attainment | Male Income | Female Income |
| Less than High School | - | - |
| High School Diploma | - | - |
| College or Associate's Degree | $30,000 | $16,316 |
| Bachelor's Degree | - | - |
| Graduate Degree | $16,250 | $0 |
| Total | $30,804 | $18,286 |
Family Income in Sabana Hoyos
Family Income Brackets in Sabana Hoyos
According to the Sabana Hoyos family income data, there are 164 families falling into the $15,000 to $24,999 income range, which is the most common income bracket and makes up 19.5% of all families.
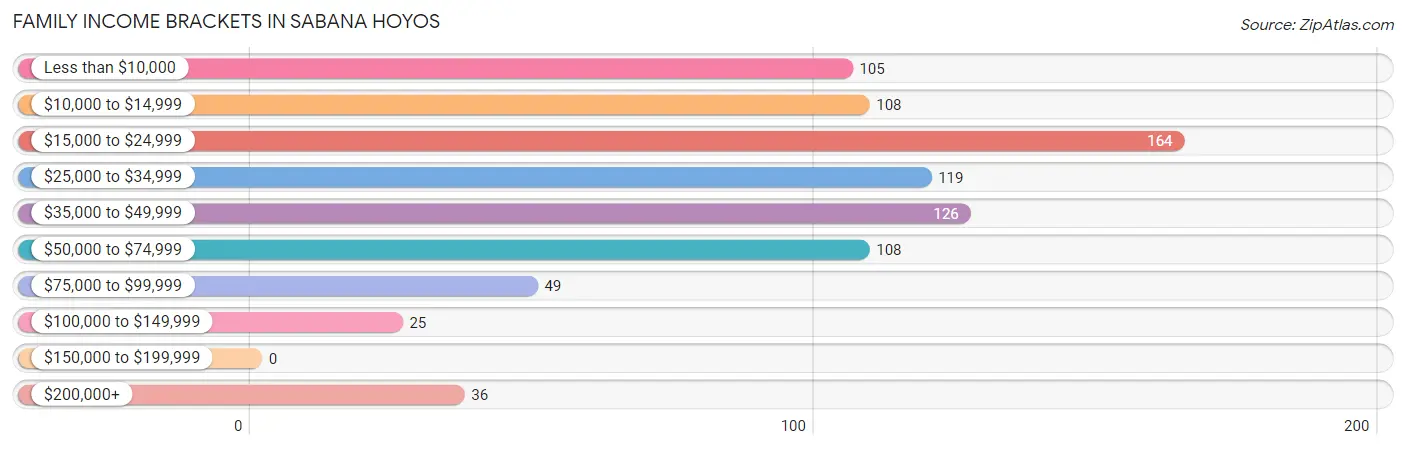
| Income Bracket | # Families | % Families |
| Less than $10,000 | 105 | 12.5% |
| $10,000 to $14,999 | 108 | 12.9% |
| $15,000 to $24,999 | 164 | 19.5% |
| $25,000 to $34,999 | 119 | 14.2% |
| $35,000 to $49,999 | 126 | 15.0% |
| $50,000 to $74,999 | 108 | 12.9% |
| $75,000 to $99,999 | 49 | 5.8% |
| $100,000 to $149,999 | 25 | 3.0% |
| $150,000 to $199,999 | 0 | 0.0% |
| $200,000+ | 36 | 4.3% |
Family Income by Famaliy Size in Sabana Hoyos
5-person families (63 | 7.5%) account for the highest median family income in Sabana Hoyos with $45,347 per family, while 2-person families (460 | 54.8%) have the highest median income of $13,264 per family member.
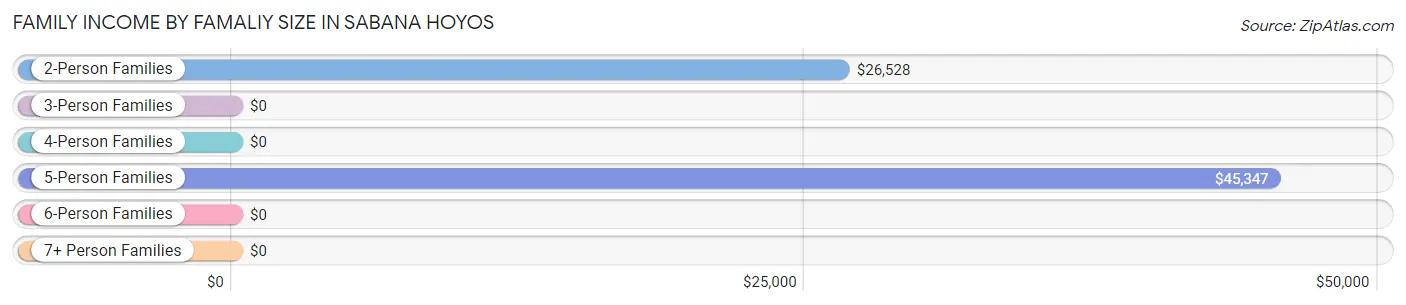
| Income Bracket | # Families | Median Income |
| 2-Person Families | 460 (54.8%) | $26,528 |
| 3-Person Families | 251 (29.9%) | $0 |
| 4-Person Families | 66 (7.9%) | $0 |
| 5-Person Families | 63 (7.5%) | $45,347 |
| 6-Person Families | 0 (0.0%) | $0 |
| 7+ Person Families | 0 (0.0%) | $0 |
| Total | 840 (100.0%) | $28,071 |
Family Income by Number of Earners in Sabana Hoyos
The median family income in Sabana Hoyos is $28,071, with families comprising 2 earners (113) having the highest median family income of $66,597, while families with no earners (348) have the lowest median family income of $16,739, accounting for 13.5% and 41.4% of families, respectively.
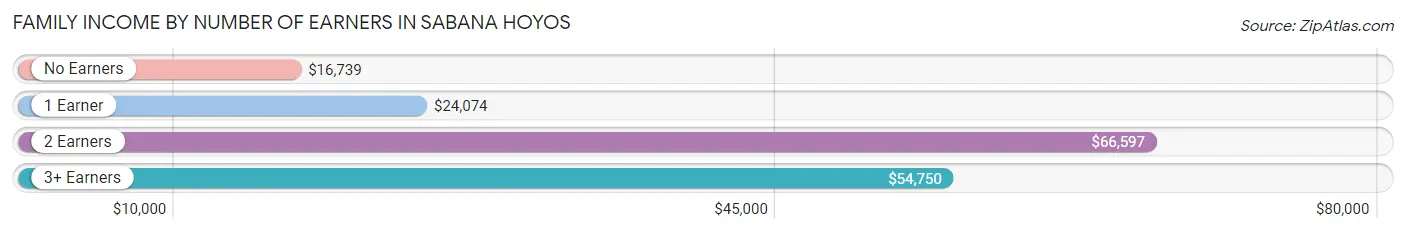
| Number of Earners | # Families | Median Income |
| No Earners | 348 (41.4%) | $16,739 |
| 1 Earner | 318 (37.9%) | $24,074 |
| 2 Earners | 113 (13.5%) | $66,597 |
| 3+ Earners | 61 (7.3%) | $54,750 |
| Total | 840 (100.0%) | $28,071 |
Household Income in Sabana Hoyos
Household Income Brackets in Sabana Hoyos
With 233 households falling in the category, the less than $10,000 income range is the most frequent in Sabana Hoyos, accounting for 20.2% of all households.
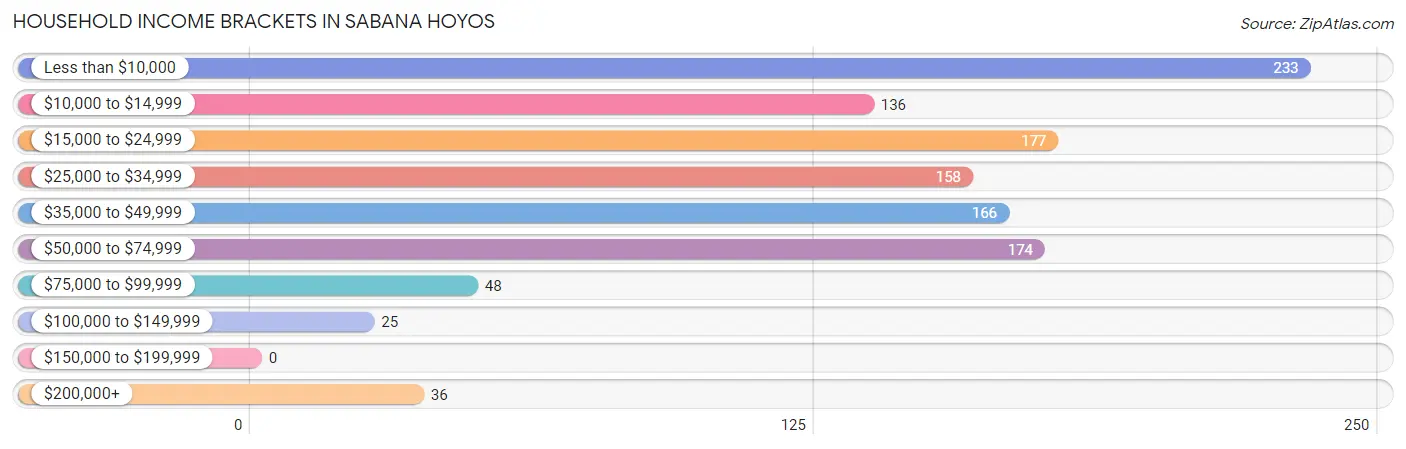
| Income Bracket | # Households | % Households |
| Less than $10,000 | 233 | 20.2% |
| $10,000 to $14,999 | 136 | 11.8% |
| $15,000 to $24,999 | 177 | 15.3% |
| $25,000 to $34,999 | 158 | 13.7% |
| $35,000 to $49,999 | 166 | 14.4% |
| $50,000 to $74,999 | 174 | 15.1% |
| $75,000 to $99,999 | 48 | 4.2% |
| $100,000 to $149,999 | 25 | 2.2% |
| $150,000 to $199,999 | 0 | 0.0% |
| $200,000+ | 36 | 3.1% |
Household Income by Householder Age in Sabana Hoyos
The median household income in Sabana Hoyos is $26,582, with the highest median household income of $28,450 found in the 25 to 44 years age bracket for the primary householder. A total of 257 households (22.3%) fall into this category.
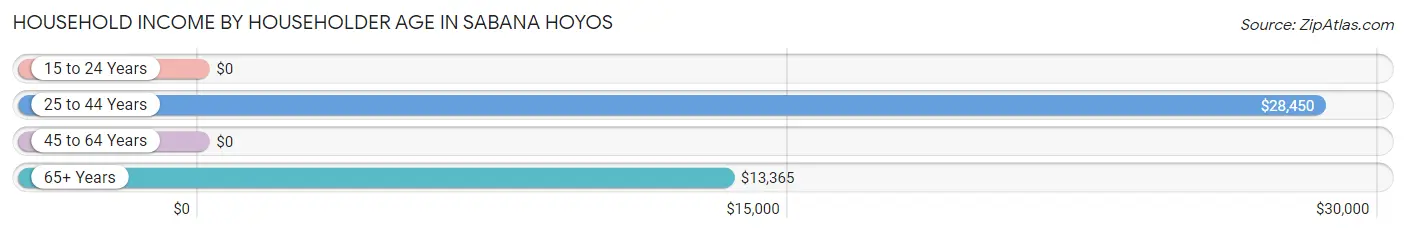
| Income Bracket | # Households | Median Income |
| 15 to 24 Years | 0 (0.0%) | $0 |
| 25 to 44 Years | 257 (22.3%) | $28,450 |
| 45 to 64 Years | 431 (37.3%) | $0 |
| 65+ Years | 466 (40.4%) | $13,365 |
| Total | 1,154 (100.0%) | $26,582 |
Poverty in Sabana Hoyos
Income Below Poverty by Sex and Age in Sabana Hoyos
With 43.1% poverty level for males and 49.7% for females among the residents of Sabana Hoyos, 16 and 17 year old males and under 5 year old females are the most vulnerable to poverty, with 39 males (100.0%) and 19 females (100.0%) in their respective age groups living below the poverty level.
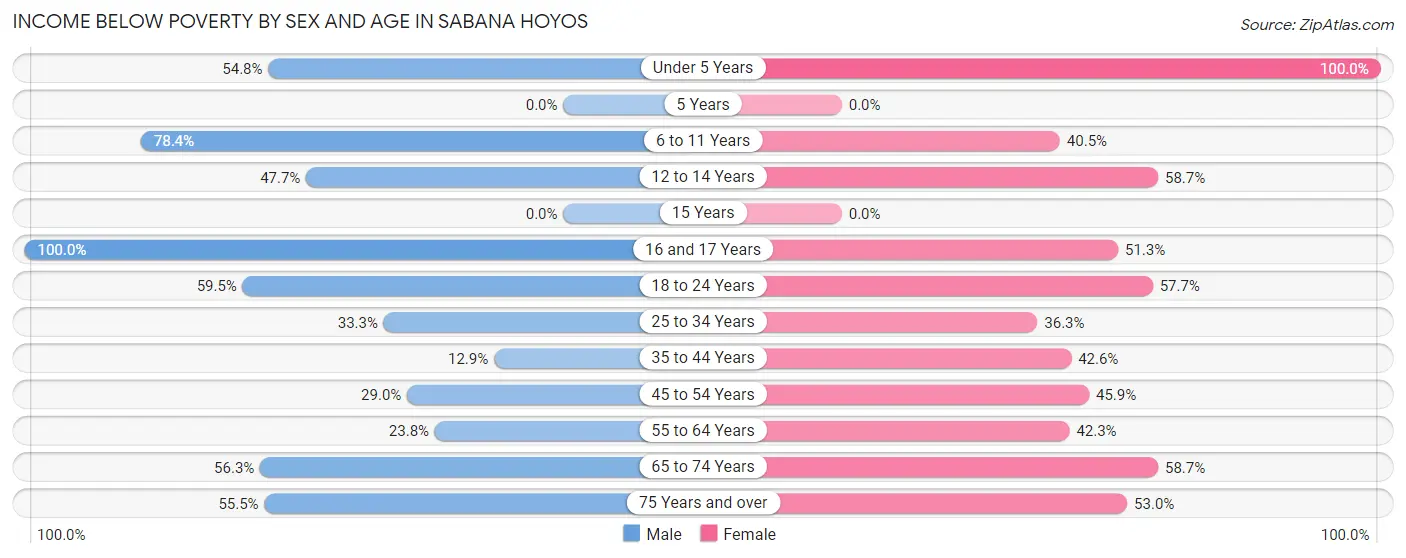
| Age Bracket | Male | Female |
| Under 5 Years | 23 (54.8%) | 19 (100.0%) |
| 5 Years | 0 (0.0%) | 0 (0.0%) |
| 6 to 11 Years | 69 (78.4%) | 34 (40.5%) |
| 12 to 14 Years | 63 (47.7%) | 27 (58.7%) |
| 15 Years | 0 (0.0%) | 0 (0.0%) |
| 16 and 17 Years | 39 (100.0%) | 20 (51.3%) |
| 18 to 24 Years | 100 (59.5%) | 101 (57.7%) |
| 25 to 34 Years | 53 (33.3%) | 49 (36.3%) |
| 35 to 44 Years | 18 (12.9%) | 66 (42.6%) |
| 45 to 54 Years | 49 (29.0%) | 134 (45.9%) |
| 55 to 64 Years | 67 (23.8%) | 71 (42.3%) |
| 65 to 74 Years | 112 (56.3%) | 172 (58.7%) |
| 75 Years and over | 81 (55.5%) | 98 (53.0%) |
| Total | 674 (43.1%) | 791 (49.7%) |
Income Above Poverty by Sex and Age in Sabana Hoyos
According to the poverty statistics in Sabana Hoyos, males aged 35 to 44 years and females aged 25 to 34 years are the age groups that are most secure financially, with 87.1% of males and 63.7% of females in these age groups living above the poverty line.
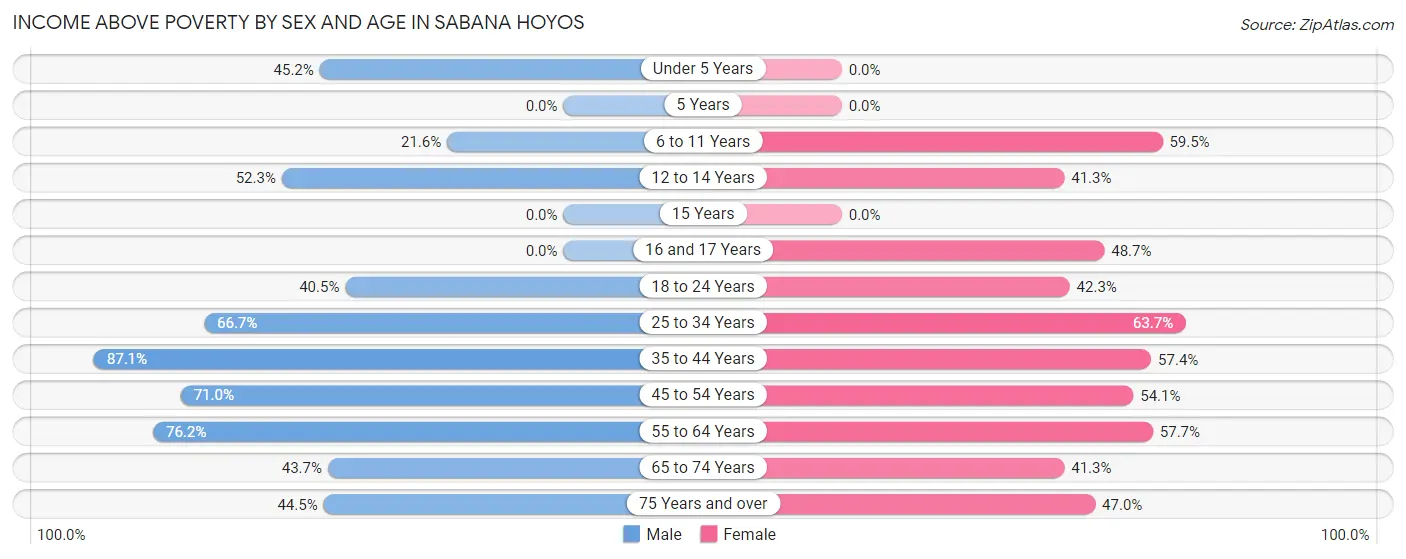
| Age Bracket | Male | Female |
| Under 5 Years | 19 (45.2%) | 0 (0.0%) |
| 5 Years | 0 (0.0%) | 0 (0.0%) |
| 6 to 11 Years | 19 (21.6%) | 50 (59.5%) |
| 12 to 14 Years | 69 (52.3%) | 19 (41.3%) |
| 15 Years | 0 (0.0%) | 0 (0.0%) |
| 16 and 17 Years | 0 (0.0%) | 19 (48.7%) |
| 18 to 24 Years | 68 (40.5%) | 74 (42.3%) |
| 25 to 34 Years | 106 (66.7%) | 86 (63.7%) |
| 35 to 44 Years | 122 (87.1%) | 89 (57.4%) |
| 45 to 54 Years | 120 (71.0%) | 158 (54.1%) |
| 55 to 64 Years | 214 (76.2%) | 97 (57.7%) |
| 65 to 74 Years | 87 (43.7%) | 121 (41.3%) |
| 75 Years and over | 65 (44.5%) | 87 (47.0%) |
| Total | 889 (56.9%) | 800 (50.3%) |
Income Below Poverty Among Married-Couple Families in Sabana Hoyos
The poverty statistics for married-couple families in Sabana Hoyos show that 28.0% or 147 of the total 525 families live below the poverty line. Families with no children have the highest poverty rate of 32.6%, comprising of 147 families. On the other hand, families with 1 or 2 children have the lowest poverty rate of 0.0%, which includes 0 families.
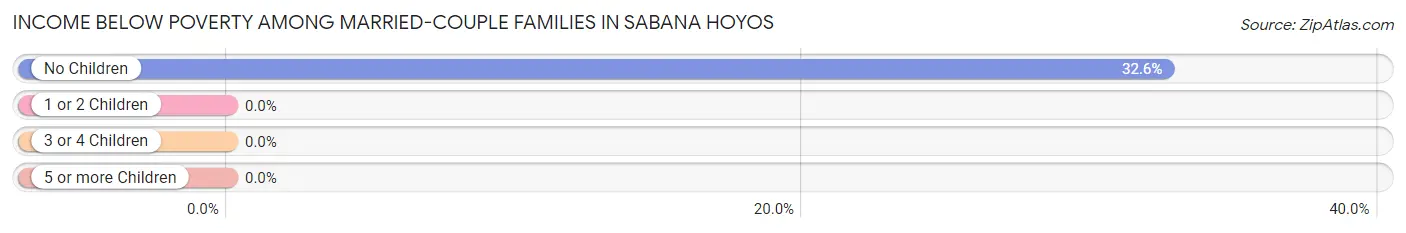
| Children | Above Poverty | Below Poverty |
| No Children | 304 (67.4%) | 147 (32.6%) |
| 1 or 2 Children | 56 (100.0%) | 0 (0.0%) |
| 3 or 4 Children | 18 (100.0%) | 0 (0.0%) |
| 5 or more Children | 0 (0.0%) | 0 (0.0%) |
| Total | 378 (72.0%) | 147 (28.0%) |
Income Below Poverty Among Single-Parent Households in Sabana Hoyos
According to the poverty data in Sabana Hoyos, 80.8% or 42 single-father households and 67.7% or 178 single-mother households are living below the poverty line. Among single-father households, those with 3 or 4 children have the highest poverty rate, with 18 households (100.0%) experiencing poverty. Likewise, among single-mother households, those with 1 or 2 children have the highest poverty rate, with 115 households (87.1%) falling below the poverty line.
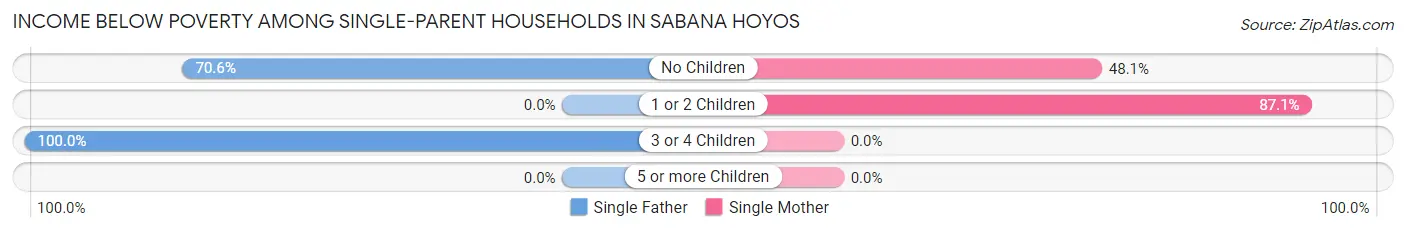
| Children | Single Father | Single Mother |
| No Children | 24 (70.6%) | 63 (48.1%) |
| 1 or 2 Children | 0 (0.0%) | 115 (87.1%) |
| 3 or 4 Children | 18 (100.0%) | 0 (0.0%) |
| 5 or more Children | 0 (0.0%) | 0 (0.0%) |
| Total | 42 (80.8%) | 178 (67.7%) |
Income Below Poverty Among Married-Couple vs Single-Parent Households in Sabana Hoyos
The poverty data for Sabana Hoyos shows that 147 of the married-couple family households (28.0%) and 220 of the single-parent households (69.8%) are living below the poverty level. Within the married-couple family households, those with no children have the highest poverty rate, with 147 households (32.6%) falling below the poverty line. Among the single-parent households, those with 3 or 4 children have the highest poverty rate, with 18 household (100.0%) living below poverty.
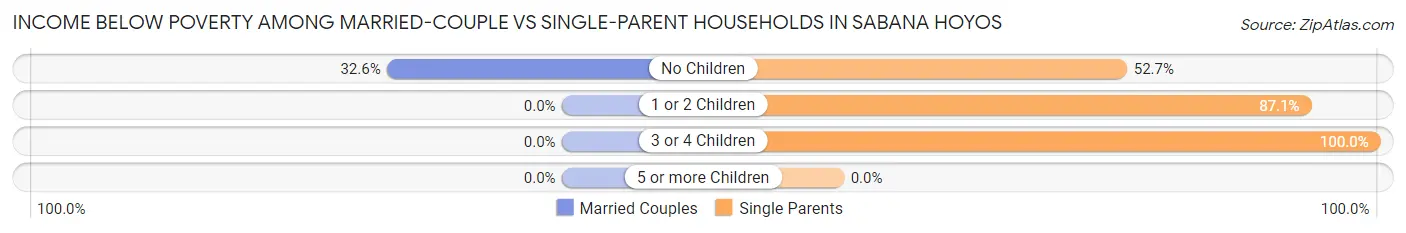
| Children | Married-Couple Families | Single-Parent Households |
| No Children | 147 (32.6%) | 87 (52.7%) |
| 1 or 2 Children | 0 (0.0%) | 115 (87.1%) |
| 3 or 4 Children | 0 (0.0%) | 18 (100.0%) |
| 5 or more Children | 0 (0.0%) | 0 (0.0%) |
| Total | 147 (28.0%) | 220 (69.8%) |
Race in Sabana Hoyos
The most populous races in Sabana Hoyos are Hispanic or Latino (3,154 | 100.0%), White / Caucasian (1,305 | 41.4%), and Some other Race (1,218 | 38.6%).
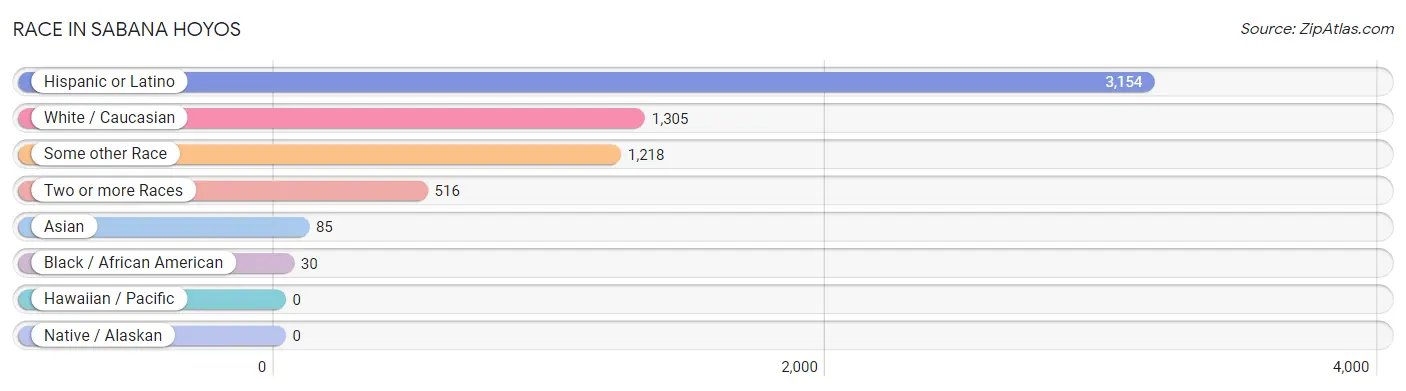
| Race | # Population | % Population |
| Asian | 85 | 2.7% |
| Black / African American | 30 | 0.9% |
| Hawaiian / Pacific | 0 | 0.0% |
| Hispanic or Latino | 3,154 | 100.0% |
| Native / Alaskan | 0 | 0.0% |
| White / Caucasian | 1,305 | 41.4% |
| Two or more Races | 516 | 16.4% |
| Some other Race | 1,218 | 38.6% |
| Total | 3,154 | 100.0% |
Ancestry in Sabana Hoyos
The most populous ancestries reported in Sabana Hoyos are Puerto Rican (3,154 | 100.0%), Thai (85 | 2.7%), and American (51 | 1.6%), together accounting for 104.3% of all Sabana Hoyos residents.
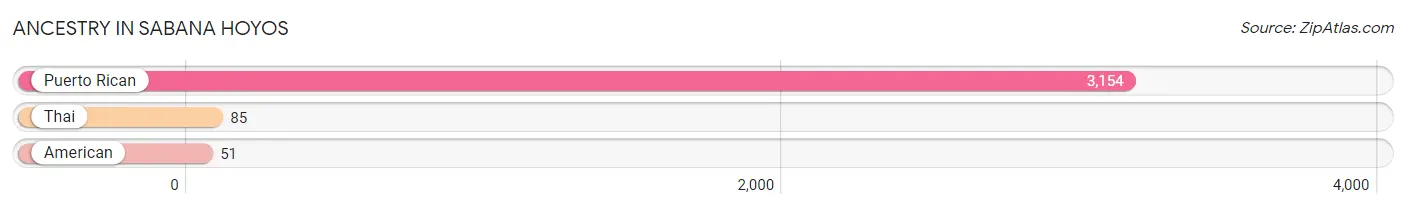
| Ancestry | # Population | % Population |
| American | 51 | 1.6% |
| Puerto Rican | 3,154 | 100.0% |
| Thai | 85 | 2.7% | View All 3 Rows |
Immigrants in Sabana Hoyos

| Immigration Origin | # Population | % Population | View All 0 Rows |
Sex and Age in Sabana Hoyos
Sex and Age in Sabana Hoyos
The most populous age groups in Sabana Hoyos are 10 to 14 Years (179 | 11.5%) for men and 70 to 74 Years (189 | 11.9%) for women.
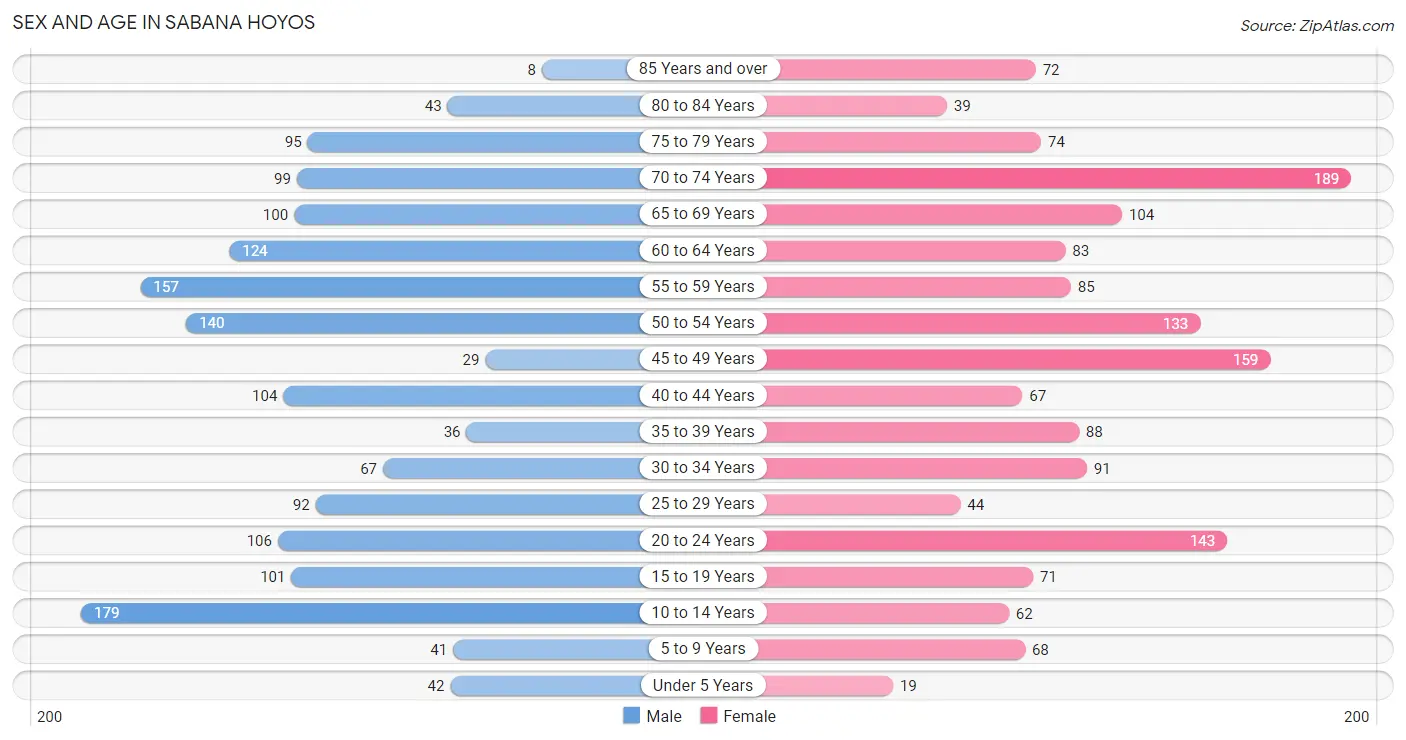
| Age Bracket | Male | Female |
| Under 5 Years | 42 (2.7%) | 19 (1.2%) |
| 5 to 9 Years | 41 (2.6%) | 68 (4.3%) |
| 10 to 14 Years | 179 (11.5%) | 62 (3.9%) |
| 15 to 19 Years | 101 (6.5%) | 71 (4.5%) |
| 20 to 24 Years | 106 (6.8%) | 143 (9.0%) |
| 25 to 29 Years | 92 (5.9%) | 44 (2.8%) |
| 30 to 34 Years | 67 (4.3%) | 91 (5.7%) |
| 35 to 39 Years | 36 (2.3%) | 88 (5.5%) |
| 40 to 44 Years | 104 (6.7%) | 67 (4.2%) |
| 45 to 49 Years | 29 (1.9%) | 159 (10.0%) |
| 50 to 54 Years | 140 (9.0%) | 133 (8.4%) |
| 55 to 59 Years | 157 (10.0%) | 85 (5.3%) |
| 60 to 64 Years | 124 (7.9%) | 83 (5.2%) |
| 65 to 69 Years | 100 (6.4%) | 104 (6.5%) |
| 70 to 74 Years | 99 (6.3%) | 189 (11.9%) |
| 75 to 79 Years | 95 (6.1%) | 74 (4.6%) |
| 80 to 84 Years | 43 (2.8%) | 39 (2.5%) |
| 85 Years and over | 8 (0.5%) | 72 (4.5%) |
| Total | 1,563 (100.0%) | 1,591 (100.0%) |
Families and Households in Sabana Hoyos
Median Family Size in Sabana Hoyos
The median family size in Sabana Hoyos is 3.23 persons per family, with single male/father families (52 | 6.2%) accounting for the largest median family size of 4.06 persons per family. On the other hand, married-couple families (525 | 62.5%) represent the smallest median family size with 3.17 persons per family.
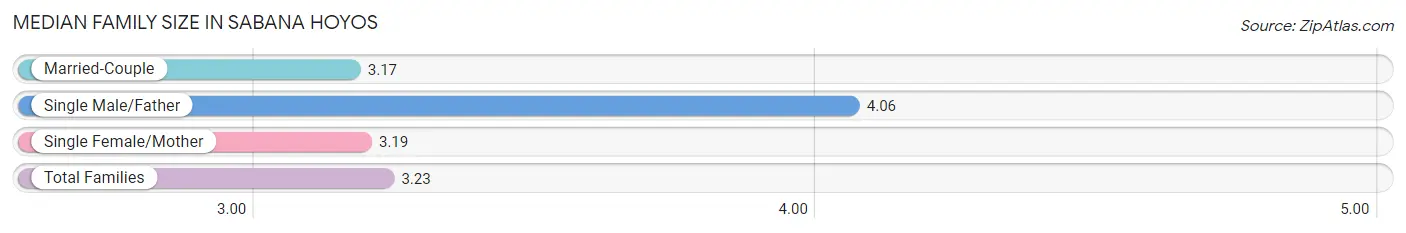
| Family Type | # Families | Family Size |
| Married-Couple | 525 (62.5%) | 3.17 |
| Single Male/Father | 52 (6.2%) | 4.06 |
| Single Female/Mother | 263 (31.3%) | 3.19 |
| Total Families | 840 (100.0%) | 3.23 |
Median Household Size in Sabana Hoyos
The median household size in Sabana Hoyos is 2.73 persons per household, with single male/father households (52 | 4.5%) accounting for the largest median household size of 4.42 persons per household. non-family households (314 | 27.2%) represent the smallest median household size with 1.08 persons per household.
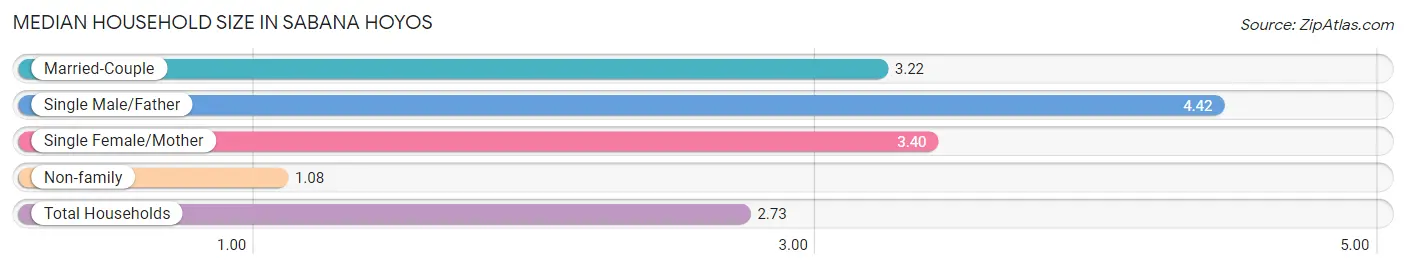
| Household Type | # Households | Household Size |
| Married-Couple | 525 (45.5%) | 3.22 |
| Single Male/Father | 52 (4.5%) | 4.42 |
| Single Female/Mother | 263 (22.8%) | 3.40 |
| Non-family | 314 (27.2%) | 1.08 |
| Total Households | 1,154 (100.0%) | 2.73 |
Household Size by Marriage Status in Sabana Hoyos
Out of a total of 1,154 households in Sabana Hoyos, 840 (72.8%) are family households, while 314 (27.2%) are nonfamily households. The most numerous type of family households are 2-person households, comprising 428, and the most common type of nonfamily households are 1-person households, comprising 291.
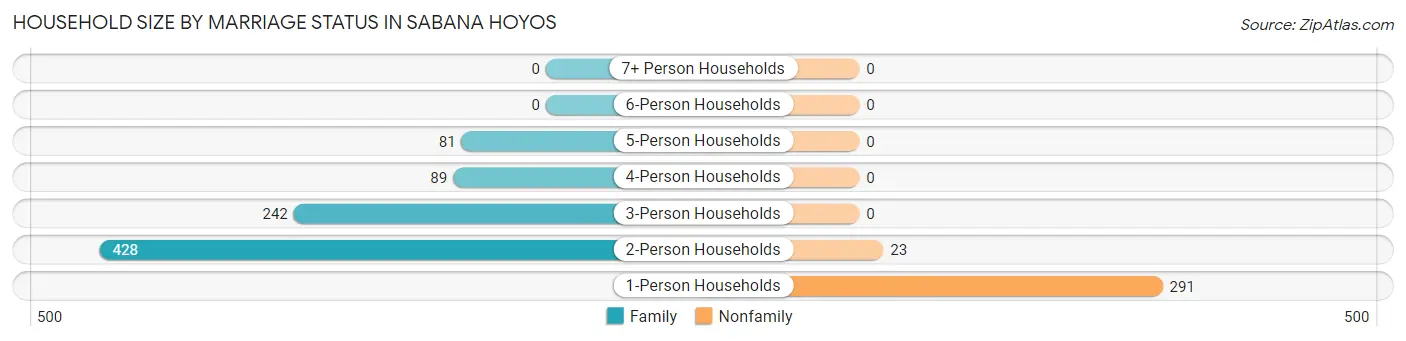
| Household Size | Family Households | Nonfamily Households |
| 1-Person Households | - | 291 (25.2%) |
| 2-Person Households | 428 (37.1%) | 23 (2.0%) |
| 3-Person Households | 242 (21.0%) | 0 (0.0%) |
| 4-Person Households | 89 (7.7%) | 0 (0.0%) |
| 5-Person Households | 81 (7.0%) | 0 (0.0%) |
| 6-Person Households | 0 (0.0%) | 0 (0.0%) |
| 7+ Person Households | 0 (0.0%) | 0 (0.0%) |
| Total | 840 (72.8%) | 314 (27.2%) |
Female Fertility in Sabana Hoyos
Fertility by Age in Sabana Hoyos
Average fertility rate in Sabana Hoyos is 24.0 births per 1,000 women. Women in the age bracket of 35 to 50 years have the highest fertility rate with 46.0 births per 1,000 women. Women in the age bracket of 35 to 50 years acount for 100.0% of all women with births.
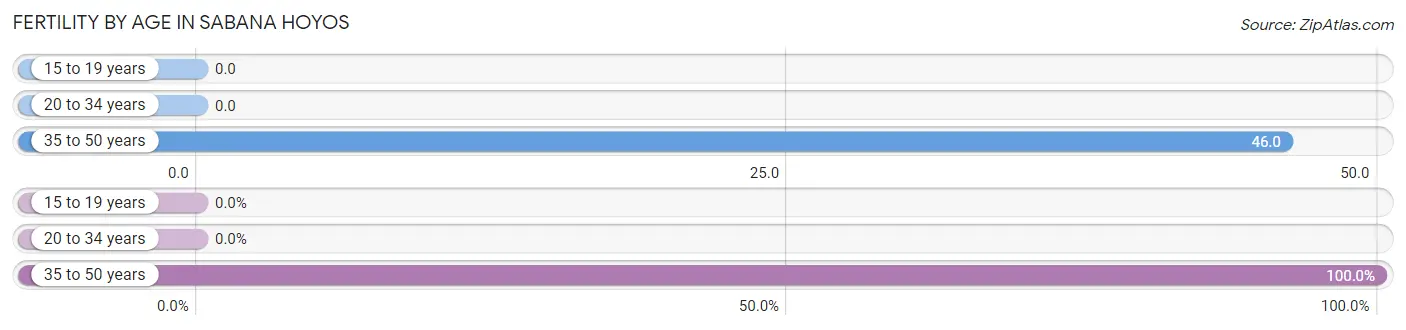
| Age Bracket | Women with Births | Births / 1,000 Women |
| 15 to 19 years | 0 (0.0%) | 0.0 |
| 20 to 34 years | 0 (0.0%) | 0.0 |
| 35 to 50 years | 17 (100.0%) | 46.0 |
| Total | 17 (100.0%) | 24.0 |
Fertility by Age by Marriage Status in Sabana Hoyos
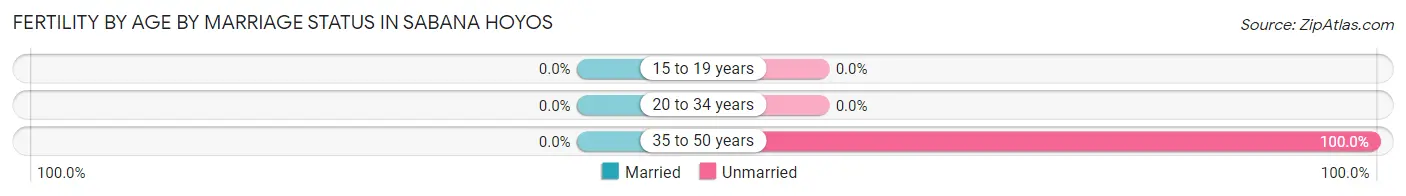
| Age Bracket | Married | Unmarried |
| 15 to 19 years | 0 (0.0%) | 0 (0.0%) |
| 20 to 34 years | 0 (0.0%) | 0 (0.0%) |
| 35 to 50 years | 0 (0.0%) | 17 (100.0%) |
| Total | 0 (0.0%) | 17 (100.0%) |
Fertility by Education in Sabana Hoyos
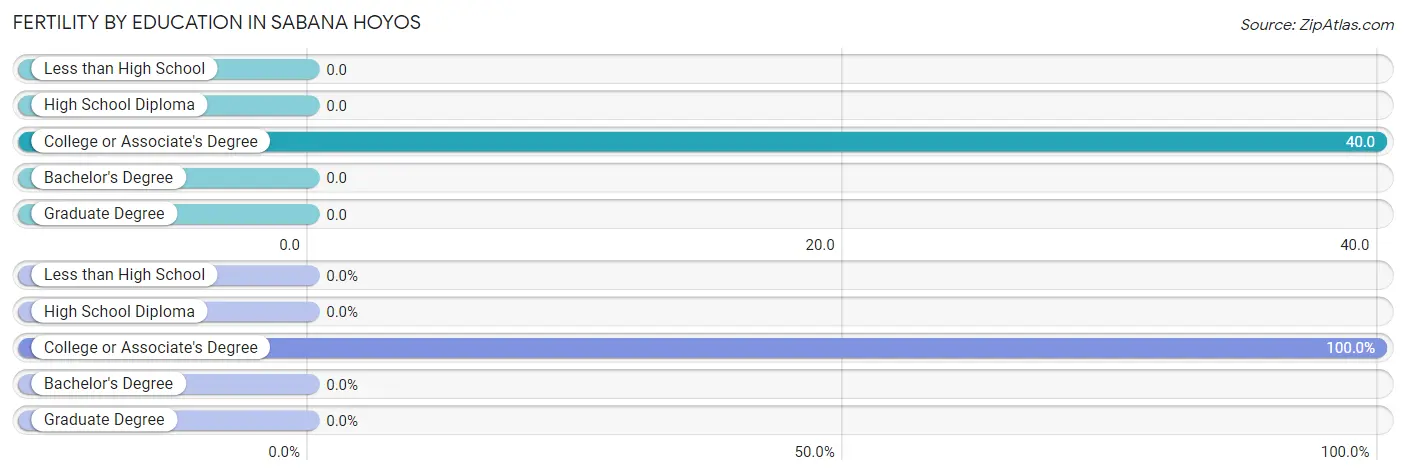
| Educational Attainment | Women with Births | Births / 1,000 Women |
| Less than High School | 0 (0.0%) | 0.0 |
| High School Diploma | 0 (0.0%) | 0.0 |
| College or Associate's Degree | 17 (100.0%) | 40.0 |
| Bachelor's Degree | 0 (0.0%) | 0.0 |
| Graduate Degree | 0 (0.0%) | 0.0 |
| Total | 17 (100.0%) | 24.0 |
Fertility by Education by Marriage Status in Sabana Hoyos
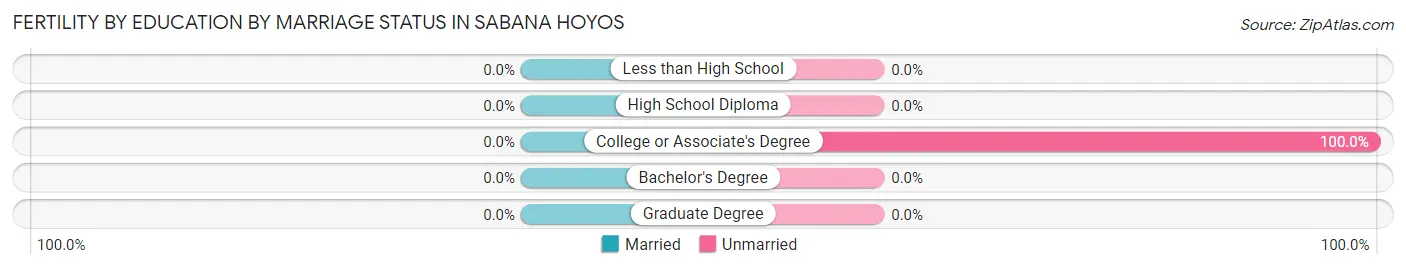
| Educational Attainment | Married | Unmarried |
| Less than High School | 0 (0.0%) | 0 (0.0%) |
| High School Diploma | 0 (0.0%) | 0 (0.0%) |
| College or Associate's Degree | 0 (0.0%) | 17 (100.0%) |
| Bachelor's Degree | 0 (0.0%) | 0 (0.0%) |
| Graduate Degree | 0 (0.0%) | 0 (0.0%) |
| Total | 0 (0.0%) | 17 (100.0%) |
Employment Characteristics in Sabana Hoyos
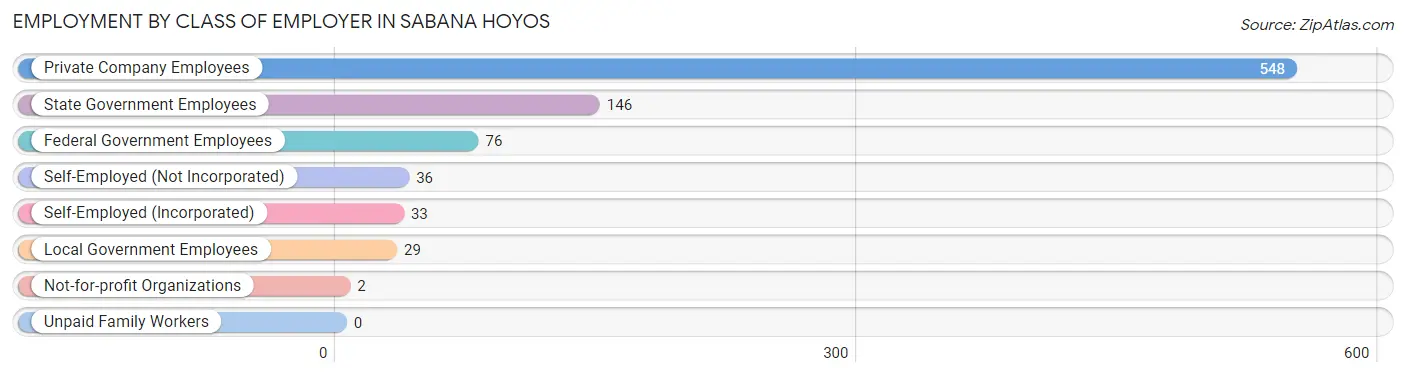
Employment by Class of Employer in Sabana Hoyos
Among the 870 employed individuals in Sabana Hoyos, private company employees (548 | 63.0%), state government employees (146 | 16.8%), and federal government employees (76 | 8.7%) make up the most common classes of employment.
| Employer Class | # Employees | % Employees |
| Private Company Employees | 548 | 63.0% |
| Self-Employed (Incorporated) | 33 | 3.8% |
| Self-Employed (Not Incorporated) | 36 | 4.1% |
| Not-for-profit Organizations | 2 | 0.2% |
| Local Government Employees | 29 | 3.3% |
| State Government Employees | 146 | 16.8% |
| Federal Government Employees | 76 | 8.7% |
| Unpaid Family Workers | 0 | 0.0% |
| Total | 870 | 100.0% |
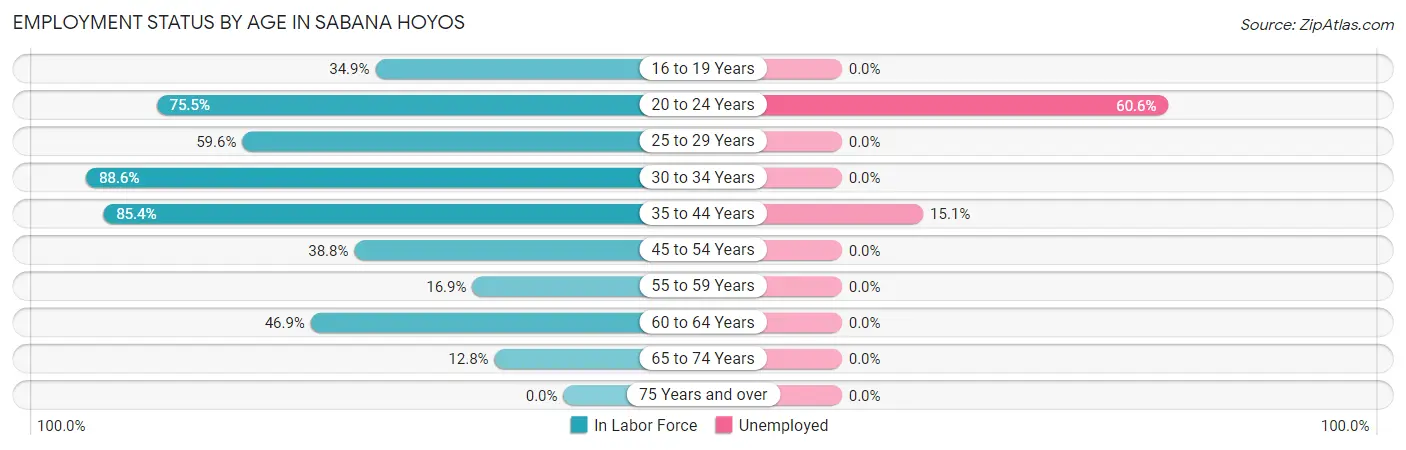
Employment Status by Age in Sabana Hoyos
According to the labor force statistics for Sabana Hoyos, out of the total population over 16 years of age (2,743), 40.1% or 1,100 individuals are in the labor force, with 13.8% or 152 of them unemployed. The age group with the highest labor force participation rate is 30 to 34 years, with 88.6% or 140 individuals in the labor force. Within the labor force, the 20 to 24 years age range has the highest percentage of unemployed individuals, with 60.6% or 114 of them being unemployed.
| Age Bracket | In Labor Force | Unemployed |
| 16 to 19 Years | 60 (34.9%) | 0 (0.0%) |
| 20 to 24 Years | 188 (75.5%) | 114 (60.6%) |
| 25 to 29 Years | 81 (59.6%) | 0 (0.0%) |
| 30 to 34 Years | 140 (88.6%) | 0 (0.0%) |
| 35 to 44 Years | 252 (85.4%) | 38 (15.1%) |
| 45 to 54 Years | 179 (38.8%) | 0 (0.0%) |
| 55 to 59 Years | 41 (16.9%) | 0 (0.0%) |
| 60 to 64 Years | 97 (46.9%) | 0 (0.0%) |
| 65 to 74 Years | 63 (12.8%) | 0 (0.0%) |
| 75 Years and over | 0 (0.0%) | 0 (0.0%) |
| Total | 1,100 (40.1%) | 152 (13.8%) |
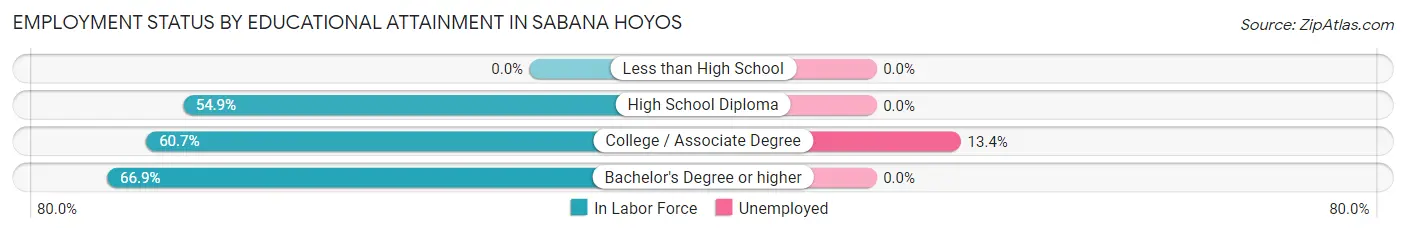
Employment Status by Educational Attainment in Sabana Hoyos
According to labor force statistics for Sabana Hoyos, 52.7% of individuals (790) out of the total population between 25 and 64 years of age (1,499) are in the labor force, with 4.8% or 38 of them being unemployed. The group with the highest labor force participation rate are those with the educational attainment of bachelor's degree or higher, with 66.9% or 309 individuals in the labor force. Within the labor force, individuals with college / associate degree education have the highest percentage of unemployment, with 13.4% or 38 of them being unemployed.
| Educational Attainment | In Labor Force | Unemployed |
| Less than High School | 0 (0.0%) | 0 (0.0%) |
| High School Diploma | 197 (54.9%) | 0 (0.0%) |
| College / Associate Degree | 284 (60.7%) | 63 (13.4%) |
| Bachelor's Degree or higher | 309 (66.9%) | 0 (0.0%) |
| Total | 790 (52.7%) | 72 (4.8%) |
Employment Occupations by Sex in Sabana Hoyos
Management, Business, Science and Arts Occupations
The most common Management, Business, Science and Arts occupations in Sabana Hoyos are Community & Social Service (132 | 13.9%), Education Instruction & Library (100 | 10.5%), Health Diagnosing & Treating (90 | 9.5%), Computers, Engineering & Science (41 | 4.3%), and Legal Services & Support (30 | 3.2%).
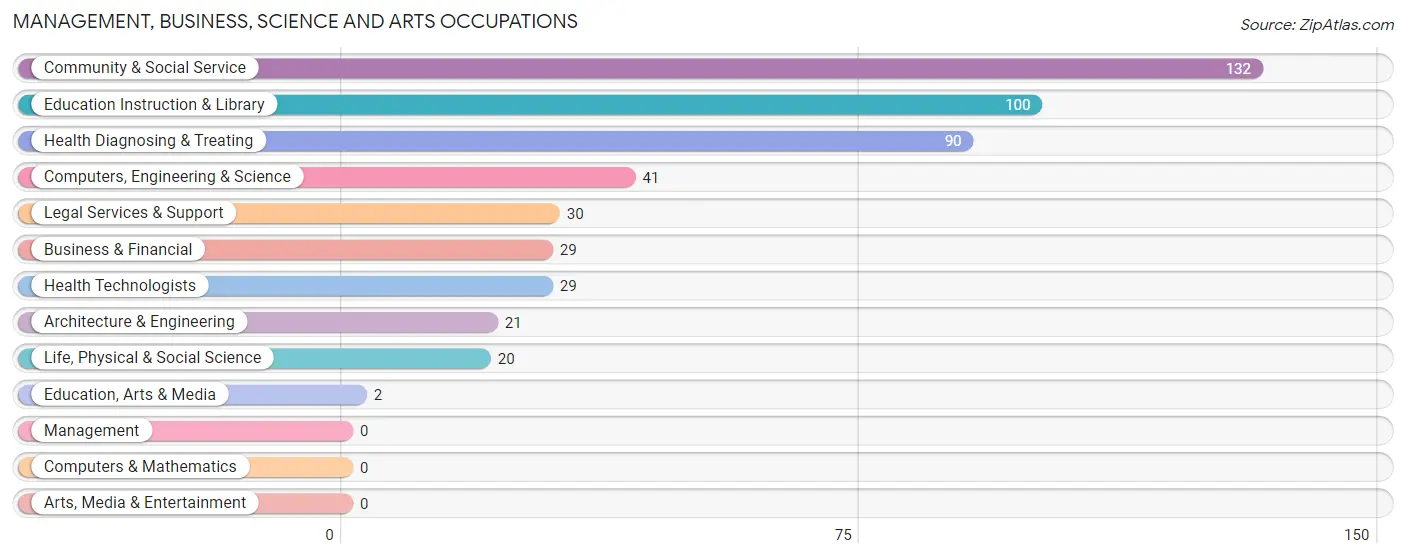
Management, Business, Science and Arts Occupations by Sex
Within the Management, Business, Science and Arts occupations in Sabana Hoyos, the most male-oriented occupations are Business & Financial (100.0%), Architecture & Engineering (100.0%), and Education, Arts & Media (100.0%), while the most female-oriented occupations are Life, Physical & Social Science (100.0%), Education Instruction & Library (71.0%), and Health Technologists (58.6%).
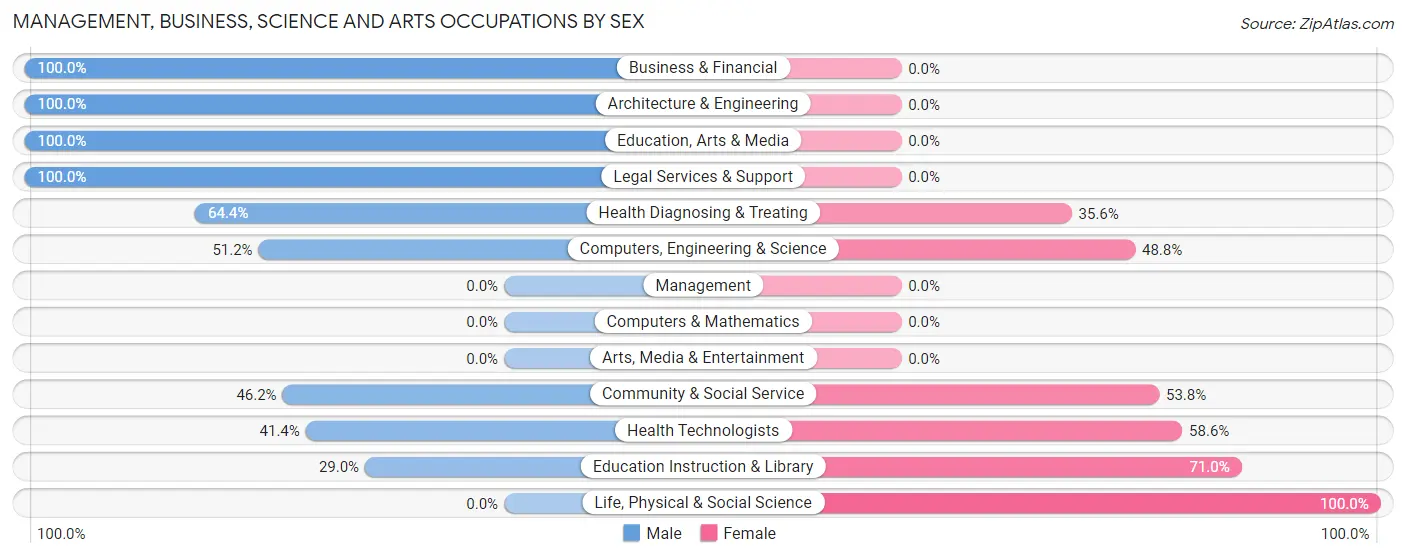
| Occupation | Male | Female |
| Management | 0 (0.0%) | 0 (0.0%) |
| Business & Financial | 29 (100.0%) | 0 (0.0%) |
| Computers, Engineering & Science | 21 (51.2%) | 20 (48.8%) |
| Computers & Mathematics | 0 (0.0%) | 0 (0.0%) |
| Architecture & Engineering | 21 (100.0%) | 0 (0.0%) |
| Life, Physical & Social Science | 0 (0.0%) | 20 (100.0%) |
| Community & Social Service | 61 (46.2%) | 71 (53.8%) |
| Education, Arts & Media | 2 (100.0%) | 0 (0.0%) |
| Legal Services & Support | 30 (100.0%) | 0 (0.0%) |
| Education Instruction & Library | 29 (29.0%) | 71 (71.0%) |
| Arts, Media & Entertainment | 0 (0.0%) | 0 (0.0%) |
| Health Diagnosing & Treating | 58 (64.4%) | 32 (35.6%) |
| Health Technologists | 12 (41.4%) | 17 (58.6%) |
| Total (Category) | 169 (57.9%) | 123 (42.1%) |
| Total (Overall) | 569 (60.0%) | 380 (40.0%) |
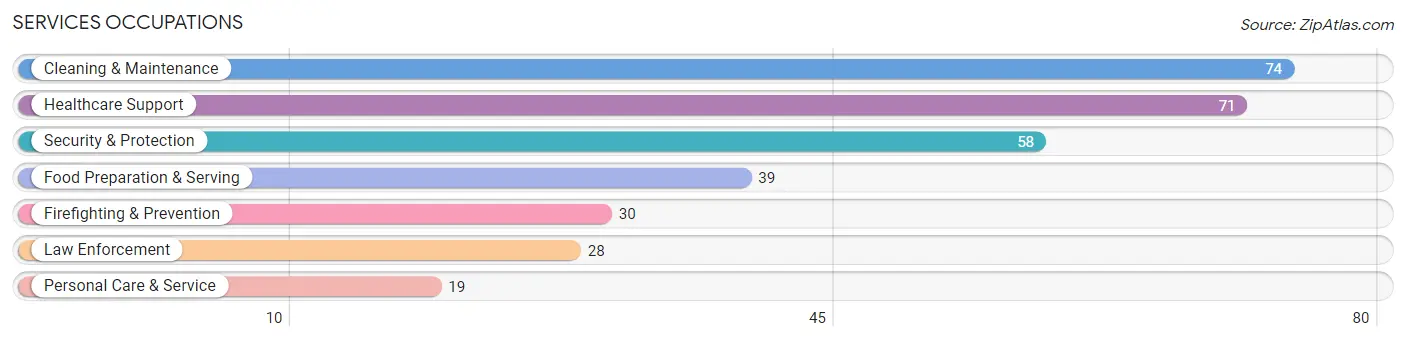
Services Occupations
The most common Services occupations in Sabana Hoyos are Cleaning & Maintenance (74 | 7.8%), Healthcare Support (71 | 7.5%), Security & Protection (58 | 6.1%), Food Preparation & Serving (39 | 4.1%), and Firefighting & Prevention (30 | 3.2%).
Services Occupations by Sex
Within the Services occupations in Sabana Hoyos, the most male-oriented occupations are Firefighting & Prevention (100.0%), Food Preparation & Serving (100.0%), and Security & Protection (75.9%), while the most female-oriented occupations are Healthcare Support (100.0%), Personal Care & Service (100.0%), and Law Enforcement (50.0%).
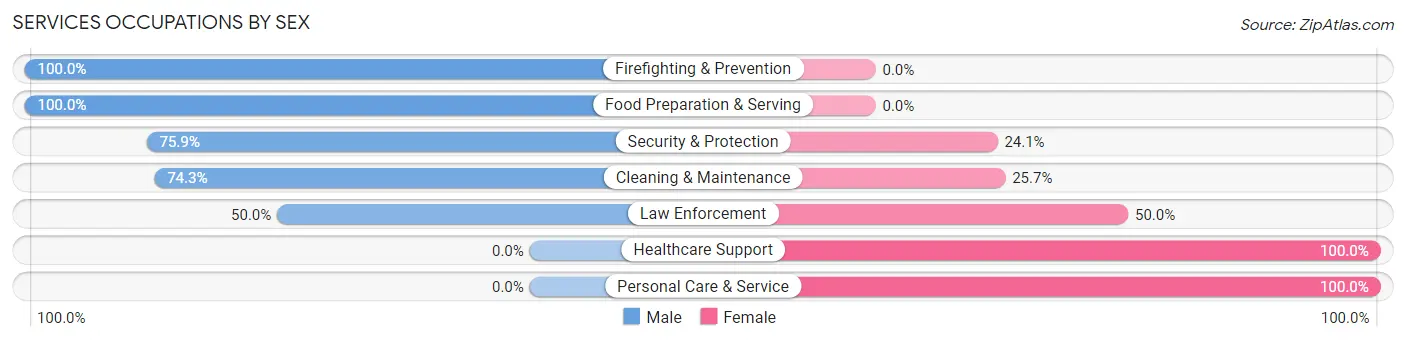
| Occupation | Male | Female |
| Healthcare Support | 0 (0.0%) | 71 (100.0%) |
| Security & Protection | 44 (75.9%) | 14 (24.1%) |
| Firefighting & Prevention | 30 (100.0%) | 0 (0.0%) |
| Law Enforcement | 14 (50.0%) | 14 (50.0%) |
| Food Preparation & Serving | 39 (100.0%) | 0 (0.0%) |
| Cleaning & Maintenance | 55 (74.3%) | 19 (25.7%) |
| Personal Care & Service | 0 (0.0%) | 19 (100.0%) |
| Total (Category) | 138 (52.9%) | 123 (47.1%) |
| Total (Overall) | 569 (60.0%) | 380 (40.0%) |
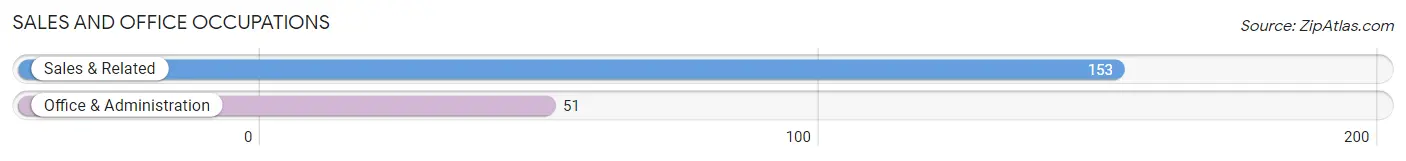
Sales and Office Occupations
The most common Sales and Office occupations in Sabana Hoyos are Sales & Related (153 | 16.1%), and Office & Administration (51 | 5.4%).
Sales and Office Occupations by Sex
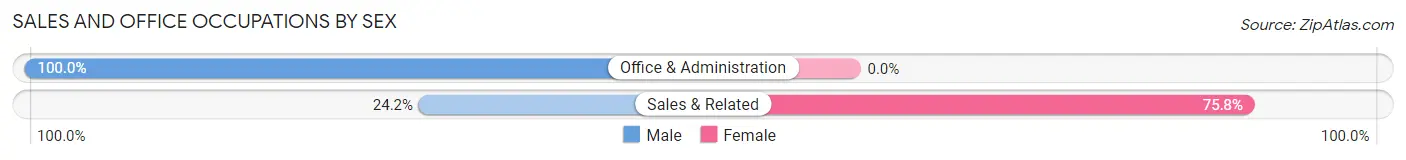
| Occupation | Male | Female |
| Sales & Related | 37 (24.2%) | 116 (75.8%) |
| Office & Administration | 51 (100.0%) | 0 (0.0%) |
| Total (Category) | 88 (43.1%) | 116 (56.9%) |
| Total (Overall) | 569 (60.0%) | 380 (40.0%) |
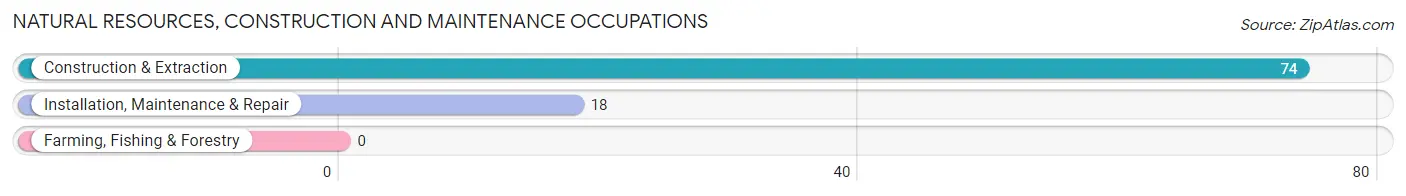
Natural Resources, Construction and Maintenance Occupations
The most common Natural Resources, Construction and Maintenance occupations in Sabana Hoyos are Construction & Extraction (74 | 7.8%), and Installation, Maintenance & Repair (18 | 1.9%).
Natural Resources, Construction and Maintenance Occupations by Sex
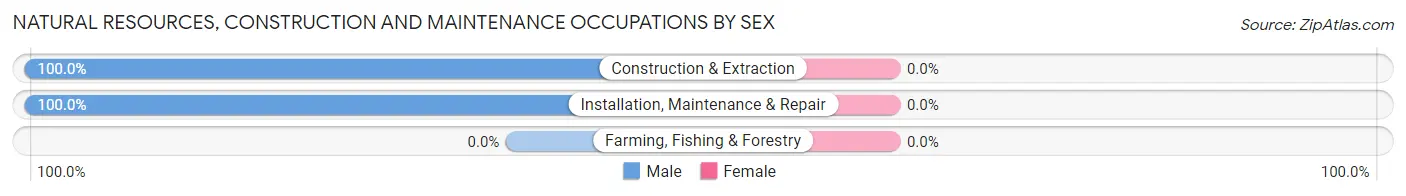
| Occupation | Male | Female |
| Farming, Fishing & Forestry | 0 (0.0%) | 0 (0.0%) |
| Construction & Extraction | 74 (100.0%) | 0 (0.0%) |
| Installation, Maintenance & Repair | 18 (100.0%) | 0 (0.0%) |
| Total (Category) | 92 (100.0%) | 0 (0.0%) |
| Total (Overall) | 569 (60.0%) | 380 (40.0%) |
Production, Transportation and Moving Occupations
The most common Production, Transportation and Moving occupations in Sabana Hoyos are Production (73 | 7.7%), and Transportation (27 | 2.9%).
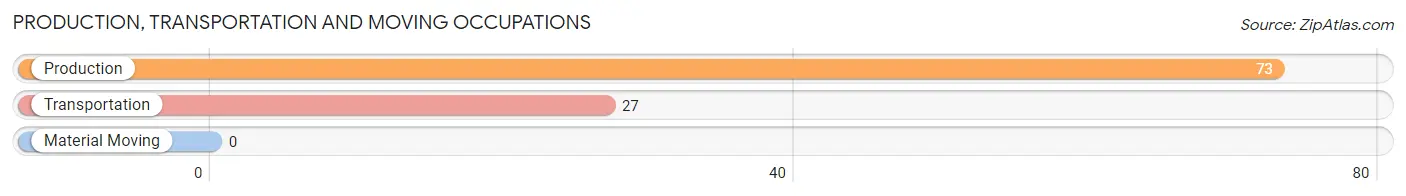
Production, Transportation and Moving Occupations by Sex
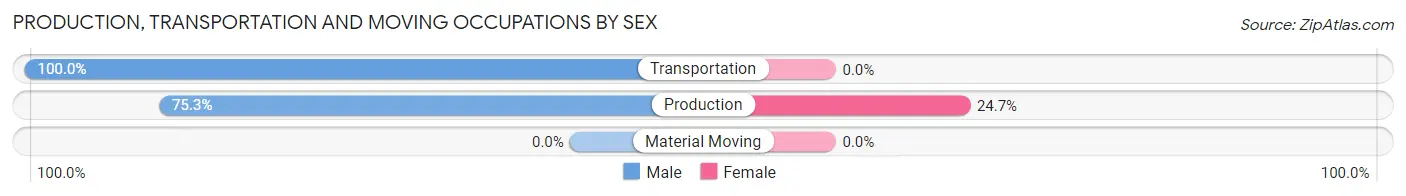
| Occupation | Male | Female |
| Production | 55 (75.3%) | 18 (24.7%) |
| Transportation | 27 (100.0%) | 0 (0.0%) |
| Material Moving | 0 (0.0%) | 0 (0.0%) |
| Total (Category) | 82 (82.0%) | 18 (18.0%) |
| Total (Overall) | 569 (60.0%) | 380 (40.0%) |
Employment Industries by Sex in Sabana Hoyos
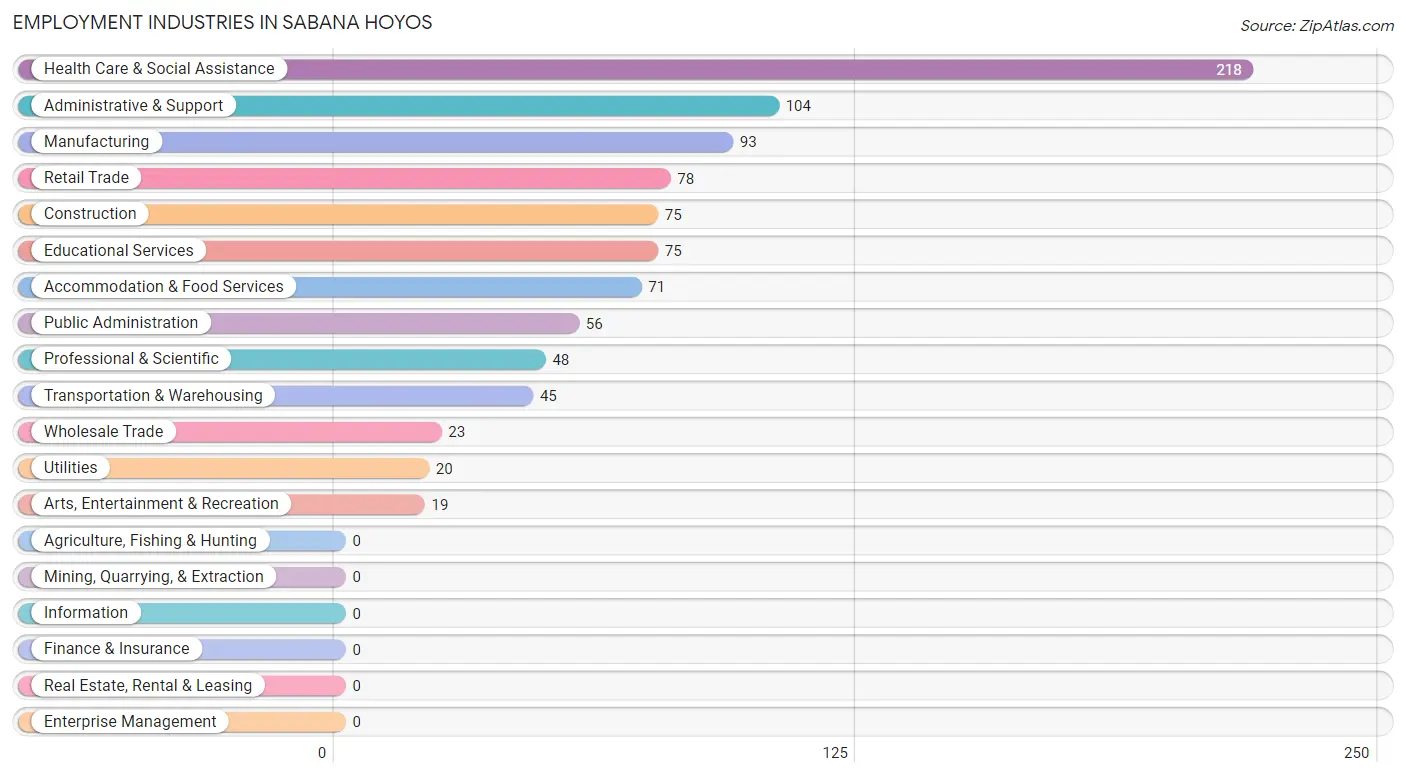
Employment Industries in Sabana Hoyos
The major employment industries in Sabana Hoyos include Health Care & Social Assistance (218 | 23.0%), Administrative & Support (104 | 11.0%), Manufacturing (93 | 9.8%), Retail Trade (78 | 8.2%), and Construction (75 | 7.9%).
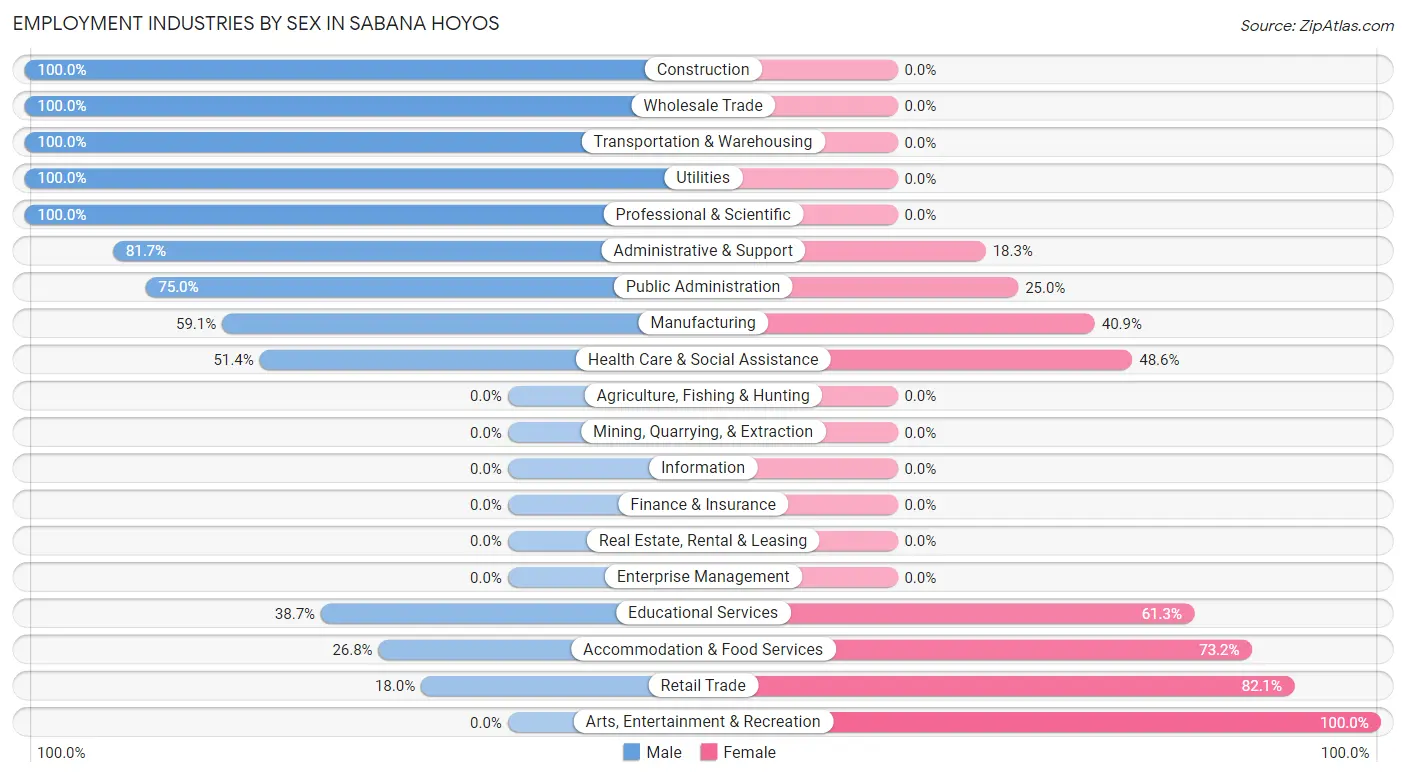
Employment Industries by Sex in Sabana Hoyos
The Sabana Hoyos industries that see more men than women are Construction (100.0%), Wholesale Trade (100.0%), and Transportation & Warehousing (100.0%), whereas the industries that tend to have a higher number of women are Arts, Entertainment & Recreation (100.0%), Retail Trade (82.1%), and Accommodation & Food Services (73.2%).
| Industry | Male | Female |
| Agriculture, Fishing & Hunting | 0 (0.0%) | 0 (0.0%) |
| Mining, Quarrying, & Extraction | 0 (0.0%) | 0 (0.0%) |
| Construction | 75 (100.0%) | 0 (0.0%) |
| Manufacturing | 55 (59.1%) | 38 (40.9%) |
| Wholesale Trade | 23 (100.0%) | 0 (0.0%) |
| Retail Trade | 14 (17.9%) | 64 (82.1%) |
| Transportation & Warehousing | 45 (100.0%) | 0 (0.0%) |
| Utilities | 20 (100.0%) | 0 (0.0%) |
| Information | 0 (0.0%) | 0 (0.0%) |
| Finance & Insurance | 0 (0.0%) | 0 (0.0%) |
| Real Estate, Rental & Leasing | 0 (0.0%) | 0 (0.0%) |
| Professional & Scientific | 48 (100.0%) | 0 (0.0%) |
| Enterprise Management | 0 (0.0%) | 0 (0.0%) |
| Administrative & Support | 85 (81.7%) | 19 (18.3%) |
| Educational Services | 29 (38.7%) | 46 (61.3%) |
| Health Care & Social Assistance | 112 (51.4%) | 106 (48.6%) |
| Arts, Entertainment & Recreation | 0 (0.0%) | 19 (100.0%) |
| Accommodation & Food Services | 19 (26.8%) | 52 (73.2%) |
| Public Administration | 42 (75.0%) | 14 (25.0%) |
| Total | 569 (60.0%) | 380 (40.0%) |
Education in Sabana Hoyos
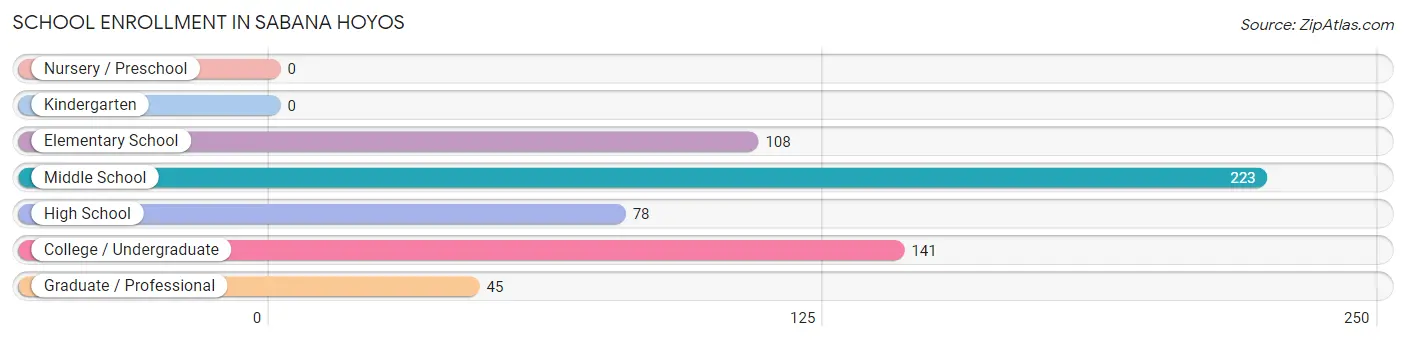
School Enrollment in Sabana Hoyos
The most common levels of schooling among the 595 students in Sabana Hoyos are middle school (223 | 37.5%), college / undergraduate (141 | 23.7%), and elementary school (108 | 18.1%).
| School Level | # Students | % Students |
| Nursery / Preschool | 0 | 0.0% |
| Kindergarten | 0 | 0.0% |
| Elementary School | 108 | 18.1% |
| Middle School | 223 | 37.5% |
| High School | 78 | 13.1% |
| College / Undergraduate | 141 | 23.7% |
| Graduate / Professional | 45 | 7.6% |
| Total | 595 | 100.0% |
School Enrollment by Age by Funding Source in Sabana Hoyos
Out of a total of 595 students who are enrolled in schools in Sabana Hoyos, 212 (35.6%) attend a private institution, while the remaining 383 (64.4%) are enrolled in public schools. The age group of 35 years and over has the highest likelihood of being enrolled in private schools, with 30 (100.0% in the age bracket) enrolled. Conversely, the age group of 15 to 17 year olds has the lowest likelihood of being enrolled in a private school, with 56 (100.0% in the age bracket) attending a public institution.
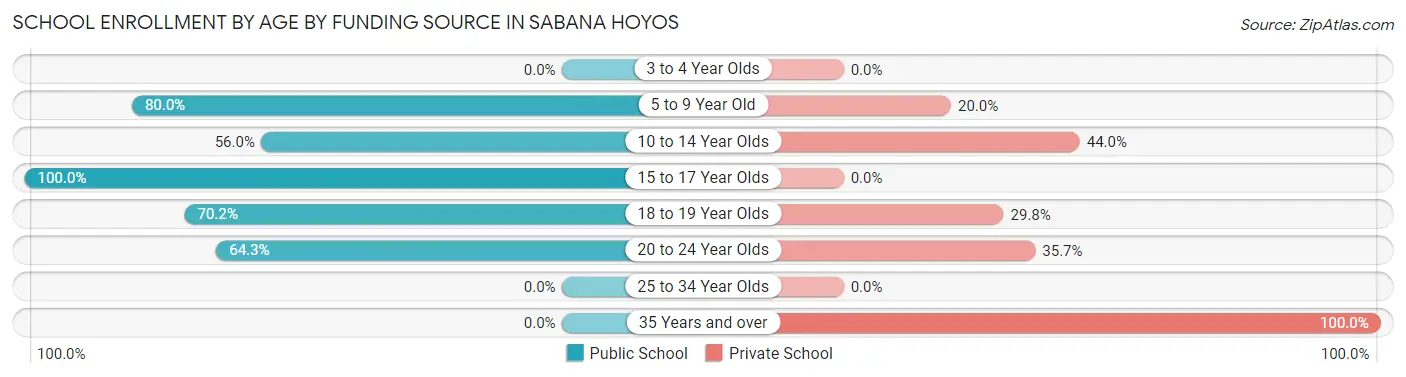
| Age Bracket | Public School | Private School |
| 3 to 4 Year Olds | 0 (0.0%) | 0 (0.0%) |
| 5 to 9 Year Old | 72 (80.0%) | 18 (20.0%) |
| 10 to 14 Year Olds | 135 (56.0%) | 106 (44.0%) |
| 15 to 17 Year Olds | 56 (100.0%) | 0 (0.0%) |
| 18 to 19 Year Olds | 66 (70.2%) | 28 (29.8%) |
| 20 to 24 Year Olds | 54 (64.3%) | 30 (35.7%) |
| 25 to 34 Year Olds | 0 (0.0%) | 0 (0.0%) |
| 35 Years and over | 0 (0.0%) | 30 (100.0%) |
| Total | 383 (64.4%) | 212 (35.6%) |
Educational Attainment by Field of Study in Sabana Hoyos
Science & technology (128 | 23.4%), physical & health sciences (89 | 16.3%), education (80 | 14.6%), business (78 | 14.3%), and social sciences (54 | 9.9%) are the most common fields of study among 547 individuals in Sabana Hoyos who have obtained a bachelor's degree or higher.
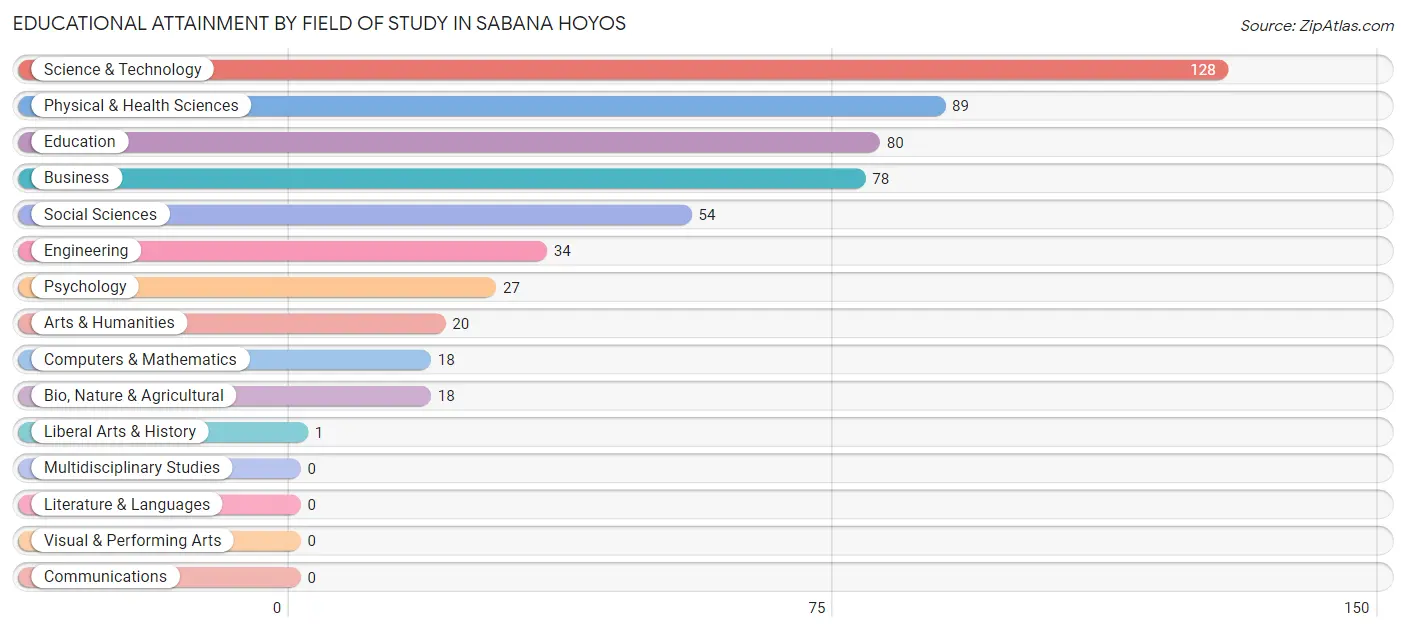
| Field of Study | # Graduates | % Graduates |
| Computers & Mathematics | 18 | 3.3% |
| Bio, Nature & Agricultural | 18 | 3.3% |
| Physical & Health Sciences | 89 | 16.3% |
| Psychology | 27 | 4.9% |
| Social Sciences | 54 | 9.9% |
| Engineering | 34 | 6.2% |
| Multidisciplinary Studies | 0 | 0.0% |
| Science & Technology | 128 | 23.4% |
| Business | 78 | 14.3% |
| Education | 80 | 14.6% |
| Literature & Languages | 0 | 0.0% |
| Liberal Arts & History | 1 | 0.2% |
| Visual & Performing Arts | 0 | 0.0% |
| Communications | 0 | 0.0% |
| Arts & Humanities | 20 | 3.7% |
| Total | 547 | 100.0% |
Transportation & Commute in Sabana Hoyos
Vehicle Availability by Sex in Sabana Hoyos
The most prevalent vehicle ownership categories in Sabana Hoyos are males with 2 vehicles (179, accounting for 35.1%) and females with 2 vehicles (69, making up 50.0%).
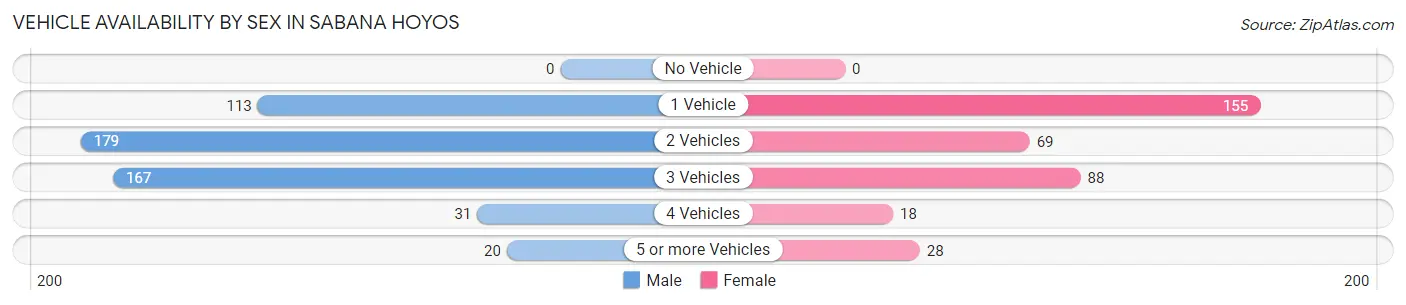
| Vehicles Available | Male | Female |
| No Vehicle | 0 (0.0%) | 0 (0.0%) |
| 1 Vehicle | 113 (22.2%) | 155 (43.3%) |
| 2 Vehicles | 179 (35.1%) | 69 (19.3%) |
| 3 Vehicles | 167 (32.8%) | 88 (24.6%) |
| 4 Vehicles | 31 (6.1%) | 18 (5.0%) |
| 5 or more Vehicles | 20 (3.9%) | 28 (7.8%) |
| Total | 510 (100.0%) | 358 (100.0%) |
Commute Time in Sabana Hoyos
The most frequently occuring commute durations in Sabana Hoyos are 30 to 34 minutes (160 commuters, 20.6%), 45 to 59 minutes (135 commuters, 17.4%), and 5 to 9 minutes (130 commuters, 16.7%).
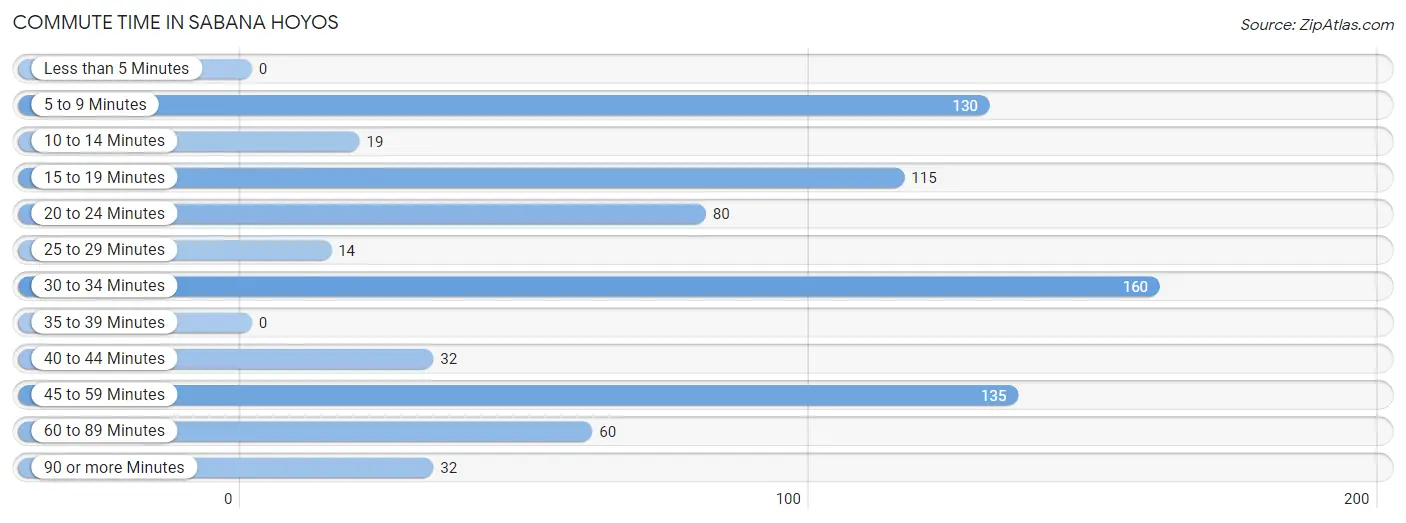
| Commute Time | # Commuters | % Commuters |
| Less than 5 Minutes | 0 | 0.0% |
| 5 to 9 Minutes | 130 | 16.7% |
| 10 to 14 Minutes | 19 | 2.5% |
| 15 to 19 Minutes | 115 | 14.8% |
| 20 to 24 Minutes | 80 | 10.3% |
| 25 to 29 Minutes | 14 | 1.8% |
| 30 to 34 Minutes | 160 | 20.6% |
| 35 to 39 Minutes | 0 | 0.0% |
| 40 to 44 Minutes | 32 | 4.1% |
| 45 to 59 Minutes | 135 | 17.4% |
| 60 to 89 Minutes | 60 | 7.7% |
| 90 or more Minutes | 32 | 4.1% |
Commute Time by Sex in Sabana Hoyos
The most common commute times in Sabana Hoyos are 5 to 9 minutes (100 commuters, 21.6%) for males and 30 to 34 minutes (95 commuters, 30.2%) for females.
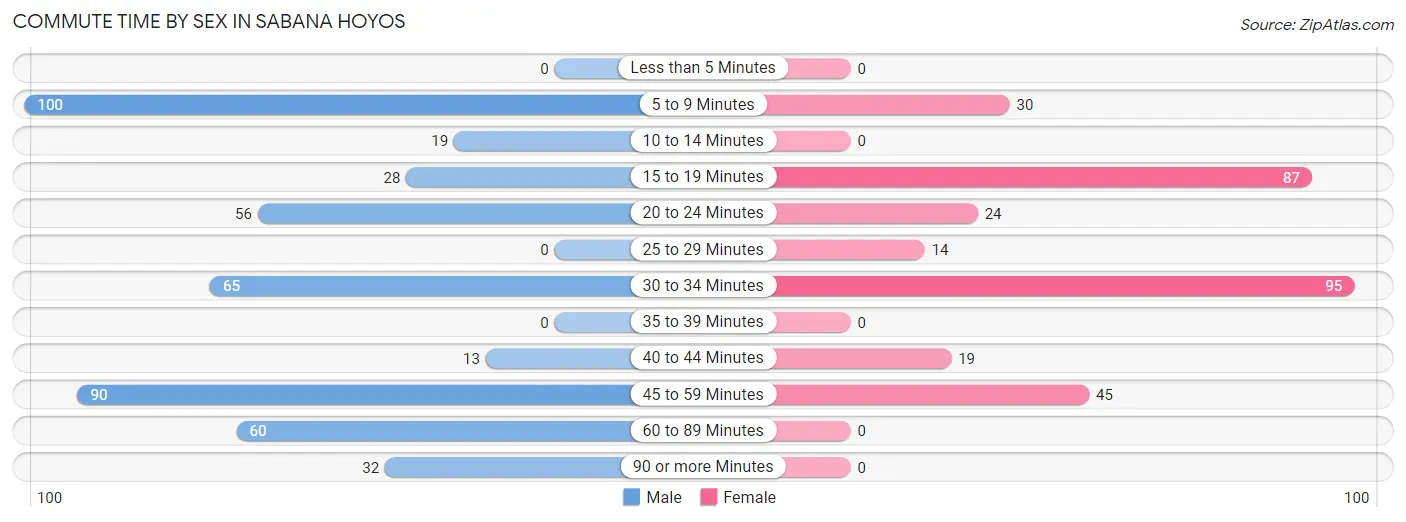
| Commute Time | Male | Female |
| Less than 5 Minutes | 0 (0.0%) | 0 (0.0%) |
| 5 to 9 Minutes | 100 (21.6%) | 30 (9.6%) |
| 10 to 14 Minutes | 19 (4.1%) | 0 (0.0%) |
| 15 to 19 Minutes | 28 (6.0%) | 87 (27.7%) |
| 20 to 24 Minutes | 56 (12.1%) | 24 (7.6%) |
| 25 to 29 Minutes | 0 (0.0%) | 14 (4.5%) |
| 30 to 34 Minutes | 65 (14.0%) | 95 (30.2%) |
| 35 to 39 Minutes | 0 (0.0%) | 0 (0.0%) |
| 40 to 44 Minutes | 13 (2.8%) | 19 (6.0%) |
| 45 to 59 Minutes | 90 (19.4%) | 45 (14.3%) |
| 60 to 89 Minutes | 60 (13.0%) | 0 (0.0%) |
| 90 or more Minutes | 32 (6.9%) | 0 (0.0%) |
Time of Departure to Work by Sex in Sabana Hoyos
The most frequent times of departure to work in Sabana Hoyos are 5:00 AM to 5:29 AM (110, 23.8%) for males and 7:30 AM to 7:59 AM (86, 27.4%) for females.
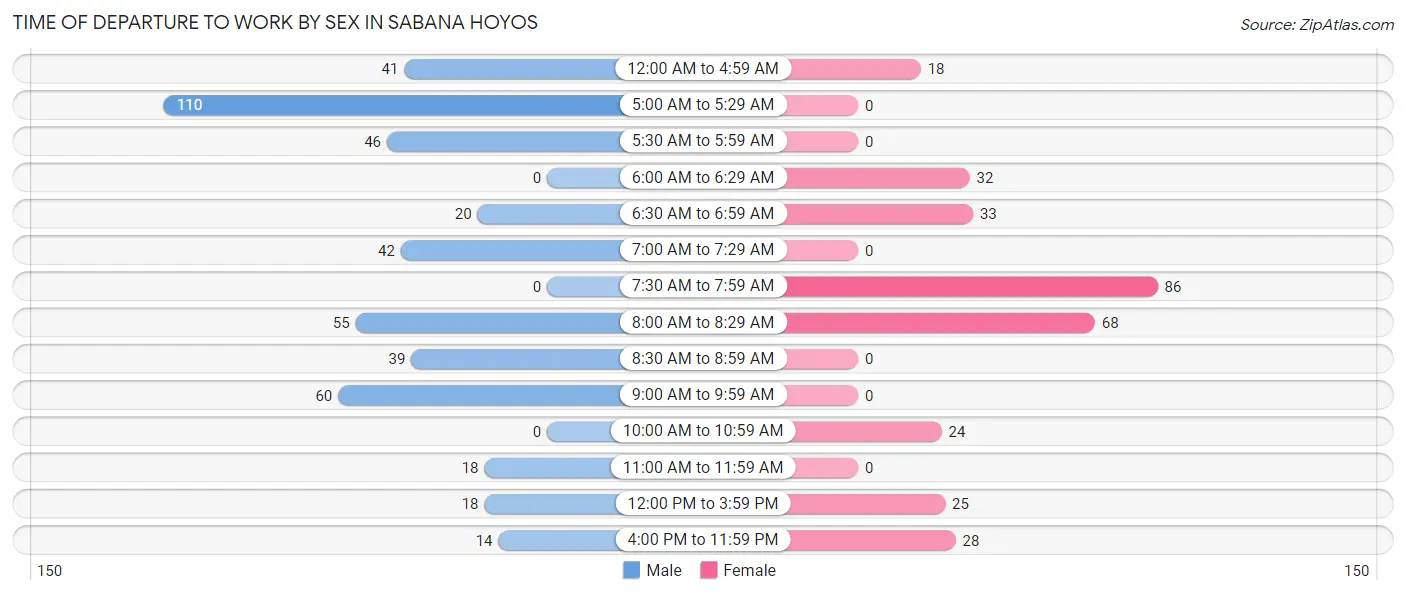
| Time of Departure | Male | Female |
| 12:00 AM to 4:59 AM | 41 (8.9%) | 18 (5.7%) |
| 5:00 AM to 5:29 AM | 110 (23.8%) | 0 (0.0%) |
| 5:30 AM to 5:59 AM | 46 (9.9%) | 0 (0.0%) |
| 6:00 AM to 6:29 AM | 0 (0.0%) | 32 (10.2%) |
| 6:30 AM to 6:59 AM | 20 (4.3%) | 33 (10.5%) |
| 7:00 AM to 7:29 AM | 42 (9.1%) | 0 (0.0%) |
| 7:30 AM to 7:59 AM | 0 (0.0%) | 86 (27.4%) |
| 8:00 AM to 8:29 AM | 55 (11.9%) | 68 (21.7%) |
| 8:30 AM to 8:59 AM | 39 (8.4%) | 0 (0.0%) |
| 9:00 AM to 9:59 AM | 60 (13.0%) | 0 (0.0%) |
| 10:00 AM to 10:59 AM | 0 (0.0%) | 24 (7.6%) |
| 11:00 AM to 11:59 AM | 18 (3.9%) | 0 (0.0%) |
| 12:00 PM to 3:59 PM | 18 (3.9%) | 25 (8.0%) |
| 4:00 PM to 11:59 PM | 14 (3.0%) | 28 (8.9%) |
| Total | 463 (100.0%) | 314 (100.0%) |
Housing Occupancy in Sabana Hoyos
Occupancy by Ownership in Sabana Hoyos
Of the total 1,154 dwellings in Sabana Hoyos, owner-occupied units account for 869 (75.3%), while renter-occupied units make up 285 (24.7%).
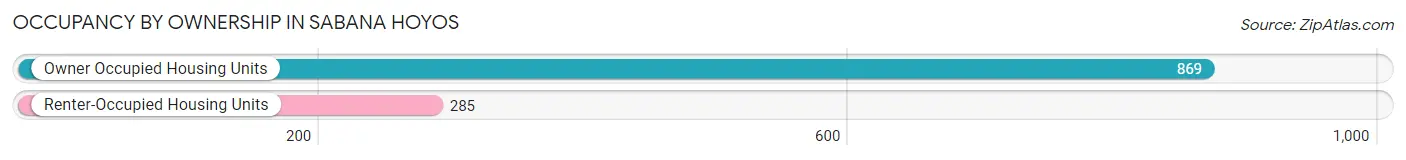
| Occupancy | # Housing Units | % Housing Units |
| Owner Occupied Housing Units | 869 | 75.3% |
| Renter-Occupied Housing Units | 285 | 24.7% |
| Total Occupied Housing Units | 1,154 | 100.0% |
Occupancy by Household Size in Sabana Hoyos
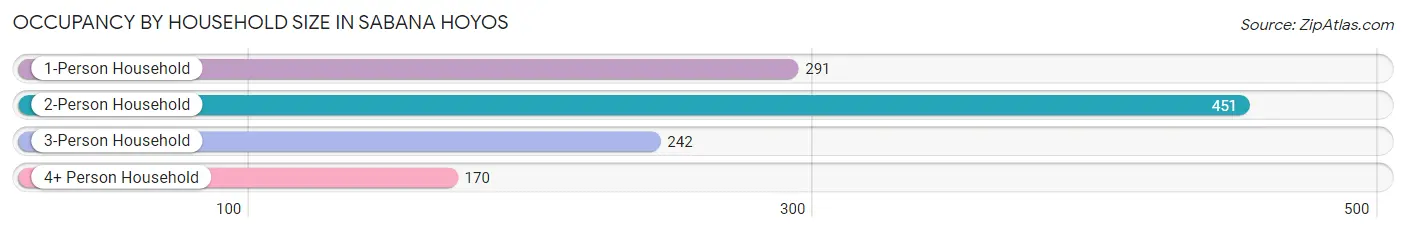
| Household Size | # Housing Units | % Housing Units |
| 1-Person Household | 291 | 25.2% |
| 2-Person Household | 451 | 39.1% |
| 3-Person Household | 242 | 21.0% |
| 4+ Person Household | 170 | 14.7% |
| Total Housing Units | 1,154 | 100.0% |
Occupancy by Ownership by Household Size in Sabana Hoyos
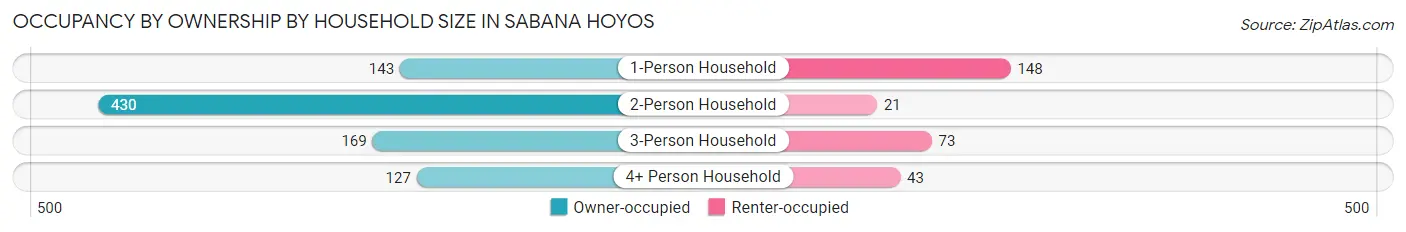
| Household Size | Owner-occupied | Renter-occupied |
| 1-Person Household | 143 (49.1%) | 148 (50.9%) |
| 2-Person Household | 430 (95.3%) | 21 (4.7%) |
| 3-Person Household | 169 (69.8%) | 73 (30.2%) |
| 4+ Person Household | 127 (74.7%) | 43 (25.3%) |
| Total Housing Units | 869 (75.3%) | 285 (24.7%) |
Occupancy by Educational Attainment in Sabana Hoyos
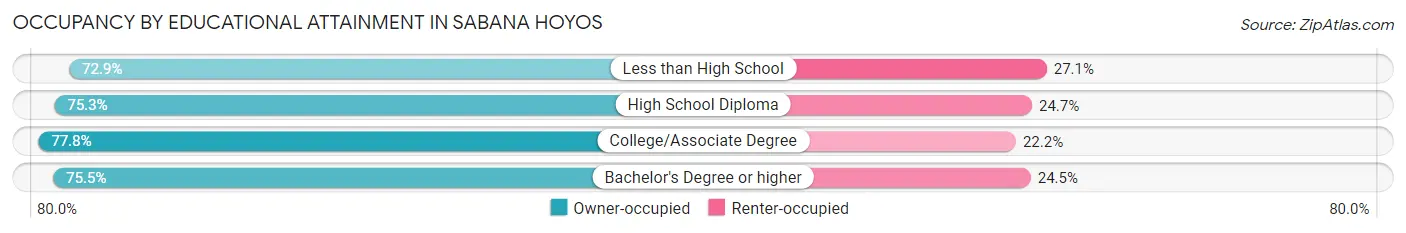
| Household Size | Owner-occupied | Renter-occupied |
| Less than High School | 221 (72.9%) | 82 (27.1%) |
| High School Diploma | 204 (75.3%) | 67 (24.7%) |
| College/Associate Degree | 207 (77.8%) | 59 (22.2%) |
| Bachelor's Degree or higher | 237 (75.5%) | 77 (24.5%) |
Occupancy by Age of Householder in Sabana Hoyos
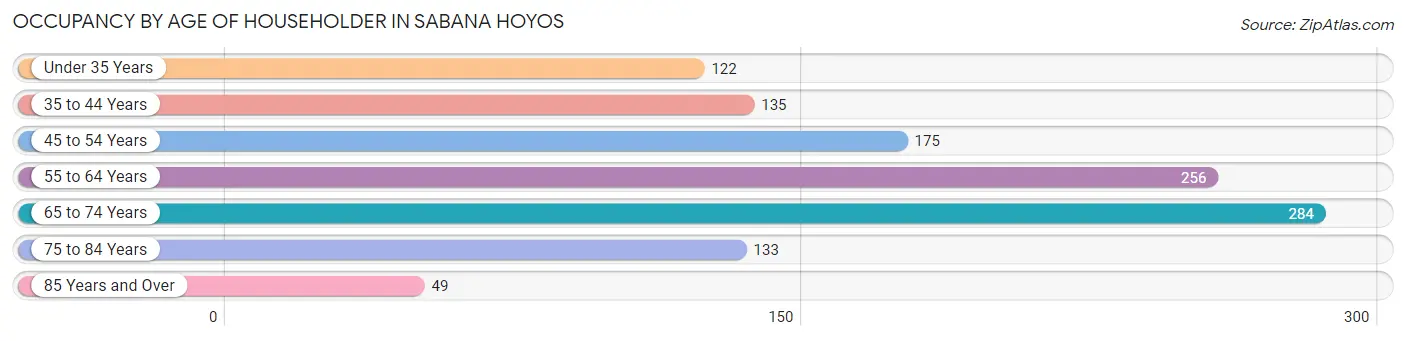
| Age Bracket | # Households | % Households |
| Under 35 Years | 122 | 10.6% |
| 35 to 44 Years | 135 | 11.7% |
| 45 to 54 Years | 175 | 15.2% |
| 55 to 64 Years | 256 | 22.2% |
| 65 to 74 Years | 284 | 24.6% |
| 75 to 84 Years | 133 | 11.5% |
| 85 Years and Over | 49 | 4.3% |
| Total | 1,154 | 100.0% |
Housing Finances in Sabana Hoyos
Median Income by Occupancy in Sabana Hoyos
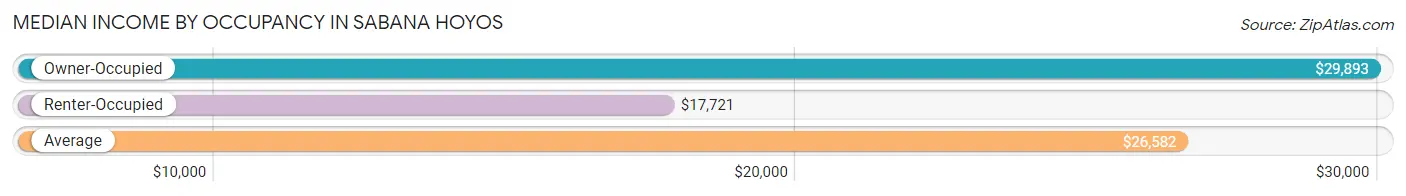
| Occupancy Type | # Households | Median Income |
| Owner-Occupied | 869 (75.3%) | $29,893 |
| Renter-Occupied | 285 (24.7%) | $17,721 |
| Average | 1,154 (100.0%) | $26,582 |
Occupancy by Householder Income Bracket in Sabana Hoyos
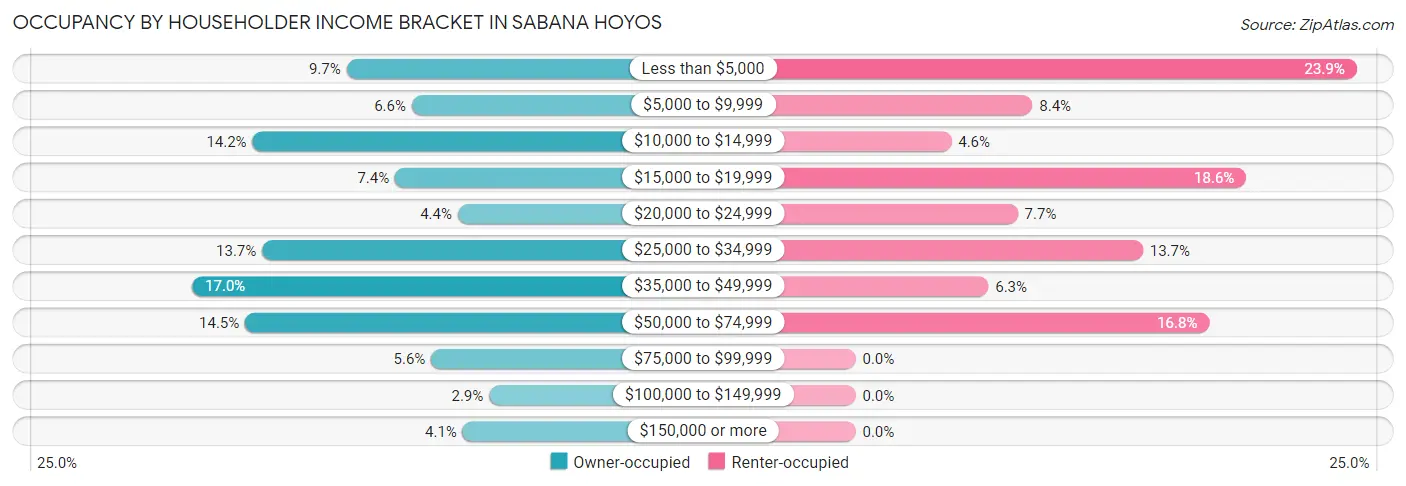
| Income Bracket | Owner-occupied | Renter-occupied |
| Less than $5,000 | 84 (9.7%) | 68 (23.9%) |
| $5,000 to $9,999 | 57 (6.6%) | 24 (8.4%) |
| $10,000 to $14,999 | 123 (14.1%) | 13 (4.6%) |
| $15,000 to $19,999 | 64 (7.4%) | 53 (18.6%) |
| $20,000 to $24,999 | 38 (4.4%) | 22 (7.7%) |
| $25,000 to $34,999 | 119 (13.7%) | 39 (13.7%) |
| $35,000 to $49,999 | 148 (17.0%) | 18 (6.3%) |
| $50,000 to $74,999 | 126 (14.5%) | 48 (16.8%) |
| $75,000 to $99,999 | 49 (5.6%) | 0 (0.0%) |
| $100,000 to $149,999 | 25 (2.9%) | 0 (0.0%) |
| $150,000 or more | 36 (4.1%) | 0 (0.0%) |
| Total | 869 (100.0%) | 285 (100.0%) |
Monthly Housing Cost Tiers in Sabana Hoyos
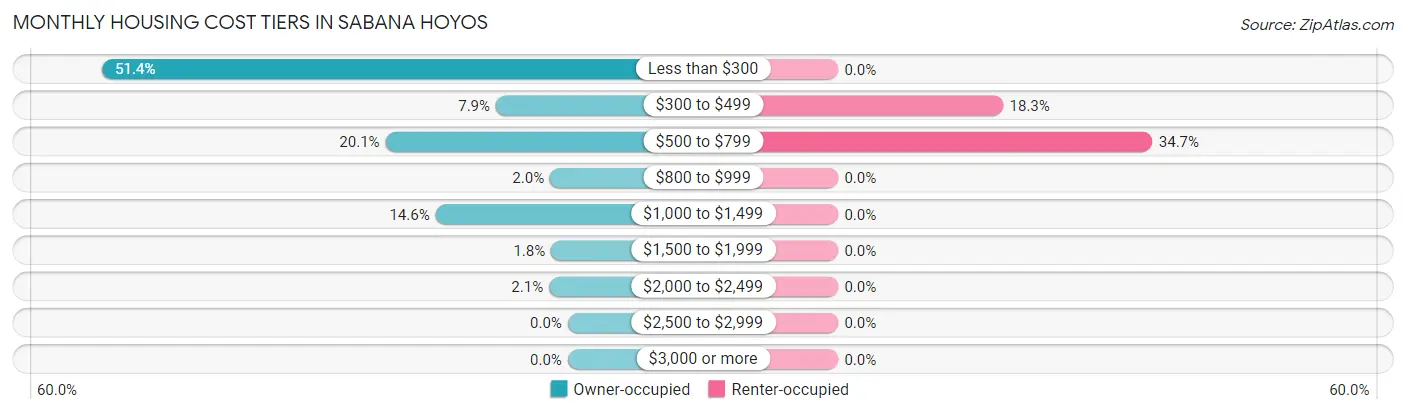
| Monthly Cost | Owner-occupied | Renter-occupied |
| Less than $300 | 447 (51.4%) | 0 (0.0%) |
| $300 to $499 | 69 (7.9%) | 52 (18.2%) |
| $500 to $799 | 175 (20.1%) | 99 (34.7%) |
| $800 to $999 | 17 (2.0%) | 0 (0.0%) |
| $1,000 to $1,499 | 127 (14.6%) | 0 (0.0%) |
| $1,500 to $1,999 | 16 (1.8%) | 0 (0.0%) |
| $2,000 to $2,499 | 18 (2.1%) | 0 (0.0%) |
| $2,500 to $2,999 | 0 (0.0%) | 0 (0.0%) |
| $3,000 or more | 0 (0.0%) | 0 (0.0%) |
| Total | 869 (100.0%) | 285 (100.0%) |
Physical Housing Characteristics in Sabana Hoyos
Housing Structures in Sabana Hoyos
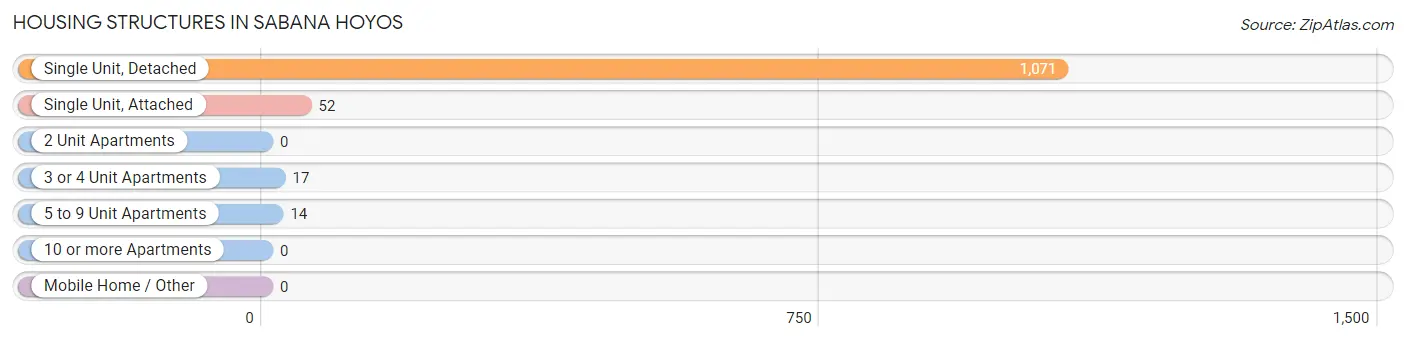
| Structure Type | # Housing Units | % Housing Units |
| Single Unit, Detached | 1,071 | 92.8% |
| Single Unit, Attached | 52 | 4.5% |
| 2 Unit Apartments | 0 | 0.0% |
| 3 or 4 Unit Apartments | 17 | 1.5% |
| 5 to 9 Unit Apartments | 14 | 1.2% |
| 10 or more Apartments | 0 | 0.0% |
| Mobile Home / Other | 0 | 0.0% |
| Total | 1,154 | 100.0% |
Housing Structures by Occupancy in Sabana Hoyos
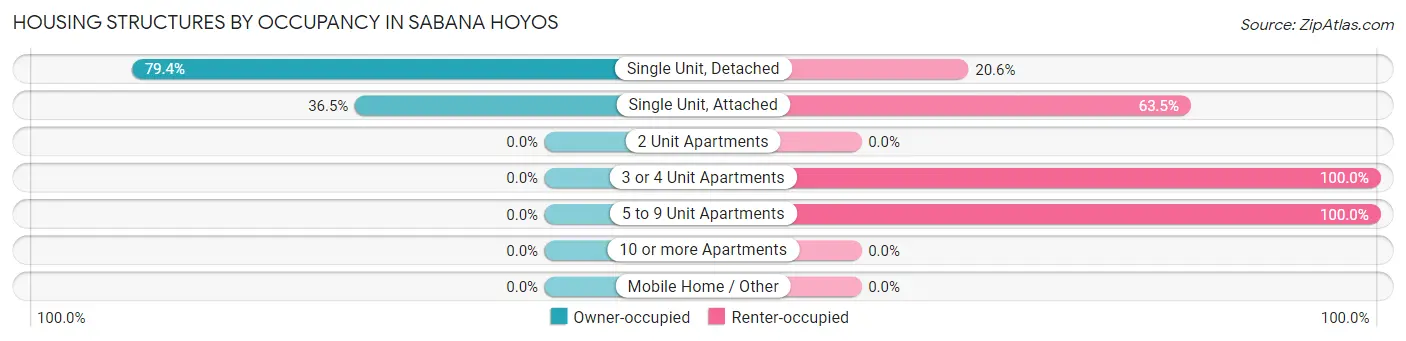
| Structure Type | Owner-occupied | Renter-occupied |
| Single Unit, Detached | 850 (79.4%) | 221 (20.6%) |
| Single Unit, Attached | 19 (36.5%) | 33 (63.5%) |
| 2 Unit Apartments | 0 (0.0%) | 0 (0.0%) |
| 3 or 4 Unit Apartments | 0 (0.0%) | 17 (100.0%) |
| 5 to 9 Unit Apartments | 0 (0.0%) | 14 (100.0%) |
| 10 or more Apartments | 0 (0.0%) | 0 (0.0%) |
| Mobile Home / Other | 0 (0.0%) | 0 (0.0%) |
| Total | 869 (75.3%) | 285 (24.7%) |
Housing Structures by Number of Rooms in Sabana Hoyos
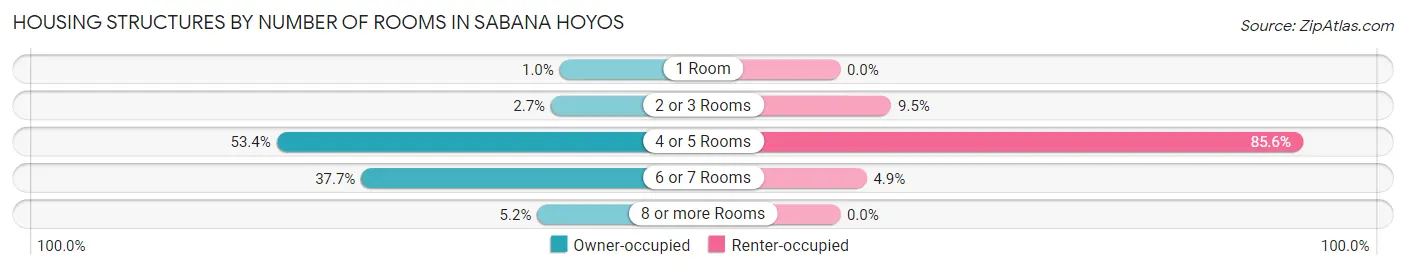
| Number of Rooms | Owner-occupied | Renter-occupied |
| 1 Room | 9 (1.0%) | 0 (0.0%) |
| 2 or 3 Rooms | 23 (2.6%) | 27 (9.5%) |
| 4 or 5 Rooms | 464 (53.4%) | 244 (85.6%) |
| 6 or 7 Rooms | 328 (37.7%) | 14 (4.9%) |
| 8 or more Rooms | 45 (5.2%) | 0 (0.0%) |
| Total | 869 (100.0%) | 285 (100.0%) |
Housing Structure by Heating Type in Sabana Hoyos
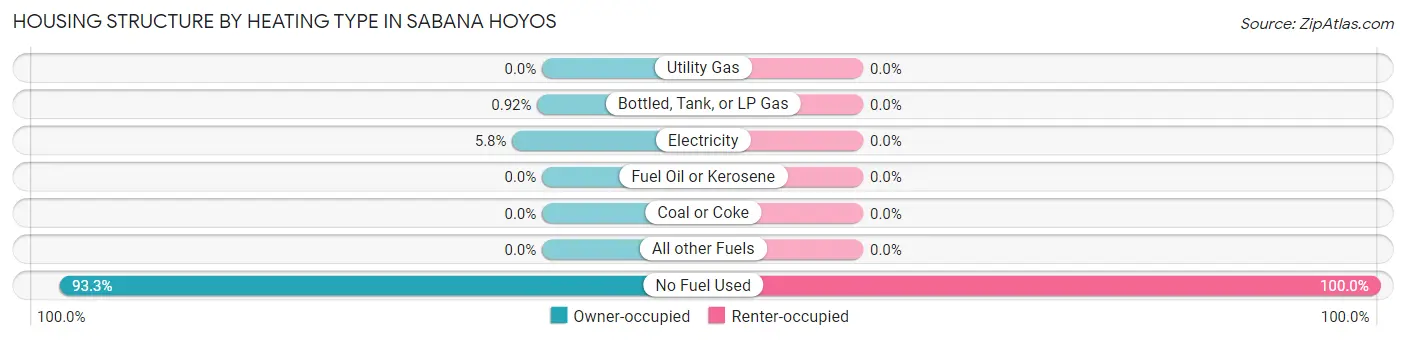
| Heating Type | Owner-occupied | Renter-occupied |
| Utility Gas | 0 (0.0%) | 0 (0.0%) |
| Bottled, Tank, or LP Gas | 8 (0.9%) | 0 (0.0%) |
| Electricity | 50 (5.8%) | 0 (0.0%) |
| Fuel Oil or Kerosene | 0 (0.0%) | 0 (0.0%) |
| Coal or Coke | 0 (0.0%) | 0 (0.0%) |
| All other Fuels | 0 (0.0%) | 0 (0.0%) |
| No Fuel Used | 811 (93.3%) | 285 (100.0%) |
| Total | 869 (100.0%) | 285 (100.0%) |
Household Vehicle Usage in Sabana Hoyos
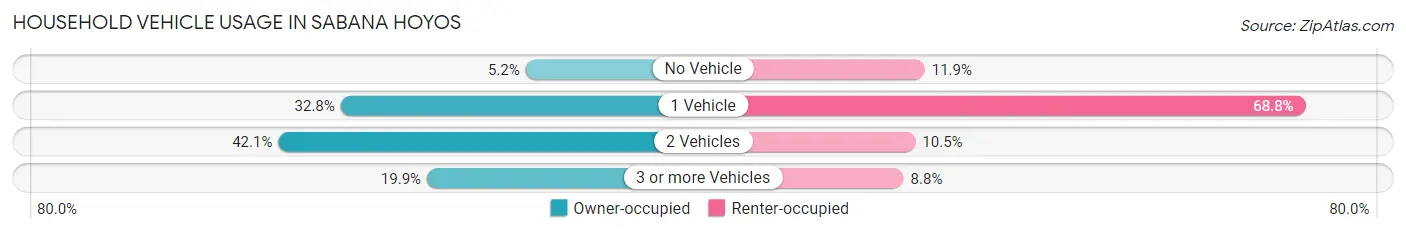
| Vehicles per Household | Owner-occupied | Renter-occupied |
| No Vehicle | 45 (5.2%) | 34 (11.9%) |
| 1 Vehicle | 285 (32.8%) | 196 (68.8%) |
| 2 Vehicles | 366 (42.1%) | 30 (10.5%) |
| 3 or more Vehicles | 173 (19.9%) | 25 (8.8%) |
| Total | 869 (100.0%) | 285 (100.0%) |
Real Estate & Mortgages in Sabana Hoyos
Real Estate and Mortgage Overview in Sabana Hoyos
| Characteristic | Without Mortgage | With Mortgage |
| Housing Units | 536 | 333 |
| Median Property Value | $106,000 | $99,100 |
| Median Household Income | $28,071 | $15 |
| Monthly Housing Costs | $169 | $0 |
| Real Estate Taxes | - | - |
Property Value by Mortgage Status in Sabana Hoyos
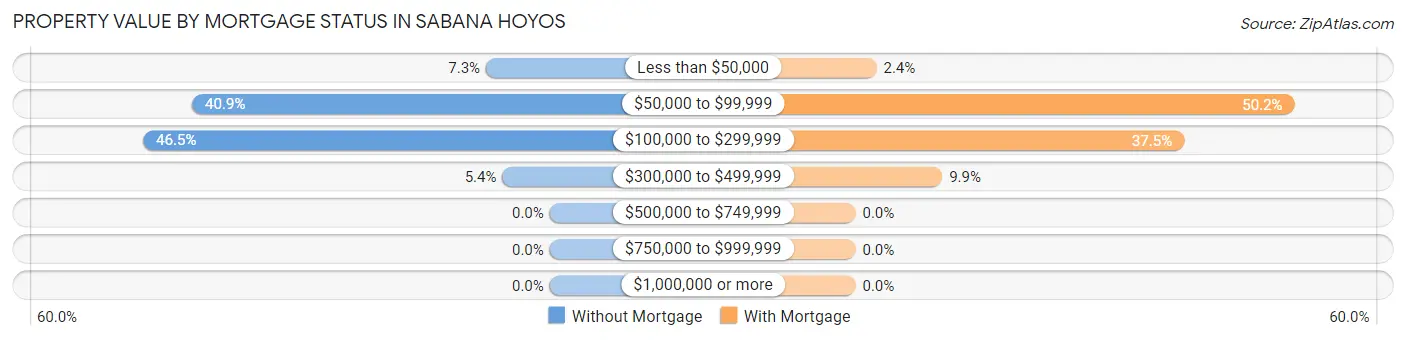
| Property Value | Without Mortgage | With Mortgage |
| Less than $50,000 | 39 (7.3%) | 8 (2.4%) |
| $50,000 to $99,999 | 219 (40.9%) | 167 (50.1%) |
| $100,000 to $299,999 | 249 (46.5%) | 125 (37.5%) |
| $300,000 to $499,999 | 29 (5.4%) | 33 (9.9%) |
| $500,000 to $749,999 | 0 (0.0%) | 0 (0.0%) |
| $750,000 to $999,999 | 0 (0.0%) | 0 (0.0%) |
| $1,000,000 or more | 0 (0.0%) | 0 (0.0%) |
| Total | 536 (100.0%) | 333 (100.0%) |
Household Income by Mortgage Status in Sabana Hoyos
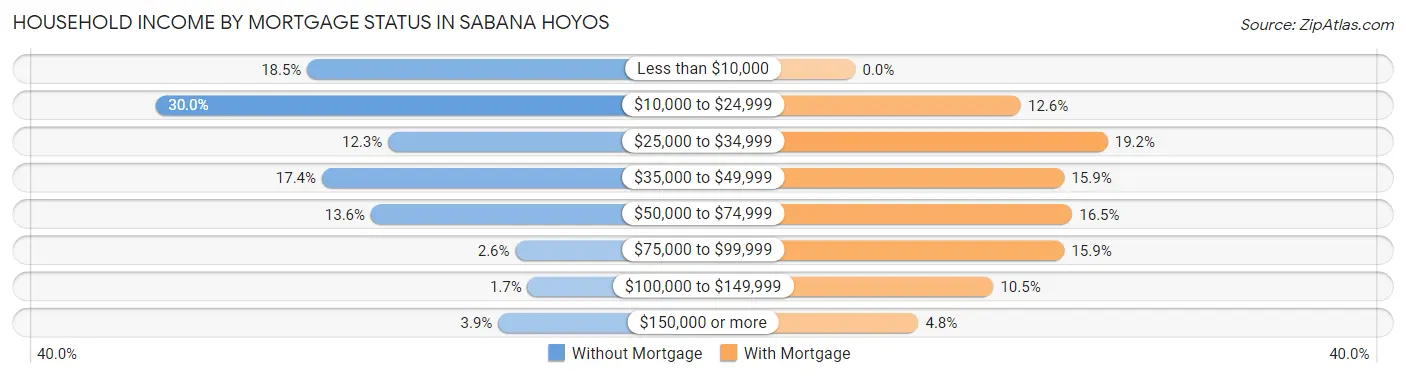
| Household Income | Without Mortgage | With Mortgage |
| Less than $10,000 | 99 (18.5%) | 0 (0.0%) |
| $10,000 to $24,999 | 161 (30.0%) | 42 (12.6%) |
| $25,000 to $34,999 | 66 (12.3%) | 64 (19.2%) |
| $35,000 to $49,999 | 93 (17.3%) | 53 (15.9%) |
| $50,000 to $74,999 | 73 (13.6%) | 55 (16.5%) |
| $75,000 to $99,999 | 14 (2.6%) | 53 (15.9%) |
| $100,000 to $149,999 | 9 (1.7%) | 35 (10.5%) |
| $150,000 or more | 21 (3.9%) | 16 (4.8%) |
| Total | 536 (100.0%) | 333 (100.0%) |
Property Value to Household Income Ratio in Sabana Hoyos
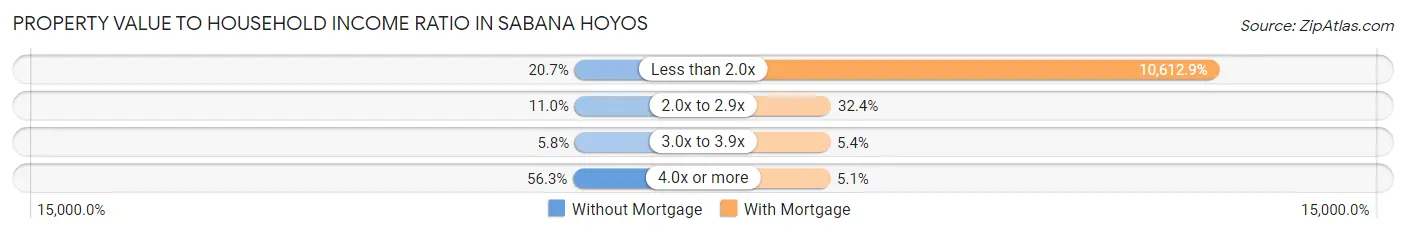
| Value-to-Income Ratio | Without Mortgage | With Mortgage |
| Less than 2.0x | 111 (20.7%) | 35,341 (10,612.9%) |
| 2.0x to 2.9x | 59 (11.0%) | 108 (32.4%) |
| 3.0x to 3.9x | 31 (5.8%) | 18 (5.4%) |
| 4.0x or more | 302 (56.3%) | 17 (5.1%) |
| Total | 536 (100.0%) | 333 (100.0%) |
Real Estate Taxes by Mortgage Status in Sabana Hoyos
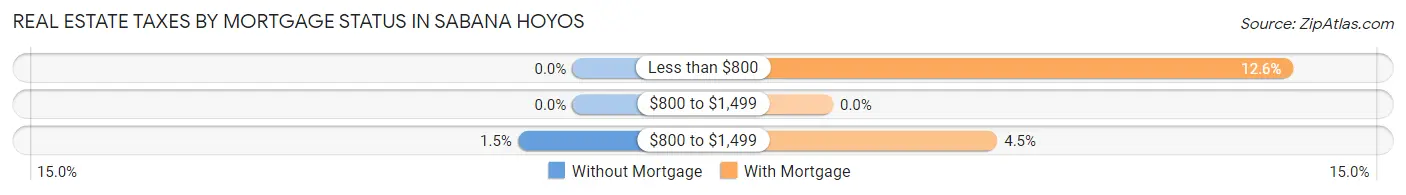
| Property Taxes | Without Mortgage | With Mortgage |
| Less than $800 | 0 (0.0%) | 42 (12.6%) |
| $800 to $1,499 | 0 (0.0%) | 0 (0.0%) |
| $800 to $1,499 | 8 (1.5%) | 15 (4.5%) |
| Total | 536 (100.0%) | 333 (100.0%) |
Health & Disability in Sabana Hoyos
Health Insurance Coverage by Age in Sabana Hoyos
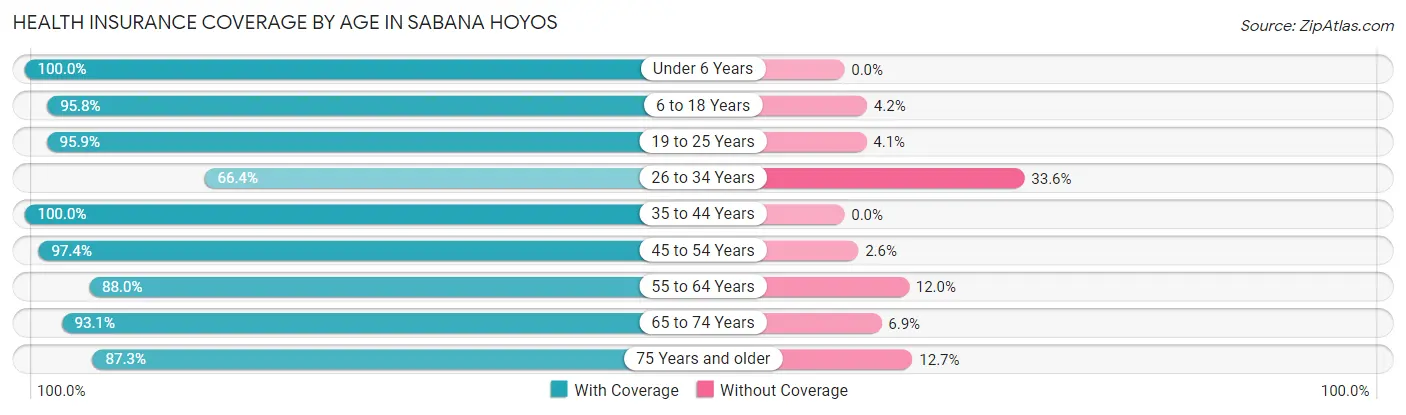
| Age Bracket | With Coverage | Without Coverage |
| Under 6 Years | 61 (100.0%) | 0 (0.0%) |
| 6 to 18 Years | 431 (95.8%) | 19 (4.2%) |
| 19 to 25 Years | 327 (95.9%) | 14 (4.1%) |
| 26 to 34 Years | 182 (66.4%) | 92 (33.6%) |
| 35 to 44 Years | 295 (100.0%) | 0 (0.0%) |
| 45 to 54 Years | 449 (97.4%) | 12 (2.6%) |
| 55 to 64 Years | 395 (88.0%) | 54 (12.0%) |
| 65 to 74 Years | 458 (93.1%) | 34 (6.9%) |
| 75 Years and older | 289 (87.3%) | 42 (12.7%) |
| Total | 2,887 (91.5%) | 267 (8.5%) |
Health Insurance Coverage by Citizenship Status in Sabana Hoyos
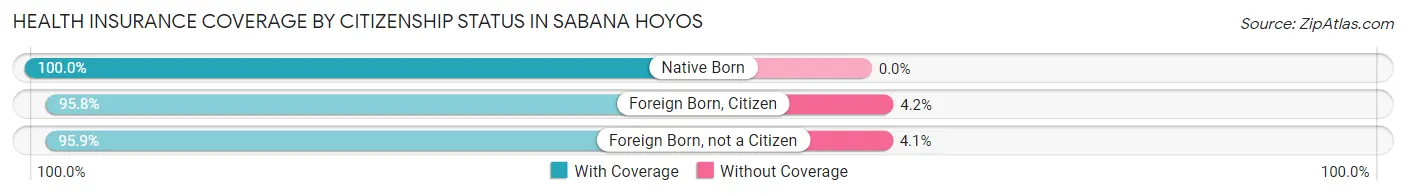
| Citizenship Status | With Coverage | Without Coverage |
| Native Born | 61 (100.0%) | 0 (0.0%) |
| Foreign Born, Citizen | 431 (95.8%) | 19 (4.2%) |
| Foreign Born, not a Citizen | 327 (95.9%) | 14 (4.1%) |
Health Insurance Coverage by Household Income in Sabana Hoyos
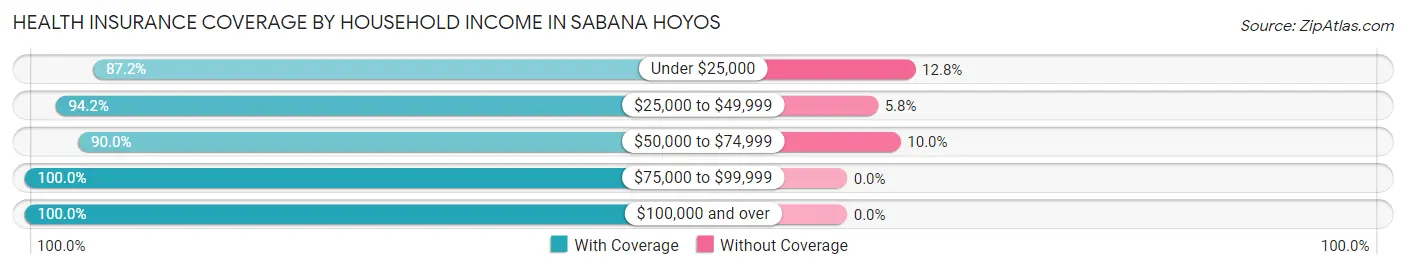
| Household Income | With Coverage | Without Coverage |
| Under $25,000 | 1,082 (87.2%) | 159 (12.8%) |
| $25,000 to $49,999 | 928 (94.2%) | 57 (5.8%) |
| $50,000 to $74,999 | 457 (90.0%) | 51 (10.0%) |
| $75,000 to $99,999 | 170 (100.0%) | 0 (0.0%) |
| $100,000 and over | 246 (100.0%) | 0 (0.0%) |
Public vs Private Health Insurance Coverage by Age in Sabana Hoyos
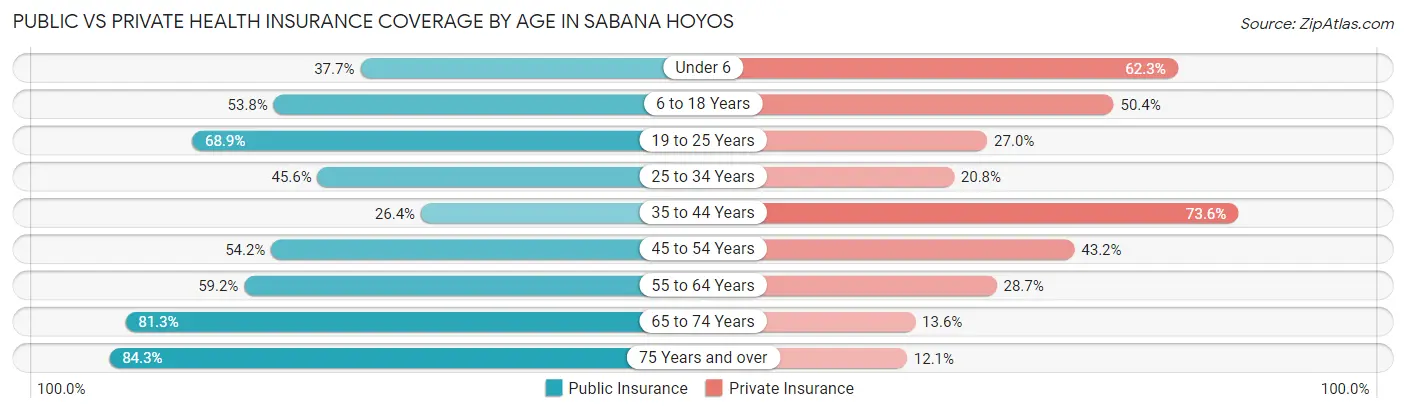
| Age Bracket | Public Insurance | Private Insurance |
| Under 6 | 23 (37.7%) | 38 (62.3%) |
| 6 to 18 Years | 242 (53.8%) | 227 (50.4%) |
| 19 to 25 Years | 235 (68.9%) | 92 (27.0%) |
| 25 to 34 Years | 125 (45.6%) | 57 (20.8%) |
| 35 to 44 Years | 78 (26.4%) | 217 (73.6%) |
| 45 to 54 Years | 250 (54.2%) | 199 (43.2%) |
| 55 to 64 Years | 266 (59.2%) | 129 (28.7%) |
| 65 to 74 Years | 400 (81.3%) | 67 (13.6%) |
| 75 Years and over | 279 (84.3%) | 40 (12.1%) |
| Total | 1,898 (60.2%) | 1,066 (33.8%) |
Disability Status by Sex by Age in Sabana Hoyos
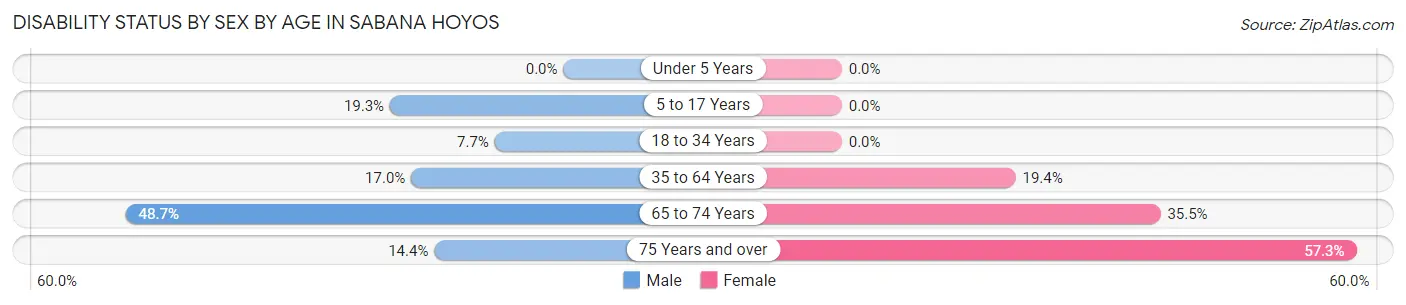
| Age Bracket | Male | Female |
| Under 5 Years | 0 (0.0%) | 0 (0.0%) |
| 5 to 17 Years | 50 (19.3%) | 0 (0.0%) |
| 18 to 34 Years | 25 (7.6%) | 0 (0.0%) |
| 35 to 64 Years | 100 (17.0%) | 119 (19.4%) |
| 65 to 74 Years | 97 (48.7%) | 104 (35.5%) |
| 75 Years and over | 21 (14.4%) | 106 (57.3%) |
Disability Class by Sex by Age in Sabana Hoyos
Disability Class: Hearing Difficulty
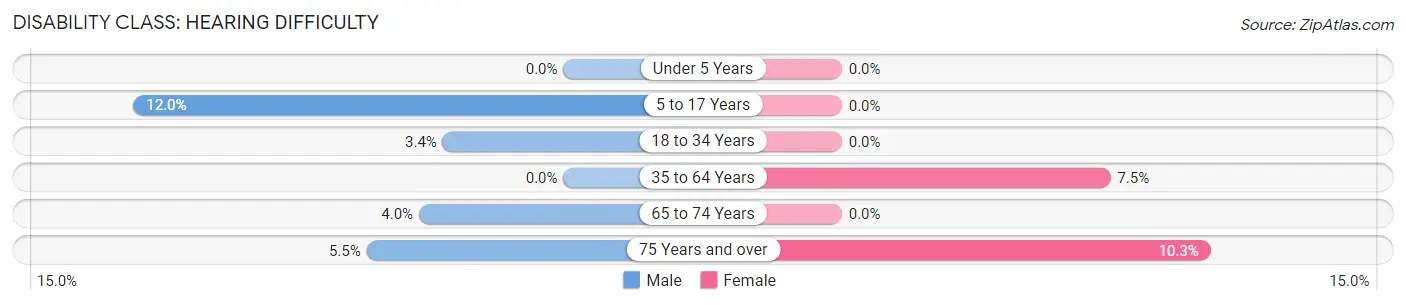
| Age Bracket | Male | Female |
| Under 5 Years | 0 (0.0%) | 0 (0.0%) |
| 5 to 17 Years | 31 (12.0%) | 0 (0.0%) |
| 18 to 34 Years | 11 (3.4%) | 0 (0.0%) |
| 35 to 64 Years | 0 (0.0%) | 46 (7.5%) |
| 65 to 74 Years | 8 (4.0%) | 0 (0.0%) |
| 75 Years and over | 8 (5.5%) | 19 (10.3%) |
Disability Class: Vision Difficulty
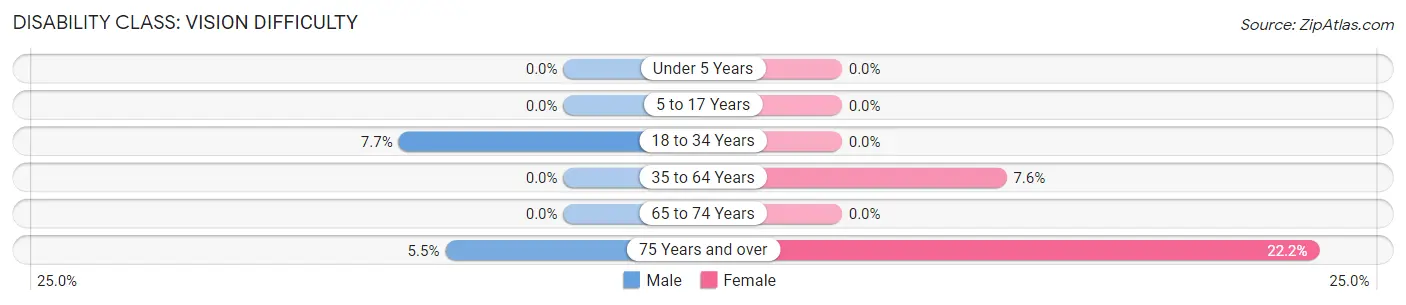
| Age Bracket | Male | Female |
| Under 5 Years | 0 (0.0%) | 0 (0.0%) |
| 5 to 17 Years | 0 (0.0%) | 0 (0.0%) |
| 18 to 34 Years | 25 (7.6%) | 0 (0.0%) |
| 35 to 64 Years | 0 (0.0%) | 47 (7.6%) |
| 65 to 74 Years | 0 (0.0%) | 0 (0.0%) |
| 75 Years and over | 8 (5.5%) | 41 (22.2%) |
Disability Class: Cognitive Difficulty
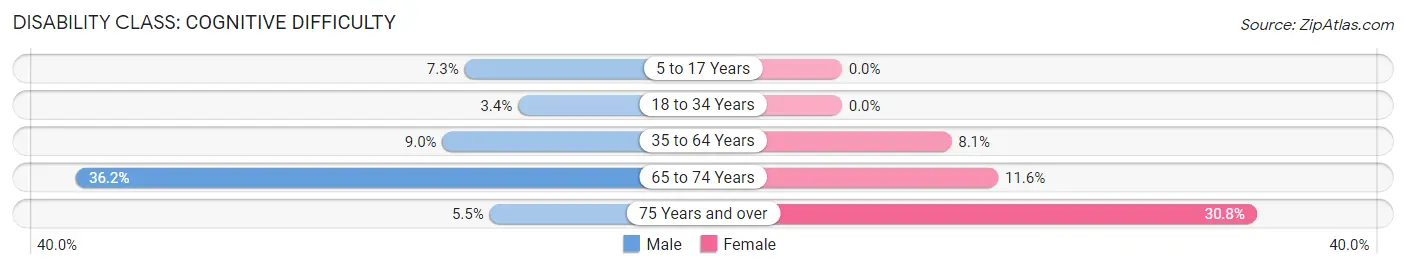
| Age Bracket | Male | Female |
| 5 to 17 Years | 19 (7.3%) | 0 (0.0%) |
| 18 to 34 Years | 11 (3.4%) | 0 (0.0%) |
| 35 to 64 Years | 53 (9.0%) | 50 (8.1%) |
| 65 to 74 Years | 72 (36.2%) | 34 (11.6%) |
| 75 Years and over | 8 (5.5%) | 57 (30.8%) |
Disability Class: Ambulatory Difficulty
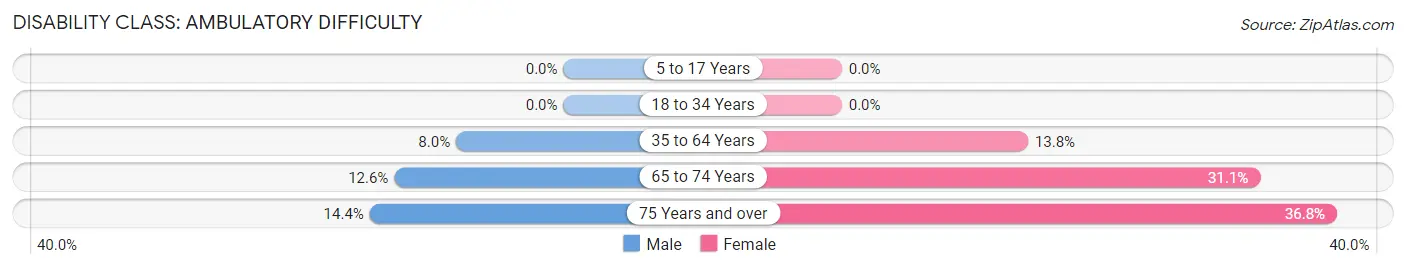
| Age Bracket | Male | Female |
| 5 to 17 Years | 0 (0.0%) | 0 (0.0%) |
| 18 to 34 Years | 0 (0.0%) | 0 (0.0%) |
| 35 to 64 Years | 47 (8.0%) | 85 (13.8%) |
| 65 to 74 Years | 25 (12.6%) | 91 (31.1%) |
| 75 Years and over | 21 (14.4%) | 68 (36.8%) |
Disability Class: Self-Care Difficulty
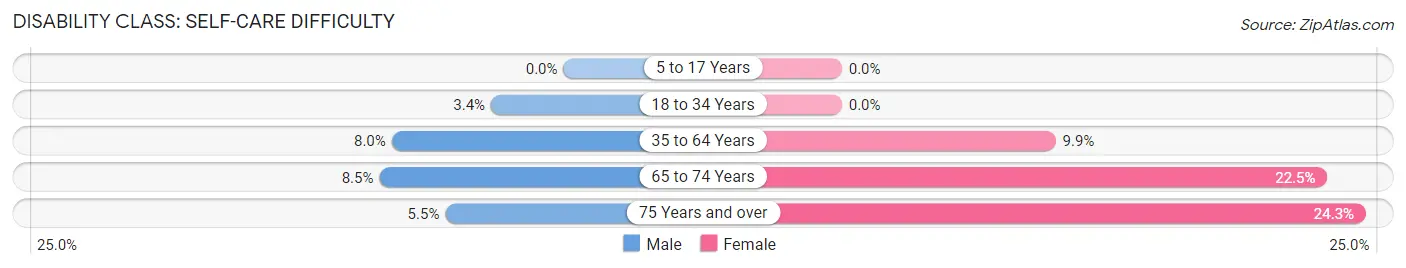
| Age Bracket | Male | Female |
| 5 to 17 Years | 0 (0.0%) | 0 (0.0%) |
| 18 to 34 Years | 11 (3.4%) | 0 (0.0%) |
| 35 to 64 Years | 47 (8.0%) | 61 (9.9%) |
| 65 to 74 Years | 17 (8.5%) | 66 (22.5%) |
| 75 Years and over | 8 (5.5%) | 45 (24.3%) |
Technology Access in Sabana Hoyos
Computing Device Access in Sabana Hoyos
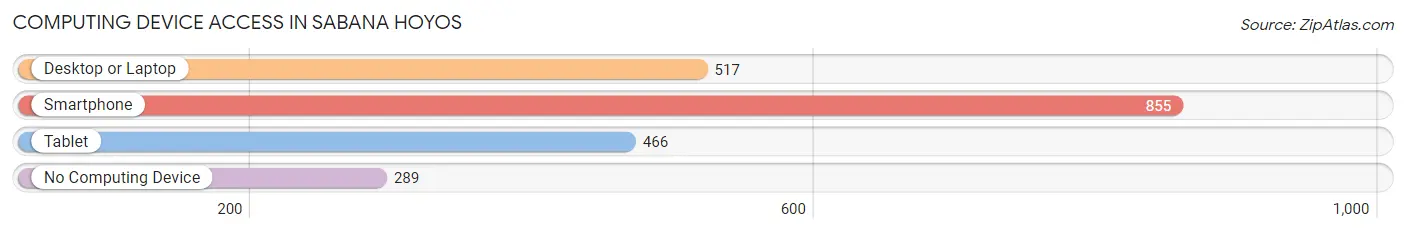
| Device Type | # Households | % Households |
| Desktop or Laptop | 517 | 44.8% |
| Smartphone | 855 | 74.1% |
| Tablet | 466 | 40.4% |
| No Computing Device | 289 | 25.0% |
| Total | 1,154 | 100.0% |
Internet Access in Sabana Hoyos
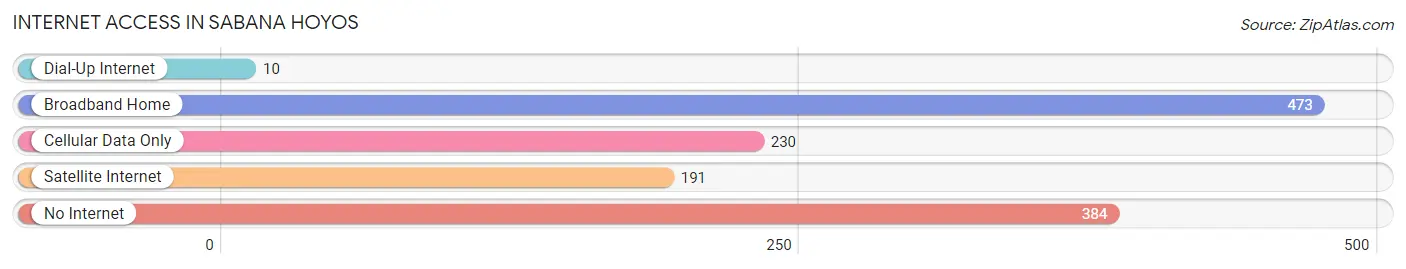
| Internet Type | # Households | % Households |
| Dial-Up Internet | 10 | 0.9% |
| Broadband Home | 473 | 41.0% |
| Cellular Data Only | 230 | 19.9% |
| Satellite Internet | 191 | 16.6% |
| No Internet | 384 | 33.3% |
| Total | 1,154 | 100.0% |
Sabana Hoyos Summary
Sabana Hoyos is a municipality located in the northern region of Puerto Rico. It is part of the San Juan-Caguas-Guaynabo Metropolitan Statistical Area. As of the 2010 census, the population of Sabana Hoyos was 8,845.
Geography
Sabana Hoyos is located in the northern region of Puerto Rico, in the northern part of the municipality of Toa Alta. It is bordered by the municipalities of Toa Alta, Bayamón, and Naranjito. The terrain of Sabana Hoyos is mostly flat, with some hills in the northern part of the municipality. The highest point is Cerro La Pica, which is located in the northern part of the municipality and has an elevation of 1,068 feet (325 meters).
Climate
Sabana Hoyos has a tropical climate, with hot and humid summers and mild winters. The average temperature is around 80°F (27°C). The average annual precipitation is around 50 inches (127 cm).
History
The area of Sabana Hoyos was originally inhabited by the Taíno people. In the early 16th century, the Spanish arrived in the area and began to colonize it. The area was part of the municipality of Toa Alta until 1824, when it was established as its own municipality.
Economy
The economy of Sabana Hoyos is mainly based on agriculture and manufacturing. The main agricultural products are sugarcane, coffee, and fruits. The main industries are food processing, textiles, and electronics.
Demographics
As of the 2010 census, the population of Sabana Hoyos was 8,845. The population is mostly of mixed European and African descent. The majority of the population is Roman Catholic. The official language is Spanish, although English is also spoken.
Education
Sabana Hoyos is served by the Puerto Rico Department of Education. There are several public schools in the municipality, as well as a few private schools. The University of Puerto Rico also has a campus in Sabana Hoyos.
Conclusion
Sabana Hoyos is a municipality located in the northern region of Puerto Rico. It is part of the San Juan-Caguas-Guaynabo Metropolitan Statistical Area. The economy of Sabana Hoyos is mainly based on agriculture and manufacturing, and the population is mostly of mixed European and African descent. The official language is Spanish, although English is also spoken. Sabana Hoyos is served by the Puerto Rico Department of Education, and the University of Puerto Rico also has a campus in the municipality.
Common Questions
What is Per Capita Income in Sabana Hoyos?
Per Capita income in Sabana Hoyos is $15,689.
What is the Median Family Income in Sabana Hoyos?
Median Family Income in Sabana Hoyos is $28,071.
What is the Median Household income in Sabana Hoyos?
Median Household Income in Sabana Hoyos is $26,582.
What is Income or Wage Gap in Sabana Hoyos?
Income or Wage Gap in Sabana Hoyos is 35.9%.
Women in Sabana Hoyos earn 64.1 cents for every dollar earned by a man.
What is Family Income Deficit in Sabana Hoyos?
Family Income Deficit in Sabana Hoyos is $8,529.
Families that are below poverty line in Sabana Hoyos earn $8,529 less on average than the poverty threshold level.
What is Inequality or Gini Index in Sabana Hoyos?
Inequality or Gini Index in Sabana Hoyos is 0.52.
What is the Total Population of Sabana Hoyos?
Total Population of Sabana Hoyos is 3,154.
What is the Total Male Population of Sabana Hoyos?
Total Male Population of Sabana Hoyos is 1,563.
What is the Total Female Population of Sabana Hoyos?
Total Female Population of Sabana Hoyos is 1,591.
What is the Ratio of Males per 100 Females in Sabana Hoyos?
There are 98.24 Males per 100 Females in Sabana Hoyos.
What is the Ratio of Females per 100 Males in Sabana Hoyos?
There are 101.79 Females per 100 Males in Sabana Hoyos.
What is the Median Population Age in Sabana Hoyos?
Median Population Age in Sabana Hoyos is 47.7 Years.
What is the Average Family Size in Sabana Hoyos
Average Family Size in Sabana Hoyos is 3.2 People.
What is the Average Household Size in Sabana Hoyos
Average Household Size in Sabana Hoyos is 2.7 People.
How Large is the Labor Force in Sabana Hoyos?
There are 1,100 People in the Labor Forcein in Sabana Hoyos.
What is the Percentage of People in the Labor Force in Sabana Hoyos?
40.1% of People are in the Labor Force in Sabana Hoyos.
What is the Unemployment Rate in Sabana Hoyos?
Unemployment Rate in Sabana Hoyos is 13.8%.