Rio Lajas, PR Map & Demographics
Rio Lajas Overview
$10,904
PER CAPITA INCOME
$32,083
AVG FAMILY INCOME
$19,716
AVG HOUSEHOLD INCOME
12.0%
WAGE / INCOME GAP [ % ]
88.0¢/ $1
WAGE / INCOME GAP [ $ ]
0.54
INEQUALITY / GINI INDEX
1,724
TOTAL POPULATION
770
MALE POPULATION
954
FEMALE POPULATION
80.71
MALES / 100 FEMALES
123.90
FEMALES / 100 MALES
38.1
MEDIAN AGE
5.1
AVG FAMILY SIZE
3.3
AVG HOUSEHOLD SIZE
706
LABOR FORCE [ PEOPLE ]
49.6%
PERCENT IN LABOR FORCE
20.4%
UNEMPLOYMENT RATE
Income in Rio Lajas
Income Overview in Rio Lajas
Per Capita Income in Rio Lajas is $10,904, while median incomes of families and households are $32,083 and $19,716 respectively.
| Characteristic | Number | Measure |
| Per Capita Income | 1,724 | $10,904 |
| Median Family Income | 272 | $32,083 |
| Mean Family Income | 272 | $41,094 |
| Median Household Income | 523 | $19,716 |
| Mean Household Income | 523 | $29,363 |
| Income Deficit | 272 | $0 |
| Wage / Income Gap (%) | 1,724 | 12.01% |
| Wage / Income Gap ($) | 1,724 | 87.99¢ per $1 |
| Gini / Inequality Index | 1,724 | 0.54 |
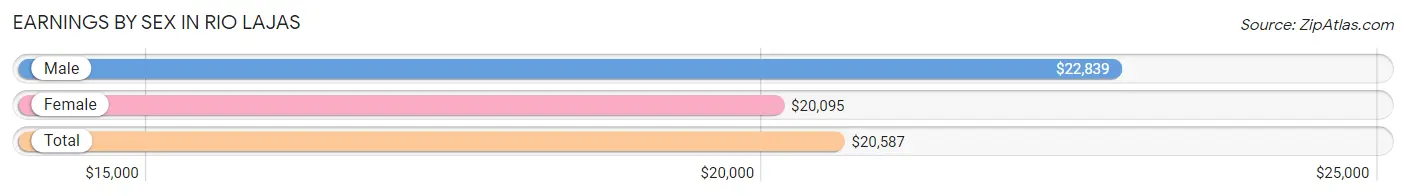
Earnings by Sex in Rio Lajas
Average Earnings in Rio Lajas are $20,587, $22,839 for men and $20,095 for women, a difference of 12.0%.
| Sex | Number | Average Earnings |
| Male | 336 (55.2%) | $22,839 |
| Female | 273 (44.8%) | $20,095 |
| Total | 609 (100.0%) | $20,587 |
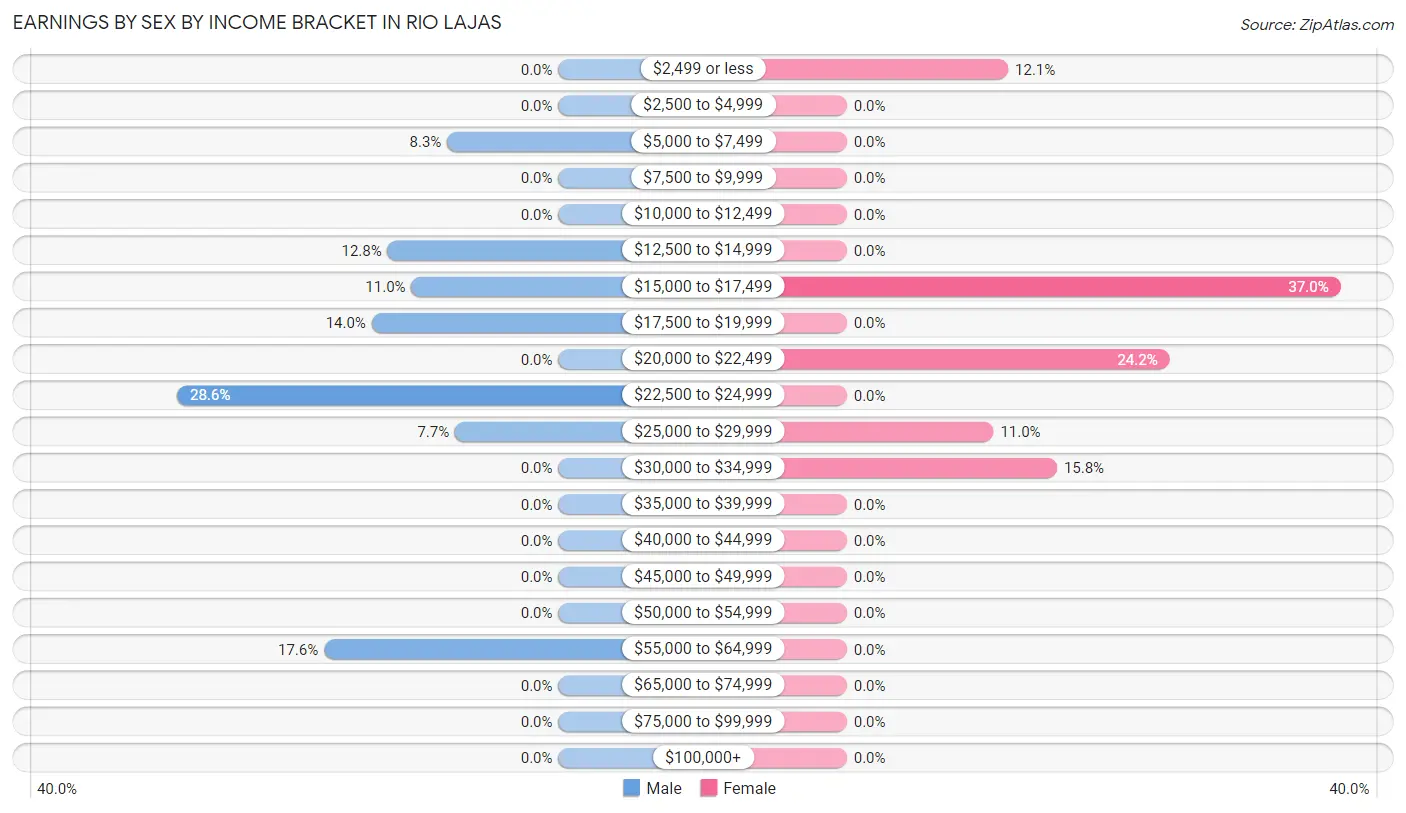
Earnings by Sex by Income Bracket in Rio Lajas
The most common earnings brackets in Rio Lajas are $22,500 to $24,999 for men (96 | 28.6%) and $15,000 to $17,499 for women (101 | 37.0%).
| Income | Male | Female |
| $2,499 or less | 0 (0.0%) | 33 (12.1%) |
| $2,500 to $4,999 | 0 (0.0%) | 0 (0.0%) |
| $5,000 to $7,499 | 28 (8.3%) | 0 (0.0%) |
| $7,500 to $9,999 | 0 (0.0%) | 0 (0.0%) |
| $10,000 to $12,499 | 0 (0.0%) | 0 (0.0%) |
| $12,500 to $14,999 | 43 (12.8%) | 0 (0.0%) |
| $15,000 to $17,499 | 37 (11.0%) | 101 (37.0%) |
| $17,500 to $19,999 | 47 (14.0%) | 0 (0.0%) |
| $20,000 to $22,499 | 0 (0.0%) | 66 (24.2%) |
| $22,500 to $24,999 | 96 (28.6%) | 0 (0.0%) |
| $25,000 to $29,999 | 26 (7.7%) | 30 (11.0%) |
| $30,000 to $34,999 | 0 (0.0%) | 43 (15.8%) |
| $35,000 to $39,999 | 0 (0.0%) | 0 (0.0%) |
| $40,000 to $44,999 | 0 (0.0%) | 0 (0.0%) |
| $45,000 to $49,999 | 0 (0.0%) | 0 (0.0%) |
| $50,000 to $54,999 | 0 (0.0%) | 0 (0.0%) |
| $55,000 to $64,999 | 59 (17.6%) | 0 (0.0%) |
| $65,000 to $74,999 | 0 (0.0%) | 0 (0.0%) |
| $75,000 to $99,999 | 0 (0.0%) | 0 (0.0%) |
| $100,000+ | 0 (0.0%) | 0 (0.0%) |
| Total | 336 (100.0%) | 273 (100.0%) |
Earnings by Sex by Educational Attainment in Rio Lajas
| Educational Attainment | Male Income | Female Income |
| Less than High School | - | - |
| High School Diploma | - | - |
| College or Associate's Degree | - | - |
| Bachelor's Degree | - | - |
| Graduate Degree | - | - |
| Total | $23,880 | $20,095 |
Family Income in Rio Lajas
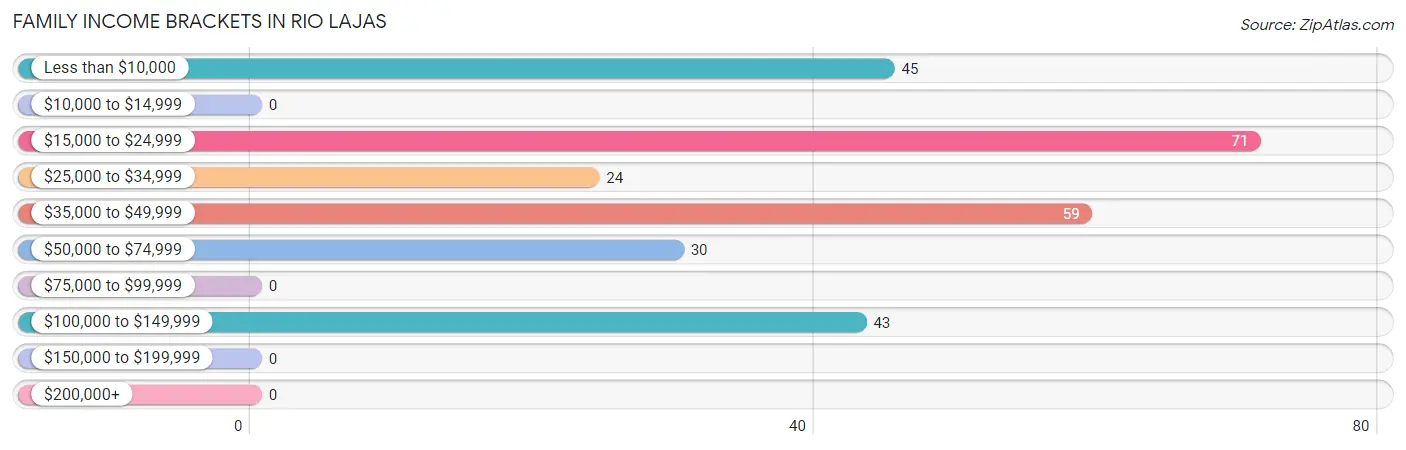
Family Income Brackets in Rio Lajas
According to the Rio Lajas family income data, there are 71 families falling into the $15,000 to $24,999 income range, which is the most common income bracket and makes up 26.1% of all families.
| Income Bracket | # Families | % Families |
| Less than $10,000 | 45 | 16.5% |
| $10,000 to $14,999 | 0 | 0.0% |
| $15,000 to $24,999 | 71 | 26.1% |
| $25,000 to $34,999 | 24 | 8.8% |
| $35,000 to $49,999 | 59 | 21.7% |
| $50,000 to $74,999 | 30 | 11.0% |
| $75,000 to $99,999 | 0 | 0.0% |
| $100,000 to $149,999 | 43 | 15.8% |
| $150,000 to $199,999 | 0 | 0.0% |
| $200,000+ | 0 | 0.0% |
Family Income by Famaliy Size in Rio Lajas
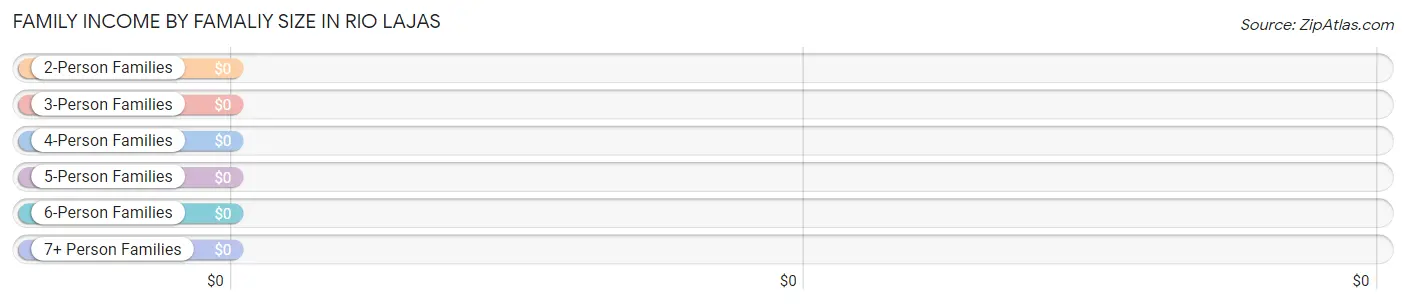
| Income Bracket | # Families | Median Income |
| 2-Person Families | 74 (27.2%) | $0 |
| 3-Person Families | 87 (32.0%) | $0 |
| 4-Person Families | 44 (16.2%) | $0 |
| 5-Person Families | 43 (15.8%) | $0 |
| 6-Person Families | 24 (8.8%) | $0 |
| 7+ Person Families | 0 (0.0%) | $0 |
| Total | 272 (100.0%) | $32,083 |
Family Income by Number of Earners in Rio Lajas
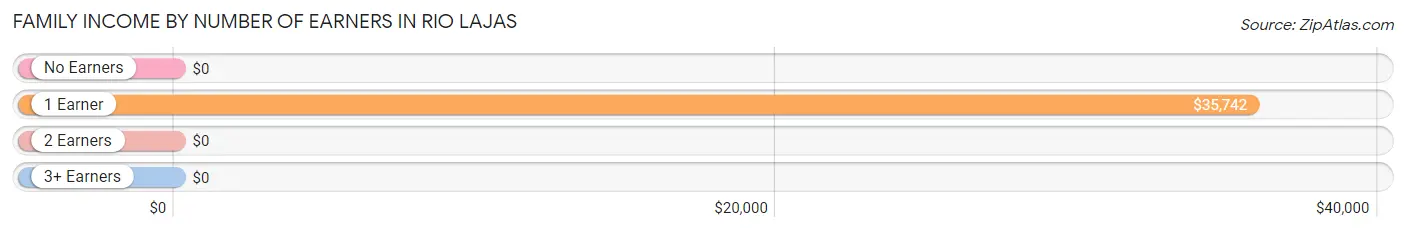
| Number of Earners | # Families | Median Income |
| No Earners | 84 (30.9%) | $0 |
| 1 Earner | 83 (30.5%) | $35,742 |
| 2 Earners | 62 (22.8%) | $0 |
| 3+ Earners | 43 (15.8%) | $0 |
| Total | 272 (100.0%) | $32,083 |
Household Income in Rio Lajas
Household Income Brackets in Rio Lajas
With 183 households falling in the category, the less than $10,000 income range is the most frequent in Rio Lajas, accounting for 35.0% of all households.
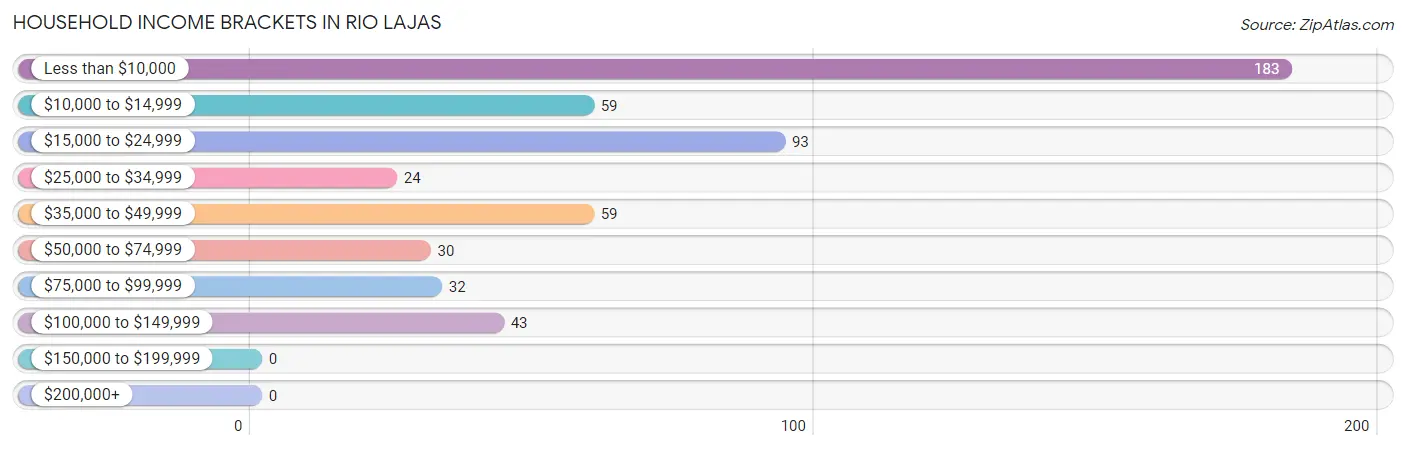
| Income Bracket | # Households | % Households |
| Less than $10,000 | 183 | 35.0% |
| $10,000 to $14,999 | 59 | 11.3% |
| $15,000 to $24,999 | 93 | 17.8% |
| $25,000 to $34,999 | 24 | 4.6% |
| $35,000 to $49,999 | 59 | 11.3% |
| $50,000 to $74,999 | 30 | 5.7% |
| $75,000 to $99,999 | 32 | 6.1% |
| $100,000 to $149,999 | 43 | 8.2% |
| $150,000 to $199,999 | 0 | 0.0% |
| $200,000+ | 0 | 0.0% |
Household Income by Householder Age in Rio Lajas
The median household income in Rio Lajas is $19,716, with the highest median household income of $18,636 found in the 65+ years age bracket for the primary householder. A total of 172 households (32.9%) fall into this category.
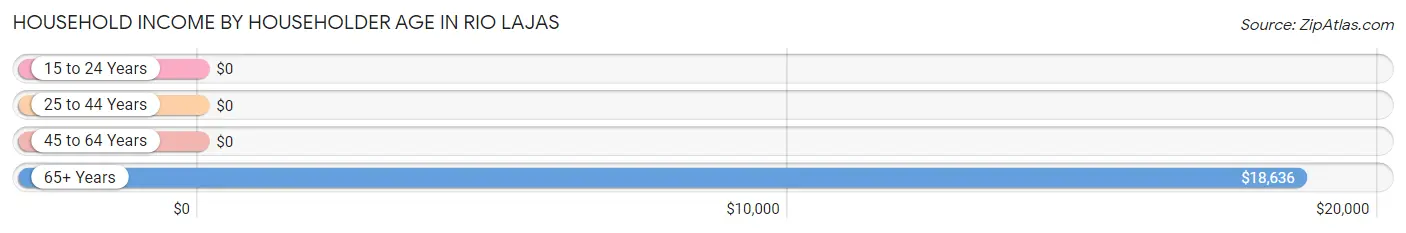
| Income Bracket | # Households | Median Income |
| 15 to 24 Years | 0 (0.0%) | $0 |
| 25 to 44 Years | 126 (24.1%) | $0 |
| 45 to 64 Years | 225 (43.0%) | $0 |
| 65+ Years | 172 (32.9%) | $18,636 |
| Total | 523 (100.0%) | $19,716 |
Poverty in Rio Lajas
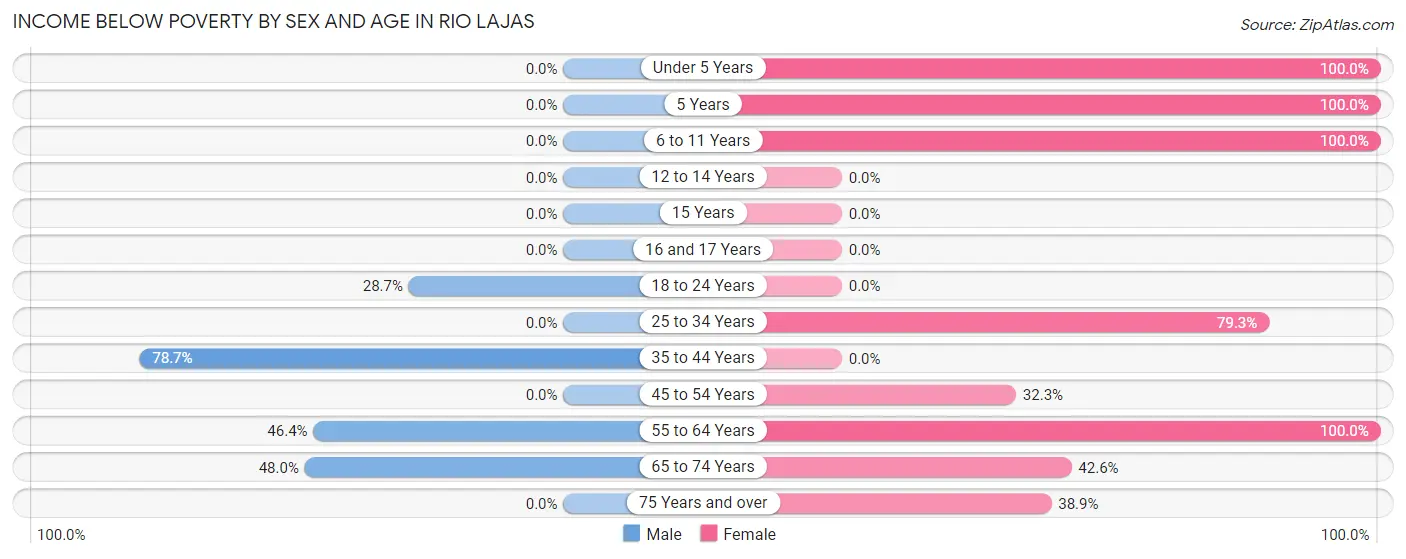
Income Below Poverty by Sex and Age in Rio Lajas
With 37.8% poverty level for males and 65.8% for females among the residents of Rio Lajas, 35 to 44 year old males and under 5 year old females are the most vulnerable to poverty, with 96 males (78.7%) and 190 females (100.0%) in their respective age groups living below the poverty level.
| Age Bracket | Male | Female |
| Under 5 Years | 0 (0.0%) | 190 (100.0%) |
| 5 Years | 0 (0.0%) | 51 (100.0%) |
| 6 to 11 Years | 0 (0.0%) | 21 (100.0%) |
| 12 to 14 Years | 0 (0.0%) | 0 (0.0%) |
| 15 Years | 0 (0.0%) | 0 (0.0%) |
| 16 and 17 Years | 0 (0.0%) | 0 (0.0%) |
| 18 to 24 Years | 37 (28.7%) | 0 (0.0%) |
| 25 to 34 Years | 0 (0.0%) | 253 (79.3%) |
| 35 to 44 Years | 96 (78.7%) | 0 (0.0%) |
| 45 to 54 Years | 0 (0.0%) | 32 (32.3%) |
| 55 to 64 Years | 122 (46.4%) | 41 (100.0%) |
| 65 to 74 Years | 36 (48.0%) | 26 (42.6%) |
| 75 Years and over | 0 (0.0%) | 14 (38.9%) |
| Total | 291 (37.8%) | 628 (65.8%) |
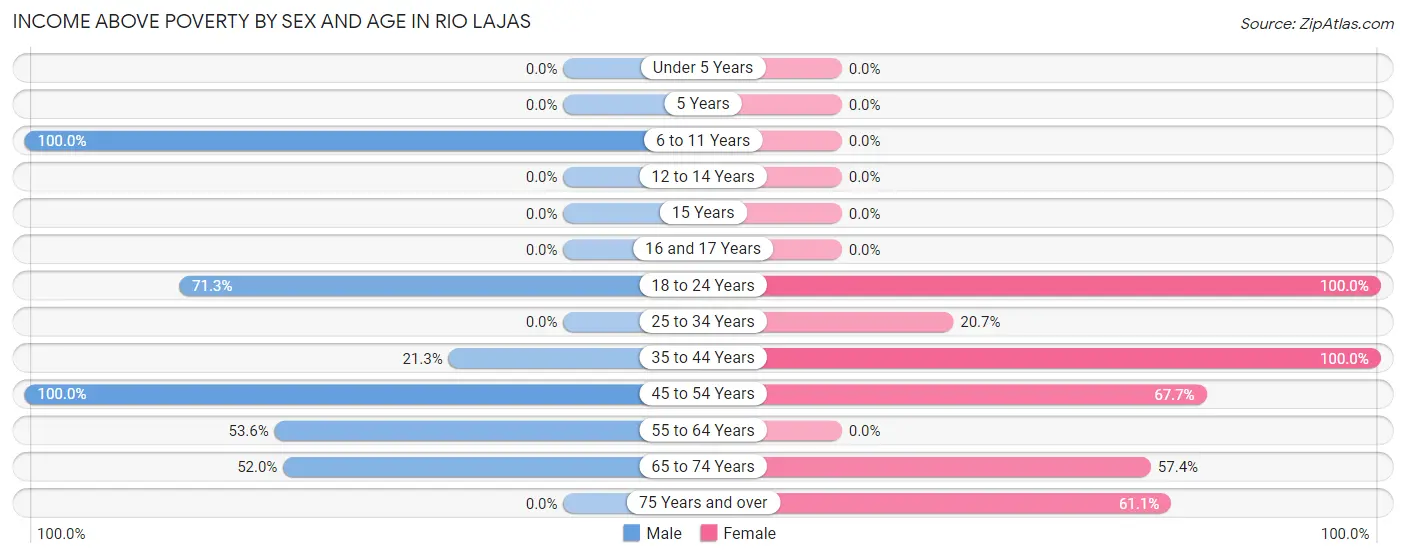
Income Above Poverty by Sex and Age in Rio Lajas
According to the poverty statistics in Rio Lajas, males aged 6 to 11 years and females aged 18 to 24 years are the age groups that are most secure financially, with 100.0% of males and 100.0% of females in these age groups living above the poverty line.
| Age Bracket | Male | Female |
| Under 5 Years | 0 (0.0%) | 0 (0.0%) |
| 5 Years | 0 (0.0%) | 0 (0.0%) |
| 6 to 11 Years | 38 (100.0%) | 0 (0.0%) |
| 12 to 14 Years | 0 (0.0%) | 0 (0.0%) |
| 15 Years | 0 (0.0%) | 0 (0.0%) |
| 16 and 17 Years | 0 (0.0%) | 0 (0.0%) |
| 18 to 24 Years | 92 (71.3%) | 106 (100.0%) |
| 25 to 34 Years | 0 (0.0%) | 66 (20.7%) |
| 35 to 44 Years | 26 (21.3%) | 30 (100.0%) |
| 45 to 54 Years | 143 (100.0%) | 67 (67.7%) |
| 55 to 64 Years | 141 (53.6%) | 0 (0.0%) |
| 65 to 74 Years | 39 (52.0%) | 35 (57.4%) |
| 75 Years and over | 0 (0.0%) | 22 (61.1%) |
| Total | 479 (62.2%) | 326 (34.2%) |
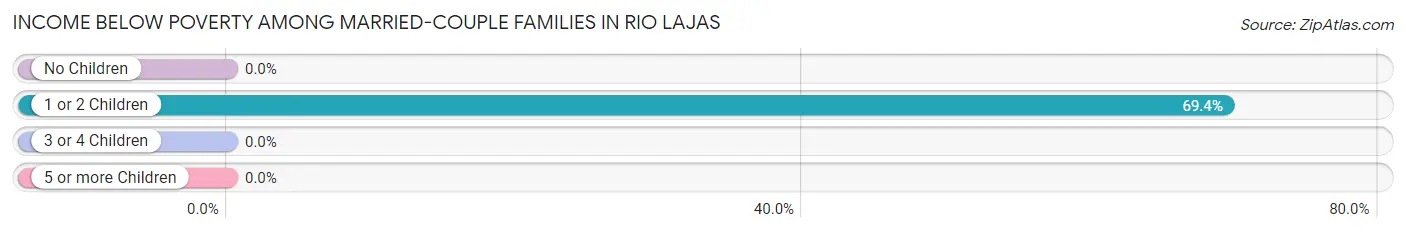
Income Below Poverty Among Married-Couple Families in Rio Lajas
The poverty statistics for married-couple families in Rio Lajas show that 48.2% or 68 of the total 141 families live below the poverty line. Families with 1 or 2 children have the highest poverty rate of 69.4%, comprising of 68 families. On the other hand, families with no children have the lowest poverty rate of 0.0%, which includes 0 families.
| Children | Above Poverty | Below Poverty |
| No Children | 43 (100.0%) | 0 (0.0%) |
| 1 or 2 Children | 30 (30.6%) | 68 (69.4%) |
| 3 or 4 Children | 0 (0.0%) | 0 (0.0%) |
| 5 or more Children | 0 (0.0%) | 0 (0.0%) |
| Total | 73 (51.8%) | 68 (48.2%) |
Income Below Poverty Among Single-Parent Households in Rio Lajas
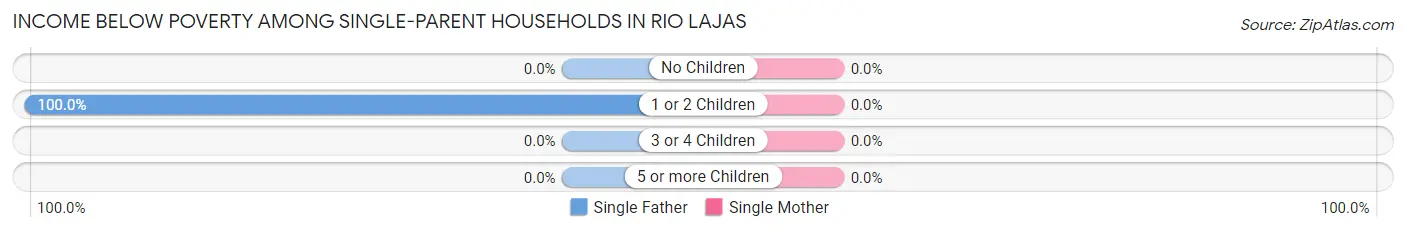
| Children | Single Father | Single Mother |
| No Children | 0 (0.0%) | 0 (0.0%) |
| 1 or 2 Children | 33 (100.0%) | 0 (0.0%) |
| 3 or 4 Children | 0 (0.0%) | 0 (0.0%) |
| 5 or more Children | 0 (0.0%) | 0 (0.0%) |
| Total | 33 (45.8%) | 0 (0.0%) |
Income Below Poverty Among Married-Couple vs Single-Parent Households in Rio Lajas
The poverty data for Rio Lajas shows that 68 of the married-couple family households (48.2%) and 33 of the single-parent households (25.2%) are living below the poverty level. Within the married-couple family households, those with 1 or 2 children have the highest poverty rate, with 68 households (69.4%) falling below the poverty line. Among the single-parent households, those with 1 or 2 children have the highest poverty rate, with 33 household (100.0%) living below poverty.
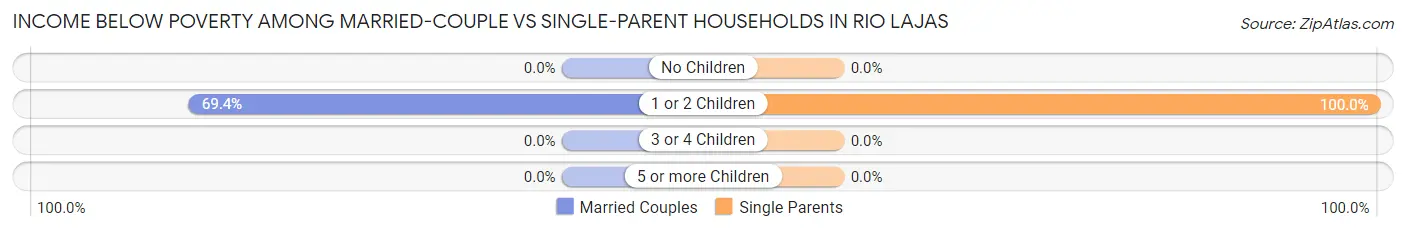
| Children | Married-Couple Families | Single-Parent Households |
| No Children | 0 (0.0%) | 0 (0.0%) |
| 1 or 2 Children | 68 (69.4%) | 33 (100.0%) |
| 3 or 4 Children | 0 (0.0%) | 0 (0.0%) |
| 5 or more Children | 0 (0.0%) | 0 (0.0%) |
| Total | 68 (48.2%) | 33 (25.2%) |
Race in Rio Lajas
The most populous races in Rio Lajas are Hispanic or Latino (1,696 | 98.4%), White / Caucasian (788 | 45.7%), and Two or more Races (706 | 40.9%).
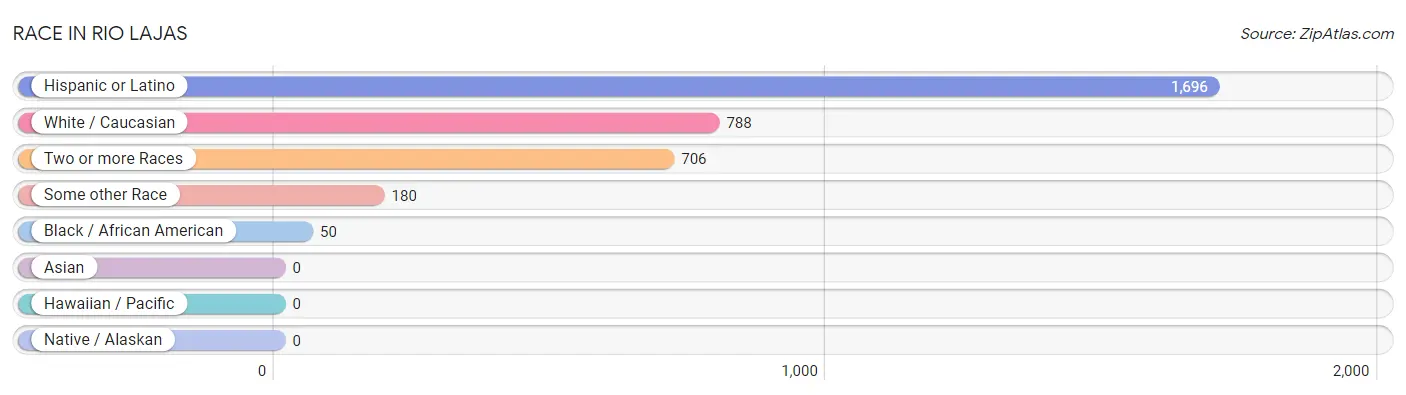
| Race | # Population | % Population |
| Asian | 0 | 0.0% |
| Black / African American | 50 | 2.9% |
| Hawaiian / Pacific | 0 | 0.0% |
| Hispanic or Latino | 1,696 | 98.4% |
| Native / Alaskan | 0 | 0.0% |
| White / Caucasian | 788 | 45.7% |
| Two or more Races | 706 | 40.9% |
| Some other Race | 180 | 10.4% |
| Total | 1,724 | 100.0% |
Ancestry in Rio Lajas
The most populous ancestries reported in Rio Lajas are , and Puerto Rican (1,696 | 98.4%), together accounting for 98.4% of all Rio Lajas residents.

| Ancestry | # Population | % Population |
| Puerto Rican | 1,696 | 98.4% | View All 1 Rows |
Immigrants in Rio Lajas

| Immigration Origin | # Population | % Population | View All 0 Rows |
Sex and Age in Rio Lajas
Sex and Age in Rio Lajas
The most populous age groups in Rio Lajas are 60 to 64 Years (182 | 23.6%) for men and 25 to 29 Years (218 | 22.9%) for women.
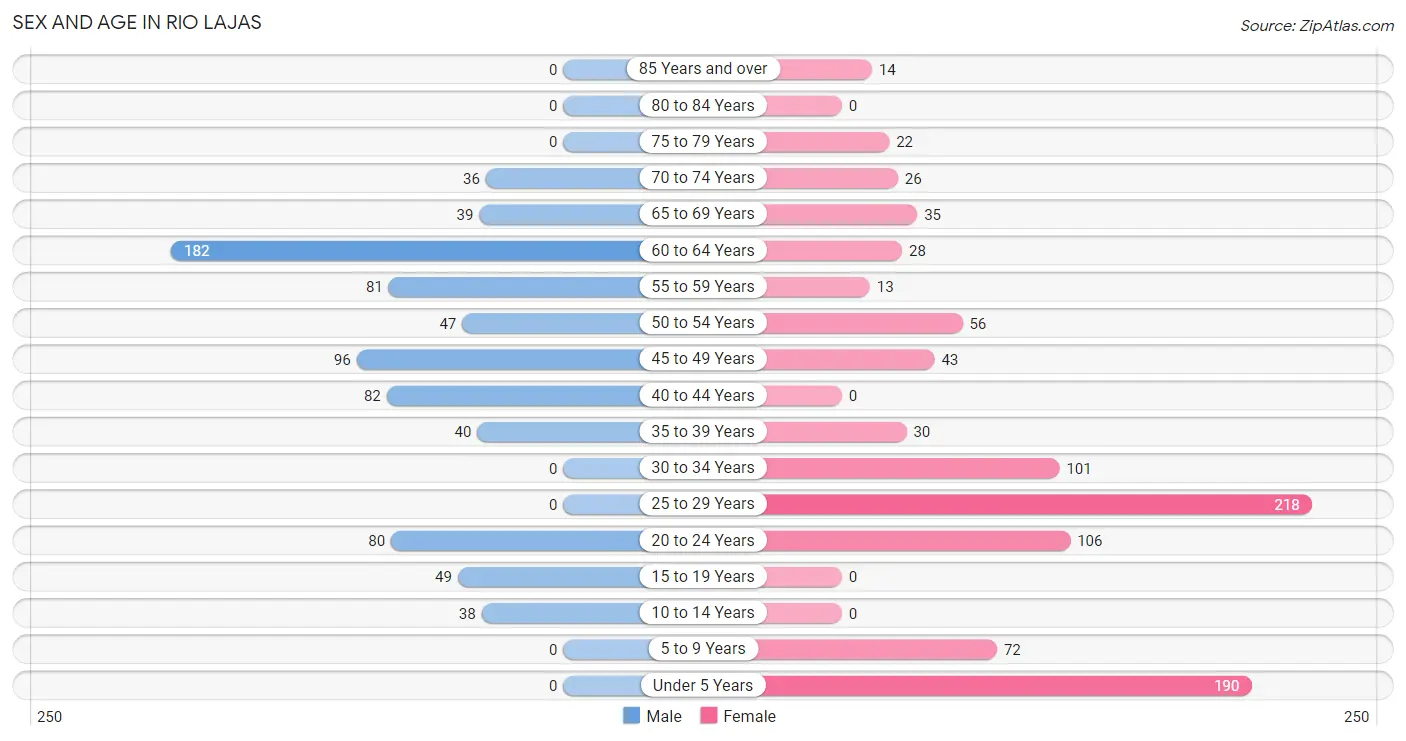
| Age Bracket | Male | Female |
| Under 5 Years | 0 (0.0%) | 190 (19.9%) |
| 5 to 9 Years | 0 (0.0%) | 72 (7.5%) |
| 10 to 14 Years | 38 (4.9%) | 0 (0.0%) |
| 15 to 19 Years | 49 (6.4%) | 0 (0.0%) |
| 20 to 24 Years | 80 (10.4%) | 106 (11.1%) |
| 25 to 29 Years | 0 (0.0%) | 218 (22.9%) |
| 30 to 34 Years | 0 (0.0%) | 101 (10.6%) |
| 35 to 39 Years | 40 (5.2%) | 30 (3.1%) |
| 40 to 44 Years | 82 (10.6%) | 0 (0.0%) |
| 45 to 49 Years | 96 (12.5%) | 43 (4.5%) |
| 50 to 54 Years | 47 (6.1%) | 56 (5.9%) |
| 55 to 59 Years | 81 (10.5%) | 13 (1.4%) |
| 60 to 64 Years | 182 (23.6%) | 28 (2.9%) |
| 65 to 69 Years | 39 (5.1%) | 35 (3.7%) |
| 70 to 74 Years | 36 (4.7%) | 26 (2.7%) |
| 75 to 79 Years | 0 (0.0%) | 22 (2.3%) |
| 80 to 84 Years | 0 (0.0%) | 0 (0.0%) |
| 85 Years and over | 0 (0.0%) | 14 (1.5%) |
| Total | 770 (100.0%) | 954 (100.0%) |
Families and Households in Rio Lajas
Median Family Size in Rio Lajas
The median family size in Rio Lajas is 5.12 persons per family, with married-couple families (141 | 51.8%) accounting for the largest median family size of 6.2 persons per family. On the other hand, single male/father families (72 | 26.5%) represent the smallest median family size with 3.46 persons per family.
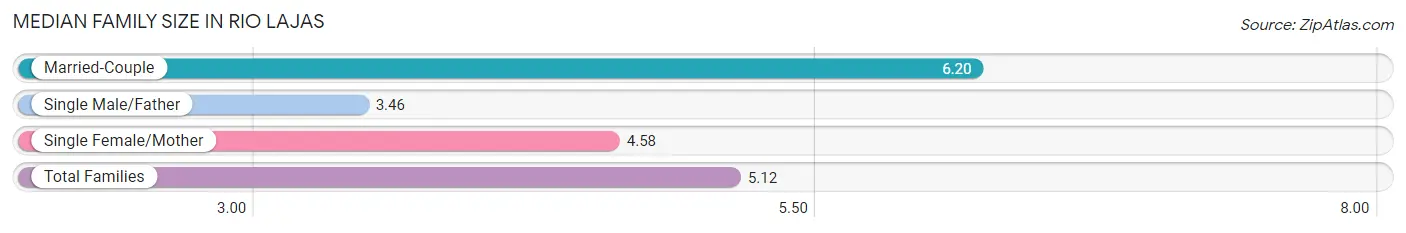
| Family Type | # Families | Family Size |
| Married-Couple | 141 (51.8%) | 6.20 |
| Single Male/Father | 72 (26.5%) | 3.46 |
| Single Female/Mother | 59 (21.7%) | 4.58 |
| Total Families | 272 (100.0%) | 5.12 |
Median Household Size in Rio Lajas
The median household size in Rio Lajas is 3.30 persons per household, with married-couple households (141 | 27.0%) accounting for the largest median household size of 6.2 persons per household. non-family households (251 | 48.0%) represent the smallest median household size with 1.19 persons per household.
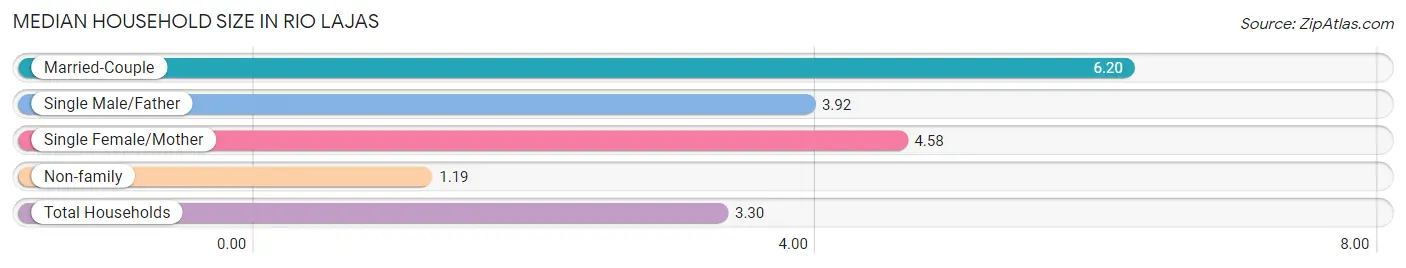
| Household Type | # Households | Household Size |
| Married-Couple | 141 (27.0%) | 6.20 |
| Single Male/Father | 72 (13.8%) | 3.92 |
| Single Female/Mother | 59 (11.3%) | 4.58 |
| Non-family | 251 (48.0%) | 1.19 |
| Total Households | 523 (100.0%) | 3.30 |
Household Size by Marriage Status in Rio Lajas
Out of a total of 523 households in Rio Lajas, 272 (52.0%) are family households, while 251 (48.0%) are nonfamily households. The most numerous type of family households are 4-person households, comprising 77, and the most common type of nonfamily households are 1-person households, comprising 219.
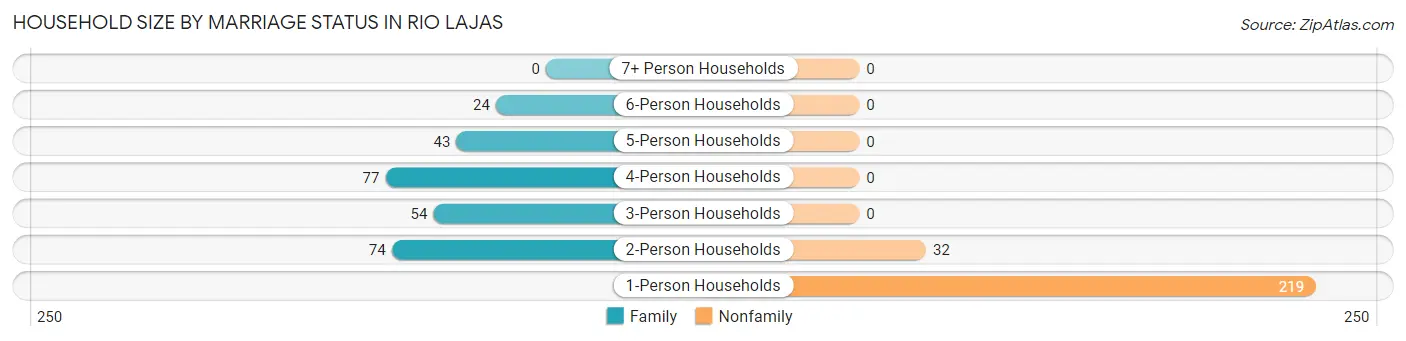
| Household Size | Family Households | Nonfamily Households |
| 1-Person Households | - | 219 (41.9%) |
| 2-Person Households | 74 (14.1%) | 32 (6.1%) |
| 3-Person Households | 54 (10.3%) | 0 (0.0%) |
| 4-Person Households | 77 (14.7%) | 0 (0.0%) |
| 5-Person Households | 43 (8.2%) | 0 (0.0%) |
| 6-Person Households | 24 (4.6%) | 0 (0.0%) |
| 7+ Person Households | 0 (0.0%) | 0 (0.0%) |
| Total | 272 (52.0%) | 251 (48.0%) |
Female Fertility in Rio Lajas
Fertility by Age in Rio Lajas
Average fertility rate in Rio Lajas is 225.0 births per 1,000 women. Women in the age bracket of 20 to 34 years have the highest fertility rate with 264.0 births per 1,000 women. Women in the age bracket of 20 to 34 years acount for 100.0% of all women with births.
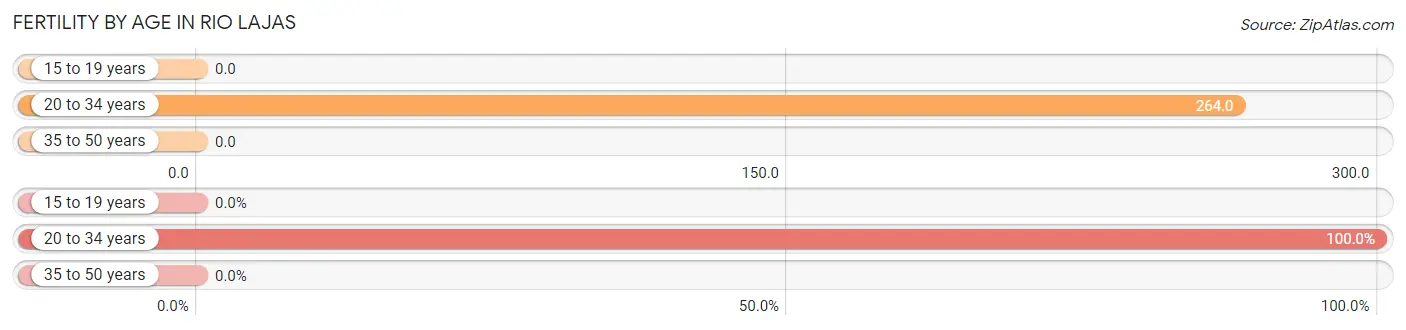
| Age Bracket | Women with Births | Births / 1,000 Women |
| 15 to 19 years | 0 (0.0%) | 0.0 |
| 20 to 34 years | 112 (100.0%) | 264.0 |
| 35 to 50 years | 0 (0.0%) | 0.0 |
| Total | 112 (100.0%) | 225.0 |
Fertility by Age by Marriage Status in Rio Lajas
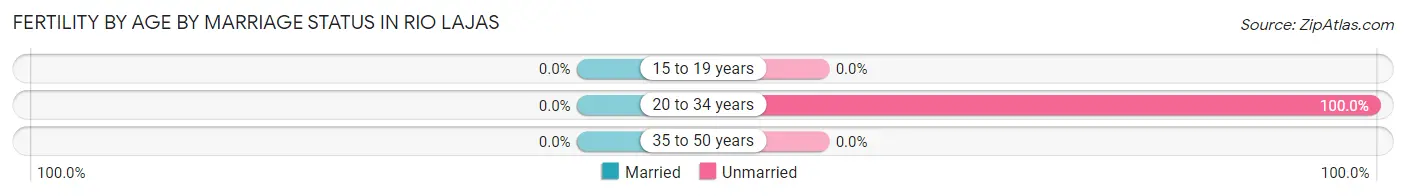
| Age Bracket | Married | Unmarried |
| 15 to 19 years | 0 (0.0%) | 0 (0.0%) |
| 20 to 34 years | 0 (0.0%) | 112 (100.0%) |
| 35 to 50 years | 0 (0.0%) | 0 (0.0%) |
| Total | 0 (0.0%) | 112 (100.0%) |
Fertility by Education in Rio Lajas
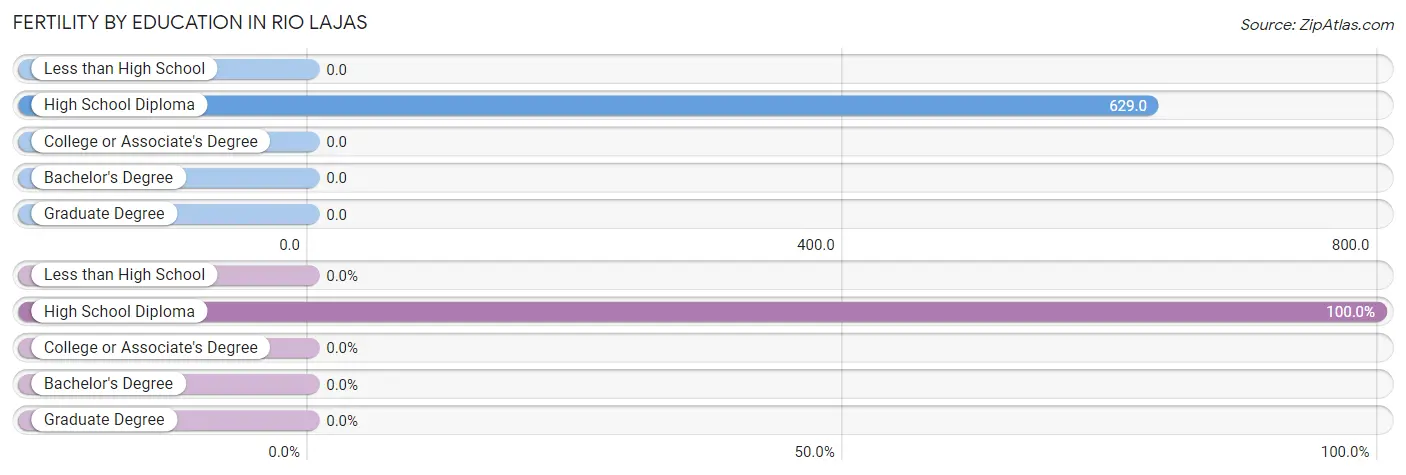
| Educational Attainment | Women with Births | Births / 1,000 Women |
| Less than High School | 0 (0.0%) | 0.0 |
| High School Diploma | 112 (100.0%) | 629.0 |
| College or Associate's Degree | 0 (0.0%) | 0.0 |
| Bachelor's Degree | 0 (0.0%) | 0.0 |
| Graduate Degree | 0 (0.0%) | 0.0 |
| Total | 112 (100.0%) | 225.0 |
Fertility by Education by Marriage Status in Rio Lajas
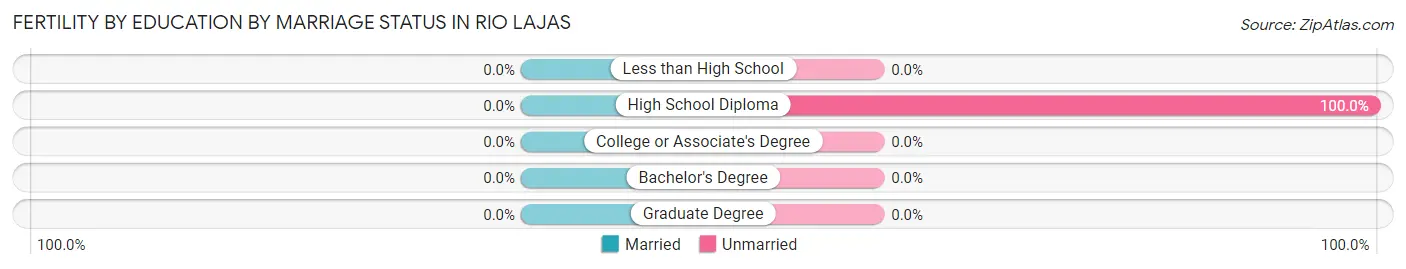
| Educational Attainment | Married | Unmarried |
| Less than High School | 0 (0.0%) | 0 (0.0%) |
| High School Diploma | 0 (0.0%) | 112 (100.0%) |
| College or Associate's Degree | 0 (0.0%) | 0 (0.0%) |
| Bachelor's Degree | 0 (0.0%) | 0 (0.0%) |
| Graduate Degree | 0 (0.0%) | 0 (0.0%) |
| Total | 0 (0.0%) | 112 (100.0%) |
Employment Characteristics in Rio Lajas
Employment by Class of Employer in Rio Lajas
Among the 562 employed individuals in Rio Lajas, private company employees (530 | 94.3%), and state government employees (32 | 5.7%) make up the most common classes of employment.
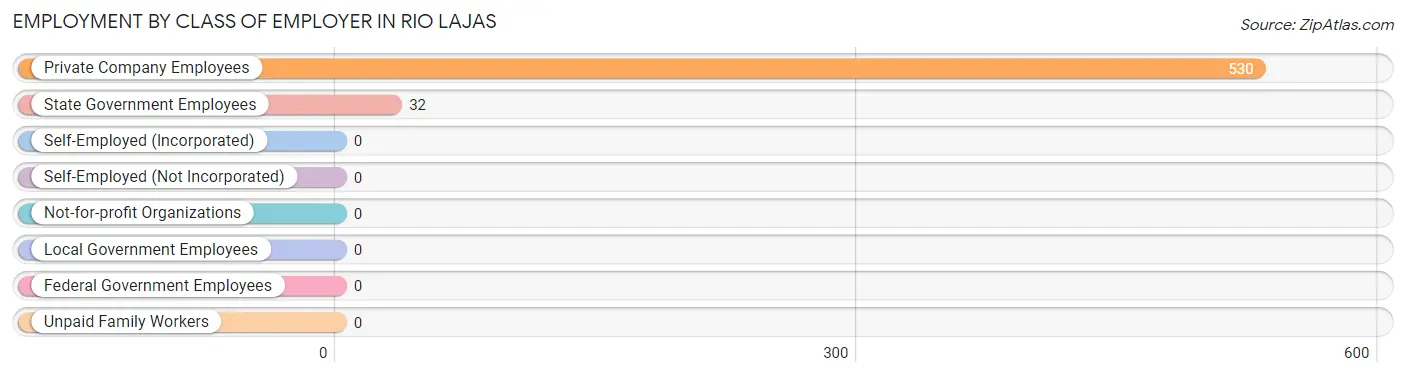
| Employer Class | # Employees | % Employees |
| Private Company Employees | 530 | 94.3% |
| Self-Employed (Incorporated) | 0 | 0.0% |
| Self-Employed (Not Incorporated) | 0 | 0.0% |
| Not-for-profit Organizations | 0 | 0.0% |
| Local Government Employees | 0 | 0.0% |
| State Government Employees | 32 | 5.7% |
| Federal Government Employees | 0 | 0.0% |
| Unpaid Family Workers | 0 | 0.0% |
| Total | 562 | 100.0% |
Employment Status by Age in Rio Lajas
According to the labor force statistics for Rio Lajas, out of the total population over 16 years of age (1,424), 49.6% or 706 individuals are in the labor force, with 20.4% or 144 of them unemployed. The age group with the highest labor force participation rate is 30 to 34 years, with 100.0% or 101 individuals in the labor force. Within the labor force, the 35 to 44 years age range has the highest percentage of unemployed individuals, with 56.6% or 73 of them being unemployed.
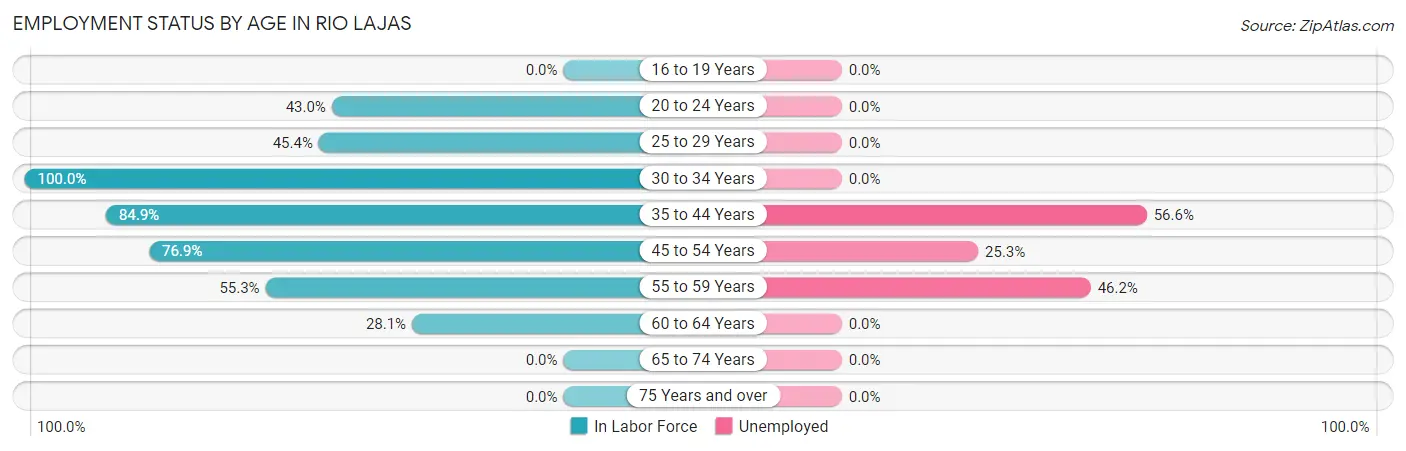
| Age Bracket | In Labor Force | Unemployed |
| 16 to 19 Years | 0 (0.0%) | 0 (0.0%) |
| 20 to 24 Years | 80 (43.0%) | 0 (0.0%) |
| 25 to 29 Years | 99 (45.4%) | 0 (0.0%) |
| 30 to 34 Years | 101 (100.0%) | 0 (0.0%) |
| 35 to 44 Years | 129 (84.9%) | 73 (56.6%) |
| 45 to 54 Years | 186 (76.9%) | 47 (25.3%) |
| 55 to 59 Years | 52 (55.3%) | 24 (46.2%) |
| 60 to 64 Years | 59 (28.1%) | 0 (0.0%) |
| 65 to 74 Years | 0 (0.0%) | 0 (0.0%) |
| 75 Years and over | 0 (0.0%) | 0 (0.0%) |
| Total | 706 (49.6%) | 144 (20.4%) |
Employment Status by Educational Attainment in Rio Lajas
According to labor force statistics for Rio Lajas, 61.6% of individuals (626) out of the total population between 25 and 64 years of age (1,017) are in the labor force, with 23.0% or 144 of them being unemployed. The group with the highest labor force participation rate are those with the educational attainment of bachelor's degree or higher, with 100.0% or 179 individuals in the labor force. Within the labor force, individuals with less than high school education have the highest percentage of unemployment, with 100.0% or 33 of them being unemployed.
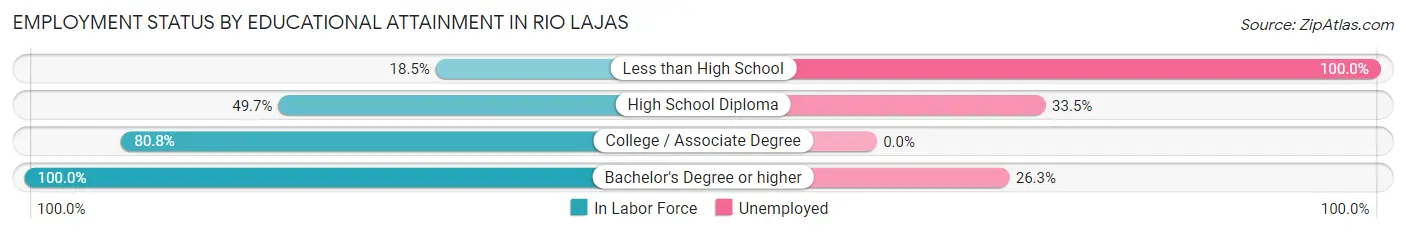
| Educational Attainment | In Labor Force | Unemployed |
| Less than High School | 33 (18.5%) | 178 (100.0%) |
| High School Diploma | 191 (49.7%) | 129 (33.5%) |
| College / Associate Degree | 223 (80.8%) | 0 (0.0%) |
| Bachelor's Degree or higher | 179 (100.0%) | 47 (26.3%) |
| Total | 626 (61.6%) | 234 (23.0%) |
Employment Occupations by Sex in Rio Lajas
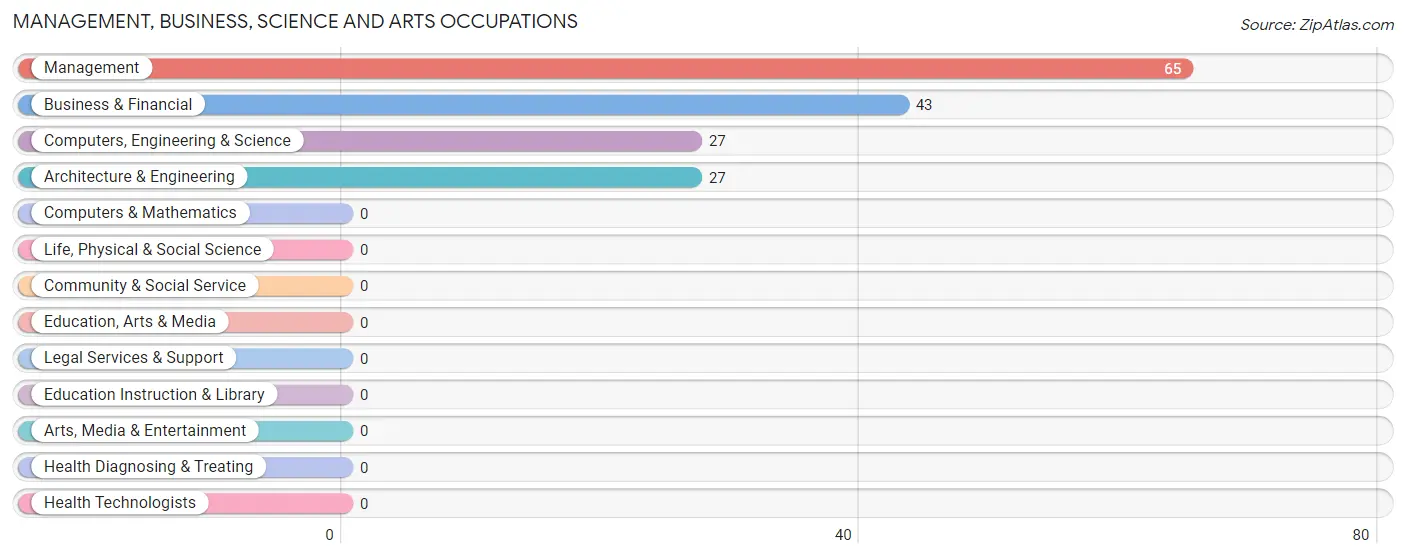
Management, Business, Science and Arts Occupations
The most common Management, Business, Science and Arts occupations in Rio Lajas are Management (65 | 11.6%), Business & Financial (43 | 7.6%), Computers, Engineering & Science (27 | 4.8%), and Architecture & Engineering (27 | 4.8%).
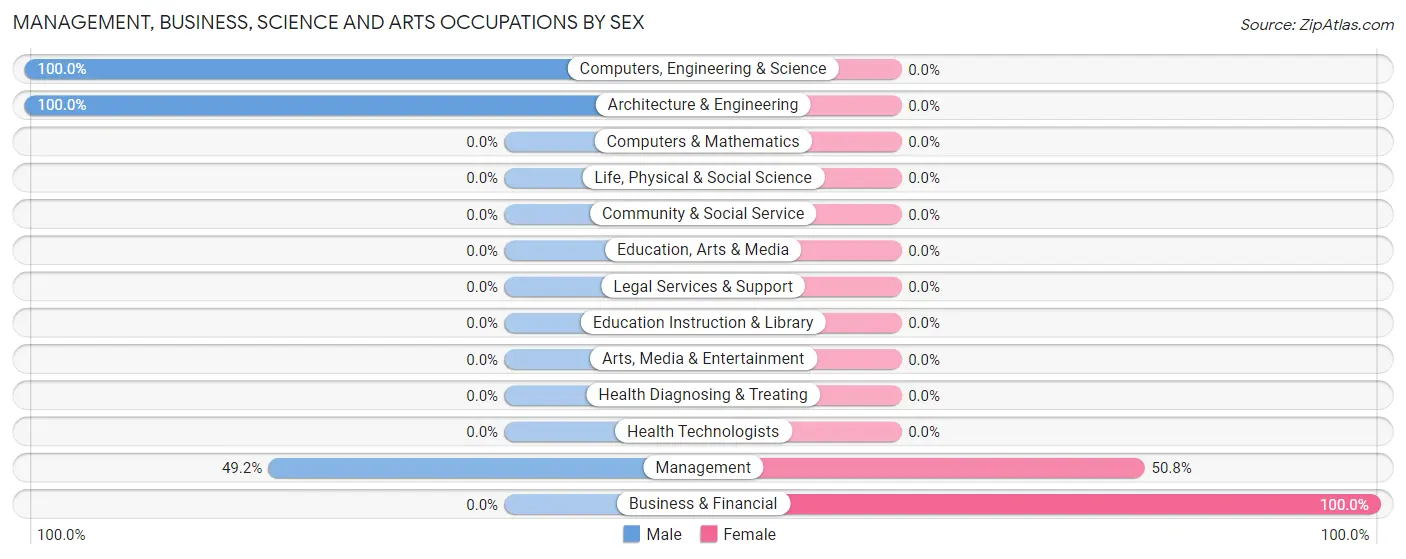
Management, Business, Science and Arts Occupations by Sex
Within the Management, Business, Science and Arts occupations in Rio Lajas, the most male-oriented occupations are Computers, Engineering & Science (100.0%), Architecture & Engineering (100.0%), and Management (49.2%), while the most female-oriented occupations are Business & Financial (100.0%), and Management (50.8%).
| Occupation | Male | Female |
| Management | 32 (49.2%) | 33 (50.8%) |
| Business & Financial | 0 (0.0%) | 43 (100.0%) |
| Computers, Engineering & Science | 27 (100.0%) | 0 (0.0%) |
| Computers & Mathematics | 0 (0.0%) | 0 (0.0%) |
| Architecture & Engineering | 27 (100.0%) | 0 (0.0%) |
| Life, Physical & Social Science | 0 (0.0%) | 0 (0.0%) |
| Community & Social Service | 0 (0.0%) | 0 (0.0%) |
| Education, Arts & Media | 0 (0.0%) | 0 (0.0%) |
| Legal Services & Support | 0 (0.0%) | 0 (0.0%) |
| Education Instruction & Library | 0 (0.0%) | 0 (0.0%) |
| Arts, Media & Entertainment | 0 (0.0%) | 0 (0.0%) |
| Health Diagnosing & Treating | 0 (0.0%) | 0 (0.0%) |
| Health Technologists | 0 (0.0%) | 0 (0.0%) |
| Total (Category) | 59 (43.7%) | 76 (56.3%) |
| Total (Overall) | 289 (51.4%) | 273 (48.6%) |
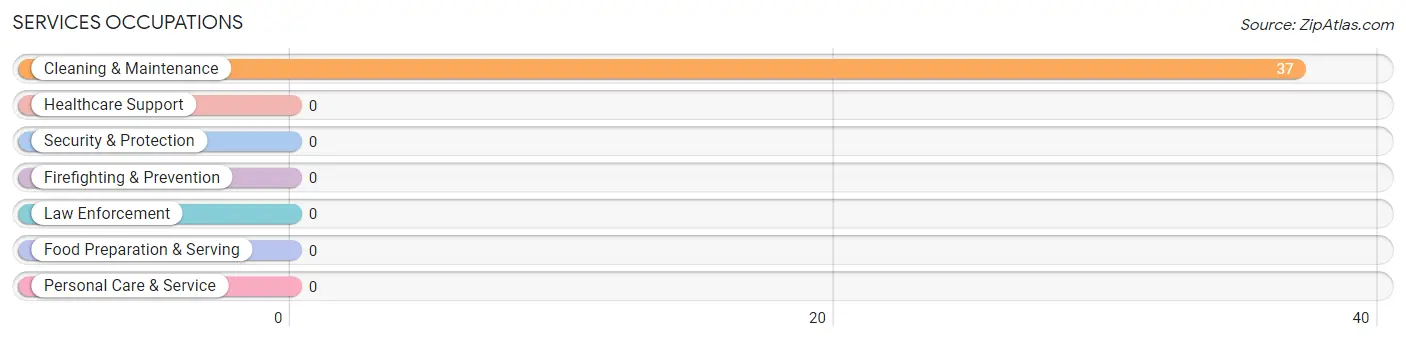
Services Occupations
The most common Services occupations in Rio Lajas are , and Cleaning & Maintenance (37 | 6.6%).
Services Occupations by Sex
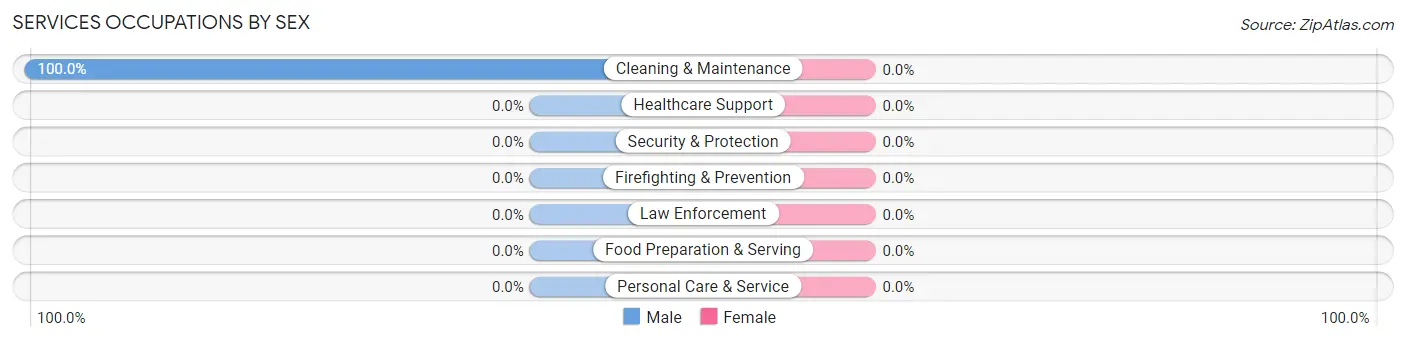
| Occupation | Male | Female |
| Healthcare Support | 0 (0.0%) | 0 (0.0%) |
| Security & Protection | 0 (0.0%) | 0 (0.0%) |
| Firefighting & Prevention | 0 (0.0%) | 0 (0.0%) |
| Law Enforcement | 0 (0.0%) | 0 (0.0%) |
| Food Preparation & Serving | 0 (0.0%) | 0 (0.0%) |
| Cleaning & Maintenance | 37 (100.0%) | 0 (0.0%) |
| Personal Care & Service | 0 (0.0%) | 0 (0.0%) |
| Total (Category) | 37 (100.0%) | 0 (0.0%) |
| Total (Overall) | 289 (51.4%) | 273 (48.6%) |
Sales and Office Occupations
The most common Sales and Office occupations in Rio Lajas are Office & Administration (197 | 35.0%), and Sales & Related (122 | 21.7%).
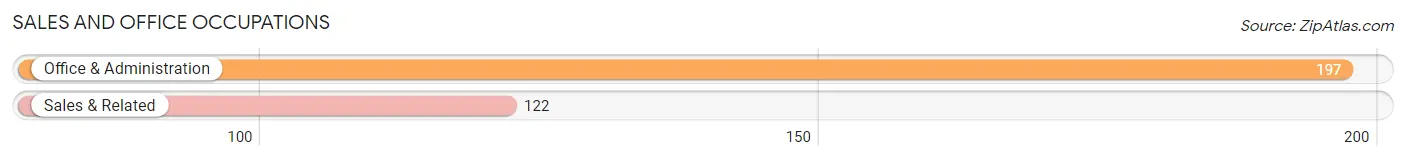
Sales and Office Occupations by Sex

| Occupation | Male | Female |
| Sales & Related | 122 (100.0%) | 0 (0.0%) |
| Office & Administration | 0 (0.0%) | 197 (100.0%) |
| Total (Category) | 122 (38.2%) | 197 (61.8%) |
| Total (Overall) | 289 (51.4%) | 273 (48.6%) |
Natural Resources, Construction and Maintenance Occupations
The most common Natural Resources, Construction and Maintenance occupations in Rio Lajas are , and Installation, Maintenance & Repair (28 | 5.0%).
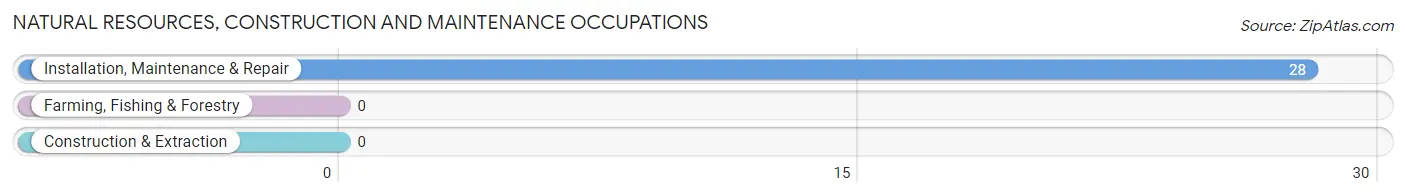
Natural Resources, Construction and Maintenance Occupations by Sex

| Occupation | Male | Female |
| Farming, Fishing & Forestry | 0 (0.0%) | 0 (0.0%) |
| Construction & Extraction | 0 (0.0%) | 0 (0.0%) |
| Installation, Maintenance & Repair | 28 (100.0%) | 0 (0.0%) |
| Total (Category) | 28 (100.0%) | 0 (0.0%) |
| Total (Overall) | 289 (51.4%) | 273 (48.6%) |
Production, Transportation and Moving Occupations
The most common Production, Transportation and Moving occupations in Rio Lajas are , and Production (43 | 7.6%).
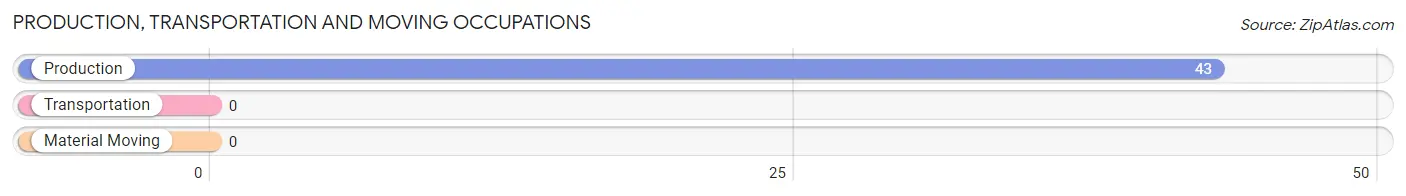
Production, Transportation and Moving Occupations by Sex
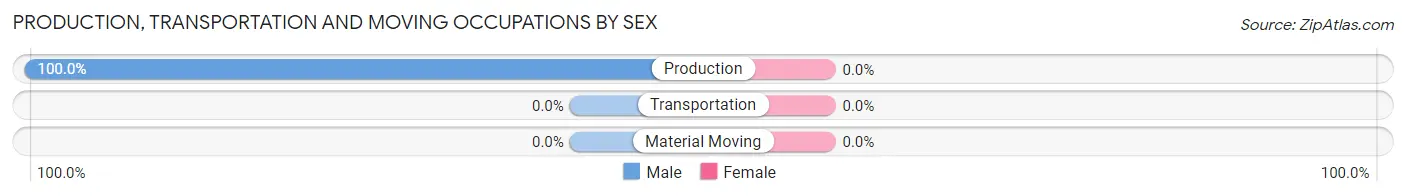
| Occupation | Male | Female |
| Production | 43 (100.0%) | 0 (0.0%) |
| Transportation | 0 (0.0%) | 0 (0.0%) |
| Material Moving | 0 (0.0%) | 0 (0.0%) |
| Total (Category) | 43 (100.0%) | 0 (0.0%) |
| Total (Overall) | 289 (51.4%) | 273 (48.6%) |
Employment Industries by Sex in Rio Lajas
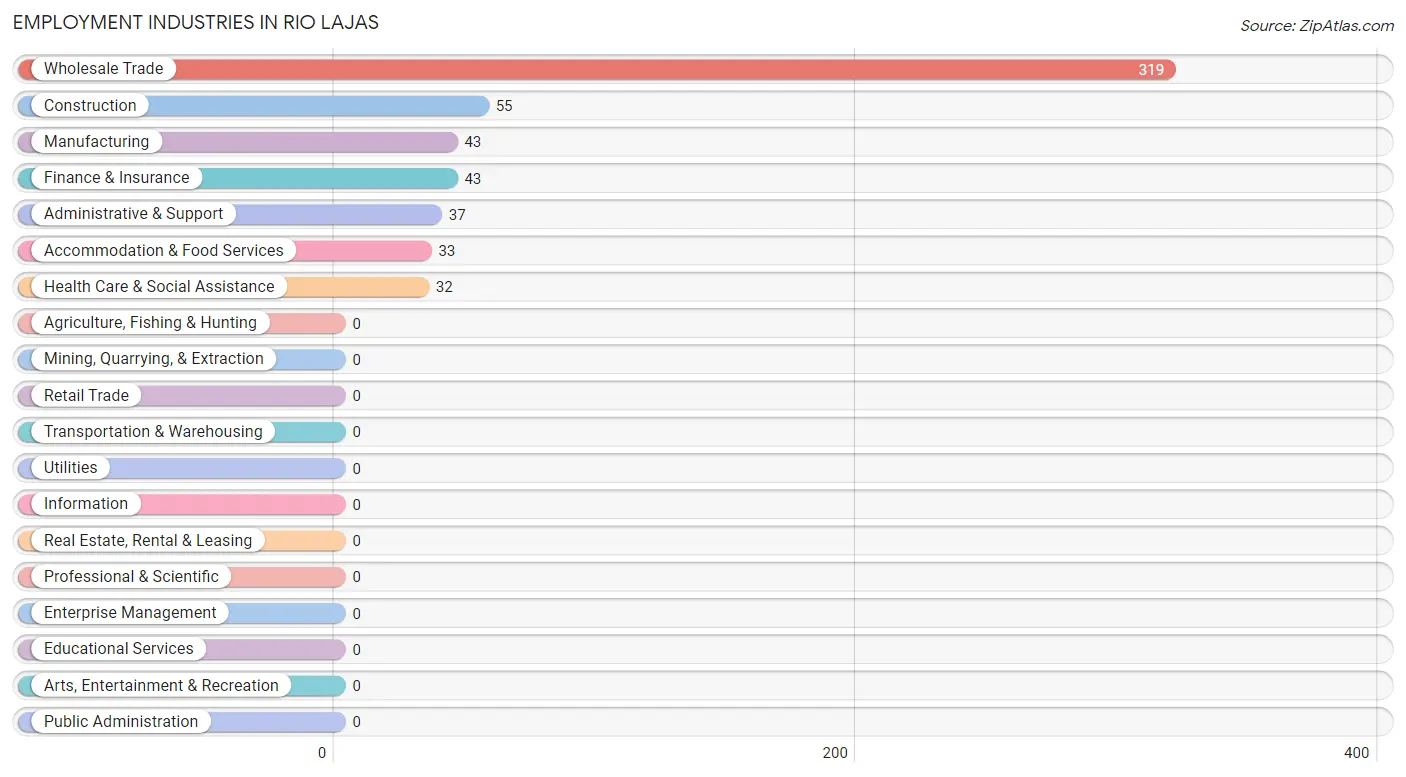
Employment Industries in Rio Lajas
The major employment industries in Rio Lajas include Wholesale Trade (319 | 56.8%), Construction (55 | 9.8%), Manufacturing (43 | 7.6%), Finance & Insurance (43 | 7.6%), and Administrative & Support (37 | 6.6%).
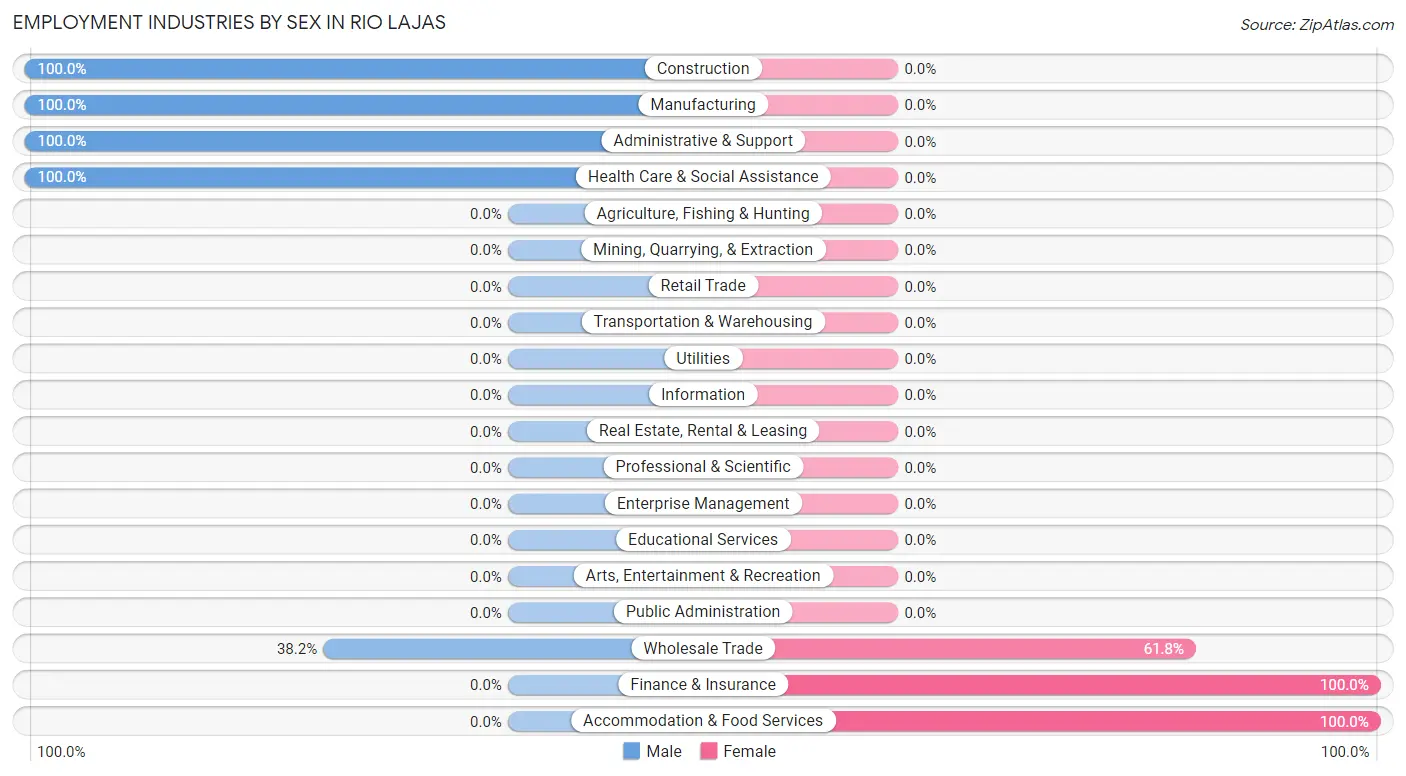
Employment Industries by Sex in Rio Lajas
The Rio Lajas industries that see more men than women are Construction (100.0%), Manufacturing (100.0%), and Administrative & Support (100.0%), whereas the industries that tend to have a higher number of women are Finance & Insurance (100.0%), Accommodation & Food Services (100.0%), and Wholesale Trade (61.8%).
| Industry | Male | Female |
| Agriculture, Fishing & Hunting | 0 (0.0%) | 0 (0.0%) |
| Mining, Quarrying, & Extraction | 0 (0.0%) | 0 (0.0%) |
| Construction | 55 (100.0%) | 0 (0.0%) |
| Manufacturing | 43 (100.0%) | 0 (0.0%) |
| Wholesale Trade | 122 (38.2%) | 197 (61.8%) |
| Retail Trade | 0 (0.0%) | 0 (0.0%) |
| Transportation & Warehousing | 0 (0.0%) | 0 (0.0%) |
| Utilities | 0 (0.0%) | 0 (0.0%) |
| Information | 0 (0.0%) | 0 (0.0%) |
| Finance & Insurance | 0 (0.0%) | 43 (100.0%) |
| Real Estate, Rental & Leasing | 0 (0.0%) | 0 (0.0%) |
| Professional & Scientific | 0 (0.0%) | 0 (0.0%) |
| Enterprise Management | 0 (0.0%) | 0 (0.0%) |
| Administrative & Support | 37 (100.0%) | 0 (0.0%) |
| Educational Services | 0 (0.0%) | 0 (0.0%) |
| Health Care & Social Assistance | 32 (100.0%) | 0 (0.0%) |
| Arts, Entertainment & Recreation | 0 (0.0%) | 0 (0.0%) |
| Accommodation & Food Services | 0 (0.0%) | 33 (100.0%) |
| Public Administration | 0 (0.0%) | 0 (0.0%) |
| Total | 289 (51.4%) | 273 (48.6%) |
Education in Rio Lajas
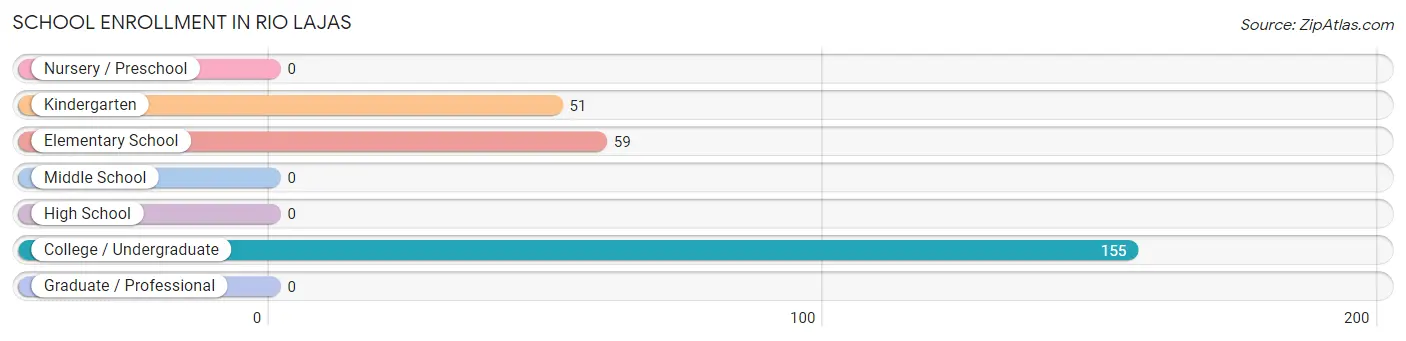
School Enrollment in Rio Lajas
The most common levels of schooling among the 265 students in Rio Lajas are college / undergraduate (155 | 58.5%), elementary school (59 | 22.3%), and kindergarten (51 | 19.3%).
| School Level | # Students | % Students |
| Nursery / Preschool | 0 | 0.0% |
| Kindergarten | 51 | 19.3% |
| Elementary School | 59 | 22.3% |
| Middle School | 0 | 0.0% |
| High School | 0 | 0.0% |
| College / Undergraduate | 155 | 58.5% |
| Graduate / Professional | 0 | 0.0% |
| Total | 265 | 100.0% |
School Enrollment by Age by Funding Source in Rio Lajas
Out of a total of 265 students who are enrolled in schools in Rio Lajas, 191 (72.1%) attend a private institution, while the remaining 74 (27.9%) are enrolled in public schools. The age group of 10 to 14 year olds has the highest likelihood of being enrolled in private schools, with 38 (100.0% in the age bracket) enrolled. Conversely, the age group of 20 to 24 year olds has the lowest likelihood of being enrolled in a private school, with 53 (50.0% in the age bracket) attending a public institution.
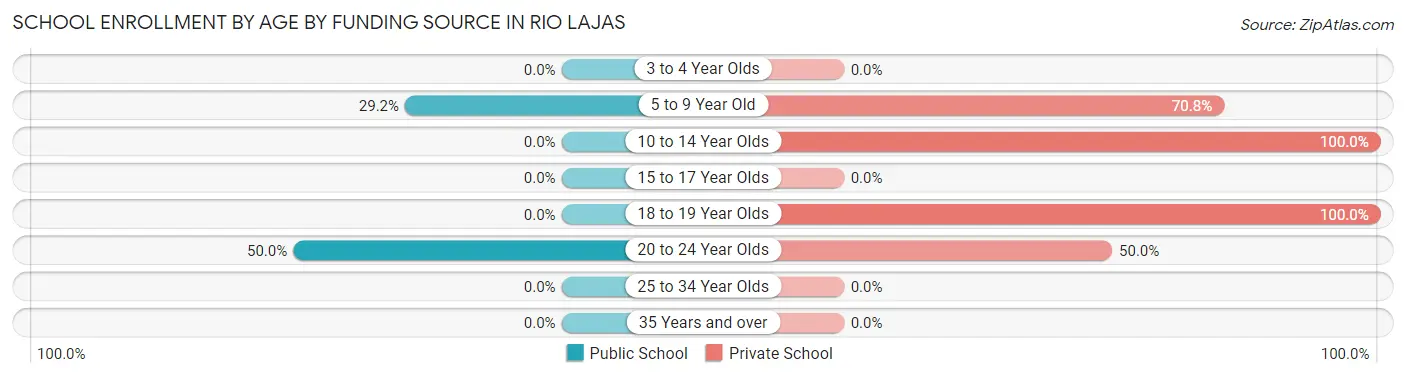
| Age Bracket | Public School | Private School |
| 3 to 4 Year Olds | 0 (0.0%) | 0 (0.0%) |
| 5 to 9 Year Old | 21 (29.2%) | 51 (70.8%) |
| 10 to 14 Year Olds | 0 (0.0%) | 38 (100.0%) |
| 15 to 17 Year Olds | 0 (0.0%) | 0 (0.0%) |
| 18 to 19 Year Olds | 0 (0.0%) | 49 (100.0%) |
| 20 to 24 Year Olds | 53 (50.0%) | 53 (50.0%) |
| 25 to 34 Year Olds | 0 (0.0%) | 0 (0.0%) |
| 35 Years and over | 0 (0.0%) | 0 (0.0%) |
| Total | 74 (27.9%) | 191 (72.1%) |
Educational Attainment by Field of Study in Rio Lajas
Business (120 | 67.0%), science & technology (32 | 17.9%), and engineering (27 | 15.1%) are the most common fields of study among 179 individuals in Rio Lajas who have obtained a bachelor's degree or higher.
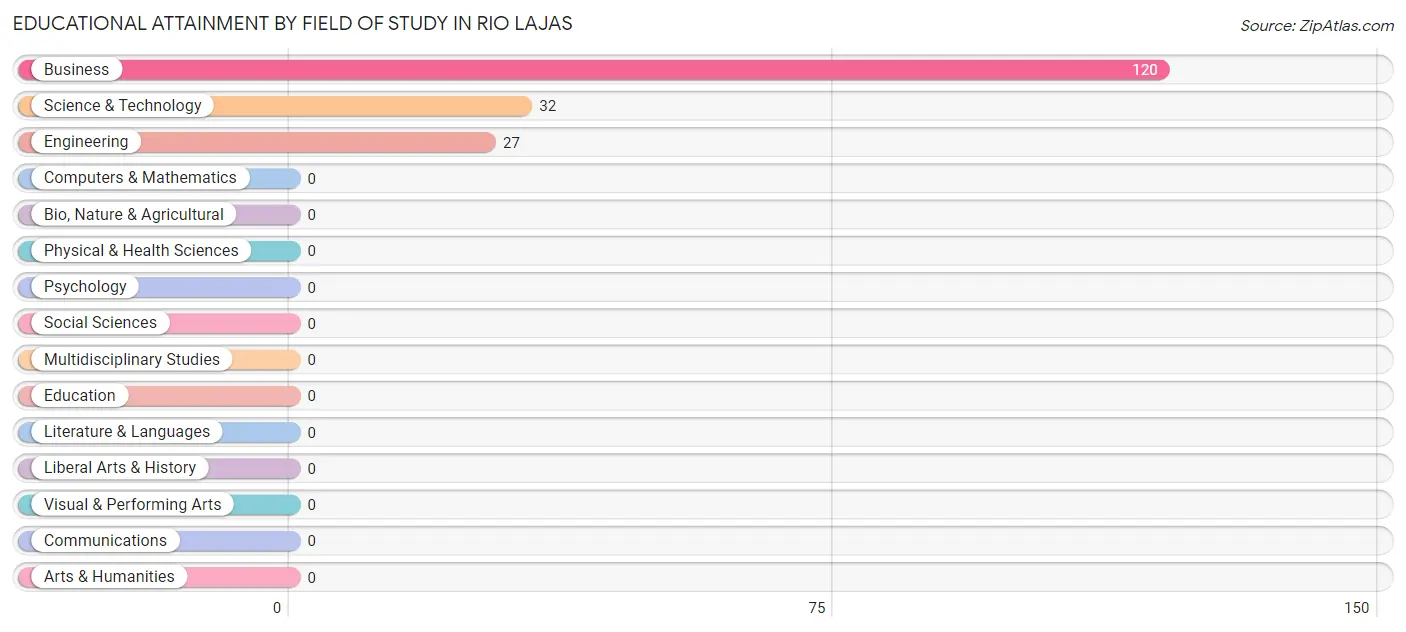
| Field of Study | # Graduates | % Graduates |
| Computers & Mathematics | 0 | 0.0% |
| Bio, Nature & Agricultural | 0 | 0.0% |
| Physical & Health Sciences | 0 | 0.0% |
| Psychology | 0 | 0.0% |
| Social Sciences | 0 | 0.0% |
| Engineering | 27 | 15.1% |
| Multidisciplinary Studies | 0 | 0.0% |
| Science & Technology | 32 | 17.9% |
| Business | 120 | 67.0% |
| Education | 0 | 0.0% |
| Literature & Languages | 0 | 0.0% |
| Liberal Arts & History | 0 | 0.0% |
| Visual & Performing Arts | 0 | 0.0% |
| Communications | 0 | 0.0% |
| Arts & Humanities | 0 | 0.0% |
| Total | 179 | 100.0% |
Transportation & Commute in Rio Lajas
Vehicle Availability by Sex in Rio Lajas
The most prevalent vehicle ownership categories in Rio Lajas are males with 2 vehicles (191, accounting for 66.1%) and females with 2 vehicles (30, making up 70.0%).
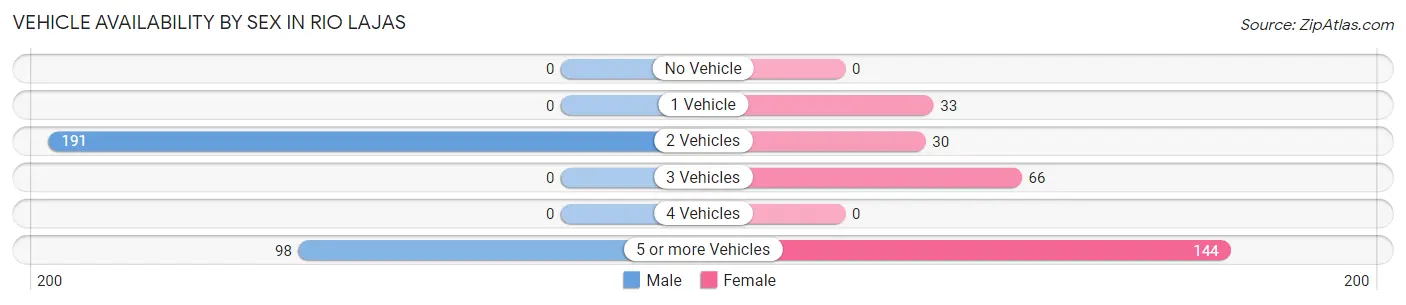
| Vehicles Available | Male | Female |
| No Vehicle | 0 (0.0%) | 0 (0.0%) |
| 1 Vehicle | 0 (0.0%) | 33 (12.1%) |
| 2 Vehicles | 191 (66.1%) | 30 (11.0%) |
| 3 Vehicles | 0 (0.0%) | 66 (24.2%) |
| 4 Vehicles | 0 (0.0%) | 0 (0.0%) |
| 5 or more Vehicles | 98 (33.9%) | 144 (52.7%) |
| Total | 289 (100.0%) | 273 (100.0%) |
Commute Time in Rio Lajas
The most frequently occuring commute durations in Rio Lajas are 30 to 34 minutes (198 commuters, 35.2%), 15 to 19 minutes (108 commuters, 19.2%), and 40 to 44 minutes (101 commuters, 18.0%).
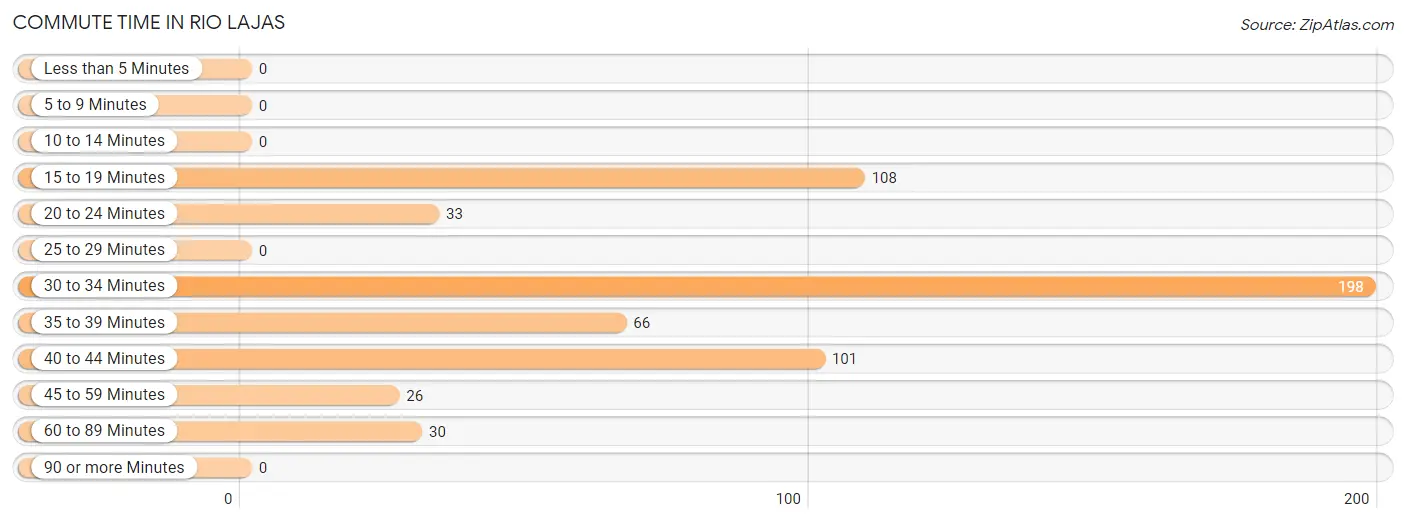
| Commute Time | # Commuters | % Commuters |
| Less than 5 Minutes | 0 | 0.0% |
| 5 to 9 Minutes | 0 | 0.0% |
| 10 to 14 Minutes | 0 | 0.0% |
| 15 to 19 Minutes | 108 | 19.2% |
| 20 to 24 Minutes | 33 | 5.9% |
| 25 to 29 Minutes | 0 | 0.0% |
| 30 to 34 Minutes | 198 | 35.2% |
| 35 to 39 Minutes | 66 | 11.7% |
| 40 to 44 Minutes | 101 | 18.0% |
| 45 to 59 Minutes | 26 | 4.6% |
| 60 to 89 Minutes | 30 | 5.3% |
| 90 or more Minutes | 0 | 0.0% |
Commute Time by Sex in Rio Lajas
The most common commute times in Rio Lajas are 30 to 34 minutes (155 commuters, 53.6%) for males and 40 to 44 minutes (101 commuters, 37.0%) for females.
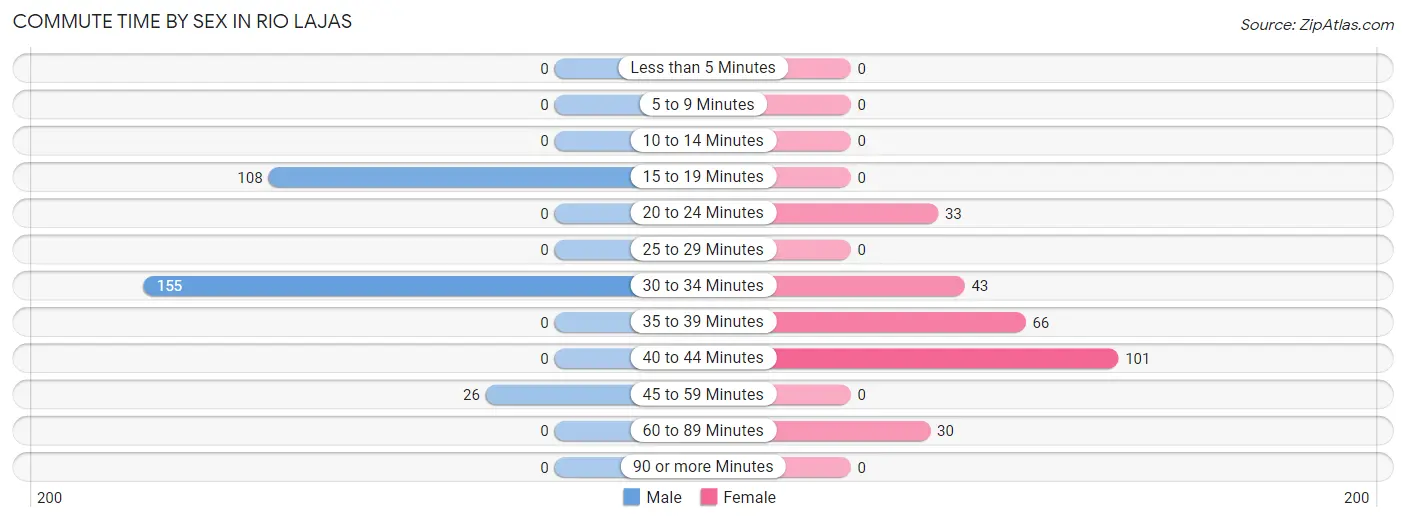
| Commute Time | Male | Female |
| Less than 5 Minutes | 0 (0.0%) | 0 (0.0%) |
| 5 to 9 Minutes | 0 (0.0%) | 0 (0.0%) |
| 10 to 14 Minutes | 0 (0.0%) | 0 (0.0%) |
| 15 to 19 Minutes | 108 (37.4%) | 0 (0.0%) |
| 20 to 24 Minutes | 0 (0.0%) | 33 (12.1%) |
| 25 to 29 Minutes | 0 (0.0%) | 0 (0.0%) |
| 30 to 34 Minutes | 155 (53.6%) | 43 (15.8%) |
| 35 to 39 Minutes | 0 (0.0%) | 66 (24.2%) |
| 40 to 44 Minutes | 0 (0.0%) | 101 (37.0%) |
| 45 to 59 Minutes | 26 (9.0%) | 0 (0.0%) |
| 60 to 89 Minutes | 0 (0.0%) | 30 (11.0%) |
| 90 or more Minutes | 0 (0.0%) | 0 (0.0%) |
Time of Departure to Work by Sex in Rio Lajas
The most frequent times of departure to work in Rio Lajas are 7:00 AM to 7:29 AM (122, 42.2%) for males and 7:00 AM to 7:29 AM (167, 61.2%) for females.
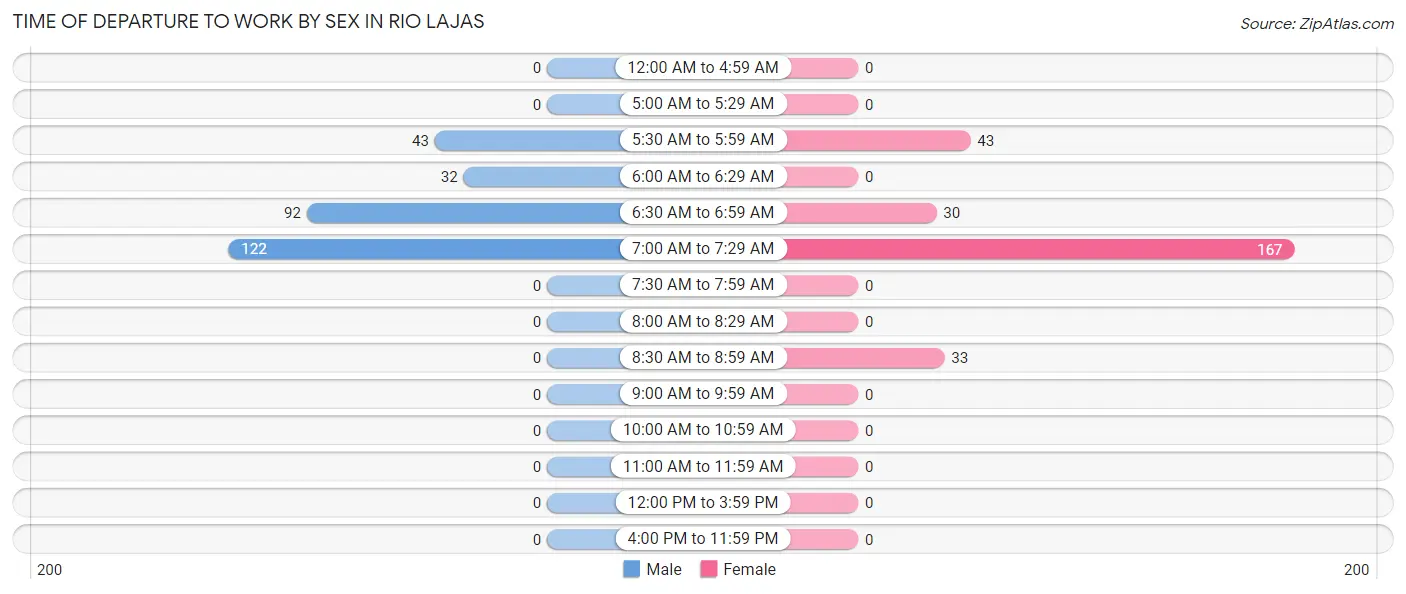
| Time of Departure | Male | Female |
| 12:00 AM to 4:59 AM | 0 (0.0%) | 0 (0.0%) |
| 5:00 AM to 5:29 AM | 0 (0.0%) | 0 (0.0%) |
| 5:30 AM to 5:59 AM | 43 (14.9%) | 43 (15.8%) |
| 6:00 AM to 6:29 AM | 32 (11.1%) | 0 (0.0%) |
| 6:30 AM to 6:59 AM | 92 (31.8%) | 30 (11.0%) |
| 7:00 AM to 7:29 AM | 122 (42.2%) | 167 (61.2%) |
| 7:30 AM to 7:59 AM | 0 (0.0%) | 0 (0.0%) |
| 8:00 AM to 8:29 AM | 0 (0.0%) | 0 (0.0%) |
| 8:30 AM to 8:59 AM | 0 (0.0%) | 33 (12.1%) |
| 9:00 AM to 9:59 AM | 0 (0.0%) | 0 (0.0%) |
| 10:00 AM to 10:59 AM | 0 (0.0%) | 0 (0.0%) |
| 11:00 AM to 11:59 AM | 0 (0.0%) | 0 (0.0%) |
| 12:00 PM to 3:59 PM | 0 (0.0%) | 0 (0.0%) |
| 4:00 PM to 11:59 PM | 0 (0.0%) | 0 (0.0%) |
| Total | 289 (100.0%) | 273 (100.0%) |
Housing Occupancy in Rio Lajas
Occupancy by Ownership in Rio Lajas
Of the total 523 dwellings in Rio Lajas, owner-occupied units account for 466 (89.1%), while renter-occupied units make up 57 (10.9%).
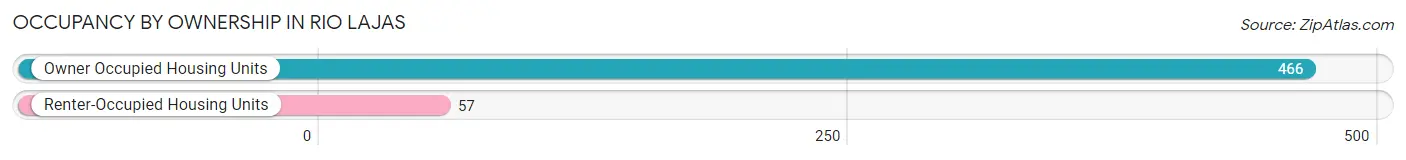
| Occupancy | # Housing Units | % Housing Units |
| Owner Occupied Housing Units | 466 | 89.1% |
| Renter-Occupied Housing Units | 57 | 10.9% |
| Total Occupied Housing Units | 523 | 100.0% |
Occupancy by Household Size in Rio Lajas
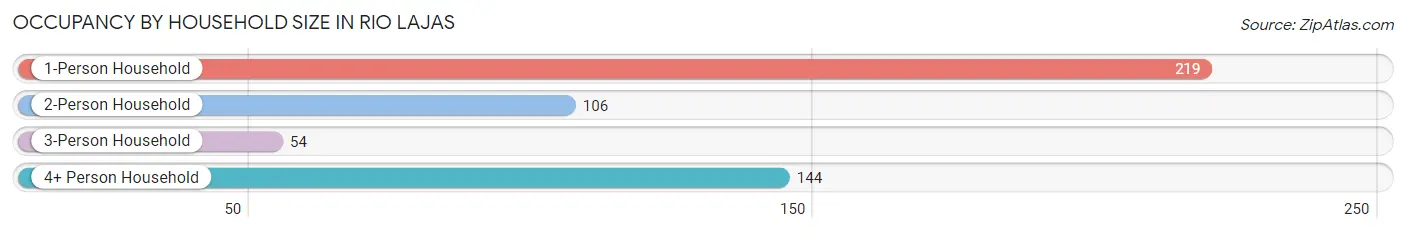
| Household Size | # Housing Units | % Housing Units |
| 1-Person Household | 219 | 41.9% |
| 2-Person Household | 106 | 20.3% |
| 3-Person Household | 54 | 10.3% |
| 4+ Person Household | 144 | 27.5% |
| Total Housing Units | 523 | 100.0% |
Occupancy by Ownership by Household Size in Rio Lajas
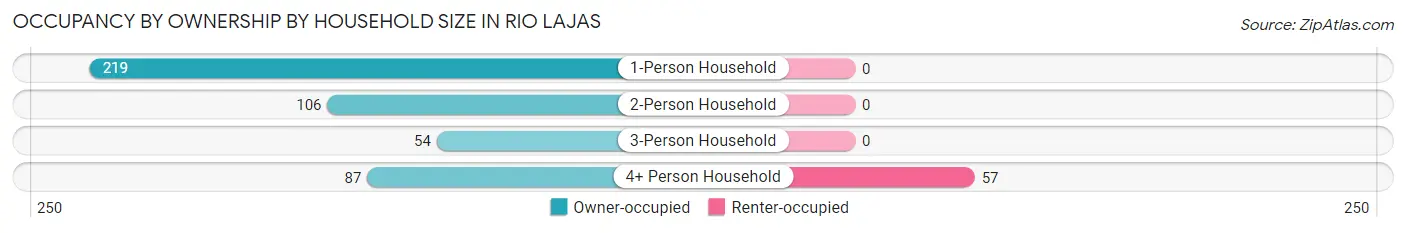
| Household Size | Owner-occupied | Renter-occupied |
| 1-Person Household | 219 (100.0%) | 0 (0.0%) |
| 2-Person Household | 106 (100.0%) | 0 (0.0%) |
| 3-Person Household | 54 (100.0%) | 0 (0.0%) |
| 4+ Person Household | 87 (60.4%) | 57 (39.6%) |
| Total Housing Units | 466 (89.1%) | 57 (10.9%) |
Occupancy by Educational Attainment in Rio Lajas
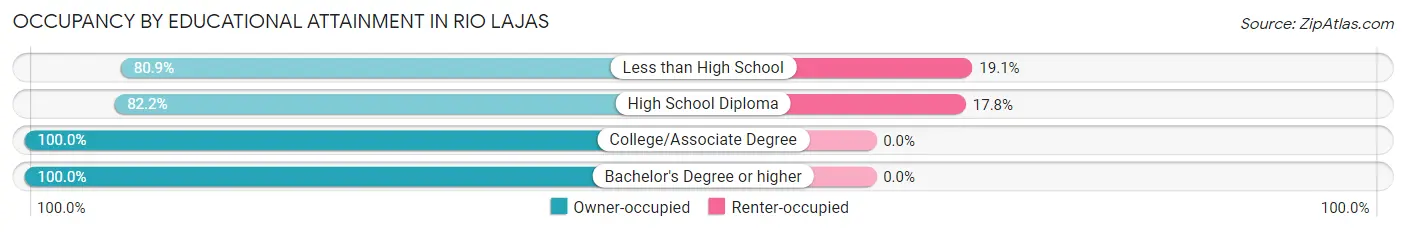
| Household Size | Owner-occupied | Renter-occupied |
| Less than High School | 140 (80.9%) | 33 (19.1%) |
| High School Diploma | 111 (82.2%) | 24 (17.8%) |
| College/Associate Degree | 110 (100.0%) | 0 (0.0%) |
| Bachelor's Degree or higher | 105 (100.0%) | 0 (0.0%) |
Occupancy by Age of Householder in Rio Lajas
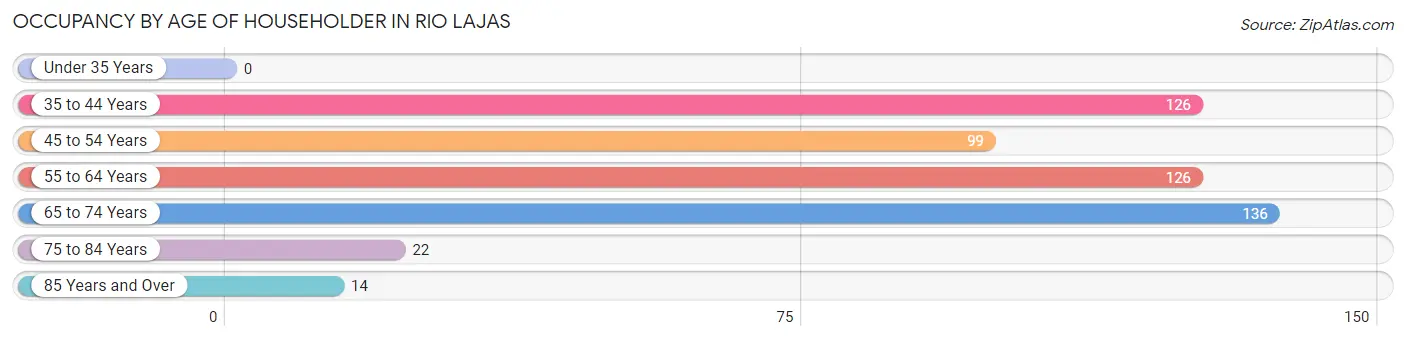
| Age Bracket | # Households | % Households |
| Under 35 Years | 0 | 0.0% |
| 35 to 44 Years | 126 | 24.1% |
| 45 to 54 Years | 99 | 18.9% |
| 55 to 64 Years | 126 | 24.1% |
| 65 to 74 Years | 136 | 26.0% |
| 75 to 84 Years | 22 | 4.2% |
| 85 Years and Over | 14 | 2.7% |
| Total | 523 | 100.0% |
Housing Finances in Rio Lajas
Median Income by Occupancy in Rio Lajas
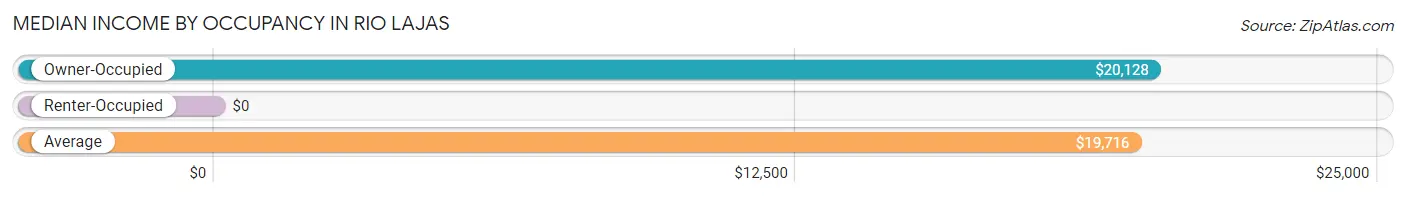
| Occupancy Type | # Households | Median Income |
| Owner-Occupied | 466 (89.1%) | $20,128 |
| Renter-Occupied | 57 (10.9%) | $0 |
| Average | 523 (100.0%) | $19,716 |
Occupancy by Householder Income Bracket in Rio Lajas
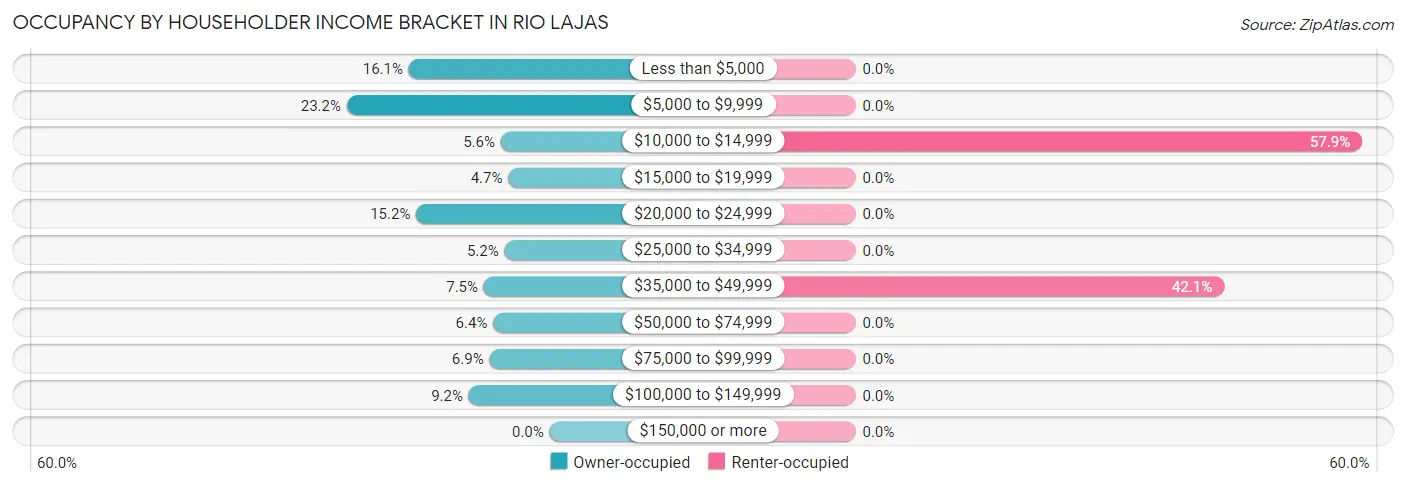
| Income Bracket | Owner-occupied | Renter-occupied |
| Less than $5,000 | 75 (16.1%) | 0 (0.0%) |
| $5,000 to $9,999 | 108 (23.2%) | 0 (0.0%) |
| $10,000 to $14,999 | 26 (5.6%) | 33 (57.9%) |
| $15,000 to $19,999 | 22 (4.7%) | 0 (0.0%) |
| $20,000 to $24,999 | 71 (15.2%) | 0 (0.0%) |
| $25,000 to $34,999 | 24 (5.1%) | 0 (0.0%) |
| $35,000 to $49,999 | 35 (7.5%) | 24 (42.1%) |
| $50,000 to $74,999 | 30 (6.4%) | 0 (0.0%) |
| $75,000 to $99,999 | 32 (6.9%) | 0 (0.0%) |
| $100,000 to $149,999 | 43 (9.2%) | 0 (0.0%) |
| $150,000 or more | 0 (0.0%) | 0 (0.0%) |
| Total | 466 (100.0%) | 57 (100.0%) |
Monthly Housing Cost Tiers in Rio Lajas
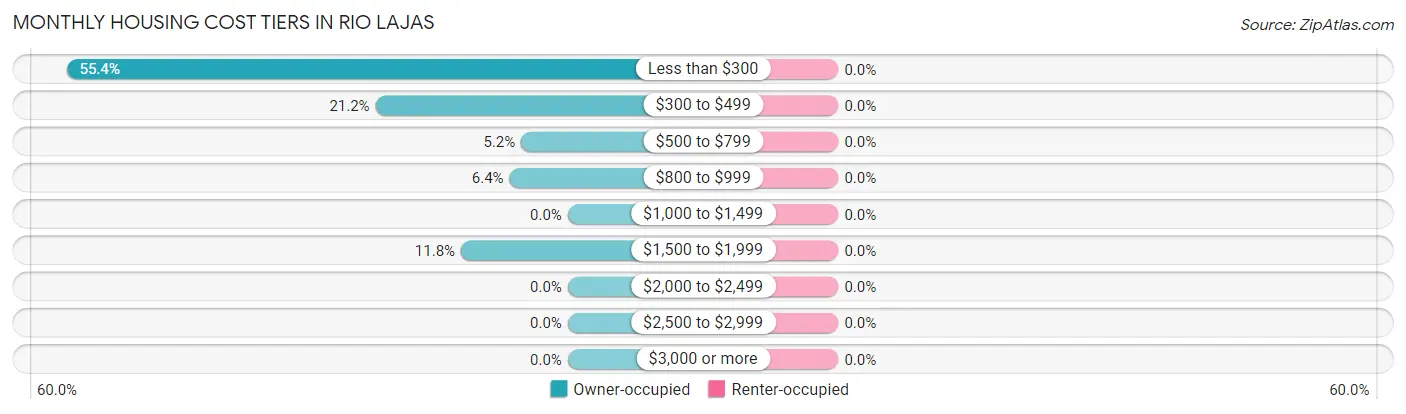
| Monthly Cost | Owner-occupied | Renter-occupied |
| Less than $300 | 258 (55.4%) | 0 (0.0%) |
| $300 to $499 | 99 (21.2%) | 0 (0.0%) |
| $500 to $799 | 24 (5.1%) | 0 (0.0%) |
| $800 to $999 | 30 (6.4%) | 0 (0.0%) |
| $1,000 to $1,499 | 0 (0.0%) | 0 (0.0%) |
| $1,500 to $1,999 | 55 (11.8%) | 0 (0.0%) |
| $2,000 to $2,499 | 0 (0.0%) | 0 (0.0%) |
| $2,500 to $2,999 | 0 (0.0%) | 0 (0.0%) |
| $3,000 or more | 0 (0.0%) | 0 (0.0%) |
| Total | 466 (100.0%) | 57 (100.0%) |
Physical Housing Characteristics in Rio Lajas
Housing Structures in Rio Lajas
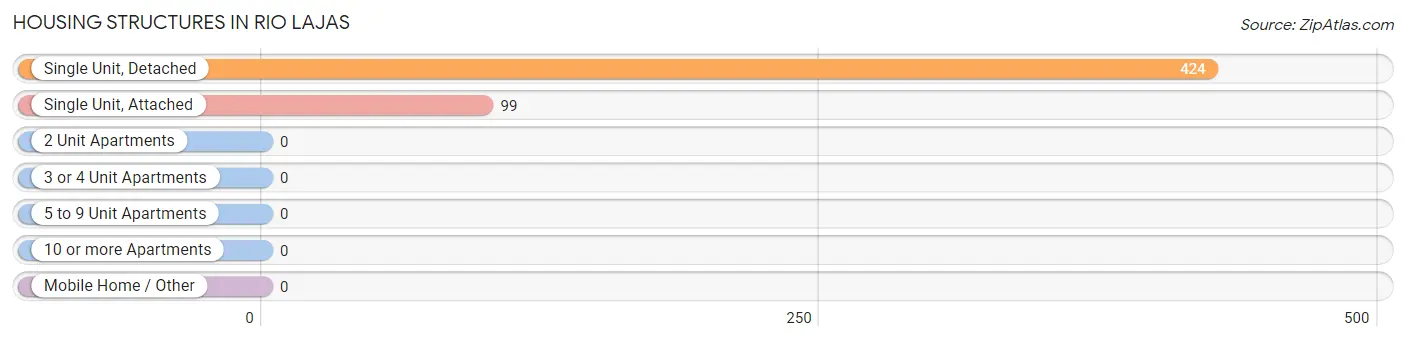
| Structure Type | # Housing Units | % Housing Units |
| Single Unit, Detached | 424 | 81.1% |
| Single Unit, Attached | 99 | 18.9% |
| 2 Unit Apartments | 0 | 0.0% |
| 3 or 4 Unit Apartments | 0 | 0.0% |
| 5 to 9 Unit Apartments | 0 | 0.0% |
| 10 or more Apartments | 0 | 0.0% |
| Mobile Home / Other | 0 | 0.0% |
| Total | 523 | 100.0% |
Housing Structures by Occupancy in Rio Lajas
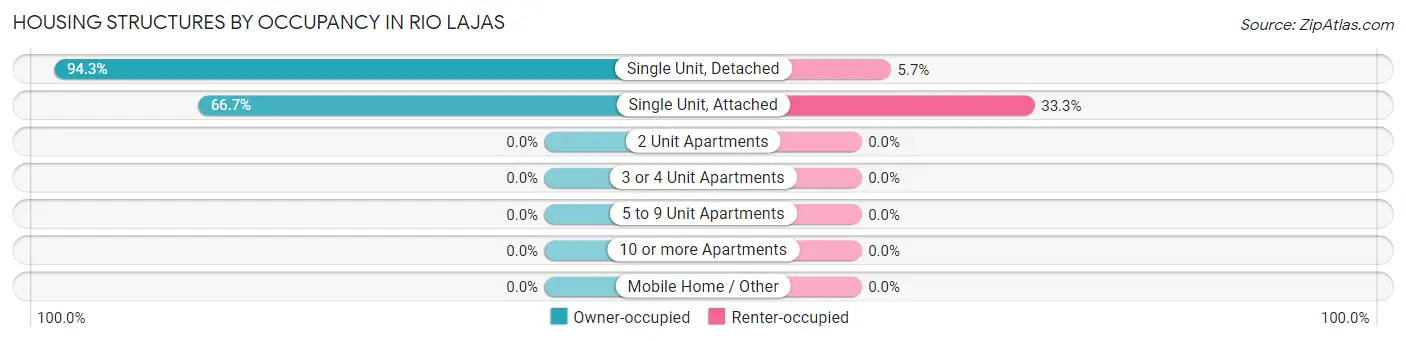
| Structure Type | Owner-occupied | Renter-occupied |
| Single Unit, Detached | 400 (94.3%) | 24 (5.7%) |
| Single Unit, Attached | 66 (66.7%) | 33 (33.3%) |
| 2 Unit Apartments | 0 (0.0%) | 0 (0.0%) |
| 3 or 4 Unit Apartments | 0 (0.0%) | 0 (0.0%) |
| 5 to 9 Unit Apartments | 0 (0.0%) | 0 (0.0%) |
| 10 or more Apartments | 0 (0.0%) | 0 (0.0%) |
| Mobile Home / Other | 0 (0.0%) | 0 (0.0%) |
| Total | 466 (89.1%) | 57 (10.9%) |
Housing Structures by Number of Rooms in Rio Lajas
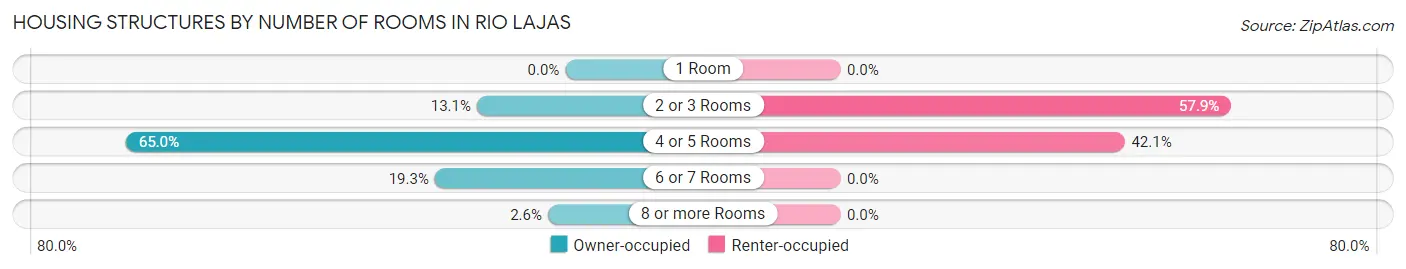
| Number of Rooms | Owner-occupied | Renter-occupied |
| 1 Room | 0 (0.0%) | 0 (0.0%) |
| 2 or 3 Rooms | 61 (13.1%) | 33 (57.9%) |
| 4 or 5 Rooms | 303 (65.0%) | 24 (42.1%) |
| 6 or 7 Rooms | 90 (19.3%) | 0 (0.0%) |
| 8 or more Rooms | 12 (2.6%) | 0 (0.0%) |
| Total | 466 (100.0%) | 57 (100.0%) |
Housing Structure by Heating Type in Rio Lajas
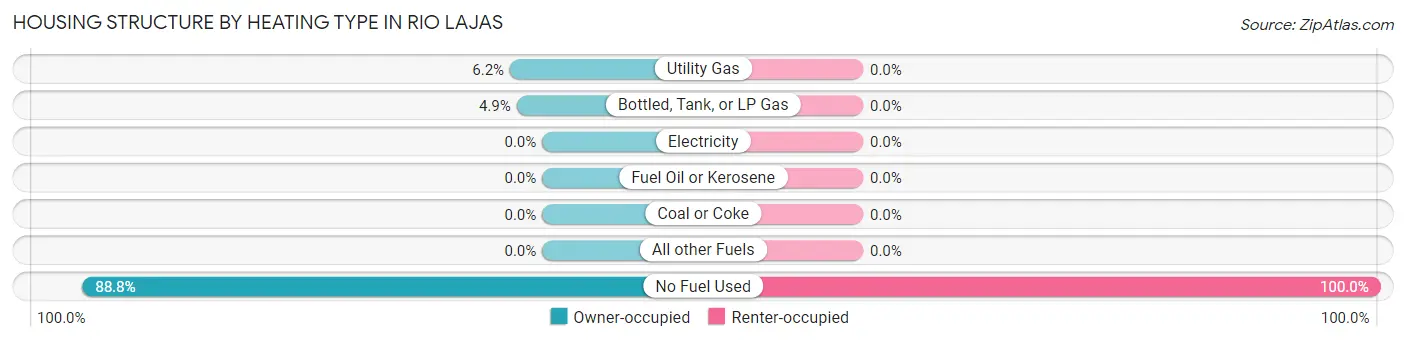
| Heating Type | Owner-occupied | Renter-occupied |
| Utility Gas | 29 (6.2%) | 0 (0.0%) |
| Bottled, Tank, or LP Gas | 23 (4.9%) | 0 (0.0%) |
| Electricity | 0 (0.0%) | 0 (0.0%) |
| Fuel Oil or Kerosene | 0 (0.0%) | 0 (0.0%) |
| Coal or Coke | 0 (0.0%) | 0 (0.0%) |
| All other Fuels | 0 (0.0%) | 0 (0.0%) |
| No Fuel Used | 414 (88.8%) | 57 (100.0%) |
| Total | 466 (100.0%) | 57 (100.0%) |
Household Vehicle Usage in Rio Lajas
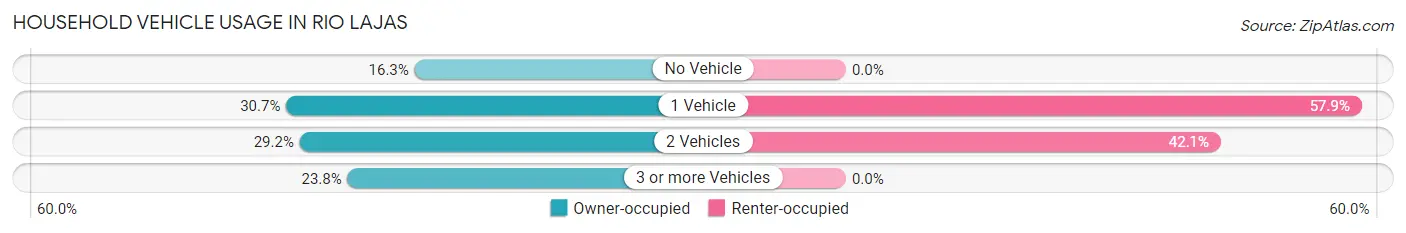
| Vehicles per Household | Owner-occupied | Renter-occupied |
| No Vehicle | 76 (16.3%) | 0 (0.0%) |
| 1 Vehicle | 143 (30.7%) | 33 (57.9%) |
| 2 Vehicles | 136 (29.2%) | 24 (42.1%) |
| 3 or more Vehicles | 111 (23.8%) | 0 (0.0%) |
| Total | 466 (100.0%) | 57 (100.0%) |
Real Estate & Mortgages in Rio Lajas
Real Estate and Mortgage Overview in Rio Lajas
| Characteristic | Without Mortgage | With Mortgage |
| Housing Units | 322 | 144 |
| Median Property Value | $77,400 | $160,800 |
| Median Household Income | $9,653 | $0 |
| Monthly Housing Costs | $218 | $0 |
| Real Estate Taxes | - | - |
Property Value by Mortgage Status in Rio Lajas
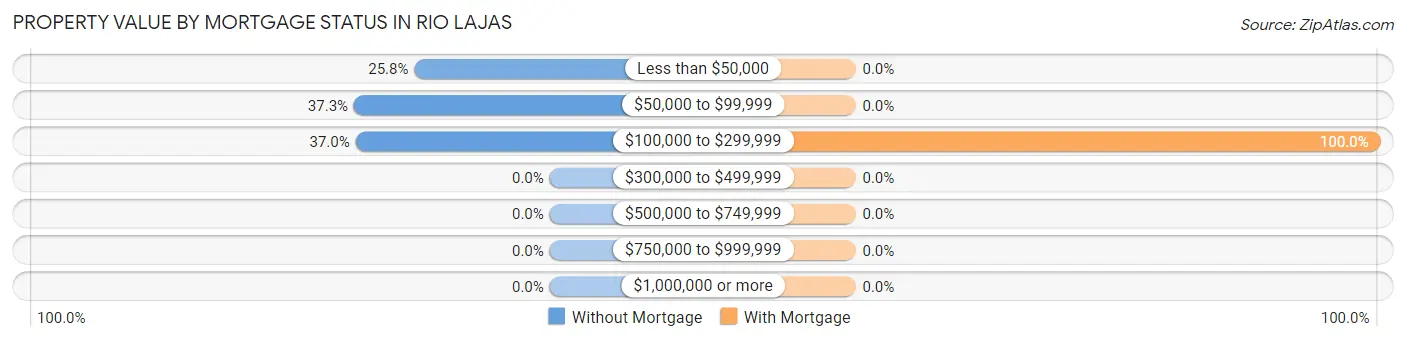
| Property Value | Without Mortgage | With Mortgage |
| Less than $50,000 | 83 (25.8%) | 0 (0.0%) |
| $50,000 to $99,999 | 120 (37.3%) | 0 (0.0%) |
| $100,000 to $299,999 | 119 (37.0%) | 144 (100.0%) |
| $300,000 to $499,999 | 0 (0.0%) | 0 (0.0%) |
| $500,000 to $749,999 | 0 (0.0%) | 0 (0.0%) |
| $750,000 to $999,999 | 0 (0.0%) | 0 (0.0%) |
| $1,000,000 or more | 0 (0.0%) | 0 (0.0%) |
| Total | 322 (100.0%) | 144 (100.0%) |
Household Income by Mortgage Status in Rio Lajas
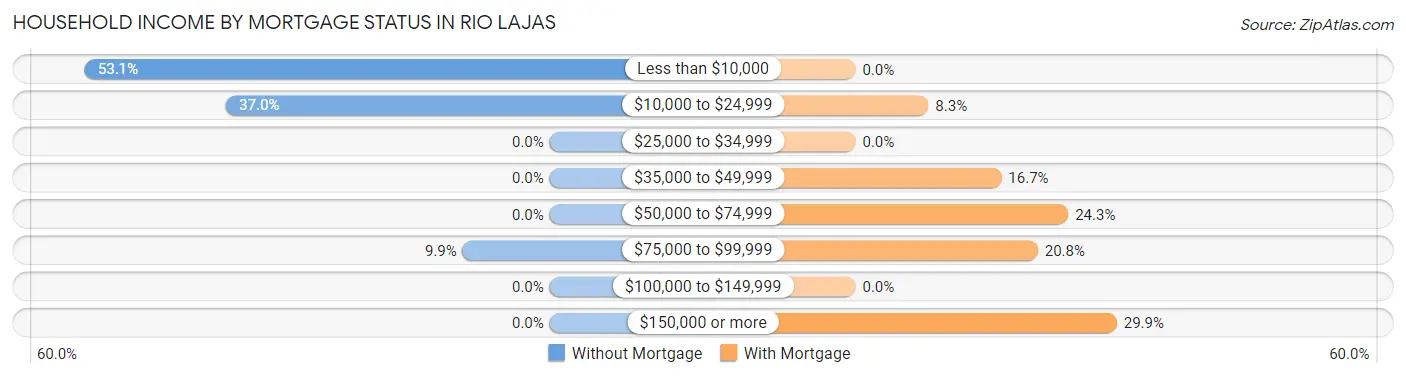
| Household Income | Without Mortgage | With Mortgage |
| Less than $10,000 | 171 (53.1%) | 0 (0.0%) |
| $10,000 to $24,999 | 119 (37.0%) | 12 (8.3%) |
| $25,000 to $34,999 | 0 (0.0%) | 0 (0.0%) |
| $35,000 to $49,999 | 0 (0.0%) | 24 (16.7%) |
| $50,000 to $74,999 | 0 (0.0%) | 35 (24.3%) |
| $75,000 to $99,999 | 32 (9.9%) | 30 (20.8%) |
| $100,000 to $149,999 | 0 (0.0%) | 0 (0.0%) |
| $150,000 or more | 0 (0.0%) | 43 (29.9%) |
| Total | 322 (100.0%) | 144 (100.0%) |
Property Value to Household Income Ratio in Rio Lajas
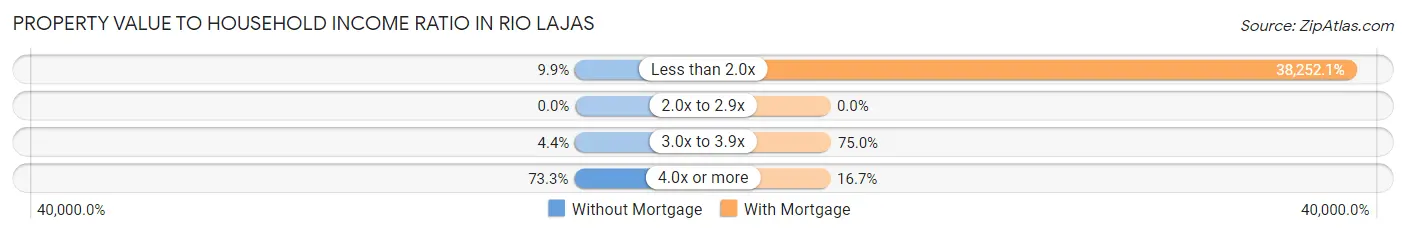
| Value-to-Income Ratio | Without Mortgage | With Mortgage |
| Less than 2.0x | 32 (9.9%) | 55,083 (38,252.1%) |
| 2.0x to 2.9x | 0 (0.0%) | 0 (0.0%) |
| 3.0x to 3.9x | 14 (4.3%) | 108 (75.0%) |
| 4.0x or more | 236 (73.3%) | 24 (16.7%) |
| Total | 322 (100.0%) | 144 (100.0%) |
Real Estate Taxes by Mortgage Status in Rio Lajas
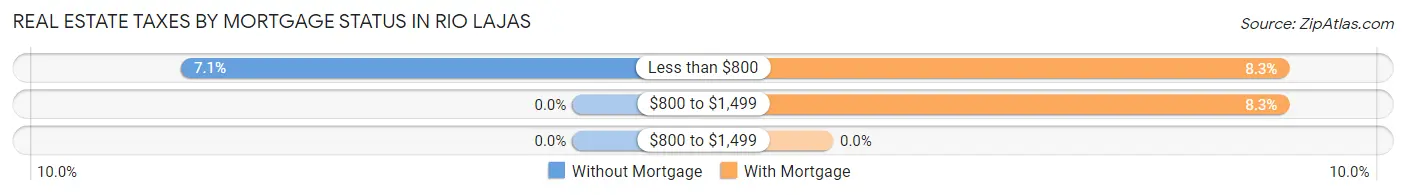
| Property Taxes | Without Mortgage | With Mortgage |
| Less than $800 | 23 (7.1%) | 12 (8.3%) |
| $800 to $1,499 | 0 (0.0%) | 12 (8.3%) |
| $800 to $1,499 | 0 (0.0%) | 0 (0.0%) |
| Total | 322 (100.0%) | 144 (100.0%) |
Health & Disability in Rio Lajas
Health Insurance Coverage by Age in Rio Lajas
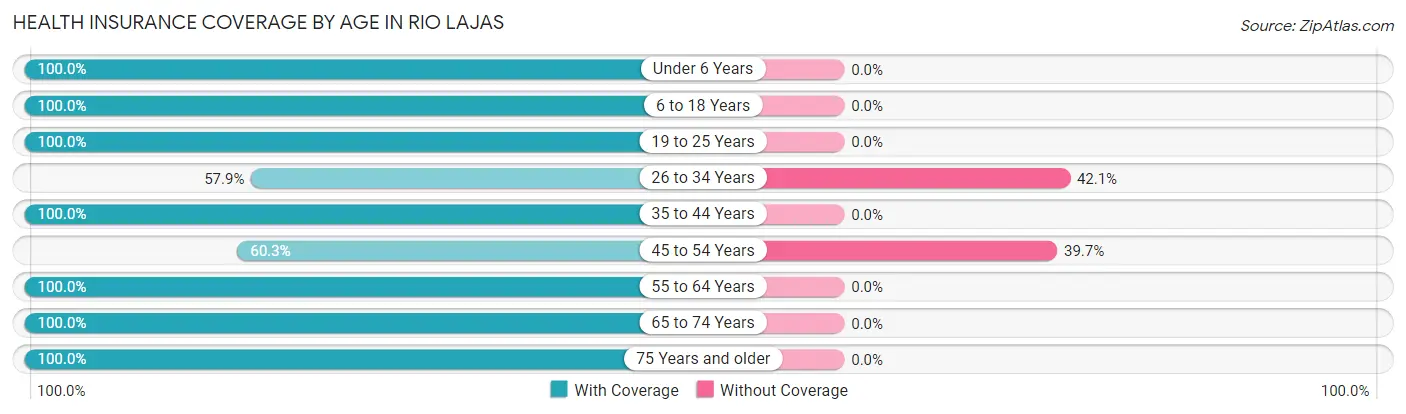
| Age Bracket | With Coverage | Without Coverage |
| Under 6 Years | 241 (100.0%) | 0 (0.0%) |
| 6 to 18 Years | 59 (100.0%) | 0 (0.0%) |
| 19 to 25 Years | 314 (100.0%) | 0 (0.0%) |
| 26 to 34 Years | 139 (57.9%) | 101 (42.1%) |
| 35 to 44 Years | 152 (100.0%) | 0 (0.0%) |
| 45 to 54 Years | 146 (60.3%) | 96 (39.7%) |
| 55 to 64 Years | 304 (100.0%) | 0 (0.0%) |
| 65 to 74 Years | 136 (100.0%) | 0 (0.0%) |
| 75 Years and older | 36 (100.0%) | 0 (0.0%) |
| Total | 1,527 (88.6%) | 197 (11.4%) |
Health Insurance Coverage by Citizenship Status in Rio Lajas
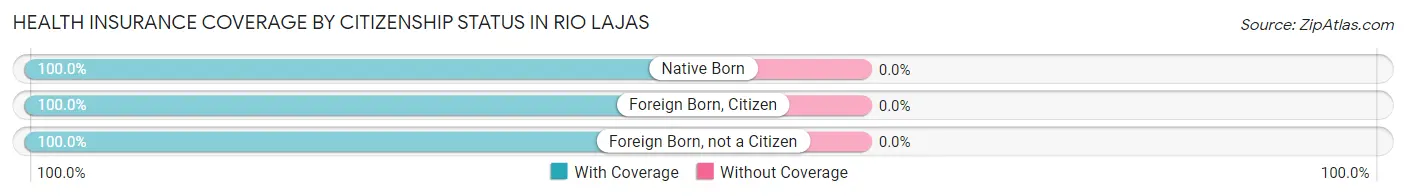
| Citizenship Status | With Coverage | Without Coverage |
| Native Born | 241 (100.0%) | 0 (0.0%) |
| Foreign Born, Citizen | 59 (100.0%) | 0 (0.0%) |
| Foreign Born, not a Citizen | 314 (100.0%) | 0 (0.0%) |
Health Insurance Coverage by Household Income in Rio Lajas
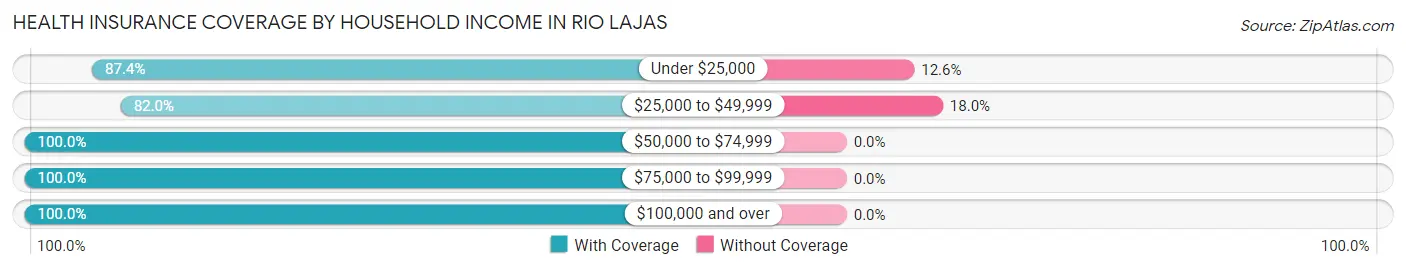
| Household Income | With Coverage | Without Coverage |
| Under $25,000 | 698 (87.4%) | 101 (12.6%) |
| $25,000 to $49,999 | 437 (82.0%) | 96 (18.0%) |
| $50,000 to $74,999 | 94 (100.0%) | 0 (0.0%) |
| $75,000 to $99,999 | 79 (100.0%) | 0 (0.0%) |
| $100,000 and over | 219 (100.0%) | 0 (0.0%) |
Public vs Private Health Insurance Coverage by Age in Rio Lajas
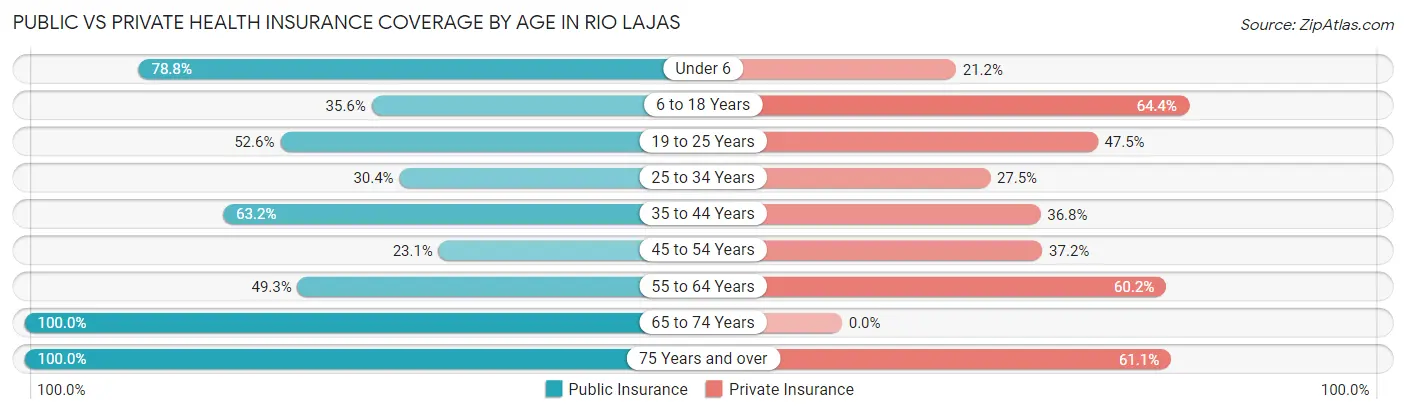
| Age Bracket | Public Insurance | Private Insurance |
| Under 6 | 190 (78.8%) | 51 (21.2%) |
| 6 to 18 Years | 21 (35.6%) | 38 (64.4%) |
| 19 to 25 Years | 165 (52.5%) | 149 (47.4%) |
| 25 to 34 Years | 73 (30.4%) | 66 (27.5%) |
| 35 to 44 Years | 96 (63.2%) | 56 (36.8%) |
| 45 to 54 Years | 56 (23.1%) | 90 (37.2%) |
| 55 to 64 Years | 150 (49.3%) | 183 (60.2%) |
| 65 to 74 Years | 136 (100.0%) | 0 (0.0%) |
| 75 Years and over | 36 (100.0%) | 22 (61.1%) |
| Total | 923 (53.5%) | 655 (38.0%) |
Disability Status by Sex by Age in Rio Lajas
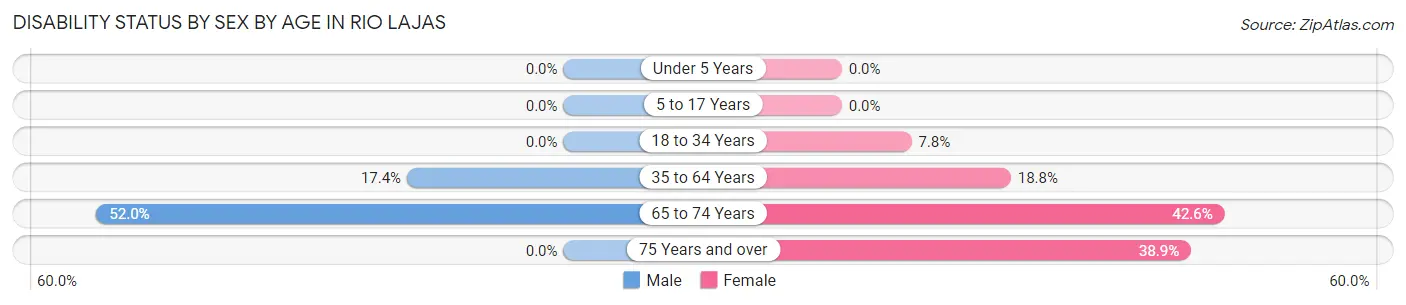
| Age Bracket | Male | Female |
| Under 5 Years | 0 (0.0%) | 0 (0.0%) |
| 5 to 17 Years | 0 (0.0%) | 0 (0.0%) |
| 18 to 34 Years | 0 (0.0%) | 33 (7.8%) |
| 35 to 64 Years | 92 (17.4%) | 32 (18.8%) |
| 65 to 74 Years | 39 (52.0%) | 26 (42.6%) |
| 75 Years and over | 0 (0.0%) | 14 (38.9%) |
Disability Class by Sex by Age in Rio Lajas
Disability Class: Hearing Difficulty
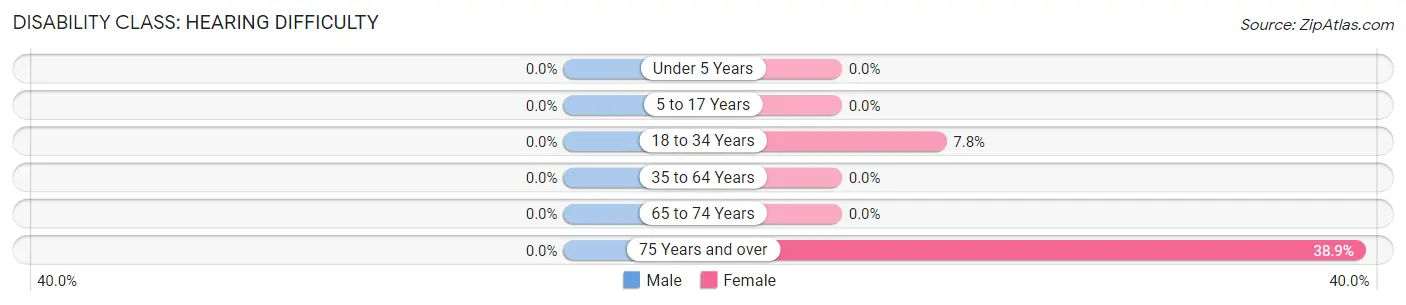
| Age Bracket | Male | Female |
| Under 5 Years | 0 (0.0%) | 0 (0.0%) |
| 5 to 17 Years | 0 (0.0%) | 0 (0.0%) |
| 18 to 34 Years | 0 (0.0%) | 33 (7.8%) |
| 35 to 64 Years | 0 (0.0%) | 0 (0.0%) |
| 65 to 74 Years | 0 (0.0%) | 0 (0.0%) |
| 75 Years and over | 0 (0.0%) | 14 (38.9%) |
Disability Class: Vision Difficulty
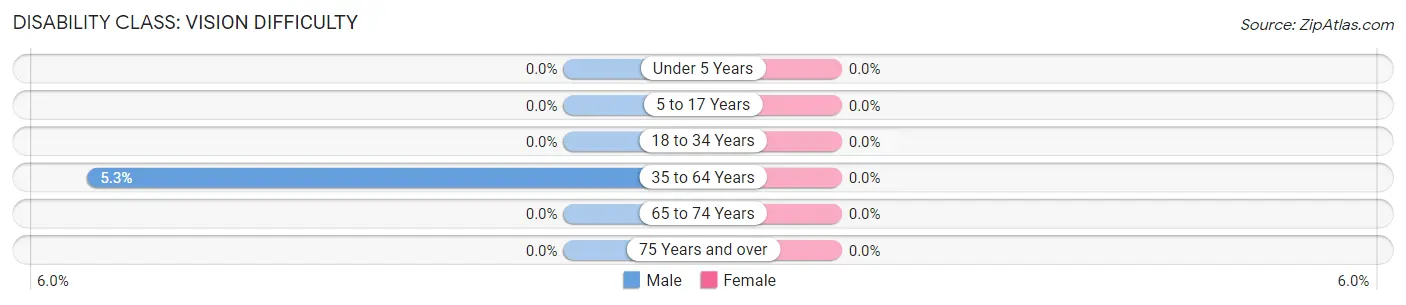
| Age Bracket | Male | Female |
| Under 5 Years | 0 (0.0%) | 0 (0.0%) |
| 5 to 17 Years | 0 (0.0%) | 0 (0.0%) |
| 18 to 34 Years | 0 (0.0%) | 0 (0.0%) |
| 35 to 64 Years | 28 (5.3%) | 0 (0.0%) |
| 65 to 74 Years | 0 (0.0%) | 0 (0.0%) |
| 75 Years and over | 0 (0.0%) | 0 (0.0%) |
Disability Class: Cognitive Difficulty
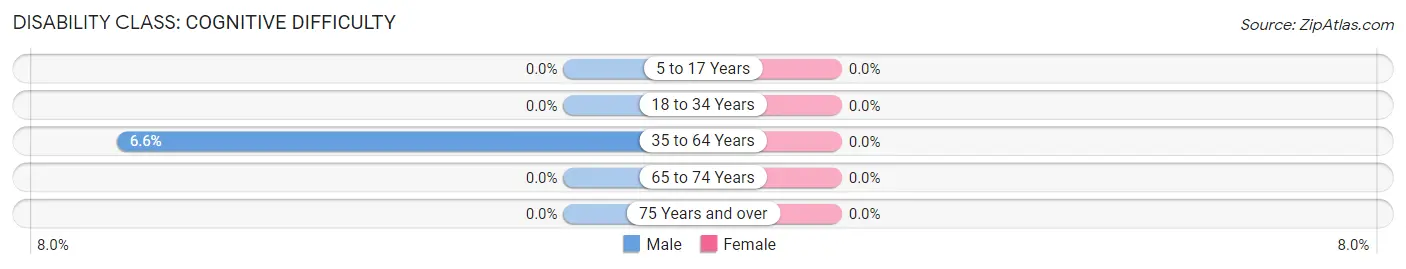
| Age Bracket | Male | Female |
| 5 to 17 Years | 0 (0.0%) | 0 (0.0%) |
| 18 to 34 Years | 0 (0.0%) | 0 (0.0%) |
| 35 to 64 Years | 35 (6.6%) | 0 (0.0%) |
| 65 to 74 Years | 0 (0.0%) | 0 (0.0%) |
| 75 Years and over | 0 (0.0%) | 0 (0.0%) |
Disability Class: Ambulatory Difficulty
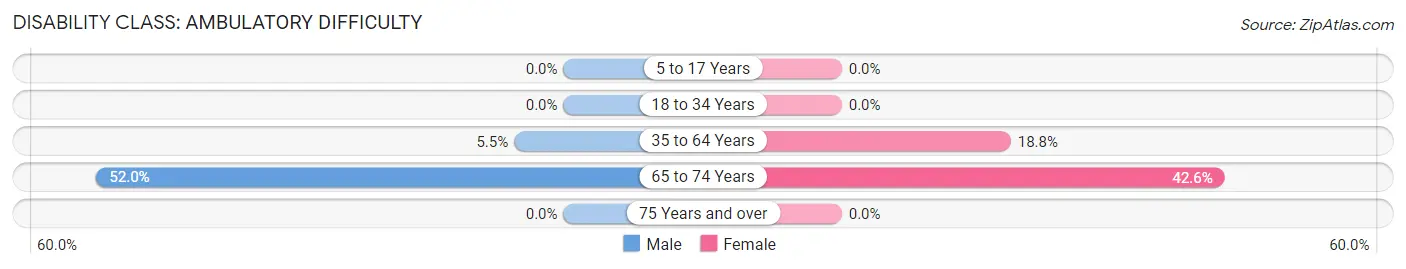
| Age Bracket | Male | Female |
| 5 to 17 Years | 0 (0.0%) | 0 (0.0%) |
| 18 to 34 Years | 0 (0.0%) | 0 (0.0%) |
| 35 to 64 Years | 29 (5.5%) | 32 (18.8%) |
| 65 to 74 Years | 39 (52.0%) | 26 (42.6%) |
| 75 Years and over | 0 (0.0%) | 0 (0.0%) |
Disability Class: Self-Care Difficulty
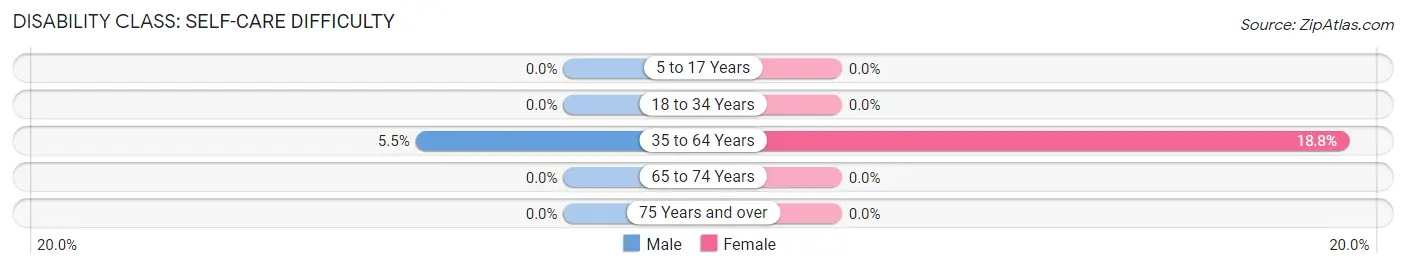
| Age Bracket | Male | Female |
| 5 to 17 Years | 0 (0.0%) | 0 (0.0%) |
| 18 to 34 Years | 0 (0.0%) | 0 (0.0%) |
| 35 to 64 Years | 29 (5.5%) | 32 (18.8%) |
| 65 to 74 Years | 0 (0.0%) | 0 (0.0%) |
| 75 Years and over | 0 (0.0%) | 0 (0.0%) |
Technology Access in Rio Lajas
Computing Device Access in Rio Lajas
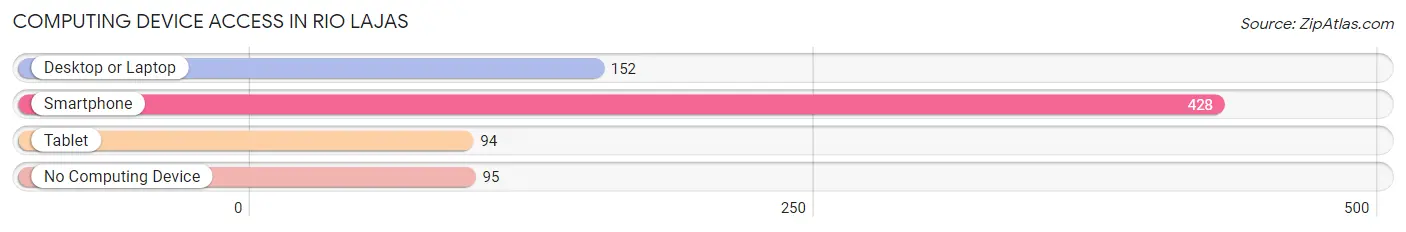
| Device Type | # Households | % Households |
| Desktop or Laptop | 152 | 29.1% |
| Smartphone | 428 | 81.8% |
| Tablet | 94 | 18.0% |
| No Computing Device | 95 | 18.2% |
| Total | 523 | 100.0% |
Internet Access in Rio Lajas
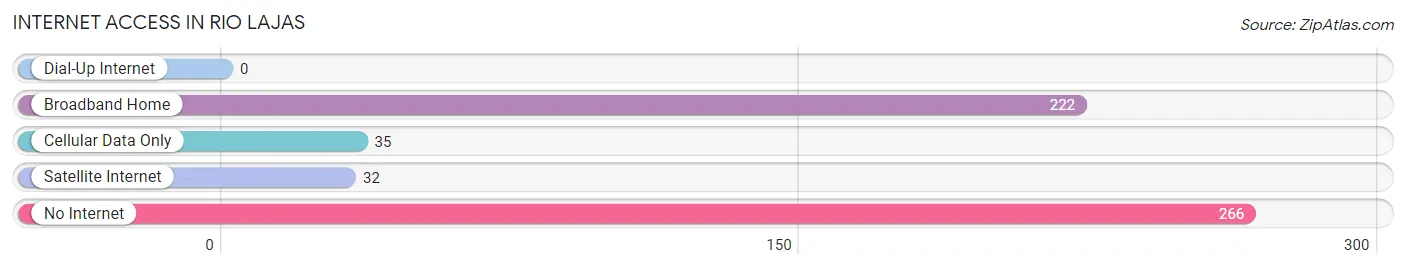
| Internet Type | # Households | % Households |
| Dial-Up Internet | 0 | 0.0% |
| Broadband Home | 222 | 42.4% |
| Cellular Data Only | 35 | 6.7% |
| Satellite Internet | 32 | 6.1% |
| No Internet | 266 | 50.9% |
| Total | 523 | 100.0% |
Rio Lajas Summary
Rio Lajas is a small municipality located in the eastern part of Puerto Rico, in the region of Humacao. It is bordered by the municipalities of Yabucoa, Maunabo, Patillas, and Humacao. The municipality has a total area of 11.9 square miles and a population of 8,845 as of the 2010 census.
History
Rio Lajas was founded in 1815 by Don Juan de la Cruz, who was a Spanish soldier. The name of the town is derived from the Lajas River, which runs through the area. The river was named after the lajas, or flat stones, that were found in the riverbed.
In the early 19th century, the area was used for cattle ranching and farming. The town was officially established in 1815 and was part of the municipality of Humacao until 1831, when it became an independent municipality.
In the late 19th century, the economy of Rio Lajas was based on the production of sugar cane, coffee, and tobacco. The town also had a thriving fishing industry.
Geography
Rio Lajas is located in the eastern part of Puerto Rico, in the region of Humacao. It is bordered by the municipalities of Yabucoa, Maunabo, Patillas, and Humacao. The municipality has a total area of 11.9 square miles and a population of 8,845 as of the 2010 census.
The terrain of Rio Lajas is mostly flat, with some hills in the northern part of the municipality. The highest point is Cerro de la Cruz, which is located in the northern part of the municipality and has an elevation of 1,065 feet.
The climate of Rio Lajas is tropical, with temperatures ranging from the mid-70s to the mid-80s Fahrenheit. The average annual rainfall is around 50 inches.
Economy
The economy of Rio Lajas is largely based on agriculture and tourism. The main agricultural products are sugar cane, coffee, and tobacco. The town also has a thriving fishing industry.
Tourism is an important part of the economy, with many visitors coming to the area to enjoy the beaches, fishing, and other outdoor activities.
Demographics
As of the 2010 census, the population of Rio Lajas was 8,845. The population is mostly of Puerto Rican descent, with a small percentage of African and other ethnicities. The median age is 38.5 years, and the median household income is $19,845.
The majority of the population is Roman Catholic, with a small percentage of other religions. Spanish is the primary language spoken in Rio Lajas.
Conclusion
Rio Lajas is a small municipality located in the eastern part of Puerto Rico, in the region of Humacao. It has a total area of 11.9 square miles and a population of 8,845 as of the 2010 census. The economy of Rio Lajas is largely based on agriculture and tourism, with the main agricultural products being sugar cane, coffee, and tobacco. The population is mostly of Puerto Rican descent, with a small percentage of African and other ethnicities. Spanish is the primary language spoken in Rio Lajas.
Common Questions
What is Per Capita Income in Rio Lajas?
Per Capita income in Rio Lajas is $10,904.
What is the Median Family Income in Rio Lajas?
Median Family Income in Rio Lajas is $32,083.
What is the Median Household income in Rio Lajas?
Median Household Income in Rio Lajas is $19,716.
What is Income or Wage Gap in Rio Lajas?
Income or Wage Gap in Rio Lajas is 12.0%.
Women in Rio Lajas earn 88.0 cents for every dollar earned by a man.
What is Inequality or Gini Index in Rio Lajas?
Inequality or Gini Index in Rio Lajas is 0.54.
What is the Total Population of Rio Lajas?
Total Population of Rio Lajas is 1,724.
What is the Total Male Population of Rio Lajas?
Total Male Population of Rio Lajas is 770.
What is the Total Female Population of Rio Lajas?
Total Female Population of Rio Lajas is 954.
What is the Ratio of Males per 100 Females in Rio Lajas?
There are 80.71 Males per 100 Females in Rio Lajas.
What is the Ratio of Females per 100 Males in Rio Lajas?
There are 123.90 Females per 100 Males in Rio Lajas.
What is the Median Population Age in Rio Lajas?
Median Population Age in Rio Lajas is 38.1 Years.
What is the Average Family Size in Rio Lajas
Average Family Size in Rio Lajas is 5.1 People.
What is the Average Household Size in Rio Lajas
Average Household Size in Rio Lajas is 3.3 People.
How Large is the Labor Force in Rio Lajas?
There are 706 People in the Labor Forcein in Rio Lajas.
What is the Percentage of People in the Labor Force in Rio Lajas?
49.6% of People are in the Labor Force in Rio Lajas.
What is the Unemployment Rate in Rio Lajas?
Unemployment Rate in Rio Lajas is 20.4%.