Orocovis, PR Map & Demographics
Orocovis Map
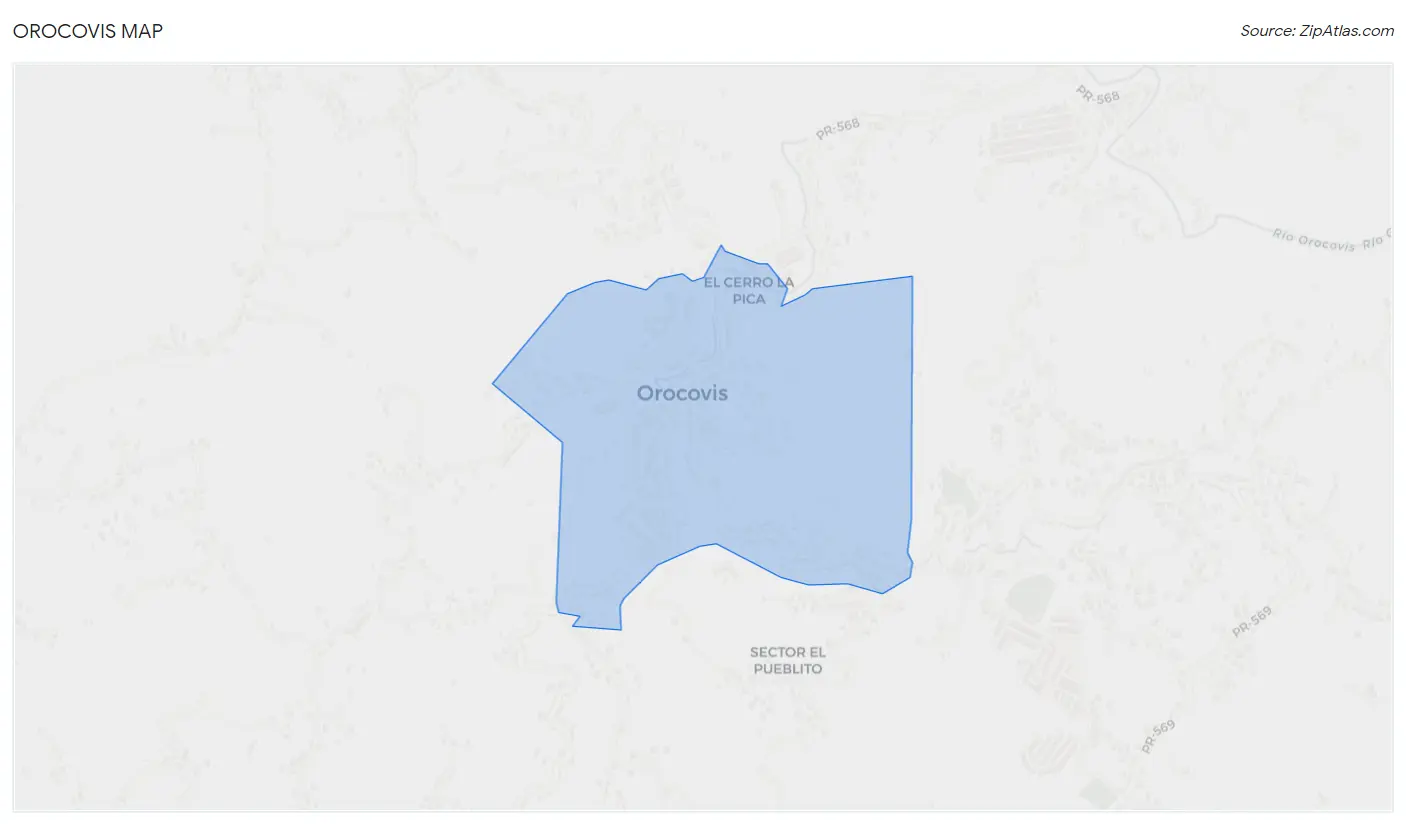
Orocovis Overview
$10,364
PER CAPITA INCOME
$17,107
AVG FAMILY INCOME
$20,045
AVG HOUSEHOLD INCOME
16.4%
WAGE / INCOME GAP [ % ]
83.6¢/ $1
WAGE / INCOME GAP [ $ ]
0.42
INEQUALITY / GINI INDEX
1,264
TOTAL POPULATION
489
MALE POPULATION
775
FEMALE POPULATION
63.10
MALES / 100 FEMALES
158.49
FEMALES / 100 MALES
42.0
MEDIAN AGE
3.7
AVG FAMILY SIZE
2.8
AVG HOUSEHOLD SIZE
431
LABOR FORCE [ PEOPLE ]
40.1%
PERCENT IN LABOR FORCE
6.7%
UNEMPLOYMENT RATE
Orocovis Zip Codes
Income in Orocovis
Income Overview in Orocovis
Per Capita Income in Orocovis is $10,364, while median incomes of families and households are $17,107 and $20,045 respectively.
| Characteristic | Number | Measure |
| Per Capita Income | 1,264 | $10,364 |
| Median Family Income | 261 | $17,107 |
| Mean Family Income | 261 | $26,216 |
| Median Household Income | 443 | $20,045 |
| Mean Household Income | 443 | $24,256 |
| Income Deficit | 261 | $0 |
| Wage / Income Gap (%) | 1,264 | 16.39% |
| Wage / Income Gap ($) | 1,264 | 83.61¢ per $1 |
| Gini / Inequality Index | 1,264 | 0.42 |
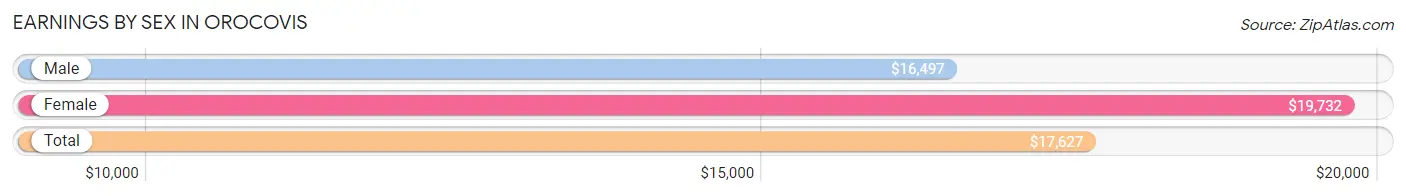
Earnings by Sex in Orocovis
Average Earnings in Orocovis are $17,627, $16,497 for men and $19,732 for women, a difference of 16.4%.
| Sex | Number | Average Earnings |
| Male | 203 (49.0%) | $16,497 |
| Female | 211 (51.0%) | $19,732 |
| Total | 414 (100.0%) | $17,627 |
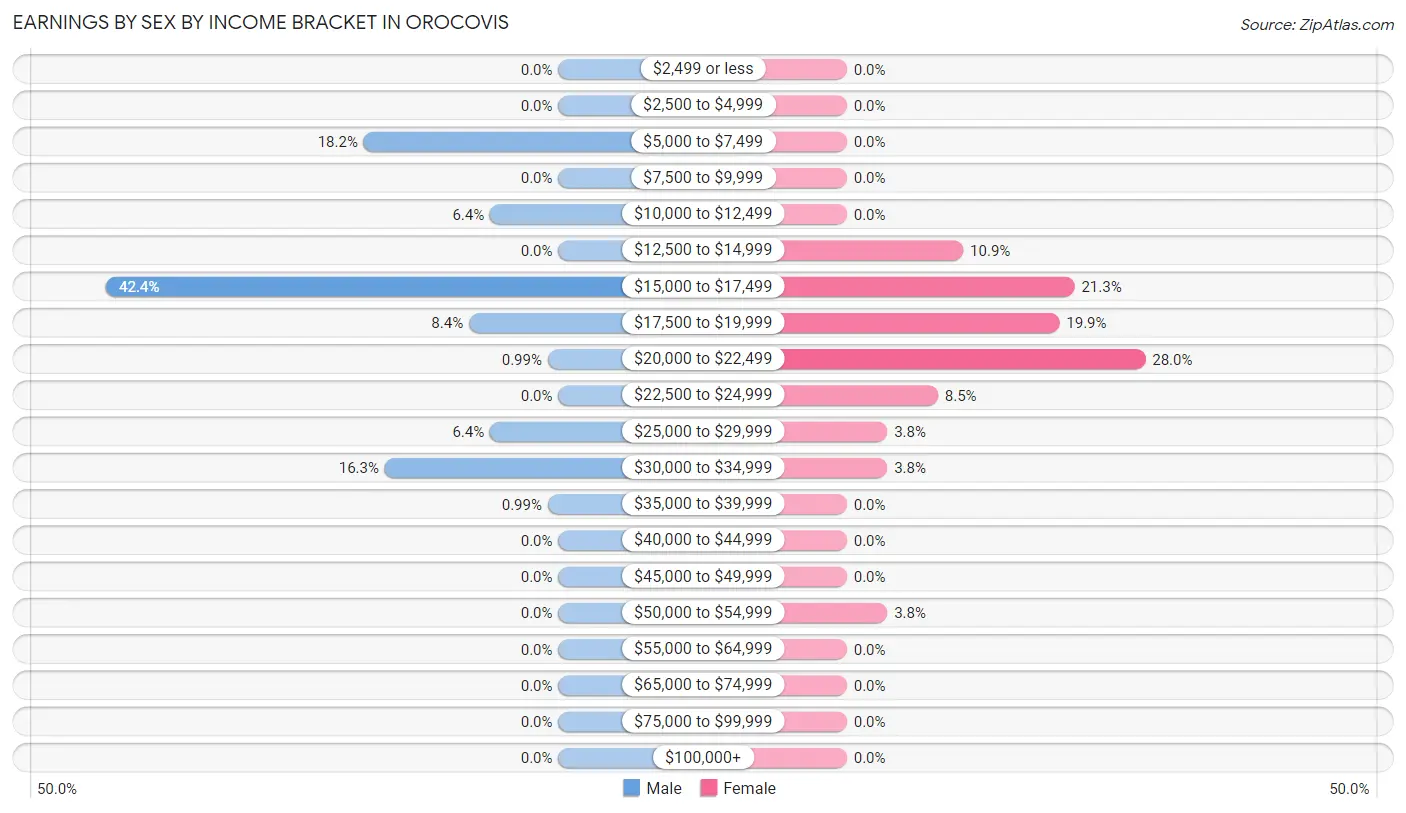
Earnings by Sex by Income Bracket in Orocovis
The most common earnings brackets in Orocovis are $15,000 to $17,499 for men (86 | 42.4%) and $20,000 to $22,499 for women (59 | 28.0%).
| Income | Male | Female |
| $2,499 or less | 0 (0.0%) | 0 (0.0%) |
| $2,500 to $4,999 | 0 (0.0%) | 0 (0.0%) |
| $5,000 to $7,499 | 37 (18.2%) | 0 (0.0%) |
| $7,500 to $9,999 | 0 (0.0%) | 0 (0.0%) |
| $10,000 to $12,499 | 13 (6.4%) | 0 (0.0%) |
| $12,500 to $14,999 | 0 (0.0%) | 23 (10.9%) |
| $15,000 to $17,499 | 86 (42.4%) | 45 (21.3%) |
| $17,500 to $19,999 | 17 (8.4%) | 42 (19.9%) |
| $20,000 to $22,499 | 2 (1.0%) | 59 (28.0%) |
| $22,500 to $24,999 | 0 (0.0%) | 18 (8.5%) |
| $25,000 to $29,999 | 13 (6.4%) | 8 (3.8%) |
| $30,000 to $34,999 | 33 (16.3%) | 8 (3.8%) |
| $35,000 to $39,999 | 2 (1.0%) | 0 (0.0%) |
| $40,000 to $44,999 | 0 (0.0%) | 0 (0.0%) |
| $45,000 to $49,999 | 0 (0.0%) | 0 (0.0%) |
| $50,000 to $54,999 | 0 (0.0%) | 8 (3.8%) |
| $55,000 to $64,999 | 0 (0.0%) | 0 (0.0%) |
| $65,000 to $74,999 | 0 (0.0%) | 0 (0.0%) |
| $75,000 to $99,999 | 0 (0.0%) | 0 (0.0%) |
| $100,000+ | 0 (0.0%) | 0 (0.0%) |
| Total | 203 (100.0%) | 211 (100.0%) |
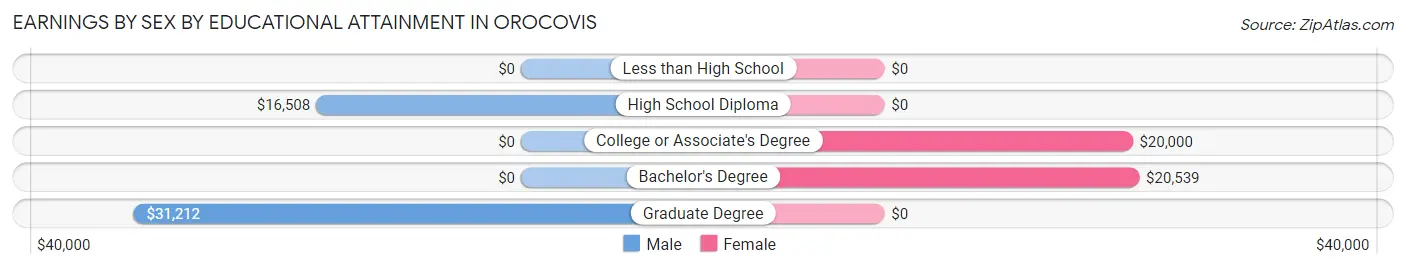
Earnings by Sex by Educational Attainment in Orocovis
Average earnings in Orocovis are $17,049 for men and $19,732 for women, a difference of 13.6%. Men with an educational attainment of graduate degree enjoy the highest average annual earnings of $31,212, while those with high school diploma education earn the least with $16,508. Women with an educational attainment of bachelor's degree earn the most with the average annual earnings of $20,539, while those with college or associate's degree education have the smallest earnings of $20,000.
| Educational Attainment | Male Income | Female Income |
| Less than High School | - | - |
| High School Diploma | $16,508 | $0 |
| College or Associate's Degree | - | - |
| Bachelor's Degree | - | - |
| Graduate Degree | $31,212 | $0 |
| Total | $17,049 | $19,732 |
Family Income in Orocovis
Family Income Brackets in Orocovis
According to the Orocovis family income data, there are 67 families falling into the $15,000 to $24,999 income range, which is the most common income bracket and makes up 25.7% of all families.
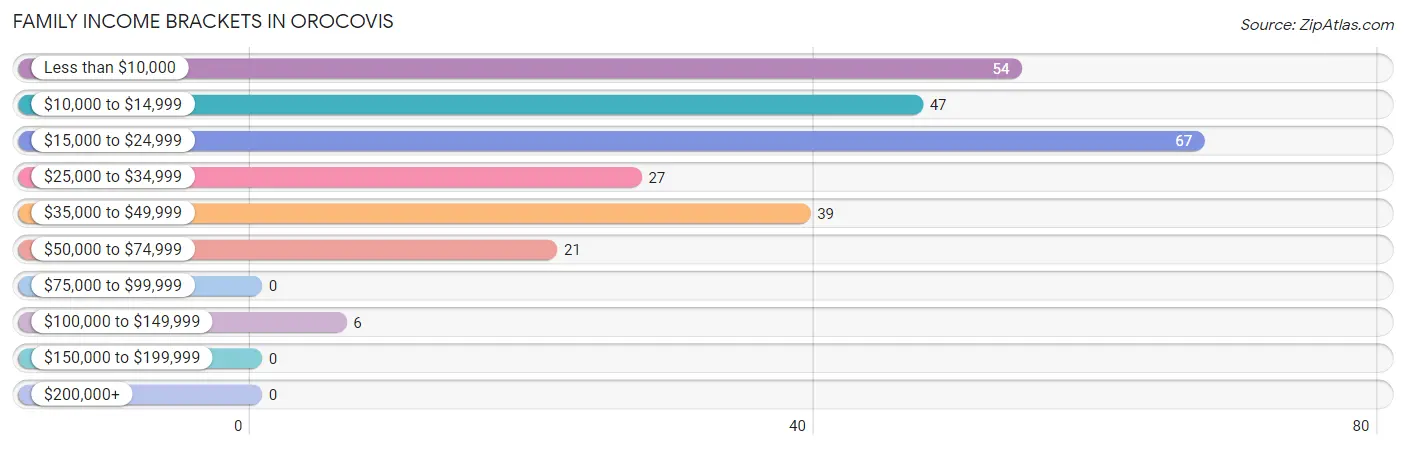
| Income Bracket | # Families | % Families |
| Less than $10,000 | 54 | 20.7% |
| $10,000 to $14,999 | 47 | 18.0% |
| $15,000 to $24,999 | 67 | 25.7% |
| $25,000 to $34,999 | 27 | 10.3% |
| $35,000 to $49,999 | 39 | 14.9% |
| $50,000 to $74,999 | 21 | 8.0% |
| $75,000 to $99,999 | 0 | 0.0% |
| $100,000 to $149,999 | 6 | 2.3% |
| $150,000 to $199,999 | 0 | 0.0% |
| $200,000+ | 0 | 0.0% |
Family Income by Famaliy Size in Orocovis
2-person families (91 | 34.9%) account for the highest median family income in Orocovis with $23,681 per family, while 2-person families (91 | 34.9%) have the highest median income of $11,840 per family member.
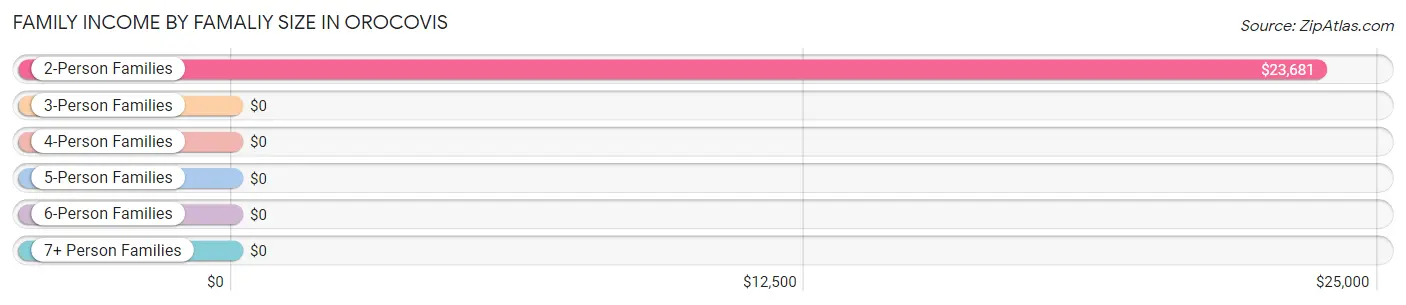
| Income Bracket | # Families | Median Income |
| 2-Person Families | 91 (34.9%) | $23,681 |
| 3-Person Families | 142 (54.4%) | $0 |
| 4-Person Families | 28 (10.7%) | $0 |
| 5-Person Families | 0 (0.0%) | $0 |
| 6-Person Families | 0 (0.0%) | $0 |
| 7+ Person Families | 0 (0.0%) | $0 |
| Total | 261 (100.0%) | $17,107 |
Family Income by Number of Earners in Orocovis
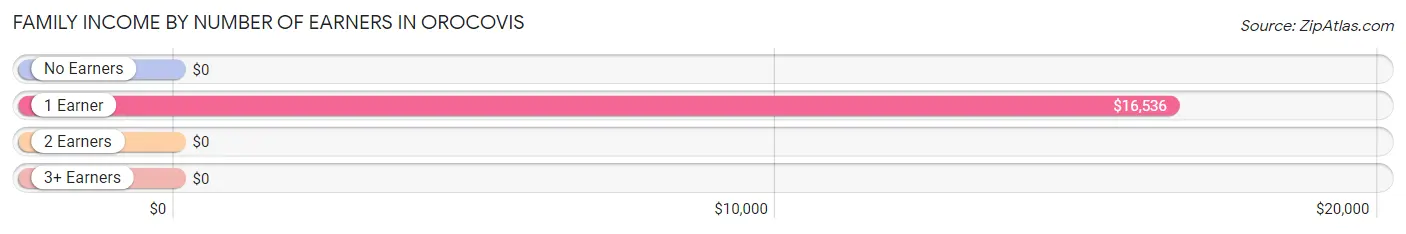
| Number of Earners | # Families | Median Income |
| No Earners | 63 (24.1%) | $0 |
| 1 Earner | 167 (64.0%) | $16,536 |
| 2 Earners | 31 (11.9%) | $0 |
| 3+ Earners | 0 (0.0%) | $0 |
| Total | 261 (100.0%) | $17,107 |
Household Income in Orocovis
Household Income Brackets in Orocovis
With 100 households falling in the category, the $10,000 to $14,999 income range is the most frequent in Orocovis, accounting for 22.6% of all households.
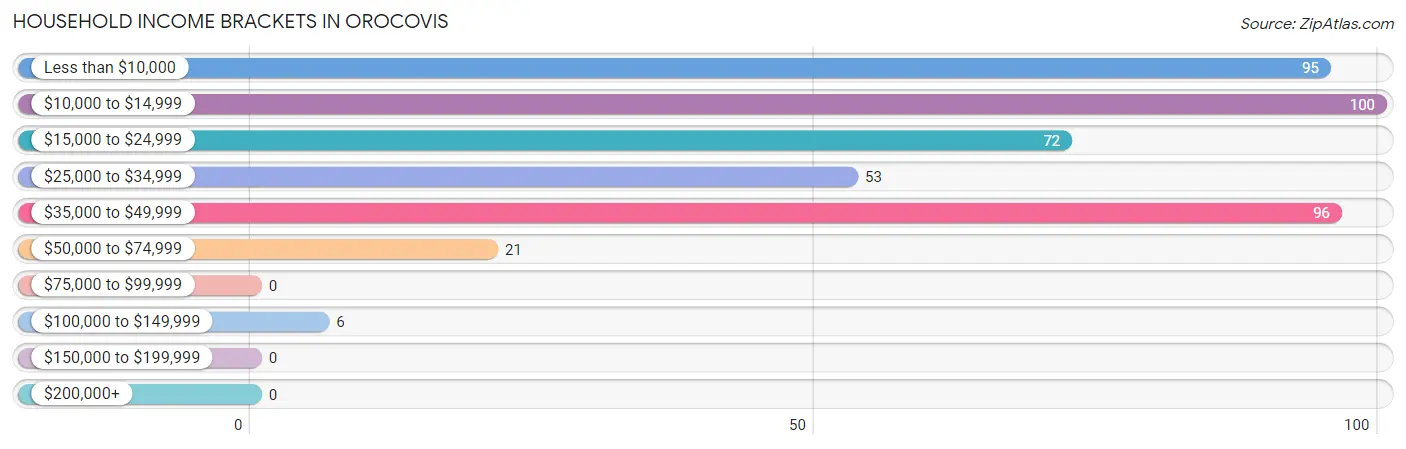
| Income Bracket | # Households | % Households |
| Less than $10,000 | 95 | 21.4% |
| $10,000 to $14,999 | 100 | 22.6% |
| $15,000 to $24,999 | 72 | 16.3% |
| $25,000 to $34,999 | 53 | 12.0% |
| $35,000 to $49,999 | 96 | 21.7% |
| $50,000 to $74,999 | 21 | 4.7% |
| $75,000 to $99,999 | 0 | 0.0% |
| $100,000 to $149,999 | 6 | 1.4% |
| $150,000 to $199,999 | 0 | 0.0% |
| $200,000+ | 0 | 0.0% |
Household Income by Householder Age in Orocovis
The median household income in Orocovis is $20,045, with the highest median household income of $21,518 found in the 25 to 44 years age bracket for the primary householder. A total of 120 households (27.1%) fall into this category.
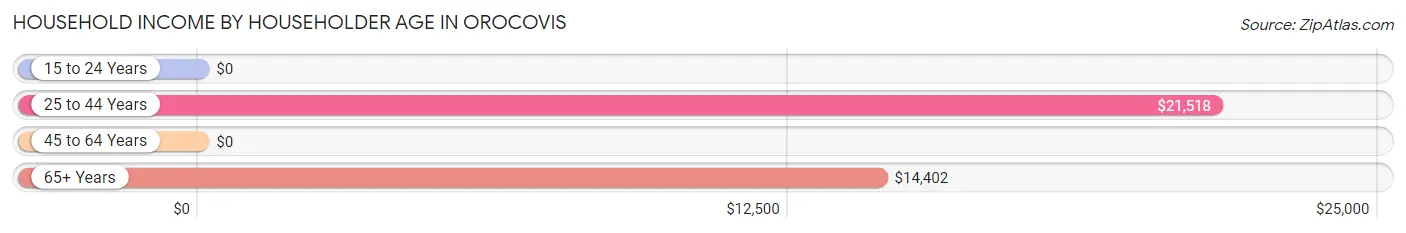
| Income Bracket | # Households | Median Income |
| 15 to 24 Years | 0 (0.0%) | $0 |
| 25 to 44 Years | 120 (27.1%) | $21,518 |
| 45 to 64 Years | 190 (42.9%) | $0 |
| 65+ Years | 133 (30.0%) | $14,402 |
| Total | 443 (100.0%) | $20,045 |
Poverty in Orocovis
Income Below Poverty by Sex and Age in Orocovis
With 49.9% poverty level for males and 53.4% for females among the residents of Orocovis, 6 to 11 year old males and 6 to 11 year old females are the most vulnerable to poverty, with 29 males (100.0%) and 92 females (100.0%) in their respective age groups living below the poverty level.
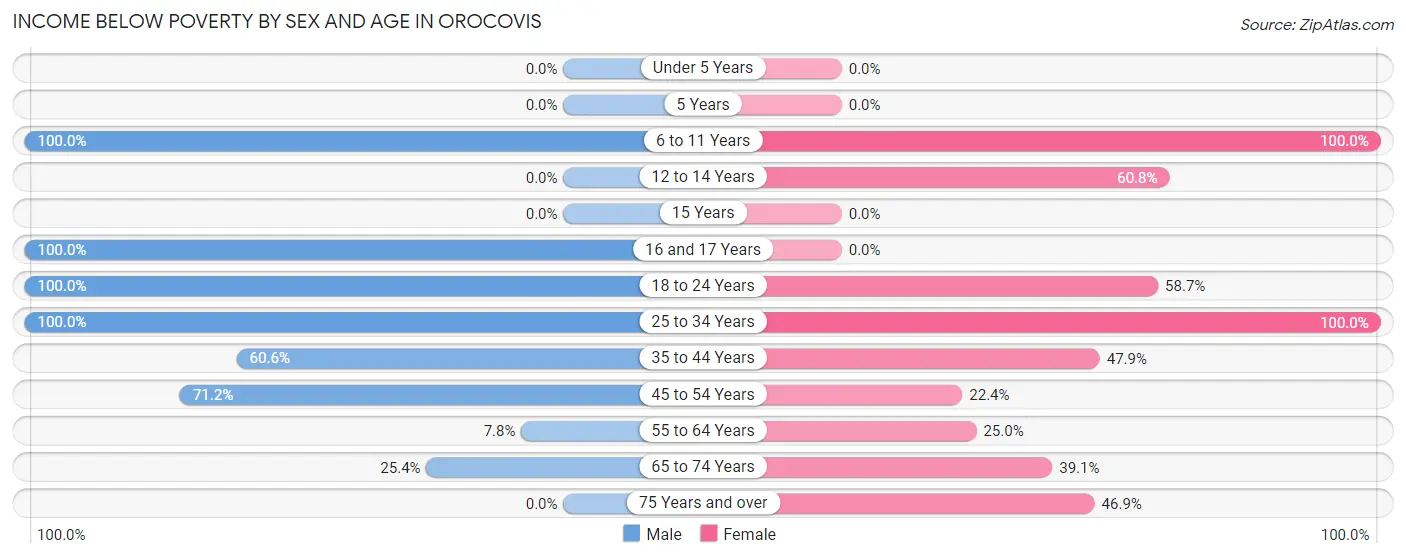
| Age Bracket | Male | Female |
| Under 5 Years | 0 (0.0%) | 0 (0.0%) |
| 5 Years | 0 (0.0%) | 0 (0.0%) |
| 6 to 11 Years | 29 (100.0%) | 92 (100.0%) |
| 12 to 14 Years | 0 (0.0%) | 31 (60.8%) |
| 15 Years | 0 (0.0%) | 0 (0.0%) |
| 16 and 17 Years | 25 (100.0%) | 0 (0.0%) |
| 18 to 24 Years | 38 (100.0%) | 64 (58.7%) |
| 25 to 34 Years | 13 (100.0%) | 81 (100.0%) |
| 35 to 44 Years | 77 (60.6%) | 34 (47.9%) |
| 45 to 54 Years | 37 (71.2%) | 32 (22.4%) |
| 55 to 64 Years | 10 (7.8%) | 23 (25.0%) |
| 65 to 74 Years | 15 (25.4%) | 34 (39.1%) |
| 75 Years and over | 0 (0.0%) | 23 (46.9%) |
| Total | 244 (49.9%) | 414 (53.4%) |
Income Above Poverty by Sex and Age in Orocovis
According to the poverty statistics in Orocovis, males aged 12 to 14 years and females aged 45 to 54 years are the age groups that are most secure financially, with 100.0% of males and 77.6% of females in these age groups living above the poverty line.
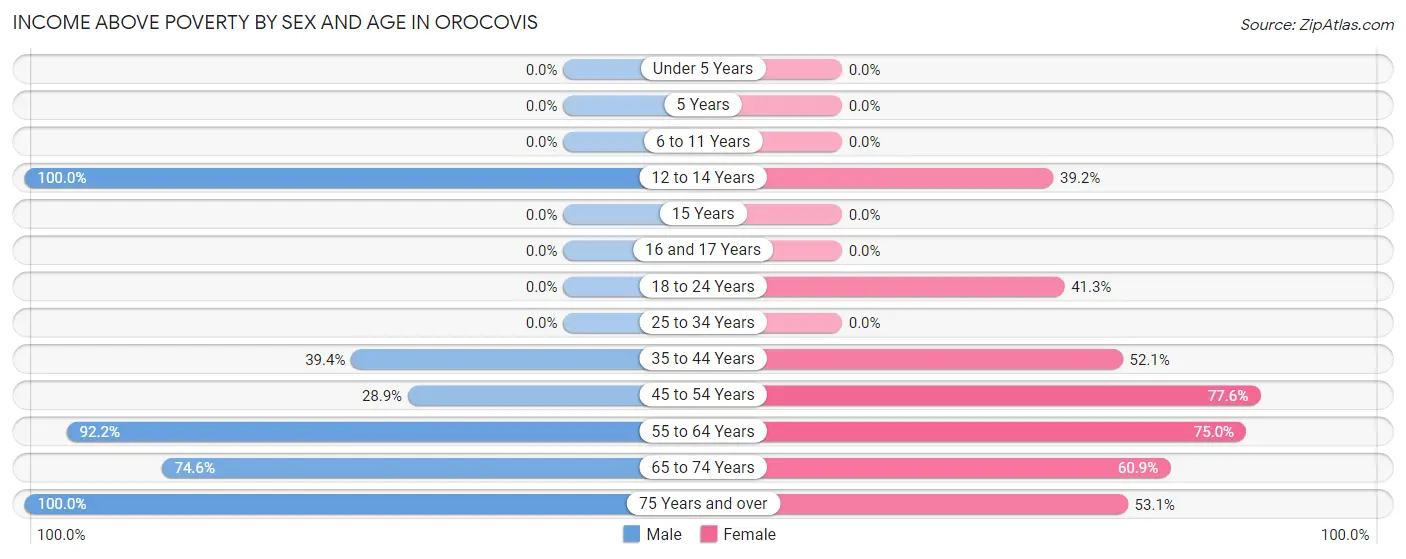
| Age Bracket | Male | Female |
| Under 5 Years | 0 (0.0%) | 0 (0.0%) |
| 5 Years | 0 (0.0%) | 0 (0.0%) |
| 6 to 11 Years | 0 (0.0%) | 0 (0.0%) |
| 12 to 14 Years | 17 (100.0%) | 20 (39.2%) |
| 15 Years | 0 (0.0%) | 0 (0.0%) |
| 16 and 17 Years | 0 (0.0%) | 0 (0.0%) |
| 18 to 24 Years | 0 (0.0%) | 45 (41.3%) |
| 25 to 34 Years | 0 (0.0%) | 0 (0.0%) |
| 35 to 44 Years | 50 (39.4%) | 37 (52.1%) |
| 45 to 54 Years | 15 (28.8%) | 111 (77.6%) |
| 55 to 64 Years | 118 (92.2%) | 69 (75.0%) |
| 65 to 74 Years | 44 (74.6%) | 53 (60.9%) |
| 75 Years and over | 1 (100.0%) | 26 (53.1%) |
| Total | 245 (50.1%) | 361 (46.6%) |
Income Below Poverty Among Married-Couple Families in Orocovis
The poverty statistics for married-couple families in Orocovis show that 23.5% or 24 of the total 102 families live below the poverty line. Families with no children have the highest poverty rate of 27.3%, comprising of 24 families. On the other hand, families with 1 or 2 children have the lowest poverty rate of 0.0%, which includes 0 families.
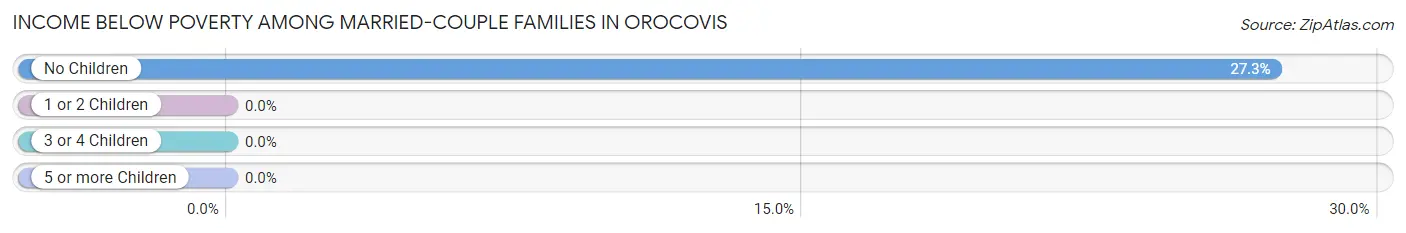
| Children | Above Poverty | Below Poverty |
| No Children | 64 (72.7%) | 24 (27.3%) |
| 1 or 2 Children | 14 (100.0%) | 0 (0.0%) |
| 3 or 4 Children | 0 (0.0%) | 0 (0.0%) |
| 5 or more Children | 0 (0.0%) | 0 (0.0%) |
| Total | 78 (76.5%) | 24 (23.5%) |
Income Below Poverty Among Single-Parent Households in Orocovis
According to the poverty data in Orocovis, 82.2% or 60 single-father households and 60.5% or 52 single-mother households are living below the poverty line. Among single-father households, those with 1 or 2 children have the highest poverty rate, with 60 households (100.0%) experiencing poverty. Likewise, among single-mother households, those with 1 or 2 children have the highest poverty rate, with 52 households (100.0%) falling below the poverty line.
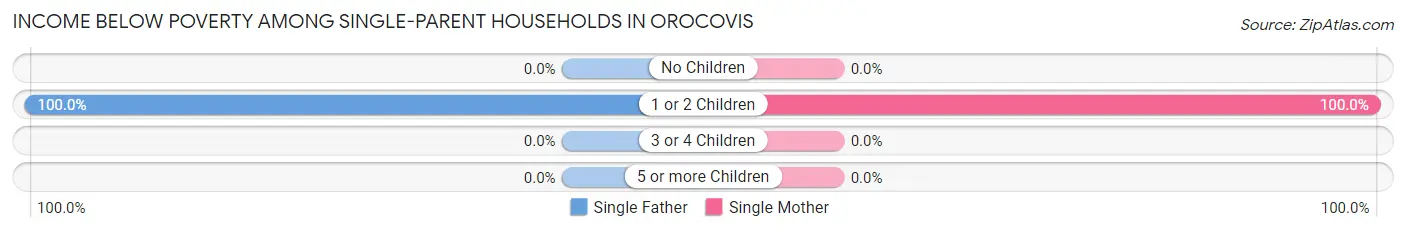
| Children | Single Father | Single Mother |
| No Children | 0 (0.0%) | 0 (0.0%) |
| 1 or 2 Children | 60 (100.0%) | 52 (100.0%) |
| 3 or 4 Children | 0 (0.0%) | 0 (0.0%) |
| 5 or more Children | 0 (0.0%) | 0 (0.0%) |
| Total | 60 (82.2%) | 52 (60.5%) |
Income Below Poverty Among Married-Couple vs Single-Parent Households in Orocovis
The poverty data for Orocovis shows that 24 of the married-couple family households (23.5%) and 112 of the single-parent households (70.4%) are living below the poverty level. Within the married-couple family households, those with no children have the highest poverty rate, with 24 households (27.3%) falling below the poverty line. Among the single-parent households, those with 1 or 2 children have the highest poverty rate, with 112 household (100.0%) living below poverty.
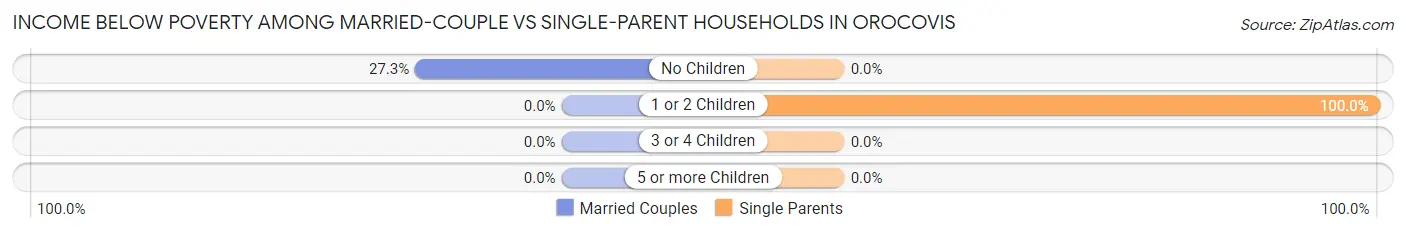
| Children | Married-Couple Families | Single-Parent Households |
| No Children | 24 (27.3%) | 0 (0.0%) |
| 1 or 2 Children | 0 (0.0%) | 112 (100.0%) |
| 3 or 4 Children | 0 (0.0%) | 0 (0.0%) |
| 5 or more Children | 0 (0.0%) | 0 (0.0%) |
| Total | 24 (23.5%) | 112 (70.4%) |
Race in Orocovis
The most populous races in Orocovis are Hispanic or Latino (1,263 | 99.9%), White / Caucasian (667 | 52.8%), and Two or more Races (351 | 27.8%).
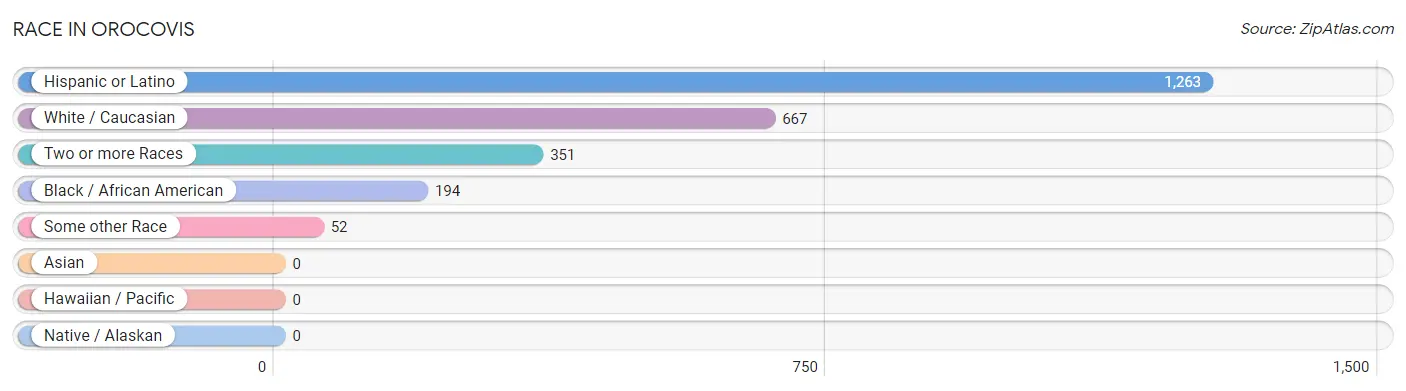
| Race | # Population | % Population |
| Asian | 0 | 0.0% |
| Black / African American | 194 | 15.3% |
| Hawaiian / Pacific | 0 | 0.0% |
| Hispanic or Latino | 1,263 | 99.9% |
| Native / Alaskan | 0 | 0.0% |
| White / Caucasian | 667 | 52.8% |
| Two or more Races | 351 | 27.8% |
| Some other Race | 52 | 4.1% |
| Total | 1,264 | 100.0% |
Ancestry in Orocovis
The most populous ancestries reported in Orocovis are Puerto Rican (1,262 | 99.8%), American (32 | 2.5%), and Spaniard (1 | 0.1%), together accounting for 102.4% of all Orocovis residents.
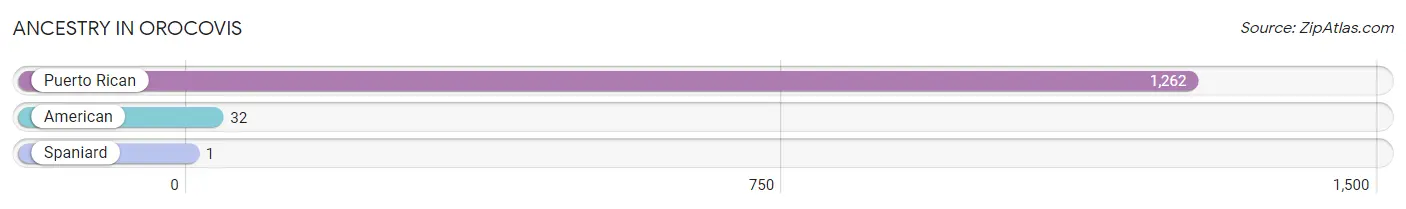
| Ancestry | # Population | % Population |
| American | 32 | 2.5% |
| Puerto Rican | 1,262 | 99.8% |
| Spaniard | 1 | 0.1% | View All 3 Rows |
Immigrants in Orocovis

| Immigration Origin | # Population | % Population | View All 0 Rows |
Sex and Age in Orocovis
Sex and Age in Orocovis
The most populous age groups in Orocovis are 55 to 59 Years (115 | 23.5%) for men and 20 to 24 Years (99 | 12.8%) for women.
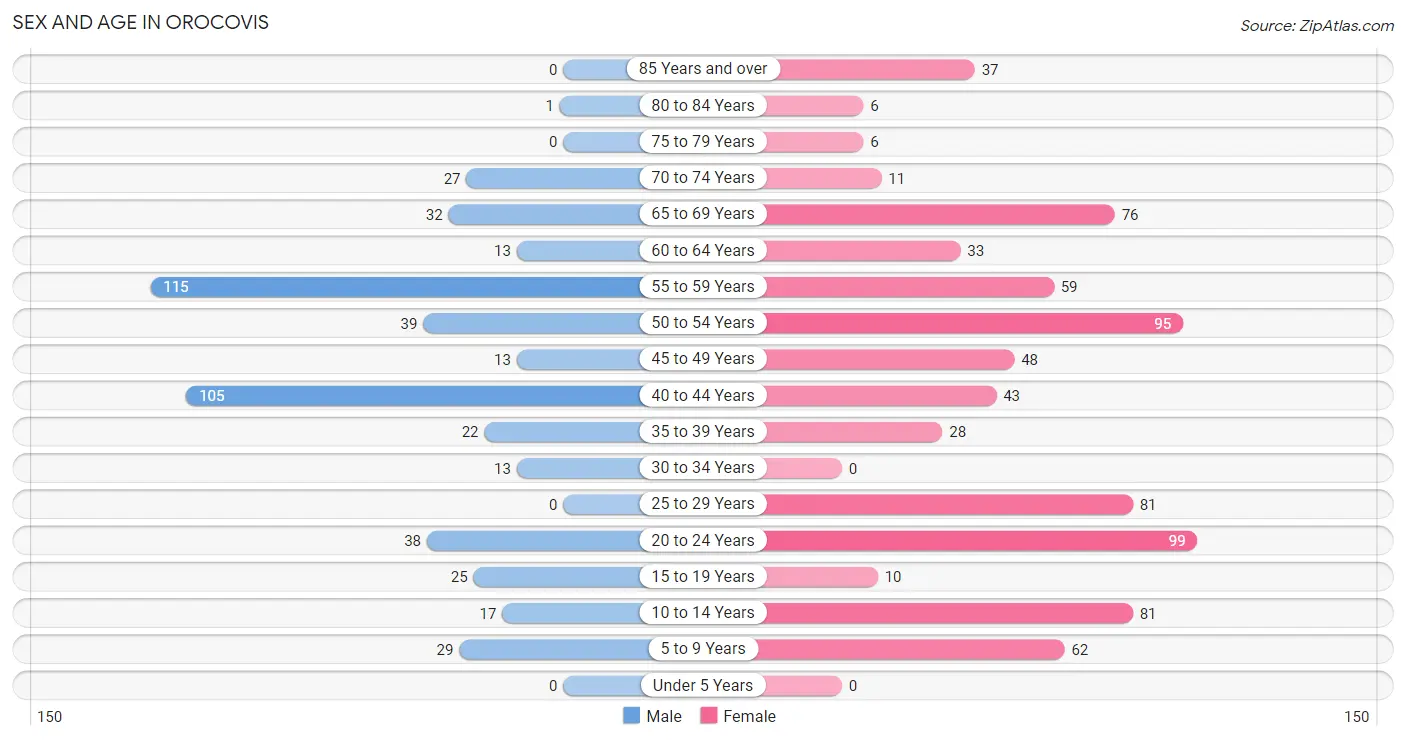
| Age Bracket | Male | Female |
| Under 5 Years | 0 (0.0%) | 0 (0.0%) |
| 5 to 9 Years | 29 (5.9%) | 62 (8.0%) |
| 10 to 14 Years | 17 (3.5%) | 81 (10.4%) |
| 15 to 19 Years | 25 (5.1%) | 10 (1.3%) |
| 20 to 24 Years | 38 (7.8%) | 99 (12.8%) |
| 25 to 29 Years | 0 (0.0%) | 81 (10.4%) |
| 30 to 34 Years | 13 (2.7%) | 0 (0.0%) |
| 35 to 39 Years | 22 (4.5%) | 28 (3.6%) |
| 40 to 44 Years | 105 (21.5%) | 43 (5.6%) |
| 45 to 49 Years | 13 (2.7%) | 48 (6.2%) |
| 50 to 54 Years | 39 (8.0%) | 95 (12.3%) |
| 55 to 59 Years | 115 (23.5%) | 59 (7.6%) |
| 60 to 64 Years | 13 (2.7%) | 33 (4.3%) |
| 65 to 69 Years | 32 (6.5%) | 76 (9.8%) |
| 70 to 74 Years | 27 (5.5%) | 11 (1.4%) |
| 75 to 79 Years | 0 (0.0%) | 6 (0.8%) |
| 80 to 84 Years | 1 (0.2%) | 6 (0.8%) |
| 85 Years and over | 0 (0.0%) | 37 (4.8%) |
| Total | 489 (100.0%) | 775 (100.0%) |
Families and Households in Orocovis
Median Family Size in Orocovis
The median family size in Orocovis is 3.68 persons per family, with married-couple families (102 | 39.1%) accounting for the largest median family size of 3.89 persons per family. On the other hand, single female/mother families (86 | 33.0%) represent the smallest median family size with 3.41 persons per family.
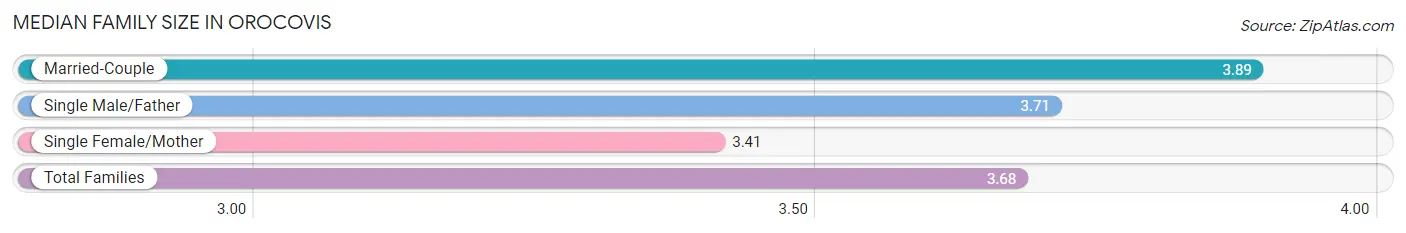
| Family Type | # Families | Family Size |
| Married-Couple | 102 (39.1%) | 3.89 |
| Single Male/Father | 73 (28.0%) | 3.71 |
| Single Female/Mother | 86 (33.0%) | 3.41 |
| Total Families | 261 (100.0%) | 3.68 |
Median Household Size in Orocovis
The median household size in Orocovis is 2.84 persons per household, with single male/father households (73 | 16.5%) accounting for the largest median household size of 4.3 persons per household. non-family households (182 | 41.1%) represent the smallest median household size with 1.07 persons per household.
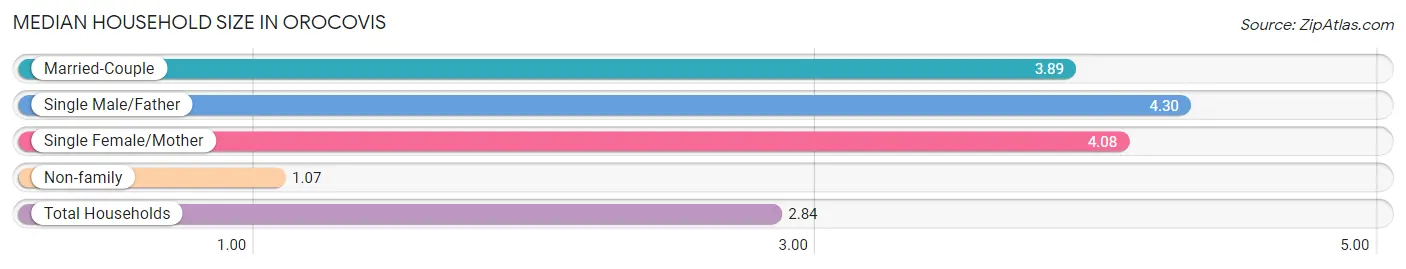
| Household Type | # Households | Household Size |
| Married-Couple | 102 (23.0%) | 3.89 |
| Single Male/Father | 73 (16.5%) | 4.30 |
| Single Female/Mother | 86 (19.4%) | 4.08 |
| Non-family | 182 (41.1%) | 1.07 |
| Total Households | 443 (100.0%) | 2.84 |
Household Size by Marriage Status in Orocovis
Out of a total of 443 households in Orocovis, 261 (58.9%) are family households, while 182 (41.1%) are nonfamily households. The most numerous type of family households are 4-person households, comprising 117, and the most common type of nonfamily households are 1-person households, comprising 173.
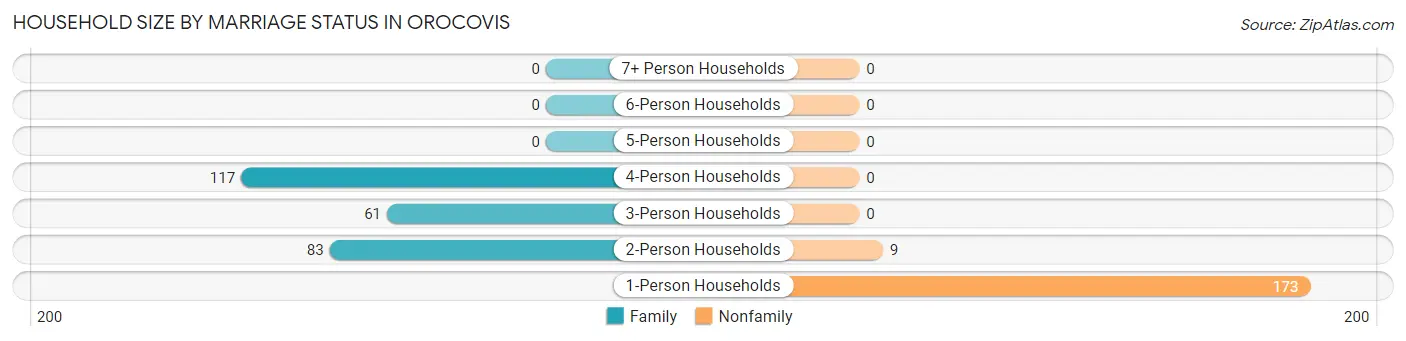
| Household Size | Family Households | Nonfamily Households |
| 1-Person Households | - | 173 (39.1%) |
| 2-Person Households | 83 (18.7%) | 9 (2.0%) |
| 3-Person Households | 61 (13.8%) | 0 (0.0%) |
| 4-Person Households | 117 (26.4%) | 0 (0.0%) |
| 5-Person Households | 0 (0.0%) | 0 (0.0%) |
| 6-Person Households | 0 (0.0%) | 0 (0.0%) |
| 7+ Person Households | 0 (0.0%) | 0 (0.0%) |
| Total | 261 (58.9%) | 182 (41.1%) |
Female Fertility in Orocovis
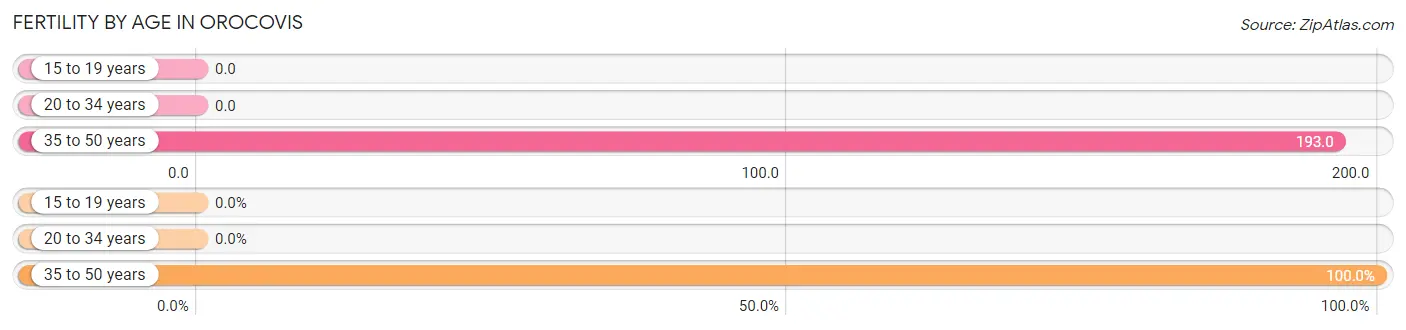
Fertility by Age in Orocovis
Average fertility rate in Orocovis is 74.0 births per 1,000 women. Women in the age bracket of 35 to 50 years have the highest fertility rate with 193.0 births per 1,000 women. Women in the age bracket of 35 to 50 years acount for 100.0% of all women with births.
| Age Bracket | Women with Births | Births / 1,000 Women |
| 15 to 19 years | 0 (0.0%) | 0.0 |
| 20 to 34 years | 0 (0.0%) | 0.0 |
| 35 to 50 years | 23 (100.0%) | 193.0 |
| Total | 23 (100.0%) | 74.0 |
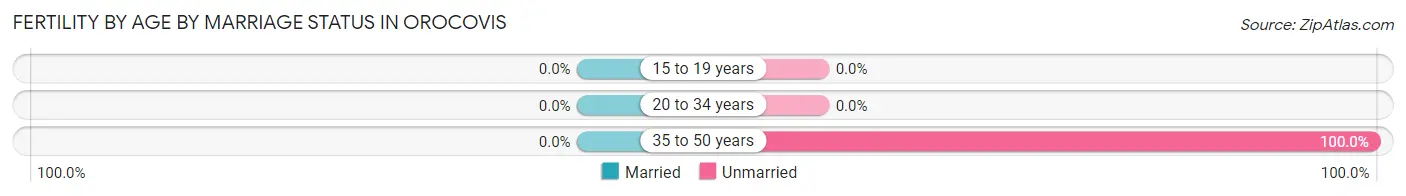
Fertility by Age by Marriage Status in Orocovis
| Age Bracket | Married | Unmarried |
| 15 to 19 years | 0 (0.0%) | 0 (0.0%) |
| 20 to 34 years | 0 (0.0%) | 0 (0.0%) |
| 35 to 50 years | 0 (0.0%) | 23 (100.0%) |
| Total | 0 (0.0%) | 23 (100.0%) |
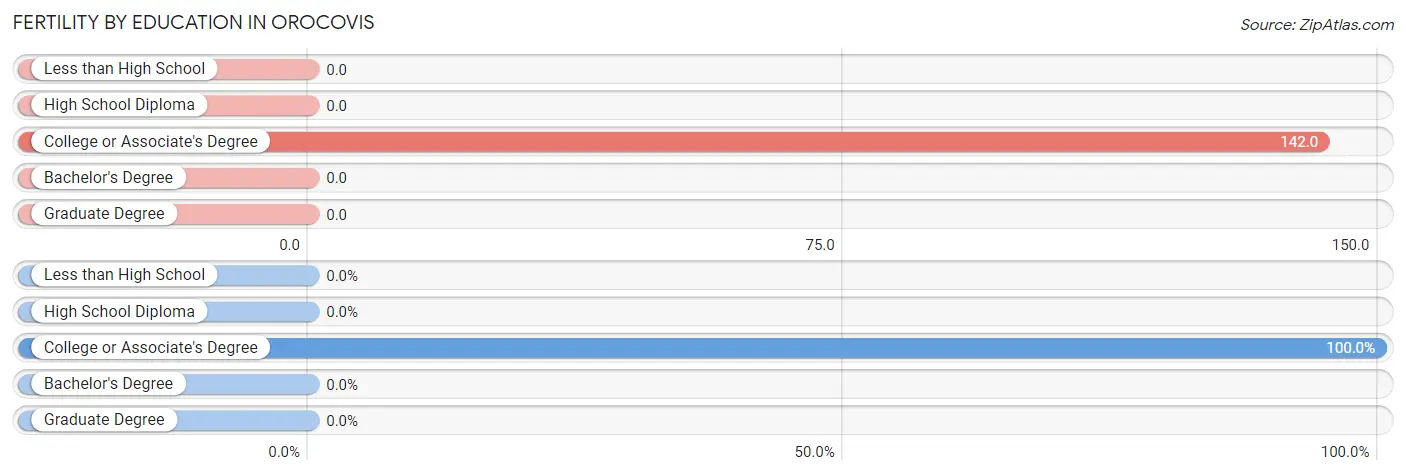
Fertility by Education in Orocovis
| Educational Attainment | Women with Births | Births / 1,000 Women |
| Less than High School | 0 (0.0%) | 0.0 |
| High School Diploma | 0 (0.0%) | 0.0 |
| College or Associate's Degree | 23 (100.0%) | 142.0 |
| Bachelor's Degree | 0 (0.0%) | 0.0 |
| Graduate Degree | 0 (0.0%) | 0.0 |
| Total | 23 (100.0%) | 74.0 |
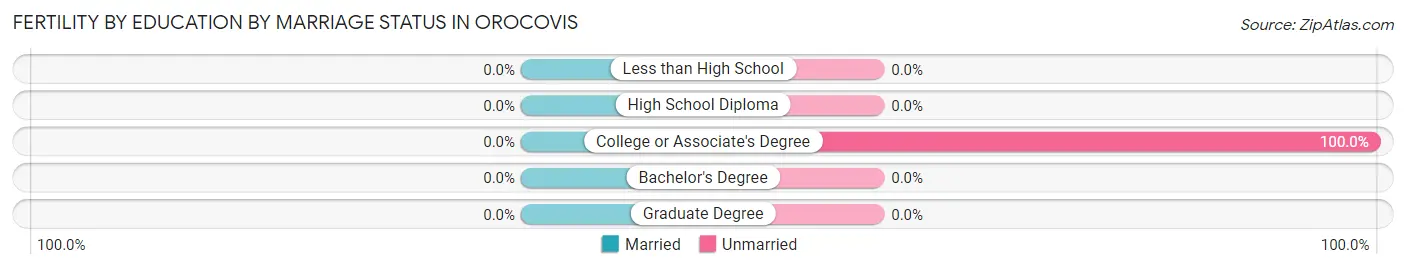
Fertility by Education by Marriage Status in Orocovis
| Educational Attainment | Married | Unmarried |
| Less than High School | 0 (0.0%) | 0 (0.0%) |
| High School Diploma | 0 (0.0%) | 0 (0.0%) |
| College or Associate's Degree | 0 (0.0%) | 23 (100.0%) |
| Bachelor's Degree | 0 (0.0%) | 0 (0.0%) |
| Graduate Degree | 0 (0.0%) | 0 (0.0%) |
| Total | 0 (0.0%) | 23 (100.0%) |
Employment Characteristics in Orocovis
Employment by Class of Employer in Orocovis
Among the 402 employed individuals in Orocovis, private company employees (252 | 62.7%), state government employees (72 | 17.9%), and self-employed (not incorporated) (23 | 5.7%) make up the most common classes of employment.
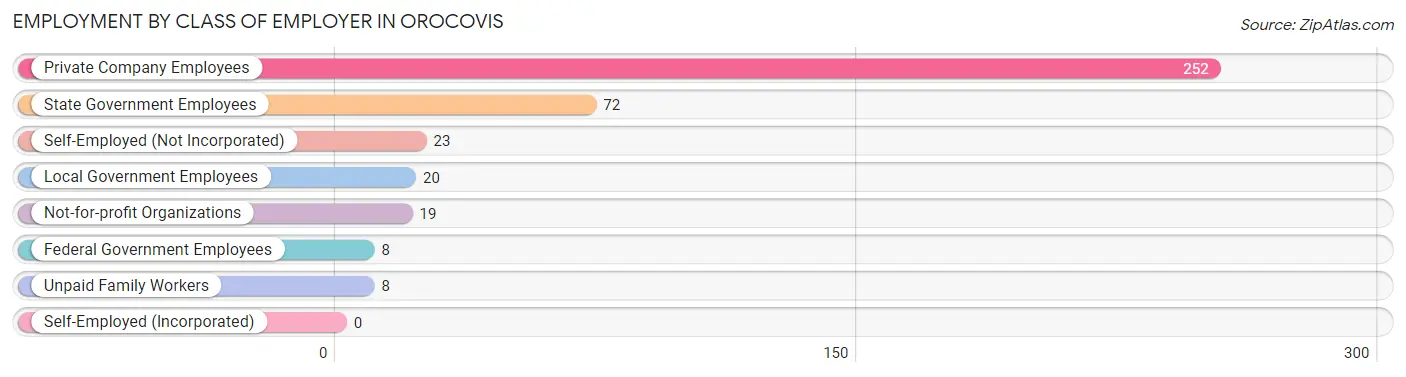
| Employer Class | # Employees | % Employees |
| Private Company Employees | 252 | 62.7% |
| Self-Employed (Incorporated) | 0 | 0.0% |
| Self-Employed (Not Incorporated) | 23 | 5.7% |
| Not-for-profit Organizations | 19 | 4.7% |
| Local Government Employees | 20 | 5.0% |
| State Government Employees | 72 | 17.9% |
| Federal Government Employees | 8 | 2.0% |
| Unpaid Family Workers | 8 | 2.0% |
| Total | 402 | 100.0% |
Employment Status by Age in Orocovis
According to the labor force statistics for Orocovis, out of the total population over 16 years of age (1,075), 40.1% or 431 individuals are in the labor force, with 6.7% or 29 of them unemployed. The age group with the highest labor force participation rate is 35 to 44 years, with 61.6% or 122 individuals in the labor force. Within the labor force, the 25 to 29 years age range has the highest percentage of unemployed individuals, with 100.0% or 29 of them being unemployed.
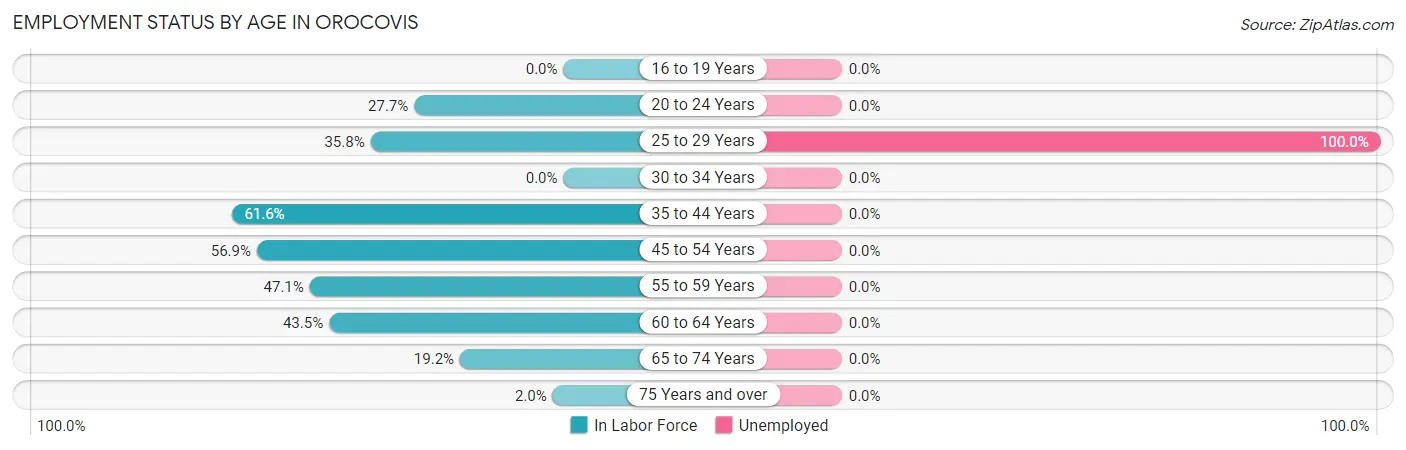
| Age Bracket | In Labor Force | Unemployed |
| 16 to 19 Years | 0 (0.0%) | 0 (0.0%) |
| 20 to 24 Years | 38 (27.7%) | 0 (0.0%) |
| 25 to 29 Years | 29 (35.8%) | 29 (100.0%) |
| 30 to 34 Years | 0 (0.0%) | 0 (0.0%) |
| 35 to 44 Years | 122 (61.6%) | 0 (0.0%) |
| 45 to 54 Years | 111 (56.9%) | 0 (0.0%) |
| 55 to 59 Years | 82 (47.1%) | 0 (0.0%) |
| 60 to 64 Years | 20 (43.5%) | 0 (0.0%) |
| 65 to 74 Years | 28 (19.2%) | 0 (0.0%) |
| 75 Years and over | 1 (2.0%) | 0 (0.0%) |
| Total | 431 (40.1%) | 29 (6.7%) |
Employment Status by Educational Attainment in Orocovis
According to labor force statistics for Orocovis, 51.5% of individuals (364) out of the total population between 25 and 64 years of age (707) are in the labor force, with 8.0% or 29 of them being unemployed. The group with the highest labor force participation rate are those with the educational attainment of bachelor's degree or higher, with 90.5% or 133 individuals in the labor force. Within the labor force, individuals with college / associate degree education have the highest percentage of unemployment, with 21.5% or 29 of them being unemployed.
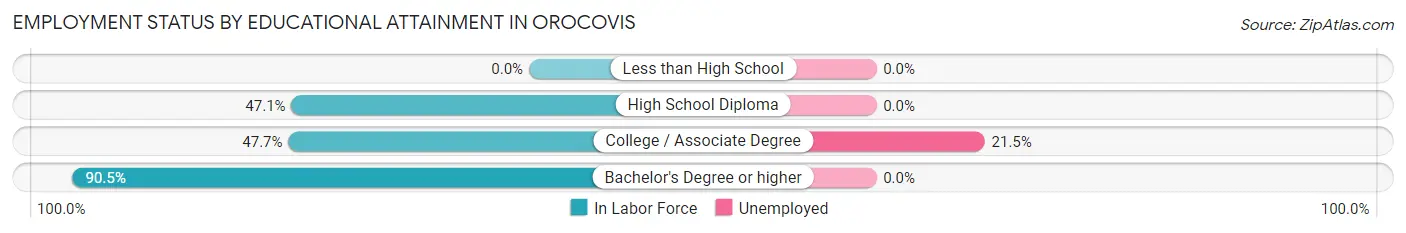
| Educational Attainment | In Labor Force | Unemployed |
| Less than High School | 0 (0.0%) | 0 (0.0%) |
| High School Diploma | 96 (47.1%) | 0 (0.0%) |
| College / Associate Degree | 135 (47.7%) | 61 (21.5%) |
| Bachelor's Degree or higher | 133 (90.5%) | 0 (0.0%) |
| Total | 364 (51.5%) | 57 (8.0%) |
Employment Occupations by Sex in Orocovis
Management, Business, Science and Arts Occupations
The most common Management, Business, Science and Arts occupations in Orocovis are Management (51 | 12.7%), Computers, Engineering & Science (33 | 8.2%), Life, Physical & Social Science (33 | 8.2%), Community & Social Service (18 | 4.5%), and Education, Arts & Media (18 | 4.5%).
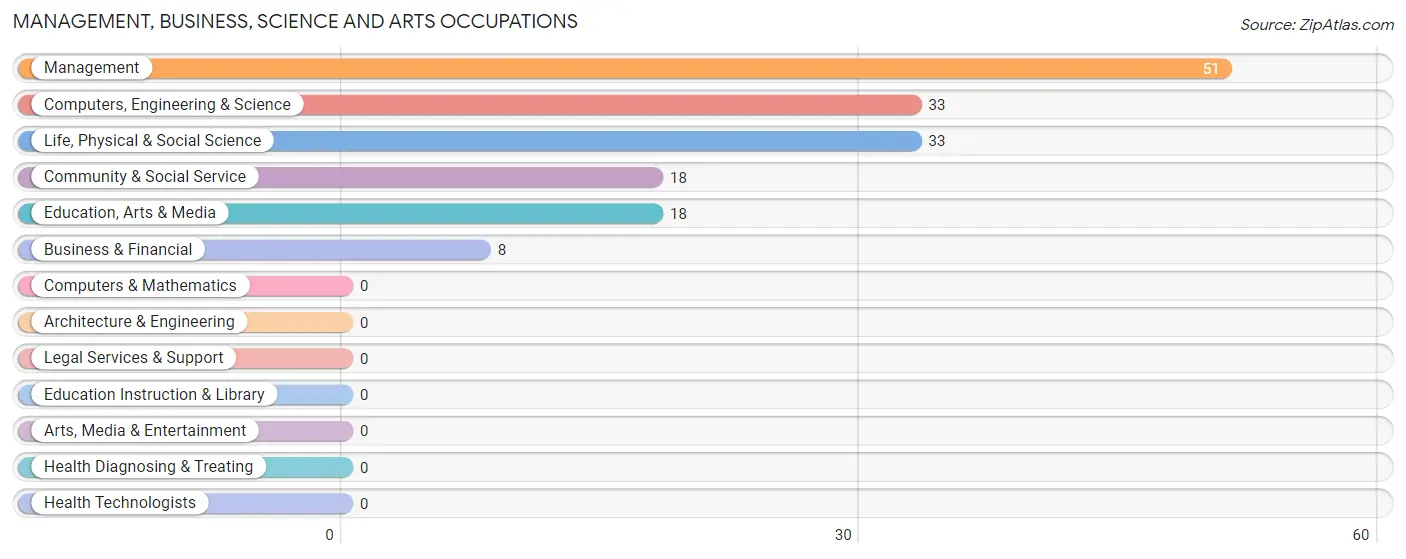
Management, Business, Science and Arts Occupations by Sex
Within the Management, Business, Science and Arts occupations in Orocovis, the most male-oriented occupations are Computers, Engineering & Science (100.0%), Life, Physical & Social Science (100.0%), and Community & Social Service (100.0%), while the most female-oriented occupations are Management (100.0%), and Business & Financial (100.0%).
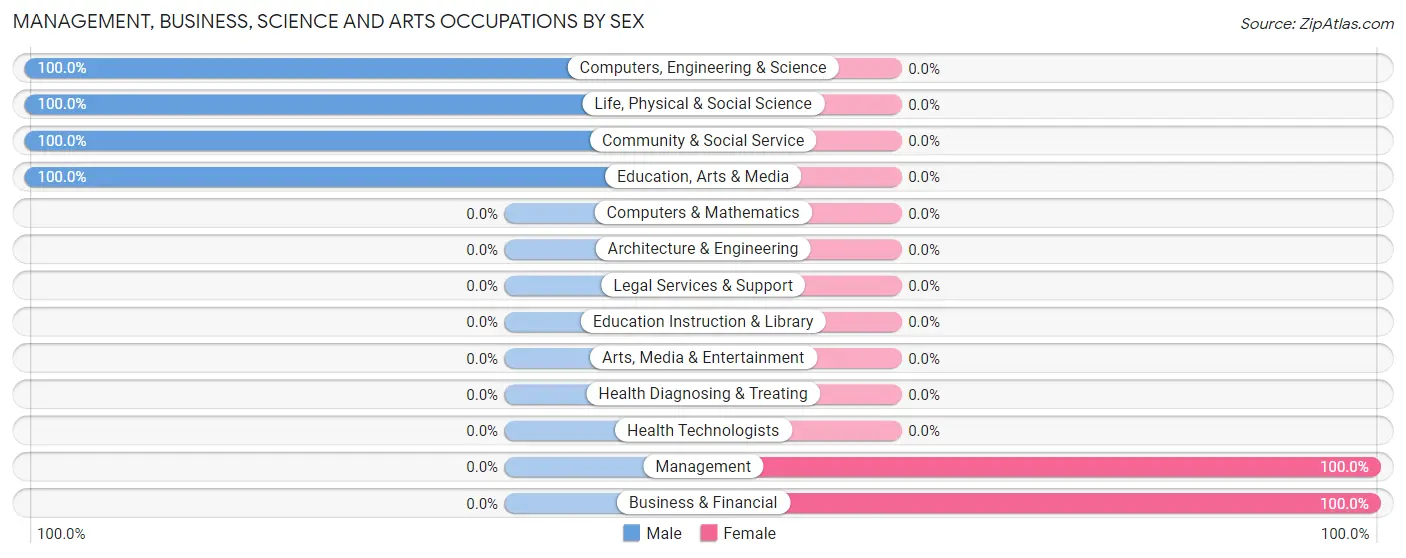
| Occupation | Male | Female |
| Management | 0 (0.0%) | 51 (100.0%) |
| Business & Financial | 0 (0.0%) | 8 (100.0%) |
| Computers, Engineering & Science | 33 (100.0%) | 0 (0.0%) |
| Computers & Mathematics | 0 (0.0%) | 0 (0.0%) |
| Architecture & Engineering | 0 (0.0%) | 0 (0.0%) |
| Life, Physical & Social Science | 33 (100.0%) | 0 (0.0%) |
| Community & Social Service | 18 (100.0%) | 0 (0.0%) |
| Education, Arts & Media | 18 (100.0%) | 0 (0.0%) |
| Legal Services & Support | 0 (0.0%) | 0 (0.0%) |
| Education Instruction & Library | 0 (0.0%) | 0 (0.0%) |
| Arts, Media & Entertainment | 0 (0.0%) | 0 (0.0%) |
| Health Diagnosing & Treating | 0 (0.0%) | 0 (0.0%) |
| Health Technologists | 0 (0.0%) | 0 (0.0%) |
| Total (Category) | 51 (46.4%) | 59 (53.6%) |
| Total (Overall) | 191 (47.5%) | 211 (52.5%) |
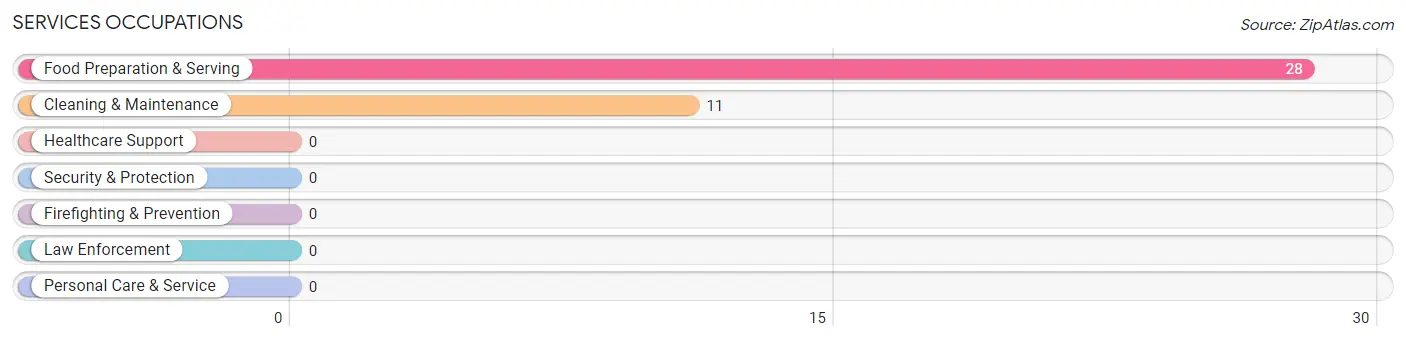
Services Occupations
The most common Services occupations in Orocovis are Food Preparation & Serving (28 | 7.0%), and Cleaning & Maintenance (11 | 2.7%).
Services Occupations by Sex
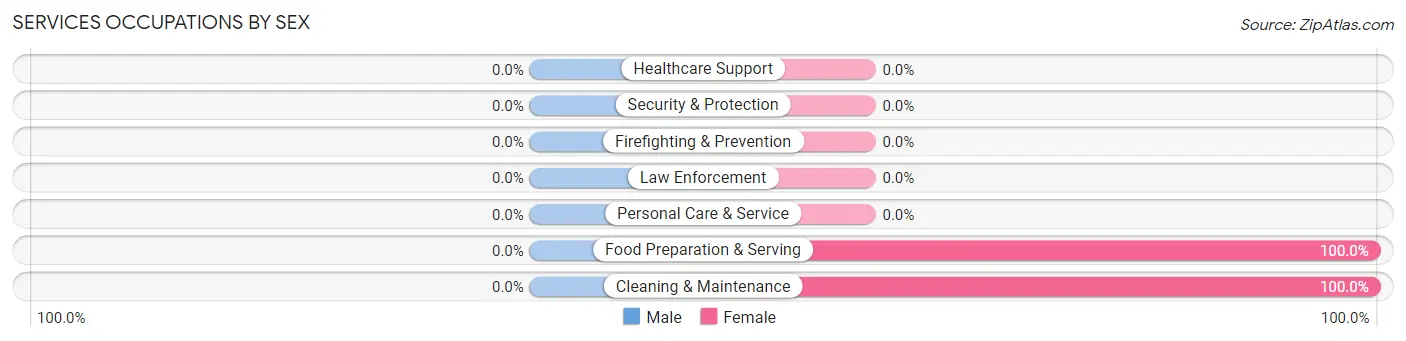
| Occupation | Male | Female |
| Healthcare Support | 0 (0.0%) | 0 (0.0%) |
| Security & Protection | 0 (0.0%) | 0 (0.0%) |
| Firefighting & Prevention | 0 (0.0%) | 0 (0.0%) |
| Law Enforcement | 0 (0.0%) | 0 (0.0%) |
| Food Preparation & Serving | 0 (0.0%) | 28 (100.0%) |
| Cleaning & Maintenance | 0 (0.0%) | 11 (100.0%) |
| Personal Care & Service | 0 (0.0%) | 0 (0.0%) |
| Total (Category) | 0 (0.0%) | 39 (100.0%) |
| Total (Overall) | 191 (47.5%) | 211 (52.5%) |
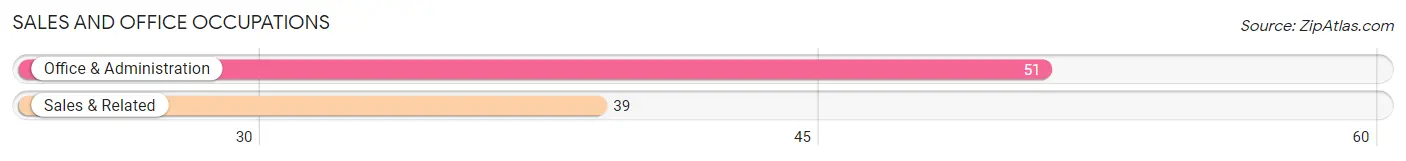
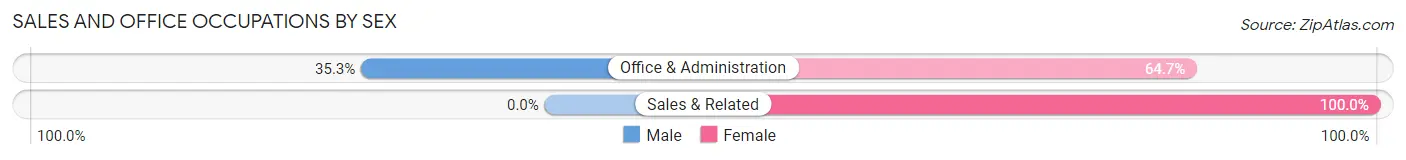
Sales and Office Occupations
The most common Sales and Office occupations in Orocovis are Office & Administration (51 | 12.7%), and Sales & Related (39 | 9.7%).
Sales and Office Occupations by Sex
| Occupation | Male | Female |
| Sales & Related | 0 (0.0%) | 39 (100.0%) |
| Office & Administration | 18 (35.3%) | 33 (64.7%) |
| Total (Category) | 18 (20.0%) | 72 (80.0%) |
| Total (Overall) | 191 (47.5%) | 211 (52.5%) |
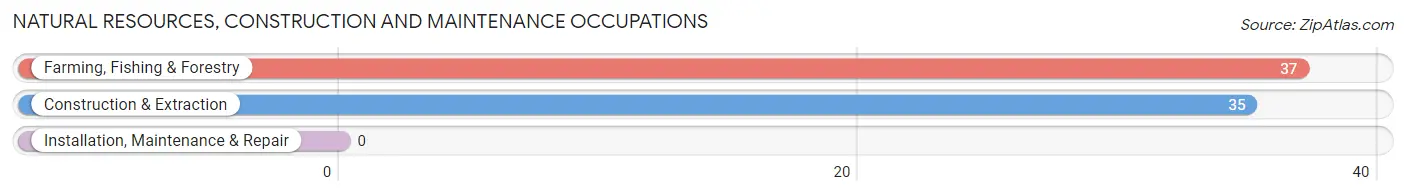
Natural Resources, Construction and Maintenance Occupations
The most common Natural Resources, Construction and Maintenance occupations in Orocovis are Farming, Fishing & Forestry (37 | 9.2%), and Construction & Extraction (35 | 8.7%).
Natural Resources, Construction and Maintenance Occupations by Sex
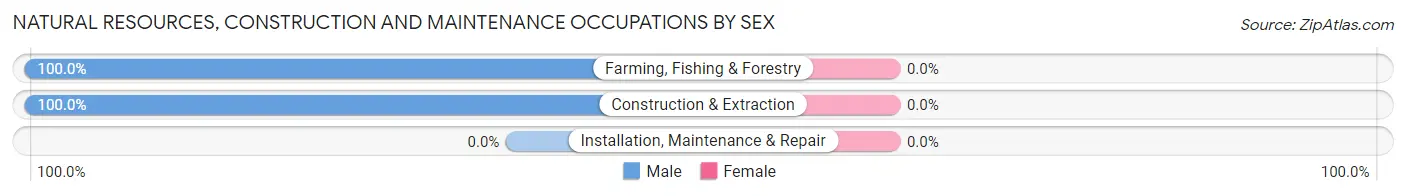
| Occupation | Male | Female |
| Farming, Fishing & Forestry | 37 (100.0%) | 0 (0.0%) |
| Construction & Extraction | 35 (100.0%) | 0 (0.0%) |
| Installation, Maintenance & Repair | 0 (0.0%) | 0 (0.0%) |
| Total (Category) | 72 (100.0%) | 0 (0.0%) |
| Total (Overall) | 191 (47.5%) | 211 (52.5%) |
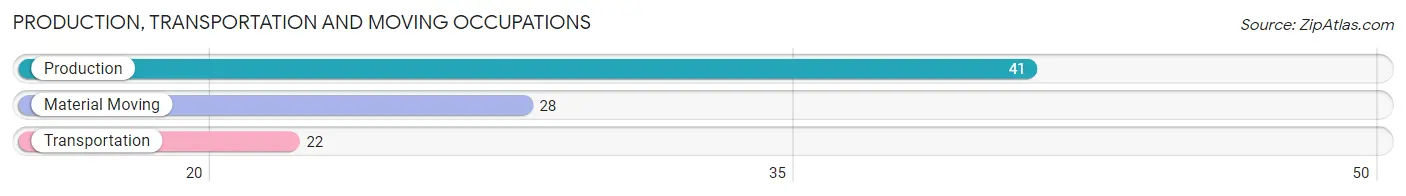
Production, Transportation and Moving Occupations
The most common Production, Transportation and Moving occupations in Orocovis are Production (41 | 10.2%), Material Moving (28 | 7.0%), and Transportation (22 | 5.5%).
Production, Transportation and Moving Occupations by Sex
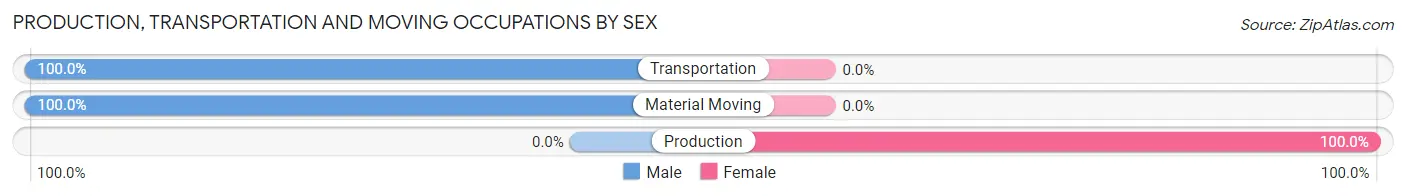
| Occupation | Male | Female |
| Production | 0 (0.0%) | 41 (100.0%) |
| Transportation | 22 (100.0%) | 0 (0.0%) |
| Material Moving | 28 (100.0%) | 0 (0.0%) |
| Total (Category) | 50 (54.9%) | 41 (45.1%) |
| Total (Overall) | 191 (47.5%) | 211 (52.5%) |
Employment Industries by Sex in Orocovis
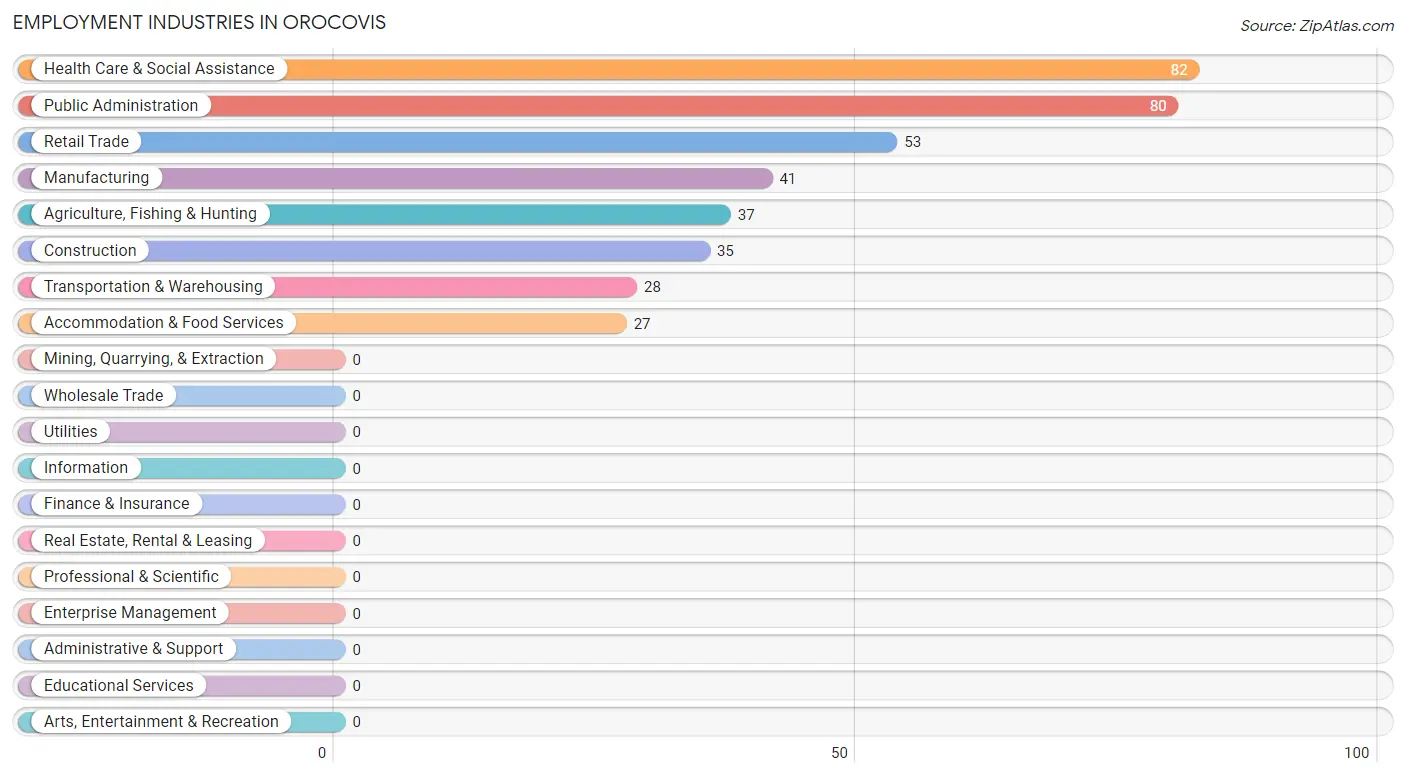
Employment Industries in Orocovis
The major employment industries in Orocovis include Health Care & Social Assistance (82 | 20.4%), Public Administration (80 | 19.9%), Retail Trade (53 | 13.2%), Manufacturing (41 | 10.2%), and Agriculture, Fishing & Hunting (37 | 9.2%).
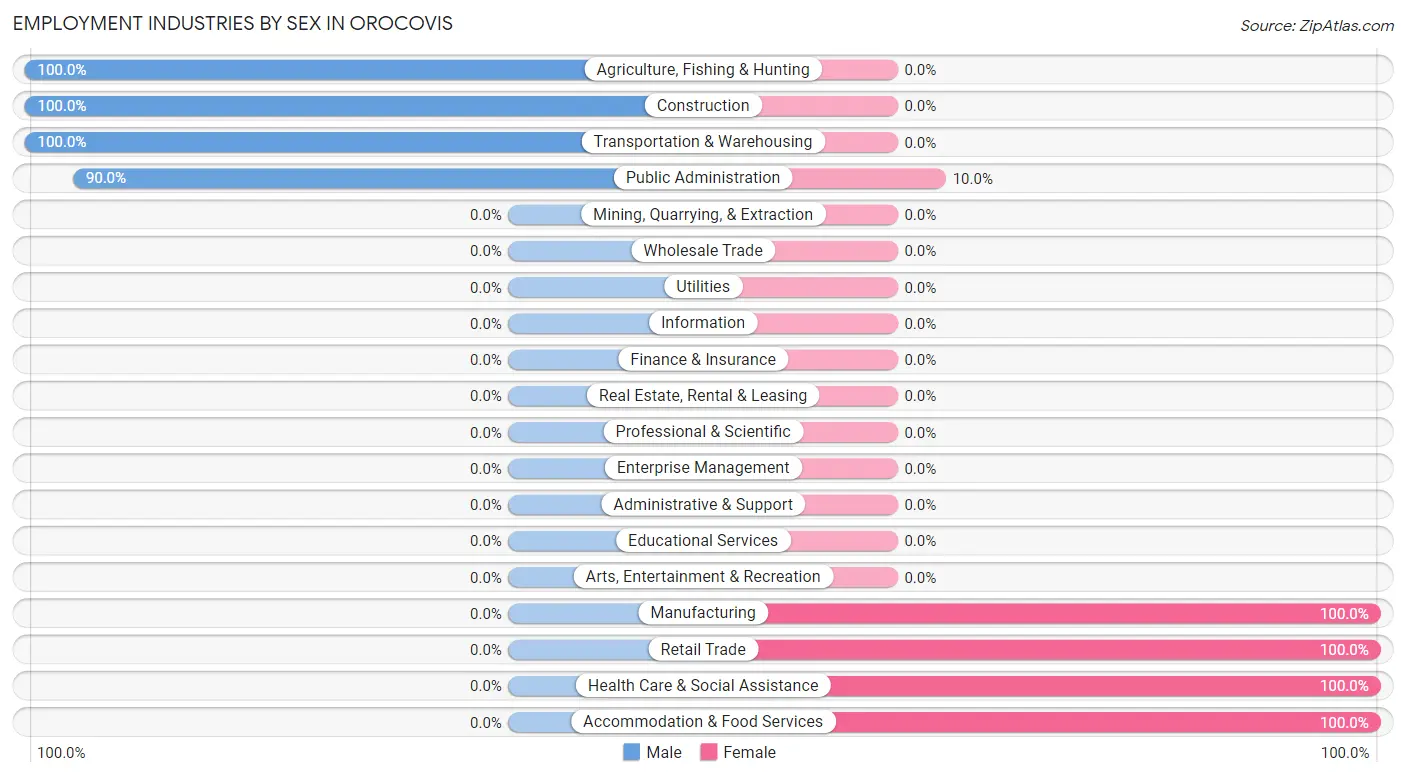
Employment Industries by Sex in Orocovis
The Orocovis industries that see more men than women are Agriculture, Fishing & Hunting (100.0%), Construction (100.0%), and Transportation & Warehousing (100.0%), whereas the industries that tend to have a higher number of women are Manufacturing (100.0%), Retail Trade (100.0%), and Health Care & Social Assistance (100.0%).
| Industry | Male | Female |
| Agriculture, Fishing & Hunting | 37 (100.0%) | 0 (0.0%) |
| Mining, Quarrying, & Extraction | 0 (0.0%) | 0 (0.0%) |
| Construction | 35 (100.0%) | 0 (0.0%) |
| Manufacturing | 0 (0.0%) | 41 (100.0%) |
| Wholesale Trade | 0 (0.0%) | 0 (0.0%) |
| Retail Trade | 0 (0.0%) | 53 (100.0%) |
| Transportation & Warehousing | 28 (100.0%) | 0 (0.0%) |
| Utilities | 0 (0.0%) | 0 (0.0%) |
| Information | 0 (0.0%) | 0 (0.0%) |
| Finance & Insurance | 0 (0.0%) | 0 (0.0%) |
| Real Estate, Rental & Leasing | 0 (0.0%) | 0 (0.0%) |
| Professional & Scientific | 0 (0.0%) | 0 (0.0%) |
| Enterprise Management | 0 (0.0%) | 0 (0.0%) |
| Administrative & Support | 0 (0.0%) | 0 (0.0%) |
| Educational Services | 0 (0.0%) | 0 (0.0%) |
| Health Care & Social Assistance | 0 (0.0%) | 82 (100.0%) |
| Arts, Entertainment & Recreation | 0 (0.0%) | 0 (0.0%) |
| Accommodation & Food Services | 0 (0.0%) | 27 (100.0%) |
| Public Administration | 72 (90.0%) | 8 (10.0%) |
| Total | 191 (47.5%) | 211 (52.5%) |
Education in Orocovis
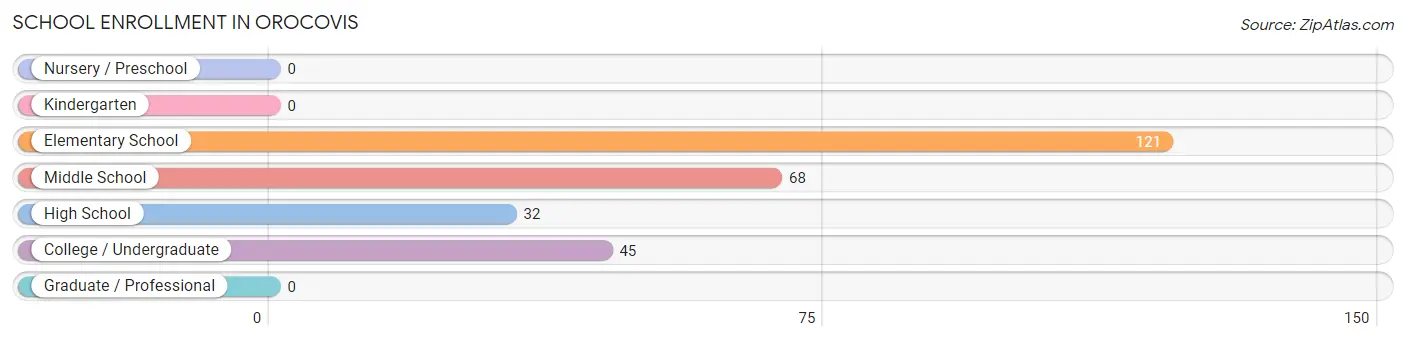
School Enrollment in Orocovis
The most common levels of schooling among the 266 students in Orocovis are elementary school (121 | 45.5%), middle school (68 | 25.6%), and college / undergraduate (45 | 16.9%).
| School Level | # Students | % Students |
| Nursery / Preschool | 0 | 0.0% |
| Kindergarten | 0 | 0.0% |
| Elementary School | 121 | 45.5% |
| Middle School | 68 | 25.6% |
| High School | 32 | 12.0% |
| College / Undergraduate | 45 | 16.9% |
| Graduate / Professional | 0 | 0.0% |
| Total | 266 | 100.0% |
School Enrollment by Age by Funding Source in Orocovis
Out of a total of 266 students who are enrolled in schools in Orocovis, 35 (13.2%) attend a private institution, while the remaining 231 (86.8%) are enrolled in public schools. The age group of 20 to 24 year olds has the highest likelihood of being enrolled in private schools, with 35 (52.2% in the age bracket) enrolled. Conversely, the age group of 5 to 9 year old has the lowest likelihood of being enrolled in a private school, with 91 (100.0% in the age bracket) attending a public institution.
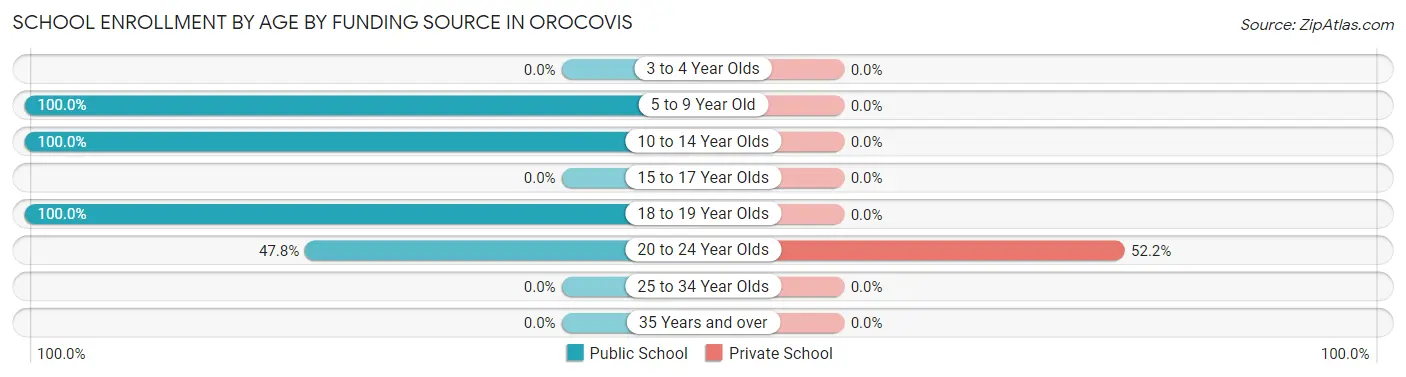
| Age Bracket | Public School | Private School |
| 3 to 4 Year Olds | 0 (0.0%) | 0 (0.0%) |
| 5 to 9 Year Old | 91 (100.0%) | 0 (0.0%) |
| 10 to 14 Year Olds | 98 (100.0%) | 0 (0.0%) |
| 15 to 17 Year Olds | 0 (0.0%) | 0 (0.0%) |
| 18 to 19 Year Olds | 10 (100.0%) | 0 (0.0%) |
| 20 to 24 Year Olds | 32 (47.8%) | 35 (52.2%) |
| 25 to 34 Year Olds | 0 (0.0%) | 0 (0.0%) |
| 35 Years and over | 0 (0.0%) | 0 (0.0%) |
| Total | 231 (86.8%) | 35 (13.2%) |
Educational Attainment by Field of Study in Orocovis
Science & technology (92 | 49.7%), business (47 | 25.4%), social sciences (14 | 7.6%), arts & humanities (14 | 7.6%), and education (13 | 7.0%) are the most common fields of study among 185 individuals in Orocovis who have obtained a bachelor's degree or higher.
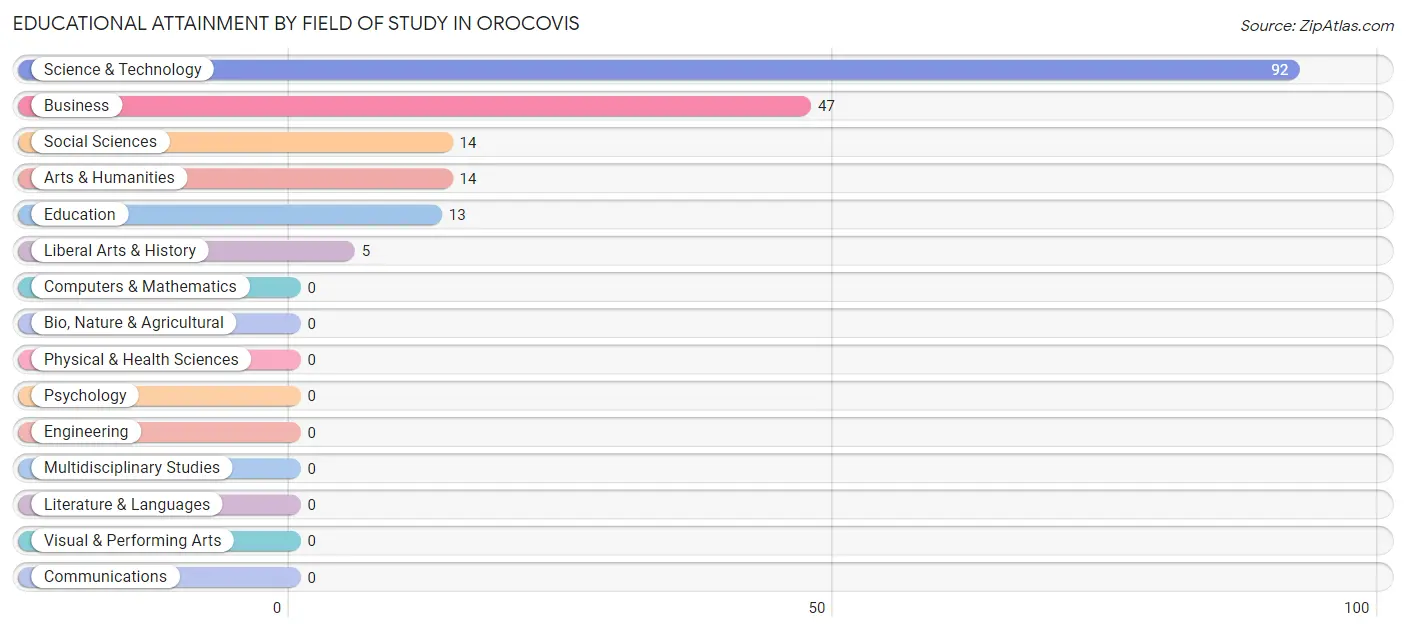
| Field of Study | # Graduates | % Graduates |
| Computers & Mathematics | 0 | 0.0% |
| Bio, Nature & Agricultural | 0 | 0.0% |
| Physical & Health Sciences | 0 | 0.0% |
| Psychology | 0 | 0.0% |
| Social Sciences | 14 | 7.6% |
| Engineering | 0 | 0.0% |
| Multidisciplinary Studies | 0 | 0.0% |
| Science & Technology | 92 | 49.7% |
| Business | 47 | 25.4% |
| Education | 13 | 7.0% |
| Literature & Languages | 0 | 0.0% |
| Liberal Arts & History | 5 | 2.7% |
| Visual & Performing Arts | 0 | 0.0% |
| Communications | 0 | 0.0% |
| Arts & Humanities | 14 | 7.6% |
| Total | 185 | 100.0% |
Transportation & Commute in Orocovis
Vehicle Availability by Sex in Orocovis
The most prevalent vehicle ownership categories in Orocovis are males with 1 vehicle (100, accounting for 54.0%) and females with 1 vehicle (49, making up 47.4%).
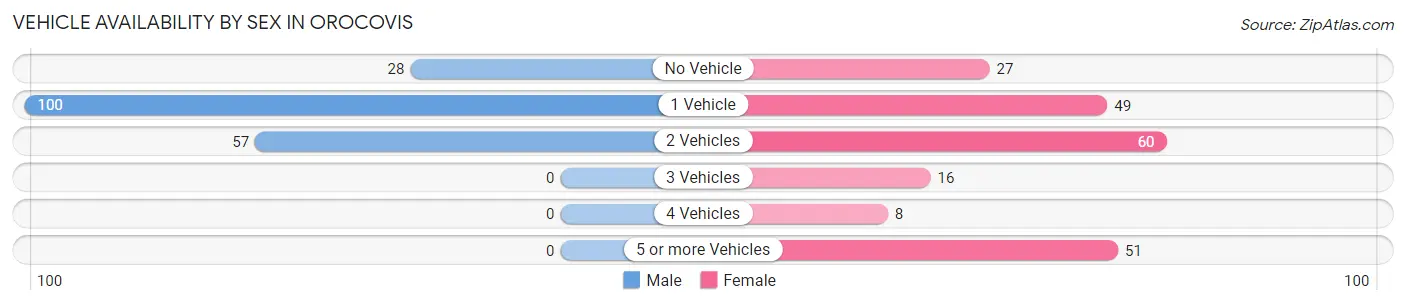
| Vehicles Available | Male | Female |
| No Vehicle | 28 (15.1%) | 27 (12.8%) |
| 1 Vehicle | 100 (54.0%) | 49 (23.2%) |
| 2 Vehicles | 57 (30.8%) | 60 (28.4%) |
| 3 Vehicles | 0 (0.0%) | 16 (7.6%) |
| 4 Vehicles | 0 (0.0%) | 8 (3.8%) |
| 5 or more Vehicles | 0 (0.0%) | 51 (24.2%) |
| Total | 185 (100.0%) | 211 (100.0%) |
Commute Time in Orocovis
The most frequently occuring commute durations in Orocovis are 10 to 14 minutes (151 commuters, 38.0%), 90 or more minutes (96 commuters, 24.2%), and 15 to 19 minutes (38 commuters, 9.6%).
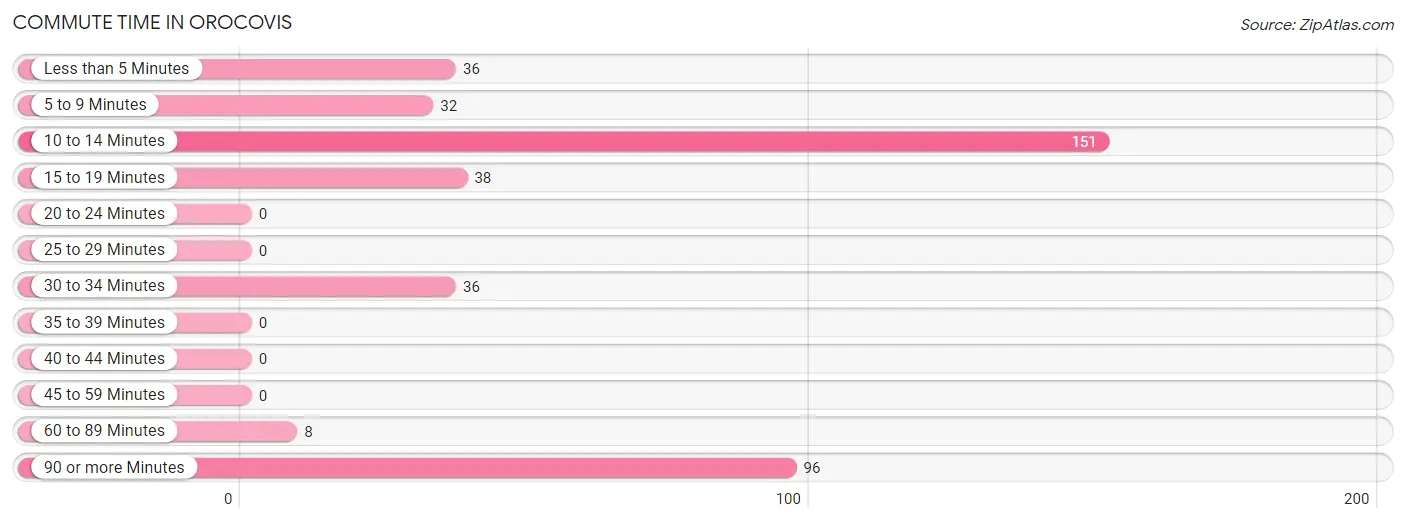
| Commute Time | # Commuters | % Commuters |
| Less than 5 Minutes | 36 | 9.1% |
| 5 to 9 Minutes | 32 | 8.1% |
| 10 to 14 Minutes | 151 | 38.0% |
| 15 to 19 Minutes | 38 | 9.6% |
| 20 to 24 Minutes | 0 | 0.0% |
| 25 to 29 Minutes | 0 | 0.0% |
| 30 to 34 Minutes | 36 | 9.1% |
| 35 to 39 Minutes | 0 | 0.0% |
| 40 to 44 Minutes | 0 | 0.0% |
| 45 to 59 Minutes | 0 | 0.0% |
| 60 to 89 Minutes | 8 | 2.0% |
| 90 or more Minutes | 96 | 24.2% |
Commute Time by Sex in Orocovis
The most common commute times in Orocovis are 90 or more minutes (96 commuters, 51.6%) for males and 10 to 14 minutes (97 commuters, 46.0%) for females.
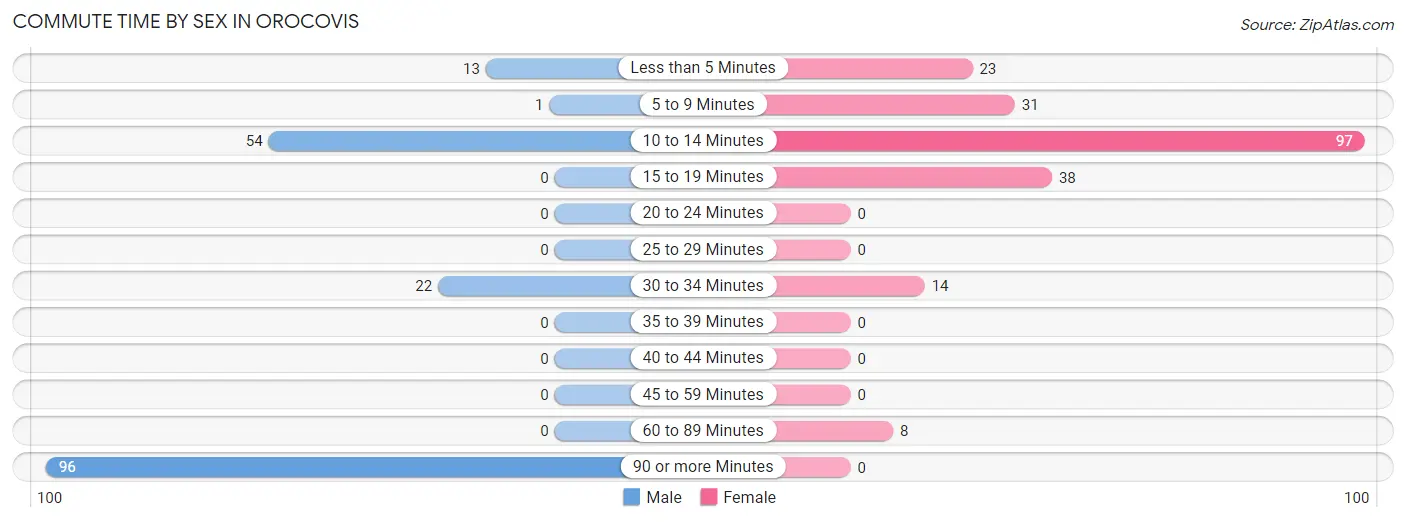
| Commute Time | Male | Female |
| Less than 5 Minutes | 13 (7.0%) | 23 (10.9%) |
| 5 to 9 Minutes | 1 (0.5%) | 31 (14.7%) |
| 10 to 14 Minutes | 54 (29.0%) | 97 (46.0%) |
| 15 to 19 Minutes | 0 (0.0%) | 38 (18.0%) |
| 20 to 24 Minutes | 0 (0.0%) | 0 (0.0%) |
| 25 to 29 Minutes | 0 (0.0%) | 0 (0.0%) |
| 30 to 34 Minutes | 22 (11.8%) | 14 (6.6%) |
| 35 to 39 Minutes | 0 (0.0%) | 0 (0.0%) |
| 40 to 44 Minutes | 0 (0.0%) | 0 (0.0%) |
| 45 to 59 Minutes | 0 (0.0%) | 0 (0.0%) |
| 60 to 89 Minutes | 0 (0.0%) | 8 (3.8%) |
| 90 or more Minutes | 96 (51.6%) | 0 (0.0%) |
Time of Departure to Work by Sex in Orocovis
The most frequent times of departure to work in Orocovis are 12:00 AM to 4:59 AM (96, 51.6%) for males and 8:00 AM to 8:29 AM (78, 37.0%) for females.
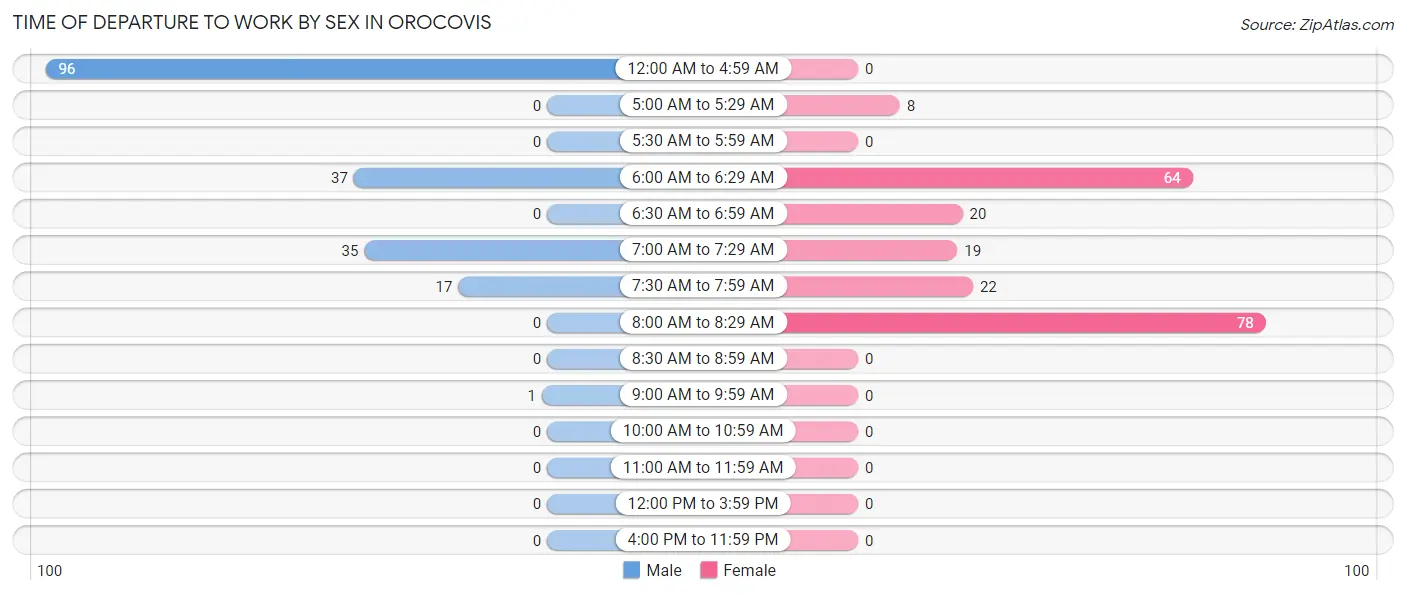
| Time of Departure | Male | Female |
| 12:00 AM to 4:59 AM | 96 (51.6%) | 0 (0.0%) |
| 5:00 AM to 5:29 AM | 0 (0.0%) | 8 (3.8%) |
| 5:30 AM to 5:59 AM | 0 (0.0%) | 0 (0.0%) |
| 6:00 AM to 6:29 AM | 37 (19.9%) | 64 (30.3%) |
| 6:30 AM to 6:59 AM | 0 (0.0%) | 20 (9.5%) |
| 7:00 AM to 7:29 AM | 35 (18.8%) | 19 (9.0%) |
| 7:30 AM to 7:59 AM | 17 (9.1%) | 22 (10.4%) |
| 8:00 AM to 8:29 AM | 0 (0.0%) | 78 (37.0%) |
| 8:30 AM to 8:59 AM | 0 (0.0%) | 0 (0.0%) |
| 9:00 AM to 9:59 AM | 1 (0.5%) | 0 (0.0%) |
| 10:00 AM to 10:59 AM | 0 (0.0%) | 0 (0.0%) |
| 11:00 AM to 11:59 AM | 0 (0.0%) | 0 (0.0%) |
| 12:00 PM to 3:59 PM | 0 (0.0%) | 0 (0.0%) |
| 4:00 PM to 11:59 PM | 0 (0.0%) | 0 (0.0%) |
| Total | 186 (100.0%) | 211 (100.0%) |
Housing Occupancy in Orocovis
Occupancy by Ownership in Orocovis
Of the total 443 dwellings in Orocovis, owner-occupied units account for 156 (35.2%), while renter-occupied units make up 287 (64.8%).
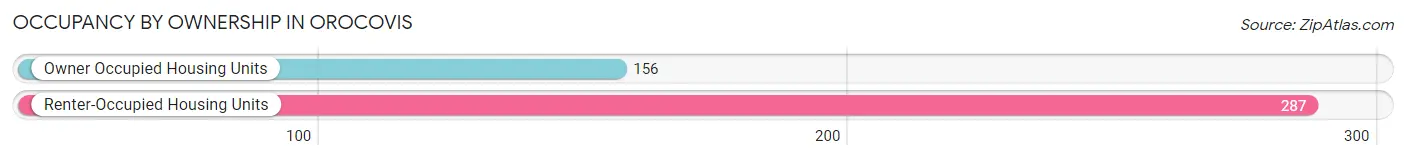
| Occupancy | # Housing Units | % Housing Units |
| Owner Occupied Housing Units | 156 | 35.2% |
| Renter-Occupied Housing Units | 287 | 64.8% |
| Total Occupied Housing Units | 443 | 100.0% |
Occupancy by Household Size in Orocovis
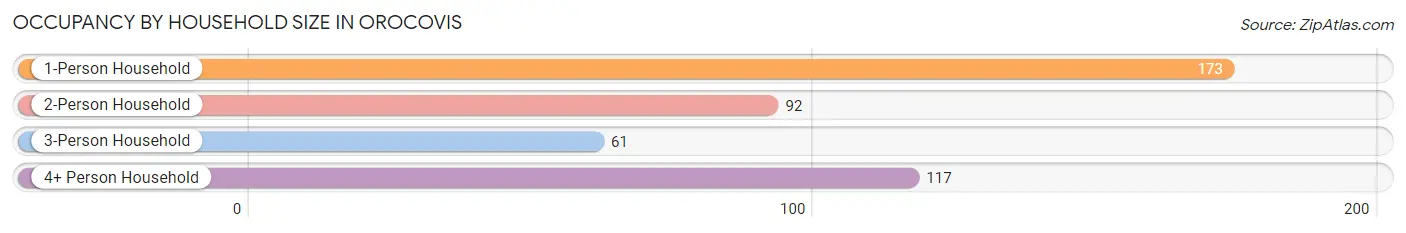
| Household Size | # Housing Units | % Housing Units |
| 1-Person Household | 173 | 39.1% |
| 2-Person Household | 92 | 20.8% |
| 3-Person Household | 61 | 13.8% |
| 4+ Person Household | 117 | 26.4% |
| Total Housing Units | 443 | 100.0% |
Occupancy by Ownership by Household Size in Orocovis
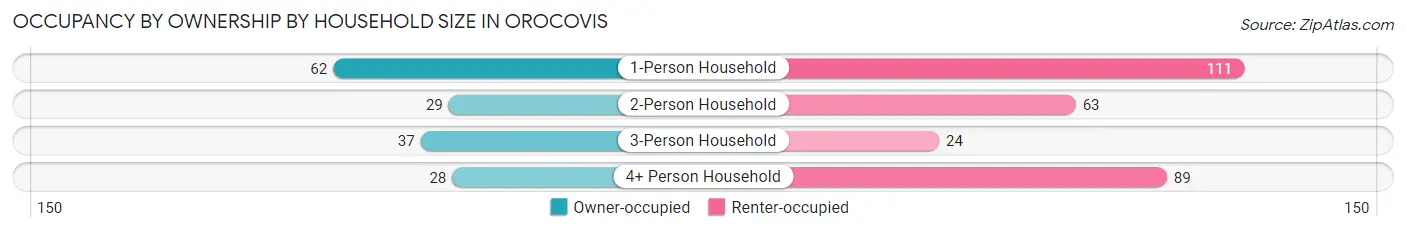
| Household Size | Owner-occupied | Renter-occupied |
| 1-Person Household | 62 (35.8%) | 111 (64.2%) |
| 2-Person Household | 29 (31.5%) | 63 (68.5%) |
| 3-Person Household | 37 (60.7%) | 24 (39.3%) |
| 4+ Person Household | 28 (23.9%) | 89 (76.1%) |
| Total Housing Units | 156 (35.2%) | 287 (64.8%) |
Occupancy by Educational Attainment in Orocovis
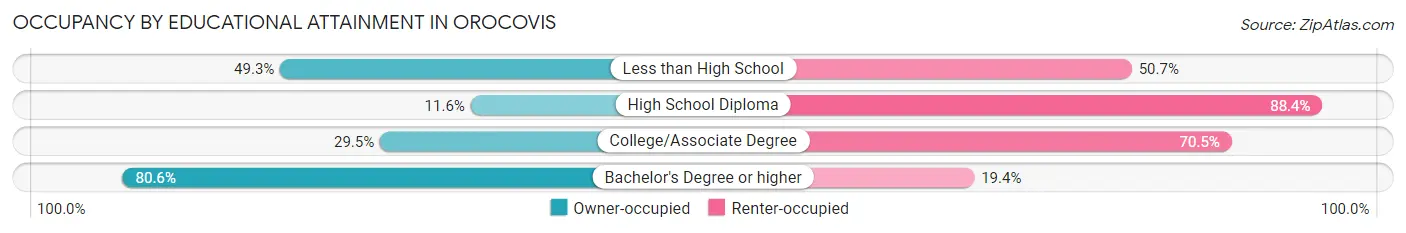
| Household Size | Owner-occupied | Renter-occupied |
| Less than High School | 37 (49.3%) | 38 (50.7%) |
| High School Diploma | 17 (11.6%) | 130 (88.4%) |
| College/Associate Degree | 44 (29.5%) | 105 (70.5%) |
| Bachelor's Degree or higher | 58 (80.6%) | 14 (19.4%) |
Occupancy by Age of Householder in Orocovis
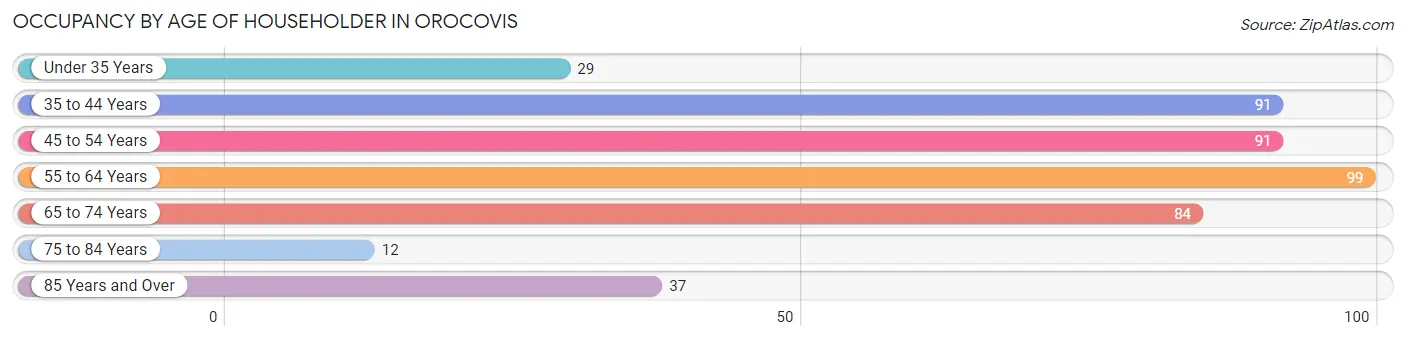
| Age Bracket | # Households | % Households |
| Under 35 Years | 29 | 6.6% |
| 35 to 44 Years | 91 | 20.5% |
| 45 to 54 Years | 91 | 20.5% |
| 55 to 64 Years | 99 | 22.4% |
| 65 to 74 Years | 84 | 19.0% |
| 75 to 84 Years | 12 | 2.7% |
| 85 Years and Over | 37 | 8.4% |
| Total | 443 | 100.0% |
Housing Finances in Orocovis
Median Income by Occupancy in Orocovis

| Occupancy Type | # Households | Median Income |
| Owner-Occupied | 156 (35.2%) | $13,542 |
| Renter-Occupied | 287 (64.8%) | $21,920 |
| Average | 443 (100.0%) | $20,045 |
Occupancy by Householder Income Bracket in Orocovis
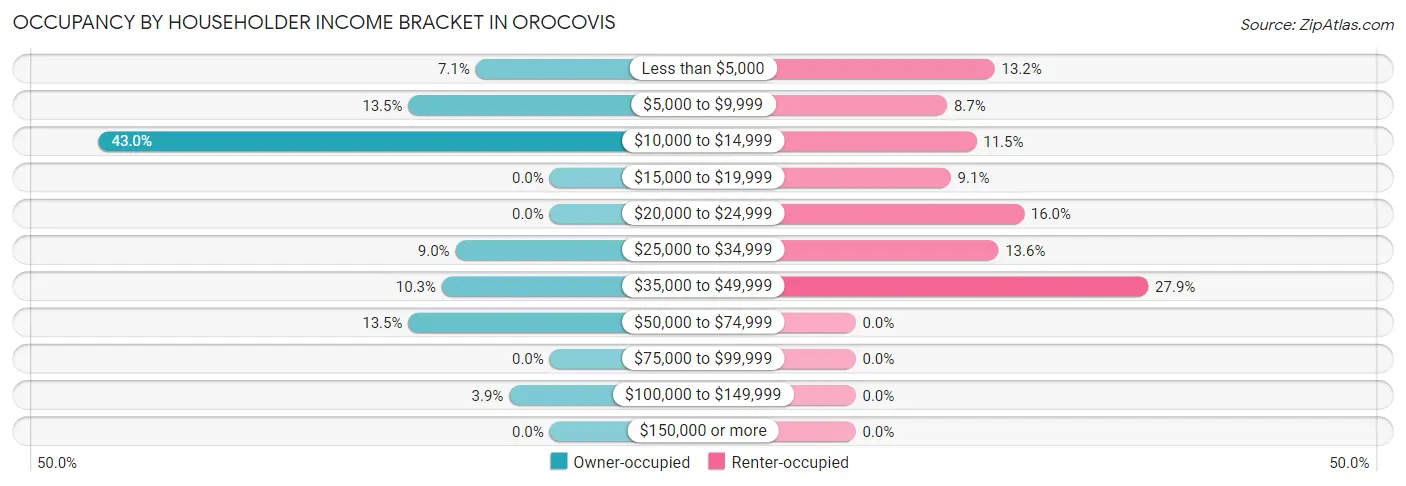
| Income Bracket | Owner-occupied | Renter-occupied |
| Less than $5,000 | 11 (7.0%) | 38 (13.2%) |
| $5,000 to $9,999 | 21 (13.5%) | 25 (8.7%) |
| $10,000 to $14,999 | 67 (42.9%) | 33 (11.5%) |
| $15,000 to $19,999 | 0 (0.0%) | 26 (9.1%) |
| $20,000 to $24,999 | 0 (0.0%) | 46 (16.0%) |
| $25,000 to $34,999 | 14 (9.0%) | 39 (13.6%) |
| $35,000 to $49,999 | 16 (10.3%) | 80 (27.9%) |
| $50,000 to $74,999 | 21 (13.5%) | 0 (0.0%) |
| $75,000 to $99,999 | 0 (0.0%) | 0 (0.0%) |
| $100,000 to $149,999 | 6 (3.8%) | 0 (0.0%) |
| $150,000 or more | 0 (0.0%) | 0 (0.0%) |
| Total | 156 (100.0%) | 287 (100.0%) |
Monthly Housing Cost Tiers in Orocovis
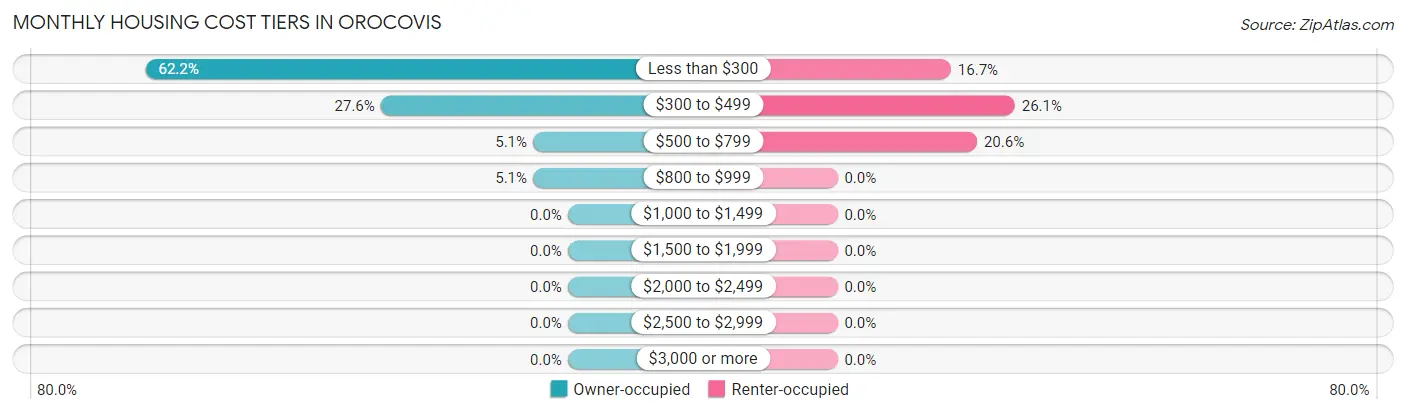
| Monthly Cost | Owner-occupied | Renter-occupied |
| Less than $300 | 97 (62.2%) | 48 (16.7%) |
| $300 to $499 | 43 (27.6%) | 75 (26.1%) |
| $500 to $799 | 8 (5.1%) | 59 (20.6%) |
| $800 to $999 | 8 (5.1%) | 0 (0.0%) |
| $1,000 to $1,499 | 0 (0.0%) | 0 (0.0%) |
| $1,500 to $1,999 | 0 (0.0%) | 0 (0.0%) |
| $2,000 to $2,499 | 0 (0.0%) | 0 (0.0%) |
| $2,500 to $2,999 | 0 (0.0%) | 0 (0.0%) |
| $3,000 or more | 0 (0.0%) | 0 (0.0%) |
| Total | 156 (100.0%) | 287 (100.0%) |
Physical Housing Characteristics in Orocovis
Housing Structures in Orocovis
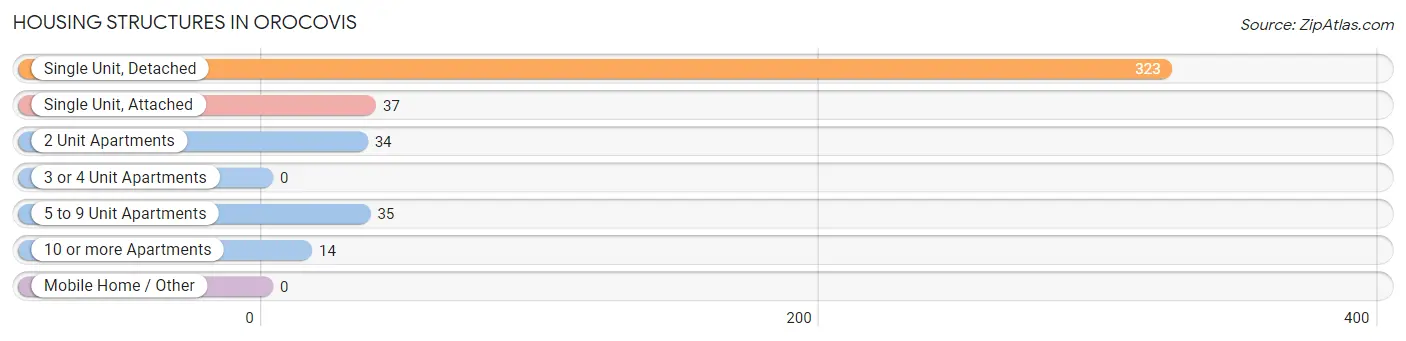
| Structure Type | # Housing Units | % Housing Units |
| Single Unit, Detached | 323 | 72.9% |
| Single Unit, Attached | 37 | 8.4% |
| 2 Unit Apartments | 34 | 7.7% |
| 3 or 4 Unit Apartments | 0 | 0.0% |
| 5 to 9 Unit Apartments | 35 | 7.9% |
| 10 or more Apartments | 14 | 3.2% |
| Mobile Home / Other | 0 | 0.0% |
| Total | 443 | 100.0% |
Housing Structures by Occupancy in Orocovis
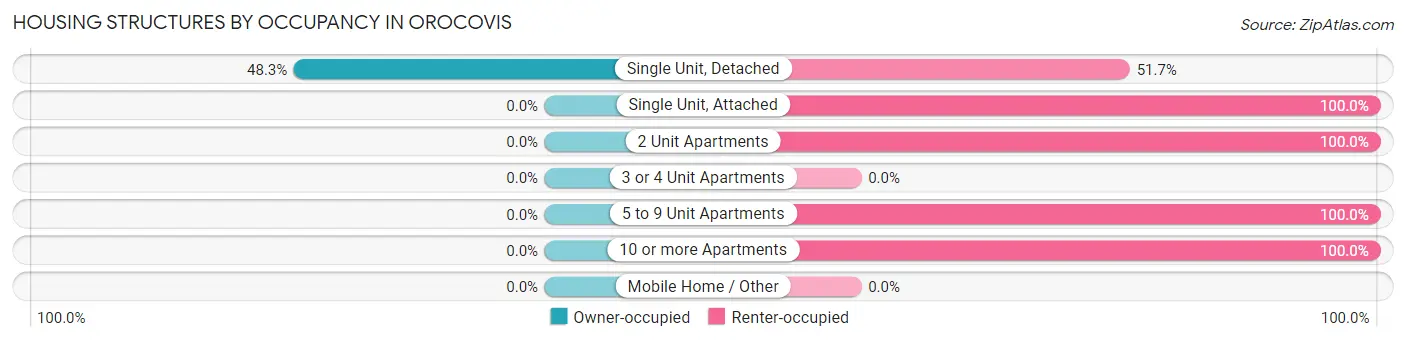
| Structure Type | Owner-occupied | Renter-occupied |
| Single Unit, Detached | 156 (48.3%) | 167 (51.7%) |
| Single Unit, Attached | 0 (0.0%) | 37 (100.0%) |
| 2 Unit Apartments | 0 (0.0%) | 34 (100.0%) |
| 3 or 4 Unit Apartments | 0 (0.0%) | 0 (0.0%) |
| 5 to 9 Unit Apartments | 0 (0.0%) | 35 (100.0%) |
| 10 or more Apartments | 0 (0.0%) | 14 (100.0%) |
| Mobile Home / Other | 0 (0.0%) | 0 (0.0%) |
| Total | 156 (35.2%) | 287 (64.8%) |
Housing Structures by Number of Rooms in Orocovis
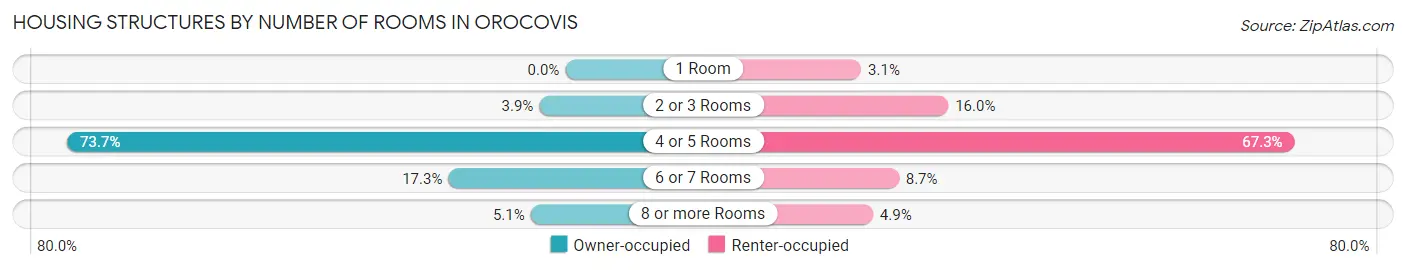
| Number of Rooms | Owner-occupied | Renter-occupied |
| 1 Room | 0 (0.0%) | 9 (3.1%) |
| 2 or 3 Rooms | 6 (3.8%) | 46 (16.0%) |
| 4 or 5 Rooms | 115 (73.7%) | 193 (67.2%) |
| 6 or 7 Rooms | 27 (17.3%) | 25 (8.7%) |
| 8 or more Rooms | 8 (5.1%) | 14 (4.9%) |
| Total | 156 (100.0%) | 287 (100.0%) |
Housing Structure by Heating Type in Orocovis
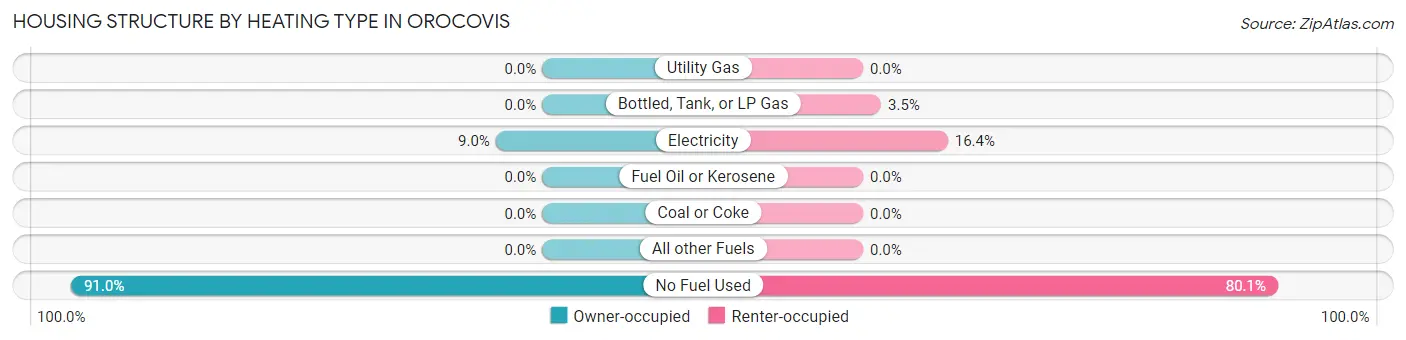
| Heating Type | Owner-occupied | Renter-occupied |
| Utility Gas | 0 (0.0%) | 0 (0.0%) |
| Bottled, Tank, or LP Gas | 0 (0.0%) | 10 (3.5%) |
| Electricity | 14 (9.0%) | 47 (16.4%) |
| Fuel Oil or Kerosene | 0 (0.0%) | 0 (0.0%) |
| Coal or Coke | 0 (0.0%) | 0 (0.0%) |
| All other Fuels | 0 (0.0%) | 0 (0.0%) |
| No Fuel Used | 142 (91.0%) | 230 (80.1%) |
| Total | 156 (100.0%) | 287 (100.0%) |
Household Vehicle Usage in Orocovis
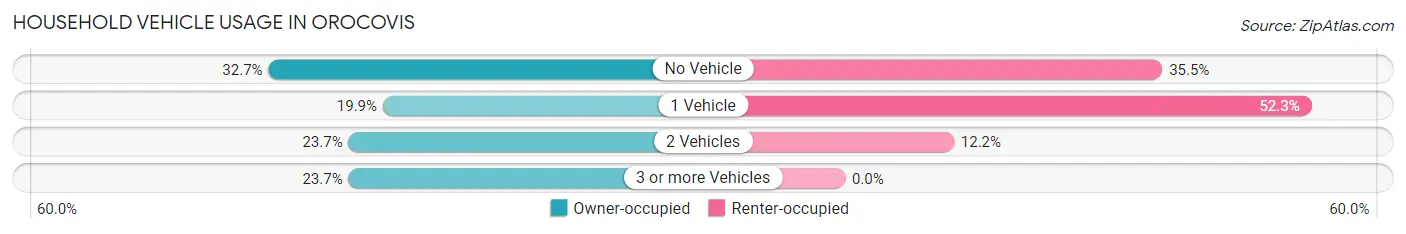
| Vehicles per Household | Owner-occupied | Renter-occupied |
| No Vehicle | 51 (32.7%) | 102 (35.5%) |
| 1 Vehicle | 31 (19.9%) | 150 (52.3%) |
| 2 Vehicles | 37 (23.7%) | 35 (12.2%) |
| 3 or more Vehicles | 37 (23.7%) | 0 (0.0%) |
| Total | 156 (100.0%) | 287 (100.0%) |
Real Estate & Mortgages in Orocovis
Real Estate and Mortgage Overview in Orocovis
| Characteristic | Without Mortgage | With Mortgage |
| Housing Units | 140 | 16 |
| Median Property Value | $83,600 | $0 |
| Median Household Income | $12,986 | $0 |
| Monthly Housing Costs | $130 | $0 |
| Real Estate Taxes | $1,022 | $8 |
Property Value by Mortgage Status in Orocovis
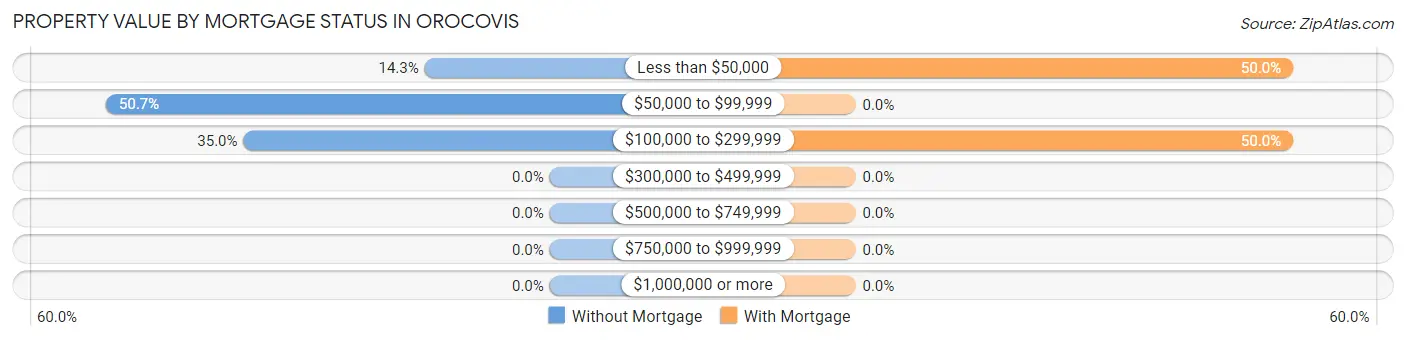
| Property Value | Without Mortgage | With Mortgage |
| Less than $50,000 | 20 (14.3%) | 8 (50.0%) |
| $50,000 to $99,999 | 71 (50.7%) | 0 (0.0%) |
| $100,000 to $299,999 | 49 (35.0%) | 8 (50.0%) |
| $300,000 to $499,999 | 0 (0.0%) | 0 (0.0%) |
| $500,000 to $749,999 | 0 (0.0%) | 0 (0.0%) |
| $750,000 to $999,999 | 0 (0.0%) | 0 (0.0%) |
| $1,000,000 or more | 0 (0.0%) | 0 (0.0%) |
| Total | 140 (100.0%) | 16 (100.0%) |
Household Income by Mortgage Status in Orocovis
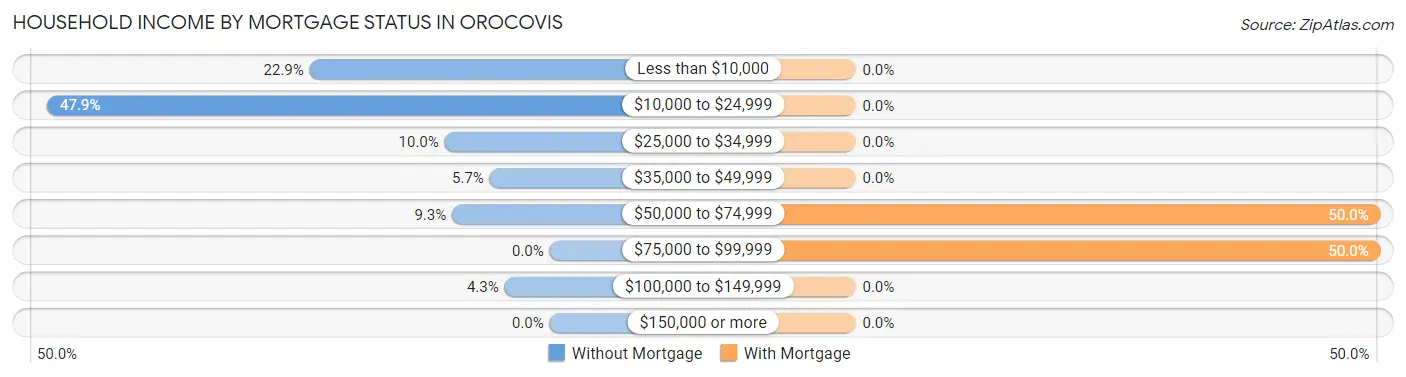
| Household Income | Without Mortgage | With Mortgage |
| Less than $10,000 | 32 (22.9%) | 0 (0.0%) |
| $10,000 to $24,999 | 67 (47.9%) | 0 (0.0%) |
| $25,000 to $34,999 | 14 (10.0%) | 0 (0.0%) |
| $35,000 to $49,999 | 8 (5.7%) | 0 (0.0%) |
| $50,000 to $74,999 | 13 (9.3%) | 8 (50.0%) |
| $75,000 to $99,999 | 0 (0.0%) | 8 (50.0%) |
| $100,000 to $149,999 | 6 (4.3%) | 0 (0.0%) |
| $150,000 or more | 0 (0.0%) | 0 (0.0%) |
| Total | 140 (100.0%) | 16 (100.0%) |
Property Value to Household Income Ratio in Orocovis
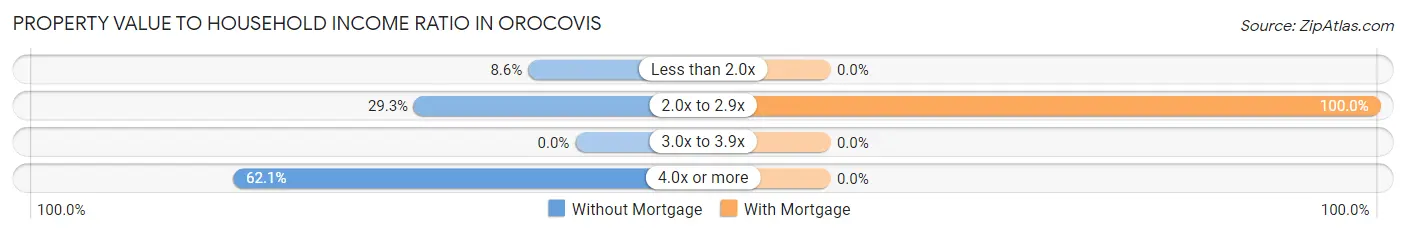
| Value-to-Income Ratio | Without Mortgage | With Mortgage |
| Less than 2.0x | 12 (8.6%) | 0 (0.0%) |
| 2.0x to 2.9x | 41 (29.3%) | 16 (100.0%) |
| 3.0x to 3.9x | 0 (0.0%) | 0 (0.0%) |
| 4.0x or more | 87 (62.1%) | 0 (0.0%) |
| Total | 140 (100.0%) | 16 (100.0%) |
Real Estate Taxes by Mortgage Status in Orocovis
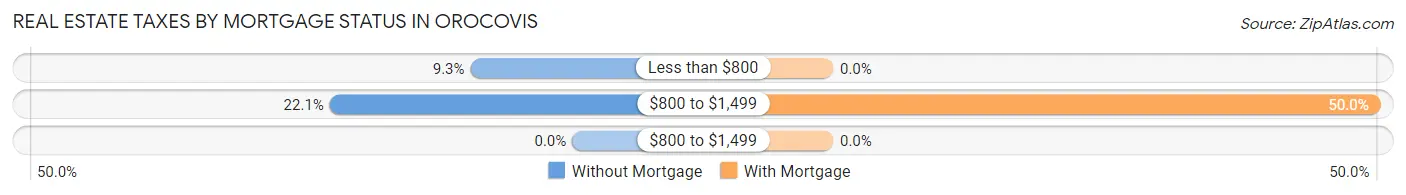
| Property Taxes | Without Mortgage | With Mortgage |
| Less than $800 | 13 (9.3%) | 0 (0.0%) |
| $800 to $1,499 | 31 (22.1%) | 8 (50.0%) |
| $800 to $1,499 | 0 (0.0%) | 0 (0.0%) |
| Total | 140 (100.0%) | 16 (100.0%) |
Health & Disability in Orocovis
Health Insurance Coverage by Age in Orocovis
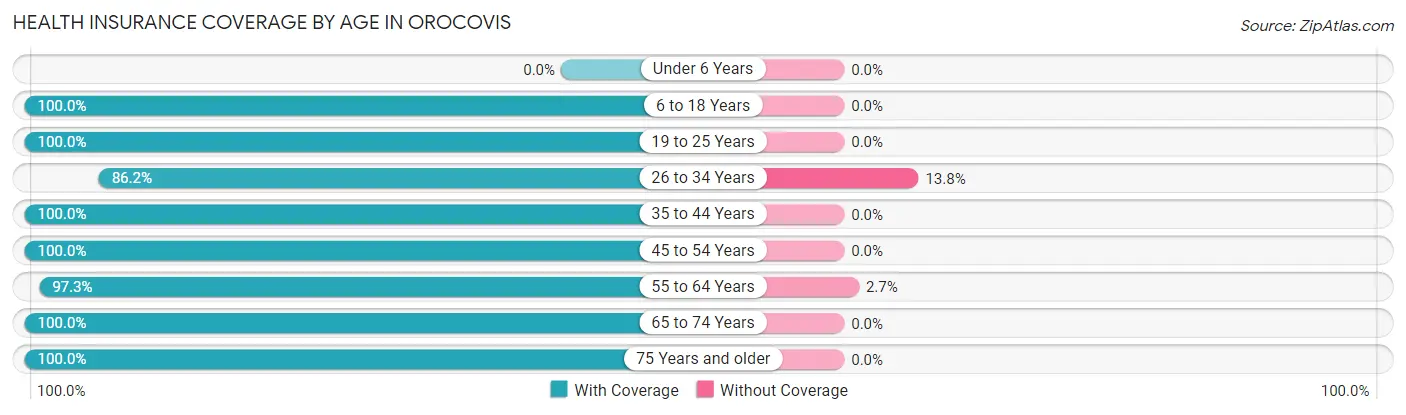
| Age Bracket | With Coverage | Without Coverage |
| Under 6 Years | 0 (0.0%) | 0 (0.0%) |
| 6 to 18 Years | 224 (100.0%) | 0 (0.0%) |
| 19 to 25 Years | 137 (100.0%) | 0 (0.0%) |
| 26 to 34 Years | 81 (86.2%) | 13 (13.8%) |
| 35 to 44 Years | 198 (100.0%) | 0 (0.0%) |
| 45 to 54 Years | 195 (100.0%) | 0 (0.0%) |
| 55 to 64 Years | 214 (97.3%) | 6 (2.7%) |
| 65 to 74 Years | 146 (100.0%) | 0 (0.0%) |
| 75 Years and older | 50 (100.0%) | 0 (0.0%) |
| Total | 1,245 (98.5%) | 19 (1.5%) |
Health Insurance Coverage by Citizenship Status in Orocovis
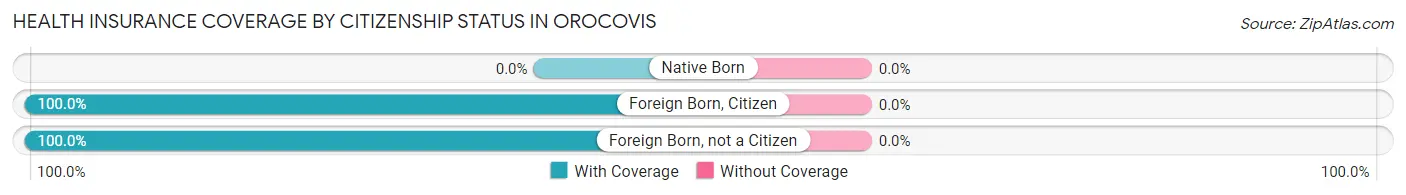
| Citizenship Status | With Coverage | Without Coverage |
| Native Born | 0 (0.0%) | 0 (0.0%) |
| Foreign Born, Citizen | 224 (100.0%) | 0 (0.0%) |
| Foreign Born, not a Citizen | 137 (100.0%) | 0 (0.0%) |
Health Insurance Coverage by Household Income in Orocovis
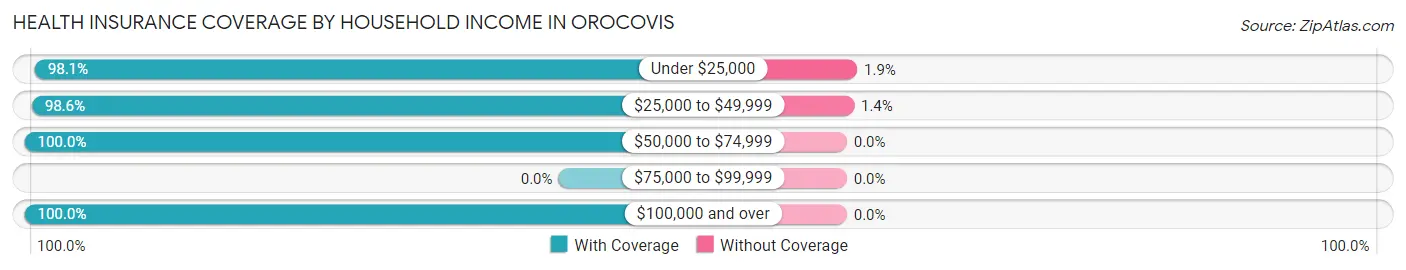
| Household Income | With Coverage | Without Coverage |
| Under $25,000 | 659 (98.1%) | 13 (1.9%) |
| $25,000 to $49,999 | 436 (98.6%) | 6 (1.4%) |
| $50,000 to $74,999 | 118 (100.0%) | 0 (0.0%) |
| $75,000 to $99,999 | 0 (0.0%) | 0 (0.0%) |
| $100,000 and over | 25 (100.0%) | 0 (0.0%) |
Public vs Private Health Insurance Coverage by Age in Orocovis
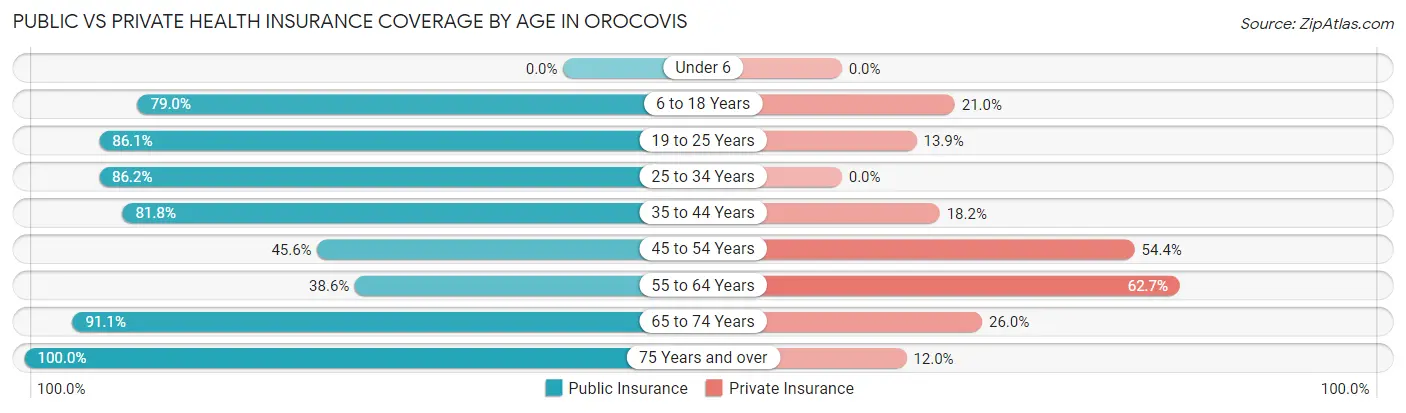
| Age Bracket | Public Insurance | Private Insurance |
| Under 6 | 0 (0.0%) | 0 (0.0%) |
| 6 to 18 Years | 177 (79.0%) | 47 (21.0%) |
| 19 to 25 Years | 118 (86.1%) | 19 (13.9%) |
| 25 to 34 Years | 81 (86.2%) | 0 (0.0%) |
| 35 to 44 Years | 162 (81.8%) | 36 (18.2%) |
| 45 to 54 Years | 89 (45.6%) | 106 (54.4%) |
| 55 to 64 Years | 85 (38.6%) | 138 (62.7%) |
| 65 to 74 Years | 133 (91.1%) | 38 (26.0%) |
| 75 Years and over | 50 (100.0%) | 6 (12.0%) |
| Total | 895 (70.8%) | 390 (30.8%) |
Disability Status by Sex by Age in Orocovis
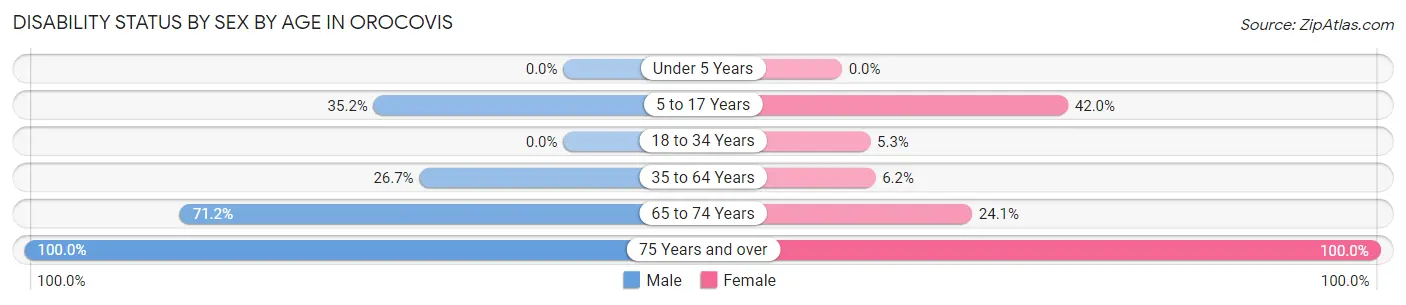
| Age Bracket | Male | Female |
| Under 5 Years | 0 (0.0%) | 0 (0.0%) |
| 5 to 17 Years | 25 (35.2%) | 60 (42.0%) |
| 18 to 34 Years | 0 (0.0%) | 10 (5.3%) |
| 35 to 64 Years | 82 (26.7%) | 19 (6.2%) |
| 65 to 74 Years | 42 (71.2%) | 21 (24.1%) |
| 75 Years and over | 1 (100.0%) | 49 (100.0%) |
Disability Class by Sex by Age in Orocovis
Disability Class: Hearing Difficulty
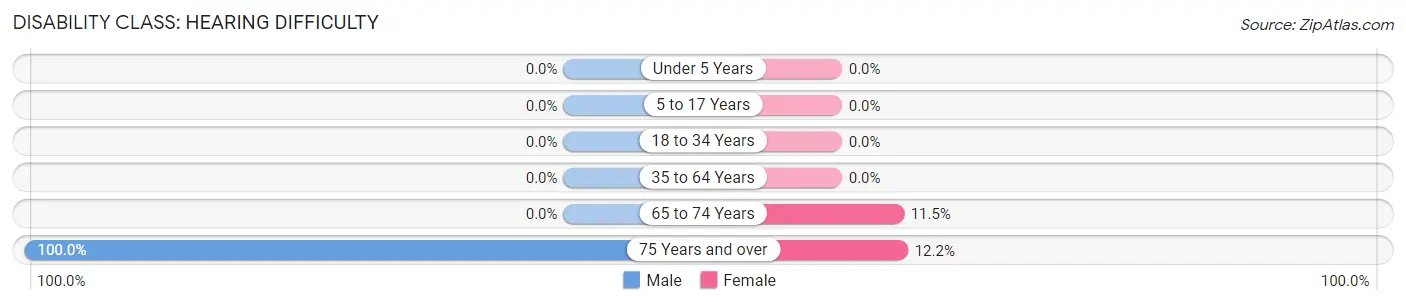
| Age Bracket | Male | Female |
| Under 5 Years | 0 (0.0%) | 0 (0.0%) |
| 5 to 17 Years | 0 (0.0%) | 0 (0.0%) |
| 18 to 34 Years | 0 (0.0%) | 0 (0.0%) |
| 35 to 64 Years | 0 (0.0%) | 0 (0.0%) |
| 65 to 74 Years | 0 (0.0%) | 10 (11.5%) |
| 75 Years and over | 1 (100.0%) | 6 (12.2%) |
Disability Class: Vision Difficulty
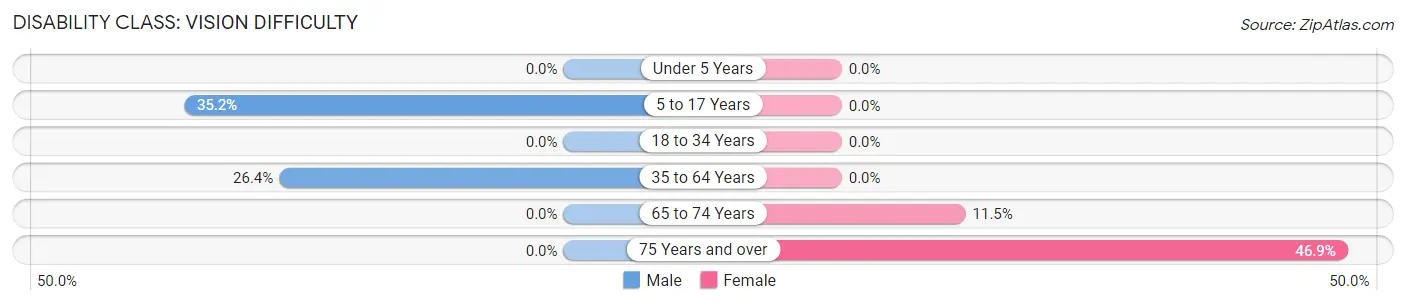
| Age Bracket | Male | Female |
| Under 5 Years | 0 (0.0%) | 0 (0.0%) |
| 5 to 17 Years | 25 (35.2%) | 0 (0.0%) |
| 18 to 34 Years | 0 (0.0%) | 0 (0.0%) |
| 35 to 64 Years | 81 (26.4%) | 0 (0.0%) |
| 65 to 74 Years | 0 (0.0%) | 10 (11.5%) |
| 75 Years and over | 0 (0.0%) | 23 (46.9%) |
Disability Class: Cognitive Difficulty
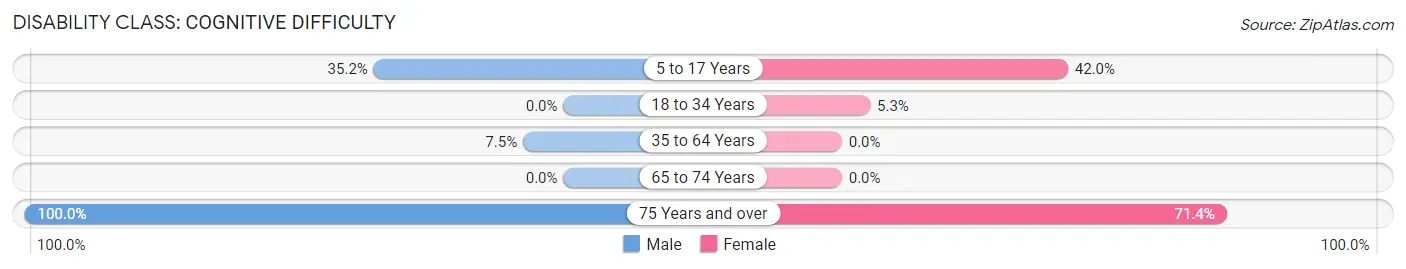
| Age Bracket | Male | Female |
| 5 to 17 Years | 25 (35.2%) | 60 (42.0%) |
| 18 to 34 Years | 0 (0.0%) | 10 (5.3%) |
| 35 to 64 Years | 23 (7.5%) | 0 (0.0%) |
| 65 to 74 Years | 0 (0.0%) | 0 (0.0%) |
| 75 Years and over | 1 (100.0%) | 35 (71.4%) |
Disability Class: Ambulatory Difficulty
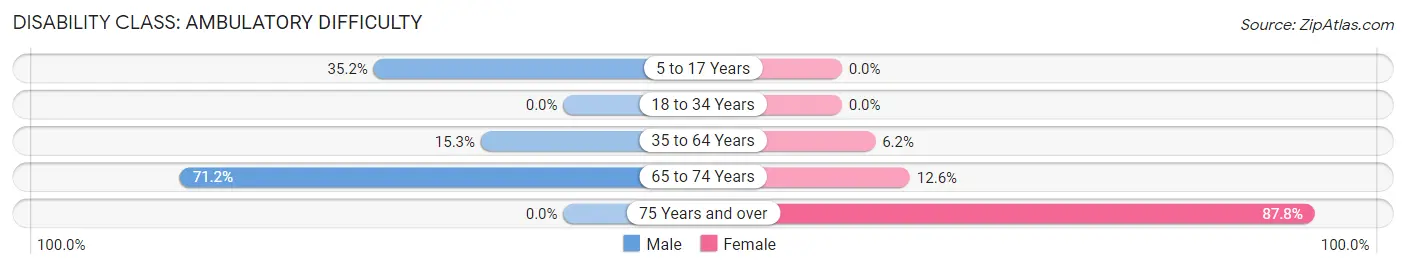
| Age Bracket | Male | Female |
| 5 to 17 Years | 25 (35.2%) | 0 (0.0%) |
| 18 to 34 Years | 0 (0.0%) | 0 (0.0%) |
| 35 to 64 Years | 47 (15.3%) | 19 (6.2%) |
| 65 to 74 Years | 42 (71.2%) | 11 (12.6%) |
| 75 Years and over | 0 (0.0%) | 43 (87.8%) |
Disability Class: Self-Care Difficulty
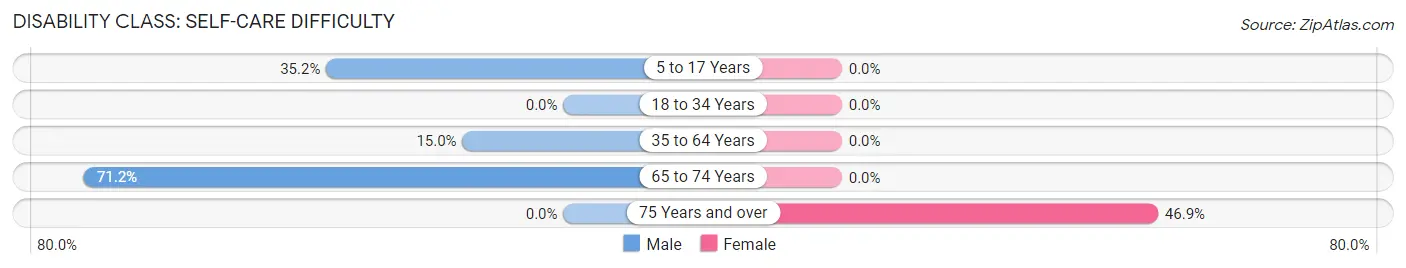
| Age Bracket | Male | Female |
| 5 to 17 Years | 25 (35.2%) | 0 (0.0%) |
| 18 to 34 Years | 0 (0.0%) | 0 (0.0%) |
| 35 to 64 Years | 46 (15.0%) | 0 (0.0%) |
| 65 to 74 Years | 42 (71.2%) | 0 (0.0%) |
| 75 Years and over | 0 (0.0%) | 23 (46.9%) |
Technology Access in Orocovis
Computing Device Access in Orocovis
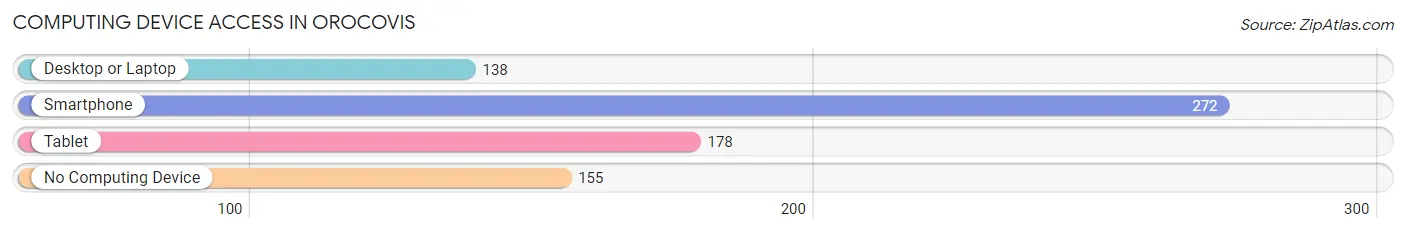
| Device Type | # Households | % Households |
| Desktop or Laptop | 138 | 31.1% |
| Smartphone | 272 | 61.4% |
| Tablet | 178 | 40.2% |
| No Computing Device | 155 | 35.0% |
| Total | 443 | 100.0% |
Internet Access in Orocovis
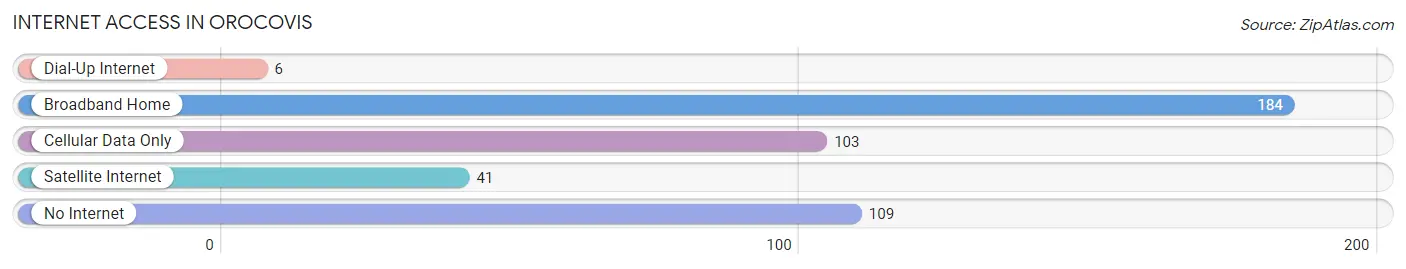
| Internet Type | # Households | % Households |
| Dial-Up Internet | 6 | 1.3% |
| Broadband Home | 184 | 41.5% |
| Cellular Data Only | 103 | 23.3% |
| Satellite Internet | 41 | 9.3% |
| No Internet | 109 | 24.6% |
| Total | 443 | 100.0% |
Orocovis Summary
Orocovis is a municipality located in the central region of Puerto Rico, in the Cordillera Central mountain range. It is part of the San Juan-Caguas-Guaynabo Metropolitan Statistical Area. The town is known as the “Heart of the Island” due to its central location. As of the 2010 census, the population of Orocovis was 24,521.
Geography
Orocovis is located in the Cordillera Central mountain range, in the center of Puerto Rico. It is bordered by the municipalities of Barranquitas to the north, Morovis to the east, Villalba to the south, and Corozal and Naranjito to the west. The town is located at an elevation of 1,000 feet (305 m) above sea level. The terrain is mostly mountainous, with some flat areas in the lower elevations. The highest point in the municipality is Cerro La Santa, at 2,922 feet (891 m).
The climate in Orocovis is tropical, with an average temperature of 79°F (26°C). The average annual precipitation is 64 inches (1,630 mm).
History
The area of Orocovis was originally inhabited by the Taíno people. The first Spanish settlers arrived in the area in the 16th century. The town was founded in 1793 and named after the Taíno chief Orocobix.
In the 19th century, the town was an important center of the coffee industry. The economy of the town was further diversified in the 20th century with the development of the tobacco and sugar industries.
Economy
The economy of Orocovis is mainly based on agriculture and tourism. The main agricultural products are coffee, tobacco, sugar cane, and fruits. The town is also home to several small manufacturing companies.
Tourism is an important part of the economy of Orocovis. The town is home to several attractions, including the Orocovis Dam, the Orocovis River, and the Cerro La Santa mountain.
Demographics
As of the 2010 census, the population of Orocovis was 24,521. The population is mostly of mixed European and Taíno descent. The majority of the population is Roman Catholic.
The median household income in Orocovis is $17,845, and the median family income is $20,945. The unemployment rate is 11.3%.
Education
Orocovis is served by the Puerto Rico Department of Education. The town has several public schools, including the Escuela Superior Orocovis, the Escuela Intermedia Orocovis, and the Escuela Primaria Orocovis. The town also has several private schools, including the Colegio San Antonio de Padua and the Colegio San José.
Conclusion
Orocovis is a municipality located in the central region of Puerto Rico. It is known as the “Heart of the Island” due to its central location. The economy of the town is mainly based on agriculture and tourism. The population of Orocovis is mostly of mixed European and Taíno descent. The town is served by the Puerto Rico Department of Education and has several public and private schools.
Common Questions
What is Per Capita Income in Orocovis?
Per Capita income in Orocovis is $10,364.
What is the Median Family Income in Orocovis?
Median Family Income in Orocovis is $17,107.
What is the Median Household income in Orocovis?
Median Household Income in Orocovis is $20,045.
What is Income or Wage Gap in Orocovis?
Income or Wage Gap in Orocovis is 16.4%.
Women in Orocovis earn 83.6 cents for every dollar earned by a man.
What is Inequality or Gini Index in Orocovis?
Inequality or Gini Index in Orocovis is 0.42.
What is the Total Population of Orocovis?
Total Population of Orocovis is 1,264.
What is the Total Male Population of Orocovis?
Total Male Population of Orocovis is 489.
What is the Total Female Population of Orocovis?
Total Female Population of Orocovis is 775.
What is the Ratio of Males per 100 Females in Orocovis?
There are 63.10 Males per 100 Females in Orocovis.
What is the Ratio of Females per 100 Males in Orocovis?
There are 158.49 Females per 100 Males in Orocovis.
What is the Median Population Age in Orocovis?
Median Population Age in Orocovis is 42.0 Years.
What is the Average Family Size in Orocovis
Average Family Size in Orocovis is 3.7 People.
What is the Average Household Size in Orocovis
Average Household Size in Orocovis is 2.8 People.
How Large is the Labor Force in Orocovis?
There are 431 People in the Labor Forcein in Orocovis.
What is the Percentage of People in the Labor Force in Orocovis?
40.1% of People are in the Labor Force in Orocovis.
What is the Unemployment Rate in Orocovis?
Unemployment Rate in Orocovis is 6.7%.