Maunabo, PR Map & Demographics
Maunabo Map
Maunabo Overview
$10,617
PER CAPITA INCOME
$25,263
AVG FAMILY INCOME
$19,821
AVG HOUSEHOLD INCOME
$14,507
FAMILY INCOME DEFICIT
0.51
INEQUALITY / GINI INDEX
1,584
TOTAL POPULATION
820
MALE POPULATION
764
FEMALE POPULATION
107.33
MALES / 100 FEMALES
93.17
FEMALES / 100 MALES
45.1
MEDIAN AGE
3.1
AVG FAMILY SIZE
2.7
AVG HOUSEHOLD SIZE
513
LABOR FORCE [ PEOPLE ]
36.8%
PERCENT IN LABOR FORCE
38.0%
UNEMPLOYMENT RATE
Maunabo Zip Codes
Income in Maunabo
Income Overview in Maunabo
Per Capita Income in Maunabo is $10,617, while median incomes of families and households are $25,263 and $19,821 respectively.
| Characteristic | Number | Measure |
| Per Capita Income | 1,584 | $10,617 |
| Median Family Income | 472 | $25,263 |
| Mean Family Income | 472 | $29,957 |
| Median Household Income | 583 | $19,821 |
| Mean Household Income | 583 | $25,651 |
| Income Deficit | 472 | $14,507 |
| Wage / Income Gap (%) | 1,584 | 0.00% |
| Wage / Income Gap ($) | 1,584 | 100.00¢ per $1 |
| Gini / Inequality Index | 1,584 | 0.51 |
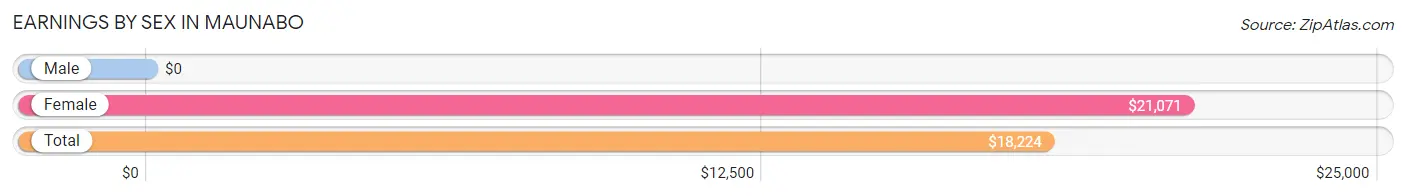
Earnings by Sex in Maunabo
| Sex | Number | Average Earnings |
| Male | 223 (60.8%) | $0 |
| Female | 144 (39.2%) | $21,071 |
| Total | 367 (100.0%) | $18,224 |
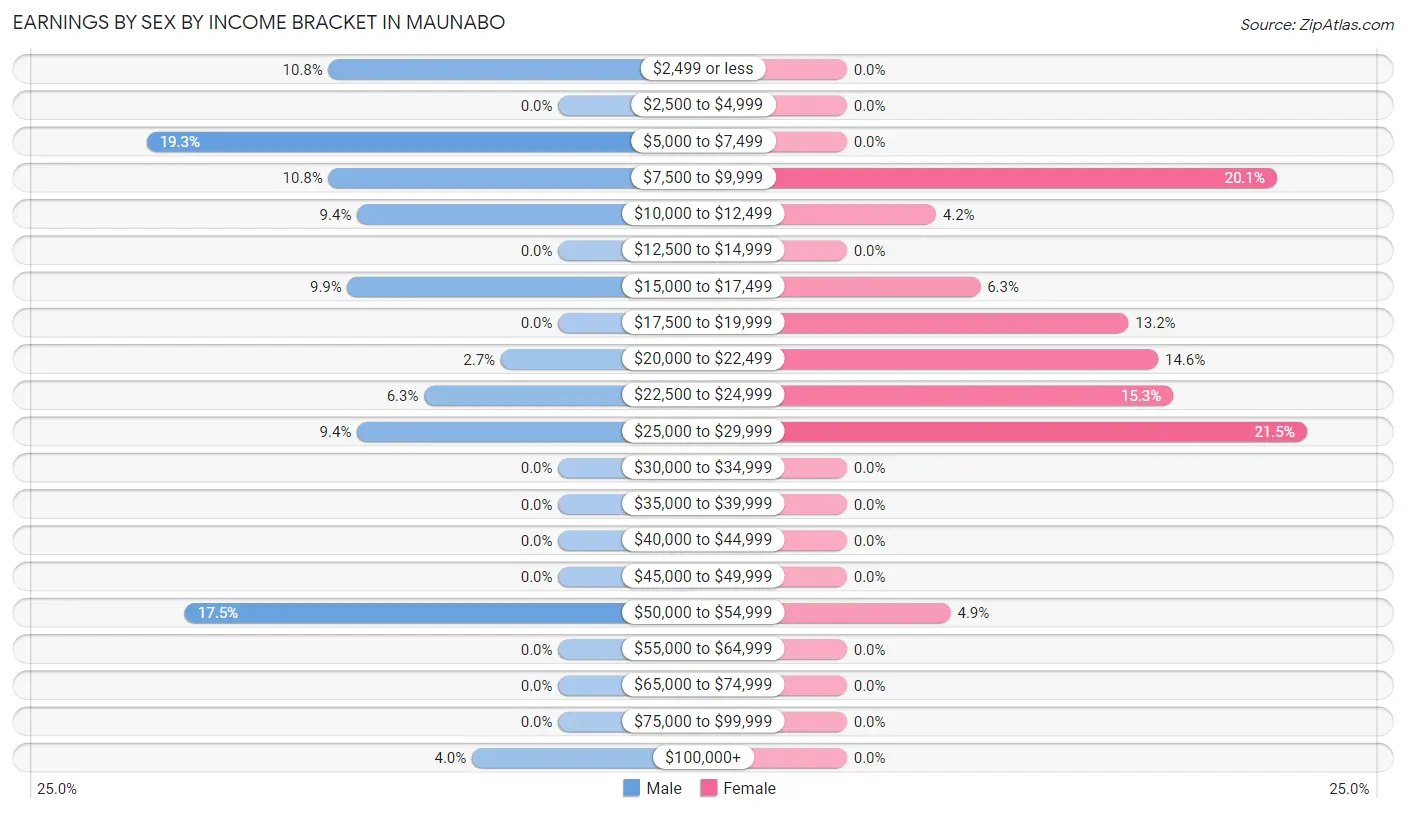
Earnings by Sex by Income Bracket in Maunabo
The most common earnings brackets in Maunabo are $5,000 to $7,499 for men (43 | 19.3%) and $25,000 to $29,999 for women (31 | 21.5%).
| Income | Male | Female |
| $2,499 or less | 24 (10.8%) | 0 (0.0%) |
| $2,500 to $4,999 | 0 (0.0%) | 0 (0.0%) |
| $5,000 to $7,499 | 43 (19.3%) | 0 (0.0%) |
| $7,500 to $9,999 | 24 (10.8%) | 29 (20.1%) |
| $10,000 to $12,499 | 21 (9.4%) | 6 (4.2%) |
| $12,500 to $14,999 | 0 (0.0%) | 0 (0.0%) |
| $15,000 to $17,499 | 22 (9.9%) | 9 (6.2%) |
| $17,500 to $19,999 | 0 (0.0%) | 19 (13.2%) |
| $20,000 to $22,499 | 6 (2.7%) | 21 (14.6%) |
| $22,500 to $24,999 | 14 (6.3%) | 22 (15.3%) |
| $25,000 to $29,999 | 21 (9.4%) | 31 (21.5%) |
| $30,000 to $34,999 | 0 (0.0%) | 0 (0.0%) |
| $35,000 to $39,999 | 0 (0.0%) | 0 (0.0%) |
| $40,000 to $44,999 | 0 (0.0%) | 0 (0.0%) |
| $45,000 to $49,999 | 0 (0.0%) | 0 (0.0%) |
| $50,000 to $54,999 | 39 (17.5%) | 7 (4.9%) |
| $55,000 to $64,999 | 0 (0.0%) | 0 (0.0%) |
| $65,000 to $74,999 | 0 (0.0%) | 0 (0.0%) |
| $75,000 to $99,999 | 0 (0.0%) | 0 (0.0%) |
| $100,000+ | 9 (4.0%) | 0 (0.0%) |
| Total | 223 (100.0%) | 144 (100.0%) |
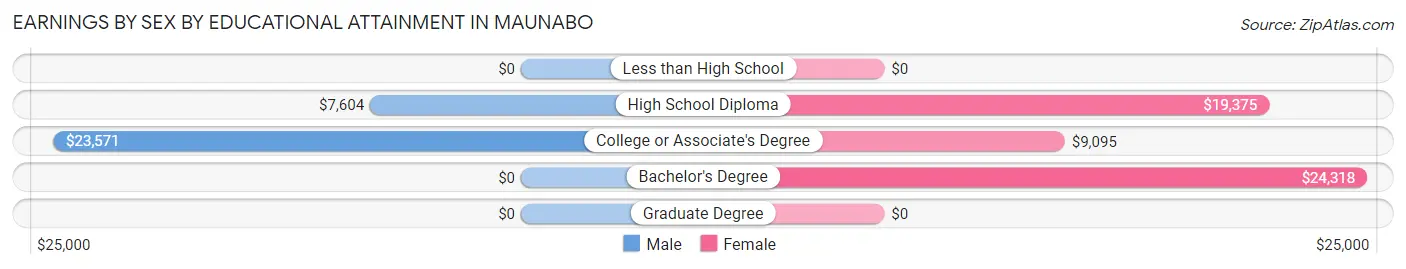
Earnings by Sex by Educational Attainment in Maunabo
Average earnings in Maunabo are $15,284 for men and $21,071 for women, a difference of 27.5%. Men with an educational attainment of college or associate's degree enjoy the highest average annual earnings of $23,571, while those with high school diploma education earn the least with $7,604. Women with an educational attainment of bachelor's degree earn the most with the average annual earnings of $24,318, while those with college or associate's degree education have the smallest earnings of $9,095.
| Educational Attainment | Male Income | Female Income |
| Less than High School | - | - |
| High School Diploma | $7,604 | $19,375 |
| College or Associate's Degree | $23,571 | $9,095 |
| Bachelor's Degree | - | - |
| Graduate Degree | - | - |
| Total | $15,284 | $21,071 |
Family Income in Maunabo
Family Income Brackets in Maunabo
According to the Maunabo family income data, there are 128 families falling into the less than $10,000 income range, which is the most common income bracket and makes up 27.1% of all families.
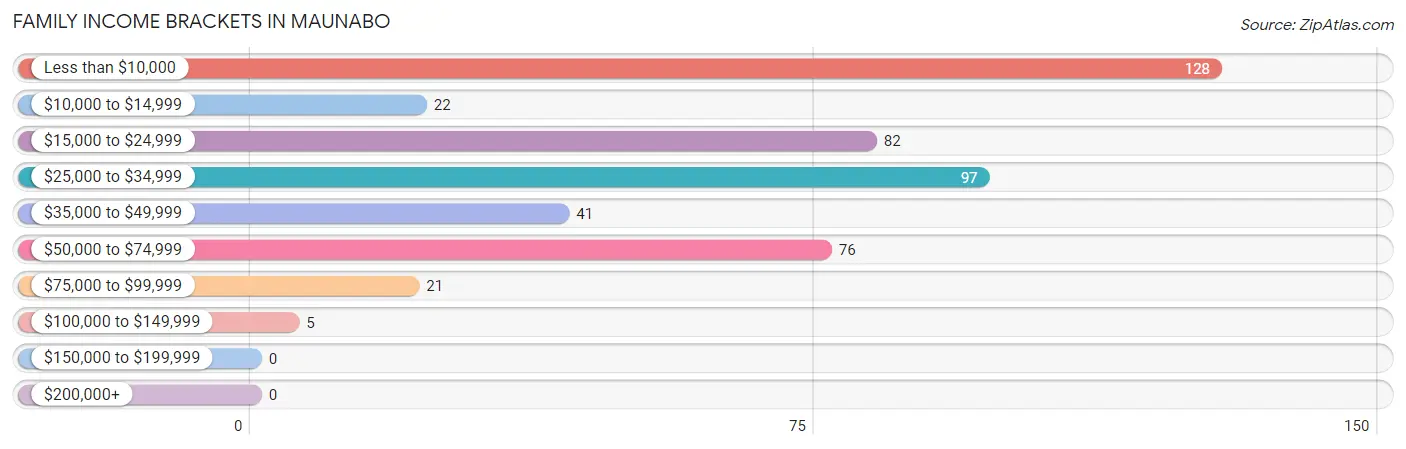
| Income Bracket | # Families | % Families |
| Less than $10,000 | 128 | 27.1% |
| $10,000 to $14,999 | 22 | 4.7% |
| $15,000 to $24,999 | 82 | 17.4% |
| $25,000 to $34,999 | 97 | 20.6% |
| $35,000 to $49,999 | 41 | 8.7% |
| $50,000 to $74,999 | 76 | 16.1% |
| $75,000 to $99,999 | 21 | 4.4% |
| $100,000 to $149,999 | 5 | 1.1% |
| $150,000 to $199,999 | 0 | 0.0% |
| $200,000+ | 0 | 0.0% |
Family Income by Famaliy Size in Maunabo
4-person families (63 | 13.4%) account for the highest median family income in Maunabo with $53,191 per family, while 4-person families (63 | 13.4%) have the highest median income of $13,298 per family member.
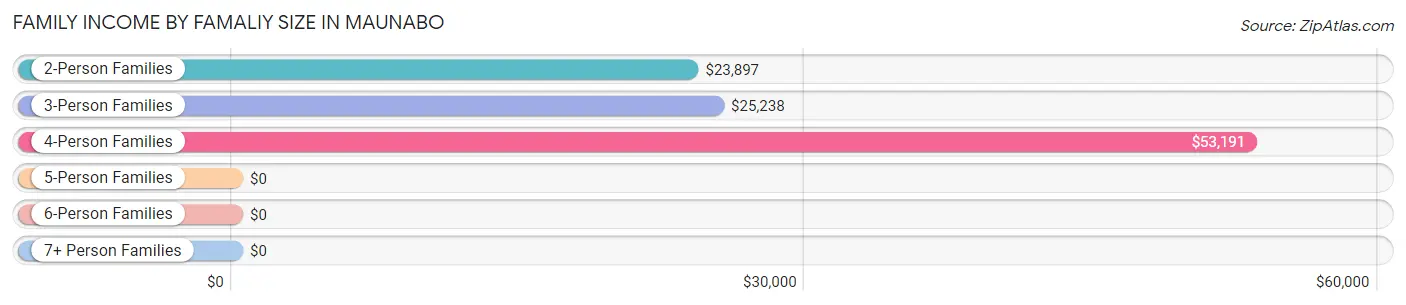
| Income Bracket | # Families | Median Income |
| 2-Person Families | 250 (53.0%) | $23,897 |
| 3-Person Families | 98 (20.8%) | $25,238 |
| 4-Person Families | 63 (13.4%) | $53,191 |
| 5-Person Families | 45 (9.5%) | $0 |
| 6-Person Families | 0 (0.0%) | $0 |
| 7+ Person Families | 16 (3.4%) | $0 |
| Total | 472 (100.0%) | $25,263 |
Family Income by Number of Earners in Maunabo
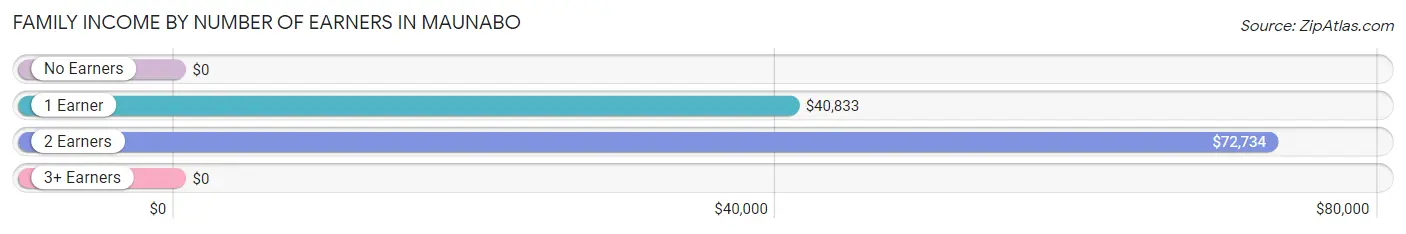
| Number of Earners | # Families | Median Income |
| No Earners | 276 (58.5%) | $0 |
| 1 Earner | 136 (28.8%) | $40,833 |
| 2 Earners | 37 (7.8%) | $72,734 |
| 3+ Earners | 23 (4.9%) | $0 |
| Total | 472 (100.0%) | $25,263 |
Household Income in Maunabo
Household Income Brackets in Maunabo
With 211 households falling in the category, the less than $10,000 income range is the most frequent in Maunabo, accounting for 36.2% of all households.
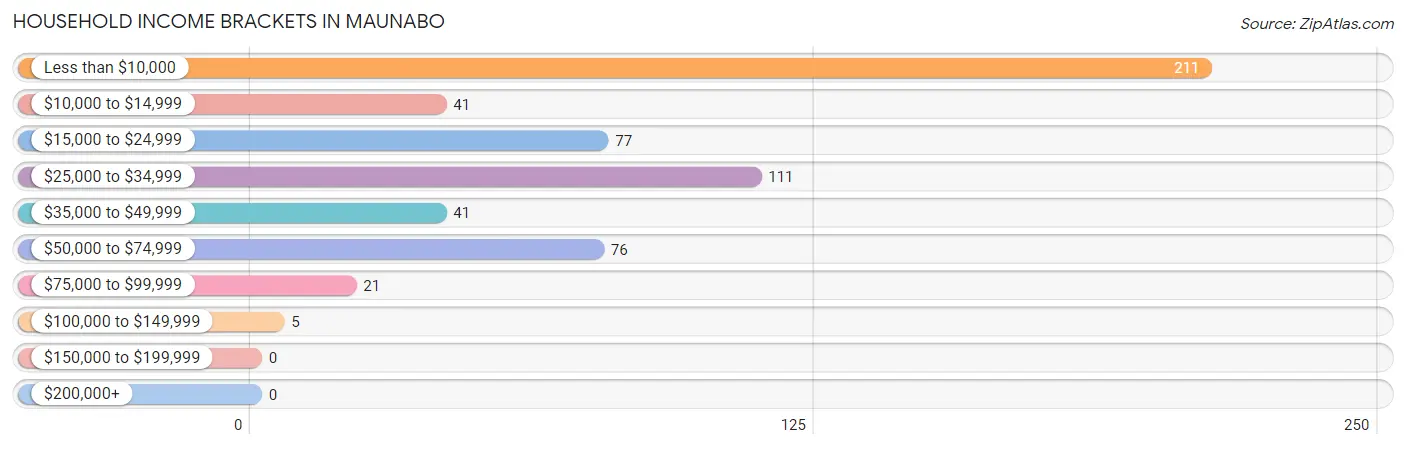
| Income Bracket | # Households | % Households |
| Less than $10,000 | 211 | 36.2% |
| $10,000 to $14,999 | 41 | 7.0% |
| $15,000 to $24,999 | 77 | 13.2% |
| $25,000 to $34,999 | 111 | 19.0% |
| $35,000 to $49,999 | 41 | 7.0% |
| $50,000 to $74,999 | 76 | 13.0% |
| $75,000 to $99,999 | 21 | 3.6% |
| $100,000 to $149,999 | 5 | 0.9% |
| $150,000 to $199,999 | 0 | 0.0% |
| $200,000+ | 0 | 0.0% |
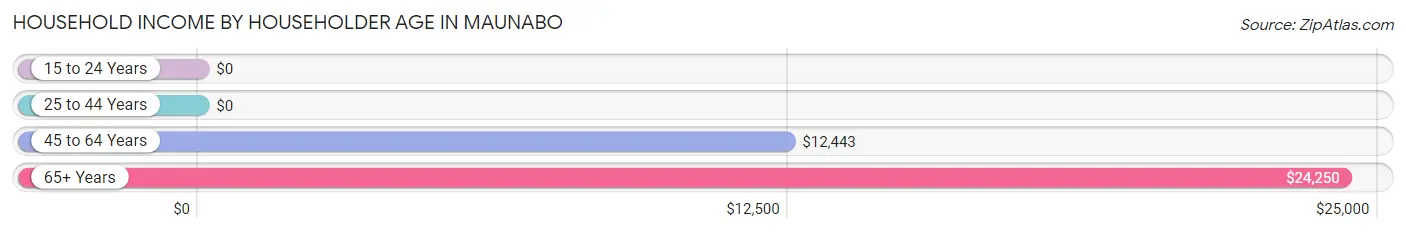
Household Income by Householder Age in Maunabo
The median household income in Maunabo is $19,821, with the highest median household income of $24,250 found in the 65+ years age bracket for the primary householder. A total of 278 households (47.7%) fall into this category.
| Income Bracket | # Households | Median Income |
| 15 to 24 Years | 0 (0.0%) | $0 |
| 25 to 44 Years | 102 (17.5%) | $0 |
| 45 to 64 Years | 203 (34.8%) | $12,443 |
| 65+ Years | 278 (47.7%) | $24,250 |
| Total | 583 (100.0%) | $19,821 |
Poverty in Maunabo
Income Below Poverty by Sex and Age in Maunabo
With 50.2% poverty level for males and 52.9% for females among the residents of Maunabo, under 5 year old males and 15 year old females are the most vulnerable to poverty, with 13 males (100.0%) and 14 females (100.0%) in their respective age groups living below the poverty level.
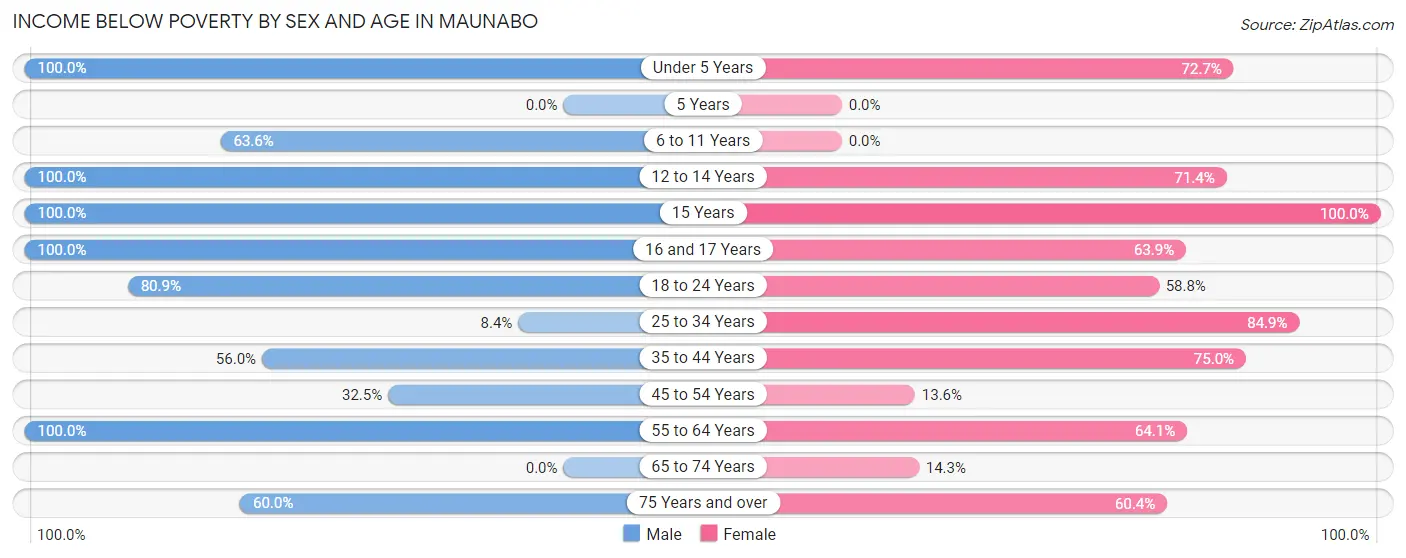
| Age Bracket | Male | Female |
| Under 5 Years | 13 (100.0%) | 24 (72.7%) |
| 5 Years | 0 (0.0%) | 0 (0.0%) |
| 6 to 11 Years | 28 (63.6%) | 0 (0.0%) |
| 12 to 14 Years | 24 (100.0%) | 20 (71.4%) |
| 15 Years | 15 (100.0%) | 14 (100.0%) |
| 16 and 17 Years | 15 (100.0%) | 23 (63.9%) |
| 18 to 24 Years | 76 (80.8%) | 30 (58.8%) |
| 25 to 34 Years | 12 (8.4%) | 45 (84.9%) |
| 35 to 44 Years | 47 (55.9%) | 90 (75.0%) |
| 45 to 54 Years | 41 (32.5%) | 16 (13.6%) |
| 55 to 64 Years | 54 (100.0%) | 66 (64.1%) |
| 65 to 74 Years | 0 (0.0%) | 12 (14.3%) |
| 75 Years and over | 87 (60.0%) | 64 (60.4%) |
| Total | 412 (50.2%) | 404 (52.9%) |
Income Above Poverty by Sex and Age in Maunabo
According to the poverty statistics in Maunabo, males aged 65 to 74 years and females aged 6 to 11 years are the age groups that are most secure financially, with 100.0% of males and 100.0% of females in these age groups living above the poverty line.
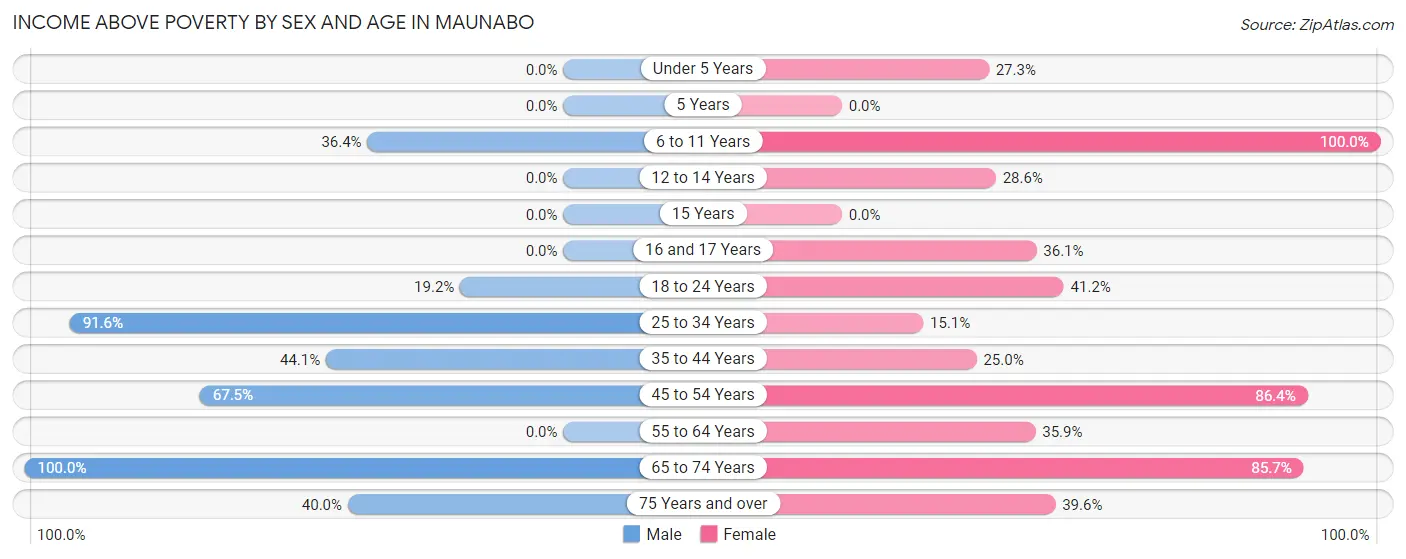
| Age Bracket | Male | Female |
| Under 5 Years | 0 (0.0%) | 9 (27.3%) |
| 5 Years | 0 (0.0%) | 0 (0.0%) |
| 6 to 11 Years | 16 (36.4%) | 18 (100.0%) |
| 12 to 14 Years | 0 (0.0%) | 8 (28.6%) |
| 15 Years | 0 (0.0%) | 0 (0.0%) |
| 16 and 17 Years | 0 (0.0%) | 13 (36.1%) |
| 18 to 24 Years | 18 (19.2%) | 21 (41.2%) |
| 25 to 34 Years | 131 (91.6%) | 8 (15.1%) |
| 35 to 44 Years | 37 (44.1%) | 30 (25.0%) |
| 45 to 54 Years | 85 (67.5%) | 102 (86.4%) |
| 55 to 64 Years | 0 (0.0%) | 37 (35.9%) |
| 65 to 74 Years | 63 (100.0%) | 72 (85.7%) |
| 75 Years and over | 58 (40.0%) | 42 (39.6%) |
| Total | 408 (49.8%) | 360 (47.1%) |
Income Below Poverty Among Married-Couple Families in Maunabo
The poverty statistics for married-couple families in Maunabo show that 49.3% or 108 of the total 219 families live below the poverty line. Families with 3 or 4 children have the highest poverty rate of 100.0%, comprising of 16 families. On the other hand, families with no children have the lowest poverty rate of 40.3%, which includes 60 families.
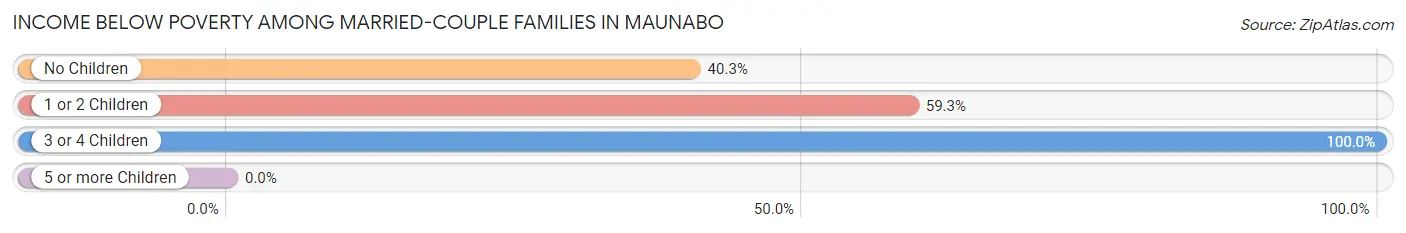
| Children | Above Poverty | Below Poverty |
| No Children | 89 (59.7%) | 60 (40.3%) |
| 1 or 2 Children | 22 (40.7%) | 32 (59.3%) |
| 3 or 4 Children | 0 (0.0%) | 16 (100.0%) |
| 5 or more Children | 0 (0.0%) | 0 (0.0%) |
| Total | 111 (50.7%) | 108 (49.3%) |
Income Below Poverty Among Single-Parent Households in Maunabo
According to the poverty data in Maunabo, 42.9% or 39 single-father households and 36.4% or 59 single-mother households are living below the poverty line. Among single-father households, those with 1 or 2 children have the highest poverty rate, with 16 households (53.3%) experiencing poverty. Likewise, among single-mother households, those with 1 or 2 children have the highest poverty rate, with 44 households (55.0%) falling below the poverty line.
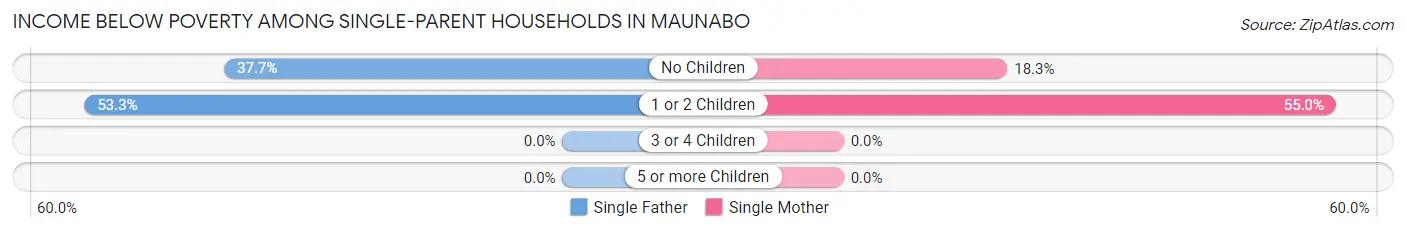
| Children | Single Father | Single Mother |
| No Children | 23 (37.7%) | 15 (18.3%) |
| 1 or 2 Children | 16 (53.3%) | 44 (55.0%) |
| 3 or 4 Children | 0 (0.0%) | 0 (0.0%) |
| 5 or more Children | 0 (0.0%) | 0 (0.0%) |
| Total | 39 (42.9%) | 59 (36.4%) |
Income Below Poverty Among Married-Couple vs Single-Parent Households in Maunabo
The poverty data for Maunabo shows that 108 of the married-couple family households (49.3%) and 98 of the single-parent households (38.7%) are living below the poverty level. Within the married-couple family households, those with 3 or 4 children have the highest poverty rate, with 16 households (100.0%) falling below the poverty line. Among the single-parent households, those with 1 or 2 children have the highest poverty rate, with 60 household (54.5%) living below poverty.
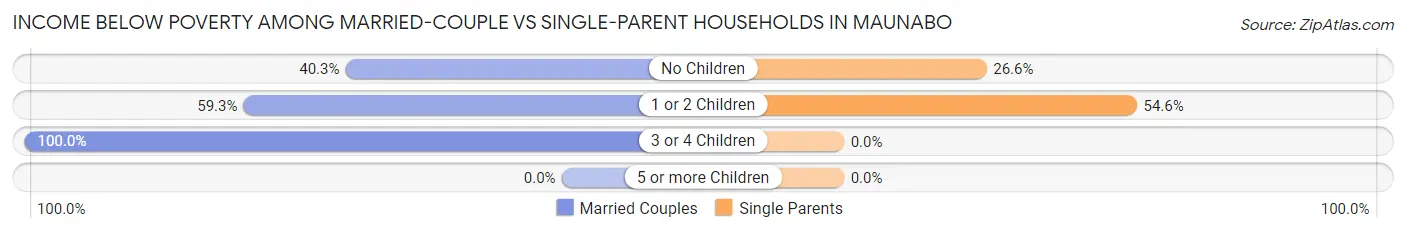
| Children | Married-Couple Families | Single-Parent Households |
| No Children | 60 (40.3%) | 38 (26.6%) |
| 1 or 2 Children | 32 (59.3%) | 60 (54.5%) |
| 3 or 4 Children | 16 (100.0%) | 0 (0.0%) |
| 5 or more Children | 0 (0.0%) | 0 (0.0%) |
| Total | 108 (49.3%) | 98 (38.7%) |
Race in Maunabo
The most populous races in Maunabo are Hispanic or Latino (1,546 | 97.6%), Black / African American (665 | 42.0%), and Some other Race (486 | 30.7%).
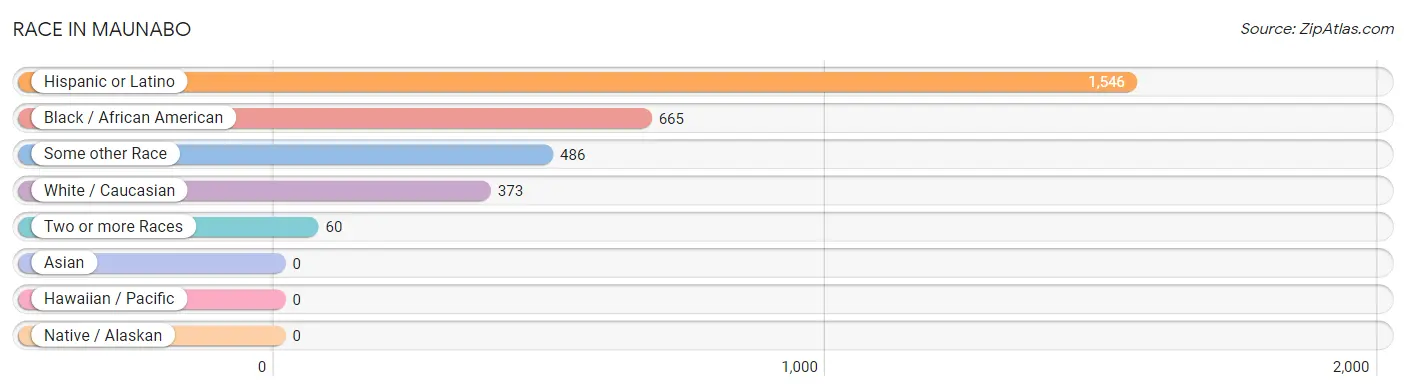
| Race | # Population | % Population |
| Asian | 0 | 0.0% |
| Black / African American | 665 | 42.0% |
| Hawaiian / Pacific | 0 | 0.0% |
| Hispanic or Latino | 1,546 | 97.6% |
| Native / Alaskan | 0 | 0.0% |
| White / Caucasian | 373 | 23.5% |
| Two or more Races | 60 | 3.8% |
| Some other Race | 486 | 30.7% |
| Total | 1,584 | 100.0% |
Ancestry in Maunabo
The most populous ancestries reported in Maunabo are Puerto Rican (1,546 | 97.6%), American (43 | 2.7%), and Arab (37 | 2.3%), together accounting for 102.6% of all Maunabo residents.
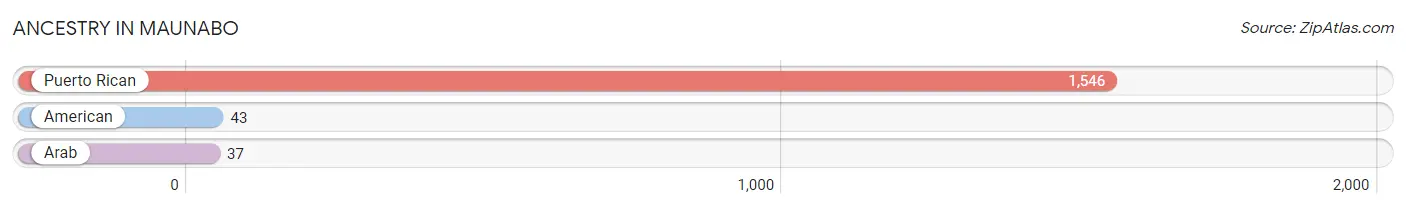
| Ancestry | # Population | % Population |
| American | 43 | 2.7% |
| Arab | 37 | 2.3% |
| Puerto Rican | 1,546 | 97.6% | View All 3 Rows |
Immigrants in Maunabo

| Immigration Origin | # Population | % Population | View All 0 Rows |
Sex and Age in Maunabo
Sex and Age in Maunabo
The most populous age groups in Maunabo are 25 to 29 Years (133 | 16.2%) for men and 60 to 64 Years (72 | 9.4%) for women.
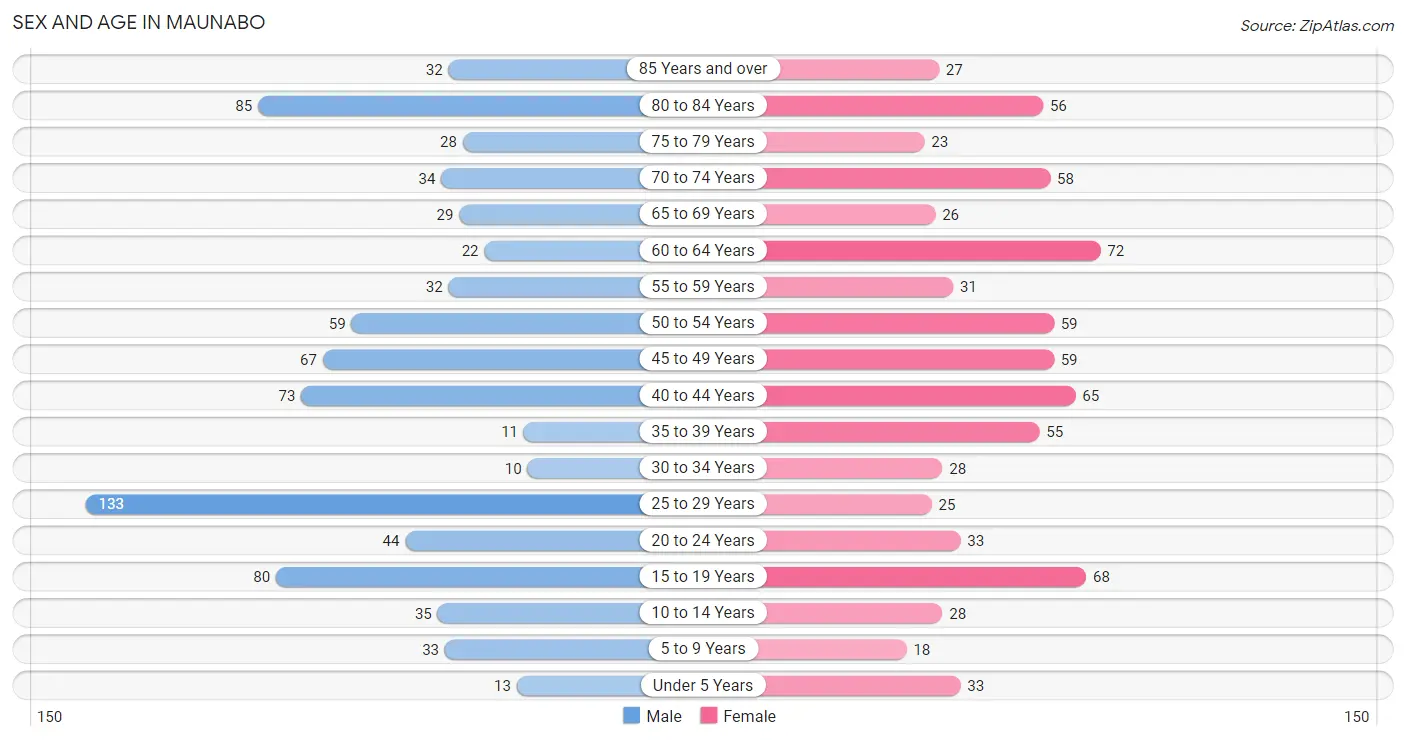
| Age Bracket | Male | Female |
| Under 5 Years | 13 (1.6%) | 33 (4.3%) |
| 5 to 9 Years | 33 (4.0%) | 18 (2.4%) |
| 10 to 14 Years | 35 (4.3%) | 28 (3.7%) |
| 15 to 19 Years | 80 (9.8%) | 68 (8.9%) |
| 20 to 24 Years | 44 (5.4%) | 33 (4.3%) |
| 25 to 29 Years | 133 (16.2%) | 25 (3.3%) |
| 30 to 34 Years | 10 (1.2%) | 28 (3.7%) |
| 35 to 39 Years | 11 (1.3%) | 55 (7.2%) |
| 40 to 44 Years | 73 (8.9%) | 65 (8.5%) |
| 45 to 49 Years | 67 (8.2%) | 59 (7.7%) |
| 50 to 54 Years | 59 (7.2%) | 59 (7.7%) |
| 55 to 59 Years | 32 (3.9%) | 31 (4.1%) |
| 60 to 64 Years | 22 (2.7%) | 72 (9.4%) |
| 65 to 69 Years | 29 (3.5%) | 26 (3.4%) |
| 70 to 74 Years | 34 (4.2%) | 58 (7.6%) |
| 75 to 79 Years | 28 (3.4%) | 23 (3.0%) |
| 80 to 84 Years | 85 (10.4%) | 56 (7.3%) |
| 85 Years and over | 32 (3.9%) | 27 (3.5%) |
| Total | 820 (100.0%) | 764 (100.0%) |
Families and Households in Maunabo
Median Family Size in Maunabo
The median family size in Maunabo is 3.07 persons per family, with single female/mother families (162 | 34.3%) accounting for the largest median family size of 3.62 persons per family. On the other hand, single male/father families (91 | 19.3%) represent the smallest median family size with 2.68 persons per family.
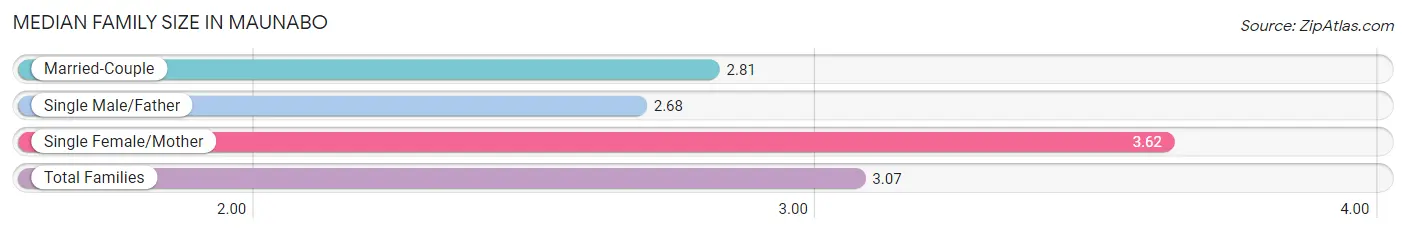
| Family Type | # Families | Family Size |
| Married-Couple | 219 (46.4%) | 2.81 |
| Single Male/Father | 91 (19.3%) | 2.68 |
| Single Female/Mother | 162 (34.3%) | 3.62 |
| Total Families | 472 (100.0%) | 3.07 |
Median Household Size in Maunabo
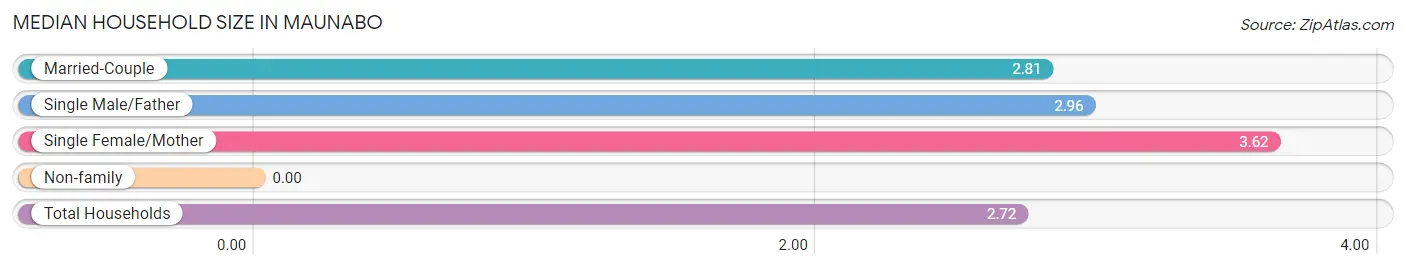
| Household Type | # Households | Household Size |
| Married-Couple | 219 (37.6%) | 2.81 |
| Single Male/Father | 91 (15.6%) | 2.96 |
| Single Female/Mother | 162 (27.8%) | 3.62 |
| Non-family | 111 (19.0%) | - |
| Total Households | 583 (100.0%) | 2.72 |
Household Size by Marriage Status in Maunabo
Out of a total of 583 households in Maunabo, 472 (81.0%) are family households, while 111 (19.0%) are nonfamily households. The most numerous type of family households are 2-person households, comprising 227, and the most common type of nonfamily households are 1-person households, comprising 111.
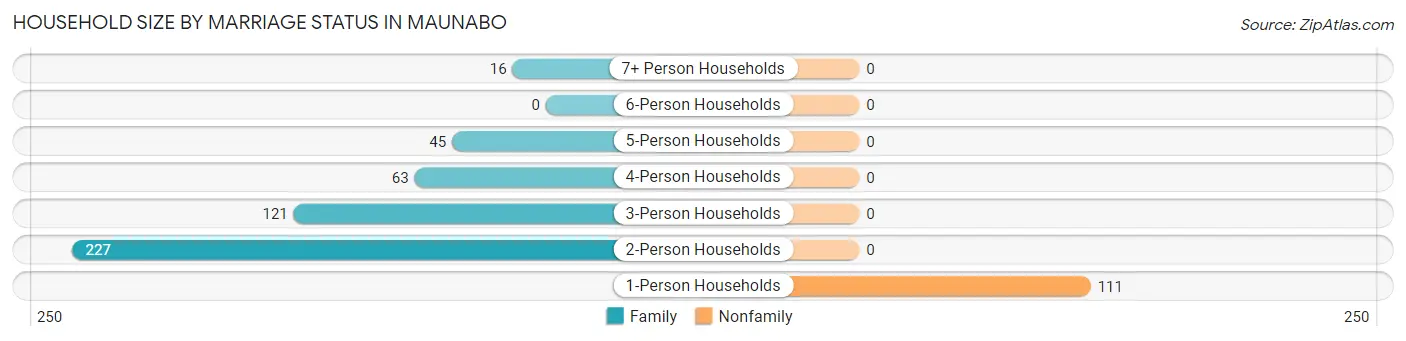
| Household Size | Family Households | Nonfamily Households |
| 1-Person Households | - | 111 (19.0%) |
| 2-Person Households | 227 (38.9%) | 0 (0.0%) |
| 3-Person Households | 121 (20.7%) | 0 (0.0%) |
| 4-Person Households | 63 (10.8%) | 0 (0.0%) |
| 5-Person Households | 45 (7.7%) | 0 (0.0%) |
| 6-Person Households | 0 (0.0%) | 0 (0.0%) |
| 7+ Person Households | 16 (2.7%) | 0 (0.0%) |
| Total | 472 (81.0%) | 111 (19.0%) |
Female Fertility in Maunabo
Fertility by Age in Maunabo
Average fertility rate in Maunabo is 95.0 births per 1,000 women. Women in the age bracket of 20 to 34 years have the highest fertility rate with 140.0 births per 1,000 women. Women in the age bracket of 35 to 50 years acount for 63.6% of all women with births.
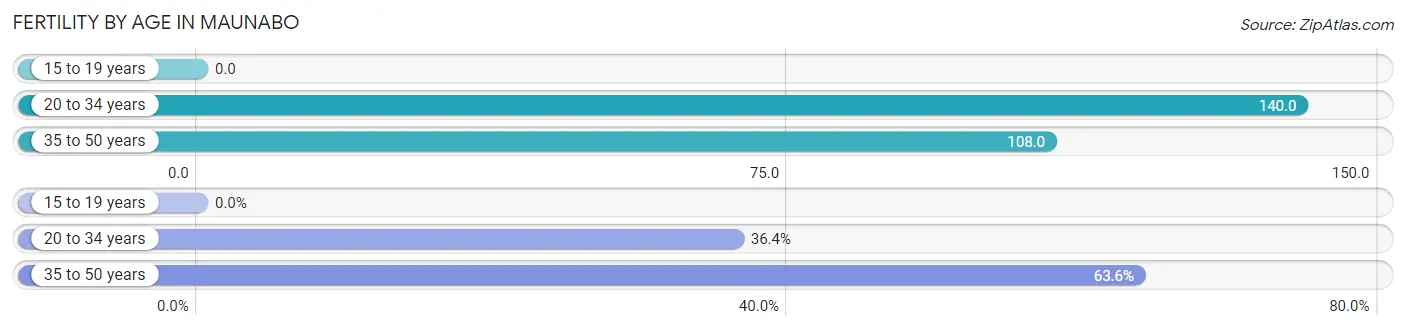
| Age Bracket | Women with Births | Births / 1,000 Women |
| 15 to 19 years | 0 (0.0%) | 0.0 |
| 20 to 34 years | 12 (36.4%) | 140.0 |
| 35 to 50 years | 21 (63.6%) | 108.0 |
| Total | 33 (100.0%) | 95.0 |
Fertility by Age by Marriage Status in Maunabo
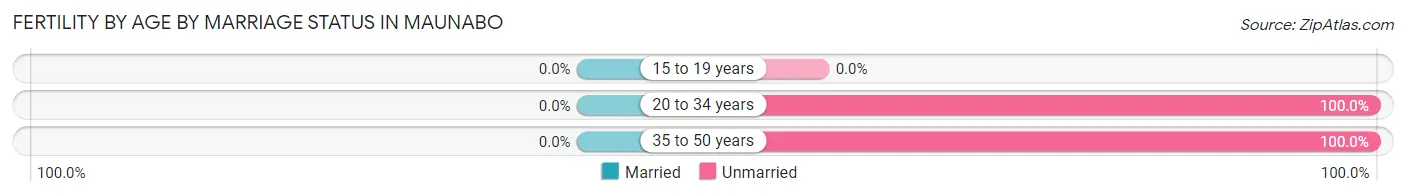
| Age Bracket | Married | Unmarried |
| 15 to 19 years | 0 (0.0%) | 0 (0.0%) |
| 20 to 34 years | 0 (0.0%) | 12 (100.0%) |
| 35 to 50 years | 0 (0.0%) | 21 (100.0%) |
| Total | 0 (0.0%) | 33 (100.0%) |
Fertility by Education in Maunabo
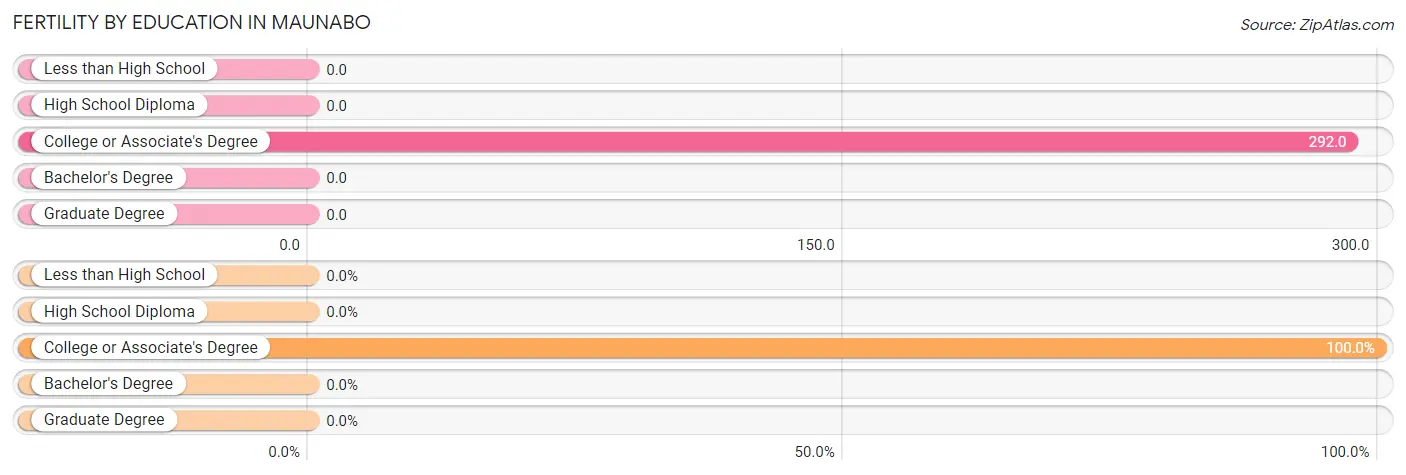
| Educational Attainment | Women with Births | Births / 1,000 Women |
| Less than High School | 0 (0.0%) | 0.0 |
| High School Diploma | 0 (0.0%) | 0.0 |
| College or Associate's Degree | 33 (100.0%) | 292.0 |
| Bachelor's Degree | 0 (0.0%) | 0.0 |
| Graduate Degree | 0 (0.0%) | 0.0 |
| Total | 33 (100.0%) | 95.0 |
Fertility by Education by Marriage Status in Maunabo
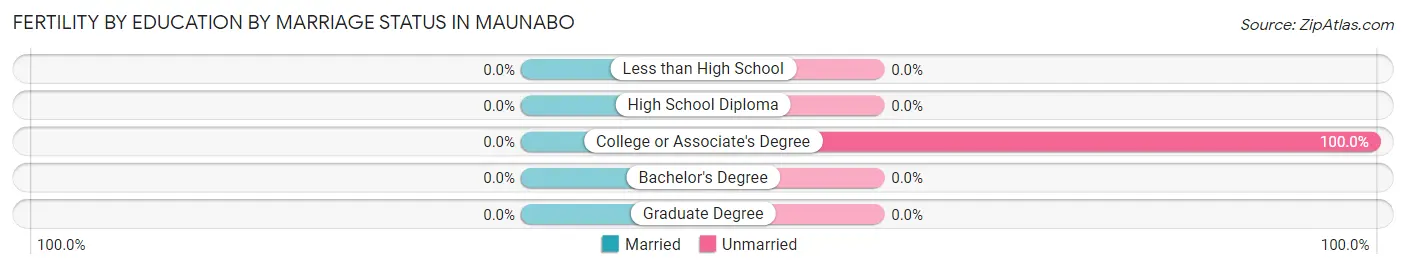
| Educational Attainment | Married | Unmarried |
| Less than High School | 0 (0.0%) | 0 (0.0%) |
| High School Diploma | 0 (0.0%) | 0 (0.0%) |
| College or Associate's Degree | 0 (0.0%) | 33 (100.0%) |
| Bachelor's Degree | 0 (0.0%) | 0 (0.0%) |
| Graduate Degree | 0 (0.0%) | 0 (0.0%) |
| Total | 0 (0.0%) | 33 (100.0%) |
Employment Characteristics in Maunabo
Employment by Class of Employer in Maunabo
Among the 274 employed individuals in Maunabo, private company employees (174 | 63.5%), state government employees (85 | 31.0%), and self-employed (not incorporated) (15 | 5.5%) make up the most common classes of employment.
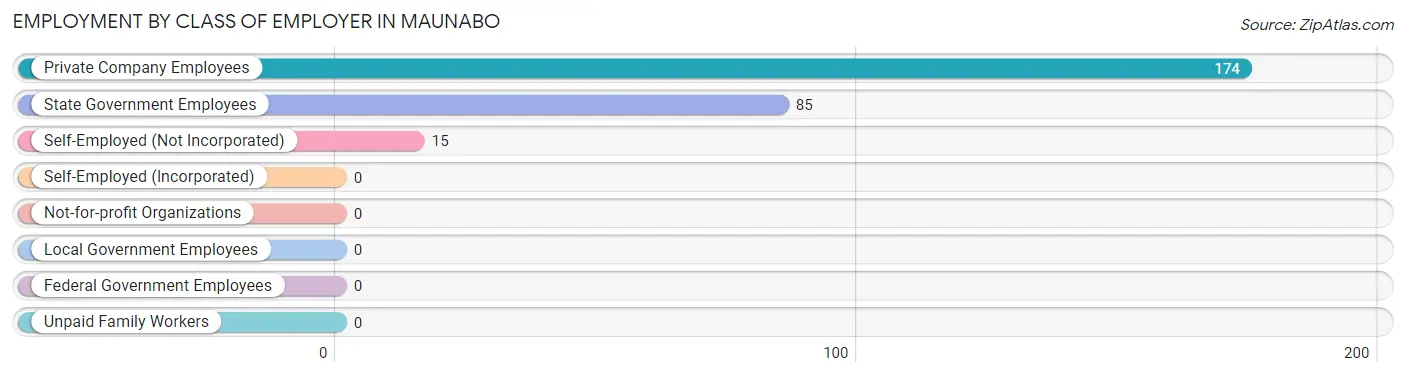
| Employer Class | # Employees | % Employees |
| Private Company Employees | 174 | 63.5% |
| Self-Employed (Incorporated) | 0 | 0.0% |
| Self-Employed (Not Incorporated) | 15 | 5.5% |
| Not-for-profit Organizations | 0 | 0.0% |
| Local Government Employees | 0 | 0.0% |
| State Government Employees | 85 | 31.0% |
| Federal Government Employees | 0 | 0.0% |
| Unpaid Family Workers | 0 | 0.0% |
| Total | 274 | 100.0% |
Employment Status by Age in Maunabo
According to the labor force statistics for Maunabo, out of the total population over 16 years of age (1,395), 36.8% or 513 individuals are in the labor force, with 38.0% or 195 of them unemployed. The age group with the highest labor force participation rate is 25 to 29 years, with 88.6% or 140 individuals in the labor force. Within the labor force, the 16 to 19 years age range has the highest percentage of unemployed individuals, with 100.0% or 37 of them being unemployed.
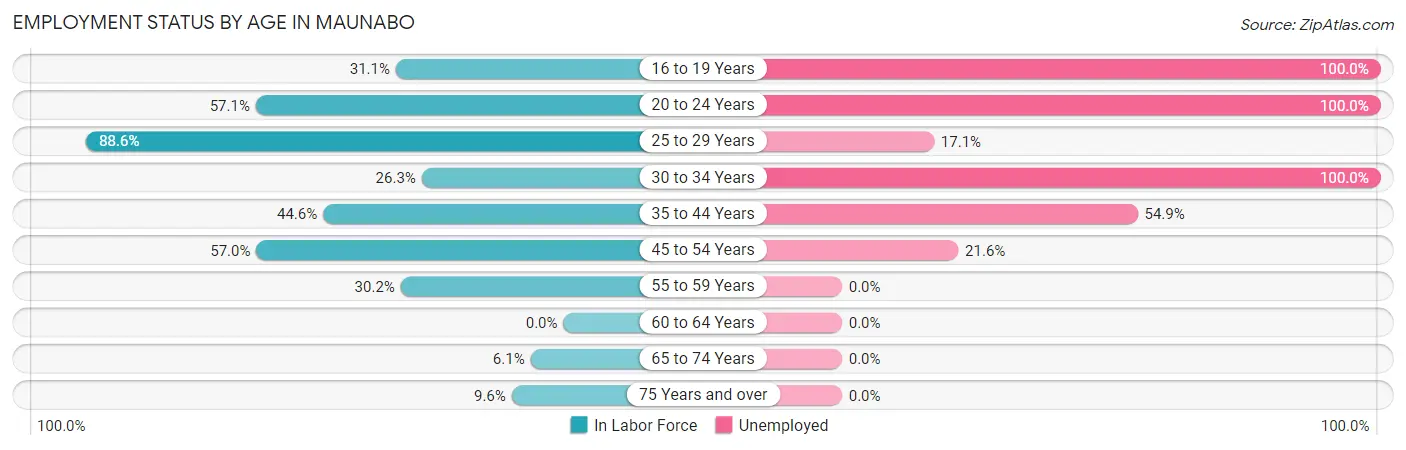
| Age Bracket | In Labor Force | Unemployed |
| 16 to 19 Years | 37 (31.1%) | 37 (100.0%) |
| 20 to 24 Years | 44 (57.1%) | 44 (100.0%) |
| 25 to 29 Years | 140 (88.6%) | 24 (17.1%) |
| 30 to 34 Years | 10 (26.3%) | 10 (100.0%) |
| 35 to 44 Years | 91 (44.6%) | 50 (54.9%) |
| 45 to 54 Years | 139 (57.0%) | 30 (21.6%) |
| 55 to 59 Years | 19 (30.2%) | 0 (0.0%) |
| 60 to 64 Years | 0 (0.0%) | 0 (0.0%) |
| 65 to 74 Years | 9 (6.1%) | 0 (0.0%) |
| 75 Years and over | 24 (9.6%) | 0 (0.0%) |
| Total | 513 (36.8%) | 195 (38.0%) |
Employment Status by Educational Attainment in Maunabo
According to labor force statistics for Maunabo, 49.8% of individuals (399) out of the total population between 25 and 64 years of age (801) are in the labor force, with 28.6% or 114 of them being unemployed. The group with the highest labor force participation rate are those with the educational attainment of bachelor's degree or higher, with 72.4% or 110 individuals in the labor force. Within the labor force, individuals with high school diploma education have the highest percentage of unemployment, with 50.8% or 67 of them being unemployed.
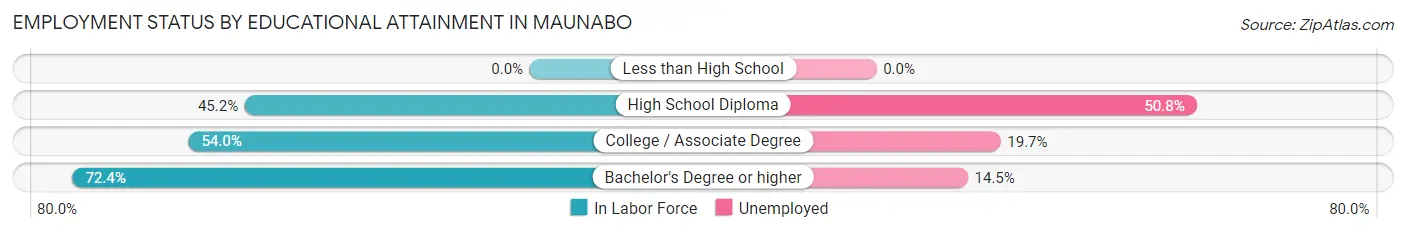
| Educational Attainment | In Labor Force | Unemployed |
| Less than High School | 0 (0.0%) | 0 (0.0%) |
| High School Diploma | 132 (45.2%) | 148 (50.8%) |
| College / Associate Degree | 157 (54.0%) | 57 (19.7%) |
| Bachelor's Degree or higher | 110 (72.4%) | 22 (14.5%) |
| Total | 399 (49.8%) | 229 (28.6%) |
Employment Occupations by Sex in Maunabo
Management, Business, Science and Arts Occupations
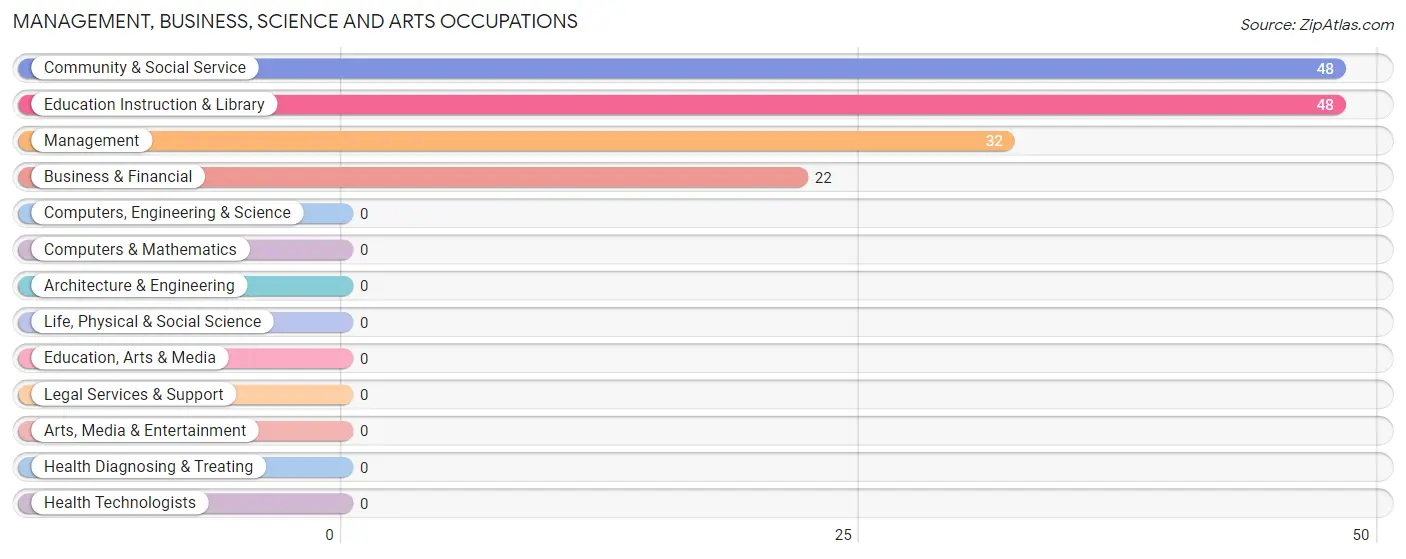
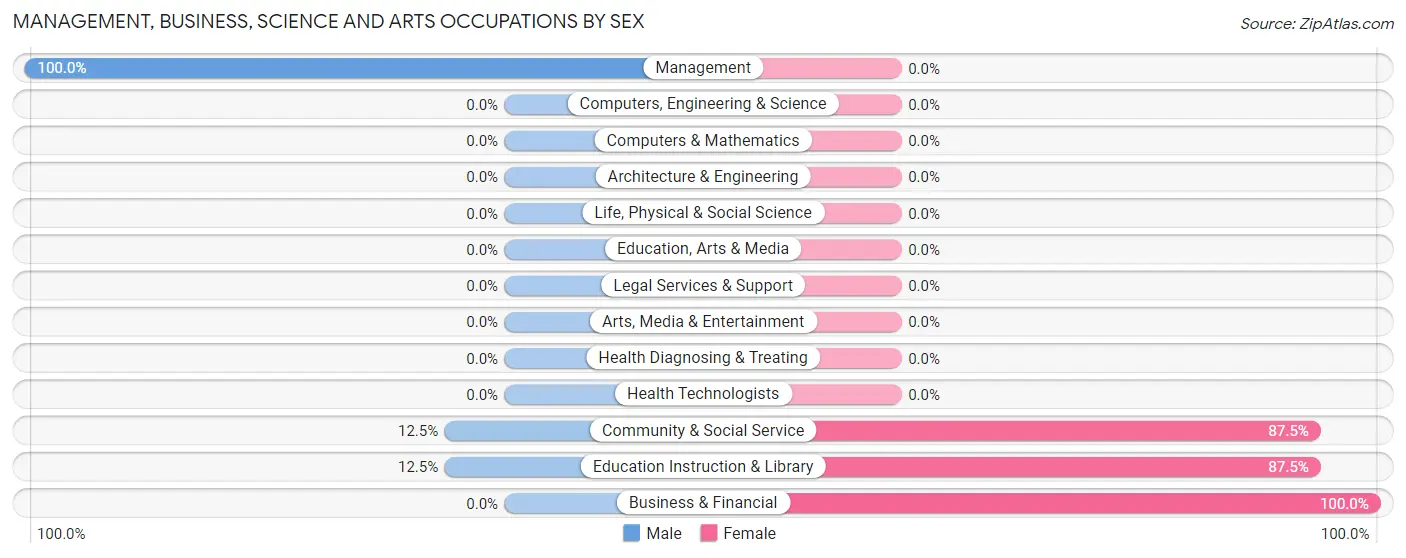
The most common Management, Business, Science and Arts occupations in Maunabo are Community & Social Service (48 | 15.1%), Education Instruction & Library (48 | 15.1%), Management (32 | 10.1%), and Business & Financial (22 | 6.9%).
Management, Business, Science and Arts Occupations by Sex
Within the Management, Business, Science and Arts occupations in Maunabo, the most male-oriented occupations are Management (100.0%), Community & Social Service (12.5%), and Education Instruction & Library (12.5%), while the most female-oriented occupations are Business & Financial (100.0%), Community & Social Service (87.5%), and Education Instruction & Library (87.5%).
| Occupation | Male | Female |
| Management | 32 (100.0%) | 0 (0.0%) |
| Business & Financial | 0 (0.0%) | 22 (100.0%) |
| Computers, Engineering & Science | 0 (0.0%) | 0 (0.0%) |
| Computers & Mathematics | 0 (0.0%) | 0 (0.0%) |
| Architecture & Engineering | 0 (0.0%) | 0 (0.0%) |
| Life, Physical & Social Science | 0 (0.0%) | 0 (0.0%) |
| Community & Social Service | 6 (12.5%) | 42 (87.5%) |
| Education, Arts & Media | 0 (0.0%) | 0 (0.0%) |
| Legal Services & Support | 0 (0.0%) | 0 (0.0%) |
| Education Instruction & Library | 6 (12.5%) | 42 (87.5%) |
| Arts, Media & Entertainment | 0 (0.0%) | 0 (0.0%) |
| Health Diagnosing & Treating | 0 (0.0%) | 0 (0.0%) |
| Health Technologists | 0 (0.0%) | 0 (0.0%) |
| Total (Category) | 38 (37.2%) | 64 (62.7%) |
| Total (Overall) | 174 (54.7%) | 144 (45.3%) |
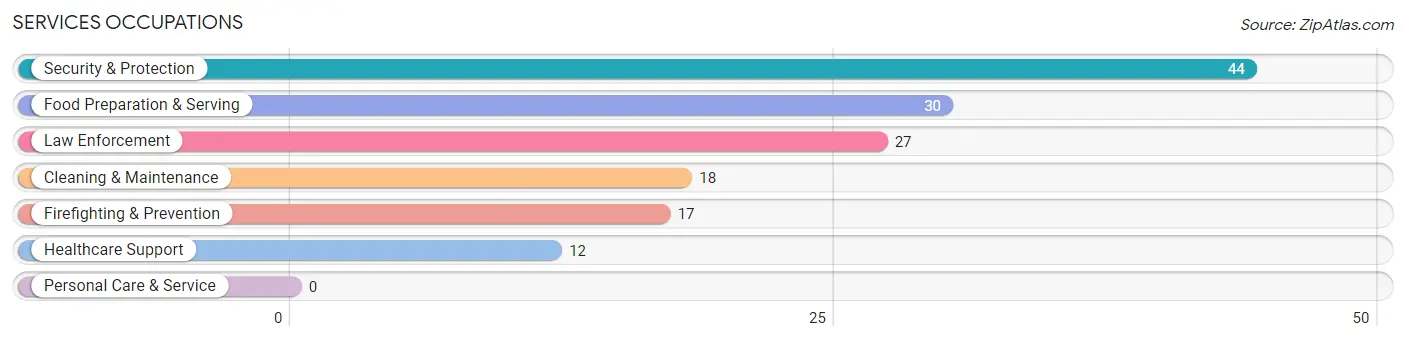
Services Occupations
The most common Services occupations in Maunabo are Security & Protection (44 | 13.8%), Food Preparation & Serving (30 | 9.4%), Law Enforcement (27 | 8.5%), Cleaning & Maintenance (18 | 5.7%), and Firefighting & Prevention (17 | 5.3%).
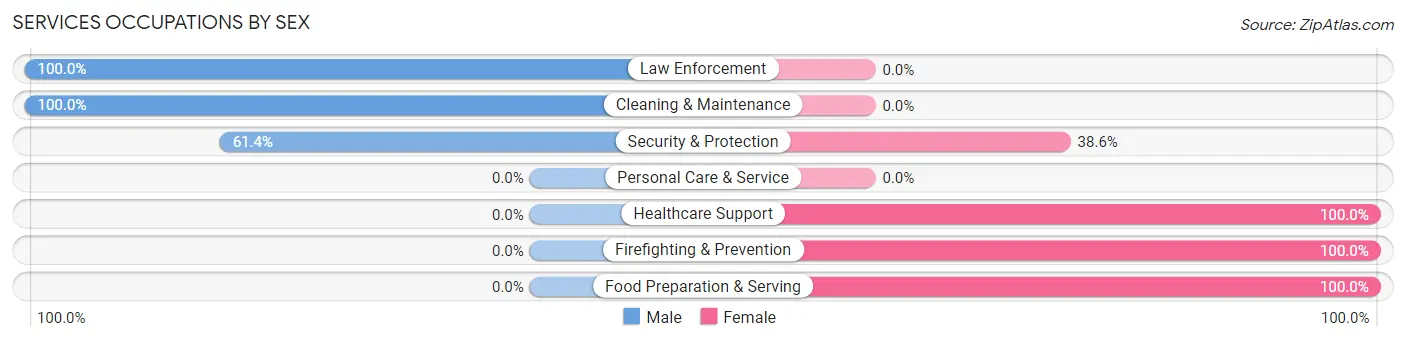
Services Occupations by Sex
Within the Services occupations in Maunabo, the most male-oriented occupations are Law Enforcement (100.0%), Cleaning & Maintenance (100.0%), and Security & Protection (61.4%), while the most female-oriented occupations are Healthcare Support (100.0%), Firefighting & Prevention (100.0%), and Food Preparation & Serving (100.0%).
| Occupation | Male | Female |
| Healthcare Support | 0 (0.0%) | 12 (100.0%) |
| Security & Protection | 27 (61.4%) | 17 (38.6%) |
| Firefighting & Prevention | 0 (0.0%) | 17 (100.0%) |
| Law Enforcement | 27 (100.0%) | 0 (0.0%) |
| Food Preparation & Serving | 0 (0.0%) | 30 (100.0%) |
| Cleaning & Maintenance | 18 (100.0%) | 0 (0.0%) |
| Personal Care & Service | 0 (0.0%) | 0 (0.0%) |
| Total (Category) | 45 (43.3%) | 59 (56.7%) |
| Total (Overall) | 174 (54.7%) | 144 (45.3%) |
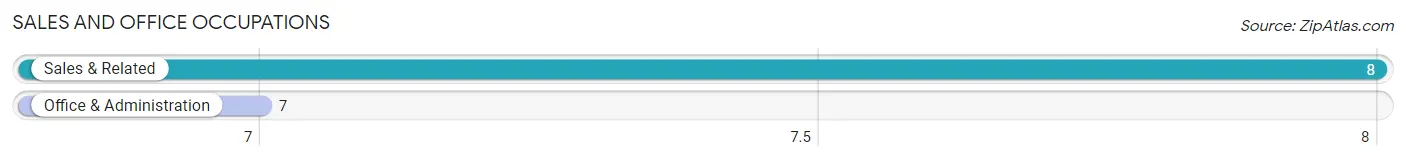
Sales and Office Occupations
The most common Sales and Office occupations in Maunabo are Sales & Related (8 | 2.5%), and Office & Administration (7 | 2.2%).
Sales and Office Occupations by Sex
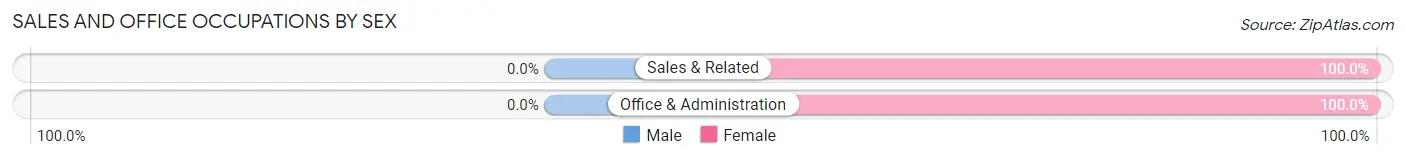
| Occupation | Male | Female |
| Sales & Related | 0 (0.0%) | 8 (100.0%) |
| Office & Administration | 0 (0.0%) | 7 (100.0%) |
| Total (Category) | 0 (0.0%) | 15 (100.0%) |
| Total (Overall) | 174 (54.7%) | 144 (45.3%) |
Natural Resources, Construction and Maintenance Occupations
The most common Natural Resources, Construction and Maintenance occupations in Maunabo are , and Construction & Extraction (30 | 9.4%).
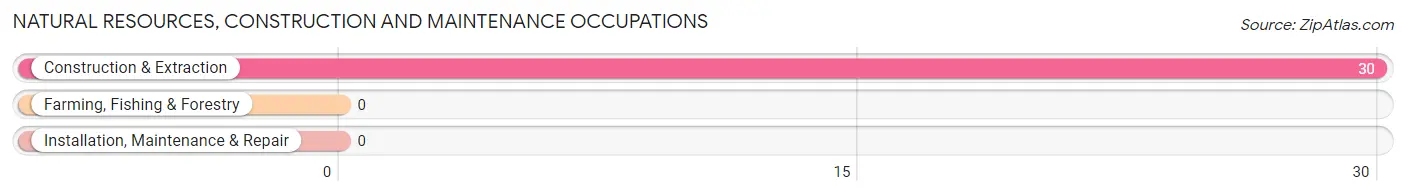
Natural Resources, Construction and Maintenance Occupations by Sex
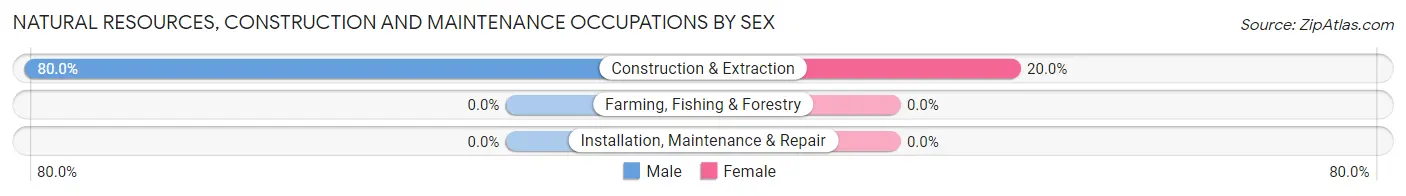
| Occupation | Male | Female |
| Farming, Fishing & Forestry | 0 (0.0%) | 0 (0.0%) |
| Construction & Extraction | 24 (80.0%) | 6 (20.0%) |
| Installation, Maintenance & Repair | 0 (0.0%) | 0 (0.0%) |
| Total (Category) | 24 (80.0%) | 6 (20.0%) |
| Total (Overall) | 174 (54.7%) | 144 (45.3%) |
Production, Transportation and Moving Occupations
The most common Production, Transportation and Moving occupations in Maunabo are Production (37 | 11.6%), Material Moving (21 | 6.6%), and Transportation (9 | 2.8%).
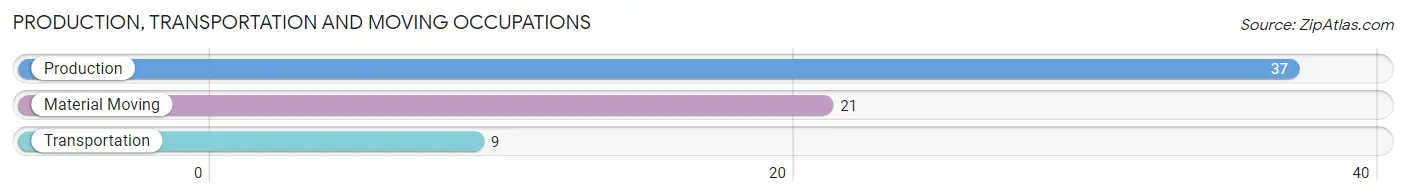
Production, Transportation and Moving Occupations by Sex
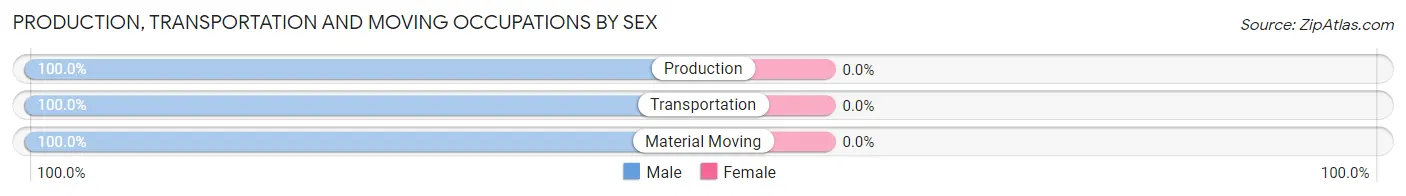
| Occupation | Male | Female |
| Production | 37 (100.0%) | 0 (0.0%) |
| Transportation | 9 (100.0%) | 0 (0.0%) |
| Material Moving | 21 (100.0%) | 0 (0.0%) |
| Total (Category) | 67 (100.0%) | 0 (0.0%) |
| Total (Overall) | 174 (54.7%) | 144 (45.3%) |
Employment Industries by Sex in Maunabo
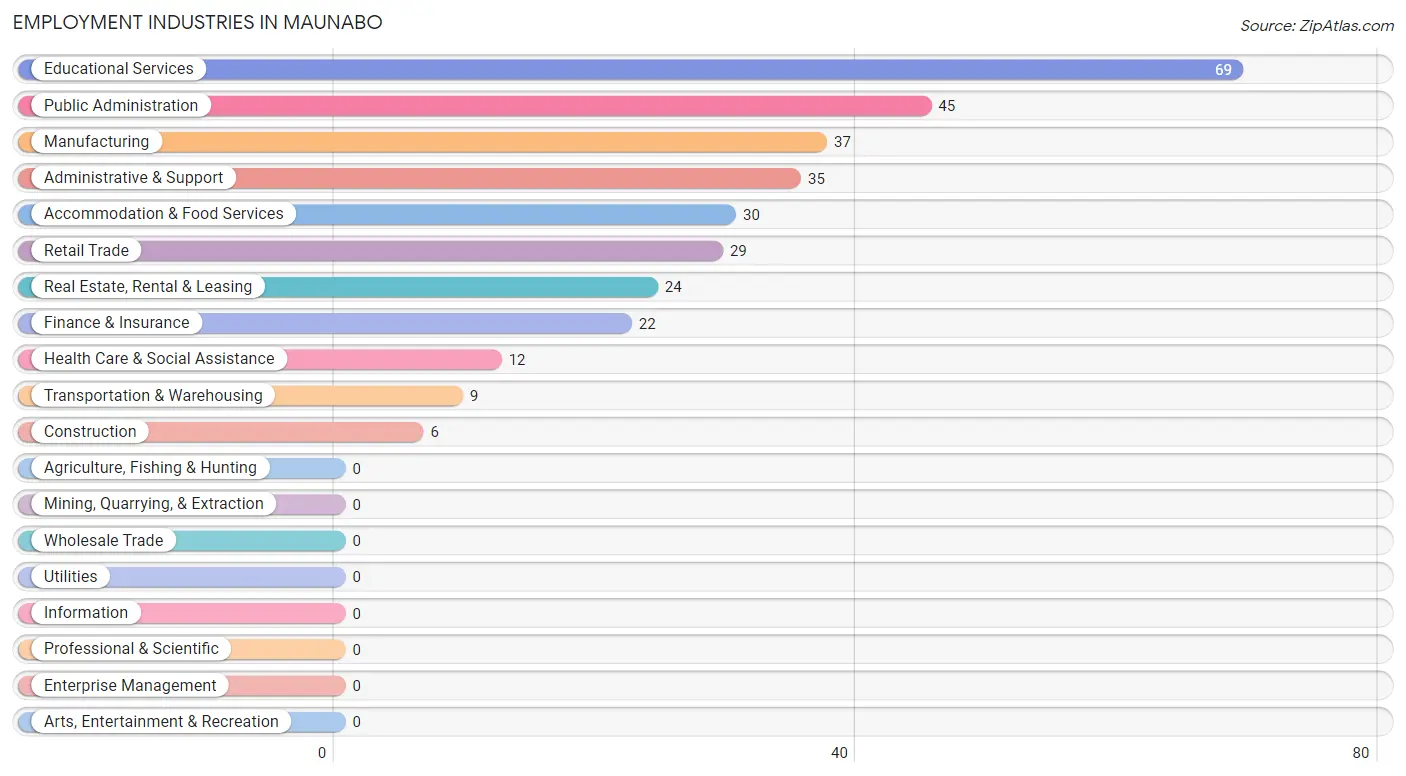
Employment Industries in Maunabo
The major employment industries in Maunabo include Educational Services (69 | 21.7%), Public Administration (45 | 14.1%), Manufacturing (37 | 11.6%), Administrative & Support (35 | 11.0%), and Accommodation & Food Services (30 | 9.4%).
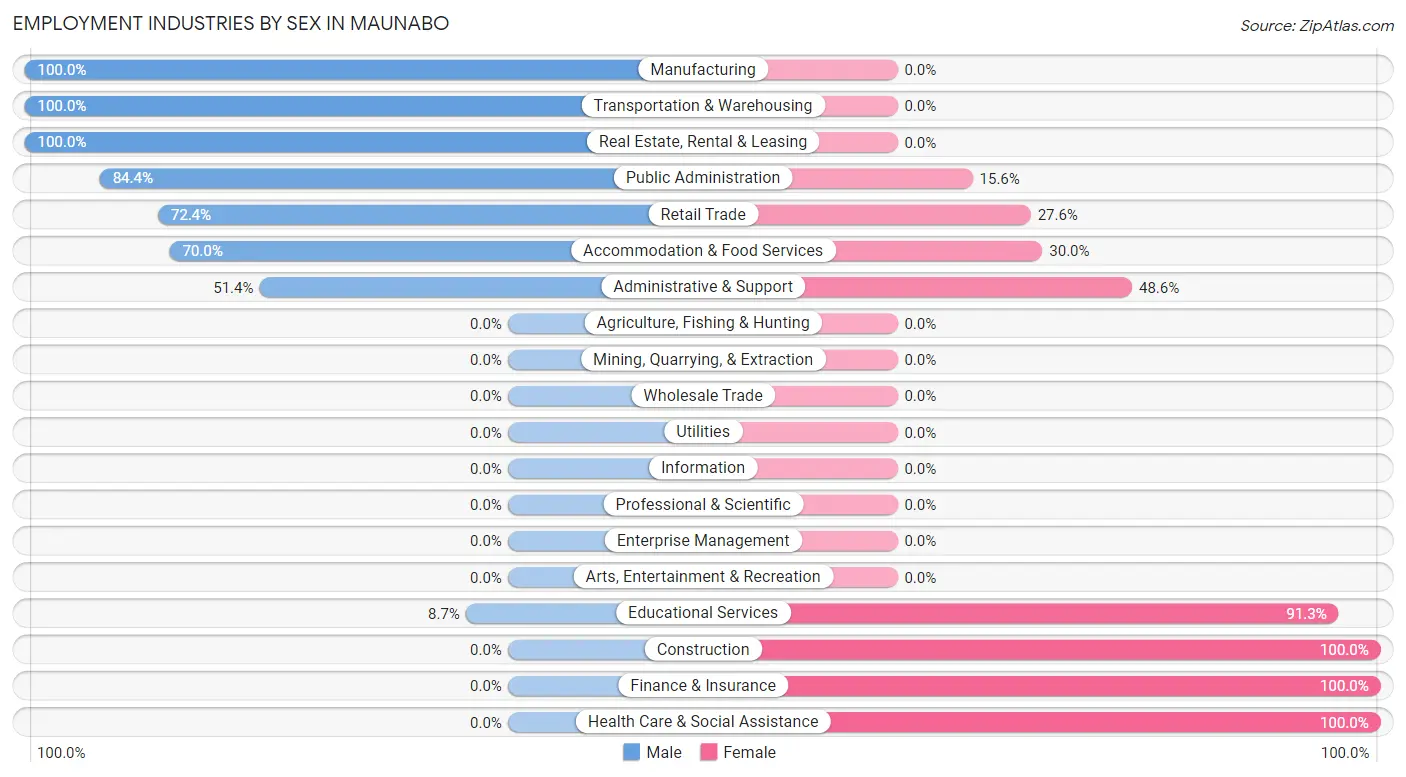
Employment Industries by Sex in Maunabo
The Maunabo industries that see more men than women are Manufacturing (100.0%), Transportation & Warehousing (100.0%), and Real Estate, Rental & Leasing (100.0%), whereas the industries that tend to have a higher number of women are Construction (100.0%), Finance & Insurance (100.0%), and Health Care & Social Assistance (100.0%).
| Industry | Male | Female |
| Agriculture, Fishing & Hunting | 0 (0.0%) | 0 (0.0%) |
| Mining, Quarrying, & Extraction | 0 (0.0%) | 0 (0.0%) |
| Construction | 0 (0.0%) | 6 (100.0%) |
| Manufacturing | 37 (100.0%) | 0 (0.0%) |
| Wholesale Trade | 0 (0.0%) | 0 (0.0%) |
| Retail Trade | 21 (72.4%) | 8 (27.6%) |
| Transportation & Warehousing | 9 (100.0%) | 0 (0.0%) |
| Utilities | 0 (0.0%) | 0 (0.0%) |
| Information | 0 (0.0%) | 0 (0.0%) |
| Finance & Insurance | 0 (0.0%) | 22 (100.0%) |
| Real Estate, Rental & Leasing | 24 (100.0%) | 0 (0.0%) |
| Professional & Scientific | 0 (0.0%) | 0 (0.0%) |
| Enterprise Management | 0 (0.0%) | 0 (0.0%) |
| Administrative & Support | 18 (51.4%) | 17 (48.6%) |
| Educational Services | 6 (8.7%) | 63 (91.3%) |
| Health Care & Social Assistance | 0 (0.0%) | 12 (100.0%) |
| Arts, Entertainment & Recreation | 0 (0.0%) | 0 (0.0%) |
| Accommodation & Food Services | 21 (70.0%) | 9 (30.0%) |
| Public Administration | 38 (84.4%) | 7 (15.6%) |
| Total | 174 (54.7%) | 144 (45.3%) |
Education in Maunabo
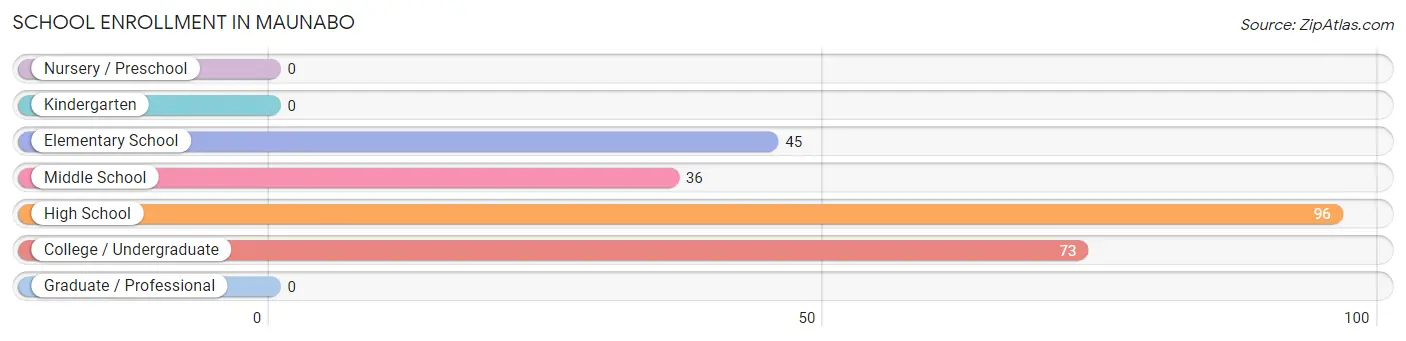
School Enrollment in Maunabo
The most common levels of schooling among the 250 students in Maunabo are high school (96 | 38.4%), college / undergraduate (73 | 29.2%), and elementary school (45 | 18.0%).
| School Level | # Students | % Students |
| Nursery / Preschool | 0 | 0.0% |
| Kindergarten | 0 | 0.0% |
| Elementary School | 45 | 18.0% |
| Middle School | 36 | 14.4% |
| High School | 96 | 38.4% |
| College / Undergraduate | 73 | 29.2% |
| Graduate / Professional | 0 | 0.0% |
| Total | 250 | 100.0% |
School Enrollment by Age by Funding Source in Maunabo
Out of a total of 250 students who are enrolled in schools in Maunabo, 82 (32.8%) attend a private institution, while the remaining 168 (67.2%) are enrolled in public schools. The age group of 20 to 24 year olds has the highest likelihood of being enrolled in private schools, with 17 (100.0% in the age bracket) enrolled. Conversely, the age group of 10 to 14 year olds has the lowest likelihood of being enrolled in a private school, with 63 (100.0% in the age bracket) attending a public institution.
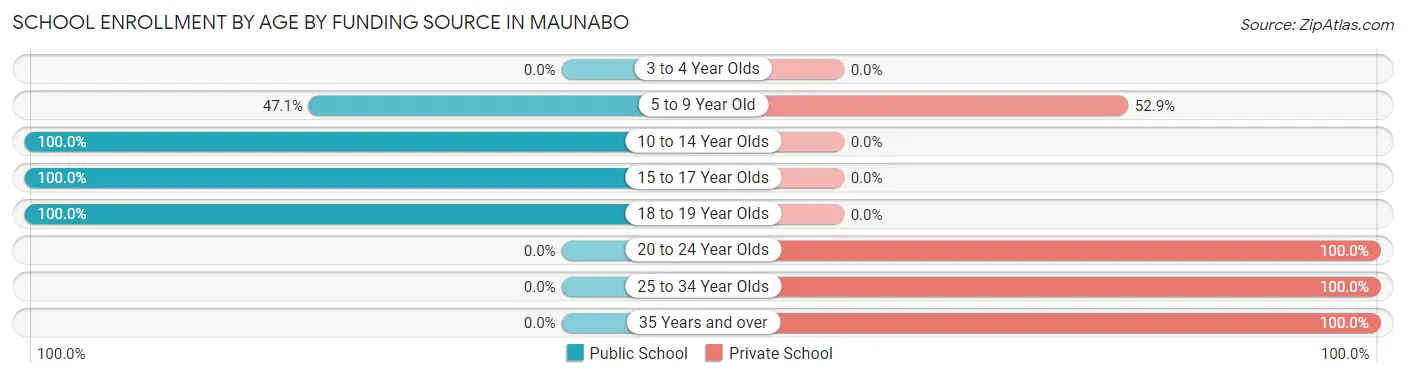
| Age Bracket | Public School | Private School |
| 3 to 4 Year Olds | 0 (0.0%) | 0 (0.0%) |
| 5 to 9 Year Old | 16 (47.1%) | 18 (52.9%) |
| 10 to 14 Year Olds | 63 (100.0%) | 0 (0.0%) |
| 15 to 17 Year Olds | 80 (100.0%) | 0 (0.0%) |
| 18 to 19 Year Olds | 9 (100.0%) | 0 (0.0%) |
| 20 to 24 Year Olds | 0 (0.0%) | 17 (100.0%) |
| 25 to 34 Year Olds | 0 (0.0%) | 20 (100.0%) |
| 35 Years and over | 0 (0.0%) | 27 (100.0%) |
| Total | 168 (67.2%) | 82 (32.8%) |
Educational Attainment by Field of Study in Maunabo
Education (114 | 51.1%), business (64 | 28.7%), bio, nature & agricultural (23 | 10.3%), physical & health sciences (12 | 5.4%), and science & technology (10 | 4.5%) are the most common fields of study among 223 individuals in Maunabo who have obtained a bachelor's degree or higher.
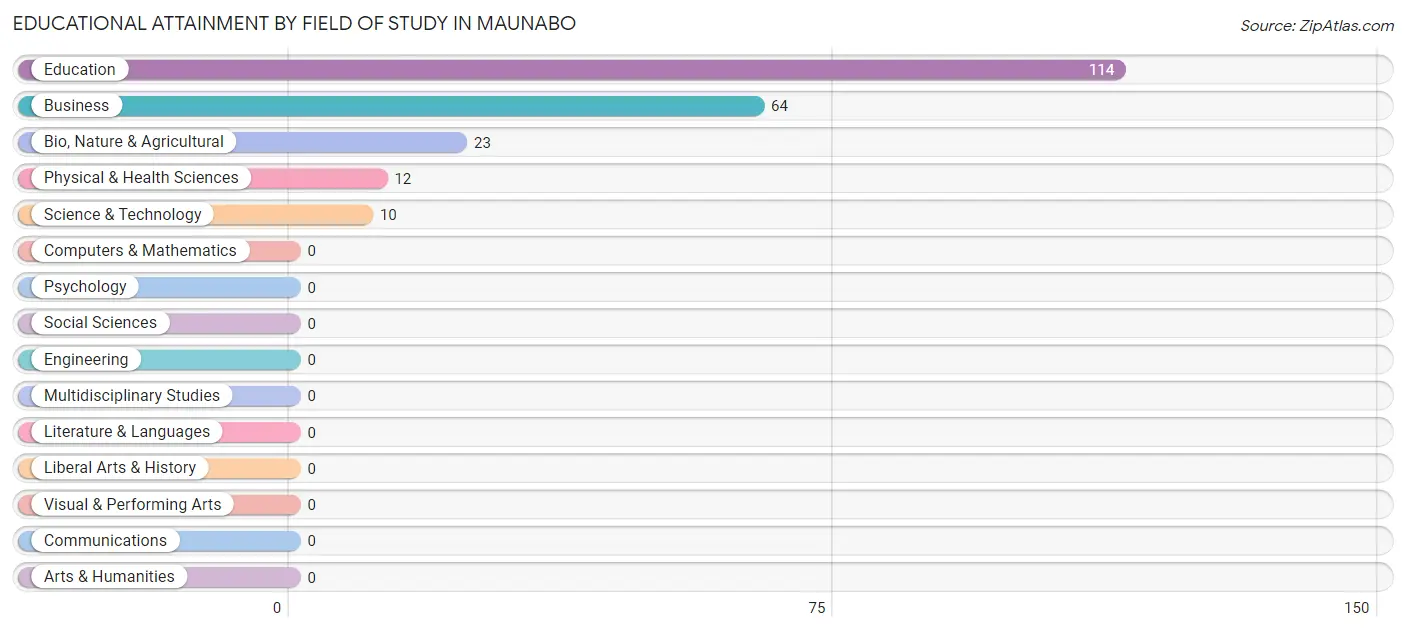
| Field of Study | # Graduates | % Graduates |
| Computers & Mathematics | 0 | 0.0% |
| Bio, Nature & Agricultural | 23 | 10.3% |
| Physical & Health Sciences | 12 | 5.4% |
| Psychology | 0 | 0.0% |
| Social Sciences | 0 | 0.0% |
| Engineering | 0 | 0.0% |
| Multidisciplinary Studies | 0 | 0.0% |
| Science & Technology | 10 | 4.5% |
| Business | 64 | 28.7% |
| Education | 114 | 51.1% |
| Literature & Languages | 0 | 0.0% |
| Liberal Arts & History | 0 | 0.0% |
| Visual & Performing Arts | 0 | 0.0% |
| Communications | 0 | 0.0% |
| Arts & Humanities | 0 | 0.0% |
| Total | 223 | 100.0% |
Transportation & Commute in Maunabo
Vehicle Availability by Sex in Maunabo
The most prevalent vehicle ownership categories in Maunabo are males with 2 vehicles (92, accounting for 60.1%) and females with 2 vehicles (57, making up 76.0%).
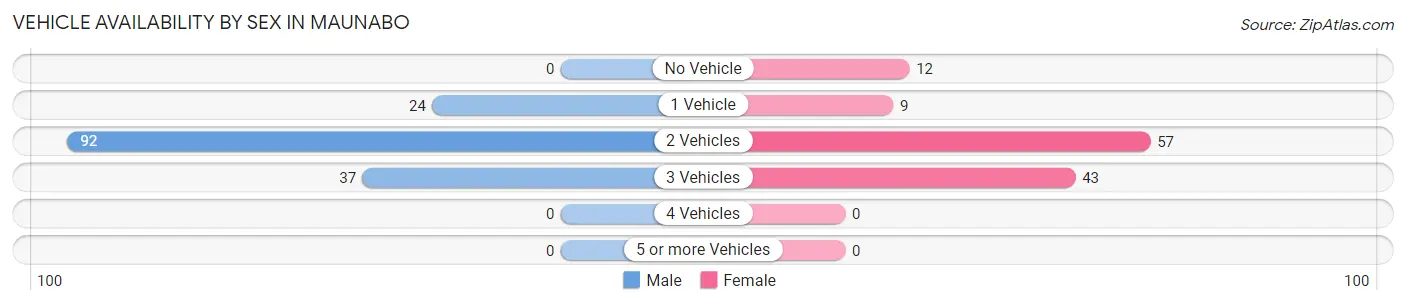
| Vehicles Available | Male | Female |
| No Vehicle | 0 (0.0%) | 12 (9.9%) |
| 1 Vehicle | 24 (15.7%) | 9 (7.4%) |
| 2 Vehicles | 92 (60.1%) | 57 (47.1%) |
| 3 Vehicles | 37 (24.2%) | 43 (35.5%) |
| 4 Vehicles | 0 (0.0%) | 0 (0.0%) |
| 5 or more Vehicles | 0 (0.0%) | 0 (0.0%) |
| Total | 153 (100.0%) | 121 (100.0%) |
Commute Time in Maunabo
The most frequently occuring commute durations in Maunabo are less than 5 minutes (48 commuters, 17.5%), 30 to 34 minutes (46 commuters, 16.8%), and 45 to 59 minutes (38 commuters, 13.9%).
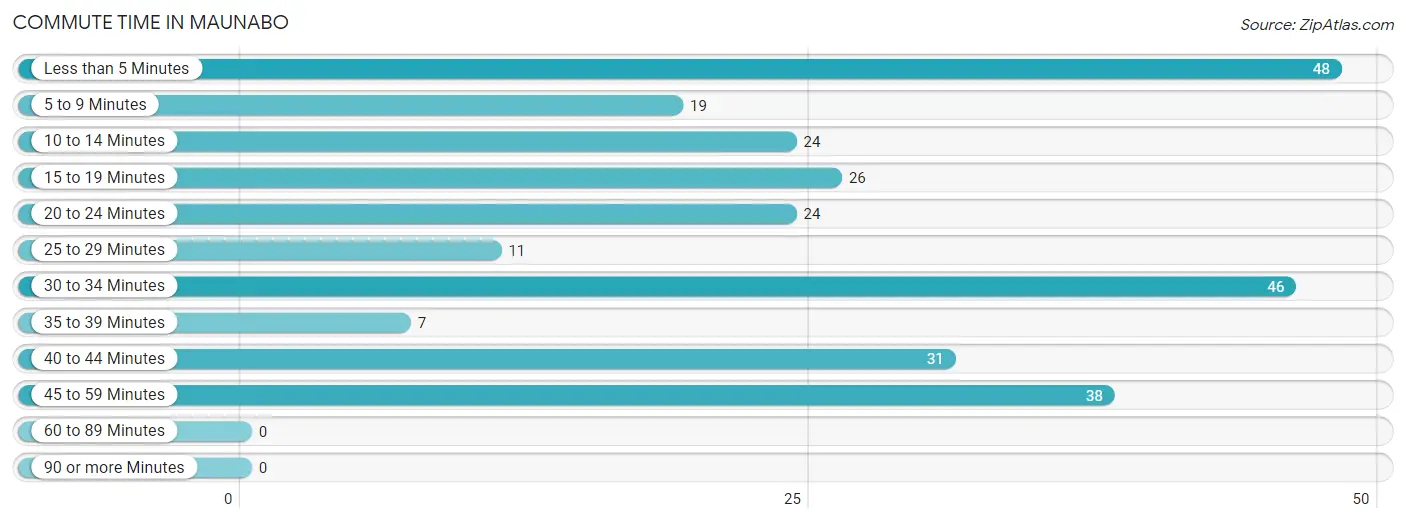
| Commute Time | # Commuters | % Commuters |
| Less than 5 Minutes | 48 | 17.5% |
| 5 to 9 Minutes | 19 | 6.9% |
| 10 to 14 Minutes | 24 | 8.8% |
| 15 to 19 Minutes | 26 | 9.5% |
| 20 to 24 Minutes | 24 | 8.8% |
| 25 to 29 Minutes | 11 | 4.0% |
| 30 to 34 Minutes | 46 | 16.8% |
| 35 to 39 Minutes | 7 | 2.5% |
| 40 to 44 Minutes | 31 | 11.3% |
| 45 to 59 Minutes | 38 | 13.9% |
| 60 to 89 Minutes | 0 | 0.0% |
| 90 or more Minutes | 0 | 0.0% |
Commute Time by Sex in Maunabo
The most common commute times in Maunabo are 45 to 59 minutes (32 commuters, 20.9%) for males and 15 to 19 minutes (26 commuters, 21.5%) for females.
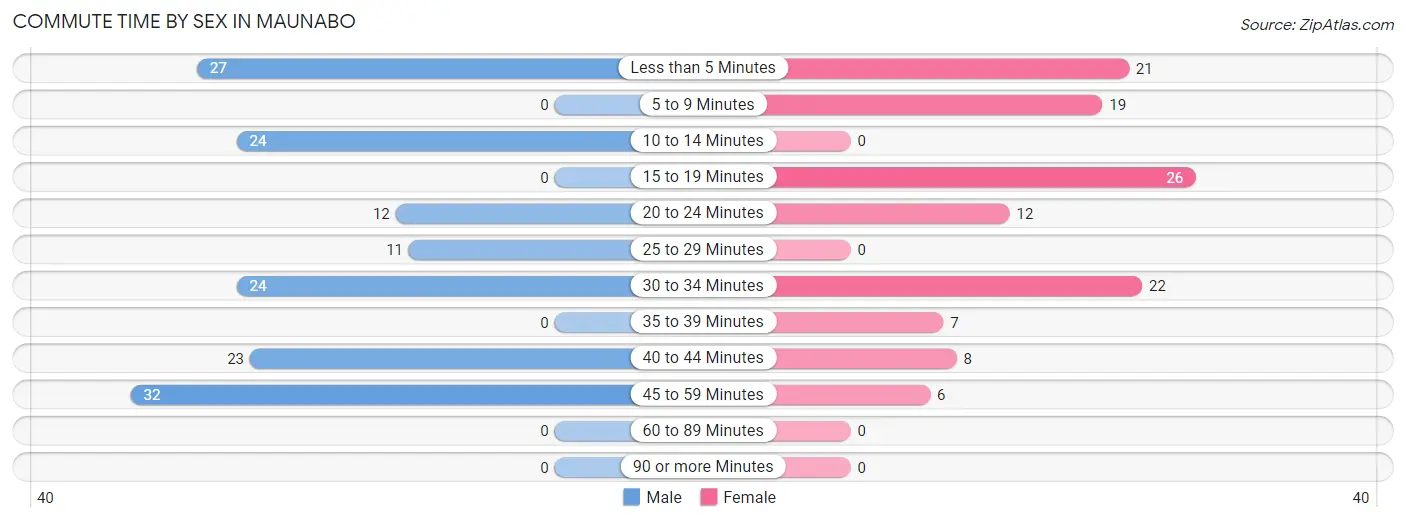
| Commute Time | Male | Female |
| Less than 5 Minutes | 27 (17.6%) | 21 (17.4%) |
| 5 to 9 Minutes | 0 (0.0%) | 19 (15.7%) |
| 10 to 14 Minutes | 24 (15.7%) | 0 (0.0%) |
| 15 to 19 Minutes | 0 (0.0%) | 26 (21.5%) |
| 20 to 24 Minutes | 12 (7.8%) | 12 (9.9%) |
| 25 to 29 Minutes | 11 (7.2%) | 0 (0.0%) |
| 30 to 34 Minutes | 24 (15.7%) | 22 (18.2%) |
| 35 to 39 Minutes | 0 (0.0%) | 7 (5.8%) |
| 40 to 44 Minutes | 23 (15.0%) | 8 (6.6%) |
| 45 to 59 Minutes | 32 (20.9%) | 6 (5.0%) |
| 60 to 89 Minutes | 0 (0.0%) | 0 (0.0%) |
| 90 or more Minutes | 0 (0.0%) | 0 (0.0%) |
Time of Departure to Work by Sex in Maunabo
The most frequent times of departure to work in Maunabo are 7:30 AM to 7:59 AM (38, 24.8%) for males and 7:30 AM to 7:59 AM (57, 47.1%) for females.
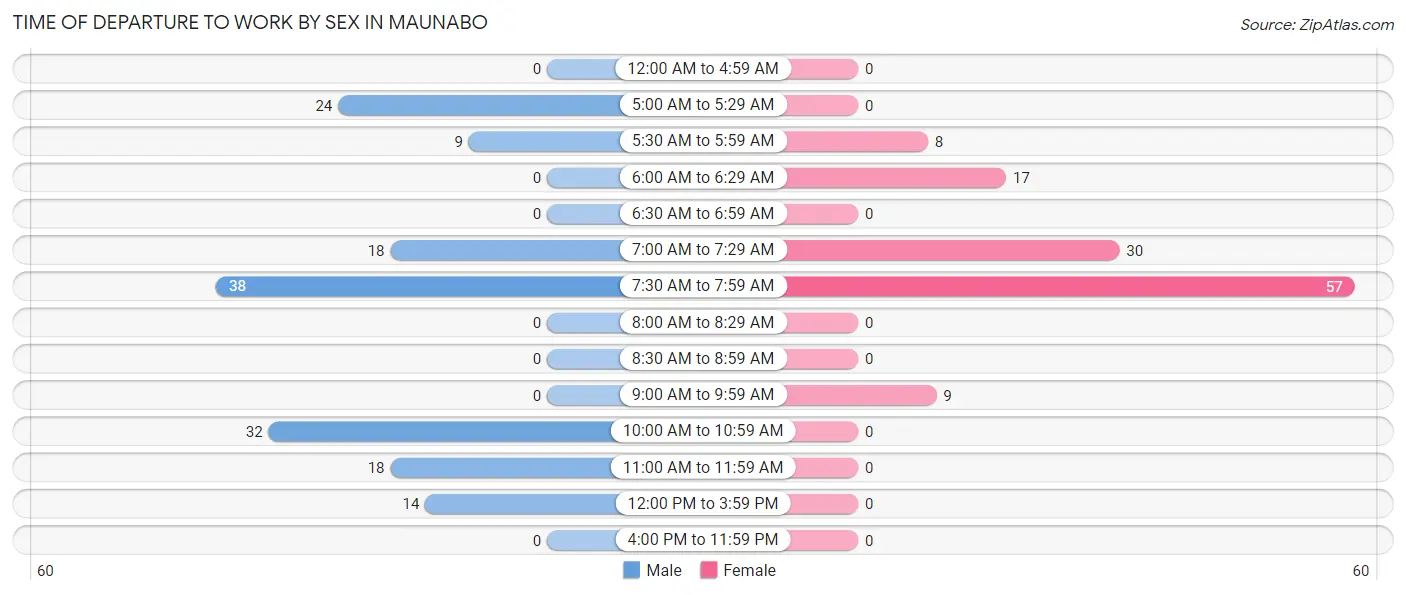
| Time of Departure | Male | Female |
| 12:00 AM to 4:59 AM | 0 (0.0%) | 0 (0.0%) |
| 5:00 AM to 5:29 AM | 24 (15.7%) | 0 (0.0%) |
| 5:30 AM to 5:59 AM | 9 (5.9%) | 8 (6.6%) |
| 6:00 AM to 6:29 AM | 0 (0.0%) | 17 (14.1%) |
| 6:30 AM to 6:59 AM | 0 (0.0%) | 0 (0.0%) |
| 7:00 AM to 7:29 AM | 18 (11.8%) | 30 (24.8%) |
| 7:30 AM to 7:59 AM | 38 (24.8%) | 57 (47.1%) |
| 8:00 AM to 8:29 AM | 0 (0.0%) | 0 (0.0%) |
| 8:30 AM to 8:59 AM | 0 (0.0%) | 0 (0.0%) |
| 9:00 AM to 9:59 AM | 0 (0.0%) | 9 (7.4%) |
| 10:00 AM to 10:59 AM | 32 (20.9%) | 0 (0.0%) |
| 11:00 AM to 11:59 AM | 18 (11.8%) | 0 (0.0%) |
| 12:00 PM to 3:59 PM | 14 (9.1%) | 0 (0.0%) |
| 4:00 PM to 11:59 PM | 0 (0.0%) | 0 (0.0%) |
| Total | 153 (100.0%) | 121 (100.0%) |
Housing Occupancy in Maunabo
Occupancy by Ownership in Maunabo
Of the total 583 dwellings in Maunabo, owner-occupied units account for 417 (71.5%), while renter-occupied units make up 166 (28.5%).
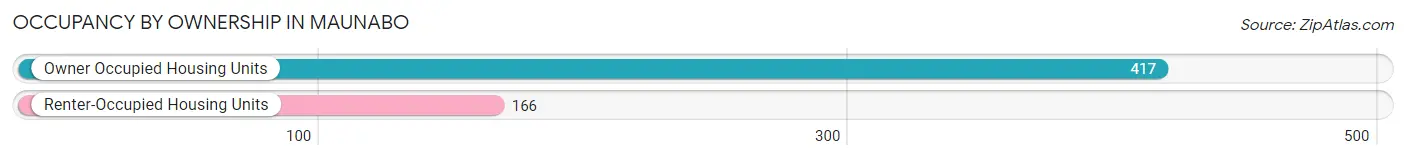
| Occupancy | # Housing Units | % Housing Units |
| Owner Occupied Housing Units | 417 | 71.5% |
| Renter-Occupied Housing Units | 166 | 28.5% |
| Total Occupied Housing Units | 583 | 100.0% |
Occupancy by Household Size in Maunabo
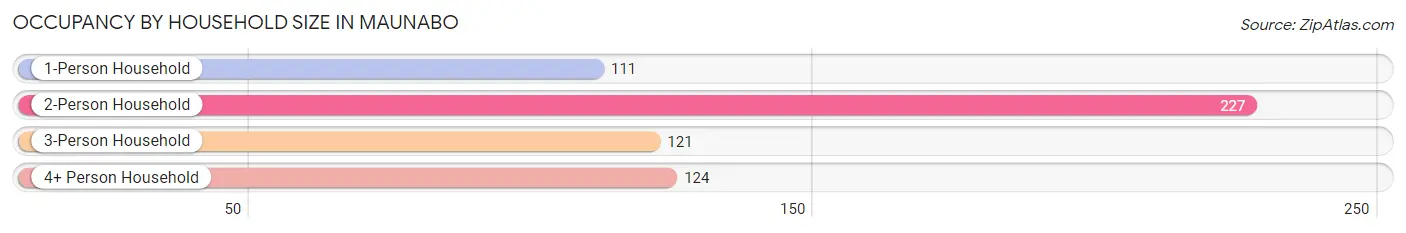
| Household Size | # Housing Units | % Housing Units |
| 1-Person Household | 111 | 19.0% |
| 2-Person Household | 227 | 38.9% |
| 3-Person Household | 121 | 20.7% |
| 4+ Person Household | 124 | 21.3% |
| Total Housing Units | 583 | 100.0% |
Occupancy by Ownership by Household Size in Maunabo
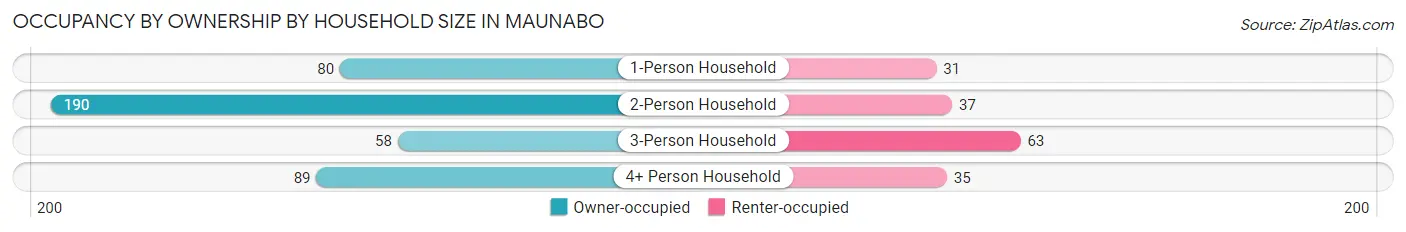
| Household Size | Owner-occupied | Renter-occupied |
| 1-Person Household | 80 (72.1%) | 31 (27.9%) |
| 2-Person Household | 190 (83.7%) | 37 (16.3%) |
| 3-Person Household | 58 (47.9%) | 63 (52.1%) |
| 4+ Person Household | 89 (71.8%) | 35 (28.2%) |
| Total Housing Units | 417 (71.5%) | 166 (28.5%) |
Occupancy by Educational Attainment in Maunabo
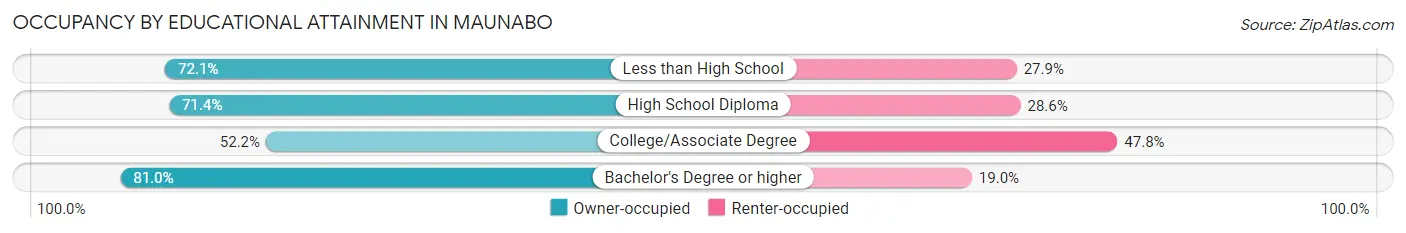
| Household Size | Owner-occupied | Renter-occupied |
| Less than High School | 88 (72.1%) | 34 (27.9%) |
| High School Diploma | 182 (71.4%) | 73 (28.6%) |
| College/Associate Degree | 36 (52.2%) | 33 (47.8%) |
| Bachelor's Degree or higher | 111 (81.0%) | 26 (19.0%) |
Occupancy by Age of Householder in Maunabo
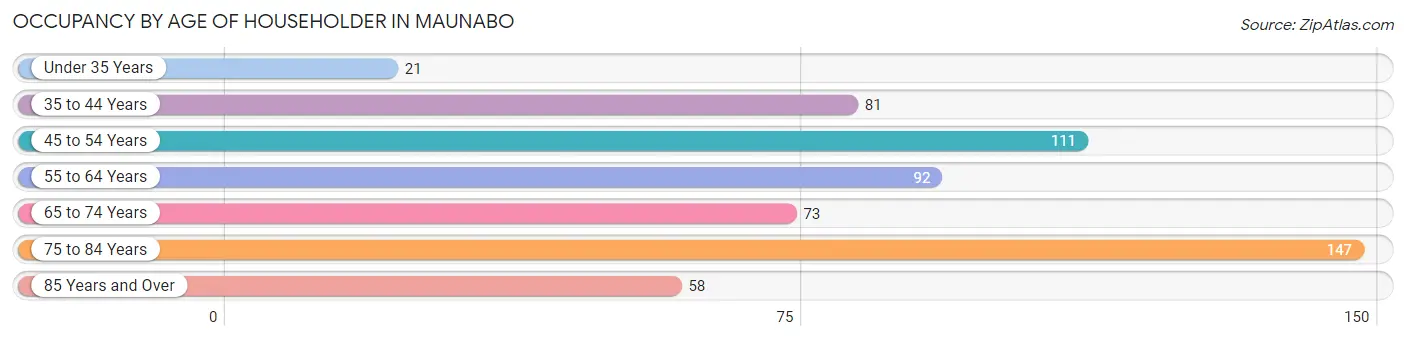
| Age Bracket | # Households | % Households |
| Under 35 Years | 21 | 3.6% |
| 35 to 44 Years | 81 | 13.9% |
| 45 to 54 Years | 111 | 19.0% |
| 55 to 64 Years | 92 | 15.8% |
| 65 to 74 Years | 73 | 12.5% |
| 75 to 84 Years | 147 | 25.2% |
| 85 Years and Over | 58 | 10.0% |
| Total | 583 | 100.0% |
Housing Finances in Maunabo
Median Income by Occupancy in Maunabo
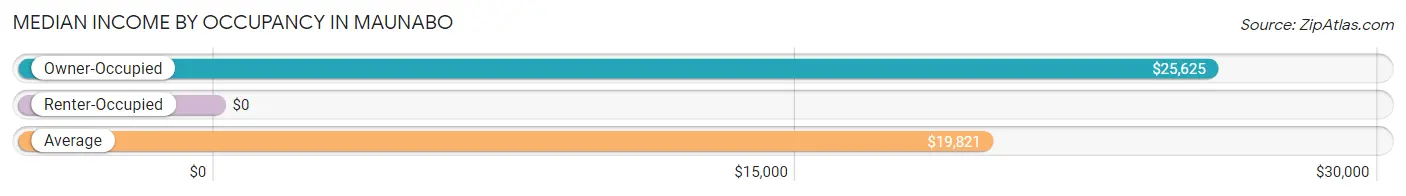
| Occupancy Type | # Households | Median Income |
| Owner-Occupied | 417 (71.5%) | $25,625 |
| Renter-Occupied | 166 (28.5%) | $0 |
| Average | 583 (100.0%) | $19,821 |
Occupancy by Householder Income Bracket in Maunabo
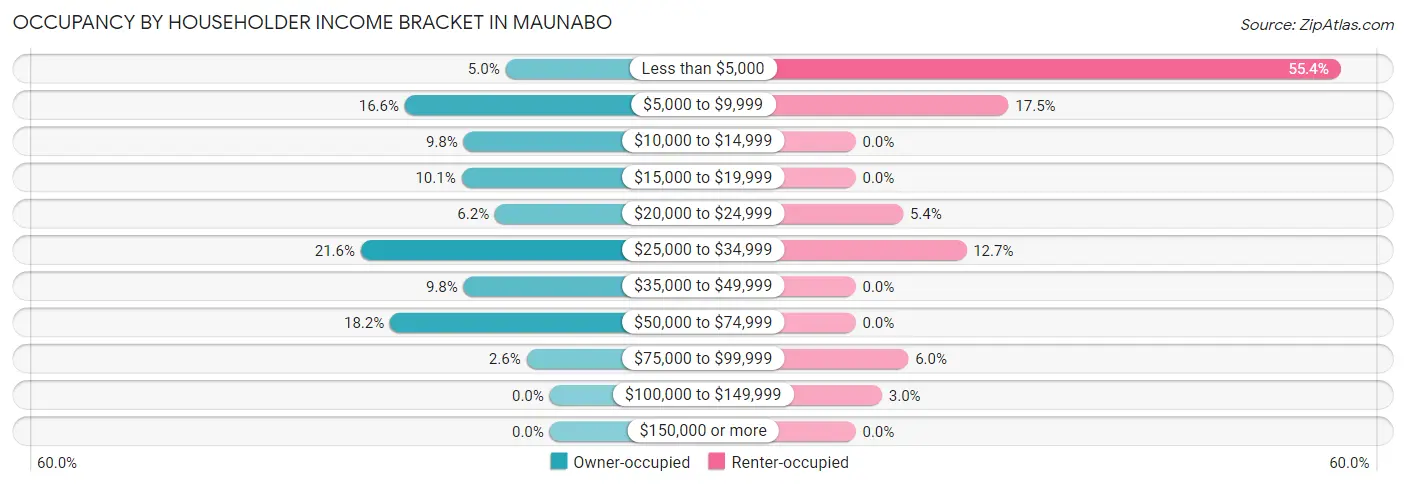
| Income Bracket | Owner-occupied | Renter-occupied |
| Less than $5,000 | 21 (5.0%) | 92 (55.4%) |
| $5,000 to $9,999 | 69 (16.6%) | 29 (17.5%) |
| $10,000 to $14,999 | 41 (9.8%) | 0 (0.0%) |
| $15,000 to $19,999 | 42 (10.1%) | 0 (0.0%) |
| $20,000 to $24,999 | 26 (6.2%) | 9 (5.4%) |
| $25,000 to $34,999 | 90 (21.6%) | 21 (12.7%) |
| $35,000 to $49,999 | 41 (9.8%) | 0 (0.0%) |
| $50,000 to $74,999 | 76 (18.2%) | 0 (0.0%) |
| $75,000 to $99,999 | 11 (2.6%) | 10 (6.0%) |
| $100,000 to $149,999 | 0 (0.0%) | 5 (3.0%) |
| $150,000 or more | 0 (0.0%) | 0 (0.0%) |
| Total | 417 (100.0%) | 166 (100.0%) |
Monthly Housing Cost Tiers in Maunabo
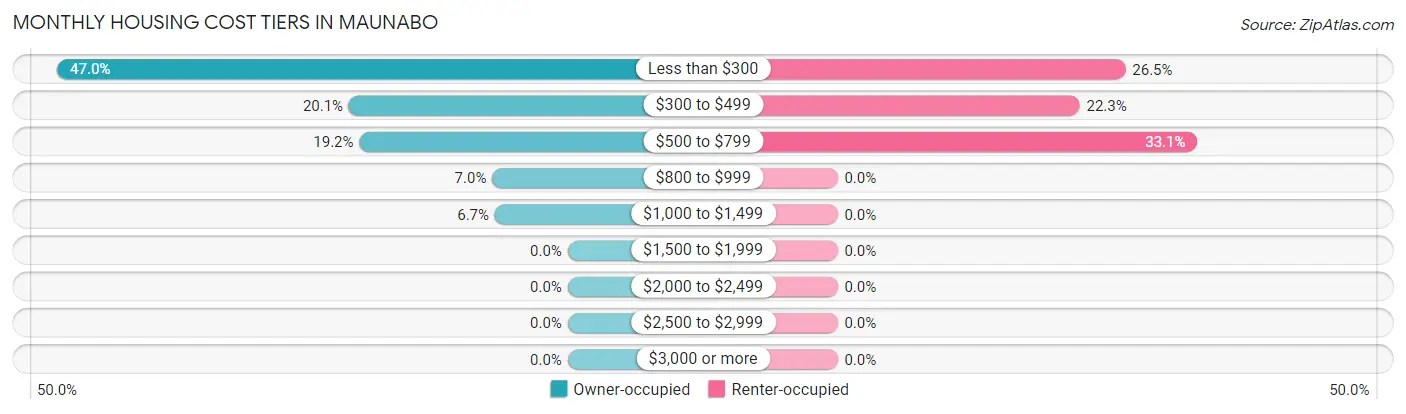
| Monthly Cost | Owner-occupied | Renter-occupied |
| Less than $300 | 196 (47.0%) | 44 (26.5%) |
| $300 to $499 | 84 (20.1%) | 37 (22.3%) |
| $500 to $799 | 80 (19.2%) | 55 (33.1%) |
| $800 to $999 | 29 (7.0%) | 0 (0.0%) |
| $1,000 to $1,499 | 28 (6.7%) | 0 (0.0%) |
| $1,500 to $1,999 | 0 (0.0%) | 0 (0.0%) |
| $2,000 to $2,499 | 0 (0.0%) | 0 (0.0%) |
| $2,500 to $2,999 | 0 (0.0%) | 0 (0.0%) |
| $3,000 or more | 0 (0.0%) | 0 (0.0%) |
| Total | 417 (100.0%) | 166 (100.0%) |
Physical Housing Characteristics in Maunabo
Housing Structures in Maunabo
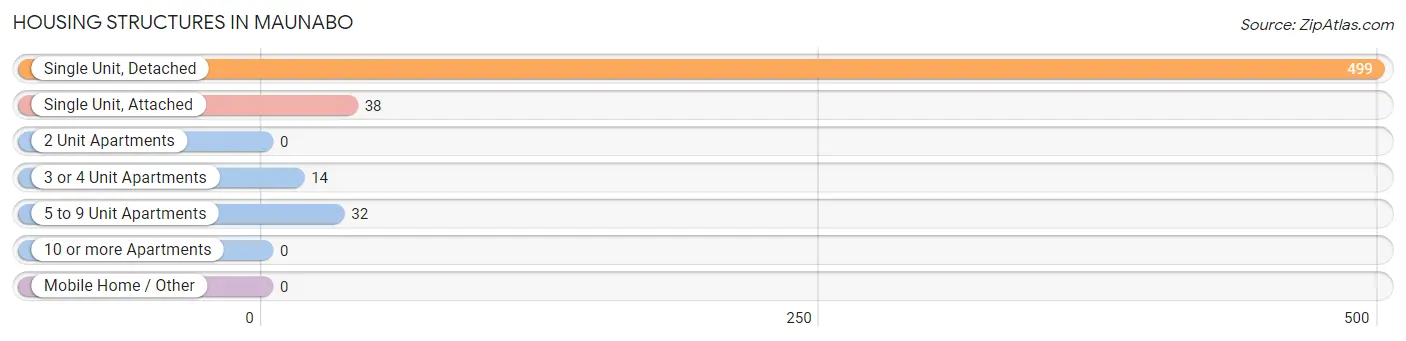
| Structure Type | # Housing Units | % Housing Units |
| Single Unit, Detached | 499 | 85.6% |
| Single Unit, Attached | 38 | 6.5% |
| 2 Unit Apartments | 0 | 0.0% |
| 3 or 4 Unit Apartments | 14 | 2.4% |
| 5 to 9 Unit Apartments | 32 | 5.5% |
| 10 or more Apartments | 0 | 0.0% |
| Mobile Home / Other | 0 | 0.0% |
| Total | 583 | 100.0% |
Housing Structures by Occupancy in Maunabo
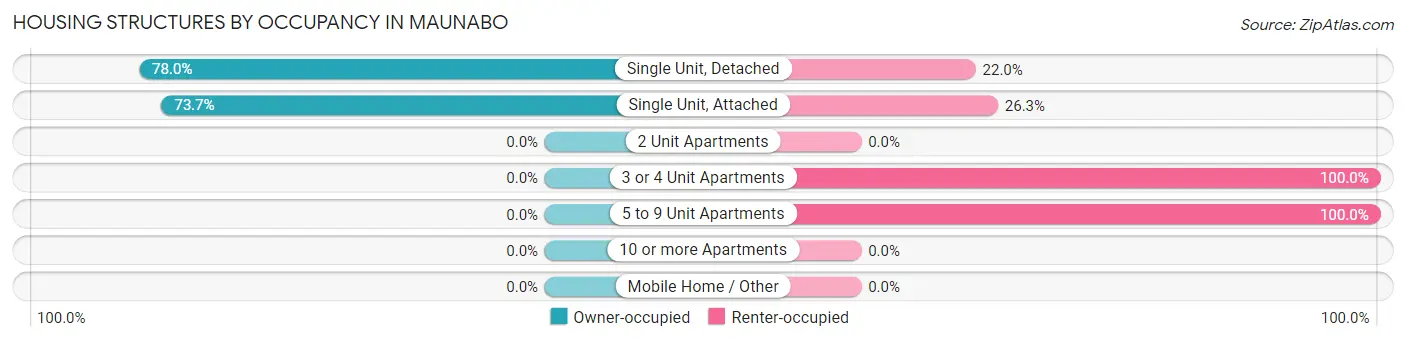
| Structure Type | Owner-occupied | Renter-occupied |
| Single Unit, Detached | 389 (78.0%) | 110 (22.0%) |
| Single Unit, Attached | 28 (73.7%) | 10 (26.3%) |
| 2 Unit Apartments | 0 (0.0%) | 0 (0.0%) |
| 3 or 4 Unit Apartments | 0 (0.0%) | 14 (100.0%) |
| 5 to 9 Unit Apartments | 0 (0.0%) | 32 (100.0%) |
| 10 or more Apartments | 0 (0.0%) | 0 (0.0%) |
| Mobile Home / Other | 0 (0.0%) | 0 (0.0%) |
| Total | 417 (71.5%) | 166 (28.5%) |
Housing Structures by Number of Rooms in Maunabo
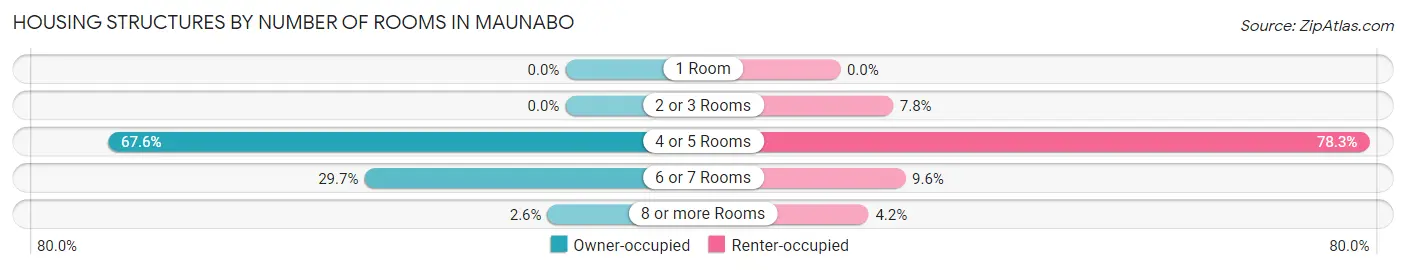
| Number of Rooms | Owner-occupied | Renter-occupied |
| 1 Room | 0 (0.0%) | 0 (0.0%) |
| 2 or 3 Rooms | 0 (0.0%) | 13 (7.8%) |
| 4 or 5 Rooms | 282 (67.6%) | 130 (78.3%) |
| 6 or 7 Rooms | 124 (29.7%) | 16 (9.6%) |
| 8 or more Rooms | 11 (2.6%) | 7 (4.2%) |
| Total | 417 (100.0%) | 166 (100.0%) |
Housing Structure by Heating Type in Maunabo
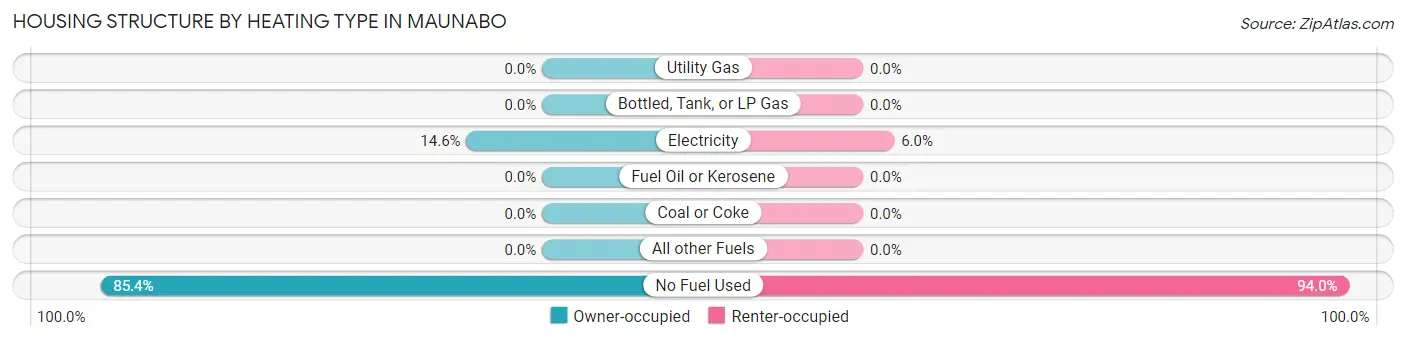
| Heating Type | Owner-occupied | Renter-occupied |
| Utility Gas | 0 (0.0%) | 0 (0.0%) |
| Bottled, Tank, or LP Gas | 0 (0.0%) | 0 (0.0%) |
| Electricity | 61 (14.6%) | 10 (6.0%) |
| Fuel Oil or Kerosene | 0 (0.0%) | 0 (0.0%) |
| Coal or Coke | 0 (0.0%) | 0 (0.0%) |
| All other Fuels | 0 (0.0%) | 0 (0.0%) |
| No Fuel Used | 356 (85.4%) | 156 (94.0%) |
| Total | 417 (100.0%) | 166 (100.0%) |
Household Vehicle Usage in Maunabo
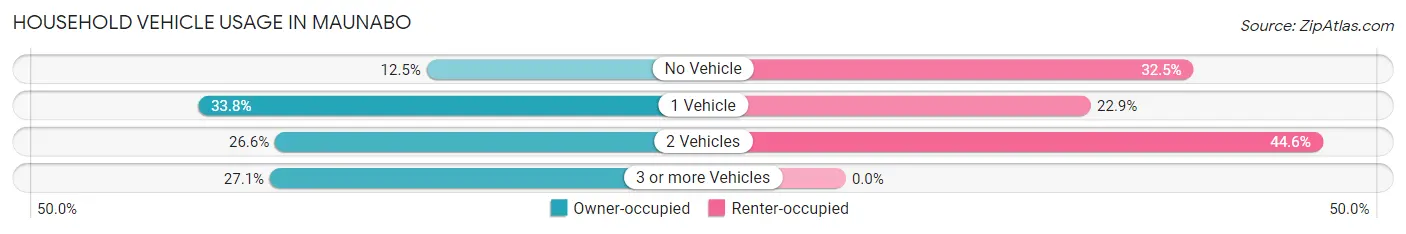
| Vehicles per Household | Owner-occupied | Renter-occupied |
| No Vehicle | 52 (12.5%) | 54 (32.5%) |
| 1 Vehicle | 141 (33.8%) | 38 (22.9%) |
| 2 Vehicles | 111 (26.6%) | 74 (44.6%) |
| 3 or more Vehicles | 113 (27.1%) | 0 (0.0%) |
| Total | 417 (100.0%) | 166 (100.0%) |
Real Estate & Mortgages in Maunabo
Real Estate and Mortgage Overview in Maunabo
| Characteristic | Without Mortgage | With Mortgage |
| Housing Units | 260 | 157 |
| Median Property Value | $130,900 | $104,300 |
| Median Household Income | $24,250 | $0 |
| Monthly Housing Costs | $178 | $0 |
| Real Estate Taxes | $527 | $157 |
Property Value by Mortgage Status in Maunabo
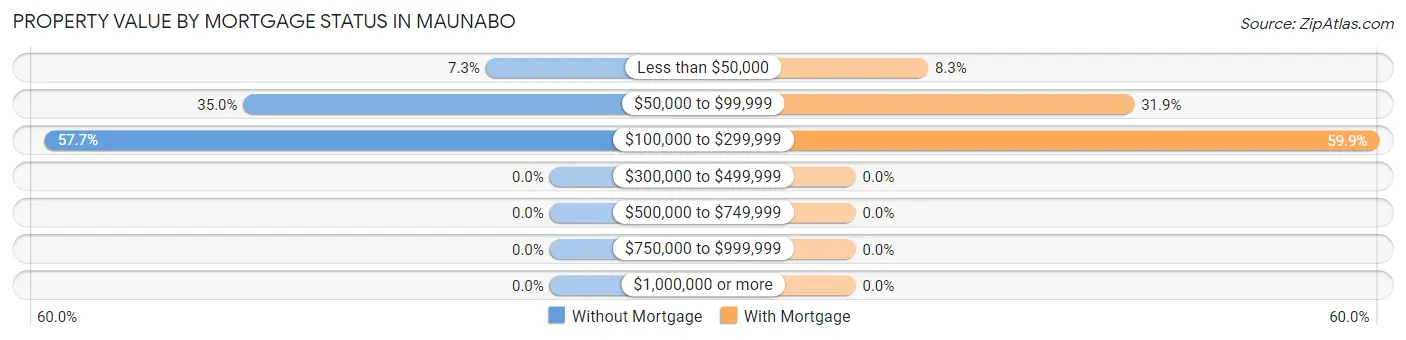
| Property Value | Without Mortgage | With Mortgage |
| Less than $50,000 | 19 (7.3%) | 13 (8.3%) |
| $50,000 to $99,999 | 91 (35.0%) | 50 (31.9%) |
| $100,000 to $299,999 | 150 (57.7%) | 94 (59.9%) |
| $300,000 to $499,999 | 0 (0.0%) | 0 (0.0%) |
| $500,000 to $749,999 | 0 (0.0%) | 0 (0.0%) |
| $750,000 to $999,999 | 0 (0.0%) | 0 (0.0%) |
| $1,000,000 or more | 0 (0.0%) | 0 (0.0%) |
| Total | 260 (100.0%) | 157 (100.0%) |
Household Income by Mortgage Status in Maunabo
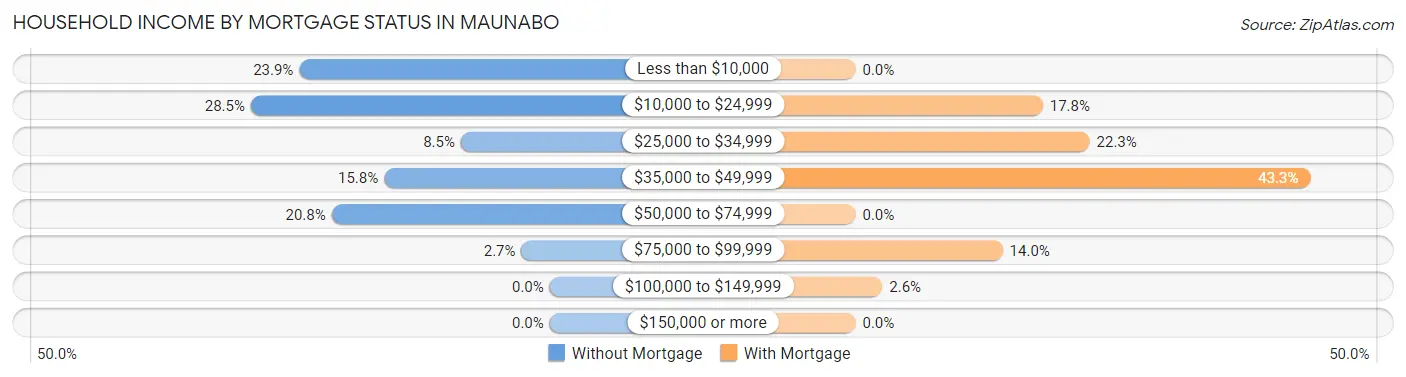
| Household Income | Without Mortgage | With Mortgage |
| Less than $10,000 | 62 (23.8%) | 0 (0.0%) |
| $10,000 to $24,999 | 74 (28.5%) | 28 (17.8%) |
| $25,000 to $34,999 | 22 (8.5%) | 35 (22.3%) |
| $35,000 to $49,999 | 41 (15.8%) | 68 (43.3%) |
| $50,000 to $74,999 | 54 (20.8%) | 0 (0.0%) |
| $75,000 to $99,999 | 7 (2.7%) | 22 (14.0%) |
| $100,000 to $149,999 | 0 (0.0%) | 4 (2.5%) |
| $150,000 or more | 0 (0.0%) | 0 (0.0%) |
| Total | 260 (100.0%) | 157 (100.0%) |
Property Value to Household Income Ratio in Maunabo
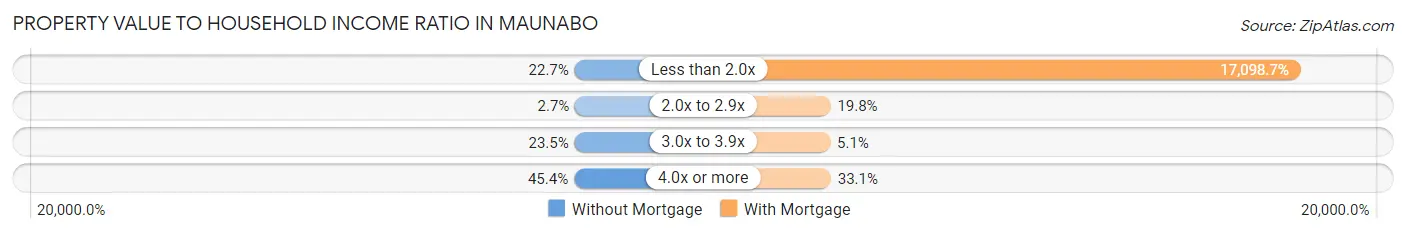
| Value-to-Income Ratio | Without Mortgage | With Mortgage |
| Less than 2.0x | 59 (22.7%) | 26,845 (17,098.7%) |
| 2.0x to 2.9x | 7 (2.7%) | 31 (19.8%) |
| 3.0x to 3.9x | 61 (23.5%) | 8 (5.1%) |
| 4.0x or more | 118 (45.4%) | 52 (33.1%) |
| Total | 260 (100.0%) | 157 (100.0%) |
Real Estate Taxes by Mortgage Status in Maunabo
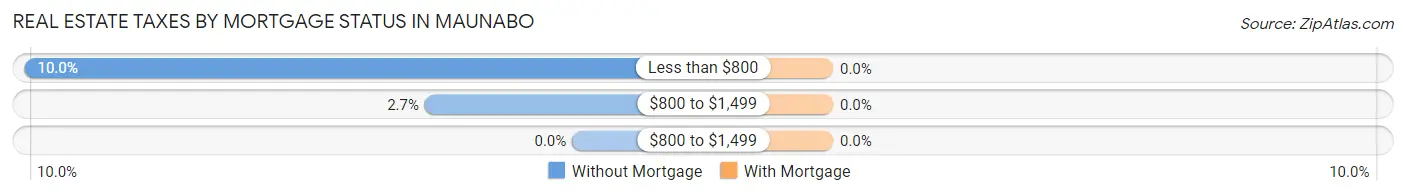
| Property Taxes | Without Mortgage | With Mortgage |
| Less than $800 | 26 (10.0%) | 0 (0.0%) |
| $800 to $1,499 | 7 (2.7%) | 0 (0.0%) |
| $800 to $1,499 | 0 (0.0%) | 0 (0.0%) |
| Total | 260 (100.0%) | 157 (100.0%) |
Health & Disability in Maunabo
Health Insurance Coverage by Age in Maunabo
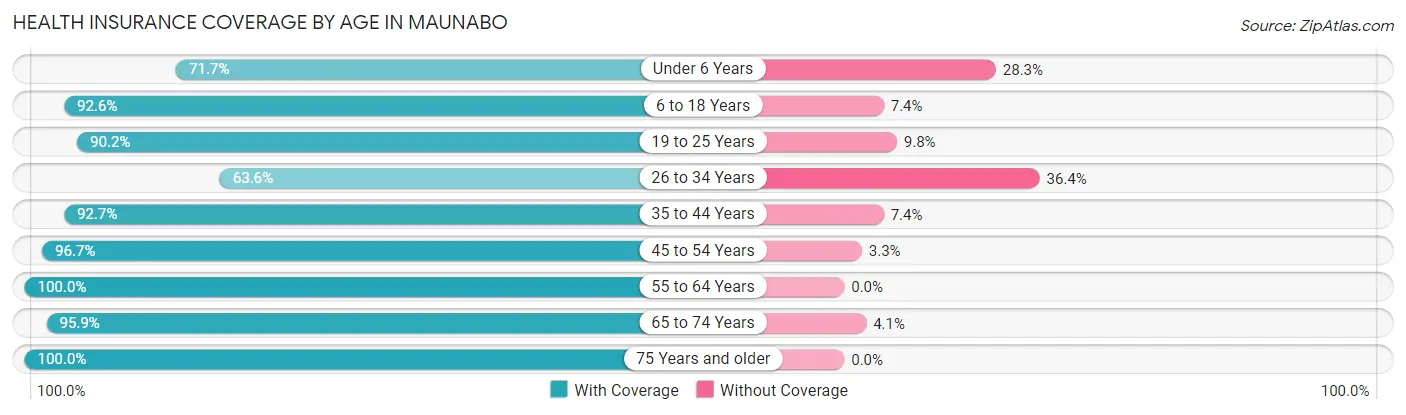
| Age Bracket | With Coverage | Without Coverage |
| Under 6 Years | 33 (71.7%) | 13 (28.3%) |
| 6 to 18 Years | 214 (92.6%) | 17 (7.4%) |
| 19 to 25 Years | 138 (90.2%) | 15 (9.8%) |
| 26 to 34 Years | 96 (63.6%) | 55 (36.4%) |
| 35 to 44 Years | 189 (92.6%) | 15 (7.3%) |
| 45 to 54 Years | 236 (96.7%) | 8 (3.3%) |
| 55 to 64 Years | 157 (100.0%) | 0 (0.0%) |
| 65 to 74 Years | 141 (95.9%) | 6 (4.1%) |
| 75 Years and older | 251 (100.0%) | 0 (0.0%) |
| Total | 1,455 (91.9%) | 129 (8.1%) |
Health Insurance Coverage by Citizenship Status in Maunabo
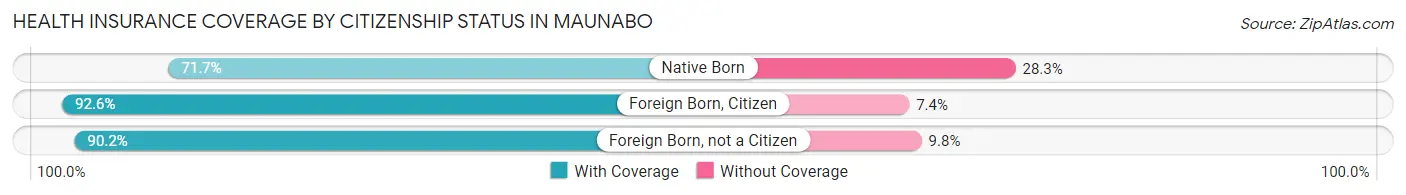
| Citizenship Status | With Coverage | Without Coverage |
| Native Born | 33 (71.7%) | 13 (28.3%) |
| Foreign Born, Citizen | 214 (92.6%) | 17 (7.4%) |
| Foreign Born, not a Citizen | 138 (90.2%) | 15 (9.8%) |
Health Insurance Coverage by Household Income in Maunabo
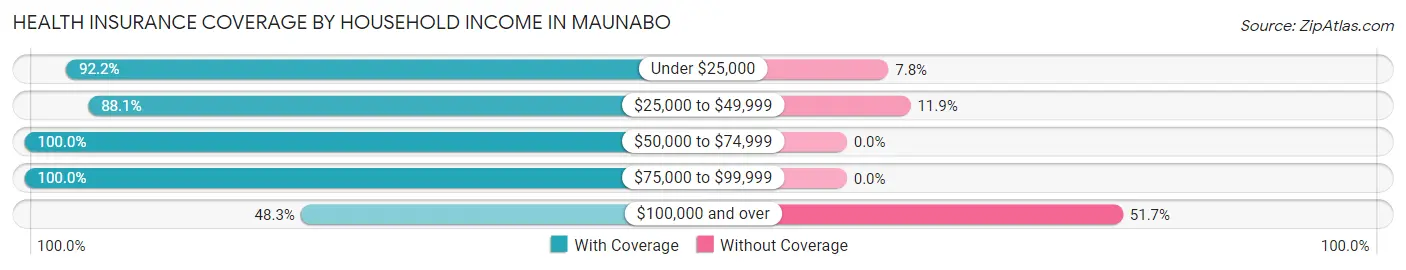
| Household Income | With Coverage | Without Coverage |
| Under $25,000 | 734 (92.2%) | 62 (7.8%) |
| $25,000 to $49,999 | 384 (88.1%) | 52 (11.9%) |
| $50,000 to $74,999 | 232 (100.0%) | 0 (0.0%) |
| $75,000 to $99,999 | 90 (100.0%) | 0 (0.0%) |
| $100,000 and over | 14 (48.3%) | 15 (51.7%) |
Public vs Private Health Insurance Coverage by Age in Maunabo
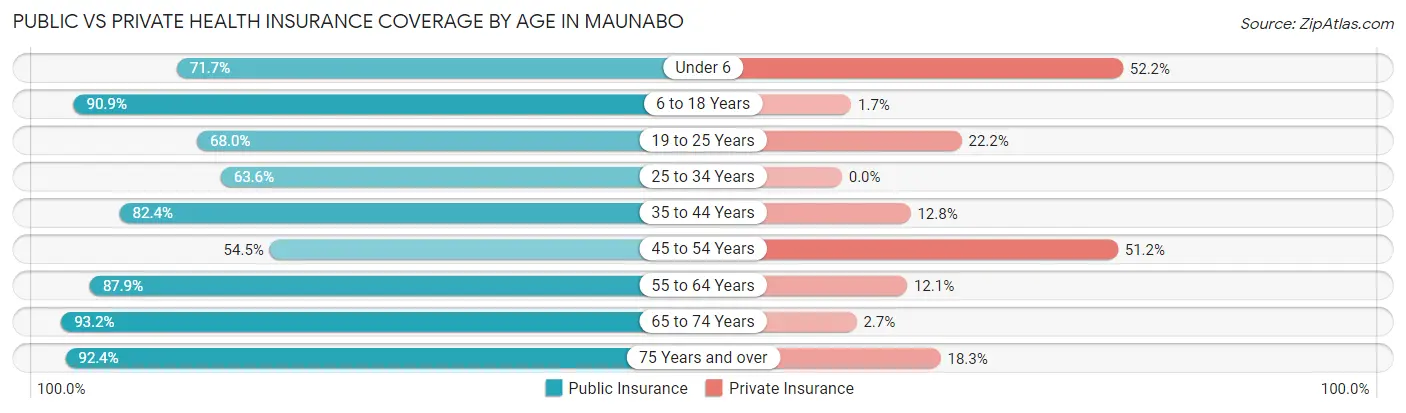
| Age Bracket | Public Insurance | Private Insurance |
| Under 6 | 33 (71.7%) | 24 (52.2%) |
| 6 to 18 Years | 210 (90.9%) | 4 (1.7%) |
| 19 to 25 Years | 104 (68.0%) | 34 (22.2%) |
| 25 to 34 Years | 96 (63.6%) | 0 (0.0%) |
| 35 to 44 Years | 168 (82.4%) | 26 (12.8%) |
| 45 to 54 Years | 133 (54.5%) | 125 (51.2%) |
| 55 to 64 Years | 138 (87.9%) | 19 (12.1%) |
| 65 to 74 Years | 137 (93.2%) | 4 (2.7%) |
| 75 Years and over | 232 (92.4%) | 46 (18.3%) |
| Total | 1,251 (79.0%) | 282 (17.8%) |
Disability Status by Sex by Age in Maunabo
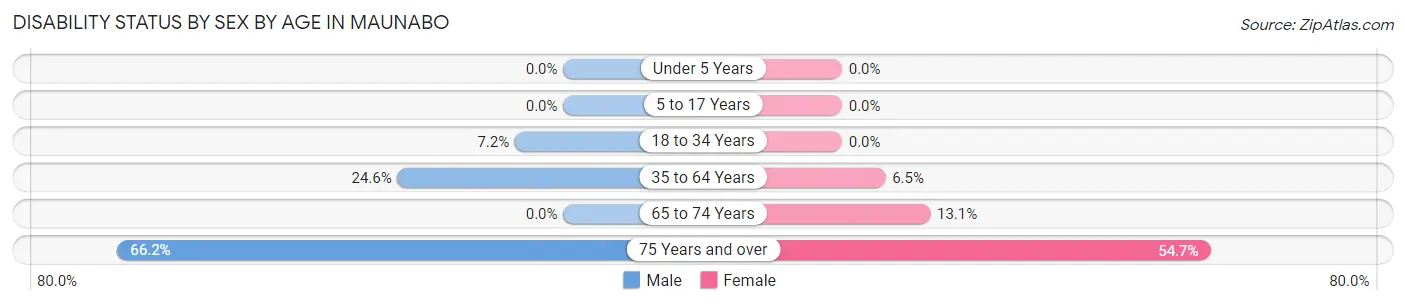
| Age Bracket | Male | Female |
| Under 5 Years | 0 (0.0%) | 0 (0.0%) |
| 5 to 17 Years | 0 (0.0%) | 0 (0.0%) |
| 18 to 34 Years | 17 (7.2%) | 0 (0.0%) |
| 35 to 64 Years | 65 (24.6%) | 22 (6.5%) |
| 65 to 74 Years | 0 (0.0%) | 11 (13.1%) |
| 75 Years and over | 96 (66.2%) | 58 (54.7%) |
Disability Class by Sex by Age in Maunabo
Disability Class: Hearing Difficulty
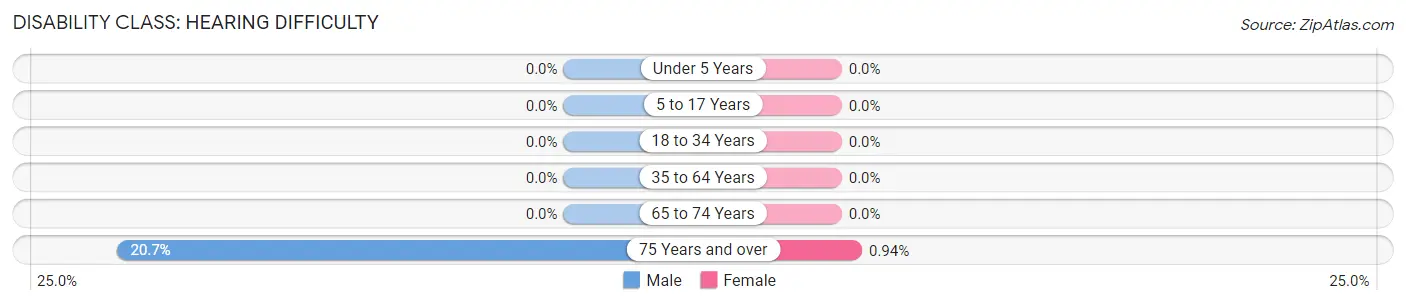
| Age Bracket | Male | Female |
| Under 5 Years | 0 (0.0%) | 0 (0.0%) |
| 5 to 17 Years | 0 (0.0%) | 0 (0.0%) |
| 18 to 34 Years | 0 (0.0%) | 0 (0.0%) |
| 35 to 64 Years | 0 (0.0%) | 0 (0.0%) |
| 65 to 74 Years | 0 (0.0%) | 0 (0.0%) |
| 75 Years and over | 30 (20.7%) | 1 (0.9%) |
Disability Class: Vision Difficulty
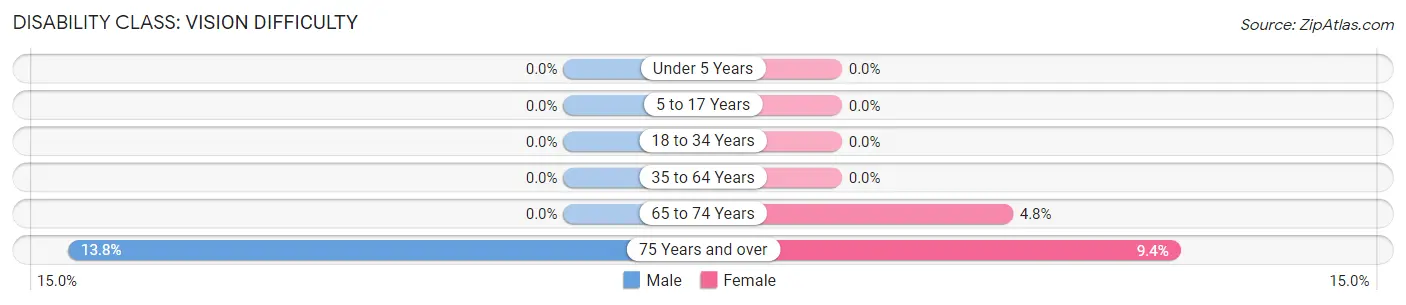
| Age Bracket | Male | Female |
| Under 5 Years | 0 (0.0%) | 0 (0.0%) |
| 5 to 17 Years | 0 (0.0%) | 0 (0.0%) |
| 18 to 34 Years | 0 (0.0%) | 0 (0.0%) |
| 35 to 64 Years | 0 (0.0%) | 0 (0.0%) |
| 65 to 74 Years | 0 (0.0%) | 4 (4.8%) |
| 75 Years and over | 20 (13.8%) | 10 (9.4%) |
Disability Class: Cognitive Difficulty
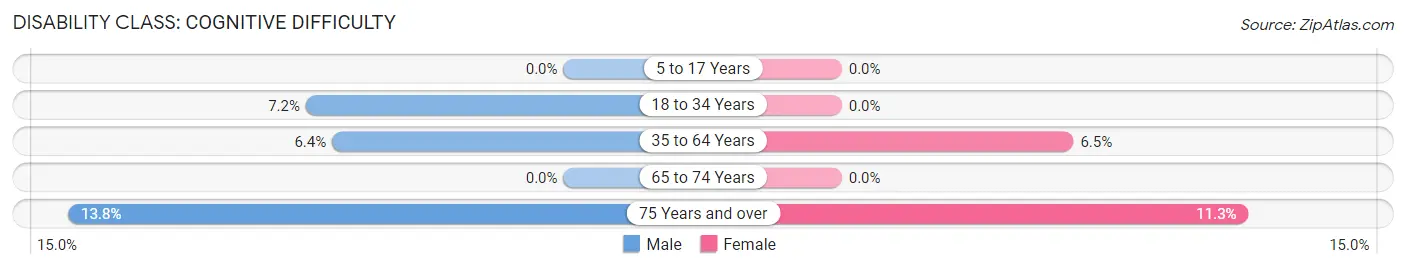
| Age Bracket | Male | Female |
| 5 to 17 Years | 0 (0.0%) | 0 (0.0%) |
| 18 to 34 Years | 17 (7.2%) | 0 (0.0%) |
| 35 to 64 Years | 17 (6.4%) | 22 (6.5%) |
| 65 to 74 Years | 0 (0.0%) | 0 (0.0%) |
| 75 Years and over | 20 (13.8%) | 12 (11.3%) |
Disability Class: Ambulatory Difficulty
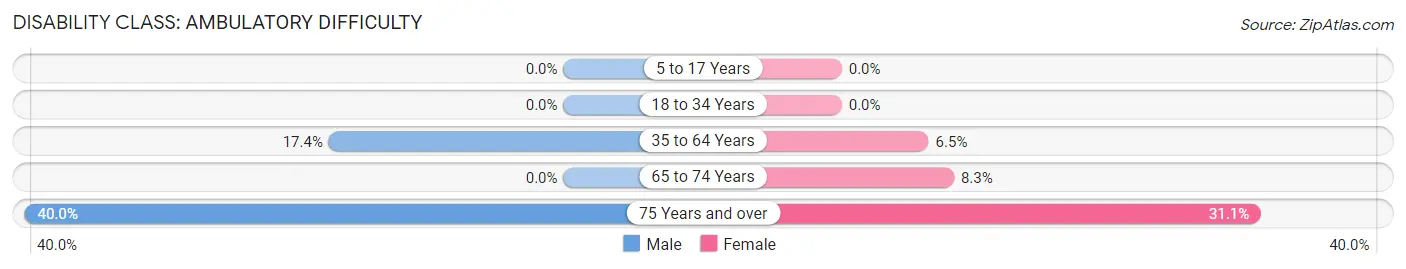
| Age Bracket | Male | Female |
| 5 to 17 Years | 0 (0.0%) | 0 (0.0%) |
| 18 to 34 Years | 0 (0.0%) | 0 (0.0%) |
| 35 to 64 Years | 46 (17.4%) | 22 (6.5%) |
| 65 to 74 Years | 0 (0.0%) | 7 (8.3%) |
| 75 Years and over | 58 (40.0%) | 33 (31.1%) |
Disability Class: Self-Care Difficulty
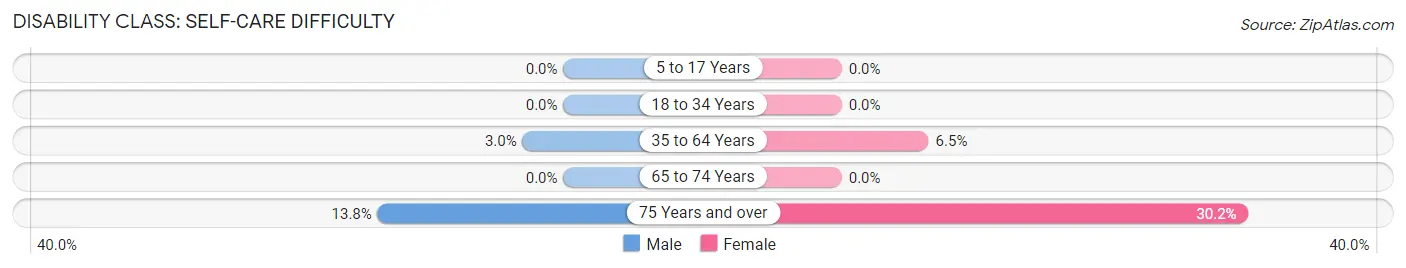
| Age Bracket | Male | Female |
| 5 to 17 Years | 0 (0.0%) | 0 (0.0%) |
| 18 to 34 Years | 0 (0.0%) | 0 (0.0%) |
| 35 to 64 Years | 8 (3.0%) | 22 (6.5%) |
| 65 to 74 Years | 0 (0.0%) | 0 (0.0%) |
| 75 Years and over | 20 (13.8%) | 32 (30.2%) |
Technology Access in Maunabo
Computing Device Access in Maunabo
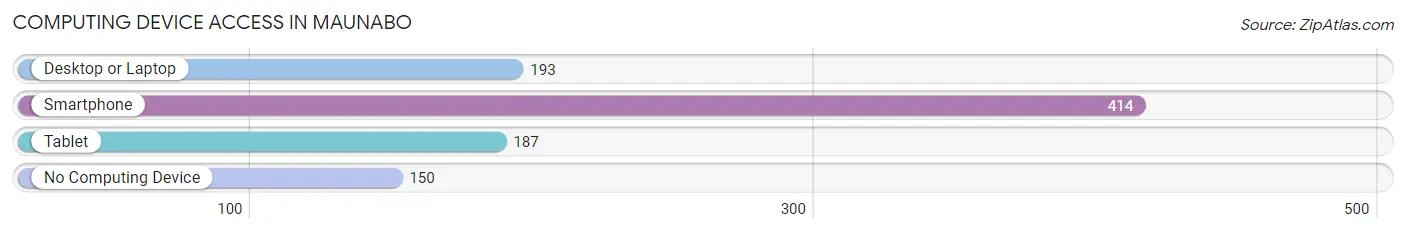
| Device Type | # Households | % Households |
| Desktop or Laptop | 193 | 33.1% |
| Smartphone | 414 | 71.0% |
| Tablet | 187 | 32.1% |
| No Computing Device | 150 | 25.7% |
| Total | 583 | 100.0% |
Internet Access in Maunabo
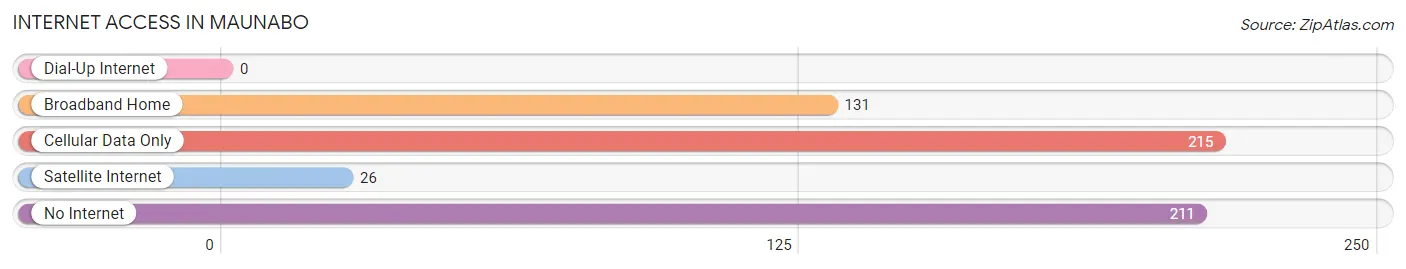
| Internet Type | # Households | % Households |
| Dial-Up Internet | 0 | 0.0% |
| Broadband Home | 131 | 22.5% |
| Cellular Data Only | 215 | 36.9% |
| Satellite Internet | 26 | 4.5% |
| No Internet | 211 | 36.2% |
| Total | 583 | 100.0% |
Maunabo Summary
Maunabo is a municipality located in the southeastern region of Puerto Rico. It is part of the Yabucoa Metropolitan Statistical Area. As of the 2010 census, the population of Maunabo was 8,845.
Geography
Maunabo is located in the southeastern region of Puerto Rico, bordered by the municipalities of Yabucoa to the north, Patillas to the south, and Arroyo to the west. The municipality is situated on the Caribbean Sea and is home to several beaches, including Playa de Maunabo, Playa de Punta Tuna, and Playa de Punta Tuna. The municipality covers an area of approximately 24 square miles.
Climate
Maunabo has a tropical climate, with temperatures ranging from the mid-70s to the mid-80s Fahrenheit throughout the year. The municipality receives an average of about 60 inches of rain per year.
History
Maunabo was founded in 1824 by Don Juan de la Cruz. The municipality was named after the Taíno chief Maunabo, who was the leader of the local Taíno tribe. The municipality was originally part of the municipality of Yabucoa, but was separated in 1824.
Economy
Maunabo's economy is largely based on agriculture and tourism. The municipality is home to several farms, which produce a variety of crops, including bananas, plantains, and coconuts. The municipality is also home to several hotels and resorts, which attract tourists from around the world.
Demographics
As of the 2010 census, the population of Maunabo was 8,845. The population is largely of Hispanic descent, with a small minority of African-American and white residents. The median household income in Maunabo is $17,845, and the median age is 38.
Conclusion
Maunabo is a municipality located in the southeastern region of Puerto Rico. It is part of the Yabucoa Metropolitan Statistical Area and has a population of 8,845. The municipality is home to several farms and resorts, and its economy is largely based on agriculture and tourism. The population is largely of Hispanic descent, with a small minority of African-American and white residents.
Common Questions
What is Per Capita Income in Maunabo?
Per Capita income in Maunabo is $10,617.
What is the Median Family Income in Maunabo?
Median Family Income in Maunabo is $25,263.
What is the Median Household income in Maunabo?
Median Household Income in Maunabo is $19,821.
What is Family Income Deficit in Maunabo?
Family Income Deficit in Maunabo is $14,507.
Families that are below poverty line in Maunabo earn $14,507 less on average than the poverty threshold level.
What is Inequality or Gini Index in Maunabo?
Inequality or Gini Index in Maunabo is 0.51.
What is the Total Population of Maunabo?
Total Population of Maunabo is 1,584.
What is the Total Male Population of Maunabo?
Total Male Population of Maunabo is 820.
What is the Total Female Population of Maunabo?
Total Female Population of Maunabo is 764.
What is the Ratio of Males per 100 Females in Maunabo?
There are 107.33 Males per 100 Females in Maunabo.
What is the Ratio of Females per 100 Males in Maunabo?
There are 93.17 Females per 100 Males in Maunabo.
What is the Median Population Age in Maunabo?
Median Population Age in Maunabo is 45.1 Years.
What is the Average Family Size in Maunabo
Average Family Size in Maunabo is 3.1 People.
What is the Average Household Size in Maunabo
Average Household Size in Maunabo is 2.7 People.
How Large is the Labor Force in Maunabo?
There are 513 People in the Labor Forcein in Maunabo.
What is the Percentage of People in the Labor Force in Maunabo?
36.8% of People are in the Labor Force in Maunabo.
What is the Unemployment Rate in Maunabo?
Unemployment Rate in Maunabo is 38.0%.