Luquillo, PR Map & Demographics
Luquillo Map
Luquillo Overview
$11,824
PER CAPITA INCOME
$24,041
AVG FAMILY INCOME
$21,037
AVG HOUSEHOLD INCOME
11.7%
WAGE / INCOME GAP [ % ]
88.3¢/ $1
WAGE / INCOME GAP [ $ ]
$9,790
FAMILY INCOME DEFICIT
0.46
INEQUALITY / GINI INDEX
7,870
TOTAL POPULATION
3,286
MALE POPULATION
4,584
FEMALE POPULATION
71.68
MALES / 100 FEMALES
139.50
FEMALES / 100 MALES
39.9
MEDIAN AGE
3.2
AVG FAMILY SIZE
2.5
AVG HOUSEHOLD SIZE
3,080
LABOR FORCE [ PEOPLE ]
47.9%
PERCENT IN LABOR FORCE
24.2%
UNEMPLOYMENT RATE
Luquillo Zip Codes
Income in Luquillo
Income Overview in Luquillo
Per Capita Income in Luquillo is $11,824, while median incomes of families and households are $24,041 and $21,037 respectively.
| Characteristic | Number | Measure |
| Per Capita Income | 7,870 | $11,824 |
| Median Family Income | 1,992 | $24,041 |
| Mean Family Income | 1,992 | $30,495 |
| Median Household Income | 3,083 | $21,037 |
| Mean Household Income | 3,083 | $27,605 |
| Income Deficit | 1,992 | $9,790 |
| Wage / Income Gap (%) | 7,870 | 11.72% |
| Wage / Income Gap ($) | 7,870 | 88.28¢ per $1 |
| Gini / Inequality Index | 7,870 | 0.46 |
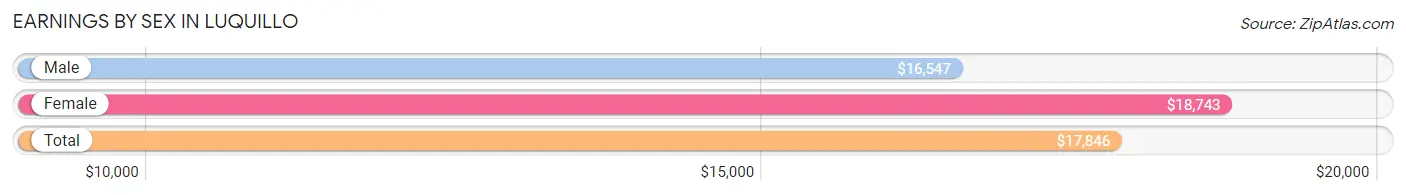
Earnings by Sex in Luquillo
Average Earnings in Luquillo are $17,846, $16,547 for men and $18,743 for women, a difference of 11.7%.
| Sex | Number | Average Earnings |
| Male | 1,245 (48.5%) | $16,547 |
| Female | 1,324 (51.5%) | $18,743 |
| Total | 2,569 (100.0%) | $17,846 |
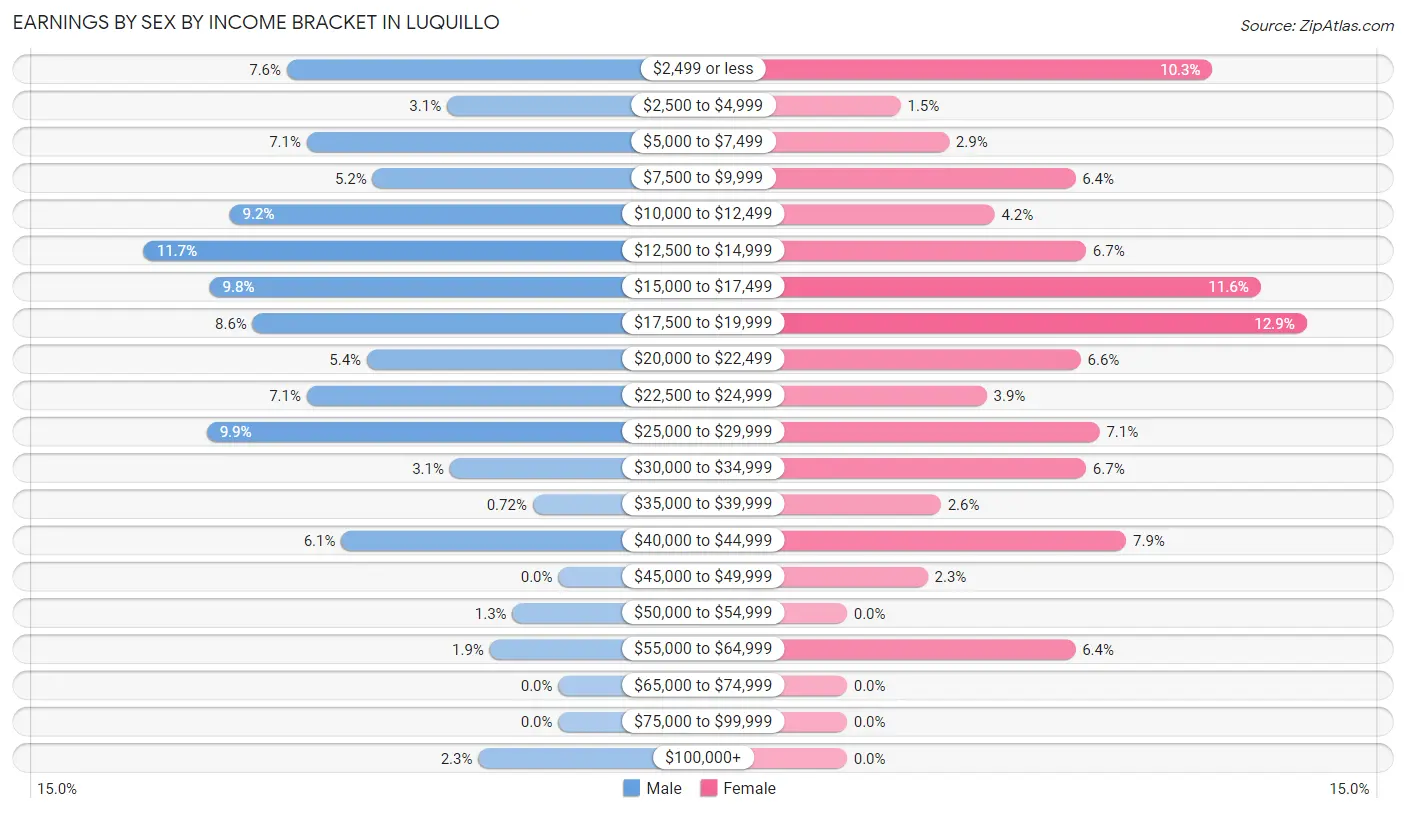
Earnings by Sex by Income Bracket in Luquillo
The most common earnings brackets in Luquillo are $12,500 to $14,999 for men (145 | 11.7%) and $17,500 to $19,999 for women (171 | 12.9%).
| Income | Male | Female |
| $2,499 or less | 95 (7.6%) | 136 (10.3%) |
| $2,500 to $4,999 | 39 (3.1%) | 20 (1.5%) |
| $5,000 to $7,499 | 88 (7.1%) | 38 (2.9%) |
| $7,500 to $9,999 | 65 (5.2%) | 85 (6.4%) |
| $10,000 to $12,499 | 115 (9.2%) | 55 (4.2%) |
| $12,500 to $14,999 | 145 (11.7%) | 89 (6.7%) |
| $15,000 to $17,499 | 122 (9.8%) | 154 (11.6%) |
| $17,500 to $19,999 | 107 (8.6%) | 171 (12.9%) |
| $20,000 to $22,499 | 67 (5.4%) | 87 (6.6%) |
| $22,500 to $24,999 | 88 (7.1%) | 52 (3.9%) |
| $25,000 to $29,999 | 123 (9.9%) | 94 (7.1%) |
| $30,000 to $34,999 | 38 (3.0%) | 89 (6.7%) |
| $35,000 to $39,999 | 9 (0.7%) | 35 (2.6%) |
| $40,000 to $44,999 | 76 (6.1%) | 104 (7.9%) |
| $45,000 to $49,999 | 0 (0.0%) | 30 (2.3%) |
| $50,000 to $54,999 | 16 (1.3%) | 0 (0.0%) |
| $55,000 to $64,999 | 24 (1.9%) | 85 (6.4%) |
| $65,000 to $74,999 | 0 (0.0%) | 0 (0.0%) |
| $75,000 to $99,999 | 0 (0.0%) | 0 (0.0%) |
| $100,000+ | 28 (2.2%) | 0 (0.0%) |
| Total | 1,245 (100.0%) | 1,324 (100.0%) |
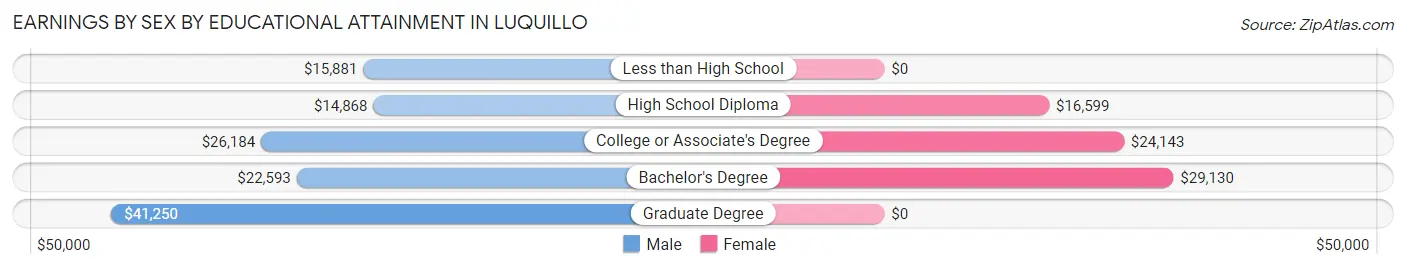
Earnings by Sex by Educational Attainment in Luquillo
Average earnings in Luquillo are $18,192 for men and $20,018 for women, a difference of 9.1%. Men with an educational attainment of graduate degree enjoy the highest average annual earnings of $41,250, while those with high school diploma education earn the least with $14,868. Women with an educational attainment of bachelor's degree earn the most with the average annual earnings of $29,130, while those with high school diploma education have the smallest earnings of $16,599.
| Educational Attainment | Male Income | Female Income |
| Less than High School | $15,881 | $0 |
| High School Diploma | $14,868 | $16,599 |
| College or Associate's Degree | $26,184 | $24,143 |
| Bachelor's Degree | $22,593 | $29,130 |
| Graduate Degree | $41,250 | $0 |
| Total | $18,192 | $20,018 |
Family Income in Luquillo
Family Income Brackets in Luquillo
According to the Luquillo family income data, there are 456 families falling into the $15,000 to $24,999 income range, which is the most common income bracket and makes up 22.9% of all families. Conversely, the $150,000 to $199,999 income bracket is the least frequent group with only 12 families (0.6%) belonging to this category.
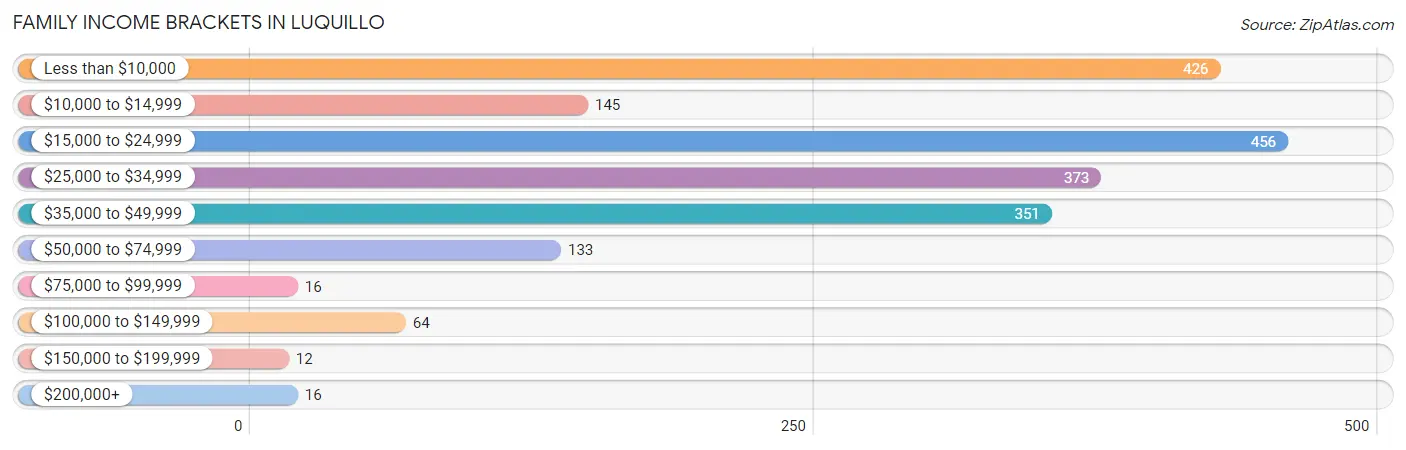
| Income Bracket | # Families | % Families |
| Less than $10,000 | 426 | 21.4% |
| $10,000 to $14,999 | 145 | 7.3% |
| $15,000 to $24,999 | 456 | 22.9% |
| $25,000 to $34,999 | 373 | 18.7% |
| $35,000 to $49,999 | 351 | 17.6% |
| $50,000 to $74,999 | 133 | 6.7% |
| $75,000 to $99,999 | 16 | 0.8% |
| $100,000 to $149,999 | 64 | 3.2% |
| $150,000 to $199,999 | 12 | 0.6% |
| $200,000+ | 16 | 0.8% |
Family Income by Famaliy Size in Luquillo
5-person families (96 | 4.8%) account for the highest median family income in Luquillo with $47,639 per family, while 2-person families (1,152 | 57.8%) have the highest median income of $11,710 per family member.
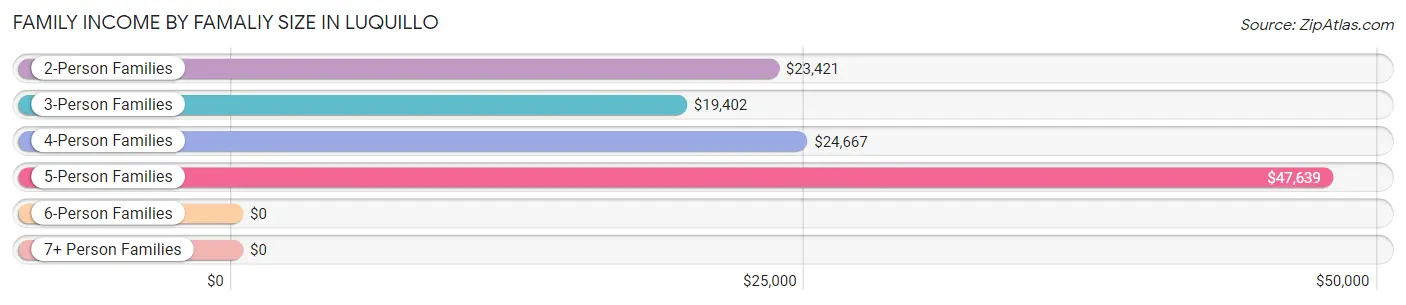
| Income Bracket | # Families | Median Income |
| 2-Person Families | 1,152 (57.8%) | $23,421 |
| 3-Person Families | 507 (25.5%) | $19,402 |
| 4-Person Families | 212 (10.6%) | $24,667 |
| 5-Person Families | 96 (4.8%) | $47,639 |
| 6-Person Families | 25 (1.3%) | $0 |
| 7+ Person Families | 0 (0.0%) | $0 |
| Total | 1,992 (100.0%) | $24,041 |
Family Income by Number of Earners in Luquillo
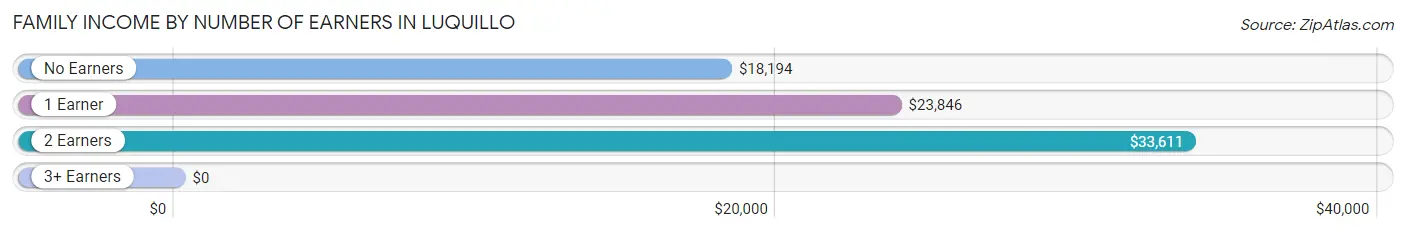
| Number of Earners | # Families | Median Income |
| No Earners | 736 (36.9%) | $18,194 |
| 1 Earner | 880 (44.2%) | $23,846 |
| 2 Earners | 344 (17.3%) | $33,611 |
| 3+ Earners | 32 (1.6%) | $0 |
| Total | 1,992 (100.0%) | $24,041 |
Household Income in Luquillo
Household Income Brackets in Luquillo
With 783 households falling in the category, the $15,000 to $24,999 income range is the most frequent in Luquillo, accounting for 25.4% of all households. In contrast, only 12 households (0.4%) fall into the $150,000 to $199,999 income bracket, making it the least populous group.
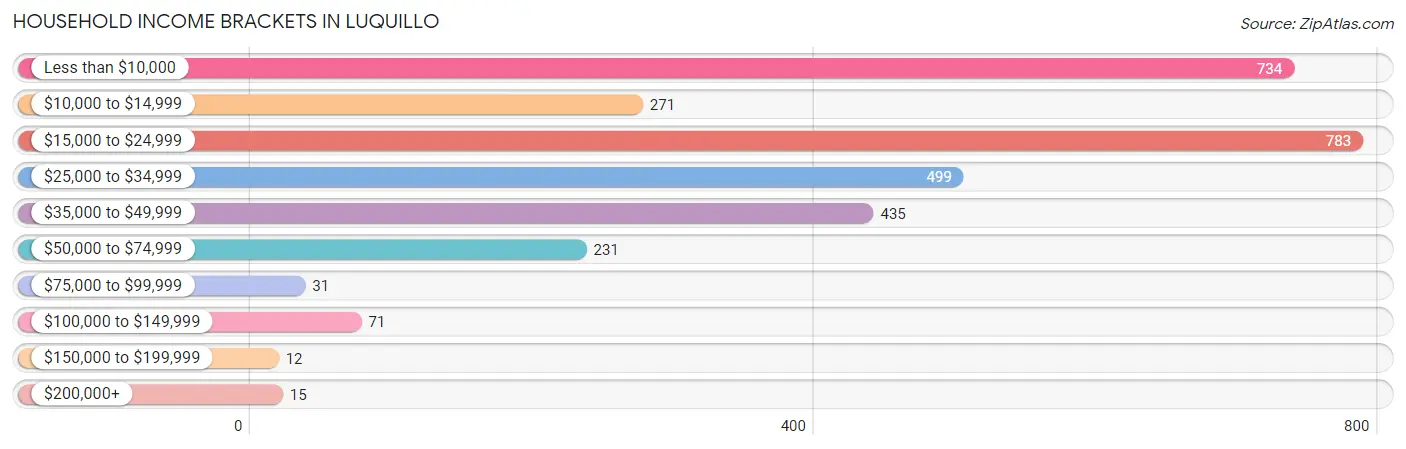
| Income Bracket | # Households | % Households |
| Less than $10,000 | 734 | 23.8% |
| $10,000 to $14,999 | 271 | 8.8% |
| $15,000 to $24,999 | 783 | 25.4% |
| $25,000 to $34,999 | 499 | 16.2% |
| $35,000 to $49,999 | 435 | 14.1% |
| $50,000 to $74,999 | 231 | 7.5% |
| $75,000 to $99,999 | 31 | 1.0% |
| $100,000 to $149,999 | 71 | 2.3% |
| $150,000 to $199,999 | 12 | 0.4% |
| $200,000+ | 15 | 0.5% |
Household Income by Householder Age in Luquillo
The median household income in Luquillo is $21,037, with the highest median household income of $23,304 found in the 45 to 64 years age bracket for the primary householder. A total of 1,045 households (33.9%) fall into this category. Meanwhile, the 15 to 24 years age bracket for the primary householder has the lowest median household income of $0, with 117 households (3.8%) in this group.
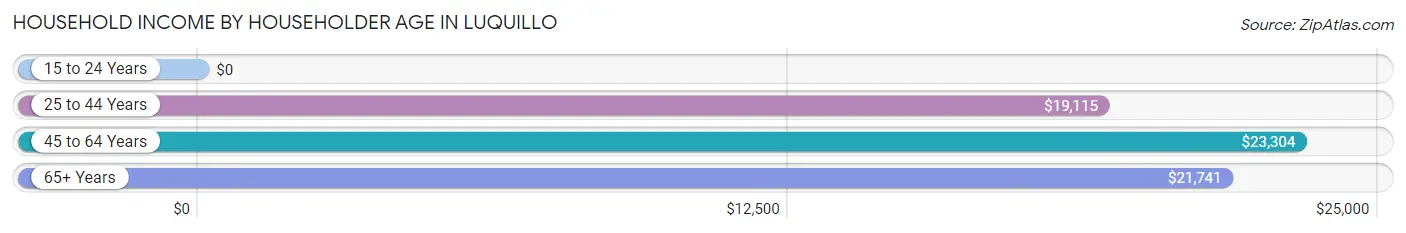
| Income Bracket | # Households | Median Income |
| 15 to 24 Years | 117 (3.8%) | $0 |
| 25 to 44 Years | 761 (24.7%) | $19,115 |
| 45 to 64 Years | 1,045 (33.9%) | $23,304 |
| 65+ Years | 1,160 (37.6%) | $21,741 |
| Total | 3,083 (100.0%) | $21,037 |
Poverty in Luquillo
Income Below Poverty by Sex and Age in Luquillo
With 46.9% poverty level for males and 53.4% for females among the residents of Luquillo, 6 to 11 year old males and 5 year old females are the most vulnerable to poverty, with 153 males (76.9%) and 46 females (100.0%) in their respective age groups living below the poverty level.
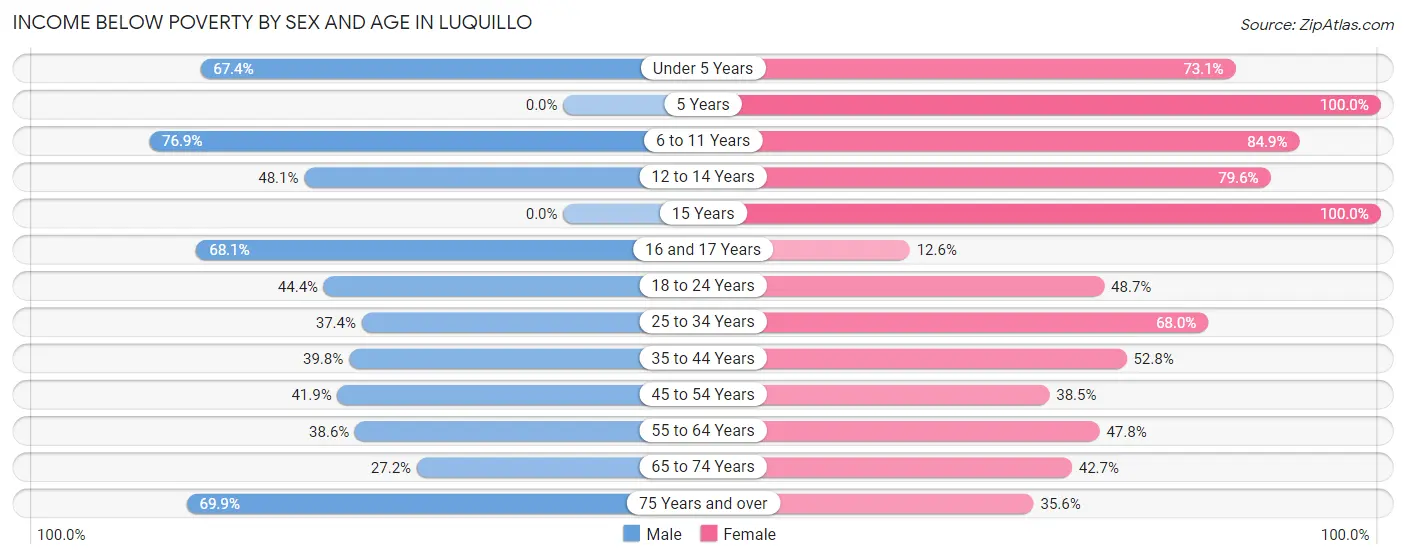
| Age Bracket | Male | Female |
| Under 5 Years | 124 (67.4%) | 160 (73.1%) |
| 5 Years | 0 (0.0%) | 46 (100.0%) |
| 6 to 11 Years | 153 (76.9%) | 259 (84.9%) |
| 12 to 14 Years | 88 (48.1%) | 175 (79.5%) |
| 15 Years | 0 (0.0%) | 35 (100.0%) |
| 16 and 17 Years | 94 (68.1%) | 15 (12.6%) |
| 18 to 24 Years | 152 (44.4%) | 300 (48.7%) |
| 25 to 34 Years | 122 (37.4%) | 374 (68.0%) |
| 35 to 44 Years | 173 (39.8%) | 279 (52.8%) |
| 45 to 54 Years | 192 (41.9%) | 181 (38.5%) |
| 55 to 64 Years | 148 (38.6%) | 242 (47.8%) |
| 65 to 74 Years | 81 (27.2%) | 225 (42.7%) |
| 75 Years and over | 200 (69.9%) | 157 (35.6%) |
| Total | 1,527 (46.9%) | 2,448 (53.4%) |
Income Above Poverty by Sex and Age in Luquillo
According to the poverty statistics in Luquillo, males aged 15 years and females aged 16 and 17 years are the age groups that are most secure financially, with 100.0% of males and 87.4% of females in these age groups living above the poverty line.
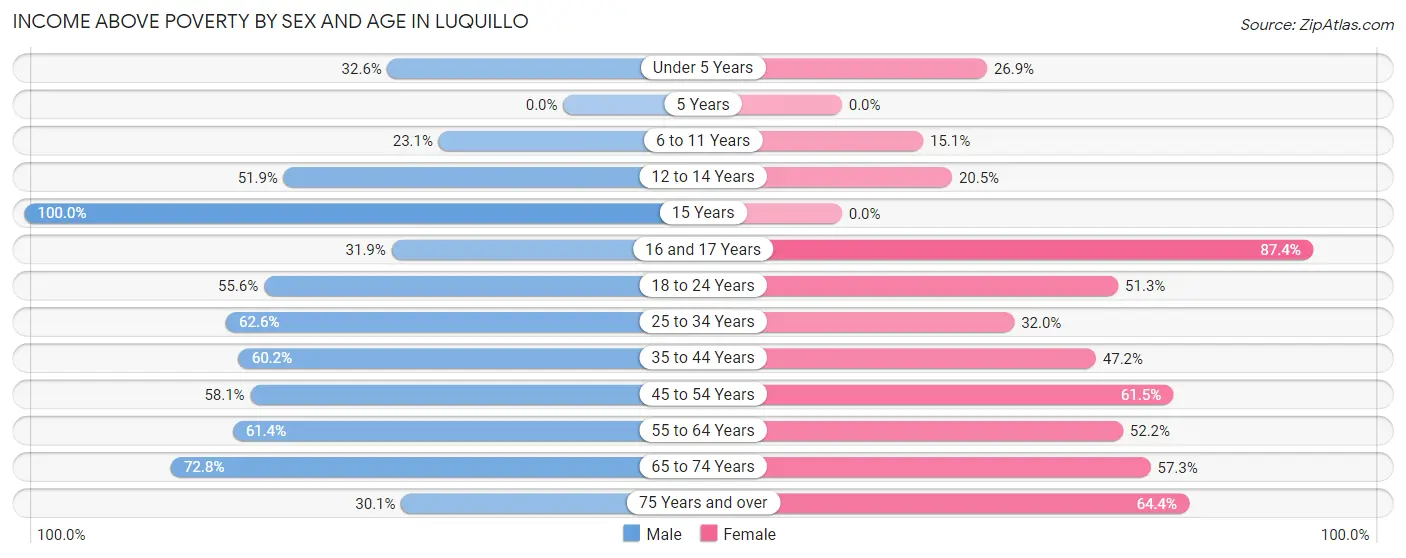
| Age Bracket | Male | Female |
| Under 5 Years | 60 (32.6%) | 59 (26.9%) |
| 5 Years | 0 (0.0%) | 0 (0.0%) |
| 6 to 11 Years | 46 (23.1%) | 46 (15.1%) |
| 12 to 14 Years | 95 (51.9%) | 45 (20.4%) |
| 15 Years | 23 (100.0%) | 0 (0.0%) |
| 16 and 17 Years | 44 (31.9%) | 104 (87.4%) |
| 18 to 24 Years | 190 (55.6%) | 316 (51.3%) |
| 25 to 34 Years | 204 (62.6%) | 176 (32.0%) |
| 35 to 44 Years | 262 (60.2%) | 249 (47.2%) |
| 45 to 54 Years | 266 (58.1%) | 289 (61.5%) |
| 55 to 64 Years | 235 (61.4%) | 264 (52.2%) |
| 65 to 74 Years | 217 (72.8%) | 302 (57.3%) |
| 75 Years and over | 86 (30.1%) | 284 (64.4%) |
| Total | 1,728 (53.1%) | 2,134 (46.6%) |
Income Below Poverty Among Married-Couple Families in Luquillo
The poverty statistics for married-couple families in Luquillo show that 37.8% or 288 of the total 763 families live below the poverty line. Families with 3 or 4 children have the highest poverty rate of 100.0%, comprising of 19 families. On the other hand, families with no children have the lowest poverty rate of 34.3%, which includes 183 families.
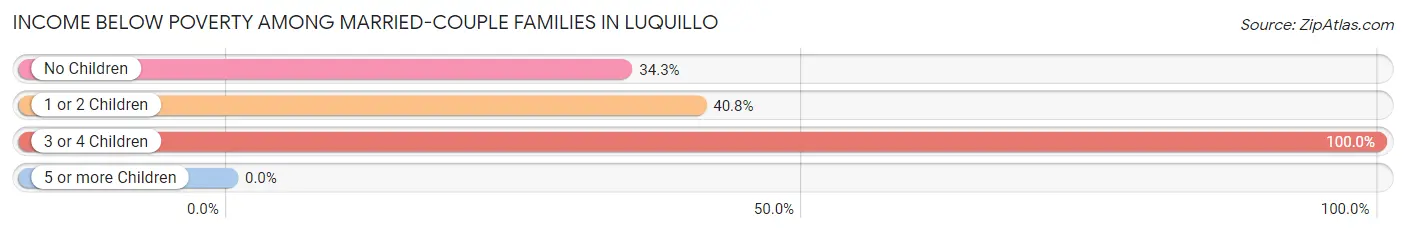
| Children | Above Poverty | Below Poverty |
| No Children | 350 (65.7%) | 183 (34.3%) |
| 1 or 2 Children | 125 (59.2%) | 86 (40.8%) |
| 3 or 4 Children | 0 (0.0%) | 19 (100.0%) |
| 5 or more Children | 0 (0.0%) | 0 (0.0%) |
| Total | 475 (62.3%) | 288 (37.8%) |
Income Below Poverty Among Single-Parent Households in Luquillo
According to the poverty data in Luquillo, 46.4% or 110 single-father households and 57.7% or 572 single-mother households are living below the poverty line. Among single-father households, those with 1 or 2 children have the highest poverty rate, with 84 households (64.1%) experiencing poverty. Likewise, among single-mother households, those with 3 or 4 children have the highest poverty rate, with 73 households (100.0%) falling below the poverty line.
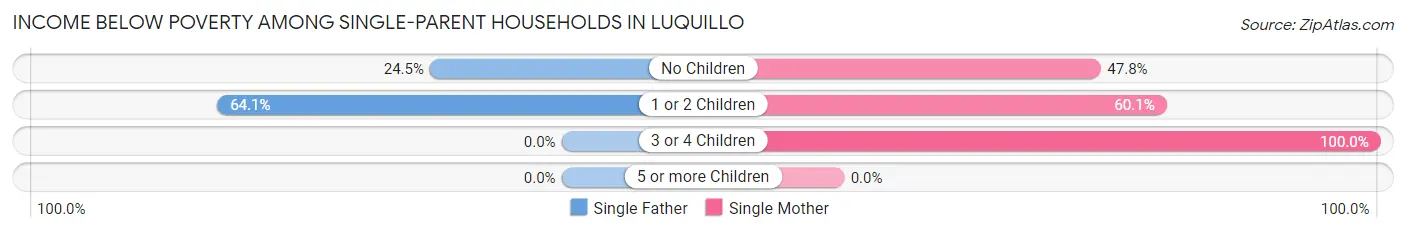
| Children | Single Father | Single Mother |
| No Children | 26 (24.5%) | 208 (47.8%) |
| 1 or 2 Children | 84 (64.1%) | 291 (60.1%) |
| 3 or 4 Children | 0 (0.0%) | 73 (100.0%) |
| 5 or more Children | 0 (0.0%) | 0 (0.0%) |
| Total | 110 (46.4%) | 572 (57.7%) |
Income Below Poverty Among Married-Couple vs Single-Parent Households in Luquillo
The poverty data for Luquillo shows that 288 of the married-couple family households (37.8%) and 682 of the single-parent households (55.5%) are living below the poverty level. Within the married-couple family households, those with 3 or 4 children have the highest poverty rate, with 19 households (100.0%) falling below the poverty line. Among the single-parent households, those with 3 or 4 children have the highest poverty rate, with 73 household (100.0%) living below poverty.
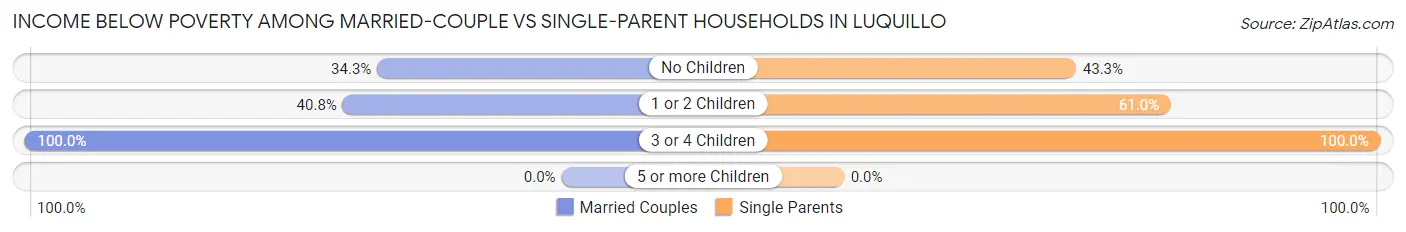
| Children | Married-Couple Families | Single-Parent Households |
| No Children | 183 (34.3%) | 234 (43.2%) |
| 1 or 2 Children | 86 (40.8%) | 375 (61.0%) |
| 3 or 4 Children | 19 (100.0%) | 73 (100.0%) |
| 5 or more Children | 0 (0.0%) | 0 (0.0%) |
| Total | 288 (37.8%) | 682 (55.5%) |
Race in Luquillo
The most populous races in Luquillo are Hispanic or Latino (7,859 | 99.9%), Some other Race (2,682 | 34.1%), and White / Caucasian (2,304 | 29.3%).
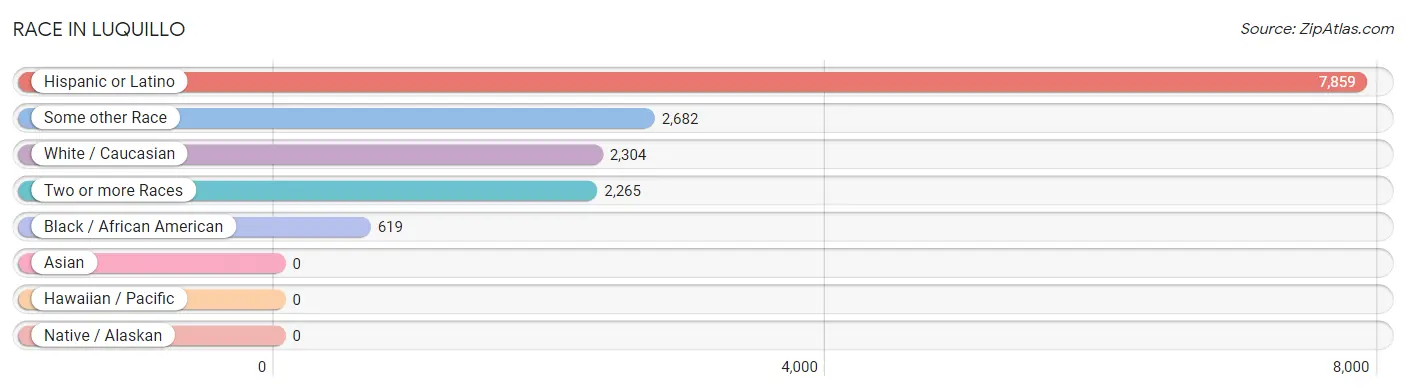
| Race | # Population | % Population |
| Asian | 0 | 0.0% |
| Black / African American | 619 | 7.9% |
| Hawaiian / Pacific | 0 | 0.0% |
| Hispanic or Latino | 7,859 | 99.9% |
| Native / Alaskan | 0 | 0.0% |
| White / Caucasian | 2,304 | 29.3% |
| Two or more Races | 2,265 | 28.8% |
| Some other Race | 2,682 | 34.1% |
| Total | 7,870 | 100.0% |
Ancestry in Luquillo
The most populous ancestries reported in Luquillo are Puerto Rican (7,759 | 98.6%), Dominican (51 | 0.6%), American (50 | 0.6%), Italian (27 | 0.3%), and Central American (24 | 0.3%), together accounting for 100.5% of all Luquillo residents.
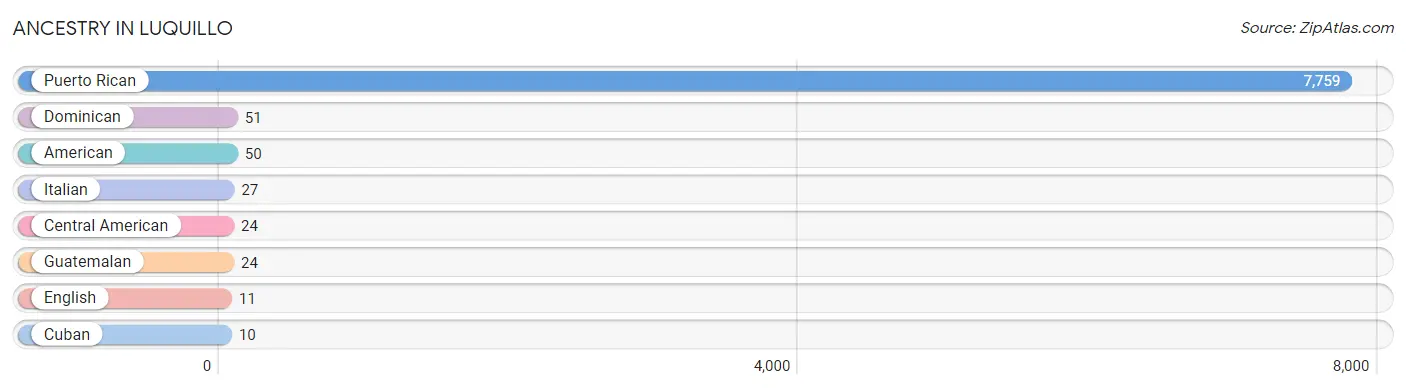
| Ancestry | # Population | % Population |
| American | 50 | 0.6% |
| Central American | 24 | 0.3% |
| Cuban | 10 | 0.1% |
| Dominican | 51 | 0.6% |
| English | 11 | 0.1% |
| Guatemalan | 24 | 0.3% |
| Italian | 27 | 0.3% |
| Puerto Rican | 7,759 | 98.6% | View All 8 Rows |
Immigrants in Luquillo

| Immigration Origin | # Population | % Population | View All 0 Rows |
Sex and Age in Luquillo
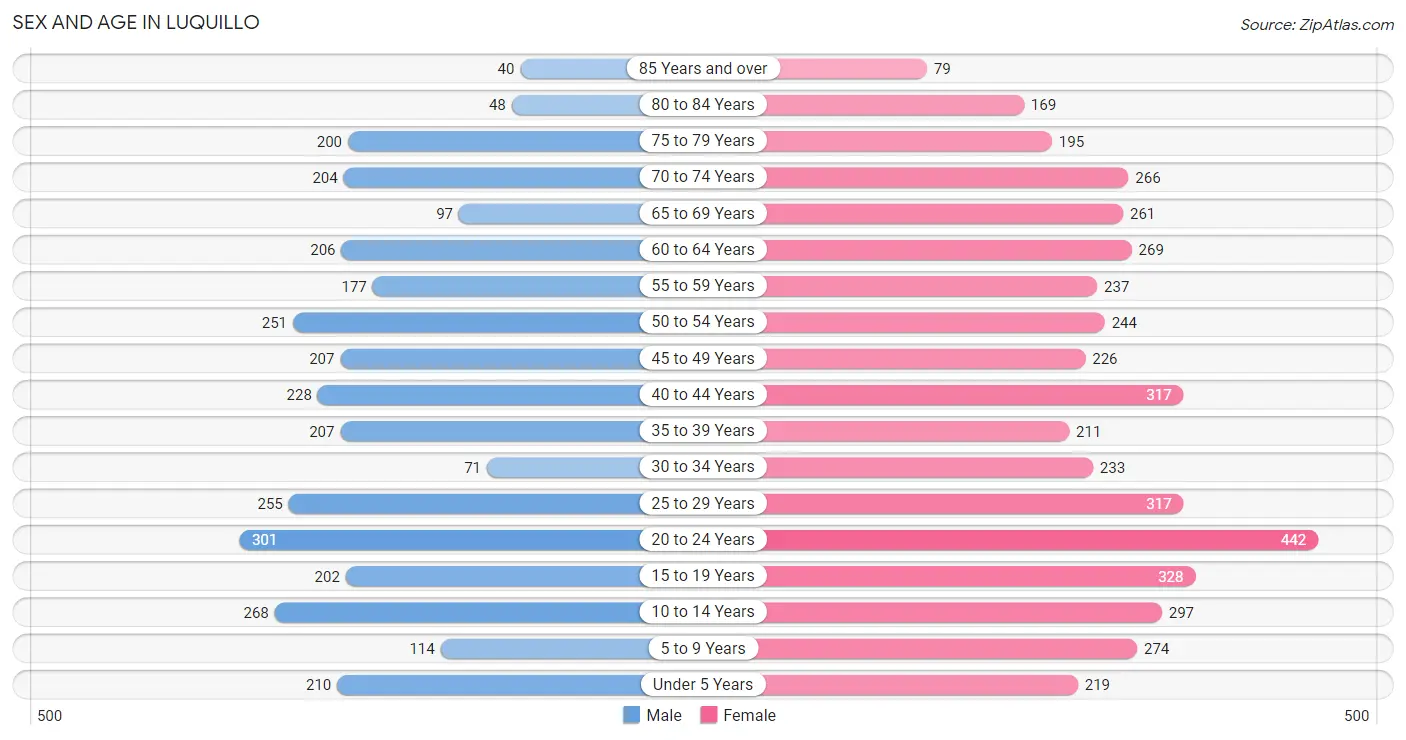
Sex and Age in Luquillo
The most populous age groups in Luquillo are 20 to 24 Years (301 | 9.2%) for men and 20 to 24 Years (442 | 9.6%) for women.
| Age Bracket | Male | Female |
| Under 5 Years | 210 (6.4%) | 219 (4.8%) |
| 5 to 9 Years | 114 (3.5%) | 274 (6.0%) |
| 10 to 14 Years | 268 (8.2%) | 297 (6.5%) |
| 15 to 19 Years | 202 (6.1%) | 328 (7.2%) |
| 20 to 24 Years | 301 (9.2%) | 442 (9.6%) |
| 25 to 29 Years | 255 (7.8%) | 317 (6.9%) |
| 30 to 34 Years | 71 (2.2%) | 233 (5.1%) |
| 35 to 39 Years | 207 (6.3%) | 211 (4.6%) |
| 40 to 44 Years | 228 (6.9%) | 317 (6.9%) |
| 45 to 49 Years | 207 (6.3%) | 226 (4.9%) |
| 50 to 54 Years | 251 (7.6%) | 244 (5.3%) |
| 55 to 59 Years | 177 (5.4%) | 237 (5.2%) |
| 60 to 64 Years | 206 (6.3%) | 269 (5.9%) |
| 65 to 69 Years | 97 (2.9%) | 261 (5.7%) |
| 70 to 74 Years | 204 (6.2%) | 266 (5.8%) |
| 75 to 79 Years | 200 (6.1%) | 195 (4.3%) |
| 80 to 84 Years | 48 (1.5%) | 169 (3.7%) |
| 85 Years and over | 40 (1.2%) | 79 (1.7%) |
| Total | 3,286 (100.0%) | 4,584 (100.0%) |
Families and Households in Luquillo
Median Family Size in Luquillo
The median family size in Luquillo is 3.18 persons per family, with single male/father families (237 | 11.9%) accounting for the largest median family size of 3.76 persons per family. On the other hand, married-couple families (763 | 38.3%) represent the smallest median family size with 3.02 persons per family.
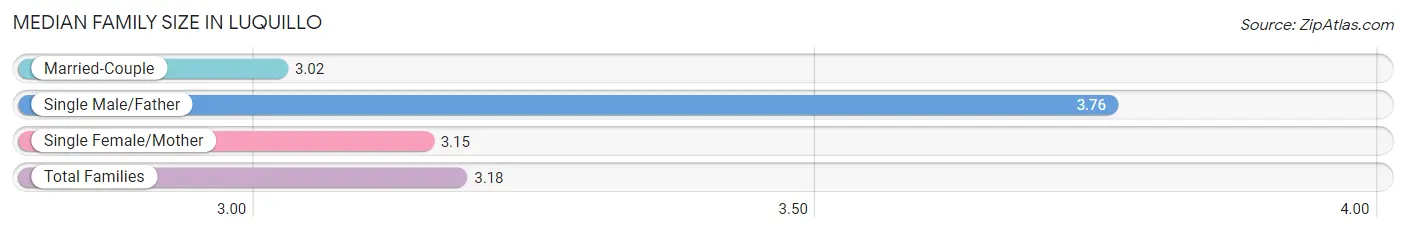
| Family Type | # Families | Family Size |
| Married-Couple | 763 (38.3%) | 3.02 |
| Single Male/Father | 237 (11.9%) | 3.76 |
| Single Female/Mother | 992 (49.8%) | 3.15 |
| Total Families | 1,992 (100.0%) | 3.18 |
Median Household Size in Luquillo
The median household size in Luquillo is 2.55 persons per household, with single male/father households (237 | 7.7%) accounting for the largest median household size of 4.33 persons per household. non-family households (1,091 | 35.4%) represent the smallest median household size with 1.17 persons per household.
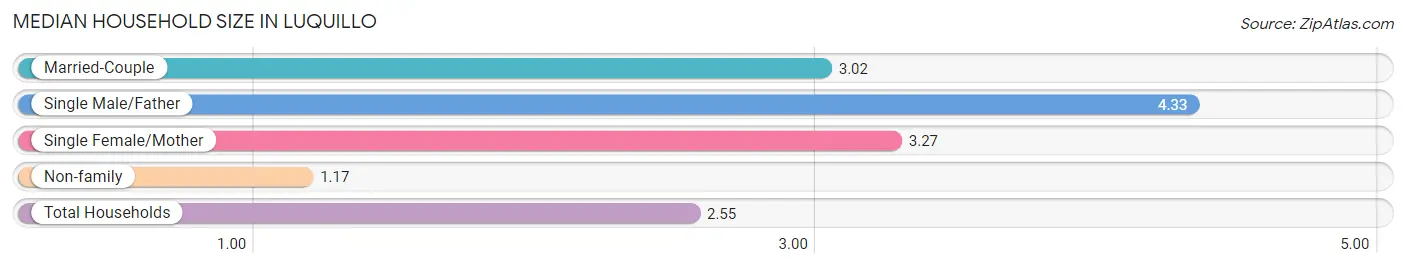
| Household Type | # Households | Household Size |
| Married-Couple | 763 (24.7%) | 3.02 |
| Single Male/Father | 237 (7.7%) | 4.33 |
| Single Female/Mother | 992 (32.2%) | 3.27 |
| Non-family | 1,091 (35.4%) | 1.17 |
| Total Households | 3,083 (100.0%) | 2.55 |
Household Size by Marriage Status in Luquillo
Out of a total of 3,083 households in Luquillo, 1,992 (64.6%) are family households, while 1,091 (35.4%) are nonfamily households. The most numerous type of family households are 2-person households, comprising 1,081, and the most common type of nonfamily households are 1-person households, comprising 930.
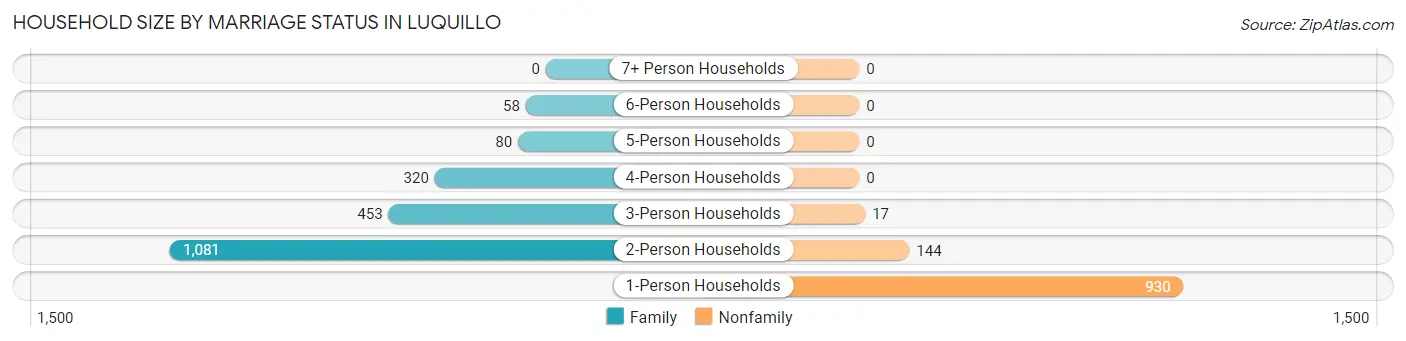
| Household Size | Family Households | Nonfamily Households |
| 1-Person Households | - | 930 (30.2%) |
| 2-Person Households | 1,081 (35.1%) | 144 (4.7%) |
| 3-Person Households | 453 (14.7%) | 17 (0.5%) |
| 4-Person Households | 320 (10.4%) | 0 (0.0%) |
| 5-Person Households | 80 (2.6%) | 0 (0.0%) |
| 6-Person Households | 58 (1.9%) | 0 (0.0%) |
| 7+ Person Households | 0 (0.0%) | 0 (0.0%) |
| Total | 1,992 (64.6%) | 1,091 (35.4%) |
Female Fertility in Luquillo
Fertility by Age in Luquillo
Average fertility rate in Luquillo is 41.0 births per 1,000 women. Women in the age bracket of 15 to 19 years have the highest fertility rate with 95.0 births per 1,000 women. Women in the age bracket of 20 to 34 years acount for 64.8% of all women with births.
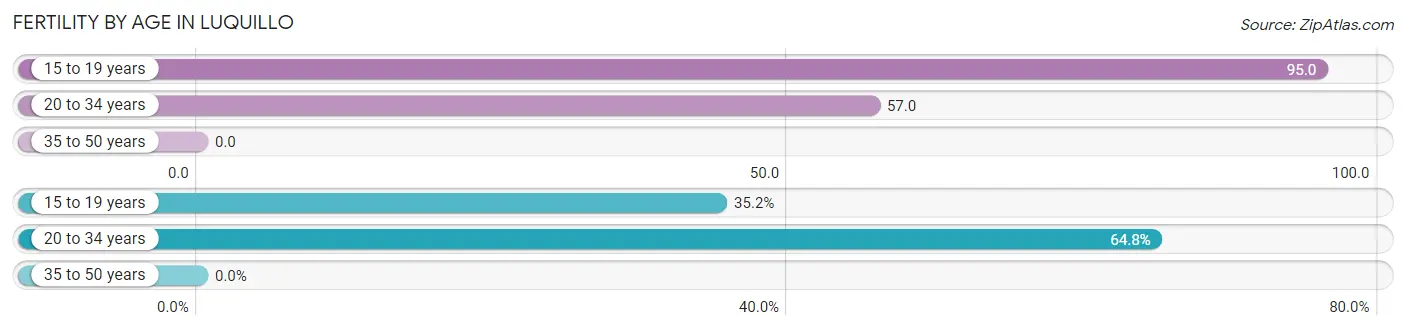
| Age Bracket | Women with Births | Births / 1,000 Women |
| 15 to 19 years | 31 (35.2%) | 95.0 |
| 20 to 34 years | 57 (64.8%) | 57.0 |
| 35 to 50 years | 0 (0.0%) | 0.0 |
| Total | 88 (100.0%) | 41.0 |
Fertility by Age by Marriage Status in Luquillo
43.2% of women with births (88) in Luquillo are married. The highest percentage of unmarried women with births falls into 15 to 19 years age bracket with 100.0% of them unmarried at the time of birth, while the lowest percentage of unmarried women with births belong to 20 to 34 years age bracket with 33.3% of them unmarried.
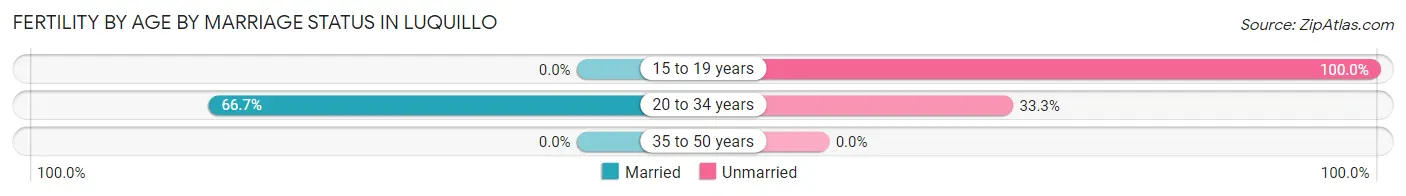
| Age Bracket | Married | Unmarried |
| 15 to 19 years | 0 (0.0%) | 31 (100.0%) |
| 20 to 34 years | 38 (66.7%) | 19 (33.3%) |
| 35 to 50 years | 0 (0.0%) | 0 (0.0%) |
| Total | 38 (43.2%) | 50 (56.8%) |
Fertility by Education in Luquillo
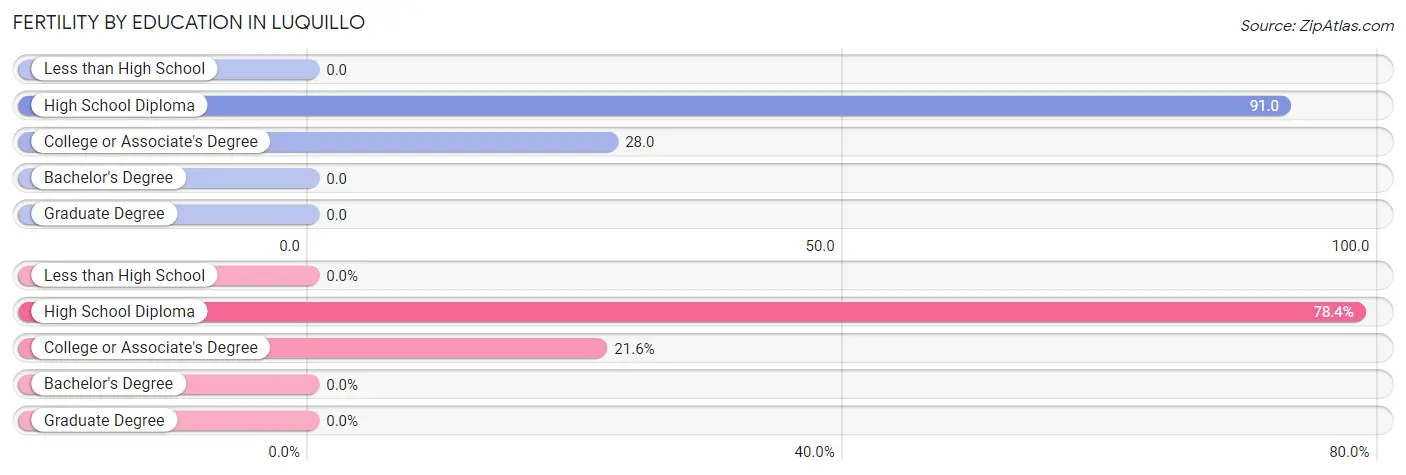
| Educational Attainment | Women with Births | Births / 1,000 Women |
| Less than High School | 0 (0.0%) | 0.0 |
| High School Diploma | 69 (78.4%) | 91.0 |
| College or Associate's Degree | 19 (21.6%) | 28.0 |
| Bachelor's Degree | 0 (0.0%) | 0.0 |
| Graduate Degree | 0 (0.0%) | 0.0 |
| Total | 88 (100.0%) | 41.0 |
Fertility by Education by Marriage Status in Luquillo
56.8% of women with births in Luquillo are unmarried. Women with the educational attainment of high school diploma are most likely to be married with 55.1% of them married at childbirth, while women with the educational attainment of college or associate's degree are least likely to be married with 100.0% of them unmarried at childbirth.
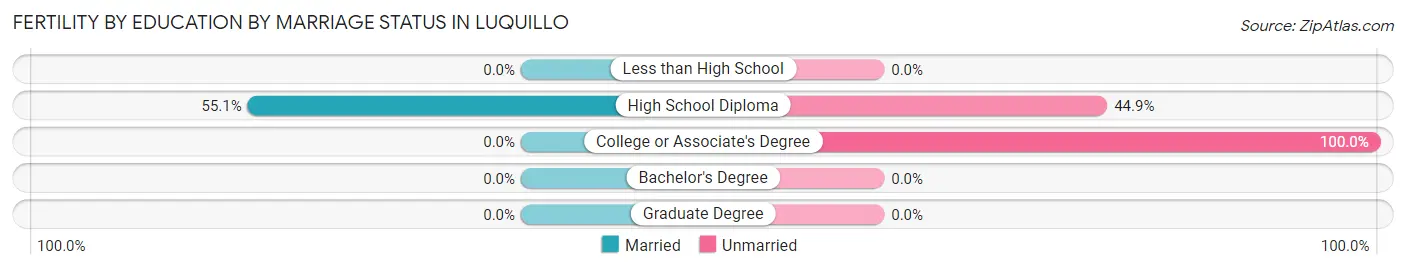
| Educational Attainment | Married | Unmarried |
| Less than High School | 0 (0.0%) | 0 (0.0%) |
| High School Diploma | 38 (55.1%) | 31 (44.9%) |
| College or Associate's Degree | 0 (0.0%) | 19 (100.0%) |
| Bachelor's Degree | 0 (0.0%) | 0 (0.0%) |
| Graduate Degree | 0 (0.0%) | 0 (0.0%) |
| Total | 38 (43.2%) | 50 (56.8%) |
Employment Characteristics in Luquillo
Employment by Class of Employer in Luquillo
Among the 2,115 employed individuals in Luquillo, private company employees (1,383 | 65.4%), self-employed (not incorporated) (233 | 11.0%), and local government employees (217 | 10.3%) make up the most common classes of employment.
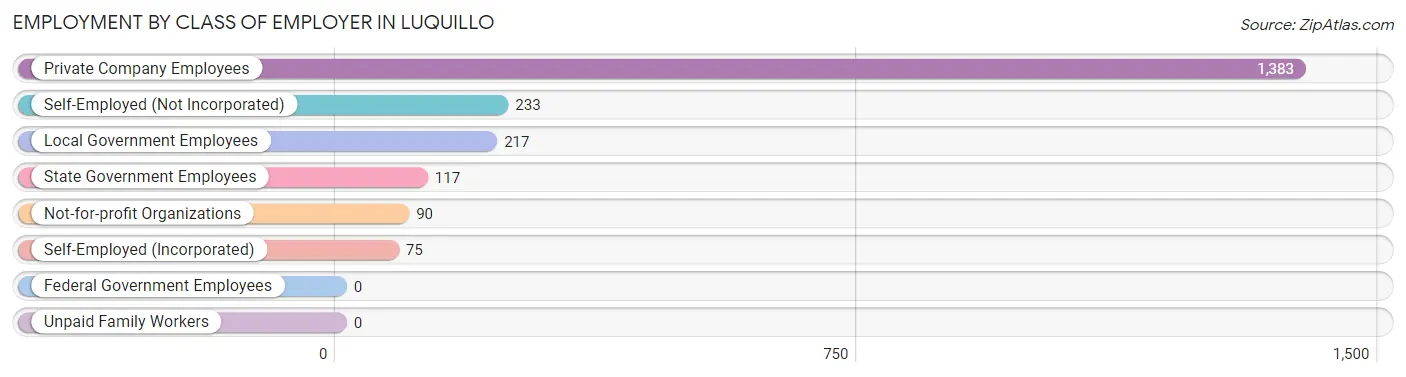
| Employer Class | # Employees | % Employees |
| Private Company Employees | 1,383 | 65.4% |
| Self-Employed (Incorporated) | 75 | 3.5% |
| Self-Employed (Not Incorporated) | 233 | 11.0% |
| Not-for-profit Organizations | 90 | 4.3% |
| Local Government Employees | 217 | 10.3% |
| State Government Employees | 117 | 5.5% |
| Federal Government Employees | 0 | 0.0% |
| Unpaid Family Workers | 0 | 0.0% |
| Total | 2,115 | 100.0% |
Employment Status by Age in Luquillo
According to the labor force statistics for Luquillo, out of the total population over 16 years of age (6,430), 47.9% or 3,080 individuals are in the labor force, with 24.2% or 745 of them unemployed. The age group with the highest labor force participation rate is 30 to 34 years, with 94.4% or 287 individuals in the labor force. Within the labor force, the 20 to 24 years age range has the highest percentage of unemployed individuals, with 55.1% or 352 of them being unemployed.
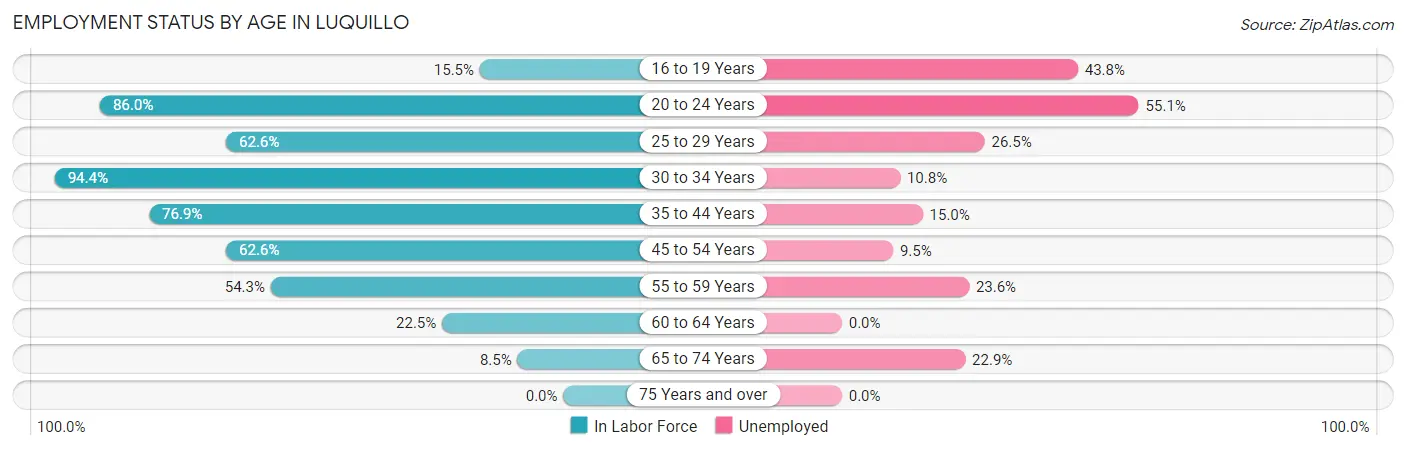
| Age Bracket | In Labor Force | Unemployed |
| 16 to 19 Years | 73 (15.5%) | 32 (43.8%) |
| 20 to 24 Years | 639 (86.0%) | 352 (55.1%) |
| 25 to 29 Years | 358 (62.6%) | 95 (26.5%) |
| 30 to 34 Years | 287 (94.4%) | 31 (10.8%) |
| 35 to 44 Years | 741 (76.9%) | 111 (15.0%) |
| 45 to 54 Years | 581 (62.6%) | 55 (9.5%) |
| 55 to 59 Years | 225 (54.3%) | 53 (23.6%) |
| 60 to 64 Years | 107 (22.5%) | 0 (0.0%) |
| 65 to 74 Years | 70 (8.5%) | 16 (22.9%) |
| 75 Years and over | 0 (0.0%) | 0 (0.0%) |
| Total | 3,080 (47.9%) | 745 (24.2%) |
Employment Status by Educational Attainment in Luquillo
According to labor force statistics for Luquillo, 62.9% of individuals (2,300) out of the total population between 25 and 64 years of age (3,656) are in the labor force, with 15.0% or 345 of them being unemployed. The group with the highest labor force participation rate are those with the educational attainment of bachelor's degree or higher, with 75.1% or 671 individuals in the labor force. Within the labor force, individuals with bachelor's degree or higher education have the highest percentage of unemployment, with 17.6% or 118 of them being unemployed.
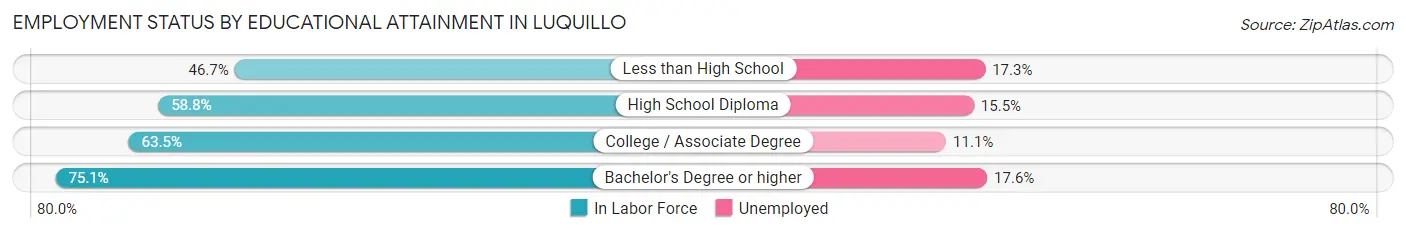
| Educational Attainment | In Labor Force | Unemployed |
| Less than High School | 168 (46.7%) | 62 (17.3%) |
| High School Diploma | 819 (58.8%) | 216 (15.5%) |
| College / Associate Degree | 641 (63.5%) | 112 (11.1%) |
| Bachelor's Degree or higher | 671 (75.1%) | 157 (17.6%) |
| Total | 2,300 (62.9%) | 548 (15.0%) |
Employment Occupations by Sex in Luquillo
Management, Business, Science and Arts Occupations
The most common Management, Business, Science and Arts occupations in Luquillo are Management (210 | 9.0%), Health Diagnosing & Treating (153 | 6.6%), Community & Social Service (128 | 5.5%), Business & Financial (108 | 4.6%), and Education Instruction & Library (80 | 3.4%).
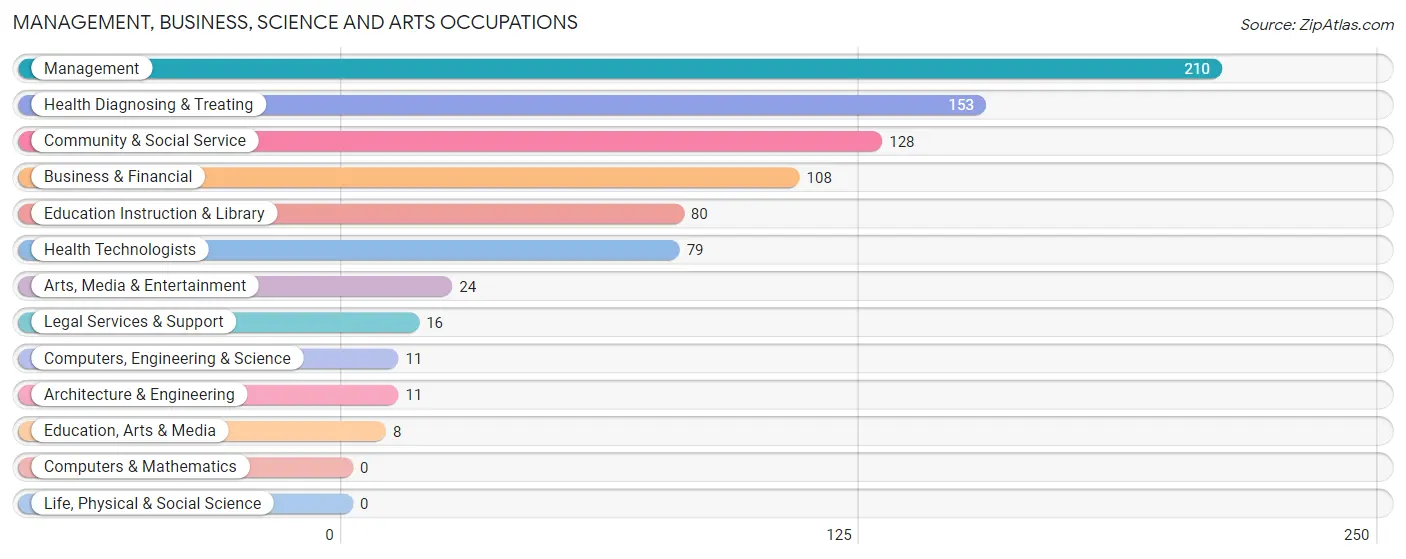
Management, Business, Science and Arts Occupations by Sex
Within the Management, Business, Science and Arts occupations in Luquillo, the most male-oriented occupations are Computers, Engineering & Science (100.0%), Architecture & Engineering (100.0%), and Business & Financial (69.4%), while the most female-oriented occupations are Education, Arts & Media (100.0%), Legal Services & Support (100.0%), and Health Diagnosing & Treating (100.0%).
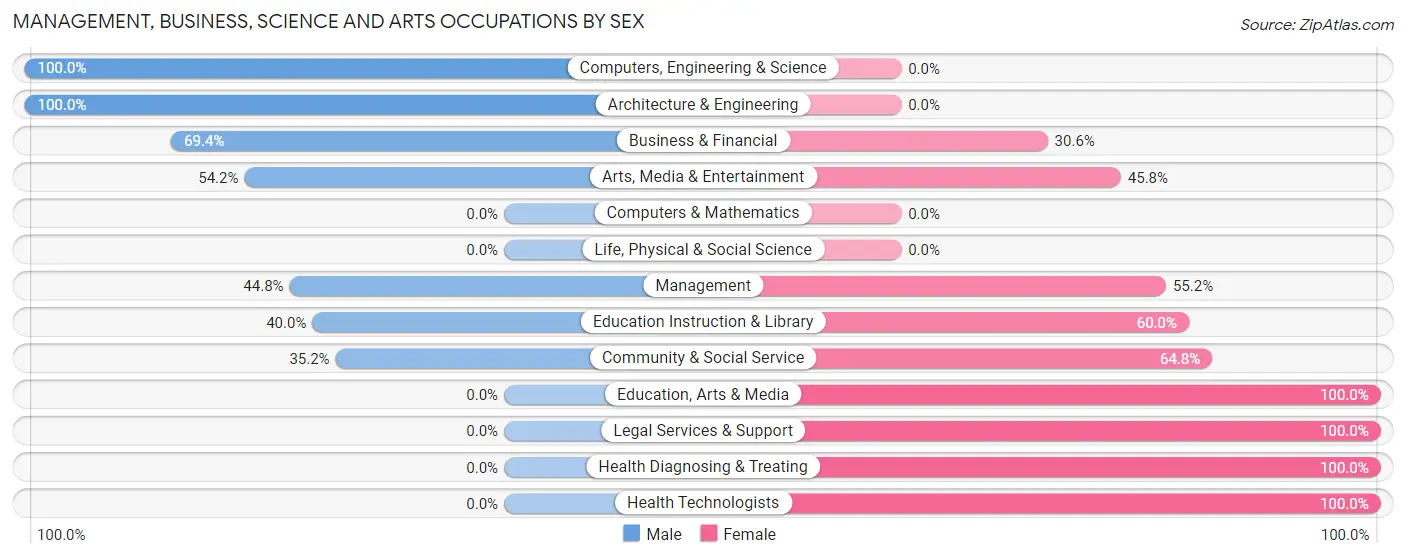
| Occupation | Male | Female |
| Management | 94 (44.8%) | 116 (55.2%) |
| Business & Financial | 75 (69.4%) | 33 (30.6%) |
| Computers, Engineering & Science | 11 (100.0%) | 0 (0.0%) |
| Computers & Mathematics | 0 (0.0%) | 0 (0.0%) |
| Architecture & Engineering | 11 (100.0%) | 0 (0.0%) |
| Life, Physical & Social Science | 0 (0.0%) | 0 (0.0%) |
| Community & Social Service | 45 (35.2%) | 83 (64.8%) |
| Education, Arts & Media | 0 (0.0%) | 8 (100.0%) |
| Legal Services & Support | 0 (0.0%) | 16 (100.0%) |
| Education Instruction & Library | 32 (40.0%) | 48 (60.0%) |
| Arts, Media & Entertainment | 13 (54.2%) | 11 (45.8%) |
| Health Diagnosing & Treating | 0 (0.0%) | 153 (100.0%) |
| Health Technologists | 0 (0.0%) | 79 (100.0%) |
| Total (Category) | 225 (36.9%) | 385 (63.1%) |
| Total (Overall) | 1,146 (49.1%) | 1,190 (50.9%) |
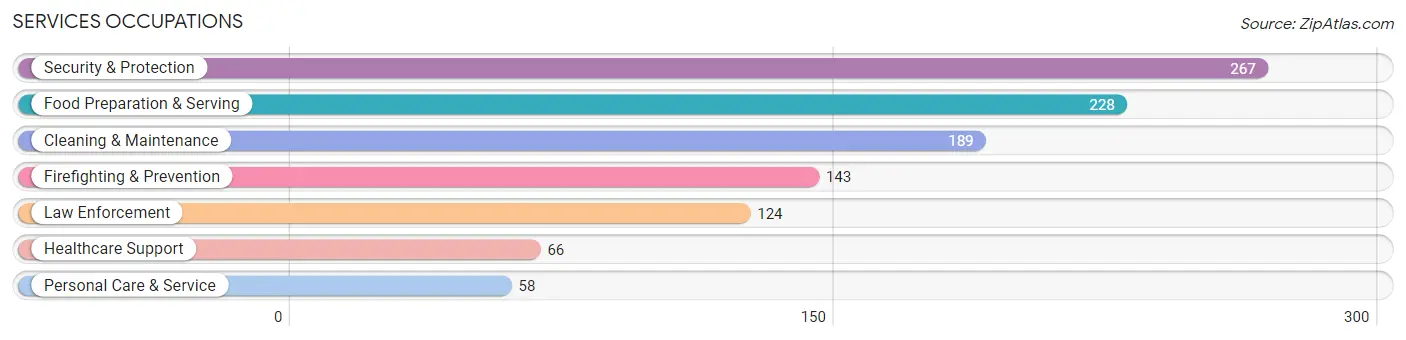
Services Occupations
The most common Services occupations in Luquillo are Security & Protection (267 | 11.4%), Food Preparation & Serving (228 | 9.8%), Cleaning & Maintenance (189 | 8.1%), Firefighting & Prevention (143 | 6.1%), and Law Enforcement (124 | 5.3%).
Services Occupations by Sex
Within the Services occupations in Luquillo, the most male-oriented occupations are Firefighting & Prevention (94.4%), Security & Protection (90.3%), and Law Enforcement (85.5%), while the most female-oriented occupations are Healthcare Support (100.0%), Food Preparation & Serving (69.3%), and Personal Care & Service (58.6%).
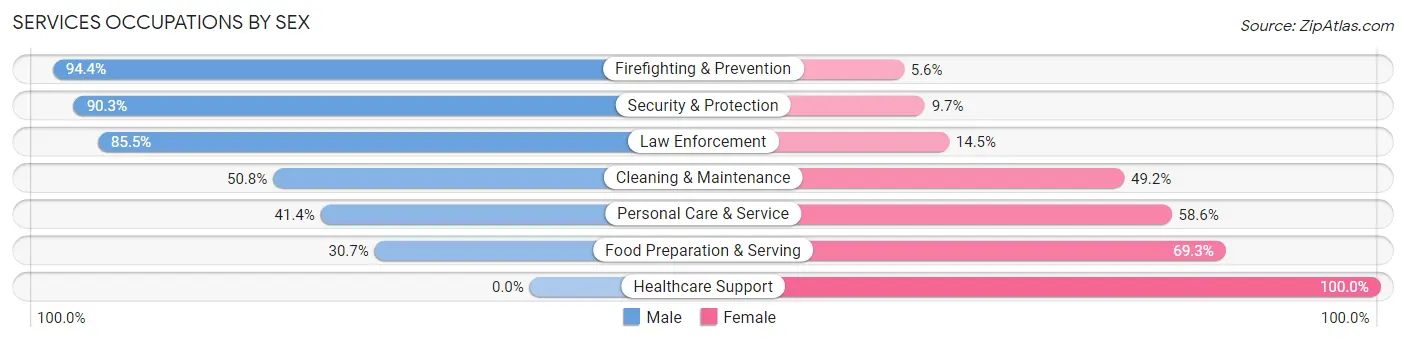
| Occupation | Male | Female |
| Healthcare Support | 0 (0.0%) | 66 (100.0%) |
| Security & Protection | 241 (90.3%) | 26 (9.7%) |
| Firefighting & Prevention | 135 (94.4%) | 8 (5.6%) |
| Law Enforcement | 106 (85.5%) | 18 (14.5%) |
| Food Preparation & Serving | 70 (30.7%) | 158 (69.3%) |
| Cleaning & Maintenance | 96 (50.8%) | 93 (49.2%) |
| Personal Care & Service | 24 (41.4%) | 34 (58.6%) |
| Total (Category) | 431 (53.3%) | 377 (46.7%) |
| Total (Overall) | 1,146 (49.1%) | 1,190 (50.9%) |
Sales and Office Occupations
The most common Sales and Office occupations in Luquillo are Sales & Related (190 | 8.1%), and Office & Administration (157 | 6.7%).

Sales and Office Occupations by Sex

| Occupation | Male | Female |
| Sales & Related | 67 (35.3%) | 123 (64.7%) |
| Office & Administration | 10 (6.4%) | 147 (93.6%) |
| Total (Category) | 77 (22.2%) | 270 (77.8%) |
| Total (Overall) | 1,146 (49.1%) | 1,190 (50.9%) |
Natural Resources, Construction and Maintenance Occupations
The most common Natural Resources, Construction and Maintenance occupations in Luquillo are Installation, Maintenance & Repair (70 | 3.0%), Construction & Extraction (55 | 2.4%), and Farming, Fishing & Forestry (10 | 0.4%).

Natural Resources, Construction and Maintenance Occupations by Sex

| Occupation | Male | Female |
| Farming, Fishing & Forestry | 10 (100.0%) | 0 (0.0%) |
| Construction & Extraction | 55 (100.0%) | 0 (0.0%) |
| Installation, Maintenance & Repair | 70 (100.0%) | 0 (0.0%) |
| Total (Category) | 135 (100.0%) | 0 (0.0%) |
| Total (Overall) | 1,146 (49.1%) | 1,190 (50.9%) |
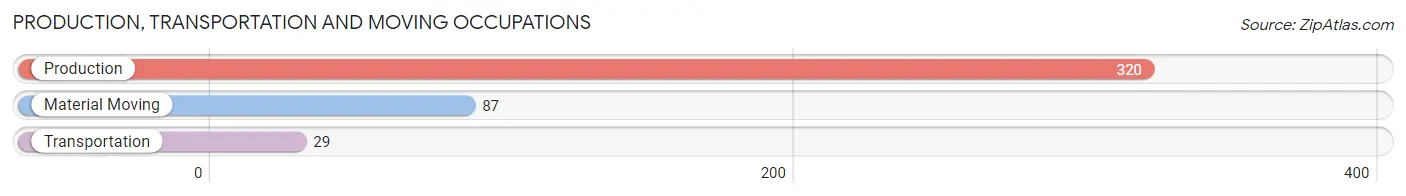
Production, Transportation and Moving Occupations
The most common Production, Transportation and Moving occupations in Luquillo are Production (320 | 13.7%), Material Moving (87 | 3.7%), and Transportation (29 | 1.2%).
Production, Transportation and Moving Occupations by Sex
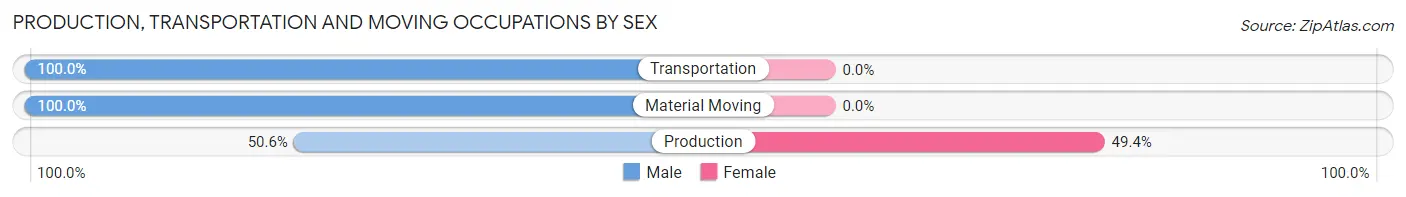
| Occupation | Male | Female |
| Production | 162 (50.6%) | 158 (49.4%) |
| Transportation | 29 (100.0%) | 0 (0.0%) |
| Material Moving | 87 (100.0%) | 0 (0.0%) |
| Total (Category) | 278 (63.8%) | 158 (36.2%) |
| Total (Overall) | 1,146 (49.1%) | 1,190 (50.9%) |
Employment Industries by Sex in Luquillo
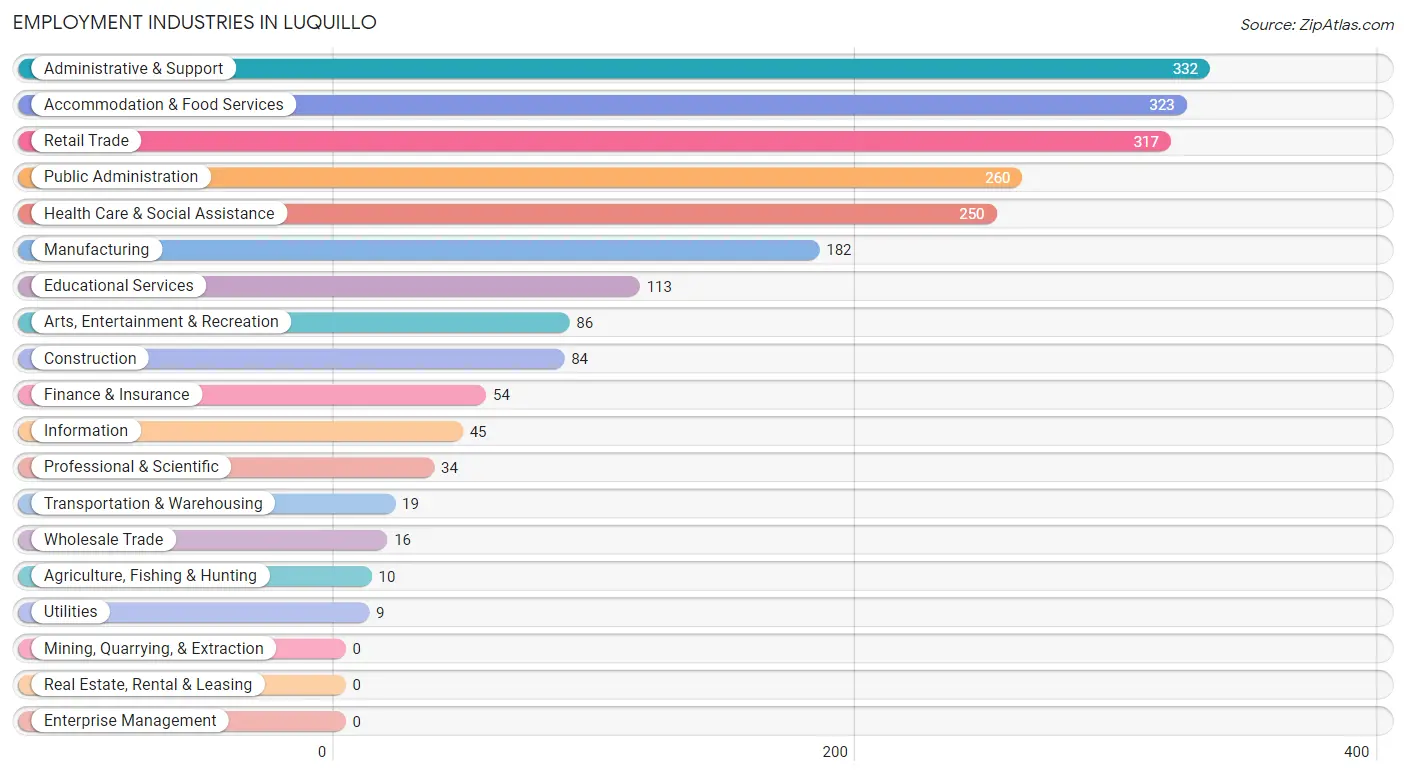
Employment Industries in Luquillo
The major employment industries in Luquillo include Administrative & Support (332 | 14.2%), Accommodation & Food Services (323 | 13.8%), Retail Trade (317 | 13.6%), Public Administration (260 | 11.1%), and Health Care & Social Assistance (250 | 10.7%).
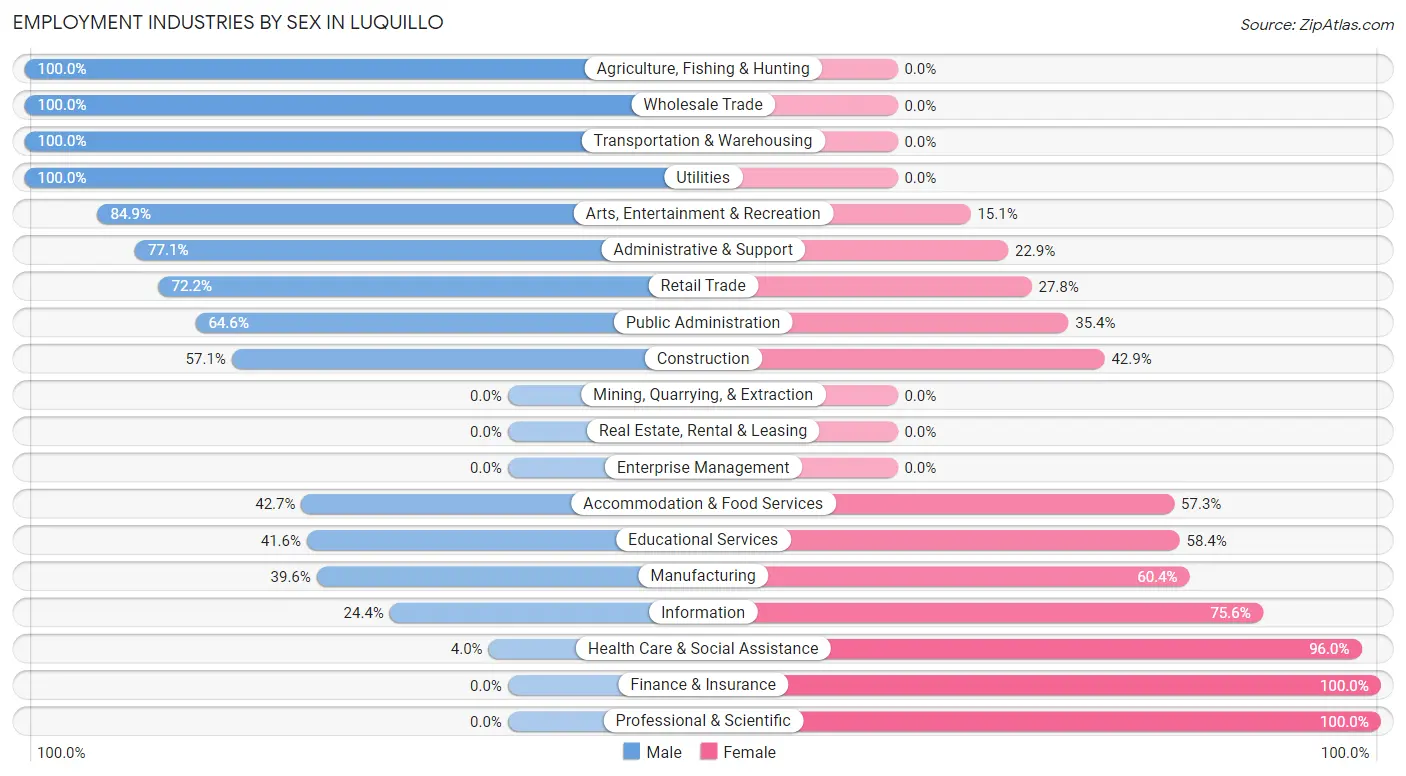
Employment Industries by Sex in Luquillo
The Luquillo industries that see more men than women are Agriculture, Fishing & Hunting (100.0%), Wholesale Trade (100.0%), and Transportation & Warehousing (100.0%), whereas the industries that tend to have a higher number of women are Finance & Insurance (100.0%), Professional & Scientific (100.0%), and Health Care & Social Assistance (96.0%).
| Industry | Male | Female |
| Agriculture, Fishing & Hunting | 10 (100.0%) | 0 (0.0%) |
| Mining, Quarrying, & Extraction | 0 (0.0%) | 0 (0.0%) |
| Construction | 48 (57.1%) | 36 (42.9%) |
| Manufacturing | 72 (39.6%) | 110 (60.4%) |
| Wholesale Trade | 16 (100.0%) | 0 (0.0%) |
| Retail Trade | 229 (72.2%) | 88 (27.8%) |
| Transportation & Warehousing | 19 (100.0%) | 0 (0.0%) |
| Utilities | 9 (100.0%) | 0 (0.0%) |
| Information | 11 (24.4%) | 34 (75.6%) |
| Finance & Insurance | 0 (0.0%) | 54 (100.0%) |
| Real Estate, Rental & Leasing | 0 (0.0%) | 0 (0.0%) |
| Professional & Scientific | 0 (0.0%) | 34 (100.0%) |
| Enterprise Management | 0 (0.0%) | 0 (0.0%) |
| Administrative & Support | 256 (77.1%) | 76 (22.9%) |
| Educational Services | 47 (41.6%) | 66 (58.4%) |
| Health Care & Social Assistance | 10 (4.0%) | 240 (96.0%) |
| Arts, Entertainment & Recreation | 73 (84.9%) | 13 (15.1%) |
| Accommodation & Food Services | 138 (42.7%) | 185 (57.3%) |
| Public Administration | 168 (64.6%) | 92 (35.4%) |
| Total | 1,146 (49.1%) | 1,190 (50.9%) |
Education in Luquillo
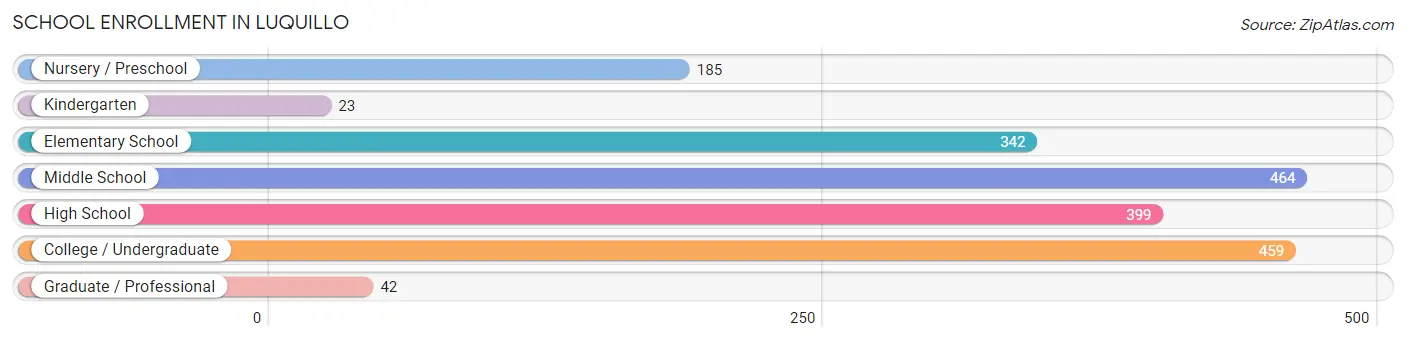
School Enrollment in Luquillo
The most common levels of schooling among the 1,914 students in Luquillo are middle school (464 | 24.2%), college / undergraduate (459 | 24.0%), and high school (399 | 20.8%).
| School Level | # Students | % Students |
| Nursery / Preschool | 185 | 9.7% |
| Kindergarten | 23 | 1.2% |
| Elementary School | 342 | 17.9% |
| Middle School | 464 | 24.2% |
| High School | 399 | 20.8% |
| College / Undergraduate | 459 | 24.0% |
| Graduate / Professional | 42 | 2.2% |
| Total | 1,914 | 100.0% |
School Enrollment by Age by Funding Source in Luquillo
Out of a total of 1,914 students who are enrolled in schools in Luquillo, 702 (36.7%) attend a private institution, while the remaining 1,212 (63.3%) are enrolled in public schools. The age group of 25 to 34 year olds has the highest likelihood of being enrolled in private schools, with 47 (100.0% in the age bracket) enrolled. Conversely, the age group of 15 to 17 year olds has the lowest likelihood of being enrolled in a private school, with 284 (90.2% in the age bracket) attending a public institution.
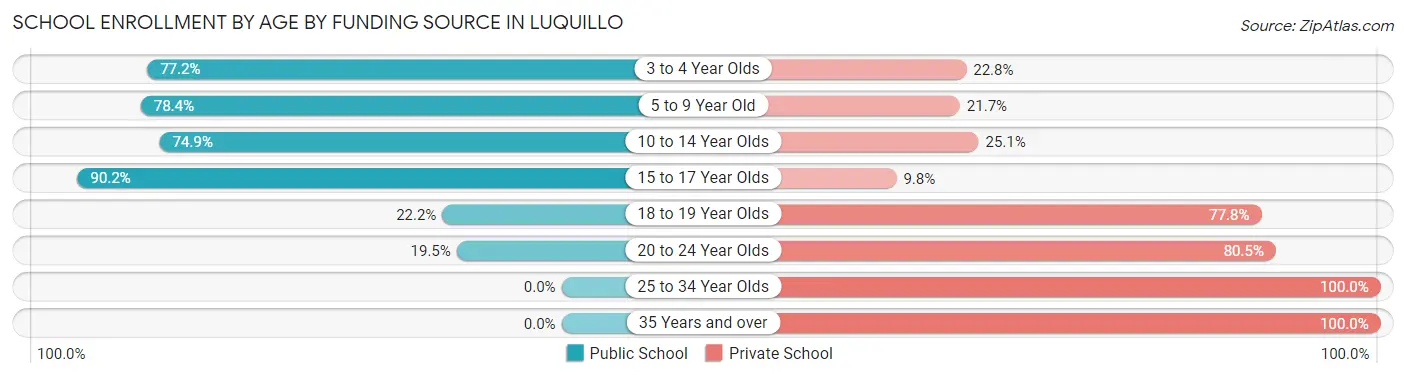
| Age Bracket | Public School | Private School |
| 3 to 4 Year Olds | 125 (77.2%) | 37 (22.8%) |
| 5 to 9 Year Old | 304 (78.3%) | 84 (21.6%) |
| 10 to 14 Year Olds | 423 (74.9%) | 142 (25.1%) |
| 15 to 17 Year Olds | 284 (90.2%) | 31 (9.8%) |
| 18 to 19 Year Olds | 18 (22.2%) | 63 (77.8%) |
| 20 to 24 Year Olds | 58 (19.5%) | 239 (80.5%) |
| 25 to 34 Year Olds | 0 (0.0%) | 47 (100.0%) |
| 35 Years and over | 0 (0.0%) | 59 (100.0%) |
| Total | 1,212 (63.3%) | 702 (36.7%) |
Educational Attainment by Field of Study in Luquillo
Business (277 | 22.2%), education (246 | 19.7%), arts & humanities (176 | 14.1%), science & technology (160 | 12.8%), and social sciences (121 | 9.7%) are the most common fields of study among 1,247 individuals in Luquillo who have obtained a bachelor's degree or higher.
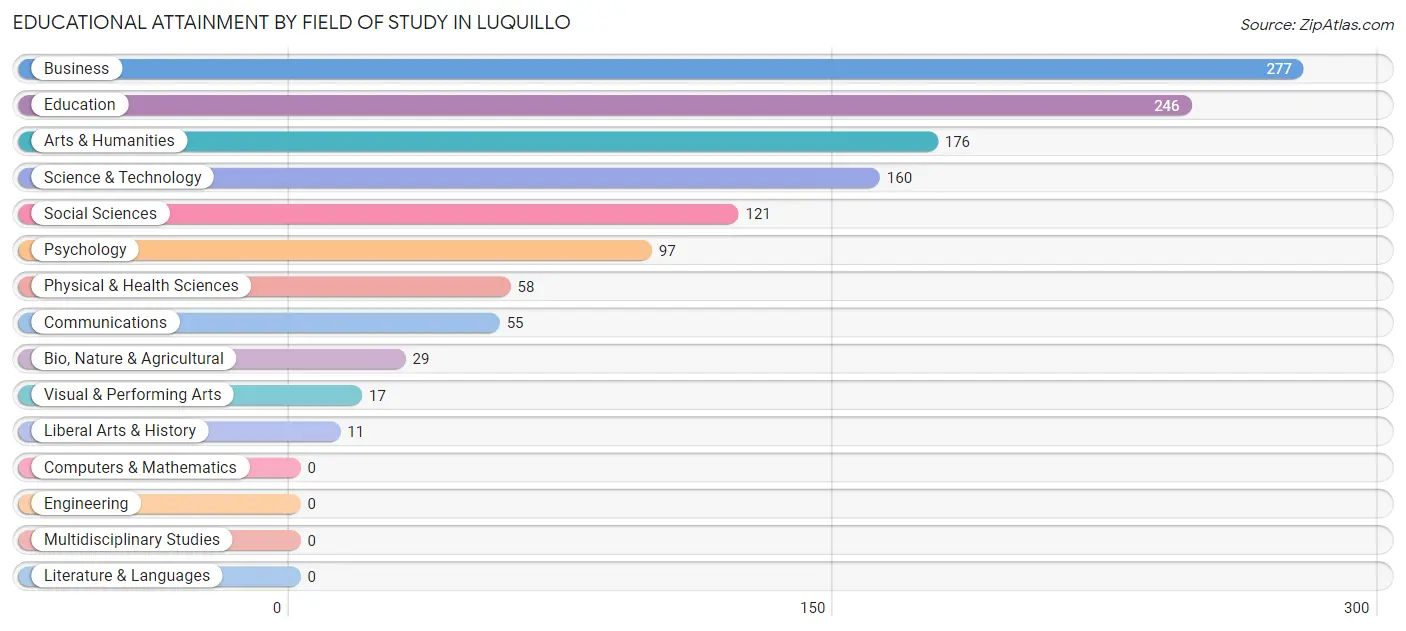
| Field of Study | # Graduates | % Graduates |
| Computers & Mathematics | 0 | 0.0% |
| Bio, Nature & Agricultural | 29 | 2.3% |
| Physical & Health Sciences | 58 | 4.6% |
| Psychology | 97 | 7.8% |
| Social Sciences | 121 | 9.7% |
| Engineering | 0 | 0.0% |
| Multidisciplinary Studies | 0 | 0.0% |
| Science & Technology | 160 | 12.8% |
| Business | 277 | 22.2% |
| Education | 246 | 19.7% |
| Literature & Languages | 0 | 0.0% |
| Liberal Arts & History | 11 | 0.9% |
| Visual & Performing Arts | 17 | 1.4% |
| Communications | 55 | 4.4% |
| Arts & Humanities | 176 | 14.1% |
| Total | 1,247 | 100.0% |
Transportation & Commute in Luquillo
Vehicle Availability by Sex in Luquillo
The most prevalent vehicle ownership categories in Luquillo are males with 2 vehicles (513, accounting for 51.2%) and females with 2 vehicles (325, making up 46.1%).
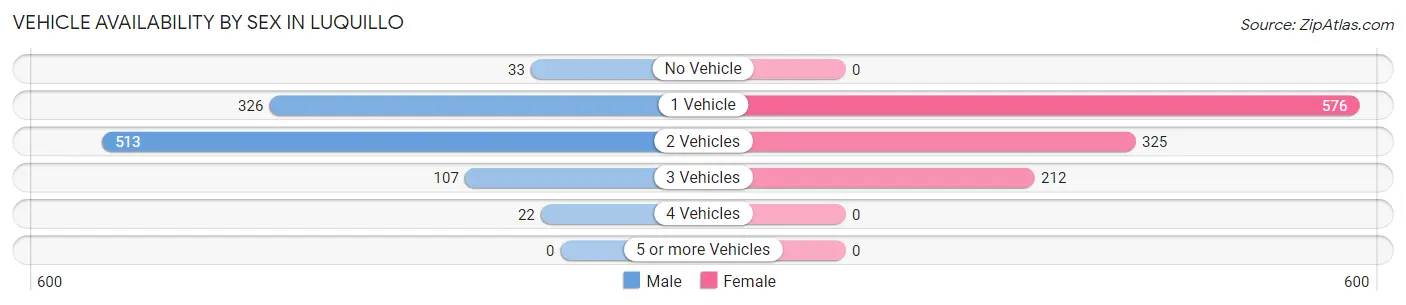
| Vehicles Available | Male | Female |
| No Vehicle | 33 (3.3%) | 0 (0.0%) |
| 1 Vehicle | 326 (32.6%) | 576 (51.7%) |
| 2 Vehicles | 513 (51.2%) | 325 (29.2%) |
| 3 Vehicles | 107 (10.7%) | 212 (19.1%) |
| 4 Vehicles | 22 (2.2%) | 0 (0.0%) |
| 5 or more Vehicles | 0 (0.0%) | 0 (0.0%) |
| Total | 1,001 (100.0%) | 1,113 (100.0%) |
Commute Time in Luquillo
The most frequently occuring commute durations in Luquillo are 15 to 19 minutes (340 commuters, 16.8%), 60 to 89 minutes (328 commuters, 16.3%), and 30 to 34 minutes (254 commuters, 12.6%).
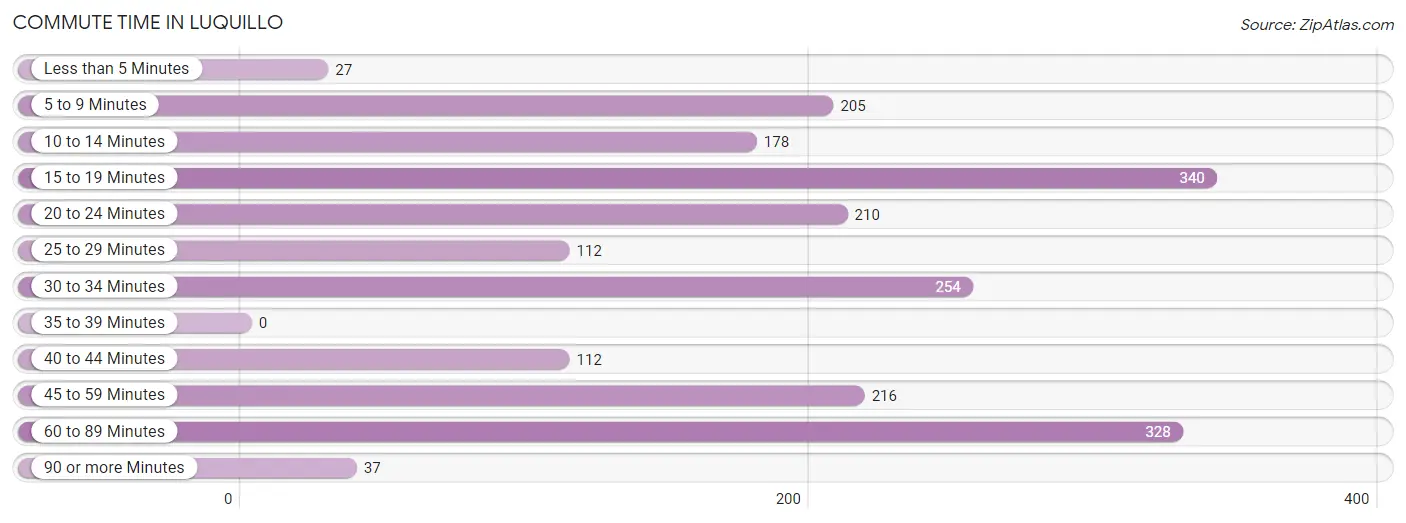
| Commute Time | # Commuters | % Commuters |
| Less than 5 Minutes | 27 | 1.3% |
| 5 to 9 Minutes | 205 | 10.2% |
| 10 to 14 Minutes | 178 | 8.8% |
| 15 to 19 Minutes | 340 | 16.8% |
| 20 to 24 Minutes | 210 | 10.4% |
| 25 to 29 Minutes | 112 | 5.6% |
| 30 to 34 Minutes | 254 | 12.6% |
| 35 to 39 Minutes | 0 | 0.0% |
| 40 to 44 Minutes | 112 | 5.6% |
| 45 to 59 Minutes | 216 | 10.7% |
| 60 to 89 Minutes | 328 | 16.3% |
| 90 or more Minutes | 37 | 1.8% |
Commute Time by Sex in Luquillo
The most common commute times in Luquillo are 15 to 19 minutes (184 commuters, 19.2%) for males and 60 to 89 minutes (207 commuters, 19.5%) for females.
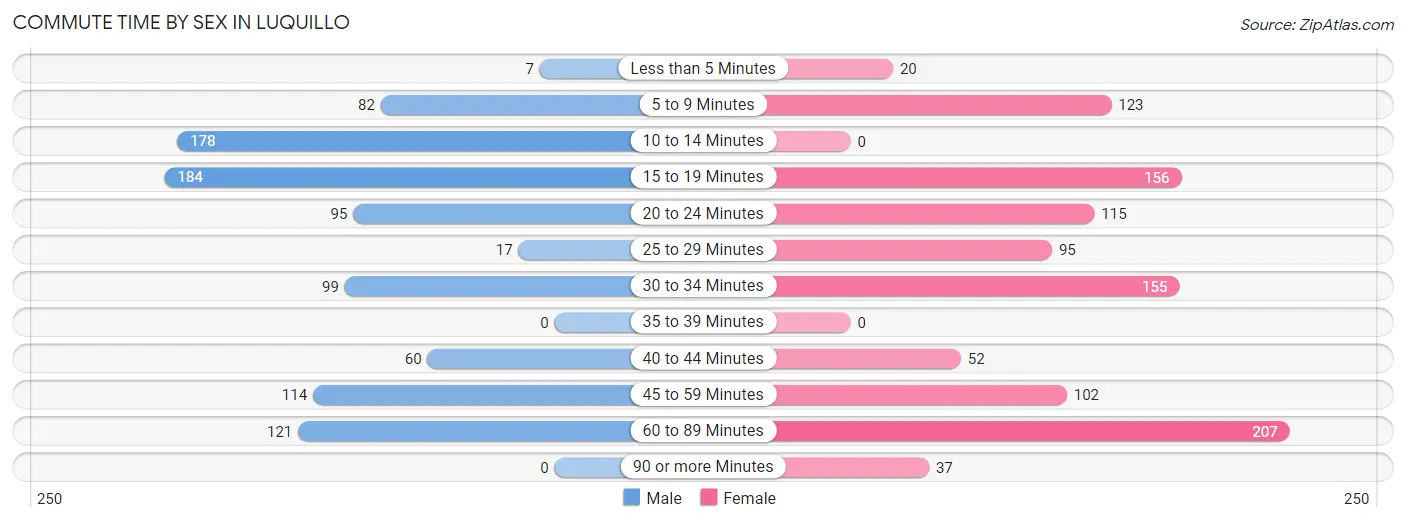
| Commute Time | Male | Female |
| Less than 5 Minutes | 7 (0.7%) | 20 (1.9%) |
| 5 to 9 Minutes | 82 (8.6%) | 123 (11.6%) |
| 10 to 14 Minutes | 178 (18.6%) | 0 (0.0%) |
| 15 to 19 Minutes | 184 (19.2%) | 156 (14.7%) |
| 20 to 24 Minutes | 95 (9.9%) | 115 (10.8%) |
| 25 to 29 Minutes | 17 (1.8%) | 95 (8.9%) |
| 30 to 34 Minutes | 99 (10.3%) | 155 (14.6%) |
| 35 to 39 Minutes | 0 (0.0%) | 0 (0.0%) |
| 40 to 44 Minutes | 60 (6.3%) | 52 (4.9%) |
| 45 to 59 Minutes | 114 (11.9%) | 102 (9.6%) |
| 60 to 89 Minutes | 121 (12.6%) | 207 (19.5%) |
| 90 or more Minutes | 0 (0.0%) | 37 (3.5%) |
Time of Departure to Work by Sex in Luquillo
The most frequent times of departure to work in Luquillo are 9:00 AM to 9:59 AM (136, 14.2%) for males and 7:30 AM to 7:59 AM (143, 13.5%) for females.
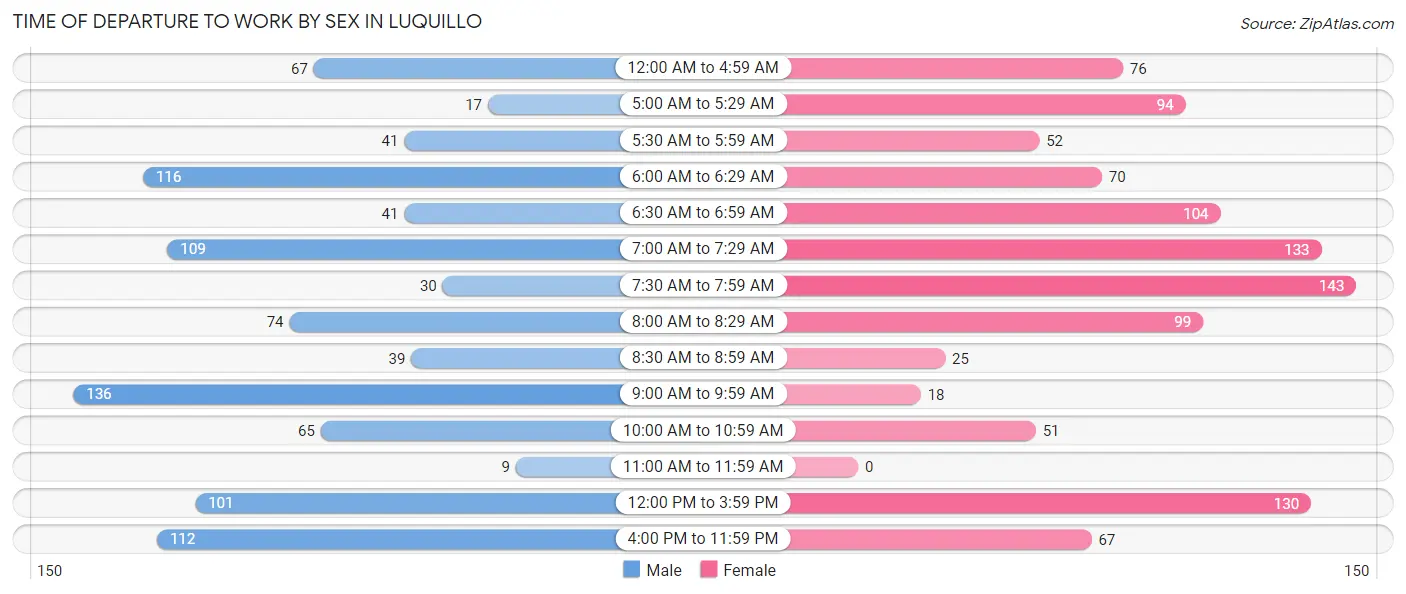
| Time of Departure | Male | Female |
| 12:00 AM to 4:59 AM | 67 (7.0%) | 76 (7.2%) |
| 5:00 AM to 5:29 AM | 17 (1.8%) | 94 (8.8%) |
| 5:30 AM to 5:59 AM | 41 (4.3%) | 52 (4.9%) |
| 6:00 AM to 6:29 AM | 116 (12.1%) | 70 (6.6%) |
| 6:30 AM to 6:59 AM | 41 (4.3%) | 104 (9.8%) |
| 7:00 AM to 7:29 AM | 109 (11.4%) | 133 (12.5%) |
| 7:30 AM to 7:59 AM | 30 (3.1%) | 143 (13.5%) |
| 8:00 AM to 8:29 AM | 74 (7.7%) | 99 (9.3%) |
| 8:30 AM to 8:59 AM | 39 (4.1%) | 25 (2.4%) |
| 9:00 AM to 9:59 AM | 136 (14.2%) | 18 (1.7%) |
| 10:00 AM to 10:59 AM | 65 (6.8%) | 51 (4.8%) |
| 11:00 AM to 11:59 AM | 9 (0.9%) | 0 (0.0%) |
| 12:00 PM to 3:59 PM | 101 (10.5%) | 130 (12.2%) |
| 4:00 PM to 11:59 PM | 112 (11.7%) | 67 (6.3%) |
| Total | 957 (100.0%) | 1,062 (100.0%) |
Housing Occupancy in Luquillo
Occupancy by Ownership in Luquillo
Of the total 3,083 dwellings in Luquillo, owner-occupied units account for 1,946 (63.1%), while renter-occupied units make up 1,137 (36.9%).
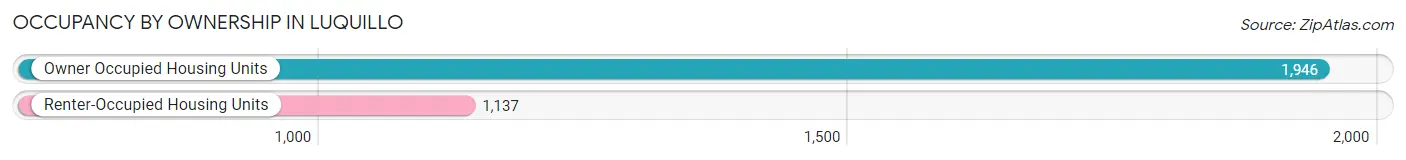
| Occupancy | # Housing Units | % Housing Units |
| Owner Occupied Housing Units | 1,946 | 63.1% |
| Renter-Occupied Housing Units | 1,137 | 36.9% |
| Total Occupied Housing Units | 3,083 | 100.0% |
Occupancy by Household Size in Luquillo
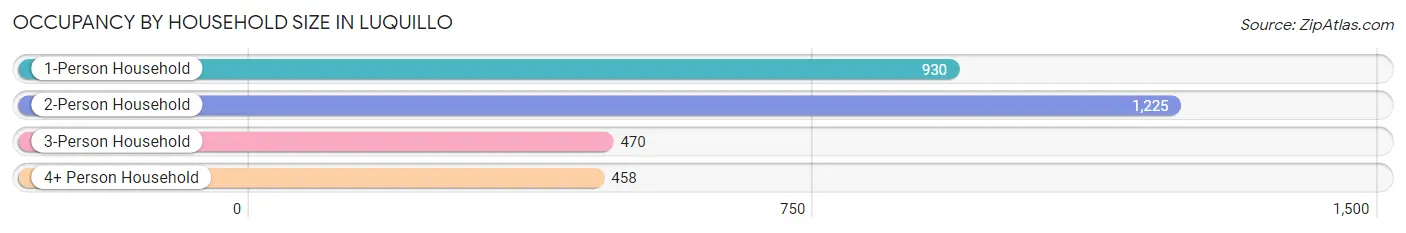
| Household Size | # Housing Units | % Housing Units |
| 1-Person Household | 930 | 30.2% |
| 2-Person Household | 1,225 | 39.7% |
| 3-Person Household | 470 | 15.2% |
| 4+ Person Household | 458 | 14.9% |
| Total Housing Units | 3,083 | 100.0% |
Occupancy by Ownership by Household Size in Luquillo
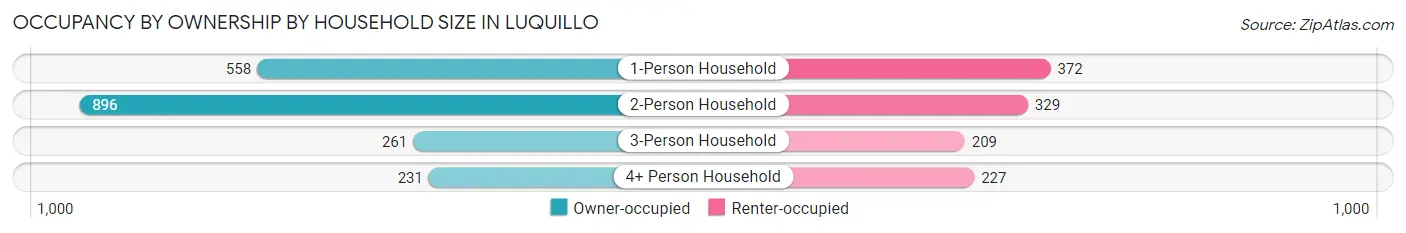
| Household Size | Owner-occupied | Renter-occupied |
| 1-Person Household | 558 (60.0%) | 372 (40.0%) |
| 2-Person Household | 896 (73.1%) | 329 (26.9%) |
| 3-Person Household | 261 (55.5%) | 209 (44.5%) |
| 4+ Person Household | 231 (50.4%) | 227 (49.6%) |
| Total Housing Units | 1,946 (63.1%) | 1,137 (36.9%) |
Occupancy by Educational Attainment in Luquillo
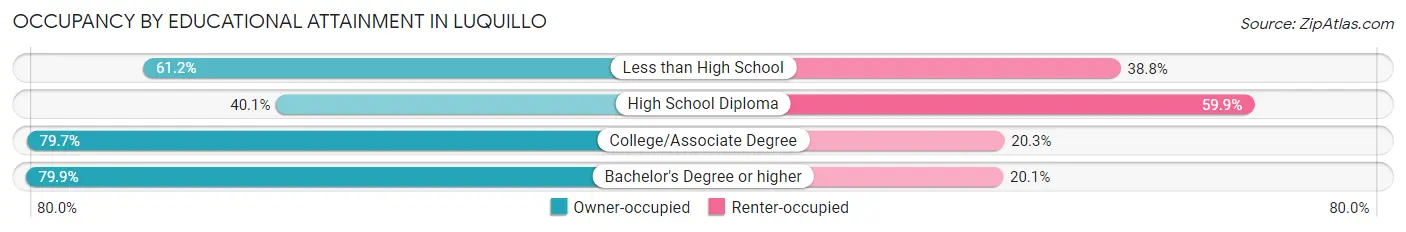
| Household Size | Owner-occupied | Renter-occupied |
| Less than High School | 341 (61.2%) | 216 (38.8%) |
| High School Diploma | 414 (40.1%) | 619 (59.9%) |
| College/Associate Degree | 639 (79.7%) | 163 (20.3%) |
| Bachelor's Degree or higher | 552 (79.9%) | 139 (20.1%) |
Occupancy by Age of Householder in Luquillo
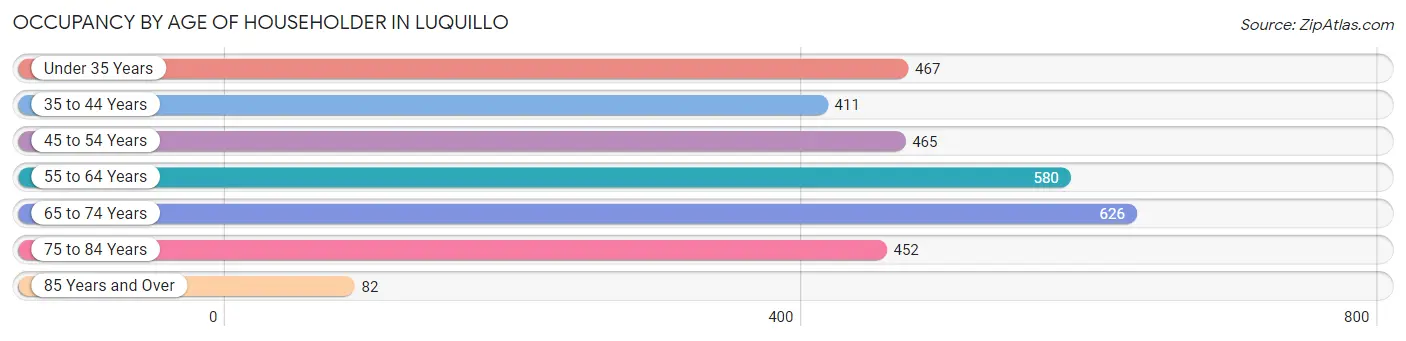
| Age Bracket | # Households | % Households |
| Under 35 Years | 467 | 15.1% |
| 35 to 44 Years | 411 | 13.3% |
| 45 to 54 Years | 465 | 15.1% |
| 55 to 64 Years | 580 | 18.8% |
| 65 to 74 Years | 626 | 20.3% |
| 75 to 84 Years | 452 | 14.7% |
| 85 Years and Over | 82 | 2.7% |
| Total | 3,083 | 100.0% |
Housing Finances in Luquillo
Median Income by Occupancy in Luquillo
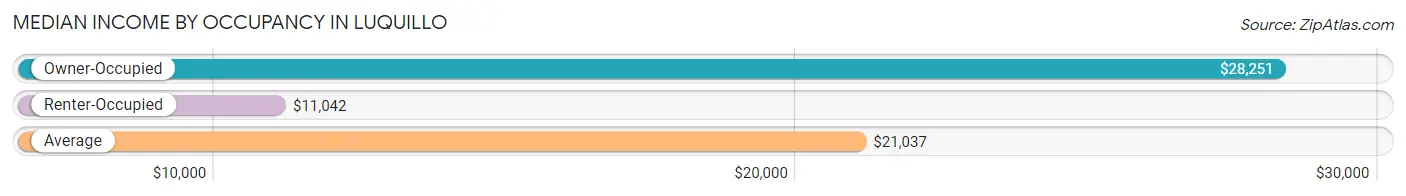
| Occupancy Type | # Households | Median Income |
| Owner-Occupied | 1,946 (63.1%) | $28,251 |
| Renter-Occupied | 1,137 (36.9%) | $11,042 |
| Average | 3,083 (100.0%) | $21,037 |
Occupancy by Householder Income Bracket in Luquillo
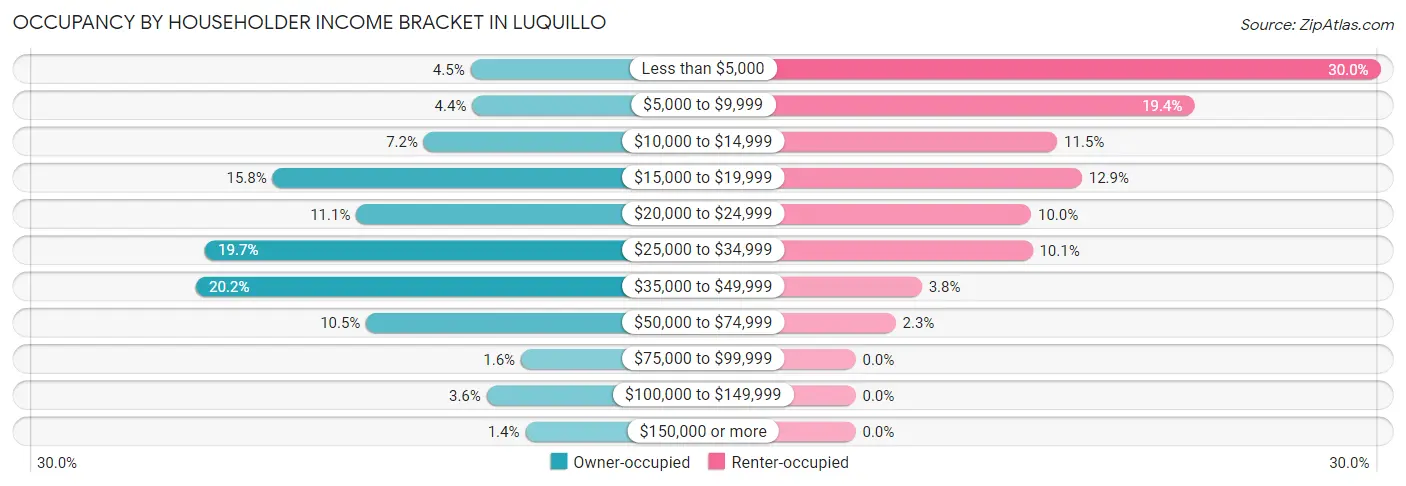
| Income Bracket | Owner-occupied | Renter-occupied |
| Less than $5,000 | 88 (4.5%) | 341 (30.0%) |
| $5,000 to $9,999 | 86 (4.4%) | 220 (19.4%) |
| $10,000 to $14,999 | 140 (7.2%) | 131 (11.5%) |
| $15,000 to $19,999 | 308 (15.8%) | 147 (12.9%) |
| $20,000 to $24,999 | 215 (11.1%) | 114 (10.0%) |
| $25,000 to $34,999 | 383 (19.7%) | 115 (10.1%) |
| $35,000 to $49,999 | 393 (20.2%) | 43 (3.8%) |
| $50,000 to $74,999 | 204 (10.5%) | 26 (2.3%) |
| $75,000 to $99,999 | 32 (1.6%) | 0 (0.0%) |
| $100,000 to $149,999 | 70 (3.6%) | 0 (0.0%) |
| $150,000 or more | 27 (1.4%) | 0 (0.0%) |
| Total | 1,946 (100.0%) | 1,137 (100.0%) |
Monthly Housing Cost Tiers in Luquillo
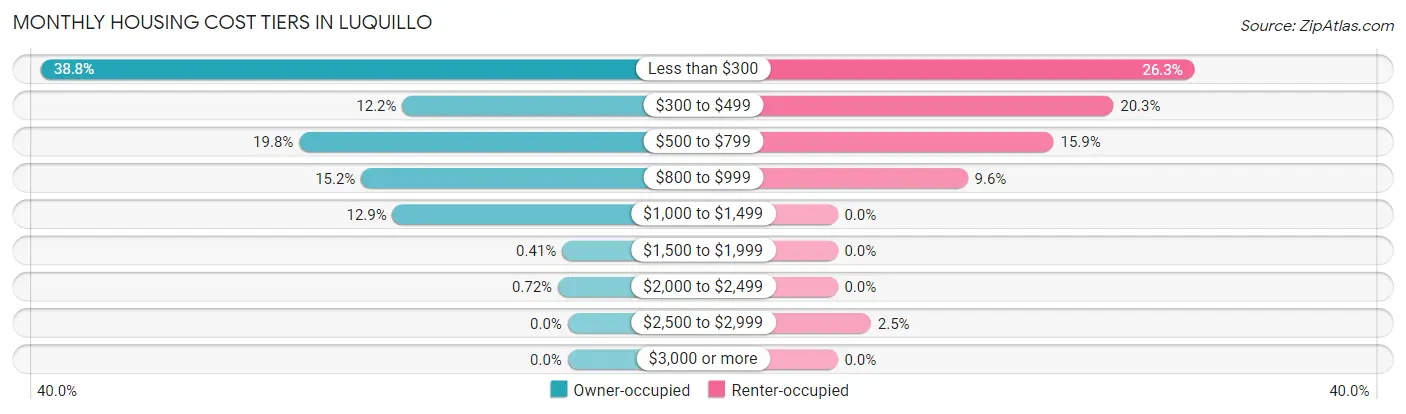
| Monthly Cost | Owner-occupied | Renter-occupied |
| Less than $300 | 755 (38.8%) | 299 (26.3%) |
| $300 to $499 | 237 (12.2%) | 231 (20.3%) |
| $500 to $799 | 385 (19.8%) | 181 (15.9%) |
| $800 to $999 | 296 (15.2%) | 109 (9.6%) |
| $1,000 to $1,499 | 251 (12.9%) | 0 (0.0%) |
| $1,500 to $1,999 | 8 (0.4%) | 0 (0.0%) |
| $2,000 to $2,499 | 14 (0.7%) | 0 (0.0%) |
| $2,500 to $2,999 | 0 (0.0%) | 28 (2.5%) |
| $3,000 or more | 0 (0.0%) | 0 (0.0%) |
| Total | 1,946 (100.0%) | 1,137 (100.0%) |
Physical Housing Characteristics in Luquillo
Housing Structures in Luquillo
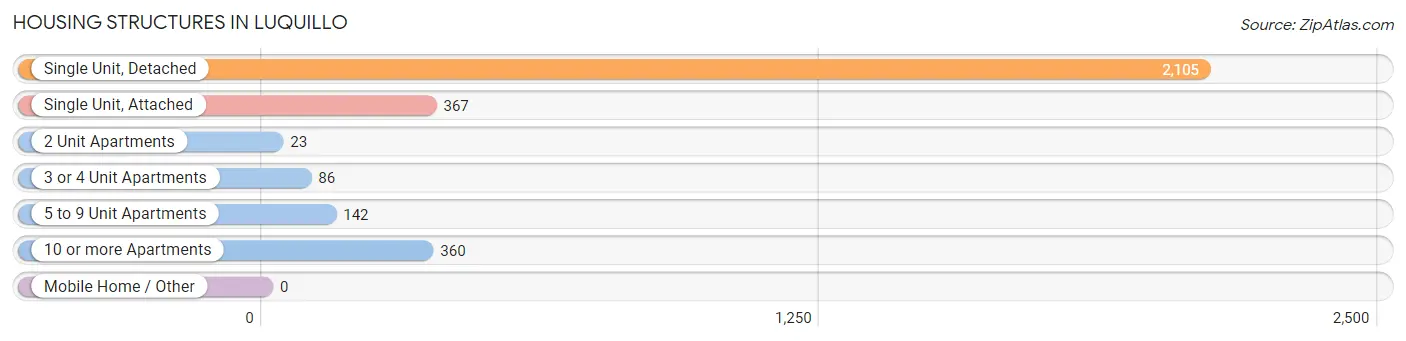
| Structure Type | # Housing Units | % Housing Units |
| Single Unit, Detached | 2,105 | 68.3% |
| Single Unit, Attached | 367 | 11.9% |
| 2 Unit Apartments | 23 | 0.7% |
| 3 or 4 Unit Apartments | 86 | 2.8% |
| 5 to 9 Unit Apartments | 142 | 4.6% |
| 10 or more Apartments | 360 | 11.7% |
| Mobile Home / Other | 0 | 0.0% |
| Total | 3,083 | 100.0% |
Housing Structures by Occupancy in Luquillo
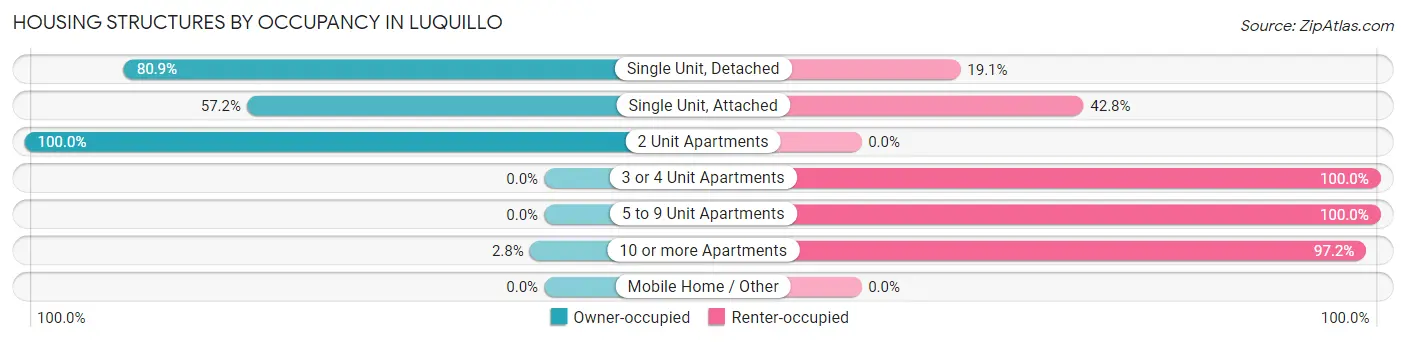
| Structure Type | Owner-occupied | Renter-occupied |
| Single Unit, Detached | 1,703 (80.9%) | 402 (19.1%) |
| Single Unit, Attached | 210 (57.2%) | 157 (42.8%) |
| 2 Unit Apartments | 23 (100.0%) | 0 (0.0%) |
| 3 or 4 Unit Apartments | 0 (0.0%) | 86 (100.0%) |
| 5 to 9 Unit Apartments | 0 (0.0%) | 142 (100.0%) |
| 10 or more Apartments | 10 (2.8%) | 350 (97.2%) |
| Mobile Home / Other | 0 (0.0%) | 0 (0.0%) |
| Total | 1,946 (63.1%) | 1,137 (36.9%) |
Housing Structures by Number of Rooms in Luquillo
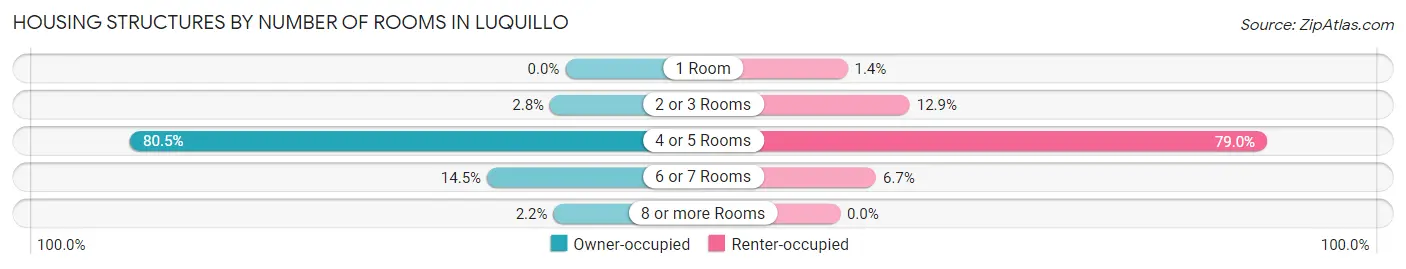
| Number of Rooms | Owner-occupied | Renter-occupied |
| 1 Room | 0 (0.0%) | 16 (1.4%) |
| 2 or 3 Rooms | 55 (2.8%) | 147 (12.9%) |
| 4 or 5 Rooms | 1,566 (80.5%) | 898 (79.0%) |
| 6 or 7 Rooms | 282 (14.5%) | 76 (6.7%) |
| 8 or more Rooms | 43 (2.2%) | 0 (0.0%) |
| Total | 1,946 (100.0%) | 1,137 (100.0%) |
Housing Structure by Heating Type in Luquillo
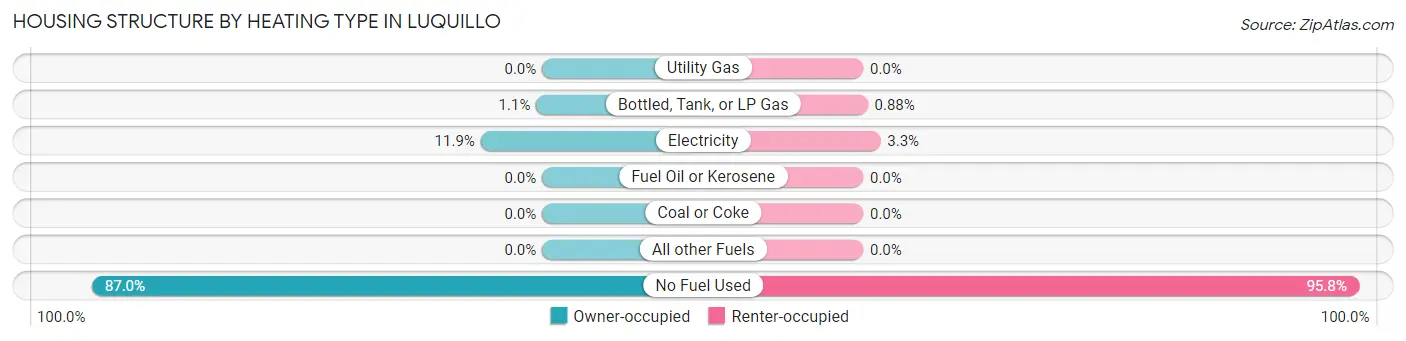
| Heating Type | Owner-occupied | Renter-occupied |
| Utility Gas | 0 (0.0%) | 0 (0.0%) |
| Bottled, Tank, or LP Gas | 22 (1.1%) | 10 (0.9%) |
| Electricity | 231 (11.9%) | 38 (3.3%) |
| Fuel Oil or Kerosene | 0 (0.0%) | 0 (0.0%) |
| Coal or Coke | 0 (0.0%) | 0 (0.0%) |
| All other Fuels | 0 (0.0%) | 0 (0.0%) |
| No Fuel Used | 1,693 (87.0%) | 1,089 (95.8%) |
| Total | 1,946 (100.0%) | 1,137 (100.0%) |
Household Vehicle Usage in Luquillo
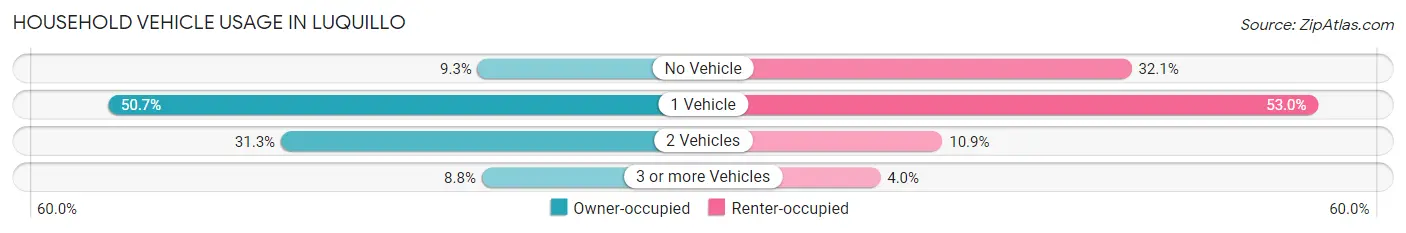
| Vehicles per Household | Owner-occupied | Renter-occupied |
| No Vehicle | 180 (9.2%) | 365 (32.1%) |
| 1 Vehicle | 986 (50.7%) | 603 (53.0%) |
| 2 Vehicles | 609 (31.3%) | 124 (10.9%) |
| 3 or more Vehicles | 171 (8.8%) | 45 (4.0%) |
| Total | 1,946 (100.0%) | 1,137 (100.0%) |
Real Estate & Mortgages in Luquillo
Real Estate and Mortgage Overview in Luquillo
| Characteristic | Without Mortgage | With Mortgage |
| Housing Units | 910 | 1,036 |
| Median Property Value | $120,900 | $127,100 |
| Median Household Income | $26,987 | $11 |
| Monthly Housing Costs | $182 | $0 |
| Real Estate Taxes | $707 | $976 |
Property Value by Mortgage Status in Luquillo
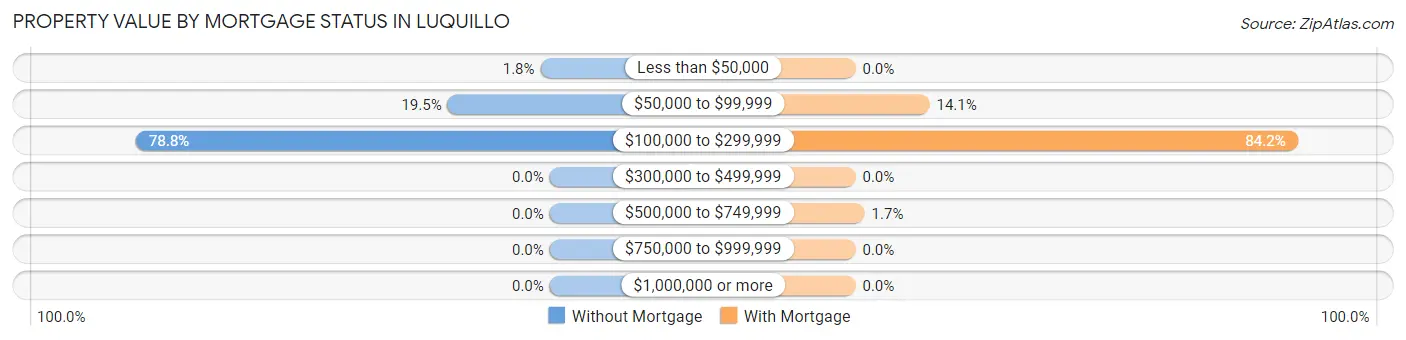
| Property Value | Without Mortgage | With Mortgage |
| Less than $50,000 | 16 (1.8%) | 0 (0.0%) |
| $50,000 to $99,999 | 177 (19.5%) | 146 (14.1%) |
| $100,000 to $299,999 | 717 (78.8%) | 872 (84.2%) |
| $300,000 to $499,999 | 0 (0.0%) | 0 (0.0%) |
| $500,000 to $749,999 | 0 (0.0%) | 18 (1.7%) |
| $750,000 to $999,999 | 0 (0.0%) | 0 (0.0%) |
| $1,000,000 or more | 0 (0.0%) | 0 (0.0%) |
| Total | 910 (100.0%) | 1,036 (100.0%) |
Household Income by Mortgage Status in Luquillo
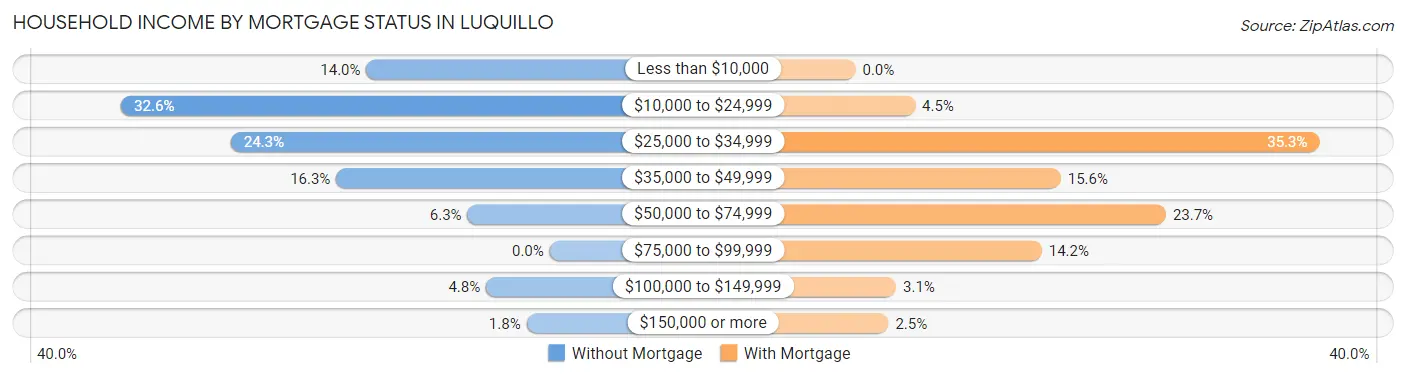
| Household Income | Without Mortgage | With Mortgage |
| Less than $10,000 | 127 (14.0%) | 0 (0.0%) |
| $10,000 to $24,999 | 297 (32.6%) | 47 (4.5%) |
| $25,000 to $34,999 | 221 (24.3%) | 366 (35.3%) |
| $35,000 to $49,999 | 148 (16.3%) | 162 (15.6%) |
| $50,000 to $74,999 | 57 (6.3%) | 245 (23.6%) |
| $75,000 to $99,999 | 0 (0.0%) | 147 (14.2%) |
| $100,000 to $149,999 | 44 (4.8%) | 32 (3.1%) |
| $150,000 or more | 16 (1.8%) | 26 (2.5%) |
| Total | 910 (100.0%) | 1,036 (100.0%) |
Property Value to Household Income Ratio in Luquillo
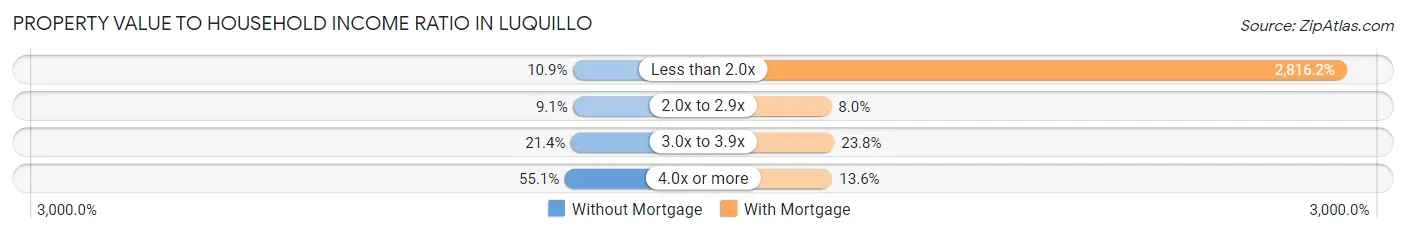
| Value-to-Income Ratio | Without Mortgage | With Mortgage |
| Less than 2.0x | 99 (10.9%) | 29,176 (2,816.2%) |
| 2.0x to 2.9x | 83 (9.1%) | 83 (8.0%) |
| 3.0x to 3.9x | 195 (21.4%) | 246 (23.7%) |
| 4.0x or more | 501 (55.0%) | 141 (13.6%) |
| Total | 910 (100.0%) | 1,036 (100.0%) |
Real Estate Taxes by Mortgage Status in Luquillo
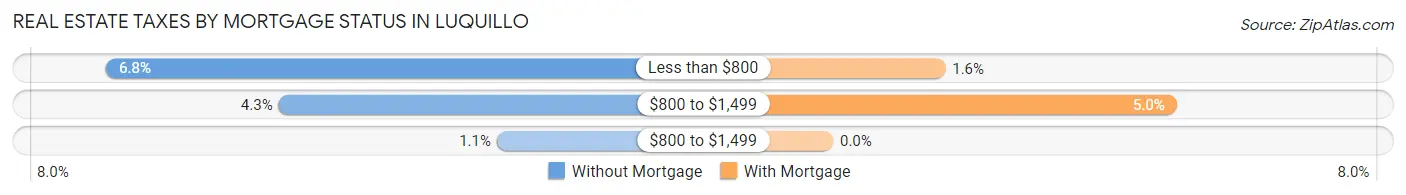
| Property Taxes | Without Mortgage | With Mortgage |
| Less than $800 | 62 (6.8%) | 17 (1.6%) |
| $800 to $1,499 | 39 (4.3%) | 52 (5.0%) |
| $800 to $1,499 | 10 (1.1%) | 0 (0.0%) |
| Total | 910 (100.0%) | 1,036 (100.0%) |
Health & Disability in Luquillo
Health Insurance Coverage by Age in Luquillo
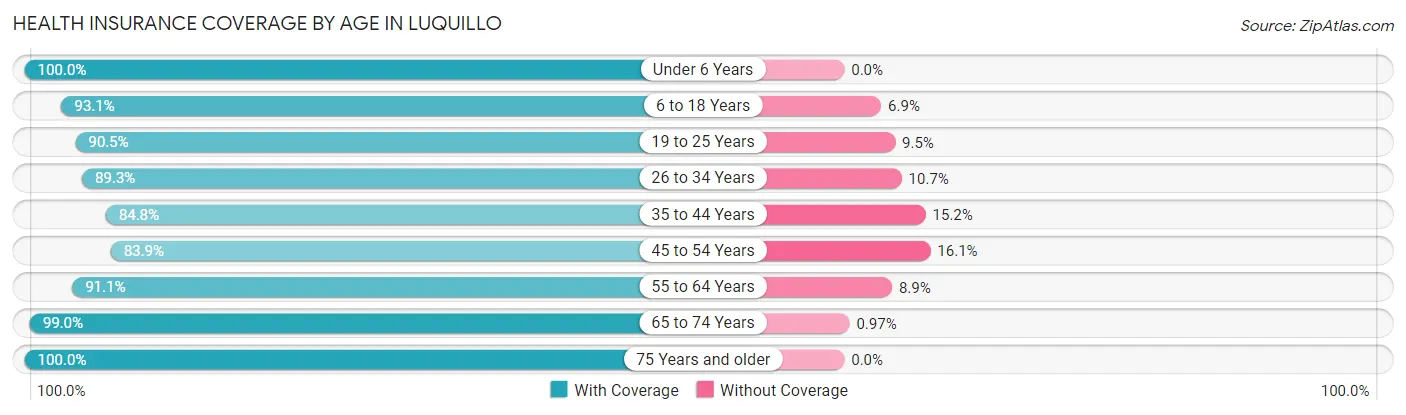
| Age Bracket | With Coverage | Without Coverage |
| Under 6 Years | 475 (100.0%) | 0 (0.0%) |
| 6 to 18 Years | 1,248 (93.1%) | 92 (6.9%) |
| 19 to 25 Years | 860 (90.5%) | 90 (9.5%) |
| 26 to 34 Years | 684 (89.3%) | 82 (10.7%) |
| 35 to 44 Years | 817 (84.8%) | 146 (15.2%) |
| 45 to 54 Years | 779 (83.9%) | 149 (16.1%) |
| 55 to 64 Years | 810 (91.1%) | 79 (8.9%) |
| 65 to 74 Years | 817 (99.0%) | 8 (1.0%) |
| 75 Years and older | 727 (100.0%) | 0 (0.0%) |
| Total | 7,217 (91.8%) | 646 (8.2%) |
Health Insurance Coverage by Citizenship Status in Luquillo
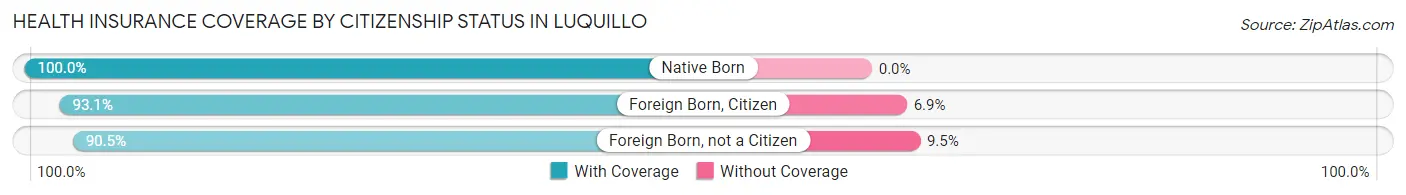
| Citizenship Status | With Coverage | Without Coverage |
| Native Born | 475 (100.0%) | 0 (0.0%) |
| Foreign Born, Citizen | 1,248 (93.1%) | 92 (6.9%) |
| Foreign Born, not a Citizen | 860 (90.5%) | 90 (9.5%) |
Health Insurance Coverage by Household Income in Luquillo
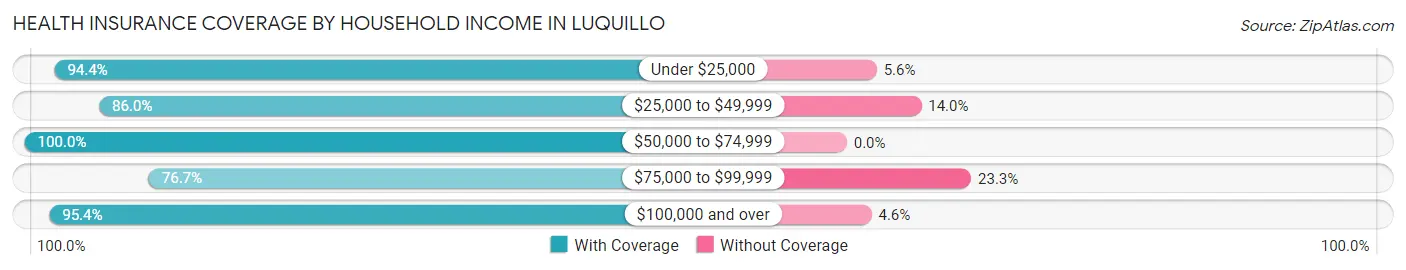
| Household Income | With Coverage | Without Coverage |
| Under $25,000 | 3,710 (94.4%) | 220 (5.6%) |
| $25,000 to $49,999 | 2,323 (86.0%) | 377 (14.0%) |
| $50,000 to $74,999 | 762 (100.0%) | 0 (0.0%) |
| $75,000 to $99,999 | 112 (76.7%) | 34 (23.3%) |
| $100,000 and over | 309 (95.4%) | 15 (4.6%) |
Public vs Private Health Insurance Coverage by Age in Luquillo
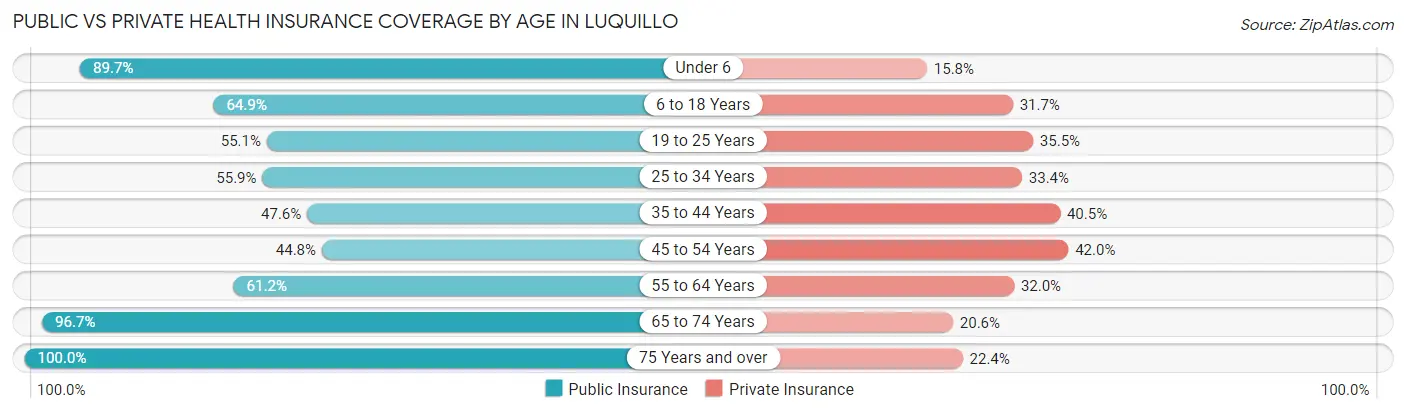
| Age Bracket | Public Insurance | Private Insurance |
| Under 6 | 426 (89.7%) | 75 (15.8%) |
| 6 to 18 Years | 870 (64.9%) | 425 (31.7%) |
| 19 to 25 Years | 523 (55.0%) | 337 (35.5%) |
| 25 to 34 Years | 428 (55.9%) | 256 (33.4%) |
| 35 to 44 Years | 458 (47.6%) | 390 (40.5%) |
| 45 to 54 Years | 416 (44.8%) | 390 (42.0%) |
| 55 to 64 Years | 544 (61.2%) | 284 (32.0%) |
| 65 to 74 Years | 798 (96.7%) | 170 (20.6%) |
| 75 Years and over | 727 (100.0%) | 163 (22.4%) |
| Total | 5,190 (66.0%) | 2,490 (31.7%) |
Disability Status by Sex by Age in Luquillo
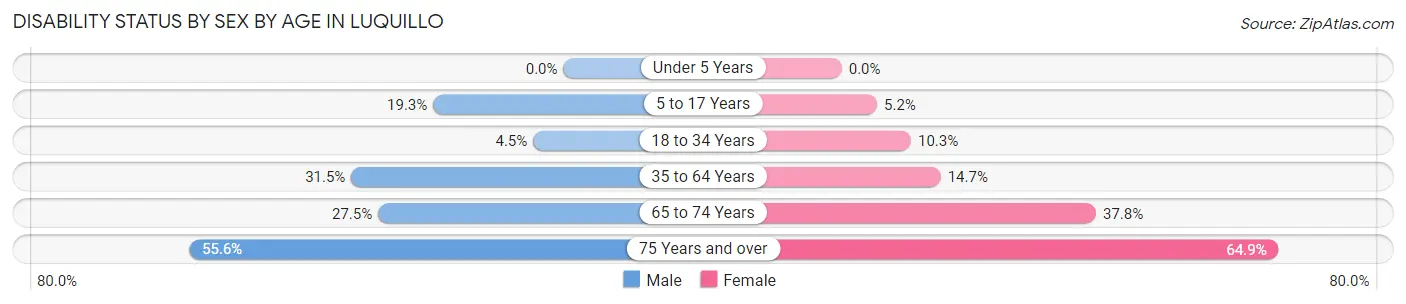
| Age Bracket | Male | Female |
| Under 5 Years | 0 (0.0%) | 0 (0.0%) |
| 5 to 17 Years | 105 (19.3%) | 38 (5.2%) |
| 18 to 34 Years | 30 (4.5%) | 120 (10.3%) |
| 35 to 64 Years | 402 (31.5%) | 221 (14.7%) |
| 65 to 74 Years | 82 (27.5%) | 199 (37.8%) |
| 75 Years and over | 159 (55.6%) | 286 (64.8%) |
Disability Class by Sex by Age in Luquillo
Disability Class: Hearing Difficulty
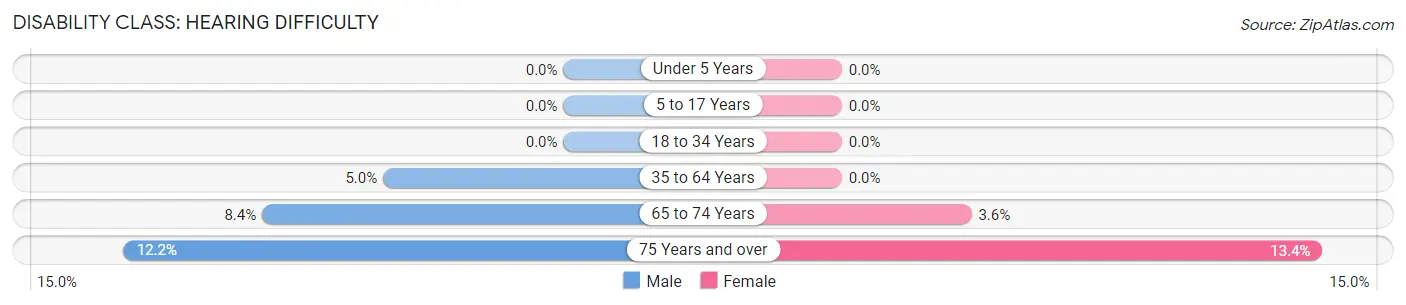
| Age Bracket | Male | Female |
| Under 5 Years | 0 (0.0%) | 0 (0.0%) |
| 5 to 17 Years | 0 (0.0%) | 0 (0.0%) |
| 18 to 34 Years | 0 (0.0%) | 0 (0.0%) |
| 35 to 64 Years | 64 (5.0%) | 0 (0.0%) |
| 65 to 74 Years | 25 (8.4%) | 19 (3.6%) |
| 75 Years and over | 35 (12.2%) | 59 (13.4%) |
Disability Class: Vision Difficulty
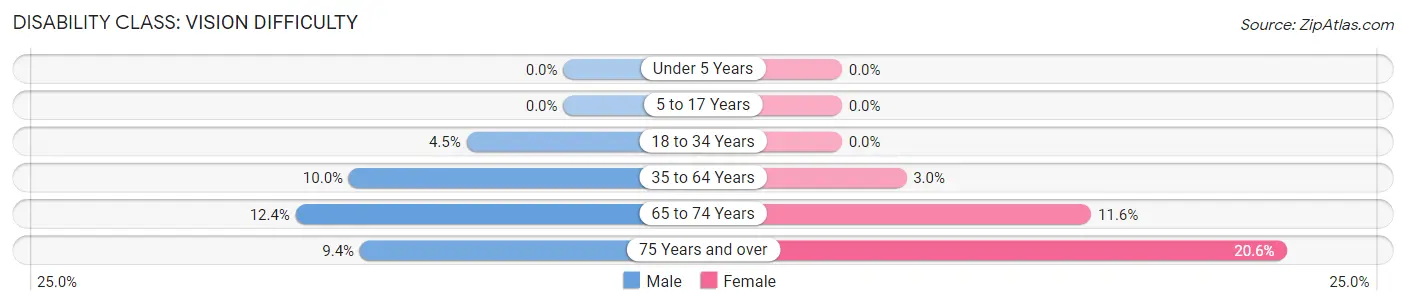
| Age Bracket | Male | Female |
| Under 5 Years | 0 (0.0%) | 0 (0.0%) |
| 5 to 17 Years | 0 (0.0%) | 0 (0.0%) |
| 18 to 34 Years | 30 (4.5%) | 0 (0.0%) |
| 35 to 64 Years | 127 (10.0%) | 45 (3.0%) |
| 65 to 74 Years | 37 (12.4%) | 61 (11.6%) |
| 75 Years and over | 27 (9.4%) | 91 (20.6%) |
Disability Class: Cognitive Difficulty
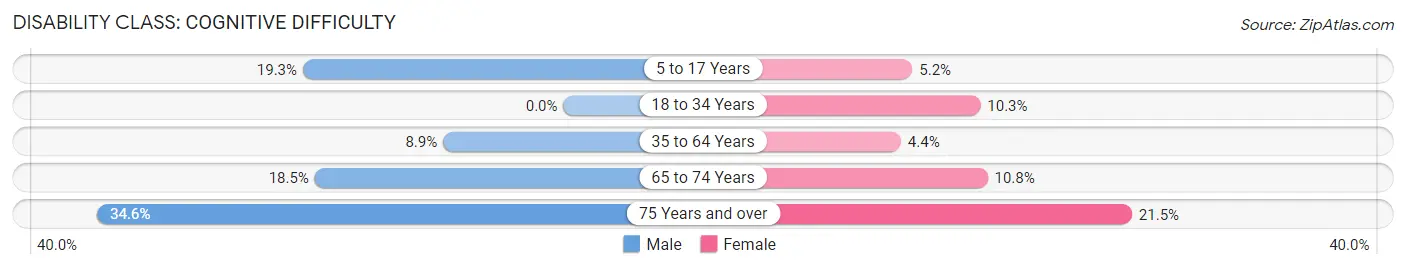
| Age Bracket | Male | Female |
| 5 to 17 Years | 105 (19.3%) | 38 (5.2%) |
| 18 to 34 Years | 0 (0.0%) | 120 (10.3%) |
| 35 to 64 Years | 114 (8.9%) | 66 (4.4%) |
| 65 to 74 Years | 55 (18.5%) | 57 (10.8%) |
| 75 Years and over | 99 (34.6%) | 95 (21.5%) |
Disability Class: Ambulatory Difficulty
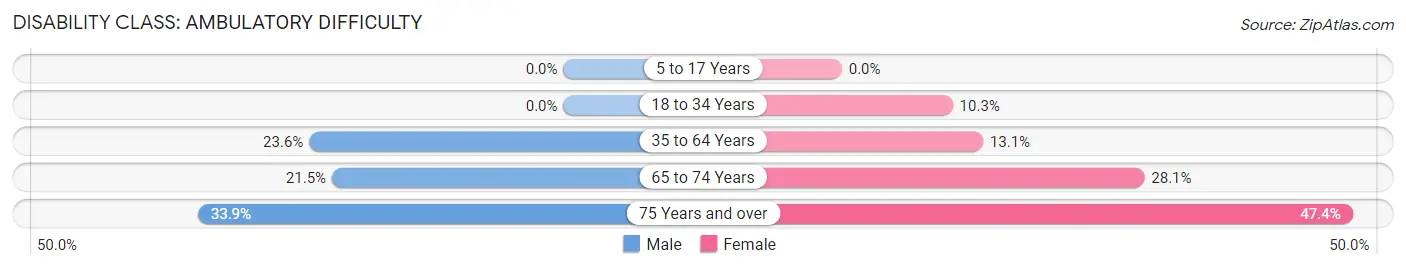
| Age Bracket | Male | Female |
| 5 to 17 Years | 0 (0.0%) | 0 (0.0%) |
| 18 to 34 Years | 0 (0.0%) | 120 (10.3%) |
| 35 to 64 Years | 301 (23.6%) | 197 (13.1%) |
| 65 to 74 Years | 64 (21.5%) | 148 (28.1%) |
| 75 Years and over | 97 (33.9%) | 209 (47.4%) |
Disability Class: Self-Care Difficulty
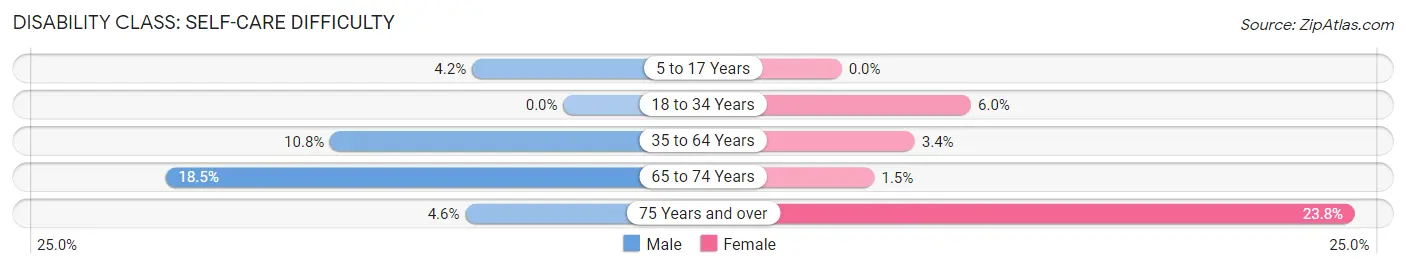
| Age Bracket | Male | Female |
| 5 to 17 Years | 23 (4.2%) | 0 (0.0%) |
| 18 to 34 Years | 0 (0.0%) | 70 (6.0%) |
| 35 to 64 Years | 138 (10.8%) | 51 (3.4%) |
| 65 to 74 Years | 55 (18.5%) | 8 (1.5%) |
| 75 Years and over | 13 (4.5%) | 105 (23.8%) |
Technology Access in Luquillo
Computing Device Access in Luquillo
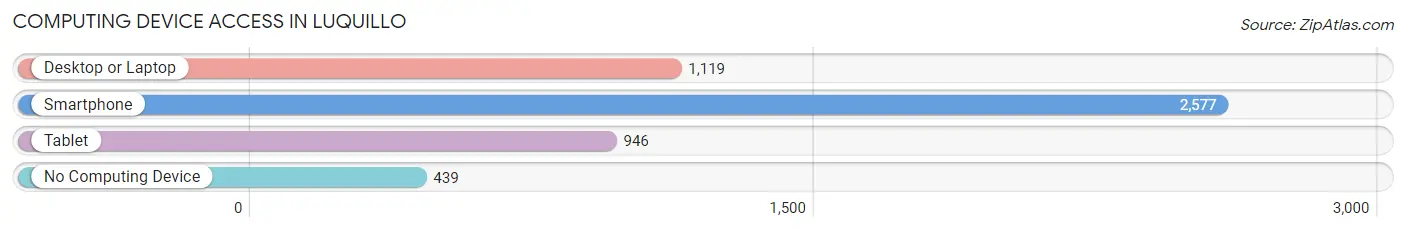
| Device Type | # Households | % Households |
| Desktop or Laptop | 1,119 | 36.3% |
| Smartphone | 2,577 | 83.6% |
| Tablet | 946 | 30.7% |
| No Computing Device | 439 | 14.2% |
| Total | 3,083 | 100.0% |
Internet Access in Luquillo
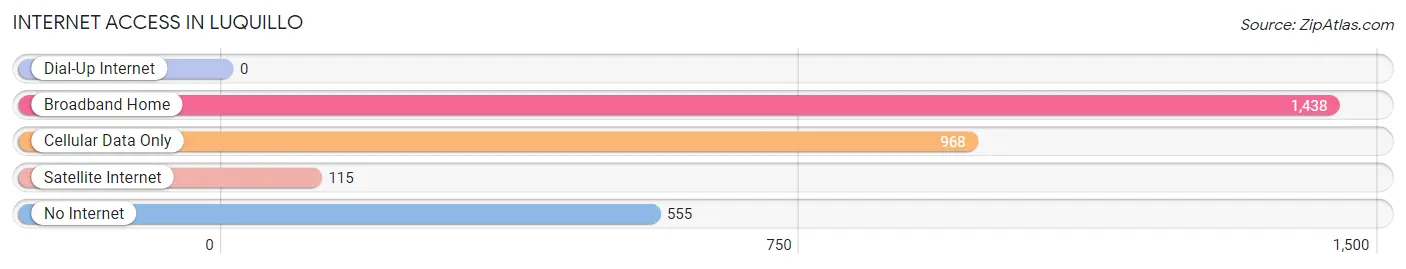
| Internet Type | # Households | % Households |
| Dial-Up Internet | 0 | 0.0% |
| Broadband Home | 1,438 | 46.6% |
| Cellular Data Only | 968 | 31.4% |
| Satellite Internet | 115 | 3.7% |
| No Internet | 555 | 18.0% |
| Total | 3,083 | 100.0% |
Luquillo Summary
Luquillo is a municipality located in the northeast corner of Puerto Rico, bordered by the Atlantic Ocean to the north and the Caribbean Sea to the south. It is part of the Fajardo metropolitan area and is home to approximately 20,000 people. The town is known for its beautiful beaches, lush rainforest, and vibrant culture.
History
The area that is now Luquillo was originally inhabited by the Taíno people, who called the area “Yucayo.” The Taíno were a peaceful people who lived off the land and were known for their agricultural skills. In the early 16th century, the Spanish arrived in the area and began to colonize the island. The Taíno were forced to work in the gold mines and on the sugar plantations, and many died from European diseases.
In 1797, the town of Luquillo was officially founded by Don Francisco de la Cruz. The town was named after the nearby river, which was named after the Taíno word for “river of the sun.” The town quickly grew and became an important port for the export of sugar and other goods.
In the late 19th century, the town was devastated by a hurricane and a plague of locusts. The town was rebuilt and continued to grow, becoming a popular tourist destination in the 20th century.
Geography
Luquillo is located in the northeast corner of Puerto Rico, bordered by the Atlantic Ocean to the north and the Caribbean Sea to the south. The town is situated on a narrow strip of land between the ocean and the El Yunque National Forest. The town is known for its beautiful beaches, lush rainforest, and vibrant culture.
The town is divided into two sections: the urban area and the rural area. The urban area is located on the coast and is home to most of the town’s population. The rural area is located in the mountains and is home to the El Yunque National Forest.
Economy
The economy of Luquillo is largely based on tourism. The town is home to several resorts and hotels, as well as a variety of restaurants and shops. The town is also home to several manufacturing plants, including a pharmaceutical plant and a plastics plant.
The town is also home to a large fishing industry. The town’s fishermen catch a variety of fish, including snapper, grouper, and mahi-mahi. The town also has a thriving agricultural industry, with crops such as bananas, plantains, and coffee being grown in the area.
Demographics
As of the 2010 census, the population of Luquillo was 19,890. The population is largely of Puerto Rican descent, with a small percentage of African and European descent. The town is predominantly Roman Catholic, with a small percentage of other religious affiliations.
The town has a high rate of poverty, with over 40% of the population living below the poverty line. The town also has a high rate of unemployment, with over 20% of the population unemployed.
Conclusion
Luquillo is a vibrant and beautiful town located in the northeast corner of Puerto Rico. The town is known for its beautiful beaches, lush rainforest, and vibrant culture. The town’s economy is largely based on tourism, fishing, and agriculture. The town has a population of 19,890, with a high rate of poverty and unemployment. Despite these challenges, the town remains a popular tourist destination and a great place to live.
Common Questions
What is Per Capita Income in Luquillo?
Per Capita income in Luquillo is $11,824.
What is the Median Family Income in Luquillo?
Median Family Income in Luquillo is $24,041.
What is the Median Household income in Luquillo?
Median Household Income in Luquillo is $21,037.
What is Income or Wage Gap in Luquillo?
Income or Wage Gap in Luquillo is 11.7%.
Women in Luquillo earn 88.3 cents for every dollar earned by a man.
What is Family Income Deficit in Luquillo?
Family Income Deficit in Luquillo is $9,790.
Families that are below poverty line in Luquillo earn $9,790 less on average than the poverty threshold level.
What is Inequality or Gini Index in Luquillo?
Inequality or Gini Index in Luquillo is 0.46.
What is the Total Population of Luquillo?
Total Population of Luquillo is 7,870.
What is the Total Male Population of Luquillo?
Total Male Population of Luquillo is 3,286.
What is the Total Female Population of Luquillo?
Total Female Population of Luquillo is 4,584.
What is the Ratio of Males per 100 Females in Luquillo?
There are 71.68 Males per 100 Females in Luquillo.
What is the Ratio of Females per 100 Males in Luquillo?
There are 139.50 Females per 100 Males in Luquillo.
What is the Median Population Age in Luquillo?
Median Population Age in Luquillo is 39.9 Years.
What is the Average Family Size in Luquillo
Average Family Size in Luquillo is 3.2 People.
What is the Average Household Size in Luquillo
Average Household Size in Luquillo is 2.5 People.
How Large is the Labor Force in Luquillo?
There are 3,080 People in the Labor Forcein in Luquillo.
What is the Percentage of People in the Labor Force in Luquillo?
47.9% of People are in the Labor Force in Luquillo.
What is the Unemployment Rate in Luquillo?
Unemployment Rate in Luquillo is 24.2%.