Luis M Cintron, PR Map & Demographics
Luis M Cintron Overview
$8,848
PER CAPITA INCOME
$18,778
AVG FAMILY INCOME
$19,593
AVG HOUSEHOLD INCOME
10.5%
WAGE / INCOME GAP [ % ]
89.5¢/ $1
WAGE / INCOME GAP [ $ ]
$10,066
FAMILY INCOME DEFICIT
0.41
INEQUALITY / GINI INDEX
1,774
TOTAL POPULATION
805
MALE POPULATION
969
FEMALE POPULATION
83.08
MALES / 100 FEMALES
120.37
FEMALES / 100 MALES
37.6
MEDIAN AGE
3.1
AVG FAMILY SIZE
2.7
AVG HOUSEHOLD SIZE
676
LABOR FORCE [ PEOPLE ]
45.8%
PERCENT IN LABOR FORCE
21.9%
UNEMPLOYMENT RATE
Income in Luis M Cintron
Income Overview in Luis M Cintron
Per Capita Income in Luis M Cintron is $8,848, while median incomes of families and households are $18,778 and $19,593 respectively.
| Characteristic | Number | Measure |
| Per Capita Income | 1,774 | $8,848 |
| Median Family Income | 492 | $18,778 |
| Mean Family Income | 492 | $21,652 |
| Median Household Income | 662 | $19,593 |
| Mean Household Income | 662 | $21,422 |
| Income Deficit | 492 | $10,066 |
| Wage / Income Gap (%) | 1,774 | 10.50% |
| Wage / Income Gap ($) | 1,774 | 89.50¢ per $1 |
| Gini / Inequality Index | 1,774 | 0.41 |
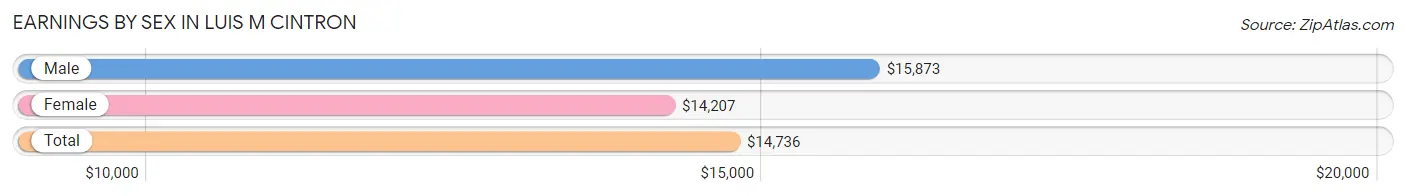
Earnings by Sex in Luis M Cintron
Average Earnings in Luis M Cintron are $14,736, $15,873 for men and $14,207 for women, a difference of 10.5%.
| Sex | Number | Average Earnings |
| Male | 316 (52.1%) | $15,873 |
| Female | 290 (47.8%) | $14,207 |
| Total | 606 (100.0%) | $14,736 |
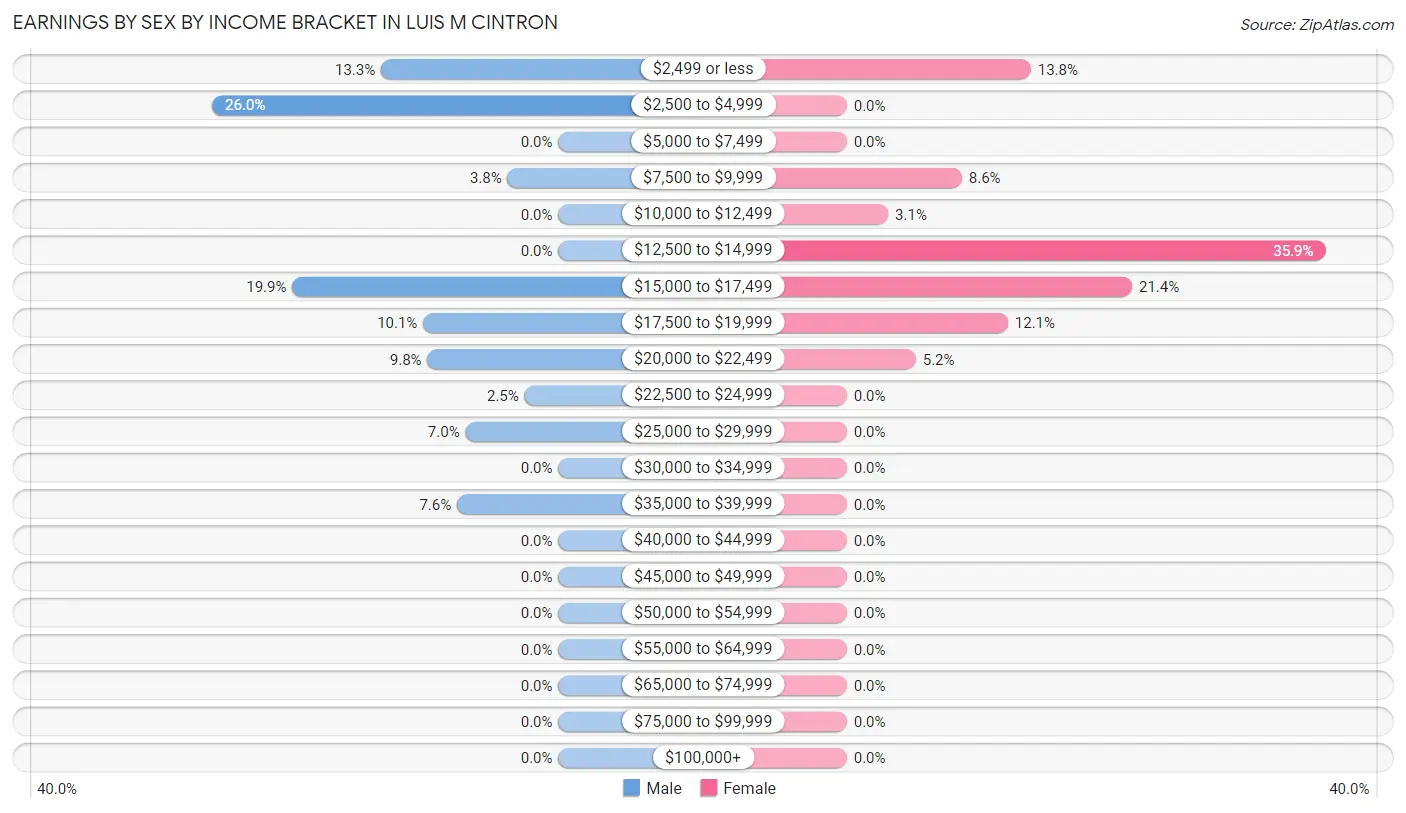
Earnings by Sex by Income Bracket in Luis M Cintron
The most common earnings brackets in Luis M Cintron are $2,500 to $4,999 for men (82 | 26.0%) and $12,500 to $14,999 for women (104 | 35.9%).
| Income | Male | Female |
| $2,499 or less | 42 (13.3%) | 40 (13.8%) |
| $2,500 to $4,999 | 82 (26.0%) | 0 (0.0%) |
| $5,000 to $7,499 | 0 (0.0%) | 0 (0.0%) |
| $7,500 to $9,999 | 12 (3.8%) | 25 (8.6%) |
| $10,000 to $12,499 | 0 (0.0%) | 9 (3.1%) |
| $12,500 to $14,999 | 0 (0.0%) | 104 (35.9%) |
| $15,000 to $17,499 | 63 (19.9%) | 62 (21.4%) |
| $17,500 to $19,999 | 32 (10.1%) | 35 (12.1%) |
| $20,000 to $22,499 | 31 (9.8%) | 15 (5.2%) |
| $22,500 to $24,999 | 8 (2.5%) | 0 (0.0%) |
| $25,000 to $29,999 | 22 (7.0%) | 0 (0.0%) |
| $30,000 to $34,999 | 0 (0.0%) | 0 (0.0%) |
| $35,000 to $39,999 | 24 (7.6%) | 0 (0.0%) |
| $40,000 to $44,999 | 0 (0.0%) | 0 (0.0%) |
| $45,000 to $49,999 | 0 (0.0%) | 0 (0.0%) |
| $50,000 to $54,999 | 0 (0.0%) | 0 (0.0%) |
| $55,000 to $64,999 | 0 (0.0%) | 0 (0.0%) |
| $65,000 to $74,999 | 0 (0.0%) | 0 (0.0%) |
| $75,000 to $99,999 | 0 (0.0%) | 0 (0.0%) |
| $100,000+ | 0 (0.0%) | 0 (0.0%) |
| Total | 316 (100.0%) | 290 (100.0%) |
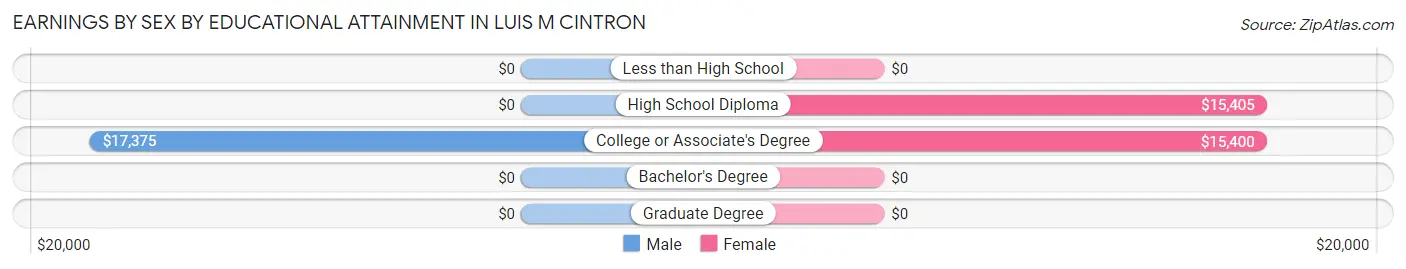
Earnings by Sex by Educational Attainment in Luis M Cintron
Average earnings in Luis M Cintron are $16,308 for men and $14,659 for women, a difference of 10.1%. Men with an educational attainment of college or associate's degree enjoy the highest average annual earnings of $17,375, while those with college or associate's degree education earn the least with $17,375. Women with an educational attainment of high school diploma earn the most with the average annual earnings of $15,405, while those with college or associate's degree education have the smallest earnings of $15,400.
| Educational Attainment | Male Income | Female Income |
| Less than High School | - | - |
| High School Diploma | - | - |
| College or Associate's Degree | $17,375 | $15,400 |
| Bachelor's Degree | - | - |
| Graduate Degree | - | - |
| Total | $16,308 | $14,659 |
Family Income in Luis M Cintron
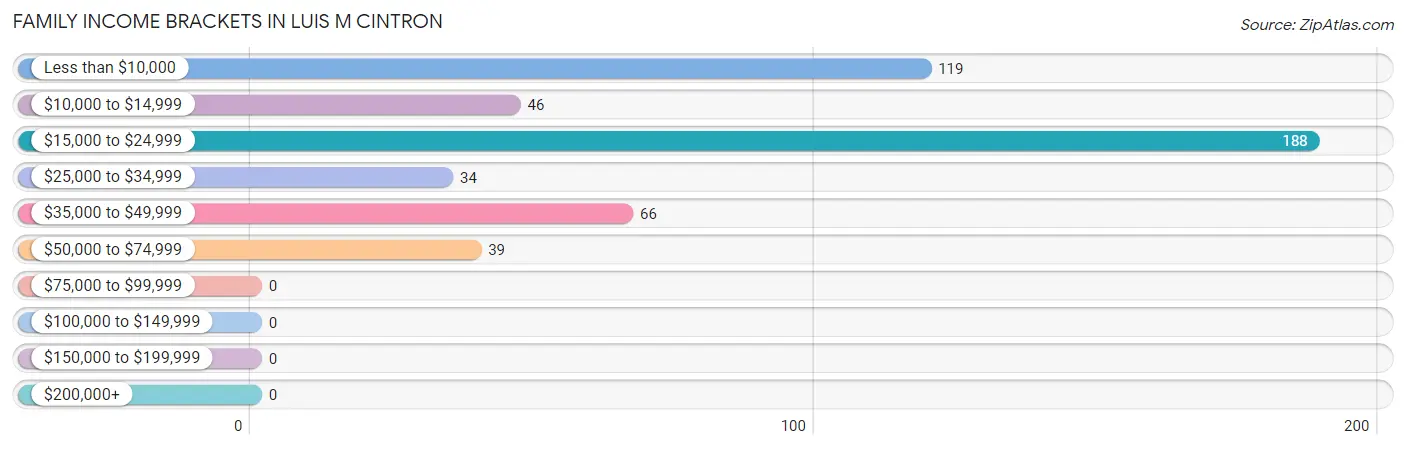
Family Income Brackets in Luis M Cintron
According to the Luis M Cintron family income data, there are 188 families falling into the $15,000 to $24,999 income range, which is the most common income bracket and makes up 38.2% of all families.
| Income Bracket | # Families | % Families |
| Less than $10,000 | 119 | 24.2% |
| $10,000 to $14,999 | 46 | 9.3% |
| $15,000 to $24,999 | 188 | 38.2% |
| $25,000 to $34,999 | 34 | 6.9% |
| $35,000 to $49,999 | 66 | 13.4% |
| $50,000 to $74,999 | 39 | 7.9% |
| $75,000 to $99,999 | 0 | 0.0% |
| $100,000 to $149,999 | 0 | 0.0% |
| $150,000 to $199,999 | 0 | 0.0% |
| $200,000+ | 0 | 0.0% |
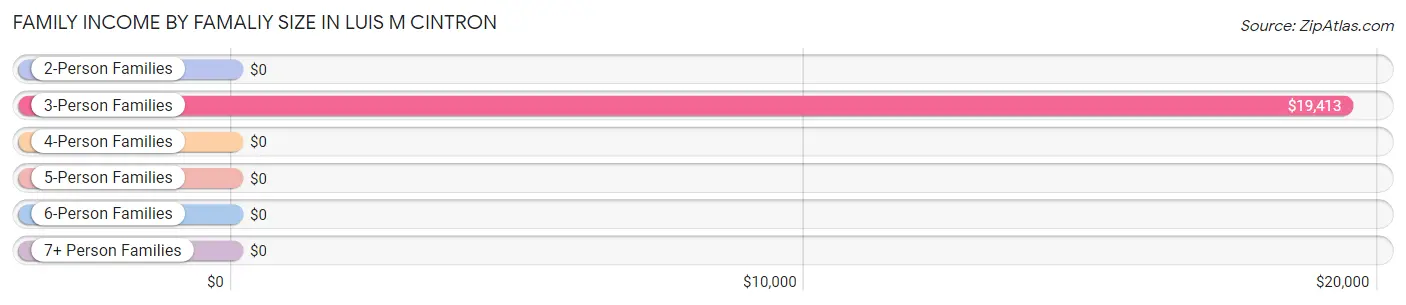
Family Income by Famaliy Size in Luis M Cintron
3-person families (203 | 41.3%) account for the highest median family income in Luis M Cintron with $19,413 per family, while 3-person families (203 | 41.3%) have the highest median income of $6,471 per family member.
| Income Bracket | # Families | Median Income |
| 2-Person Families | 216 (43.9%) | $0 |
| 3-Person Families | 203 (41.3%) | $19,413 |
| 4-Person Families | 43 (8.7%) | $0 |
| 5-Person Families | 30 (6.1%) | $0 |
| 6-Person Families | 0 (0.0%) | $0 |
| 7+ Person Families | 0 (0.0%) | $0 |
| Total | 492 (100.0%) | $18,778 |
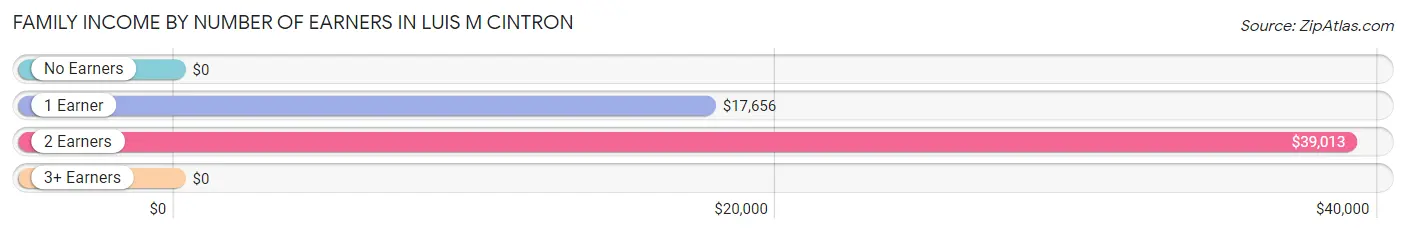
Family Income by Number of Earners in Luis M Cintron
| Number of Earners | # Families | Median Income |
| No Earners | 155 (31.5%) | $0 |
| 1 Earner | 258 (52.4%) | $17,656 |
| 2 Earners | 79 (16.1%) | $39,013 |
| 3+ Earners | 0 (0.0%) | $0 |
| Total | 492 (100.0%) | $18,778 |
Household Income in Luis M Cintron
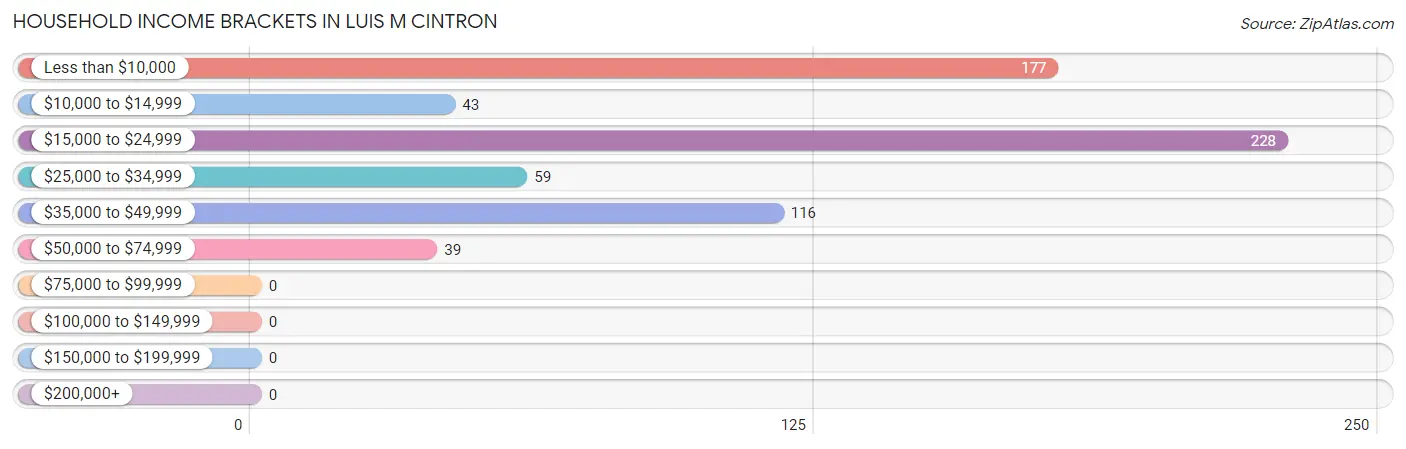
Household Income Brackets in Luis M Cintron
With 228 households falling in the category, the $15,000 to $24,999 income range is the most frequent in Luis M Cintron, accounting for 34.4% of all households.
| Income Bracket | # Households | % Households |
| Less than $10,000 | 177 | 26.7% |
| $10,000 to $14,999 | 43 | 6.5% |
| $15,000 to $24,999 | 228 | 34.4% |
| $25,000 to $34,999 | 59 | 8.9% |
| $35,000 to $49,999 | 116 | 17.5% |
| $50,000 to $74,999 | 39 | 5.9% |
| $75,000 to $99,999 | 0 | 0.0% |
| $100,000 to $149,999 | 0 | 0.0% |
| $150,000 to $199,999 | 0 | 0.0% |
| $200,000+ | 0 | 0.0% |
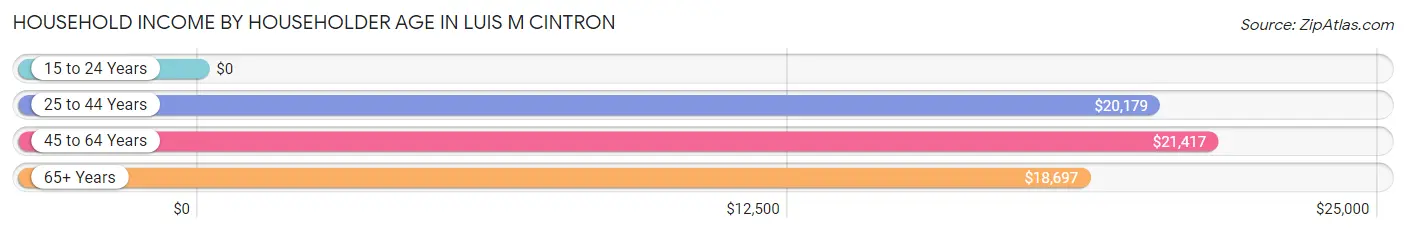
Household Income by Householder Age in Luis M Cintron
The median household income in Luis M Cintron is $19,593, with the highest median household income of $21,417 found in the 45 to 64 years age bracket for the primary householder. A total of 263 households (39.7%) fall into this category.
| Income Bracket | # Households | Median Income |
| 15 to 24 Years | 0 (0.0%) | $0 |
| 25 to 44 Years | 148 (22.4%) | $20,179 |
| 45 to 64 Years | 263 (39.7%) | $21,417 |
| 65+ Years | 251 (37.9%) | $18,697 |
| Total | 662 (100.0%) | $19,593 |
Poverty in Luis M Cintron
Income Below Poverty by Sex and Age in Luis M Cintron
With 63.2% poverty level for males and 64.6% for females among the residents of Luis M Cintron, 16 and 17 year old males and 6 to 11 year old females are the most vulnerable to poverty, with 11 males (100.0%) and 65 females (100.0%) in their respective age groups living below the poverty level.
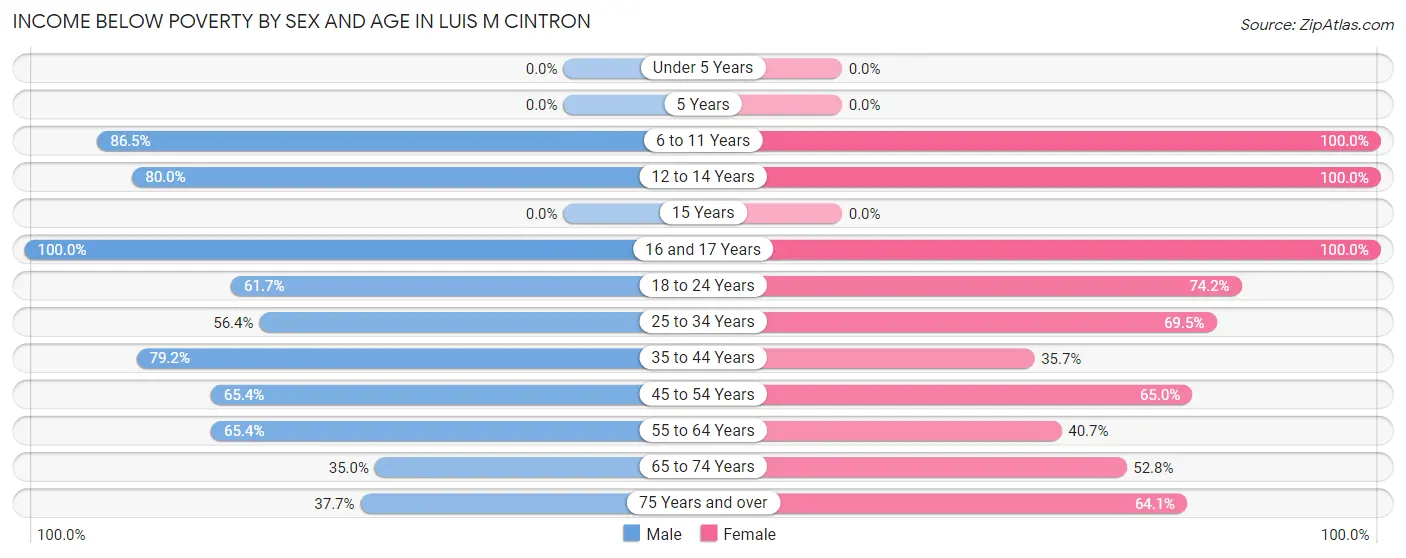
| Age Bracket | Male | Female |
| Under 5 Years | 0 (0.0%) | 0 (0.0%) |
| 5 Years | 0 (0.0%) | 0 (0.0%) |
| 6 to 11 Years | 64 (86.5%) | 65 (100.0%) |
| 12 to 14 Years | 48 (80.0%) | 67 (100.0%) |
| 15 Years | 0 (0.0%) | 0 (0.0%) |
| 16 and 17 Years | 11 (100.0%) | 17 (100.0%) |
| 18 to 24 Years | 66 (61.7%) | 112 (74.2%) |
| 25 to 34 Years | 57 (56.4%) | 82 (69.5%) |
| 35 to 44 Years | 61 (79.2%) | 40 (35.7%) |
| 45 to 54 Years | 87 (65.4%) | 106 (65.0%) |
| 55 to 64 Years | 68 (65.4%) | 11 (40.7%) |
| 65 to 74 Years | 21 (35.0%) | 85 (52.8%) |
| 75 Years and over | 26 (37.7%) | 41 (64.1%) |
| Total | 509 (63.2%) | 626 (64.6%) |
Income Above Poverty by Sex and Age in Luis M Cintron
According to the poverty statistics in Luis M Cintron, males aged 15 years and females aged 15 years are the age groups that are most secure financially, with 100.0% of males and 100.0% of females in these age groups living above the poverty line.
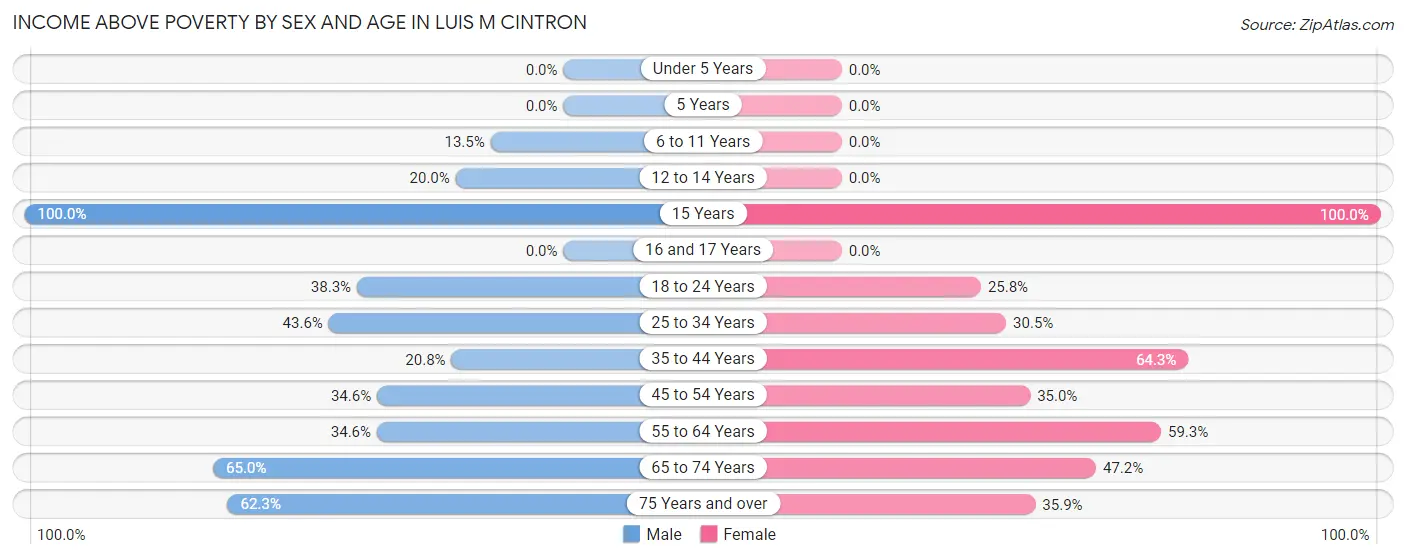
| Age Bracket | Male | Female |
| Under 5 Years | 0 (0.0%) | 0 (0.0%) |
| 5 Years | 0 (0.0%) | 0 (0.0%) |
| 6 to 11 Years | 10 (13.5%) | 0 (0.0%) |
| 12 to 14 Years | 12 (20.0%) | 0 (0.0%) |
| 15 Years | 9 (100.0%) | 24 (100.0%) |
| 16 and 17 Years | 0 (0.0%) | 0 (0.0%) |
| 18 to 24 Years | 41 (38.3%) | 39 (25.8%) |
| 25 to 34 Years | 44 (43.6%) | 36 (30.5%) |
| 35 to 44 Years | 16 (20.8%) | 72 (64.3%) |
| 45 to 54 Years | 46 (34.6%) | 57 (35.0%) |
| 55 to 64 Years | 36 (34.6%) | 16 (59.3%) |
| 65 to 74 Years | 39 (65.0%) | 76 (47.2%) |
| 75 Years and over | 43 (62.3%) | 23 (35.9%) |
| Total | 296 (36.8%) | 343 (35.4%) |
Income Below Poverty Among Married-Couple Families in Luis M Cintron
The poverty statistics for married-couple families in Luis M Cintron show that 61.8% or 131 of the total 212 families live below the poverty line. Families with 3 or 4 children have the highest poverty rate of 100.0%, comprising of 17 families. On the other hand, families with no children have the lowest poverty rate of 58.1%, which includes 101 families.
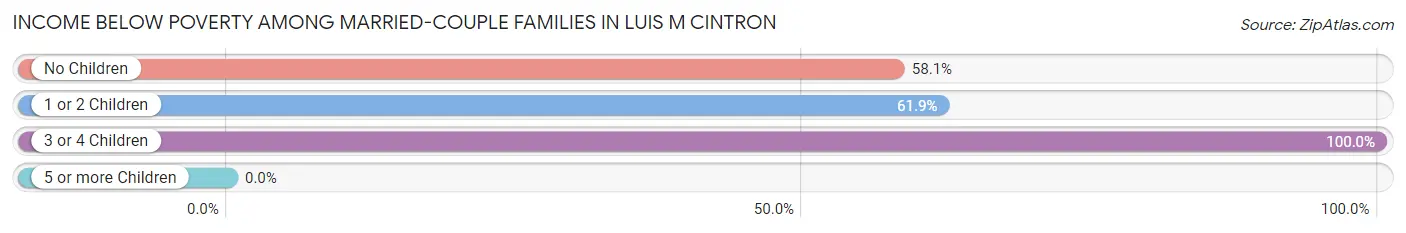
| Children | Above Poverty | Below Poverty |
| No Children | 73 (41.9%) | 101 (58.1%) |
| 1 or 2 Children | 8 (38.1%) | 13 (61.9%) |
| 3 or 4 Children | 0 (0.0%) | 17 (100.0%) |
| 5 or more Children | 0 (0.0%) | 0 (0.0%) |
| Total | 81 (38.2%) | 131 (61.8%) |
Income Below Poverty Among Single-Parent Households in Luis M Cintron
According to the poverty data in Luis M Cintron, 100.0% or 55 single-father households and 59.1% or 133 single-mother households are living below the poverty line. Among single-father households, those with 1 or 2 children have the highest poverty rate, with 55 households (100.0%) experiencing poverty. Likewise, among single-mother households, those with 1 or 2 children have the highest poverty rate, with 48 households (68.6%) falling below the poverty line.
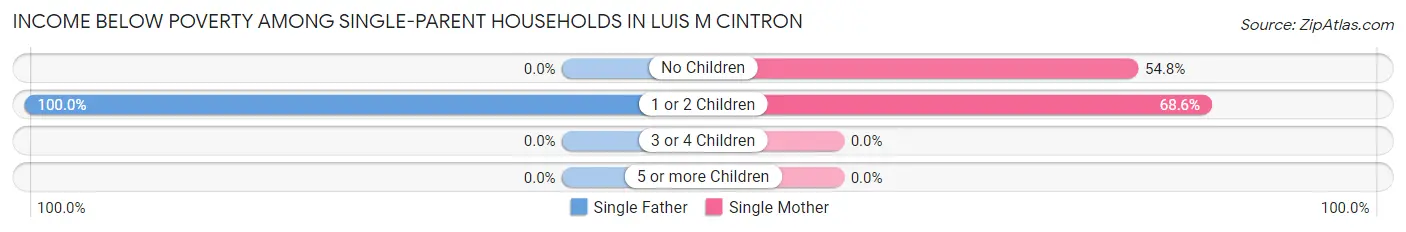
| Children | Single Father | Single Mother |
| No Children | 0 (0.0%) | 85 (54.8%) |
| 1 or 2 Children | 55 (100.0%) | 48 (68.6%) |
| 3 or 4 Children | 0 (0.0%) | 0 (0.0%) |
| 5 or more Children | 0 (0.0%) | 0 (0.0%) |
| Total | 55 (100.0%) | 133 (59.1%) |
Income Below Poverty Among Married-Couple vs Single-Parent Households in Luis M Cintron
The poverty data for Luis M Cintron shows that 131 of the married-couple family households (61.8%) and 188 of the single-parent households (67.1%) are living below the poverty level. Within the married-couple family households, those with 3 or 4 children have the highest poverty rate, with 17 households (100.0%) falling below the poverty line. Among the single-parent households, those with 1 or 2 children have the highest poverty rate, with 103 household (82.4%) living below poverty.
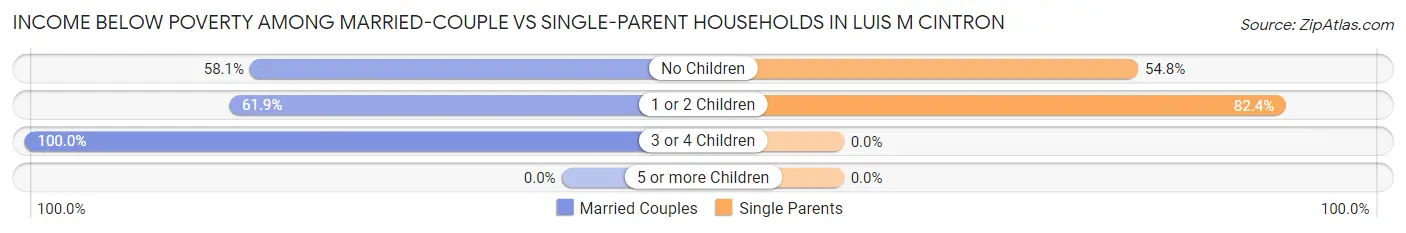
| Children | Married-Couple Families | Single-Parent Households |
| No Children | 101 (58.1%) | 85 (54.8%) |
| 1 or 2 Children | 13 (61.9%) | 103 (82.4%) |
| 3 or 4 Children | 17 (100.0%) | 0 (0.0%) |
| 5 or more Children | 0 (0.0%) | 0 (0.0%) |
| Total | 131 (61.8%) | 188 (67.1%) |
Race in Luis M Cintron
The most populous races in Luis M Cintron are Hispanic or Latino (1,774 | 100.0%), Some other Race (935 | 52.7%), and Two or more Races (568 | 32.0%).
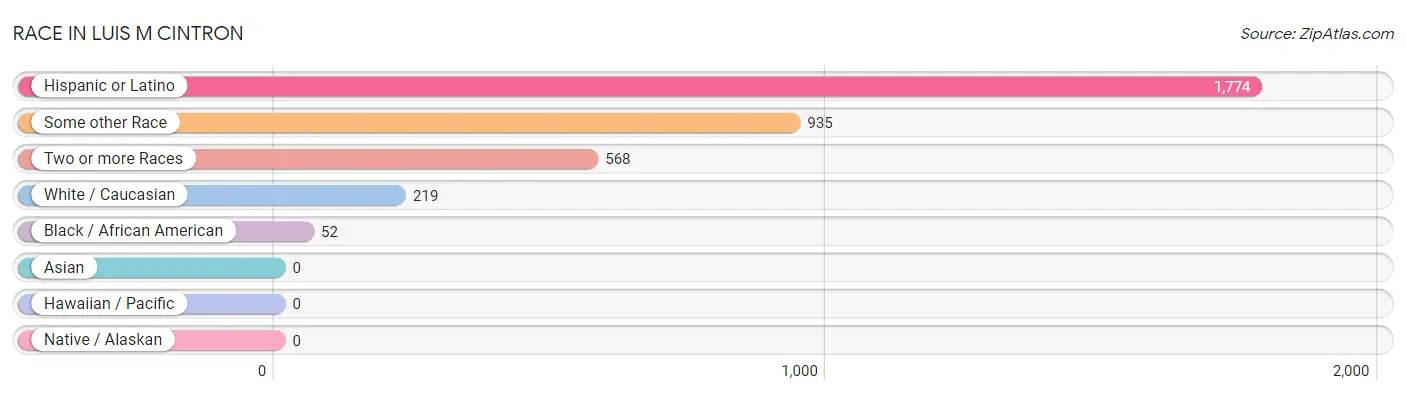
| Race | # Population | % Population |
| Asian | 0 | 0.0% |
| Black / African American | 52 | 2.9% |
| Hawaiian / Pacific | 0 | 0.0% |
| Hispanic or Latino | 1,774 | 100.0% |
| Native / Alaskan | 0 | 0.0% |
| White / Caucasian | 219 | 12.3% |
| Two or more Races | 568 | 32.0% |
| Some other Race | 935 | 52.7% |
| Total | 1,774 | 100.0% |
Ancestry in Luis M Cintron
The most populous ancestries reported in Luis M Cintron are Puerto Rican (1,732 | 97.6%), Colombian (29 | 1.6%), South American (29 | 1.6%), Central American (13 | 0.7%), and Salvadoran (13 | 0.7%), together accounting for 102.4% of all Luis M Cintron residents.
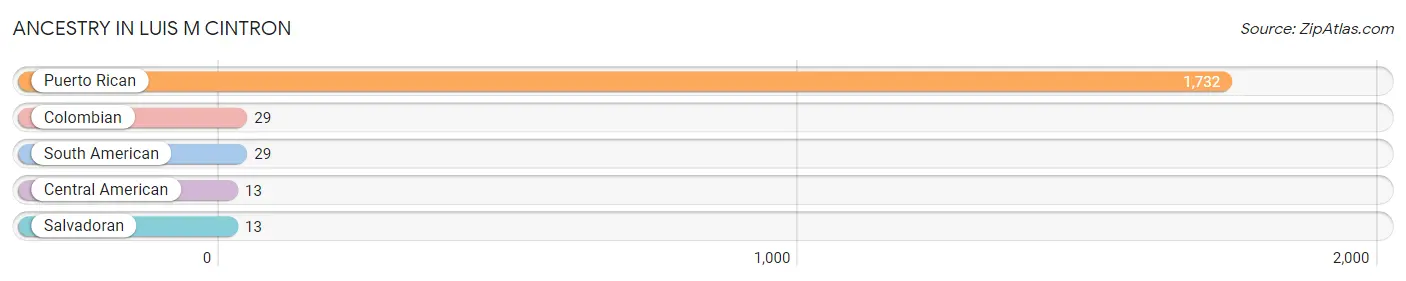
| Ancestry | # Population | % Population |
| Central American | 13 | 0.7% |
| Colombian | 29 | 1.6% |
| Puerto Rican | 1,732 | 97.6% |
| Salvadoran | 13 | 0.7% |
| South American | 29 | 1.6% | View All 5 Rows |
Immigrants in Luis M Cintron

| Immigration Origin | # Population | % Population | View All 0 Rows |
Sex and Age in Luis M Cintron
Sex and Age in Luis M Cintron
The most populous age groups in Luis M Cintron are 45 to 49 Years (120 | 14.9%) for men and 10 to 14 Years (110 | 11.4%) for women.
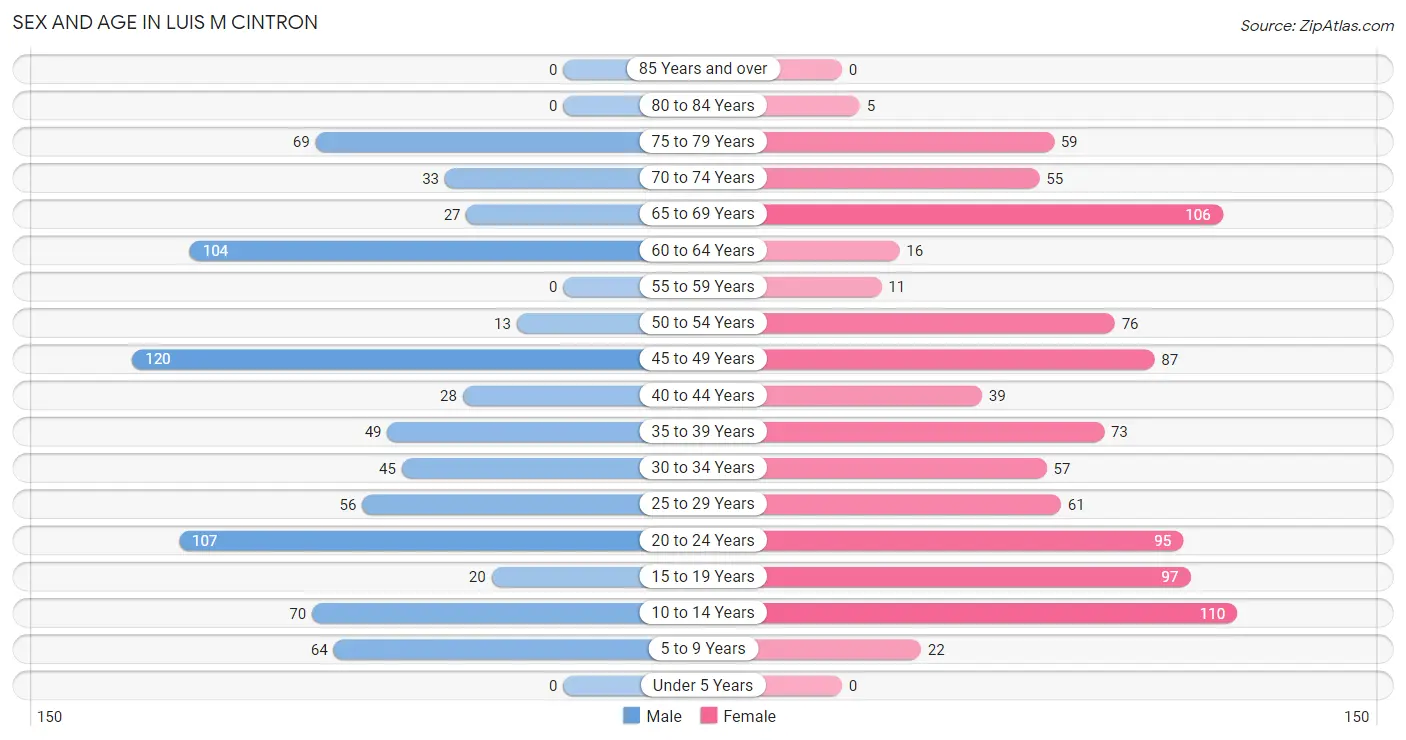
| Age Bracket | Male | Female |
| Under 5 Years | 0 (0.0%) | 0 (0.0%) |
| 5 to 9 Years | 64 (8.0%) | 22 (2.3%) |
| 10 to 14 Years | 70 (8.7%) | 110 (11.4%) |
| 15 to 19 Years | 20 (2.5%) | 97 (10.0%) |
| 20 to 24 Years | 107 (13.3%) | 95 (9.8%) |
| 25 to 29 Years | 56 (7.0%) | 61 (6.3%) |
| 30 to 34 Years | 45 (5.6%) | 57 (5.9%) |
| 35 to 39 Years | 49 (6.1%) | 73 (7.5%) |
| 40 to 44 Years | 28 (3.5%) | 39 (4.0%) |
| 45 to 49 Years | 120 (14.9%) | 87 (9.0%) |
| 50 to 54 Years | 13 (1.6%) | 76 (7.8%) |
| 55 to 59 Years | 0 (0.0%) | 11 (1.1%) |
| 60 to 64 Years | 104 (12.9%) | 16 (1.7%) |
| 65 to 69 Years | 27 (3.4%) | 106 (10.9%) |
| 70 to 74 Years | 33 (4.1%) | 55 (5.7%) |
| 75 to 79 Years | 69 (8.6%) | 59 (6.1%) |
| 80 to 84 Years | 0 (0.0%) | 5 (0.5%) |
| 85 Years and over | 0 (0.0%) | 0 (0.0%) |
| Total | 805 (100.0%) | 969 (100.0%) |
Families and Households in Luis M Cintron
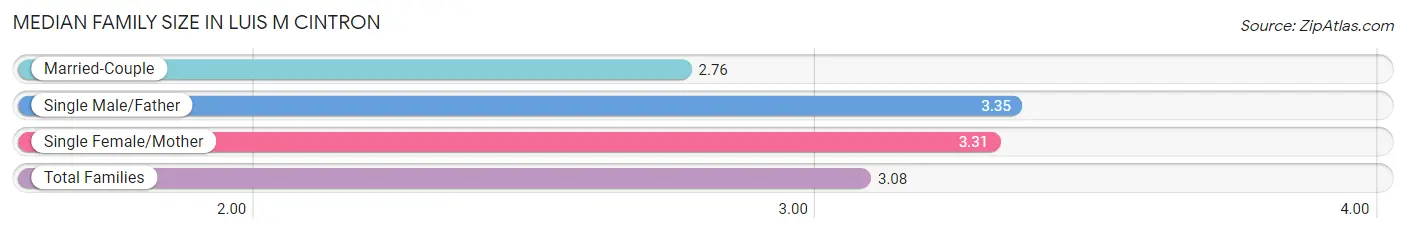
Median Family Size in Luis M Cintron
The median family size in Luis M Cintron is 3.08 persons per family, with single male/father families (55 | 11.2%) accounting for the largest median family size of 3.35 persons per family. On the other hand, married-couple families (212 | 43.1%) represent the smallest median family size with 2.76 persons per family.
| Family Type | # Families | Family Size |
| Married-Couple | 212 (43.1%) | 2.76 |
| Single Male/Father | 55 (11.2%) | 3.35 |
| Single Female/Mother | 225 (45.7%) | 3.31 |
| Total Families | 492 (100.0%) | 3.08 |
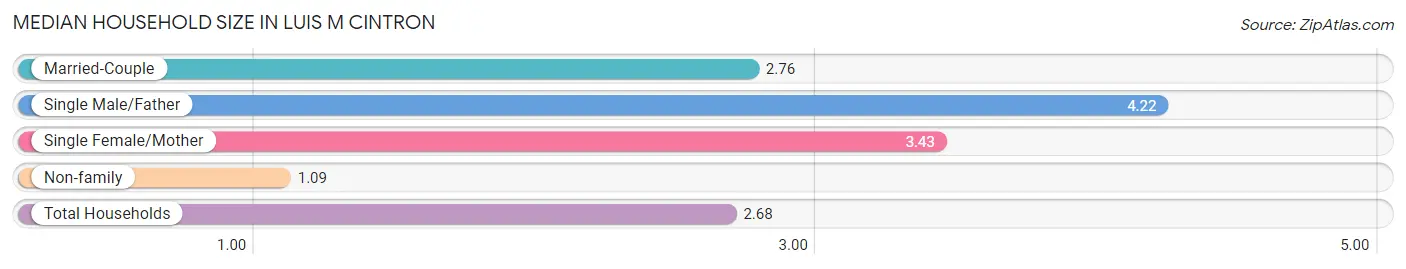
Median Household Size in Luis M Cintron
The median household size in Luis M Cintron is 2.68 persons per household, with single male/father households (55 | 8.3%) accounting for the largest median household size of 4.22 persons per household. non-family households (170 | 25.7%) represent the smallest median household size with 1.09 persons per household.
| Household Type | # Households | Household Size |
| Married-Couple | 212 (32.0%) | 2.76 |
| Single Male/Father | 55 (8.3%) | 4.22 |
| Single Female/Mother | 225 (34.0%) | 3.43 |
| Non-family | 170 (25.7%) | 1.09 |
| Total Households | 662 (100.0%) | 2.68 |
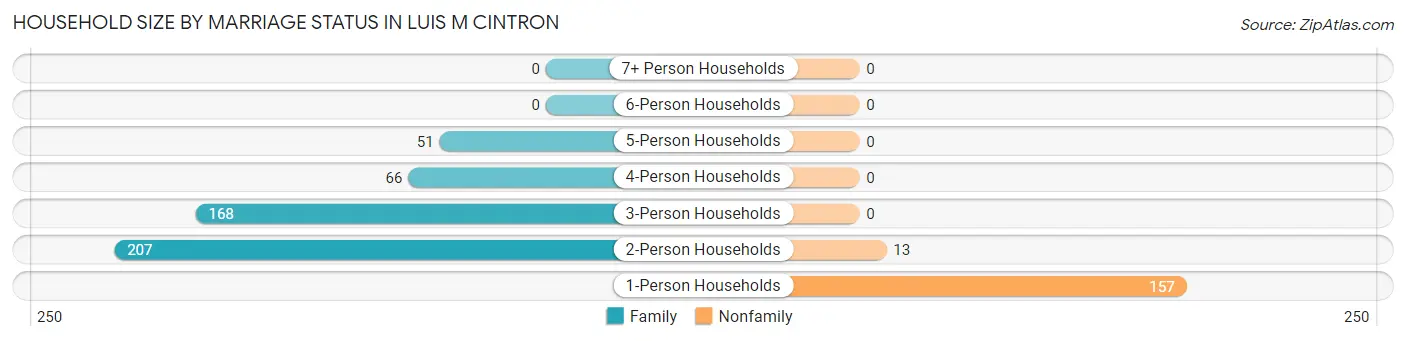
Household Size by Marriage Status in Luis M Cintron
Out of a total of 662 households in Luis M Cintron, 492 (74.3%) are family households, while 170 (25.7%) are nonfamily households. The most numerous type of family households are 2-person households, comprising 207, and the most common type of nonfamily households are 1-person households, comprising 157.
| Household Size | Family Households | Nonfamily Households |
| 1-Person Households | - | 157 (23.7%) |
| 2-Person Households | 207 (31.3%) | 13 (2.0%) |
| 3-Person Households | 168 (25.4%) | 0 (0.0%) |
| 4-Person Households | 66 (10.0%) | 0 (0.0%) |
| 5-Person Households | 51 (7.7%) | 0 (0.0%) |
| 6-Person Households | 0 (0.0%) | 0 (0.0%) |
| 7+ Person Households | 0 (0.0%) | 0 (0.0%) |
| Total | 492 (74.3%) | 170 (25.7%) |
Female Fertility in Luis M Cintron
Fertility by Age in Luis M Cintron
| Age Bracket | Women with Births | Births / 1,000 Women |
| 15 to 19 years | 0 (0.0%) | 0.0 |
| 20 to 34 years | 0 (0.0%) | 0.0 |
| 35 to 50 years | 0 (0.0%) | 0.0 |
| Total | 0 (0.0%) | 0.0 |
Fertility by Age by Marriage Status in Luis M Cintron
| Age Bracket | Married | Unmarried |
| 15 to 19 years | 0 (0.0%) | 0 (0.0%) |
| 20 to 34 years | 0 (0.0%) | 0 (0.0%) |
| 35 to 50 years | 0 (0.0%) | 0 (0.0%) |
| Total | 0 (0.0%) | 0 (0.0%) |
Fertility by Education in Luis M Cintron
| Educational Attainment | Women with Births | Births / 1,000 Women |
| Less than High School | 0 (0.0%) | 0.0 |
| High School Diploma | 0 (0.0%) | 0.0 |
| College or Associate's Degree | 0 (0.0%) | 0.0 |
| Bachelor's Degree | 0 (0.0%) | 0.0 |
| Graduate Degree | 0 (0.0%) | 0.0 |
| Total | 0 (0.0%) | 0.0 |
Fertility by Education by Marriage Status in Luis M Cintron
| Educational Attainment | Married | Unmarried |
| Less than High School | 0 (0.0%) | 0 (0.0%) |
| High School Diploma | 0 (0.0%) | 0 (0.0%) |
| College or Associate's Degree | 0 (0.0%) | 0 (0.0%) |
| Bachelor's Degree | 0 (0.0%) | 0 (0.0%) |
| Graduate Degree | 0 (0.0%) | 0 (0.0%) |
| Total | 0 (0.0%) | 0 (0.0%) |
Employment Characteristics in Luis M Cintron
Employment by Class of Employer in Luis M Cintron
Among the 527 employed individuals in Luis M Cintron, private company employees (349 | 66.2%), self-employed (not incorporated) (88 | 16.7%), and state government employees (46 | 8.7%) make up the most common classes of employment.
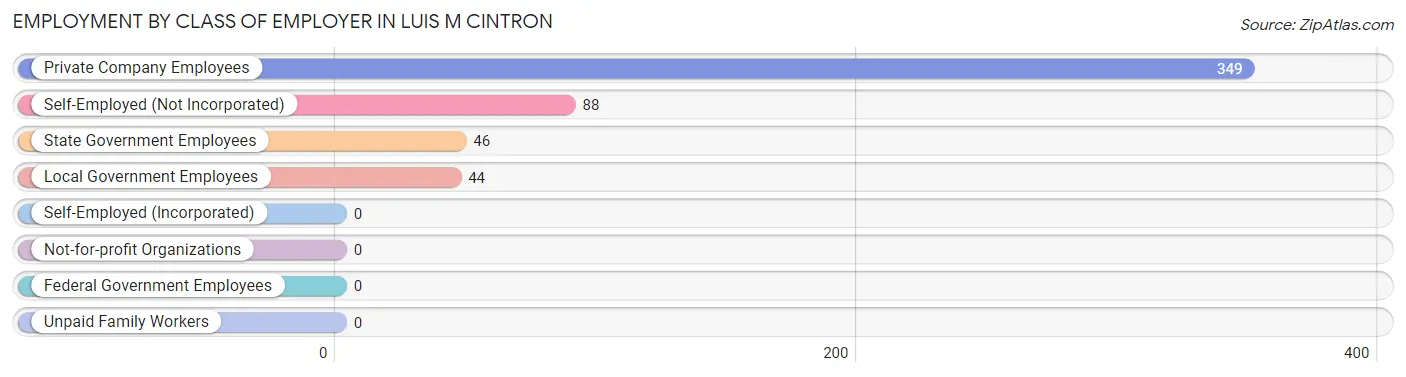
| Employer Class | # Employees | % Employees |
| Private Company Employees | 349 | 66.2% |
| Self-Employed (Incorporated) | 0 | 0.0% |
| Self-Employed (Not Incorporated) | 88 | 16.7% |
| Not-for-profit Organizations | 0 | 0.0% |
| Local Government Employees | 44 | 8.4% |
| State Government Employees | 46 | 8.7% |
| Federal Government Employees | 0 | 0.0% |
| Unpaid Family Workers | 0 | 0.0% |
| Total | 527 | 100.0% |
Employment Status by Age in Luis M Cintron
According to the labor force statistics for Luis M Cintron, out of the total population over 16 years of age (1,475), 45.8% or 676 individuals are in the labor force, with 21.9% or 148 of them unemployed. The age group with the highest labor force participation rate is 25 to 29 years, with 91.5% or 107 individuals in the labor force. Within the labor force, the 30 to 34 years age range has the highest percentage of unemployed individuals, with 71.7% or 33 of them being unemployed.
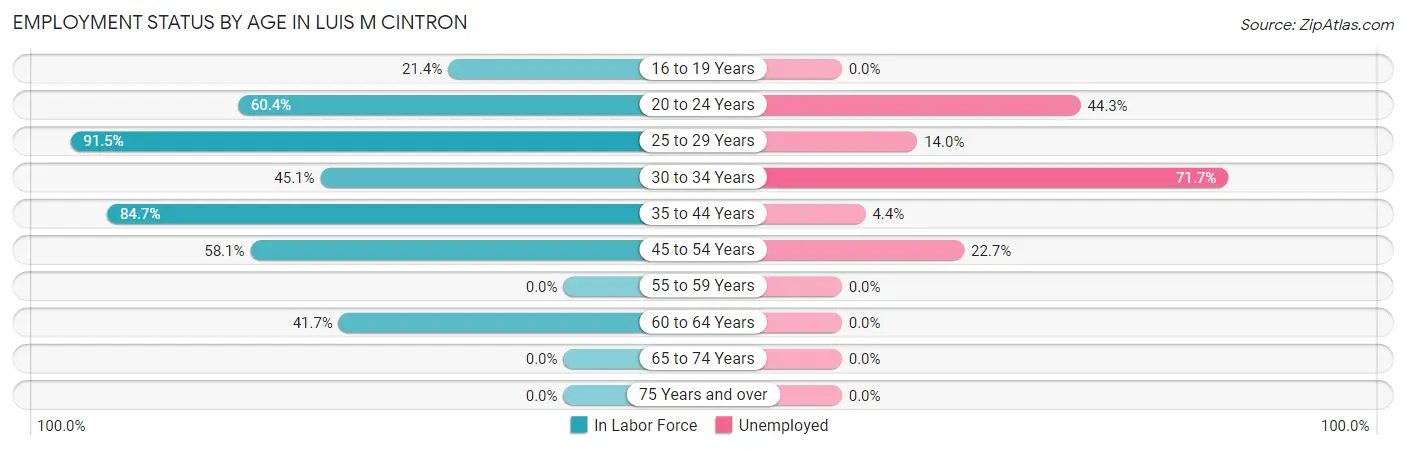
| Age Bracket | In Labor Force | Unemployed |
| 16 to 19 Years | 18 (21.4%) | 0 (0.0%) |
| 20 to 24 Years | 122 (60.4%) | 54 (44.3%) |
| 25 to 29 Years | 107 (91.5%) | 15 (14.0%) |
| 30 to 34 Years | 46 (45.1%) | 33 (71.7%) |
| 35 to 44 Years | 160 (84.7%) | 7 (4.4%) |
| 45 to 54 Years | 172 (58.1%) | 39 (22.7%) |
| 55 to 59 Years | 0 (0.0%) | 0 (0.0%) |
| 60 to 64 Years | 50 (41.7%) | 0 (0.0%) |
| 65 to 74 Years | 0 (0.0%) | 0 (0.0%) |
| 75 Years and over | 0 (0.0%) | 0 (0.0%) |
| Total | 676 (45.8%) | 148 (21.9%) |
Employment Status by Educational Attainment in Luis M Cintron
According to labor force statistics for Luis M Cintron, 64.1% of individuals (535) out of the total population between 25 and 64 years of age (835) are in the labor force, with 17.6% or 94 of them being unemployed. The group with the highest labor force participation rate are those with the educational attainment of high school diploma, with 78.5% or 281 individuals in the labor force. Within the labor force, individuals with less than high school education have the highest percentage of unemployment, with 67.9% or 19 of them being unemployed.
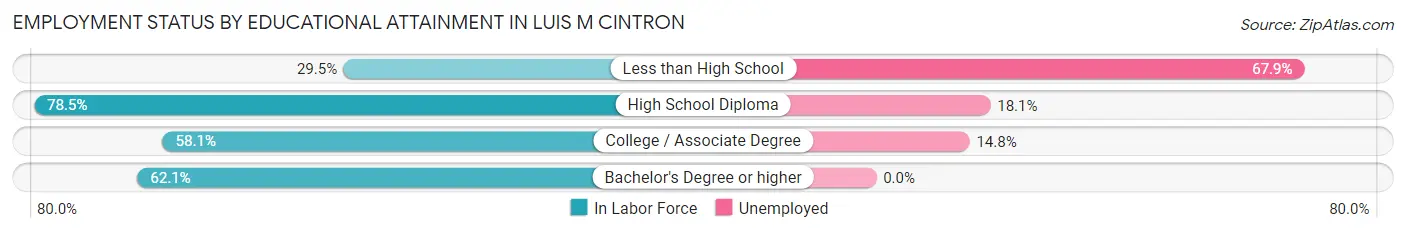
| Educational Attainment | In Labor Force | Unemployed |
| Less than High School | 28 (29.5%) | 65 (67.9%) |
| High School Diploma | 281 (78.5%) | 65 (18.1%) |
| College / Associate Degree | 162 (58.1%) | 41 (14.8%) |
| Bachelor's Degree or higher | 64 (62.1%) | 0 (0.0%) |
| Total | 535 (64.1%) | 147 (17.6%) |
Employment Occupations by Sex in Luis M Cintron
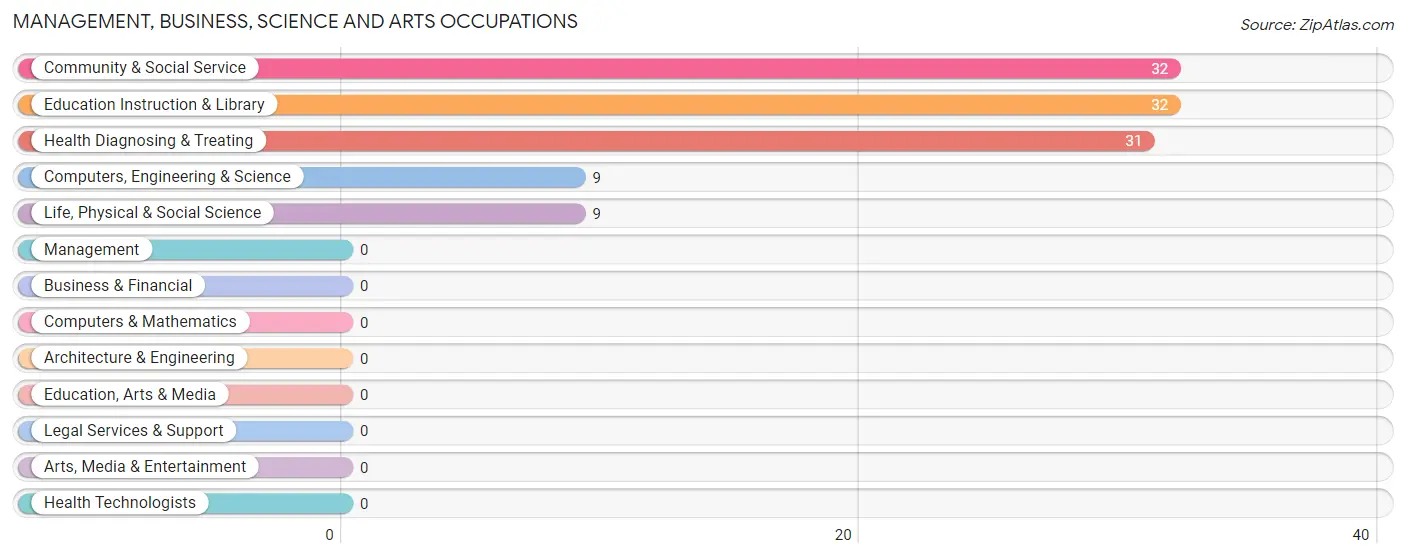
Management, Business, Science and Arts Occupations
The most common Management, Business, Science and Arts occupations in Luis M Cintron are Community & Social Service (32 | 6.1%), Education Instruction & Library (32 | 6.1%), Health Diagnosing & Treating (31 | 5.9%), Computers, Engineering & Science (9 | 1.7%), and Life, Physical & Social Science (9 | 1.7%).
Management, Business, Science and Arts Occupations by Sex
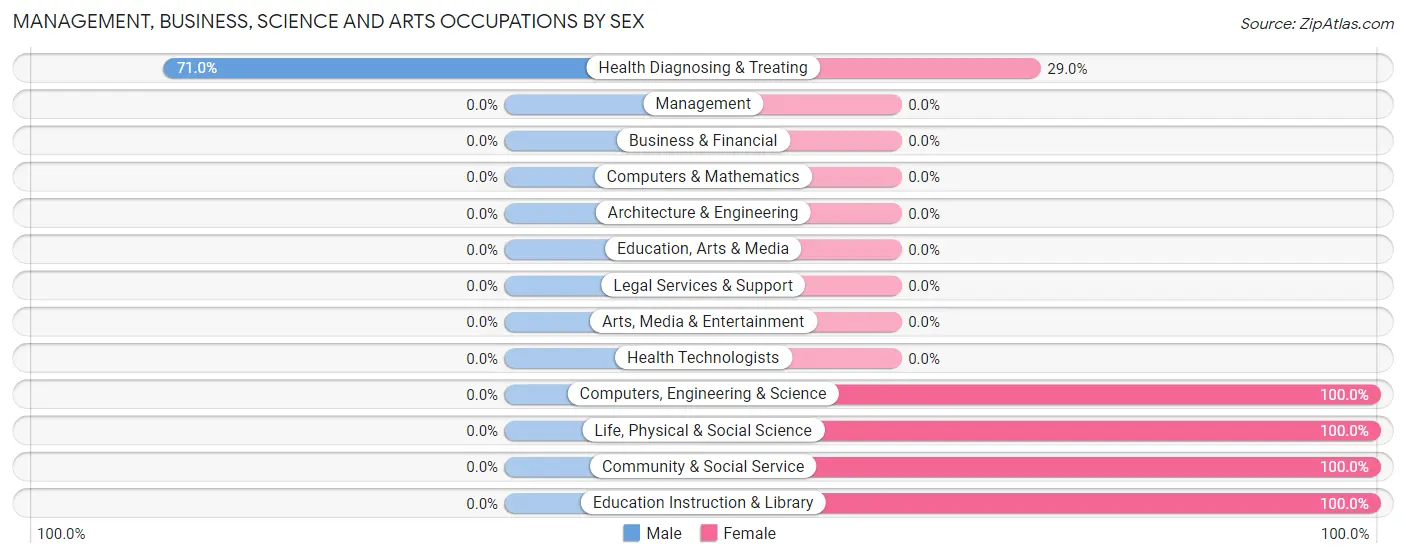
| Occupation | Male | Female |
| Management | 0 (0.0%) | 0 (0.0%) |
| Business & Financial | 0 (0.0%) | 0 (0.0%) |
| Computers, Engineering & Science | 0 (0.0%) | 9 (100.0%) |
| Computers & Mathematics | 0 (0.0%) | 0 (0.0%) |
| Architecture & Engineering | 0 (0.0%) | 0 (0.0%) |
| Life, Physical & Social Science | 0 (0.0%) | 9 (100.0%) |
| Community & Social Service | 0 (0.0%) | 32 (100.0%) |
| Education, Arts & Media | 0 (0.0%) | 0 (0.0%) |
| Legal Services & Support | 0 (0.0%) | 0 (0.0%) |
| Education Instruction & Library | 0 (0.0%) | 32 (100.0%) |
| Arts, Media & Entertainment | 0 (0.0%) | 0 (0.0%) |
| Health Diagnosing & Treating | 22 (71.0%) | 9 (29.0%) |
| Health Technologists | 0 (0.0%) | 0 (0.0%) |
| Total (Category) | 22 (30.6%) | 50 (69.4%) |
| Total (Overall) | 284 (53.9%) | 243 (46.1%) |
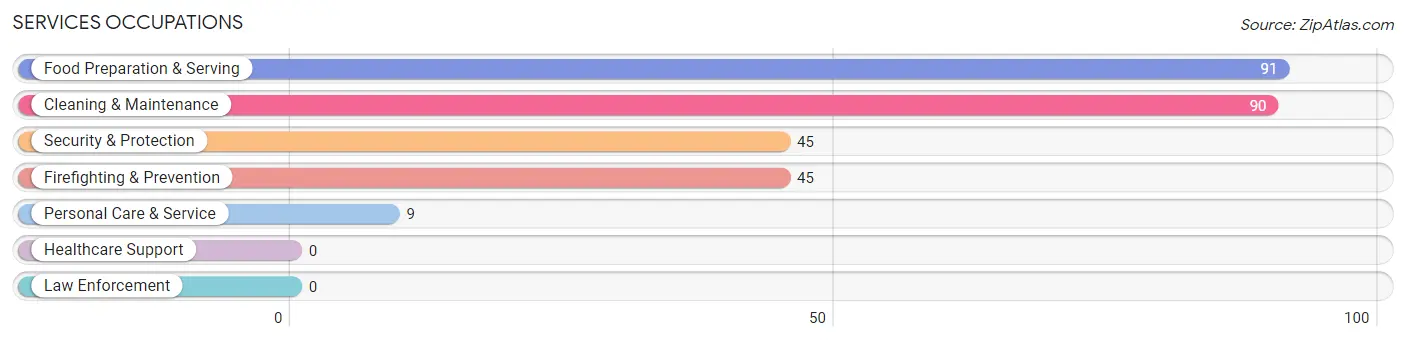
Services Occupations
The most common Services occupations in Luis M Cintron are Food Preparation & Serving (91 | 17.3%), Cleaning & Maintenance (90 | 17.1%), Security & Protection (45 | 8.5%), Firefighting & Prevention (45 | 8.5%), and Personal Care & Service (9 | 1.7%).
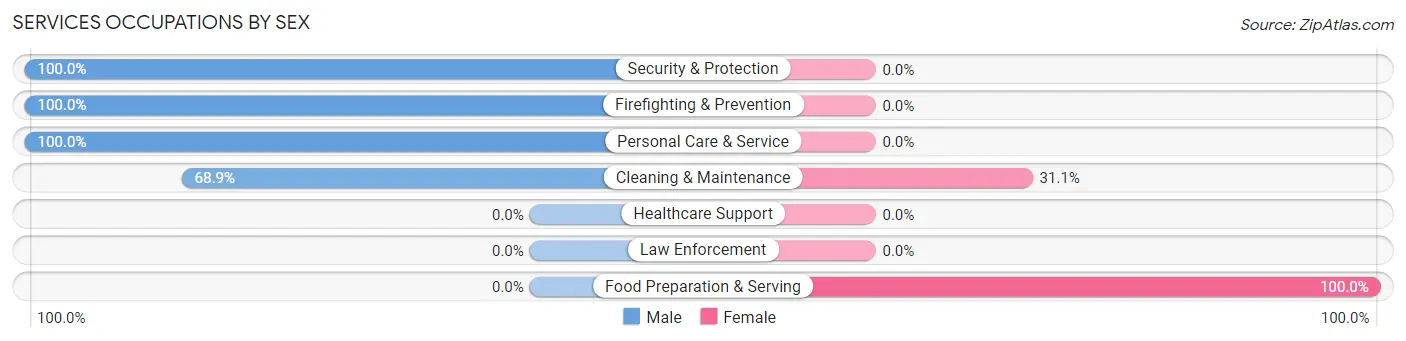
Services Occupations by Sex
Within the Services occupations in Luis M Cintron, the most male-oriented occupations are Security & Protection (100.0%), Firefighting & Prevention (100.0%), and Personal Care & Service (100.0%), while the most female-oriented occupations are Food Preparation & Serving (100.0%), and Cleaning & Maintenance (31.1%).
| Occupation | Male | Female |
| Healthcare Support | 0 (0.0%) | 0 (0.0%) |
| Security & Protection | 45 (100.0%) | 0 (0.0%) |
| Firefighting & Prevention | 45 (100.0%) | 0 (0.0%) |
| Law Enforcement | 0 (0.0%) | 0 (0.0%) |
| Food Preparation & Serving | 0 (0.0%) | 91 (100.0%) |
| Cleaning & Maintenance | 62 (68.9%) | 28 (31.1%) |
| Personal Care & Service | 9 (100.0%) | 0 (0.0%) |
| Total (Category) | 116 (49.4%) | 119 (50.6%) |
| Total (Overall) | 284 (53.9%) | 243 (46.1%) |
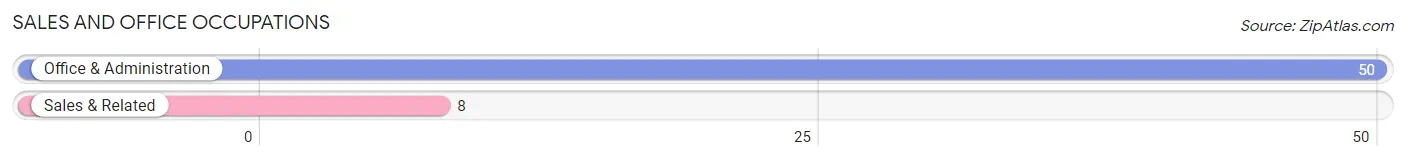
Sales and Office Occupations
The most common Sales and Office occupations in Luis M Cintron are Office & Administration (50 | 9.5%), and Sales & Related (8 | 1.5%).
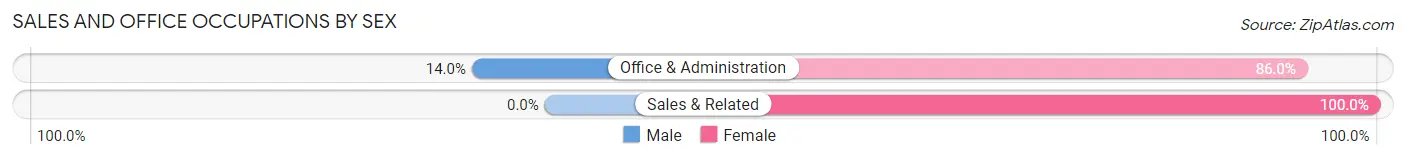
Sales and Office Occupations by Sex
| Occupation | Male | Female |
| Sales & Related | 0 (0.0%) | 8 (100.0%) |
| Office & Administration | 7 (14.0%) | 43 (86.0%) |
| Total (Category) | 7 (12.1%) | 51 (87.9%) |
| Total (Overall) | 284 (53.9%) | 243 (46.1%) |
Natural Resources, Construction and Maintenance Occupations
The most common Natural Resources, Construction and Maintenance occupations in Luis M Cintron are Construction & Extraction (60 | 11.4%), and Installation, Maintenance & Repair (50 | 9.5%).
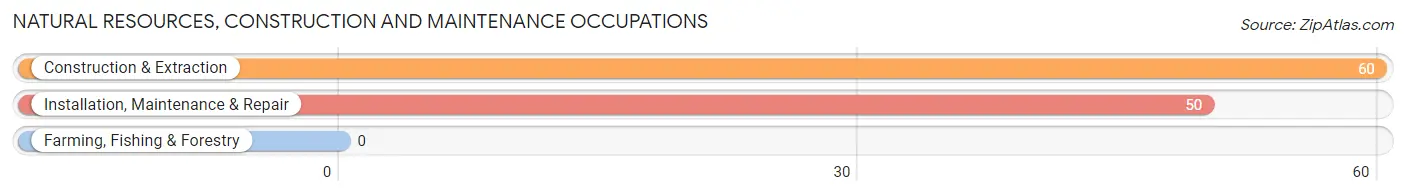
Natural Resources, Construction and Maintenance Occupations by Sex
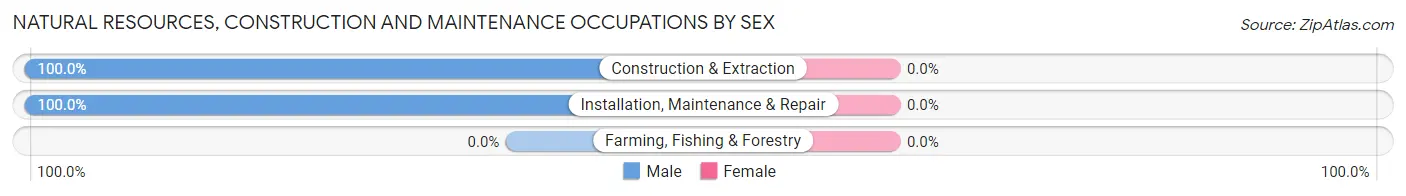
| Occupation | Male | Female |
| Farming, Fishing & Forestry | 0 (0.0%) | 0 (0.0%) |
| Construction & Extraction | 60 (100.0%) | 0 (0.0%) |
| Installation, Maintenance & Repair | 50 (100.0%) | 0 (0.0%) |
| Total (Category) | 110 (100.0%) | 0 (0.0%) |
| Total (Overall) | 284 (53.9%) | 243 (46.1%) |
Production, Transportation and Moving Occupations
The most common Production, Transportation and Moving occupations in Luis M Cintron are Production (44 | 8.4%), and Transportation (8 | 1.5%).
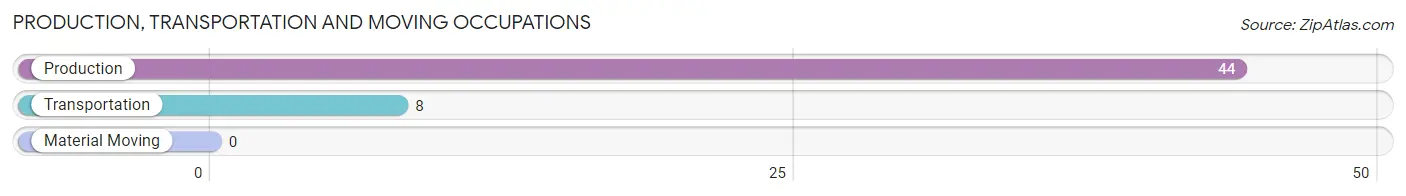
Production, Transportation and Moving Occupations by Sex
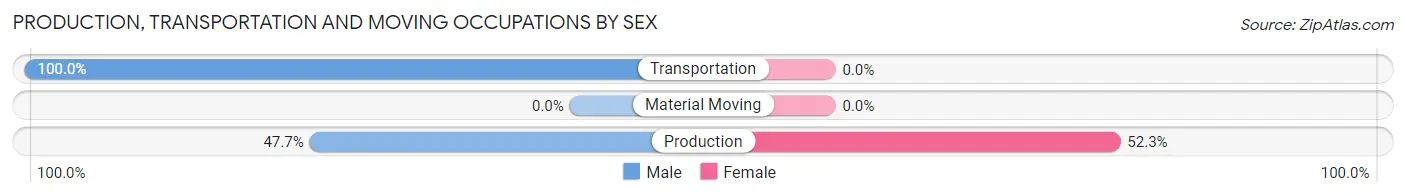
| Occupation | Male | Female |
| Production | 21 (47.7%) | 23 (52.3%) |
| Transportation | 8 (100.0%) | 0 (0.0%) |
| Material Moving | 0 (0.0%) | 0 (0.0%) |
| Total (Category) | 29 (55.8%) | 23 (44.2%) |
| Total (Overall) | 284 (53.9%) | 243 (46.1%) |
Employment Industries by Sex in Luis M Cintron
Employment Industries in Luis M Cintron
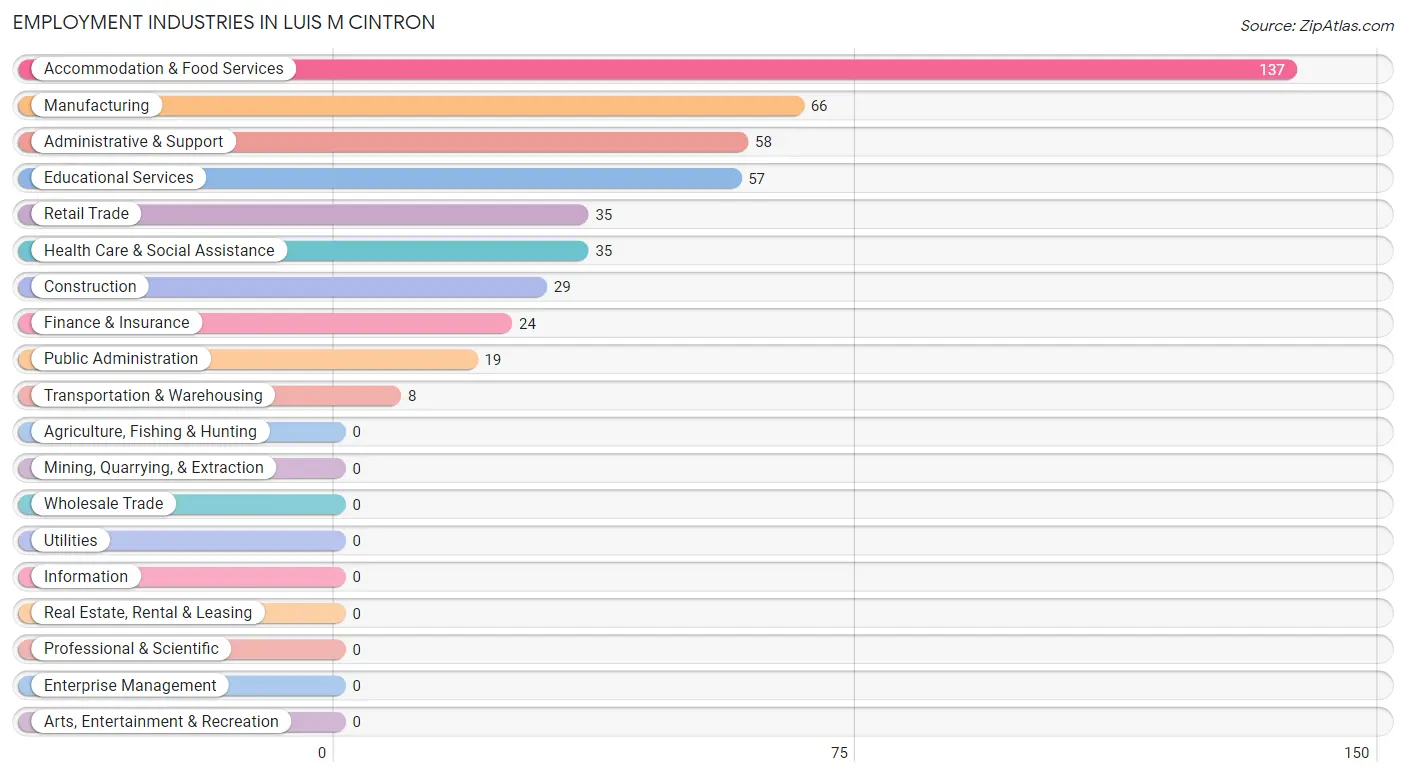
The major employment industries in Luis M Cintron include Accommodation & Food Services (137 | 26.0%), Manufacturing (66 | 12.5%), Administrative & Support (58 | 11.0%), Educational Services (57 | 10.8%), and Retail Trade (35 | 6.6%).
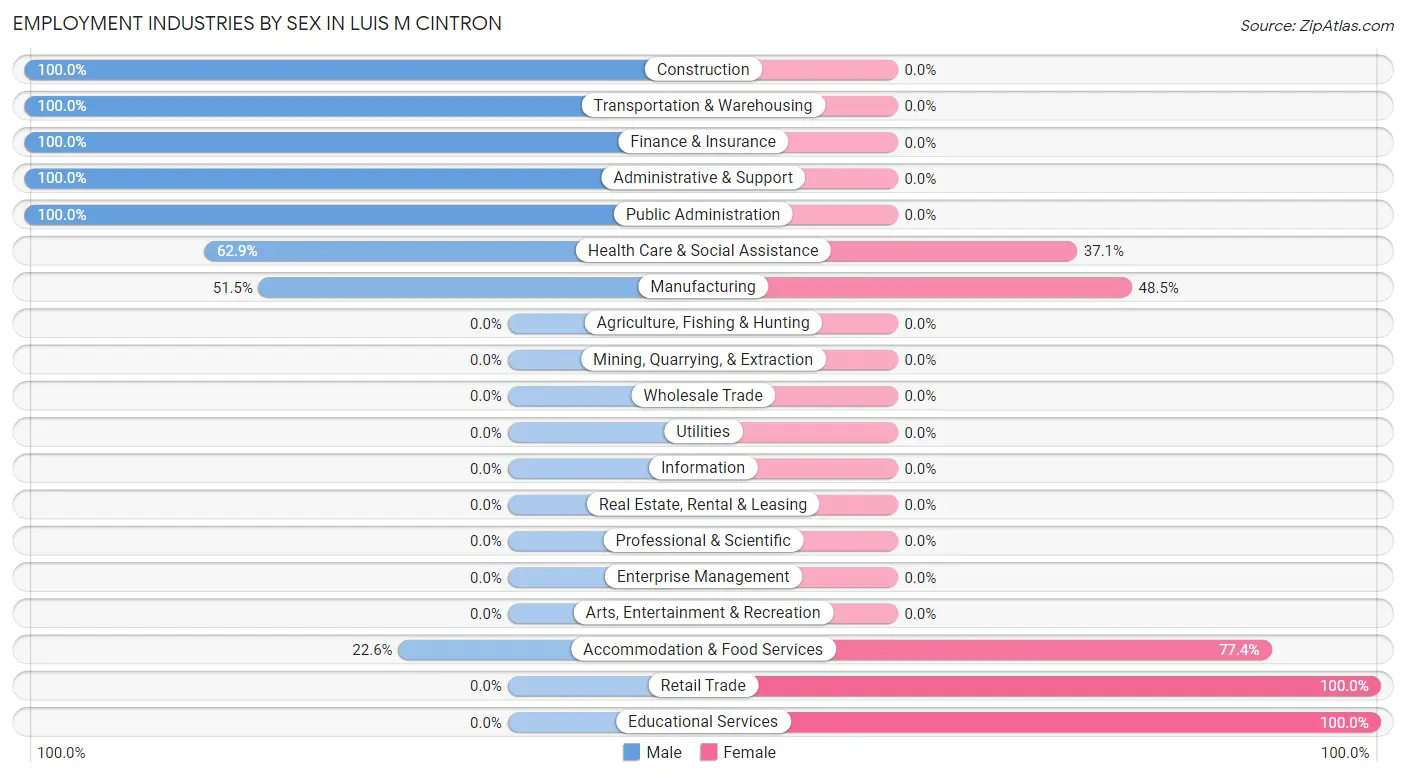
Employment Industries by Sex in Luis M Cintron
The Luis M Cintron industries that see more men than women are Construction (100.0%), Transportation & Warehousing (100.0%), and Finance & Insurance (100.0%), whereas the industries that tend to have a higher number of women are Retail Trade (100.0%), Educational Services (100.0%), and Accommodation & Food Services (77.4%).
| Industry | Male | Female |
| Agriculture, Fishing & Hunting | 0 (0.0%) | 0 (0.0%) |
| Mining, Quarrying, & Extraction | 0 (0.0%) | 0 (0.0%) |
| Construction | 29 (100.0%) | 0 (0.0%) |
| Manufacturing | 34 (51.5%) | 32 (48.5%) |
| Wholesale Trade | 0 (0.0%) | 0 (0.0%) |
| Retail Trade | 0 (0.0%) | 35 (100.0%) |
| Transportation & Warehousing | 8 (100.0%) | 0 (0.0%) |
| Utilities | 0 (0.0%) | 0 (0.0%) |
| Information | 0 (0.0%) | 0 (0.0%) |
| Finance & Insurance | 24 (100.0%) | 0 (0.0%) |
| Real Estate, Rental & Leasing | 0 (0.0%) | 0 (0.0%) |
| Professional & Scientific | 0 (0.0%) | 0 (0.0%) |
| Enterprise Management | 0 (0.0%) | 0 (0.0%) |
| Administrative & Support | 58 (100.0%) | 0 (0.0%) |
| Educational Services | 0 (0.0%) | 57 (100.0%) |
| Health Care & Social Assistance | 22 (62.9%) | 13 (37.1%) |
| Arts, Entertainment & Recreation | 0 (0.0%) | 0 (0.0%) |
| Accommodation & Food Services | 31 (22.6%) | 106 (77.4%) |
| Public Administration | 19 (100.0%) | 0 (0.0%) |
| Total | 284 (53.9%) | 243 (46.1%) |
Education in Luis M Cintron
School Enrollment in Luis M Cintron
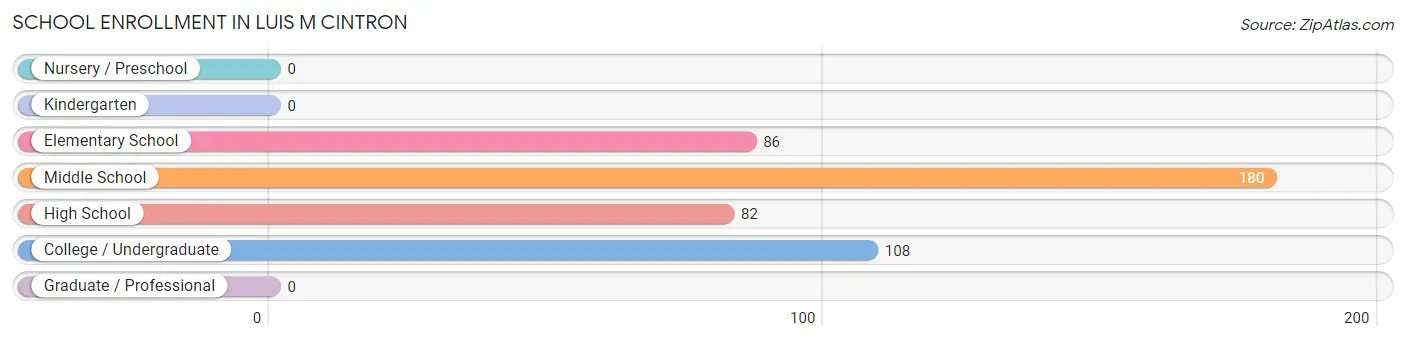
The most common levels of schooling among the 456 students in Luis M Cintron are middle school (180 | 39.5%), college / undergraduate (108 | 23.7%), and elementary school (86 | 18.9%).
| School Level | # Students | % Students |
| Nursery / Preschool | 0 | 0.0% |
| Kindergarten | 0 | 0.0% |
| Elementary School | 86 | 18.9% |
| Middle School | 180 | 39.5% |
| High School | 82 | 18.0% |
| College / Undergraduate | 108 | 23.7% |
| Graduate / Professional | 0 | 0.0% |
| Total | 456 | 100.0% |
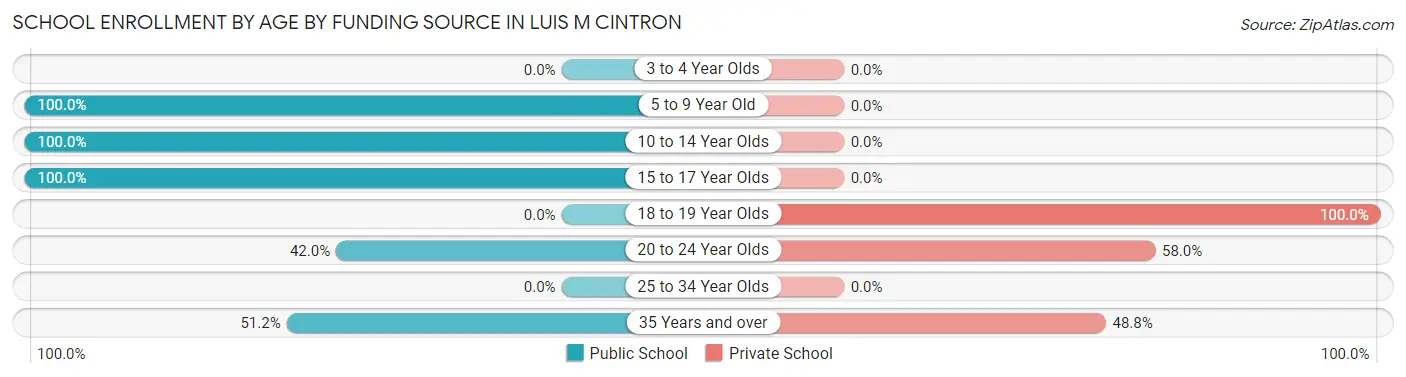
School Enrollment by Age by Funding Source in Luis M Cintron
Out of a total of 456 students who are enrolled in schools in Luis M Cintron, 87 (19.1%) attend a private institution, while the remaining 369 (80.9%) are enrolled in public schools. The age group of 18 to 19 year olds has the highest likelihood of being enrolled in private schools, with 38 (100.0% in the age bracket) enrolled. Conversely, the age group of 5 to 9 year old has the lowest likelihood of being enrolled in a private school, with 86 (100.0% in the age bracket) attending a public institution.
| Age Bracket | Public School | Private School |
| 3 to 4 Year Olds | 0 (0.0%) | 0 (0.0%) |
| 5 to 9 Year Old | 86 (100.0%) | 0 (0.0%) |
| 10 to 14 Year Olds | 180 (100.0%) | 0 (0.0%) |
| 15 to 17 Year Olds | 61 (100.0%) | 0 (0.0%) |
| 18 to 19 Year Olds | 0 (0.0%) | 38 (100.0%) |
| 20 to 24 Year Olds | 21 (42.0%) | 29 (58.0%) |
| 25 to 34 Year Olds | 0 (0.0%) | 0 (0.0%) |
| 35 Years and over | 21 (51.2%) | 20 (48.8%) |
| Total | 369 (80.9%) | 87 (19.1%) |
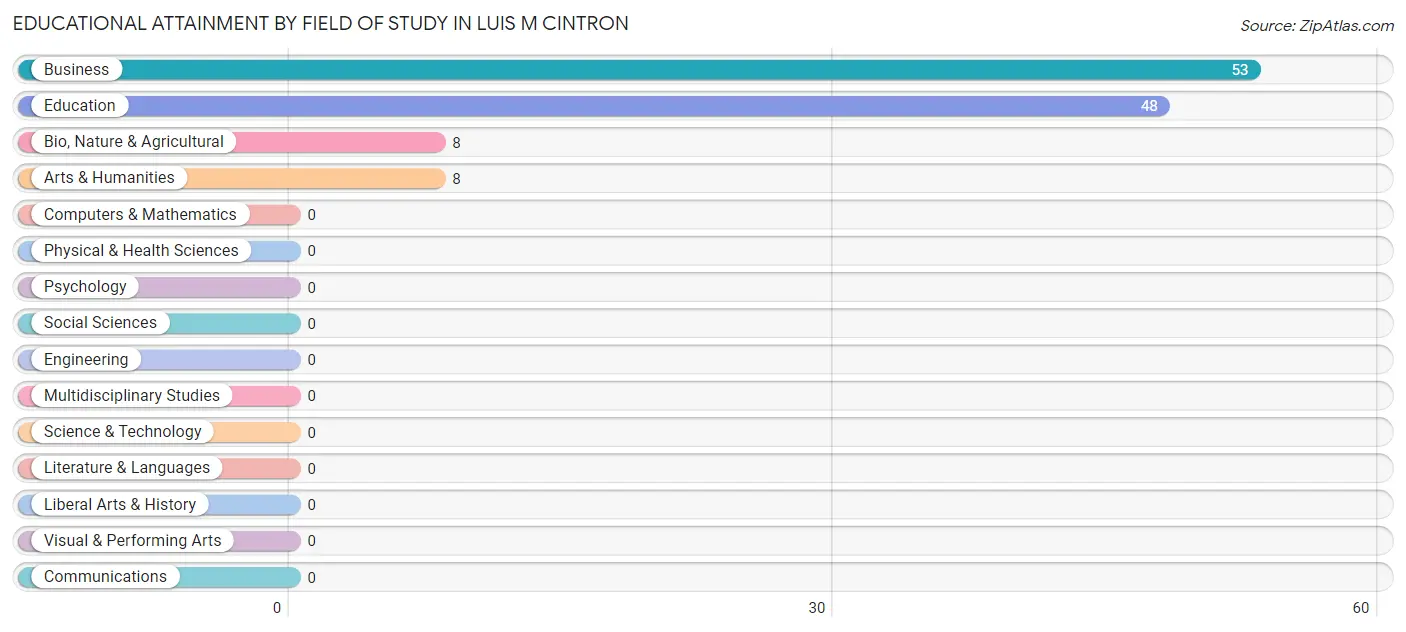
Educational Attainment by Field of Study in Luis M Cintron
Business (53 | 45.3%), education (48 | 41.0%), bio, nature & agricultural (8 | 6.8%), and arts & humanities (8 | 6.8%) are the most common fields of study among 117 individuals in Luis M Cintron who have obtained a bachelor's degree or higher.
| Field of Study | # Graduates | % Graduates |
| Computers & Mathematics | 0 | 0.0% |
| Bio, Nature & Agricultural | 8 | 6.8% |
| Physical & Health Sciences | 0 | 0.0% |
| Psychology | 0 | 0.0% |
| Social Sciences | 0 | 0.0% |
| Engineering | 0 | 0.0% |
| Multidisciplinary Studies | 0 | 0.0% |
| Science & Technology | 0 | 0.0% |
| Business | 53 | 45.3% |
| Education | 48 | 41.0% |
| Literature & Languages | 0 | 0.0% |
| Liberal Arts & History | 0 | 0.0% |
| Visual & Performing Arts | 0 | 0.0% |
| Communications | 0 | 0.0% |
| Arts & Humanities | 8 | 6.8% |
| Total | 117 | 100.0% |
Transportation & Commute in Luis M Cintron
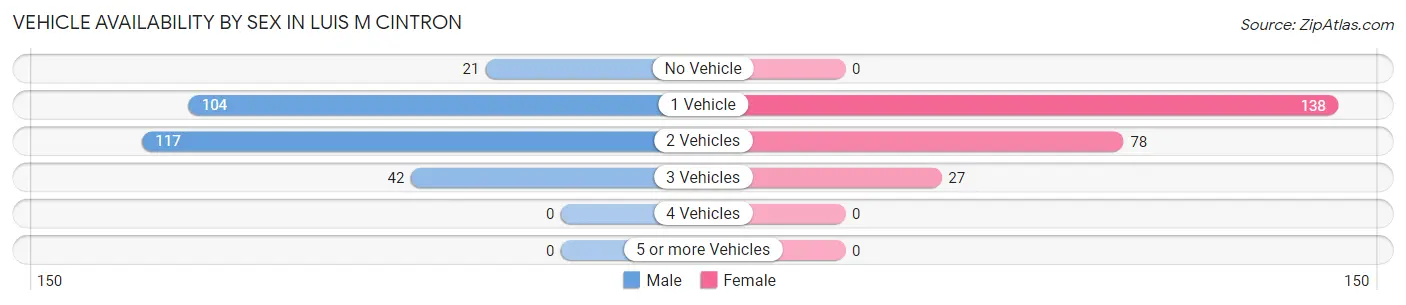
Vehicle Availability by Sex in Luis M Cintron
The most prevalent vehicle ownership categories in Luis M Cintron are males with 2 vehicles (117, accounting for 41.2%) and females with 2 vehicles (78, making up 48.1%).
| Vehicles Available | Male | Female |
| No Vehicle | 21 (7.4%) | 0 (0.0%) |
| 1 Vehicle | 104 (36.6%) | 138 (56.8%) |
| 2 Vehicles | 117 (41.2%) | 78 (32.1%) |
| 3 Vehicles | 42 (14.8%) | 27 (11.1%) |
| 4 Vehicles | 0 (0.0%) | 0 (0.0%) |
| 5 or more Vehicles | 0 (0.0%) | 0 (0.0%) |
| Total | 284 (100.0%) | 243 (100.0%) |
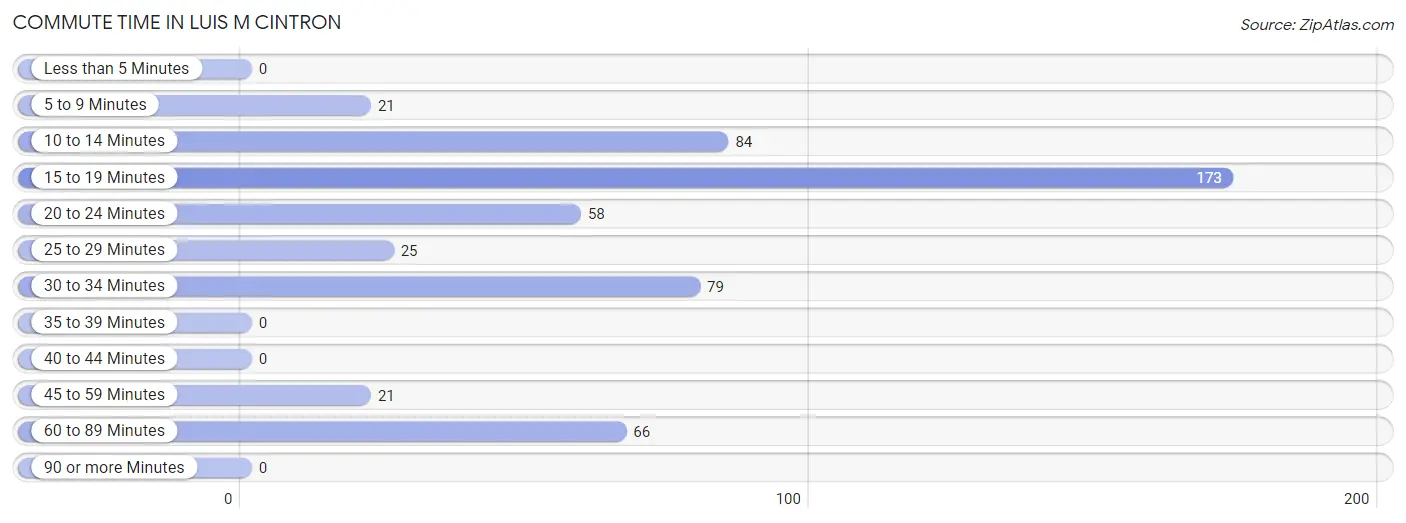
Commute Time in Luis M Cintron
The most frequently occuring commute durations in Luis M Cintron are 15 to 19 minutes (173 commuters, 32.8%), 10 to 14 minutes (84 commuters, 15.9%), and 30 to 34 minutes (79 commuters, 15.0%).
| Commute Time | # Commuters | % Commuters |
| Less than 5 Minutes | 0 | 0.0% |
| 5 to 9 Minutes | 21 | 4.0% |
| 10 to 14 Minutes | 84 | 15.9% |
| 15 to 19 Minutes | 173 | 32.8% |
| 20 to 24 Minutes | 58 | 11.0% |
| 25 to 29 Minutes | 25 | 4.7% |
| 30 to 34 Minutes | 79 | 15.0% |
| 35 to 39 Minutes | 0 | 0.0% |
| 40 to 44 Minutes | 0 | 0.0% |
| 45 to 59 Minutes | 21 | 4.0% |
| 60 to 89 Minutes | 66 | 12.5% |
| 90 or more Minutes | 0 | 0.0% |
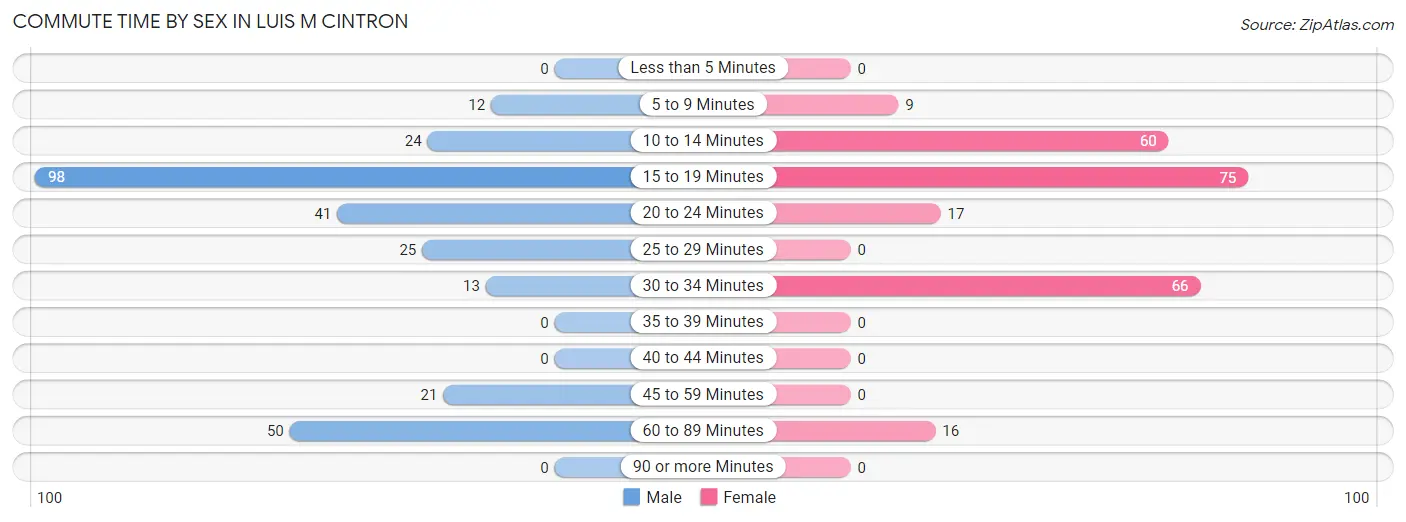
Commute Time by Sex in Luis M Cintron
The most common commute times in Luis M Cintron are 15 to 19 minutes (98 commuters, 34.5%) for males and 15 to 19 minutes (75 commuters, 30.9%) for females.
| Commute Time | Male | Female |
| Less than 5 Minutes | 0 (0.0%) | 0 (0.0%) |
| 5 to 9 Minutes | 12 (4.2%) | 9 (3.7%) |
| 10 to 14 Minutes | 24 (8.5%) | 60 (24.7%) |
| 15 to 19 Minutes | 98 (34.5%) | 75 (30.9%) |
| 20 to 24 Minutes | 41 (14.4%) | 17 (7.0%) |
| 25 to 29 Minutes | 25 (8.8%) | 0 (0.0%) |
| 30 to 34 Minutes | 13 (4.6%) | 66 (27.2%) |
| 35 to 39 Minutes | 0 (0.0%) | 0 (0.0%) |
| 40 to 44 Minutes | 0 (0.0%) | 0 (0.0%) |
| 45 to 59 Minutes | 21 (7.4%) | 0 (0.0%) |
| 60 to 89 Minutes | 50 (17.6%) | 16 (6.6%) |
| 90 or more Minutes | 0 (0.0%) | 0 (0.0%) |
Time of Departure to Work by Sex in Luis M Cintron
The most frequent times of departure to work in Luis M Cintron are 6:00 AM to 6:29 AM (80, 28.2%) for males and 12:00 PM to 3:59 PM (45, 18.5%) for females.
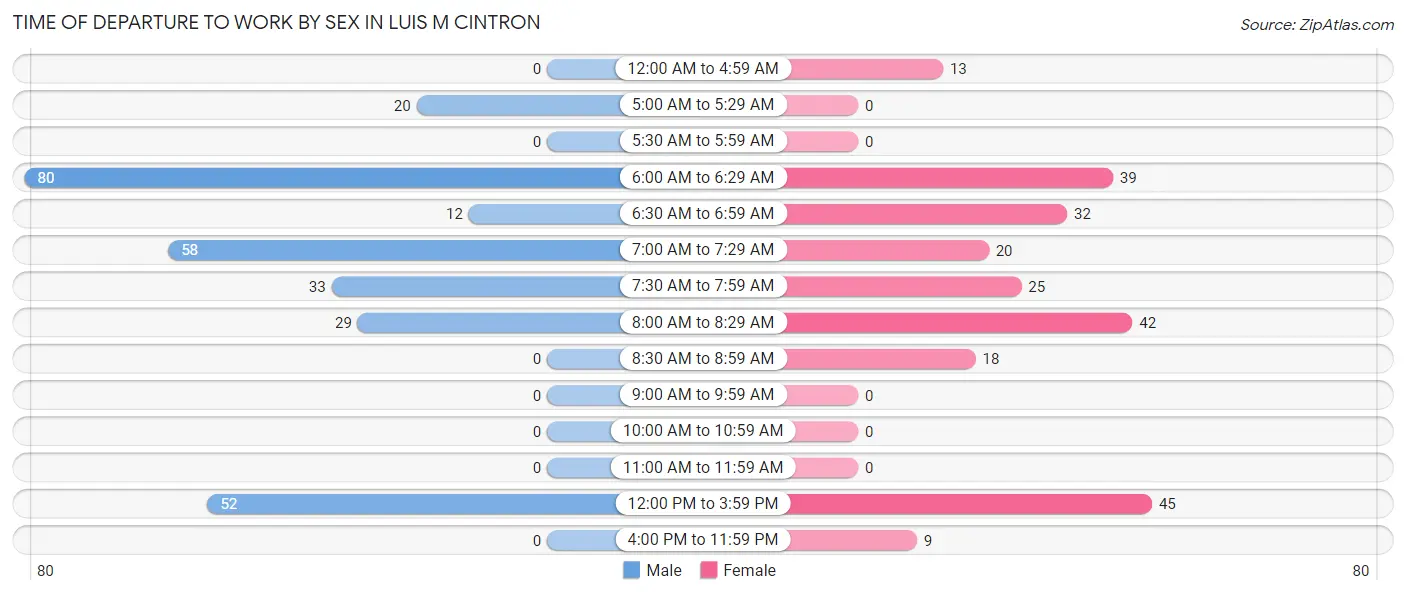
| Time of Departure | Male | Female |
| 12:00 AM to 4:59 AM | 0 (0.0%) | 13 (5.3%) |
| 5:00 AM to 5:29 AM | 20 (7.0%) | 0 (0.0%) |
| 5:30 AM to 5:59 AM | 0 (0.0%) | 0 (0.0%) |
| 6:00 AM to 6:29 AM | 80 (28.2%) | 39 (16.1%) |
| 6:30 AM to 6:59 AM | 12 (4.2%) | 32 (13.2%) |
| 7:00 AM to 7:29 AM | 58 (20.4%) | 20 (8.2%) |
| 7:30 AM to 7:59 AM | 33 (11.6%) | 25 (10.3%) |
| 8:00 AM to 8:29 AM | 29 (10.2%) | 42 (17.3%) |
| 8:30 AM to 8:59 AM | 0 (0.0%) | 18 (7.4%) |
| 9:00 AM to 9:59 AM | 0 (0.0%) | 0 (0.0%) |
| 10:00 AM to 10:59 AM | 0 (0.0%) | 0 (0.0%) |
| 11:00 AM to 11:59 AM | 0 (0.0%) | 0 (0.0%) |
| 12:00 PM to 3:59 PM | 52 (18.3%) | 45 (18.5%) |
| 4:00 PM to 11:59 PM | 0 (0.0%) | 9 (3.7%) |
| Total | 284 (100.0%) | 243 (100.0%) |
Housing Occupancy in Luis M Cintron
Occupancy by Ownership in Luis M Cintron
Of the total 662 dwellings in Luis M Cintron, owner-occupied units account for 400 (60.4%), while renter-occupied units make up 262 (39.6%).
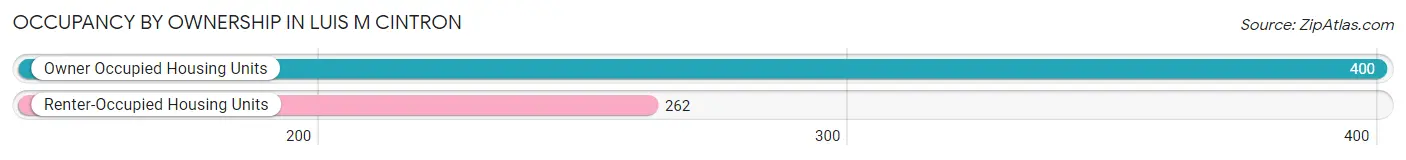
| Occupancy | # Housing Units | % Housing Units |
| Owner Occupied Housing Units | 400 | 60.4% |
| Renter-Occupied Housing Units | 262 | 39.6% |
| Total Occupied Housing Units | 662 | 100.0% |
Occupancy by Household Size in Luis M Cintron
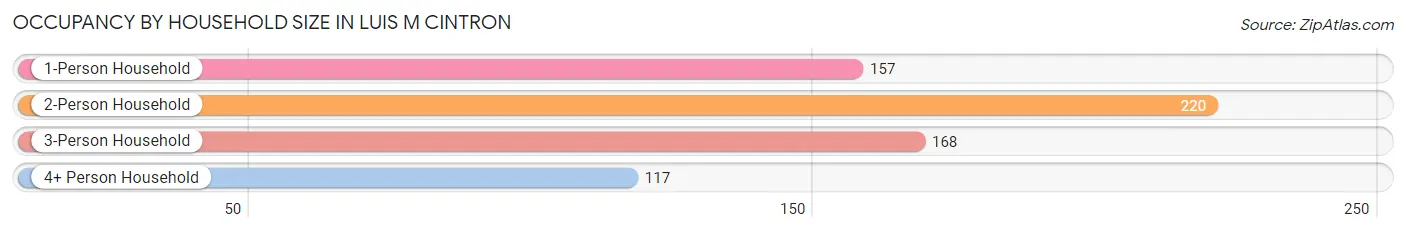
| Household Size | # Housing Units | % Housing Units |
| 1-Person Household | 157 | 23.7% |
| 2-Person Household | 220 | 33.2% |
| 3-Person Household | 168 | 25.4% |
| 4+ Person Household | 117 | 17.7% |
| Total Housing Units | 662 | 100.0% |
Occupancy by Ownership by Household Size in Luis M Cintron
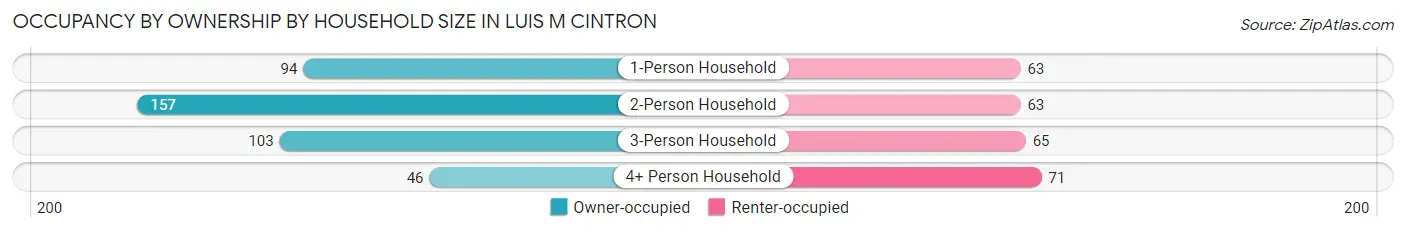
| Household Size | Owner-occupied | Renter-occupied |
| 1-Person Household | 94 (59.9%) | 63 (40.1%) |
| 2-Person Household | 157 (71.4%) | 63 (28.6%) |
| 3-Person Household | 103 (61.3%) | 65 (38.7%) |
| 4+ Person Household | 46 (39.3%) | 71 (60.7%) |
| Total Housing Units | 400 (60.4%) | 262 (39.6%) |
Occupancy by Educational Attainment in Luis M Cintron
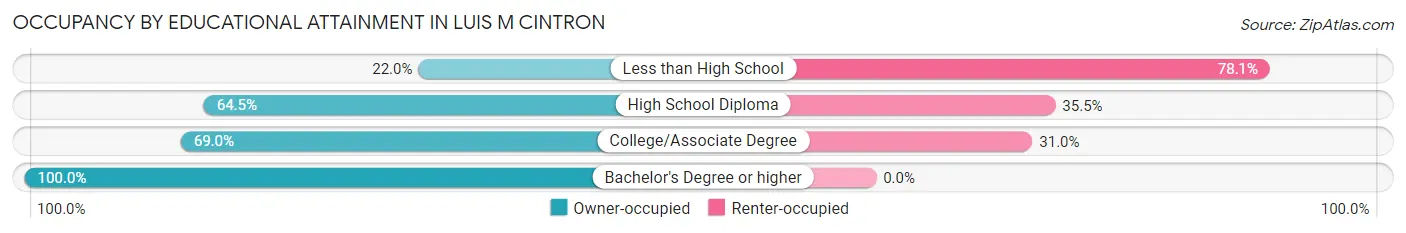
| Household Size | Owner-occupied | Renter-occupied |
| Less than High School | 36 (22.0%) | 128 (78.0%) |
| High School Diploma | 156 (64.5%) | 86 (35.5%) |
| College/Associate Degree | 107 (69.0%) | 48 (31.0%) |
| Bachelor's Degree or higher | 101 (100.0%) | 0 (0.0%) |
Occupancy by Age of Householder in Luis M Cintron
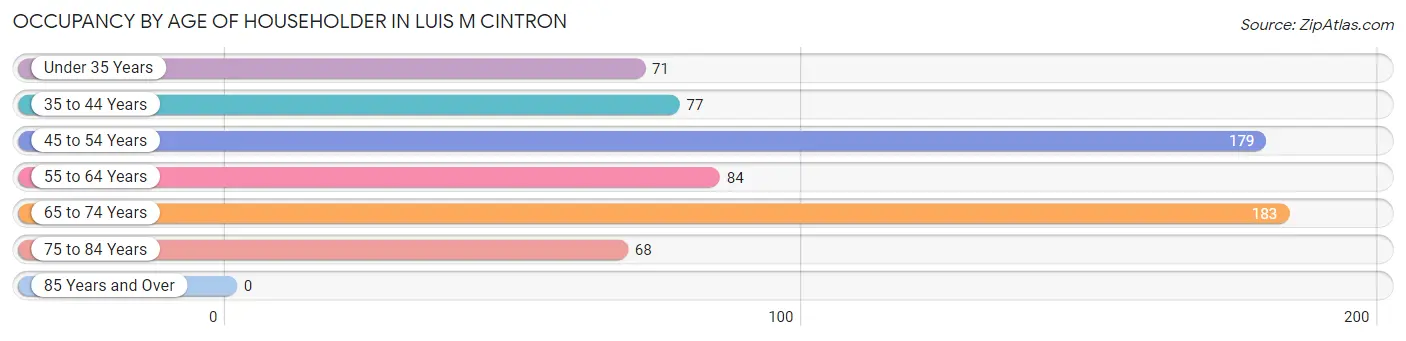
| Age Bracket | # Households | % Households |
| Under 35 Years | 71 | 10.7% |
| 35 to 44 Years | 77 | 11.6% |
| 45 to 54 Years | 179 | 27.0% |
| 55 to 64 Years | 84 | 12.7% |
| 65 to 74 Years | 183 | 27.6% |
| 75 to 84 Years | 68 | 10.3% |
| 85 Years and Over | 0 | 0.0% |
| Total | 662 | 100.0% |
Housing Finances in Luis M Cintron
Median Income by Occupancy in Luis M Cintron
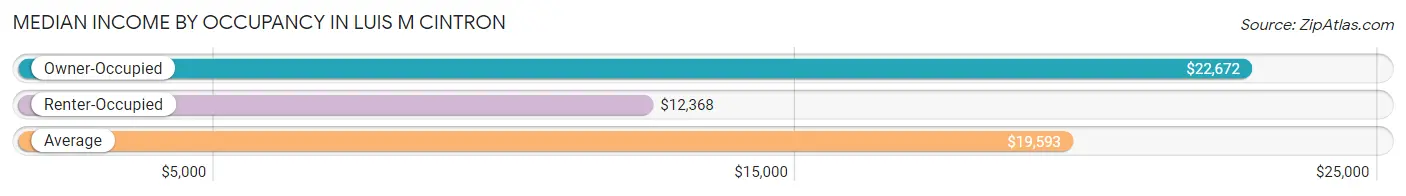
| Occupancy Type | # Households | Median Income |
| Owner-Occupied | 400 (60.4%) | $22,672 |
| Renter-Occupied | 262 (39.6%) | $12,368 |
| Average | 662 (100.0%) | $19,593 |
Occupancy by Householder Income Bracket in Luis M Cintron
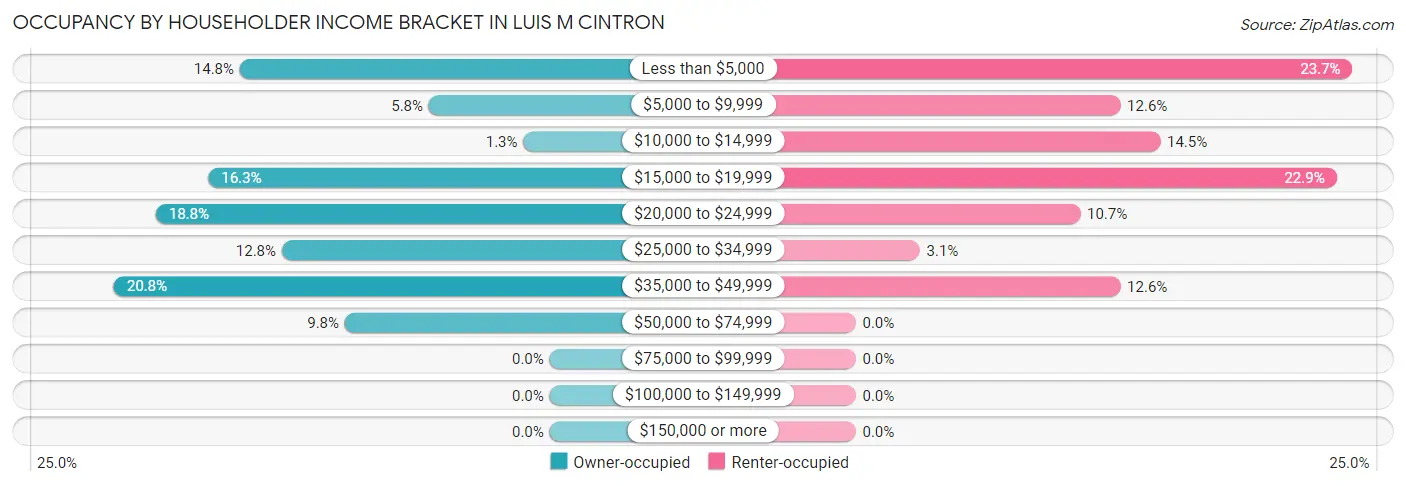
| Income Bracket | Owner-occupied | Renter-occupied |
| Less than $5,000 | 59 (14.7%) | 62 (23.7%) |
| $5,000 to $9,999 | 23 (5.8%) | 33 (12.6%) |
| $10,000 to $14,999 | 5 (1.3%) | 38 (14.5%) |
| $15,000 to $19,999 | 65 (16.3%) | 60 (22.9%) |
| $20,000 to $24,999 | 75 (18.8%) | 28 (10.7%) |
| $25,000 to $34,999 | 51 (12.8%) | 8 (3.0%) |
| $35,000 to $49,999 | 83 (20.7%) | 33 (12.6%) |
| $50,000 to $74,999 | 39 (9.8%) | 0 (0.0%) |
| $75,000 to $99,999 | 0 (0.0%) | 0 (0.0%) |
| $100,000 to $149,999 | 0 (0.0%) | 0 (0.0%) |
| $150,000 or more | 0 (0.0%) | 0 (0.0%) |
| Total | 400 (100.0%) | 262 (100.0%) |
Monthly Housing Cost Tiers in Luis M Cintron
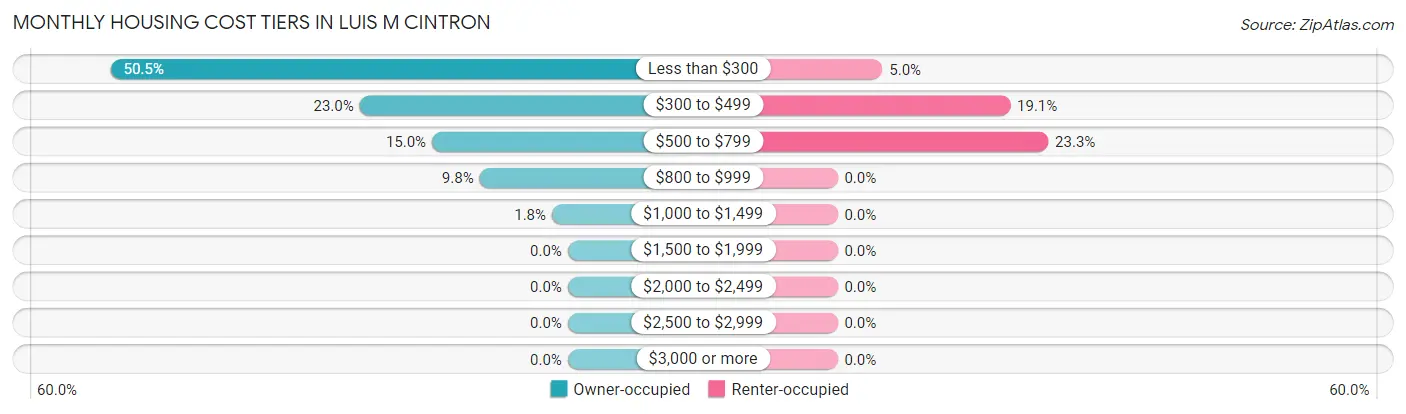
| Monthly Cost | Owner-occupied | Renter-occupied |
| Less than $300 | 202 (50.5%) | 13 (5.0%) |
| $300 to $499 | 92 (23.0%) | 50 (19.1%) |
| $500 to $799 | 60 (15.0%) | 61 (23.3%) |
| $800 to $999 | 39 (9.8%) | 0 (0.0%) |
| $1,000 to $1,499 | 7 (1.8%) | 0 (0.0%) |
| $1,500 to $1,999 | 0 (0.0%) | 0 (0.0%) |
| $2,000 to $2,499 | 0 (0.0%) | 0 (0.0%) |
| $2,500 to $2,999 | 0 (0.0%) | 0 (0.0%) |
| $3,000 or more | 0 (0.0%) | 0 (0.0%) |
| Total | 400 (100.0%) | 262 (100.0%) |
Physical Housing Characteristics in Luis M Cintron
Housing Structures in Luis M Cintron
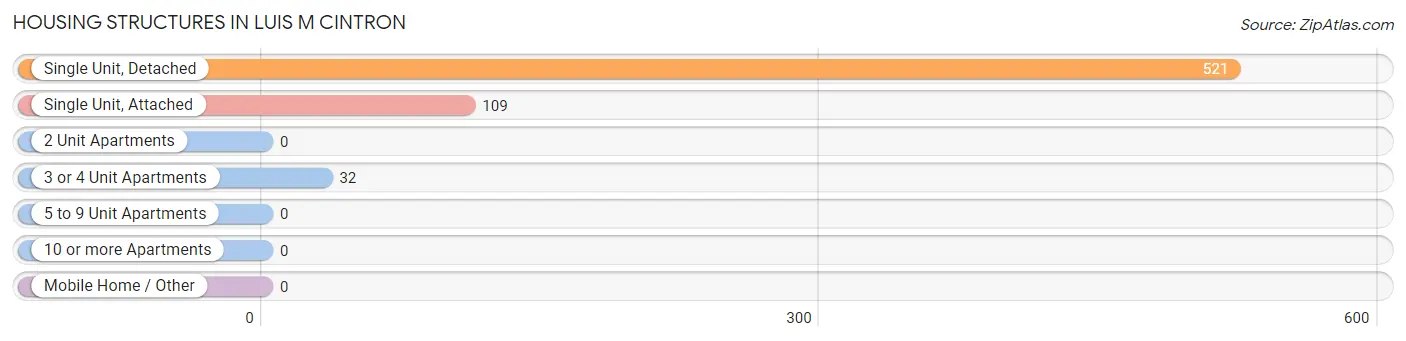
| Structure Type | # Housing Units | % Housing Units |
| Single Unit, Detached | 521 | 78.7% |
| Single Unit, Attached | 109 | 16.5% |
| 2 Unit Apartments | 0 | 0.0% |
| 3 or 4 Unit Apartments | 32 | 4.8% |
| 5 to 9 Unit Apartments | 0 | 0.0% |
| 10 or more Apartments | 0 | 0.0% |
| Mobile Home / Other | 0 | 0.0% |
| Total | 662 | 100.0% |
Housing Structures by Occupancy in Luis M Cintron
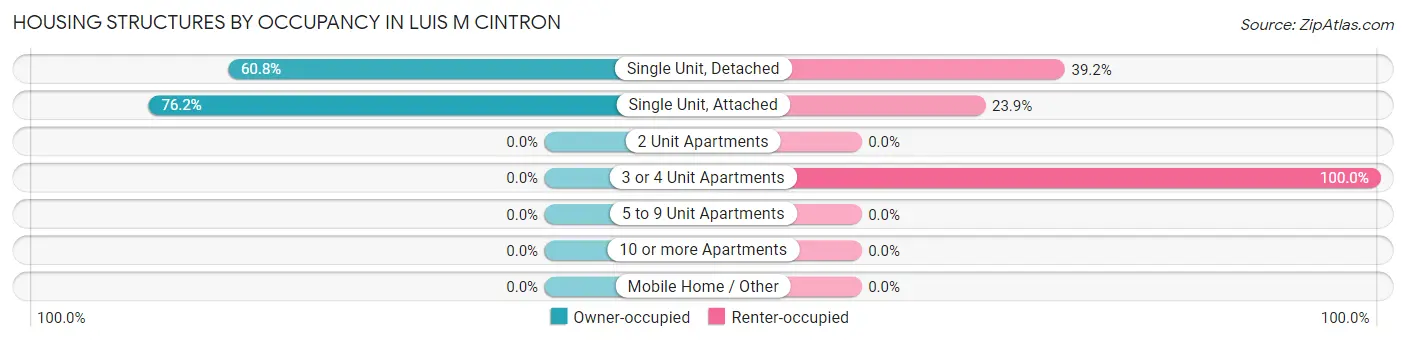
| Structure Type | Owner-occupied | Renter-occupied |
| Single Unit, Detached | 317 (60.8%) | 204 (39.2%) |
| Single Unit, Attached | 83 (76.1%) | 26 (23.8%) |
| 2 Unit Apartments | 0 (0.0%) | 0 (0.0%) |
| 3 or 4 Unit Apartments | 0 (0.0%) | 32 (100.0%) |
| 5 to 9 Unit Apartments | 0 (0.0%) | 0 (0.0%) |
| 10 or more Apartments | 0 (0.0%) | 0 (0.0%) |
| Mobile Home / Other | 0 (0.0%) | 0 (0.0%) |
| Total | 400 (60.4%) | 262 (39.6%) |
Housing Structures by Number of Rooms in Luis M Cintron
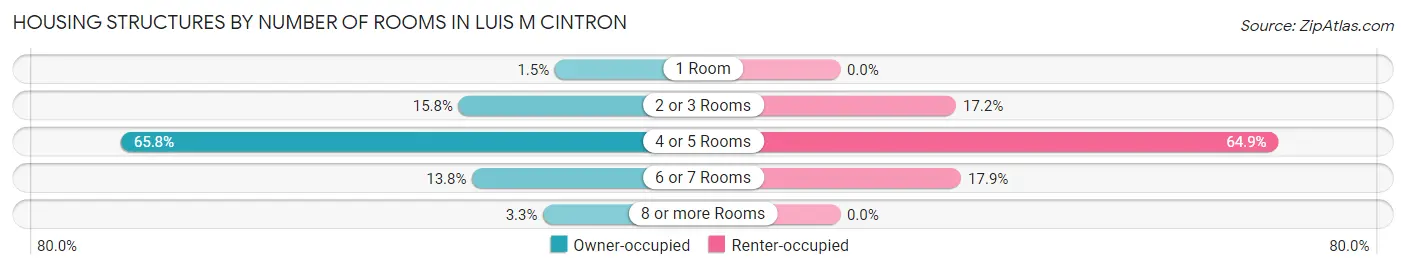
| Number of Rooms | Owner-occupied | Renter-occupied |
| 1 Room | 6 (1.5%) | 0 (0.0%) |
| 2 or 3 Rooms | 63 (15.8%) | 45 (17.2%) |
| 4 or 5 Rooms | 263 (65.7%) | 170 (64.9%) |
| 6 or 7 Rooms | 55 (13.8%) | 47 (17.9%) |
| 8 or more Rooms | 13 (3.3%) | 0 (0.0%) |
| Total | 400 (100.0%) | 262 (100.0%) |
Housing Structure by Heating Type in Luis M Cintron
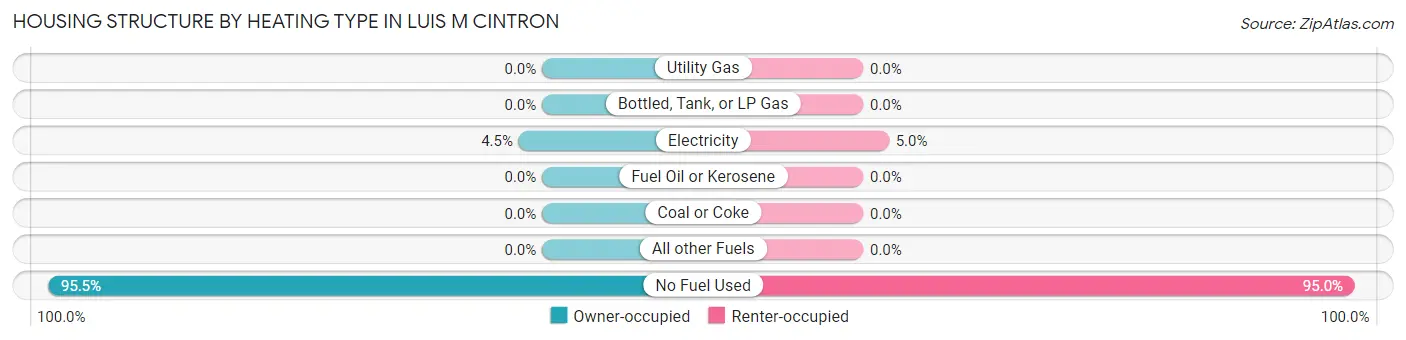
| Heating Type | Owner-occupied | Renter-occupied |
| Utility Gas | 0 (0.0%) | 0 (0.0%) |
| Bottled, Tank, or LP Gas | 0 (0.0%) | 0 (0.0%) |
| Electricity | 18 (4.5%) | 13 (5.0%) |
| Fuel Oil or Kerosene | 0 (0.0%) | 0 (0.0%) |
| Coal or Coke | 0 (0.0%) | 0 (0.0%) |
| All other Fuels | 0 (0.0%) | 0 (0.0%) |
| No Fuel Used | 382 (95.5%) | 249 (95.0%) |
| Total | 400 (100.0%) | 262 (100.0%) |
Household Vehicle Usage in Luis M Cintron
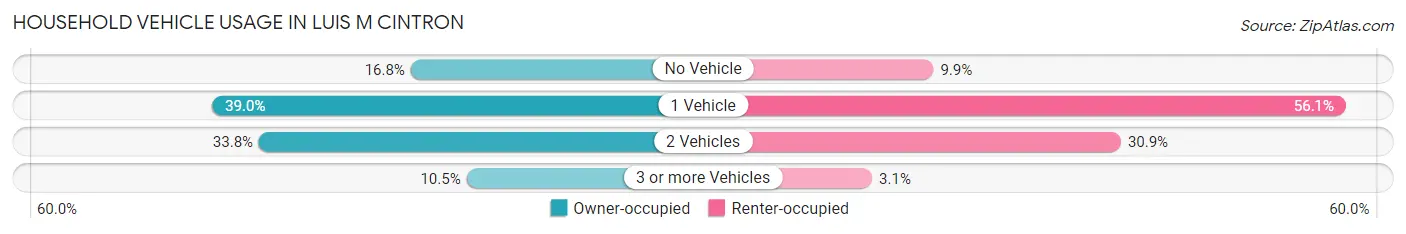
| Vehicles per Household | Owner-occupied | Renter-occupied |
| No Vehicle | 67 (16.8%) | 26 (9.9%) |
| 1 Vehicle | 156 (39.0%) | 147 (56.1%) |
| 2 Vehicles | 135 (33.8%) | 81 (30.9%) |
| 3 or more Vehicles | 42 (10.5%) | 8 (3.0%) |
| Total | 400 (100.0%) | 262 (100.0%) |
Real Estate & Mortgages in Luis M Cintron
Real Estate and Mortgage Overview in Luis M Cintron
| Characteristic | Without Mortgage | With Mortgage |
| Housing Units | 261 | 139 |
| Median Property Value | $65,500 | $98,200 |
| Median Household Income | $21,277 | $0 |
| Monthly Housing Costs | $149 | $0 |
| Real Estate Taxes | - | - |
Property Value by Mortgage Status in Luis M Cintron
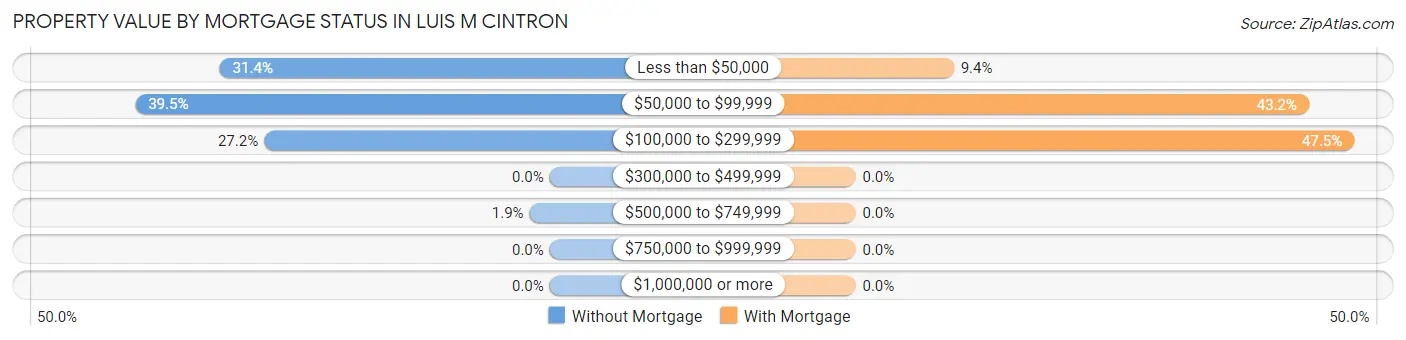
| Property Value | Without Mortgage | With Mortgage |
| Less than $50,000 | 82 (31.4%) | 13 (9.3%) |
| $50,000 to $99,999 | 103 (39.5%) | 60 (43.2%) |
| $100,000 to $299,999 | 71 (27.2%) | 66 (47.5%) |
| $300,000 to $499,999 | 0 (0.0%) | 0 (0.0%) |
| $500,000 to $749,999 | 5 (1.9%) | 0 (0.0%) |
| $750,000 to $999,999 | 0 (0.0%) | 0 (0.0%) |
| $1,000,000 or more | 0 (0.0%) | 0 (0.0%) |
| Total | 261 (100.0%) | 139 (100.0%) |
Household Income by Mortgage Status in Luis M Cintron
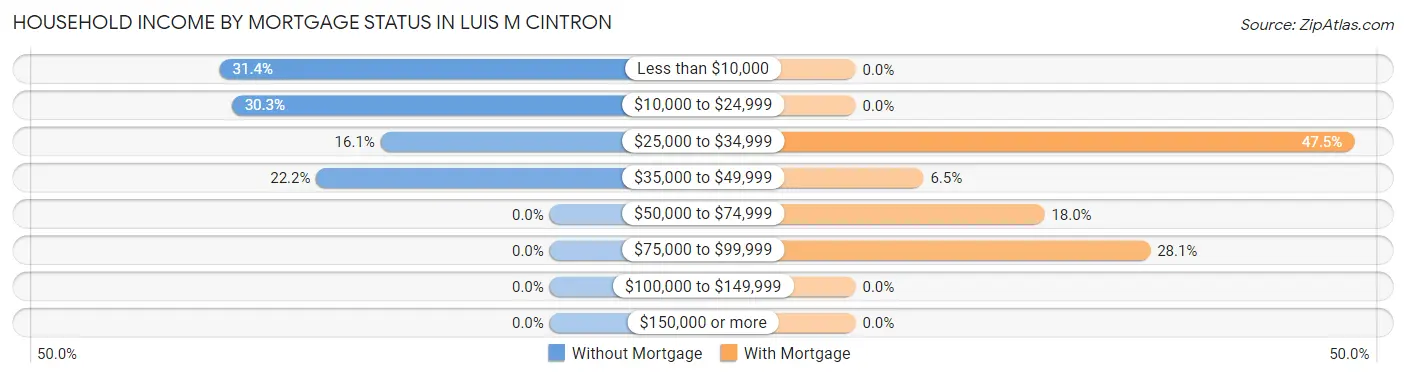
| Household Income | Without Mortgage | With Mortgage |
| Less than $10,000 | 82 (31.4%) | 0 (0.0%) |
| $10,000 to $24,999 | 79 (30.3%) | 0 (0.0%) |
| $25,000 to $34,999 | 42 (16.1%) | 66 (47.5%) |
| $35,000 to $49,999 | 58 (22.2%) | 9 (6.5%) |
| $50,000 to $74,999 | 0 (0.0%) | 25 (18.0%) |
| $75,000 to $99,999 | 0 (0.0%) | 39 (28.1%) |
| $100,000 to $149,999 | 0 (0.0%) | 0 (0.0%) |
| $150,000 or more | 0 (0.0%) | 0 (0.0%) |
| Total | 261 (100.0%) | 139 (100.0%) |
Property Value to Household Income Ratio in Luis M Cintron
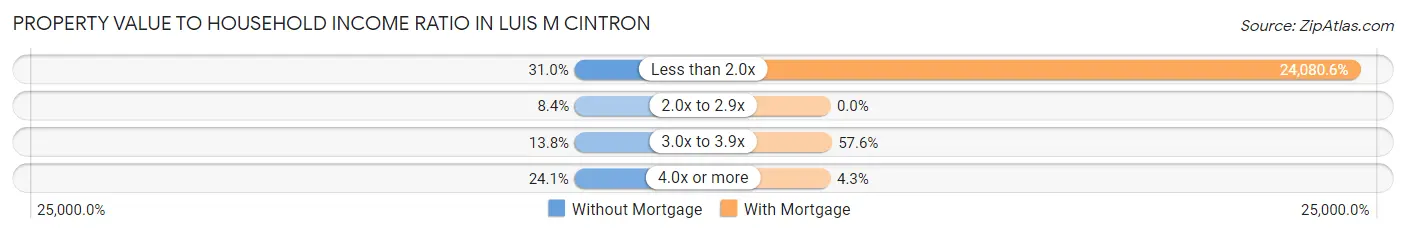
| Value-to-Income Ratio | Without Mortgage | With Mortgage |
| Less than 2.0x | 81 (31.0%) | 33,472 (24,080.6%) |
| 2.0x to 2.9x | 22 (8.4%) | 0 (0.0%) |
| 3.0x to 3.9x | 36 (13.8%) | 80 (57.6%) |
| 4.0x or more | 63 (24.1%) | 6 (4.3%) |
| Total | 261 (100.0%) | 139 (100.0%) |
Real Estate Taxes by Mortgage Status in Luis M Cintron
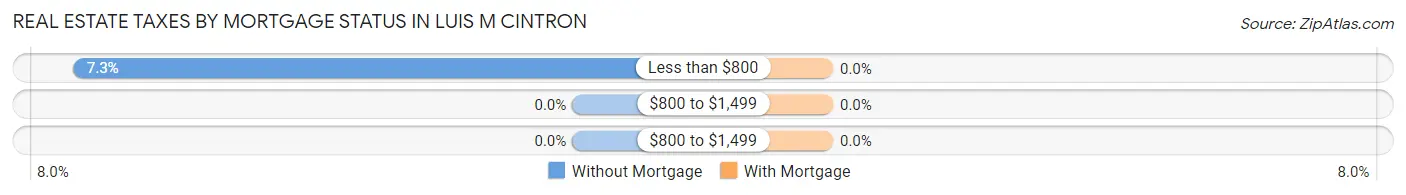
| Property Taxes | Without Mortgage | With Mortgage |
| Less than $800 | 19 (7.3%) | 0 (0.0%) |
| $800 to $1,499 | 0 (0.0%) | 0 (0.0%) |
| $800 to $1,499 | 0 (0.0%) | 0 (0.0%) |
| Total | 261 (100.0%) | 139 (100.0%) |
Health & Disability in Luis M Cintron
Health Insurance Coverage by Age in Luis M Cintron
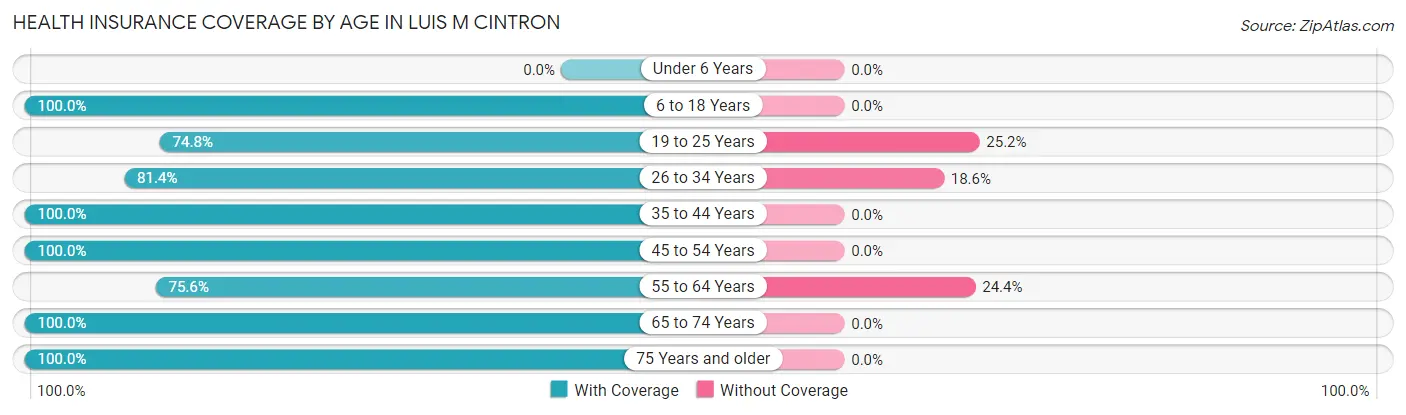
| Age Bracket | With Coverage | Without Coverage |
| Under 6 Years | 0 (0.0%) | 0 (0.0%) |
| 6 to 18 Years | 348 (100.0%) | 0 (0.0%) |
| 19 to 25 Years | 196 (74.8%) | 66 (25.2%) |
| 26 to 34 Years | 158 (81.4%) | 36 (18.6%) |
| 35 to 44 Years | 189 (100.0%) | 0 (0.0%) |
| 45 to 54 Years | 296 (100.0%) | 0 (0.0%) |
| 55 to 64 Years | 99 (75.6%) | 32 (24.4%) |
| 65 to 74 Years | 221 (100.0%) | 0 (0.0%) |
| 75 Years and older | 133 (100.0%) | 0 (0.0%) |
| Total | 1,640 (92.4%) | 134 (7.5%) |
Health Insurance Coverage by Citizenship Status in Luis M Cintron
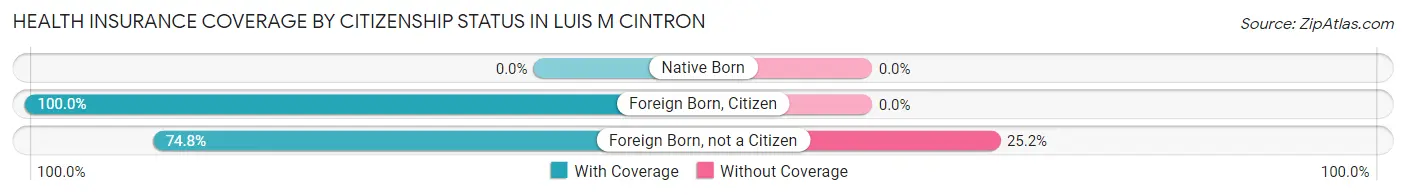
| Citizenship Status | With Coverage | Without Coverage |
| Native Born | 0 (0.0%) | 0 (0.0%) |
| Foreign Born, Citizen | 348 (100.0%) | 0 (0.0%) |
| Foreign Born, not a Citizen | 196 (74.8%) | 66 (25.2%) |
Health Insurance Coverage by Household Income in Luis M Cintron
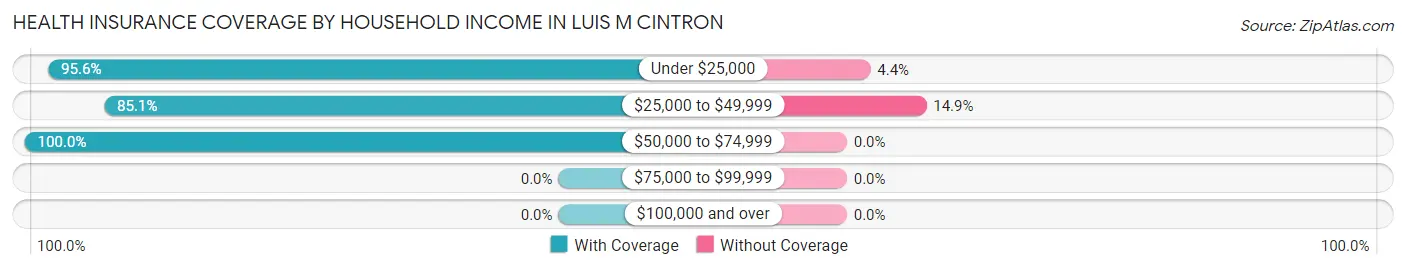
| Household Income | With Coverage | Without Coverage |
| Under $25,000 | 1,082 (95.6%) | 50 (4.4%) |
| $25,000 to $49,999 | 480 (85.1%) | 84 (14.9%) |
| $50,000 to $74,999 | 78 (100.0%) | 0 (0.0%) |
| $75,000 to $99,999 | 0 (0.0%) | 0 (0.0%) |
| $100,000 and over | 0 (0.0%) | 0 (0.0%) |
Public vs Private Health Insurance Coverage by Age in Luis M Cintron
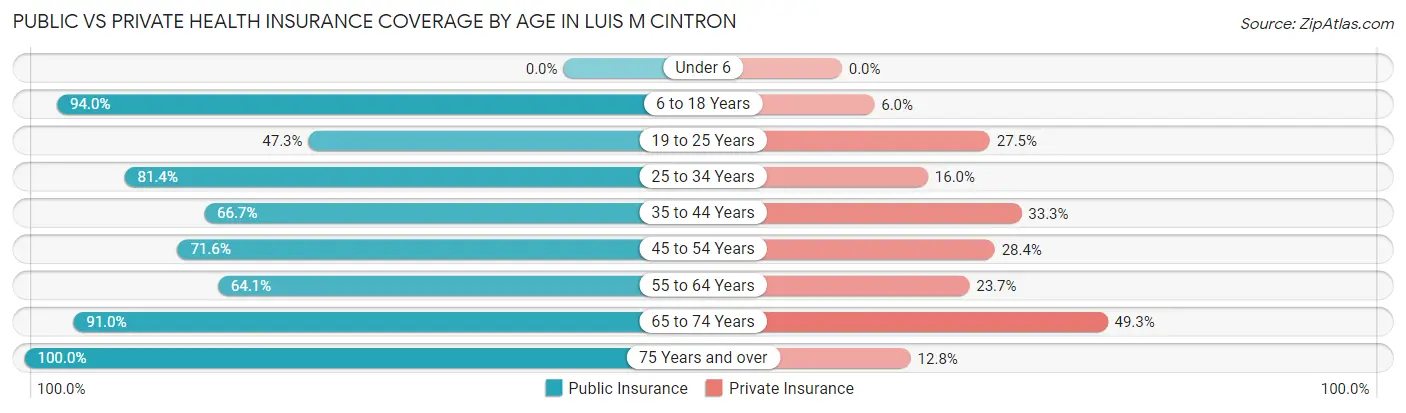
| Age Bracket | Public Insurance | Private Insurance |
| Under 6 | 0 (0.0%) | 0 (0.0%) |
| 6 to 18 Years | 327 (94.0%) | 21 (6.0%) |
| 19 to 25 Years | 124 (47.3%) | 72 (27.5%) |
| 25 to 34 Years | 158 (81.4%) | 31 (16.0%) |
| 35 to 44 Years | 126 (66.7%) | 63 (33.3%) |
| 45 to 54 Years | 212 (71.6%) | 84 (28.4%) |
| 55 to 64 Years | 84 (64.1%) | 31 (23.7%) |
| 65 to 74 Years | 201 (90.9%) | 109 (49.3%) |
| 75 Years and over | 133 (100.0%) | 17 (12.8%) |
| Total | 1,365 (76.9%) | 428 (24.1%) |
Disability Status by Sex by Age in Luis M Cintron
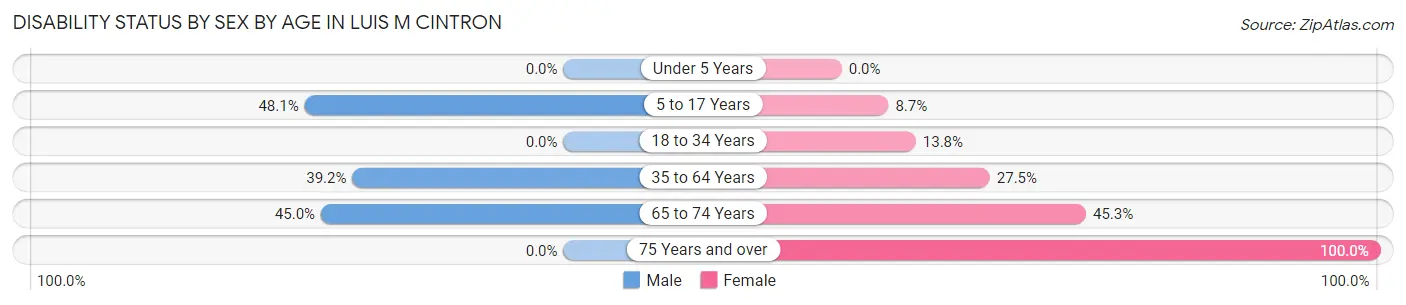
| Age Bracket | Male | Female |
| Under 5 Years | 0 (0.0%) | 0 (0.0%) |
| 5 to 17 Years | 74 (48.0%) | 15 (8.7%) |
| 18 to 34 Years | 0 (0.0%) | 37 (13.8%) |
| 35 to 64 Years | 123 (39.2%) | 83 (27.5%) |
| 65 to 74 Years | 27 (45.0%) | 73 (45.3%) |
| 75 Years and over | 0 (0.0%) | 64 (100.0%) |
Disability Class by Sex by Age in Luis M Cintron
Disability Class: Hearing Difficulty
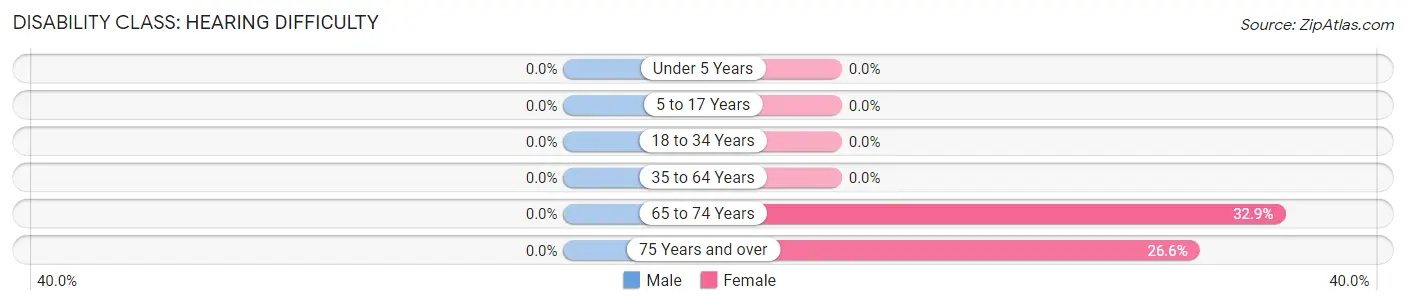
| Age Bracket | Male | Female |
| Under 5 Years | 0 (0.0%) | 0 (0.0%) |
| 5 to 17 Years | 0 (0.0%) | 0 (0.0%) |
| 18 to 34 Years | 0 (0.0%) | 0 (0.0%) |
| 35 to 64 Years | 0 (0.0%) | 0 (0.0%) |
| 65 to 74 Years | 0 (0.0%) | 53 (32.9%) |
| 75 Years and over | 0 (0.0%) | 17 (26.6%) |
Disability Class: Vision Difficulty
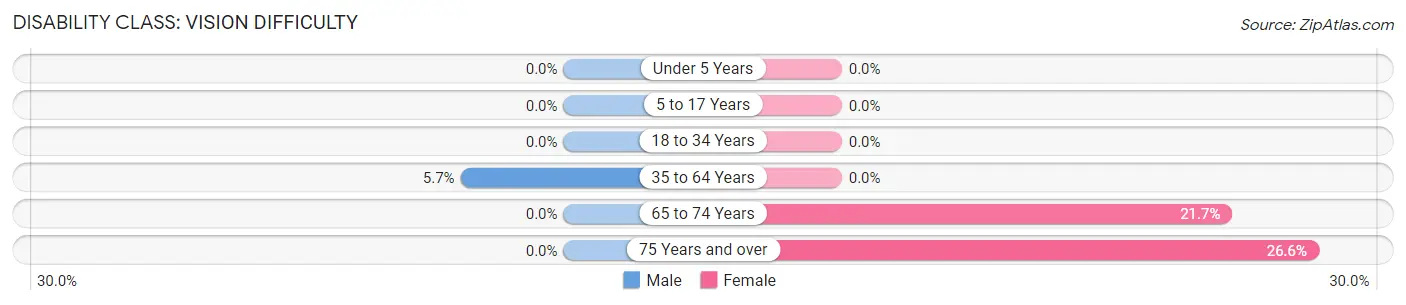
| Age Bracket | Male | Female |
| Under 5 Years | 0 (0.0%) | 0 (0.0%) |
| 5 to 17 Years | 0 (0.0%) | 0 (0.0%) |
| 18 to 34 Years | 0 (0.0%) | 0 (0.0%) |
| 35 to 64 Years | 18 (5.7%) | 0 (0.0%) |
| 65 to 74 Years | 0 (0.0%) | 35 (21.7%) |
| 75 Years and over | 0 (0.0%) | 17 (26.6%) |
Disability Class: Cognitive Difficulty
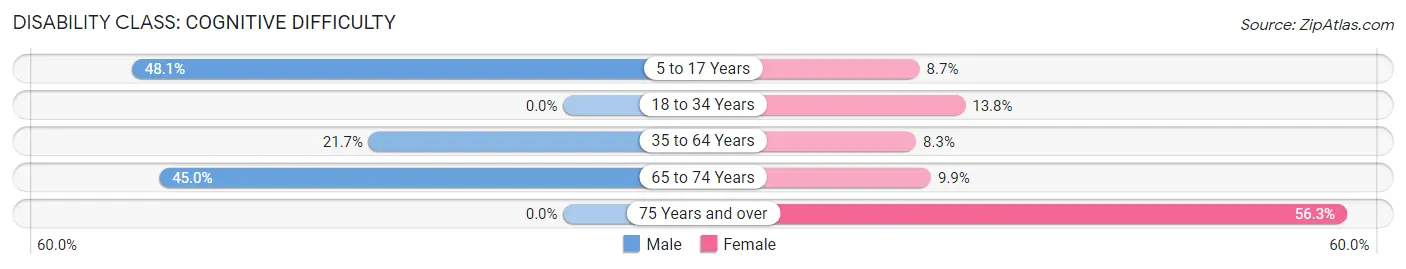
| Age Bracket | Male | Female |
| 5 to 17 Years | 74 (48.0%) | 15 (8.7%) |
| 18 to 34 Years | 0 (0.0%) | 37 (13.8%) |
| 35 to 64 Years | 68 (21.7%) | 25 (8.3%) |
| 65 to 74 Years | 27 (45.0%) | 16 (9.9%) |
| 75 Years and over | 0 (0.0%) | 36 (56.2%) |
Disability Class: Ambulatory Difficulty
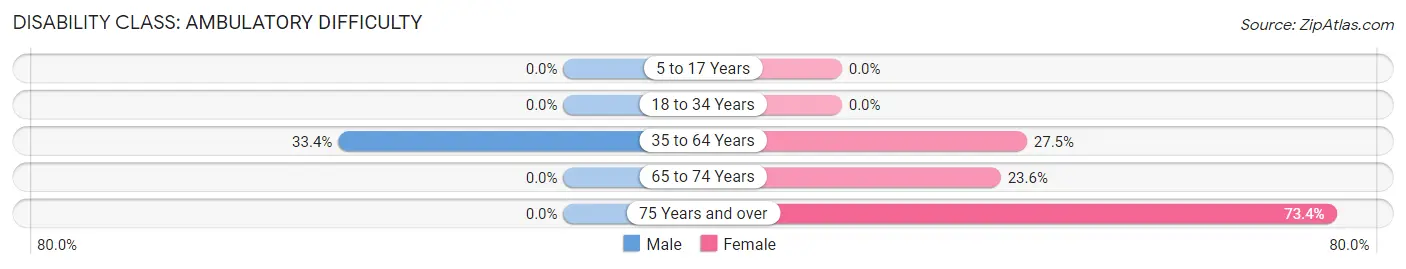
| Age Bracket | Male | Female |
| 5 to 17 Years | 0 (0.0%) | 0 (0.0%) |
| 18 to 34 Years | 0 (0.0%) | 0 (0.0%) |
| 35 to 64 Years | 105 (33.4%) | 83 (27.5%) |
| 65 to 74 Years | 0 (0.0%) | 38 (23.6%) |
| 75 Years and over | 0 (0.0%) | 47 (73.4%) |
Disability Class: Self-Care Difficulty
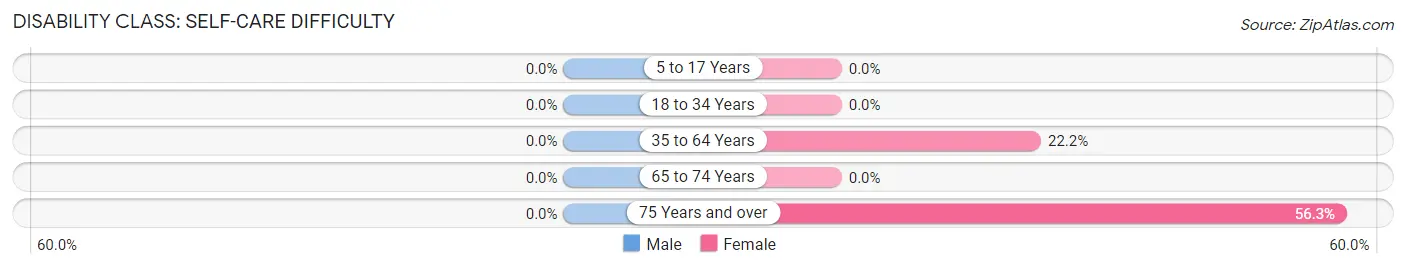
| Age Bracket | Male | Female |
| 5 to 17 Years | 0 (0.0%) | 0 (0.0%) |
| 18 to 34 Years | 0 (0.0%) | 0 (0.0%) |
| 35 to 64 Years | 0 (0.0%) | 67 (22.2%) |
| 65 to 74 Years | 0 (0.0%) | 0 (0.0%) |
| 75 Years and over | 0 (0.0%) | 36 (56.2%) |
Technology Access in Luis M Cintron
Computing Device Access in Luis M Cintron
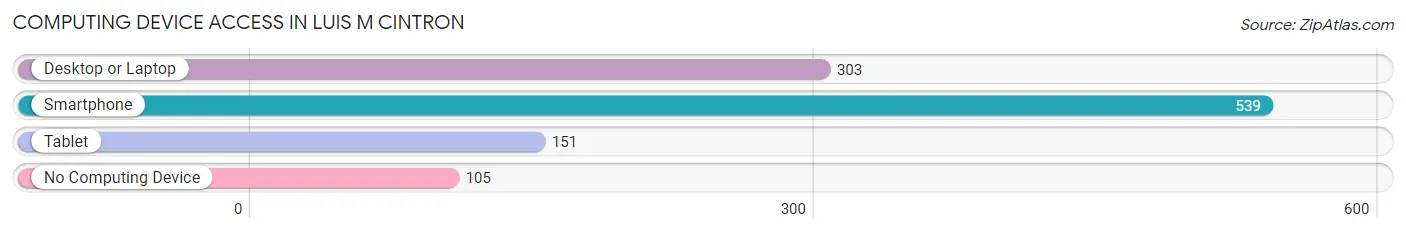
| Device Type | # Households | % Households |
| Desktop or Laptop | 303 | 45.8% |
| Smartphone | 539 | 81.4% |
| Tablet | 151 | 22.8% |
| No Computing Device | 105 | 15.9% |
| Total | 662 | 100.0% |
Internet Access in Luis M Cintron
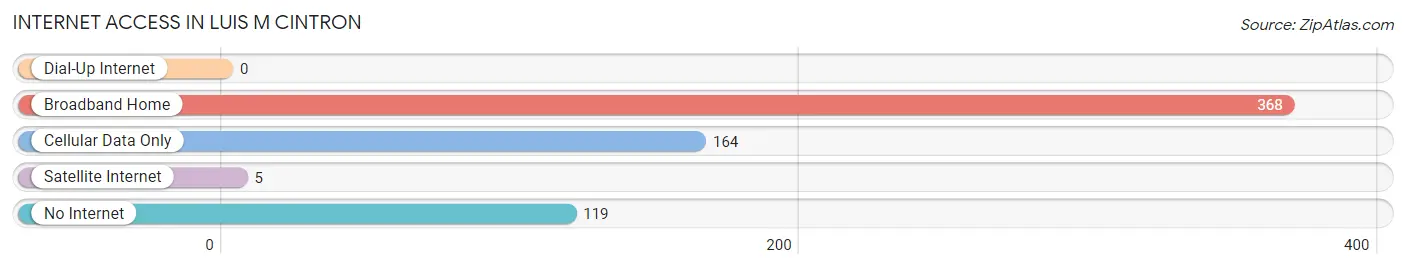
| Internet Type | # Households | % Households |
| Dial-Up Internet | 0 | 0.0% |
| Broadband Home | 368 | 55.6% |
| Cellular Data Only | 164 | 24.8% |
| Satellite Internet | 5 | 0.8% |
| No Internet | 119 | 18.0% |
| Total | 662 | 100.0% |
Luis M Cintron Summary
Puerto Rico is a Caribbean island located in the northeastern Caribbean Sea, east of the Dominican Republic and west of the Virgin Islands. It is a self-governing commonwealth of the United States, with a population of approximately 3.7 million people. Puerto Rico is a vibrant and diverse culture, with a rich history, geography, economy, and demographics.
History
Puerto Rico has a long and complex history, beginning with its first inhabitants, the Taíno people, who arrived on the island around 1000 AD. The Taíno were a peaceful people who lived in small villages and practiced agriculture. In 1493, Christopher Columbus arrived in Puerto Rico and claimed it for Spain. The Spanish began to colonize the island, bringing with them African slaves to work the plantations. The Spanish also introduced Catholicism to the island, which remains the predominant religion today.
In 1898, the Spanish-American War resulted in the United States taking control of Puerto Rico. The island became a U.S. territory, and the U.S. government began to implement a number of reforms, including the establishment of a public school system and the introduction of English as the official language. In 1952, Puerto Rico became a self-governing commonwealth of the United States.
Geography
Puerto Rico is an archipelago located in the northeastern Caribbean Sea. It is composed of the main island of Puerto Rico and several smaller islands, including Vieques, Culebra, and Mona. The main island is approximately 100 miles long and 35 miles wide, with a total area of 3,515 square miles. The terrain is mostly mountainous, with the highest peak, Cerro de Punta, reaching 4,390 feet. The climate is tropical, with temperatures ranging from the mid-70s to the mid-80s year-round.
Economy
Puerto Rico’s economy is largely based on tourism, manufacturing, and services. The island is home to a number of large multinational corporations, including pharmaceutical companies, banks, and technology companies. The government also plays an important role in the economy, providing jobs and services to the population.
The island’s main exports are pharmaceuticals, electronics, and apparel. Tourism is also an important part of the economy, with millions of visitors coming to the island each year to enjoy its beaches, culture, and history.
Demographics
Puerto Rico is a diverse and multicultural society. The population is approximately 3.7 million people, with the majority of the population being of Hispanic or Latino descent. Spanish is the official language, although English is also widely spoken. The majority of the population is Roman Catholic, although there are also a number of other religious denominations represented.
Puerto Rico has a high rate of poverty, with approximately 45% of the population living below the poverty line. The unemployment rate is also high, at around 11%. Despite these challenges, Puerto Rico has a vibrant culture and a strong sense of national identity.
Common Questions
What is Per Capita Income in Luis M Cintron?
Per Capita income in Luis M Cintron is $8,848.
What is the Median Family Income in Luis M Cintron?
Median Family Income in Luis M Cintron is $18,778.
What is the Median Household income in Luis M Cintron?
Median Household Income in Luis M Cintron is $19,593.
What is Income or Wage Gap in Luis M Cintron?
Income or Wage Gap in Luis M Cintron is 10.5%.
Women in Luis M Cintron earn 89.5 cents for every dollar earned by a man.
What is Family Income Deficit in Luis M Cintron?
Family Income Deficit in Luis M Cintron is $10,066.
Families that are below poverty line in Luis M Cintron earn $10,066 less on average than the poverty threshold level.
What is Inequality or Gini Index in Luis M Cintron?
Inequality or Gini Index in Luis M Cintron is 0.41.
What is the Total Population of Luis M Cintron?
Total Population of Luis M Cintron is 1,774.
What is the Total Male Population of Luis M Cintron?
Total Male Population of Luis M Cintron is 805.
What is the Total Female Population of Luis M Cintron?
Total Female Population of Luis M Cintron is 969.
What is the Ratio of Males per 100 Females in Luis M Cintron?
There are 83.08 Males per 100 Females in Luis M Cintron.
What is the Ratio of Females per 100 Males in Luis M Cintron?
There are 120.37 Females per 100 Males in Luis M Cintron.
What is the Median Population Age in Luis M Cintron?
Median Population Age in Luis M Cintron is 37.6 Years.
What is the Average Family Size in Luis M Cintron
Average Family Size in Luis M Cintron is 3.1 People.
What is the Average Household Size in Luis M Cintron
Average Household Size in Luis M Cintron is 2.7 People.
How Large is the Labor Force in Luis M Cintron?
There are 676 People in the Labor Forcein in Luis M Cintron.
What is the Percentage of People in the Labor Force in Luis M Cintron?
45.8% of People are in the Labor Force in Luis M Cintron.
What is the Unemployment Rate in Luis M Cintron?
Unemployment Rate in Luis M Cintron is 21.9%.