Las Carolinas, PR Map & Demographics
Las Carolinas Map
Las Carolinas Overview
$10,516
PER CAPITA INCOME
$22,813
AVG FAMILY INCOME
$19,355
AVG HOUSEHOLD INCOME
0.42
INEQUALITY / GINI INDEX
1,838
TOTAL POPULATION
883
MALE POPULATION
955
FEMALE POPULATION
92.46
MALES / 100 FEMALES
108.15
FEMALES / 100 MALES
40.0
MEDIAN AGE
3.0
AVG FAMILY SIZE
2.8
AVG HOUSEHOLD SIZE
804
LABOR FORCE [ PEOPLE ]
52.2%
PERCENT IN LABOR FORCE
23.9%
UNEMPLOYMENT RATE
Income in Las Carolinas
Income Overview in Las Carolinas
Per Capita Income in Las Carolinas is $10,516, while median incomes of families and households are $22,813 and $19,355 respectively.
| Characteristic | Number | Measure |
| Per Capita Income | 1,838 | $10,516 |
| Median Family Income | 508 | $22,813 |
| Mean Family Income | 508 | $28,102 |
| Median Household Income | 668 | $19,355 |
| Mean Household Income | 668 | $26,108 |
| Income Deficit | 508 | $0 |
| Wage / Income Gap (%) | 1,838 | 0.00% |
| Wage / Income Gap ($) | 1,838 | 100.00¢ per $1 |
| Gini / Inequality Index | 1,838 | 0.42 |
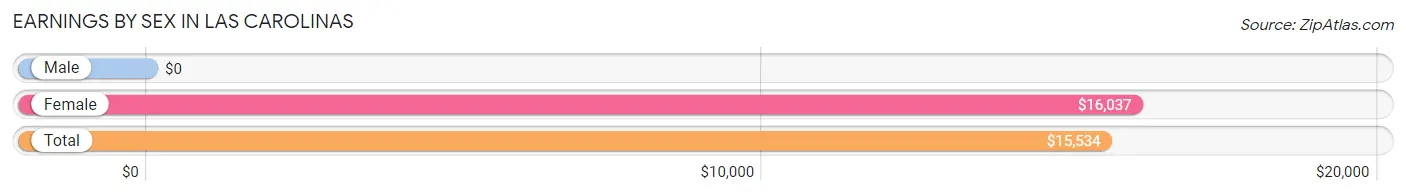
Earnings by Sex in Las Carolinas
| Sex | Number | Average Earnings |
| Male | 365 (48.2%) | $0 |
| Female | 392 (51.8%) | $16,037 |
| Total | 757 (100.0%) | $15,534 |
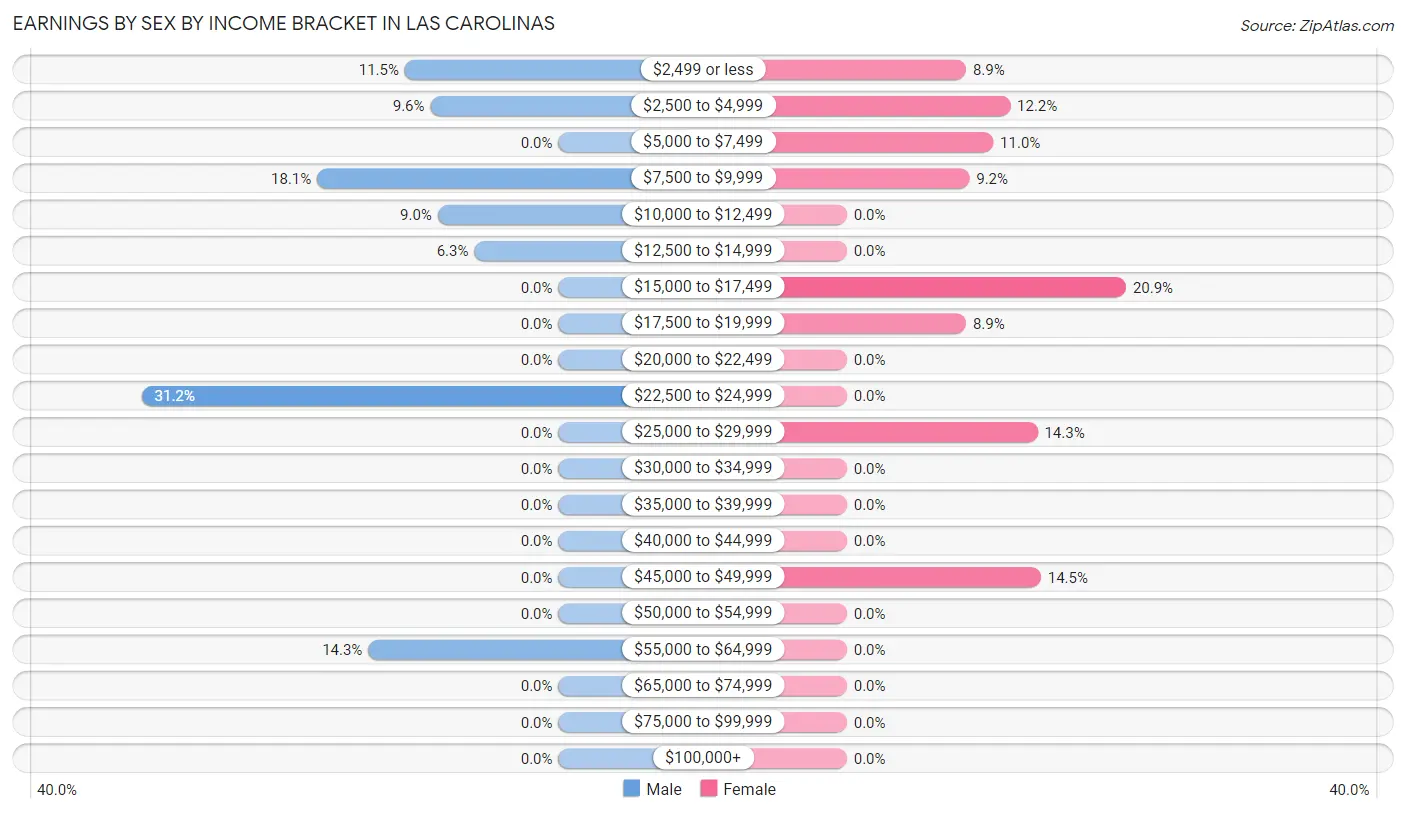
Earnings by Sex by Income Bracket in Las Carolinas
The most common earnings brackets in Las Carolinas are $22,500 to $24,999 for men (114 | 31.2%) and $15,000 to $17,499 for women (82 | 20.9%).
| Income | Male | Female |
| $2,499 or less | 42 (11.5%) | 35 (8.9%) |
| $2,500 to $4,999 | 35 (9.6%) | 48 (12.2%) |
| $5,000 to $7,499 | 0 (0.0%) | 43 (11.0%) |
| $7,500 to $9,999 | 66 (18.1%) | 36 (9.2%) |
| $10,000 to $12,499 | 33 (9.0%) | 0 (0.0%) |
| $12,500 to $14,999 | 23 (6.3%) | 0 (0.0%) |
| $15,000 to $17,499 | 0 (0.0%) | 82 (20.9%) |
| $17,500 to $19,999 | 0 (0.0%) | 35 (8.9%) |
| $20,000 to $22,499 | 0 (0.0%) | 0 (0.0%) |
| $22,500 to $24,999 | 114 (31.2%) | 0 (0.0%) |
| $25,000 to $29,999 | 0 (0.0%) | 56 (14.3%) |
| $30,000 to $34,999 | 0 (0.0%) | 0 (0.0%) |
| $35,000 to $39,999 | 0 (0.0%) | 0 (0.0%) |
| $40,000 to $44,999 | 0 (0.0%) | 0 (0.0%) |
| $45,000 to $49,999 | 0 (0.0%) | 57 (14.5%) |
| $50,000 to $54,999 | 0 (0.0%) | 0 (0.0%) |
| $55,000 to $64,999 | 52 (14.2%) | 0 (0.0%) |
| $65,000 to $74,999 | 0 (0.0%) | 0 (0.0%) |
| $75,000 to $99,999 | 0 (0.0%) | 0 (0.0%) |
| $100,000+ | 0 (0.0%) | 0 (0.0%) |
| Total | 365 (100.0%) | 392 (100.0%) |
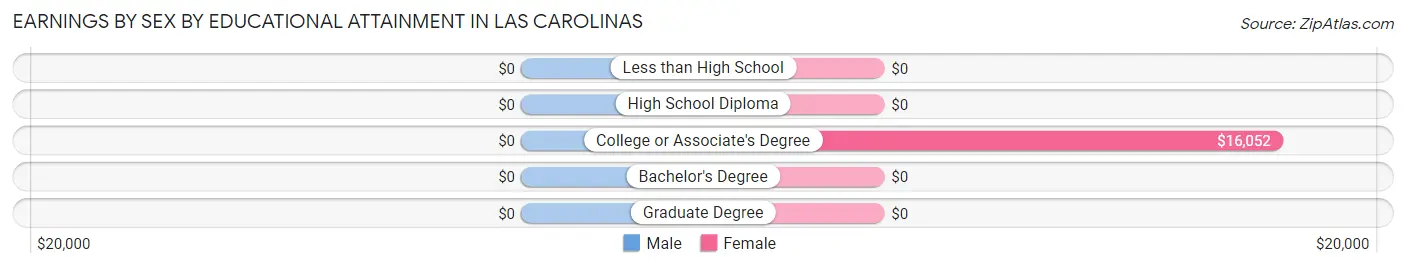
Earnings by Sex by Educational Attainment in Las Carolinas
| Educational Attainment | Male Income | Female Income |
| Less than High School | - | - |
| High School Diploma | - | - |
| College or Associate's Degree | - | - |
| Bachelor's Degree | - | - |
| Graduate Degree | - | - |
| Total | - | - |
Family Income in Las Carolinas
Family Income Brackets in Las Carolinas
According to the Las Carolinas family income data, there are 143 families falling into the less than $10,000 income range, which is the most common income bracket and makes up 28.1% of all families.
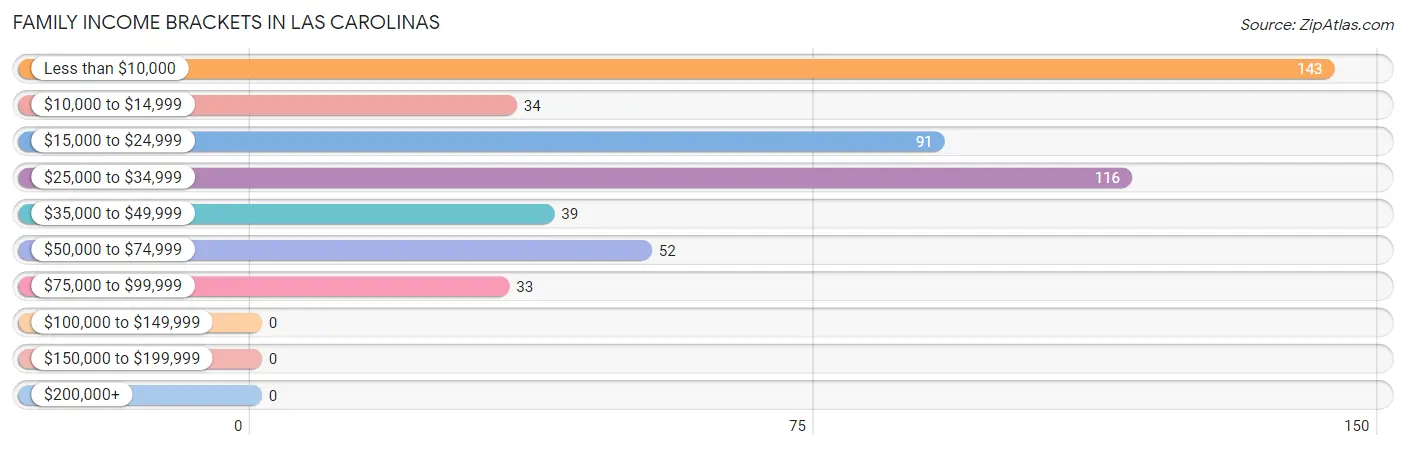
| Income Bracket | # Families | % Families |
| Less than $10,000 | 143 | 28.1% |
| $10,000 to $14,999 | 34 | 6.7% |
| $15,000 to $24,999 | 91 | 17.9% |
| $25,000 to $34,999 | 116 | 22.8% |
| $35,000 to $49,999 | 39 | 7.7% |
| $50,000 to $74,999 | 52 | 10.2% |
| $75,000 to $99,999 | 33 | 6.5% |
| $100,000 to $149,999 | 0 | 0.0% |
| $150,000 to $199,999 | 0 | 0.0% |
| $200,000+ | 0 | 0.0% |
Family Income by Famaliy Size in Las Carolinas
2-person families (312 | 61.4%) account for the highest median family income in Las Carolinas with $24,844 per family, while 2-person families (312 | 61.4%) have the highest median income of $12,422 per family member.
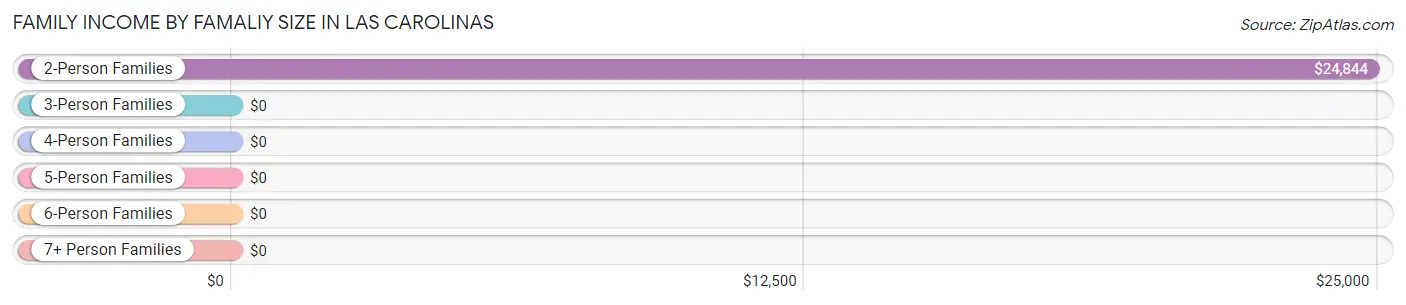
| Income Bracket | # Families | Median Income |
| 2-Person Families | 312 (61.4%) | $24,844 |
| 3-Person Families | 33 (6.5%) | $0 |
| 4-Person Families | 163 (32.1%) | $0 |
| 5-Person Families | 0 (0.0%) | $0 |
| 6-Person Families | 0 (0.0%) | $0 |
| 7+ Person Families | 0 (0.0%) | $0 |
| Total | 508 (100.0%) | $22,813 |
Family Income by Number of Earners in Las Carolinas
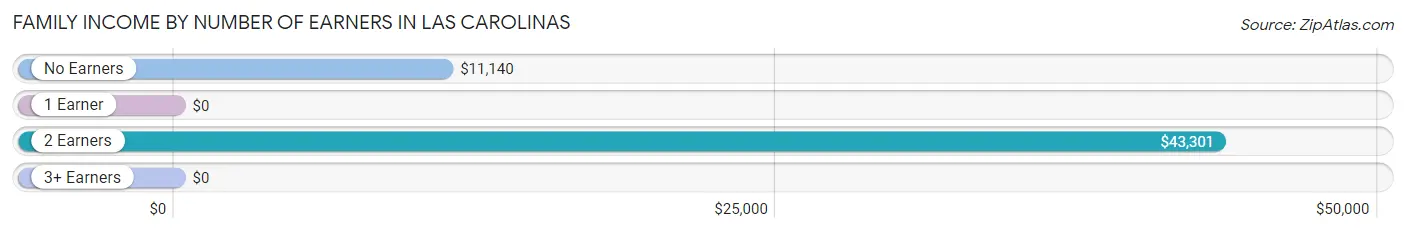
| Number of Earners | # Families | Median Income |
| No Earners | 157 (30.9%) | $11,140 |
| 1 Earner | 128 (25.2%) | $0 |
| 2 Earners | 223 (43.9%) | $43,301 |
| 3+ Earners | 0 (0.0%) | $0 |
| Total | 508 (100.0%) | $22,813 |
Household Income in Las Carolinas
Household Income Brackets in Las Carolinas
With 178 households falling in the category, the $15,000 to $24,999 income range is the most frequent in Las Carolinas, accounting for 26.7% of all households.
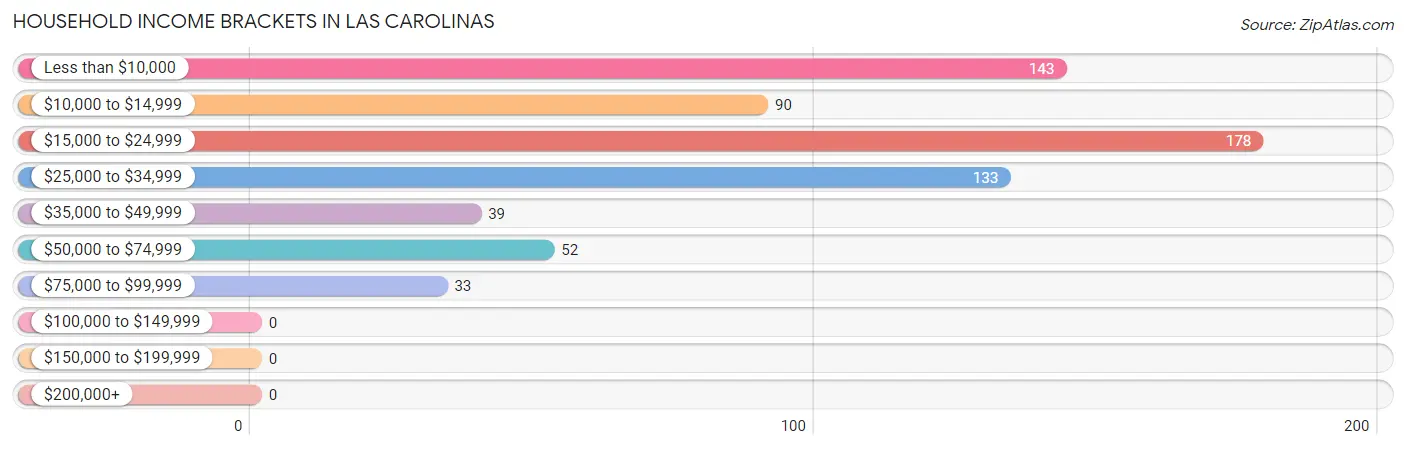
| Income Bracket | # Households | % Households |
| Less than $10,000 | 143 | 21.4% |
| $10,000 to $14,999 | 90 | 13.5% |
| $15,000 to $24,999 | 178 | 26.6% |
| $25,000 to $34,999 | 133 | 19.9% |
| $35,000 to $49,999 | 39 | 5.8% |
| $50,000 to $74,999 | 52 | 7.8% |
| $75,000 to $99,999 | 33 | 4.9% |
| $100,000 to $149,999 | 0 | 0.0% |
| $150,000 to $199,999 | 0 | 0.0% |
| $200,000+ | 0 | 0.0% |
Household Income by Householder Age in Las Carolinas
The median household income in Las Carolinas is $19,355, with the highest median household income of $24,316 found in the 45 to 64 years age bracket for the primary householder. A total of 283 households (42.4%) fall into this category.
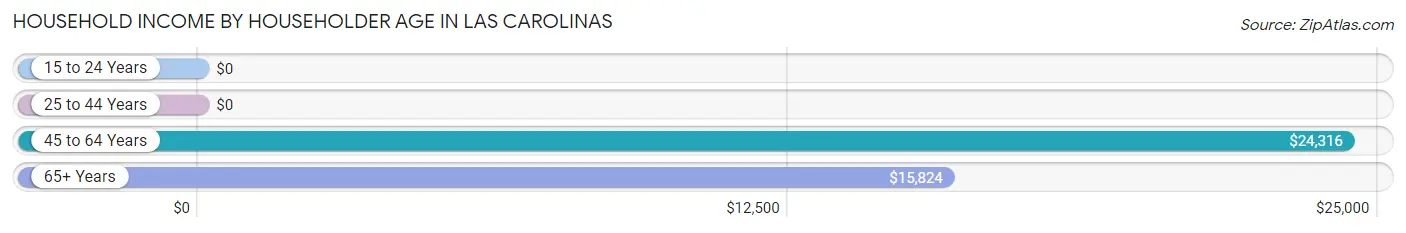
| Income Bracket | # Households | Median Income |
| 15 to 24 Years | 0 (0.0%) | $0 |
| 25 to 44 Years | 194 (29.0%) | $0 |
| 45 to 64 Years | 283 (42.4%) | $24,316 |
| 65+ Years | 191 (28.6%) | $15,824 |
| Total | 668 (100.0%) | $19,355 |
Poverty in Las Carolinas
Income Below Poverty by Sex and Age in Las Carolinas
With 59.5% poverty level for males and 55.1% for females among the residents of Las Carolinas, under 5 year old males and under 5 year old females are the most vulnerable to poverty, with 134 males (100.0%) and 45 females (100.0%) in their respective age groups living below the poverty level.
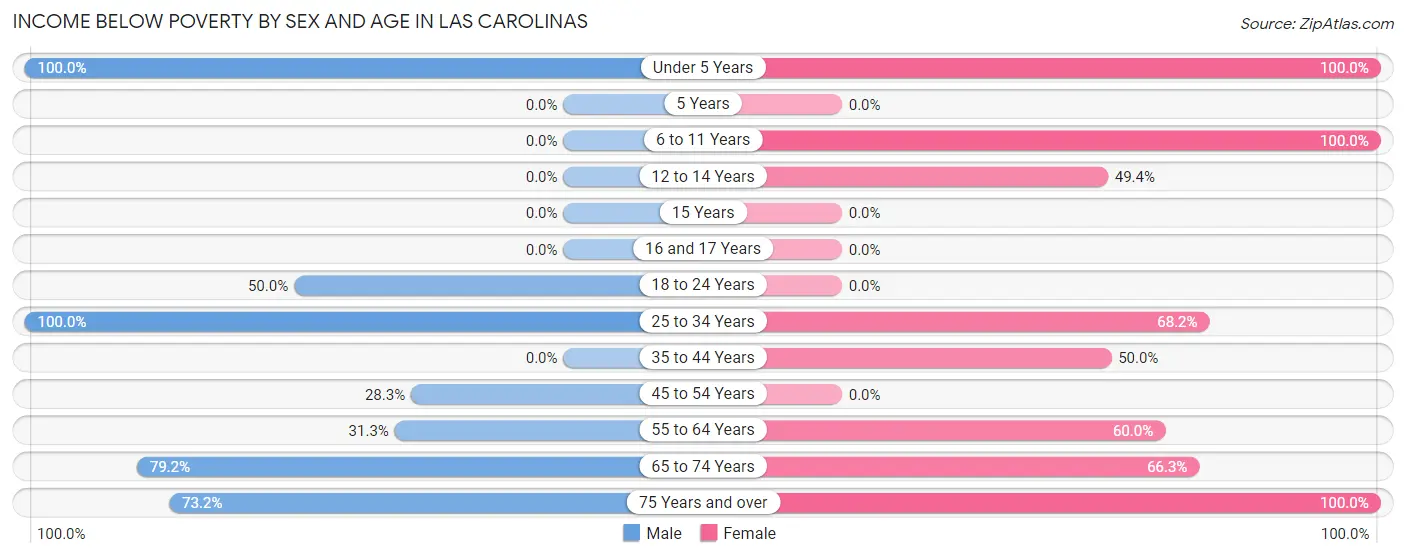
| Age Bracket | Male | Female |
| Under 5 Years | 134 (100.0%) | 45 (100.0%) |
| 5 Years | 0 (0.0%) | 0 (0.0%) |
| 6 to 11 Years | 0 (0.0%) | 39 (100.0%) |
| 12 to 14 Years | 0 (0.0%) | 39 (49.4%) |
| 15 Years | 0 (0.0%) | 0 (0.0%) |
| 16 and 17 Years | 0 (0.0%) | 0 (0.0%) |
| 18 to 24 Years | 58 (50.0%) | 0 (0.0%) |
| 25 to 34 Years | 114 (100.0%) | 176 (68.2%) |
| 35 to 44 Years | 0 (0.0%) | 57 (50.0%) |
| 45 to 54 Years | 41 (28.3%) | 0 (0.0%) |
| 55 to 64 Years | 31 (31.3%) | 78 (60.0%) |
| 65 to 74 Years | 57 (79.2%) | 65 (66.3%) |
| 75 Years and over | 90 (73.2%) | 27 (100.0%) |
| Total | 525 (59.5%) | 526 (55.1%) |
Income Above Poverty by Sex and Age in Las Carolinas
According to the poverty statistics in Las Carolinas, males aged 35 to 44 years and females aged 18 to 24 years are the age groups that are most secure financially, with 100.0% of males and 100.0% of females in these age groups living above the poverty line.
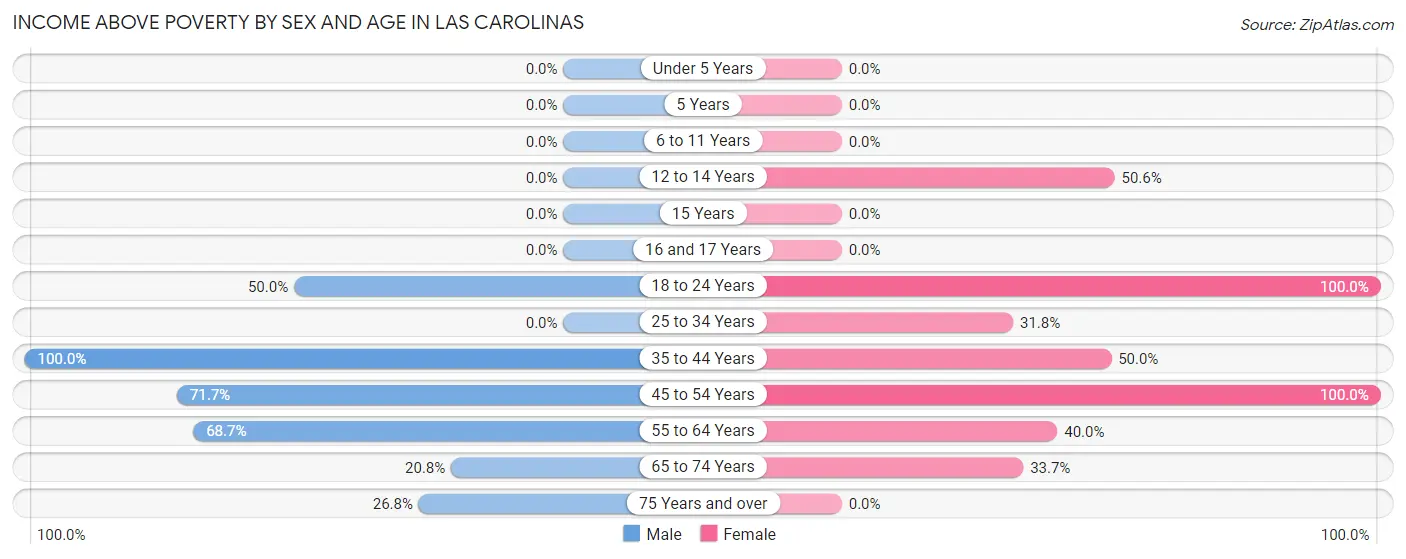
| Age Bracket | Male | Female |
| Under 5 Years | 0 (0.0%) | 0 (0.0%) |
| 5 Years | 0 (0.0%) | 0 (0.0%) |
| 6 to 11 Years | 0 (0.0%) | 0 (0.0%) |
| 12 to 14 Years | 0 (0.0%) | 40 (50.6%) |
| 15 Years | 0 (0.0%) | 0 (0.0%) |
| 16 and 17 Years | 0 (0.0%) | 0 (0.0%) |
| 18 to 24 Years | 58 (50.0%) | 47 (100.0%) |
| 25 to 34 Years | 0 (0.0%) | 82 (31.8%) |
| 35 to 44 Years | 80 (100.0%) | 57 (50.0%) |
| 45 to 54 Years | 104 (71.7%) | 118 (100.0%) |
| 55 to 64 Years | 68 (68.7%) | 52 (40.0%) |
| 65 to 74 Years | 15 (20.8%) | 33 (33.7%) |
| 75 Years and over | 33 (26.8%) | 0 (0.0%) |
| Total | 358 (40.5%) | 429 (44.9%) |
Income Below Poverty Among Married-Couple Families in Las Carolinas
The poverty statistics for married-couple families in Las Carolinas show that 57.4% or 187 of the total 326 families live below the poverty line. Families with 1 or 2 children have the highest poverty rate of 100.0%, comprising of 80 families. On the other hand, families with no children have the lowest poverty rate of 43.5%, which includes 107 families.
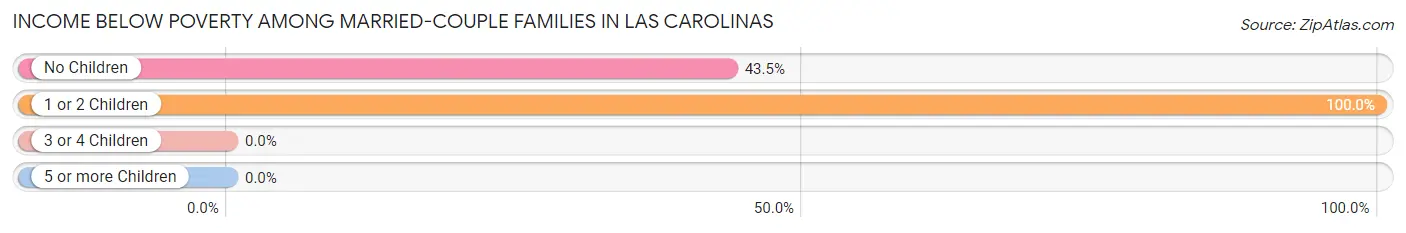
| Children | Above Poverty | Below Poverty |
| No Children | 139 (56.5%) | 107 (43.5%) |
| 1 or 2 Children | 0 (0.0%) | 80 (100.0%) |
| 3 or 4 Children | 0 (0.0%) | 0 (0.0%) |
| 5 or more Children | 0 (0.0%) | 0 (0.0%) |
| Total | 139 (42.6%) | 187 (57.4%) |
Income Below Poverty Among Single-Parent Households in Las Carolinas
According to the poverty data in Las Carolinas, 35.8% or 34 single-father households and 35.6% or 31 single-mother households are living below the poverty line. Among single-father households, those with 1 or 2 children have the highest poverty rate, with 34 households (50.7%) experiencing poverty. Likewise, among single-mother households, those with 1 or 2 children have the highest poverty rate, with 31 households (100.0%) falling below the poverty line.
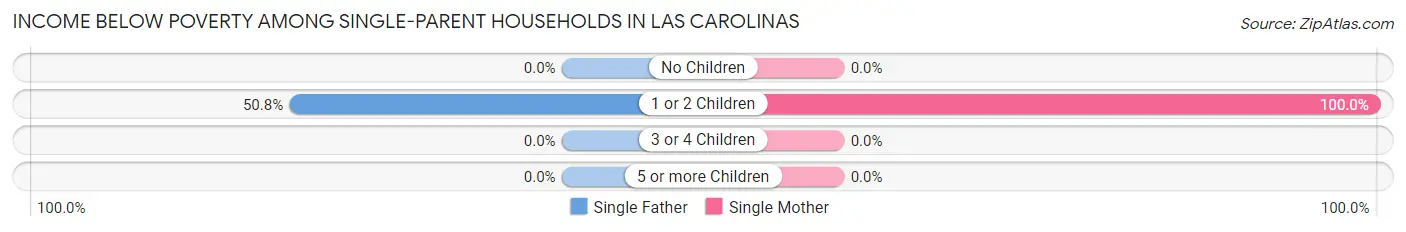
| Children | Single Father | Single Mother |
| No Children | 0 (0.0%) | 0 (0.0%) |
| 1 or 2 Children | 34 (50.7%) | 31 (100.0%) |
| 3 or 4 Children | 0 (0.0%) | 0 (0.0%) |
| 5 or more Children | 0 (0.0%) | 0 (0.0%) |
| Total | 34 (35.8%) | 31 (35.6%) |
Income Below Poverty Among Married-Couple vs Single-Parent Households in Las Carolinas
The poverty data for Las Carolinas shows that 187 of the married-couple family households (57.4%) and 65 of the single-parent households (35.7%) are living below the poverty level. Within the married-couple family households, those with 1 or 2 children have the highest poverty rate, with 80 households (100.0%) falling below the poverty line. Among the single-parent households, those with 1 or 2 children have the highest poverty rate, with 65 household (66.3%) living below poverty.
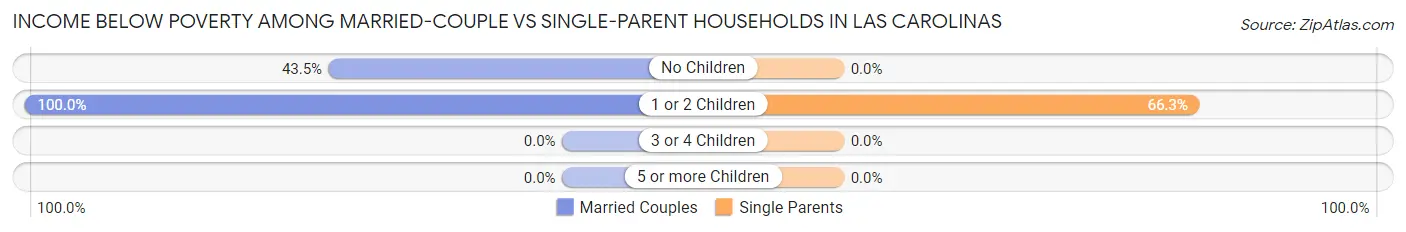
| Children | Married-Couple Families | Single-Parent Households |
| No Children | 107 (43.5%) | 0 (0.0%) |
| 1 or 2 Children | 80 (100.0%) | 65 (66.3%) |
| 3 or 4 Children | 0 (0.0%) | 0 (0.0%) |
| 5 or more Children | 0 (0.0%) | 0 (0.0%) |
| Total | 187 (57.4%) | 65 (35.7%) |
Race in Las Carolinas
The most populous races in Las Carolinas are Hispanic or Latino (1,723 | 93.7%), Some other Race (889 | 48.4%), and White / Caucasian (529 | 28.8%).
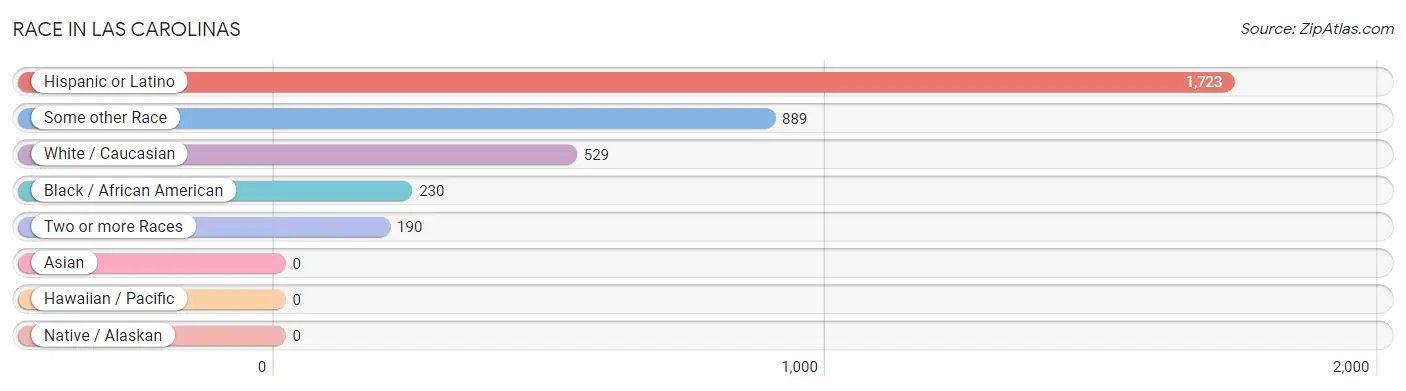
| Race | # Population | % Population |
| Asian | 0 | 0.0% |
| Black / African American | 230 | 12.5% |
| Hawaiian / Pacific | 0 | 0.0% |
| Hispanic or Latino | 1,723 | 93.7% |
| Native / Alaskan | 0 | 0.0% |
| White / Caucasian | 529 | 28.8% |
| Two or more Races | 190 | 10.3% |
| Some other Race | 889 | 48.4% |
| Total | 1,838 | 100.0% |
Ancestry in Las Carolinas
The most populous ancestries reported in Las Carolinas are , and Puerto Rican (1,723 | 93.7%), together accounting for 93.7% of all Las Carolinas residents.

| Ancestry | # Population | % Population |
| Puerto Rican | 1,723 | 93.7% | View All 1 Rows |
Immigrants in Las Carolinas

| Immigration Origin | # Population | % Population | View All 0 Rows |
Sex and Age in Las Carolinas
Sex and Age in Las Carolinas
The most populous age groups in Las Carolinas are Under 5 Years (134 | 15.2%) for men and 25 to 29 Years (134 | 14.0%) for women.
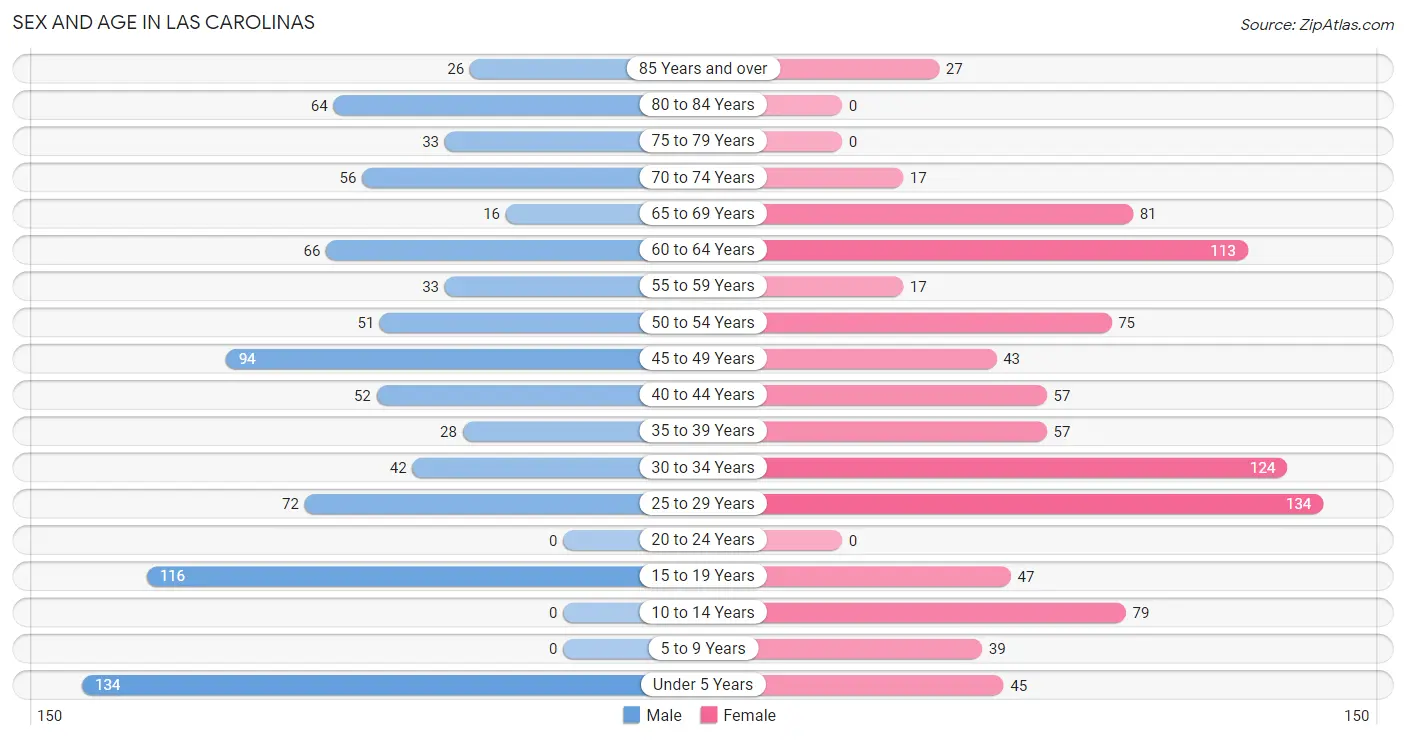
| Age Bracket | Male | Female |
| Under 5 Years | 134 (15.2%) | 45 (4.7%) |
| 5 to 9 Years | 0 (0.0%) | 39 (4.1%) |
| 10 to 14 Years | 0 (0.0%) | 79 (8.3%) |
| 15 to 19 Years | 116 (13.1%) | 47 (4.9%) |
| 20 to 24 Years | 0 (0.0%) | 0 (0.0%) |
| 25 to 29 Years | 72 (8.2%) | 134 (14.0%) |
| 30 to 34 Years | 42 (4.8%) | 124 (13.0%) |
| 35 to 39 Years | 28 (3.2%) | 57 (6.0%) |
| 40 to 44 Years | 52 (5.9%) | 57 (6.0%) |
| 45 to 49 Years | 94 (10.6%) | 43 (4.5%) |
| 50 to 54 Years | 51 (5.8%) | 75 (7.9%) |
| 55 to 59 Years | 33 (3.7%) | 17 (1.8%) |
| 60 to 64 Years | 66 (7.5%) | 113 (11.8%) |
| 65 to 69 Years | 16 (1.8%) | 81 (8.5%) |
| 70 to 74 Years | 56 (6.3%) | 17 (1.8%) |
| 75 to 79 Years | 33 (3.7%) | 0 (0.0%) |
| 80 to 84 Years | 64 (7.2%) | 0 (0.0%) |
| 85 Years and over | 26 (2.9%) | 27 (2.8%) |
| Total | 883 (100.0%) | 955 (100.0%) |
Families and Households in Las Carolinas
Median Family Size in Las Carolinas
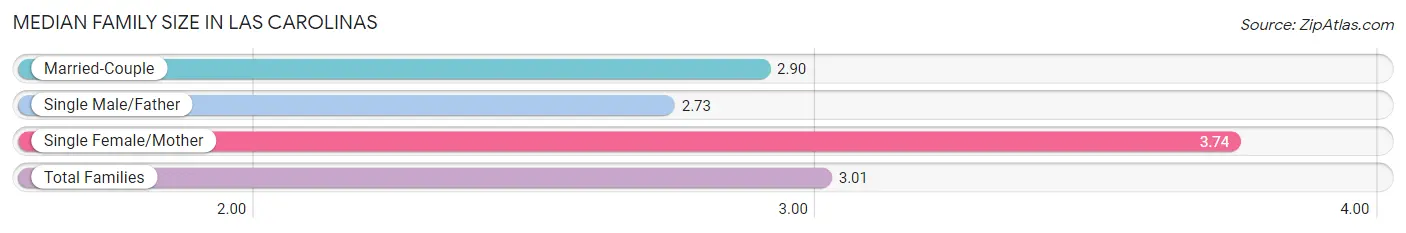
The median family size in Las Carolinas is 3.01 persons per family, with single female/mother families (87 | 17.1%) accounting for the largest median family size of 3.74 persons per family. On the other hand, single male/father families (95 | 18.7%) represent the smallest median family size with 2.73 persons per family.
| Family Type | # Families | Family Size |
| Married-Couple | 326 (64.2%) | 2.90 |
| Single Male/Father | 95 (18.7%) | 2.73 |
| Single Female/Mother | 87 (17.1%) | 3.74 |
| Total Families | 508 (100.0%) | 3.01 |
Median Household Size in Las Carolinas
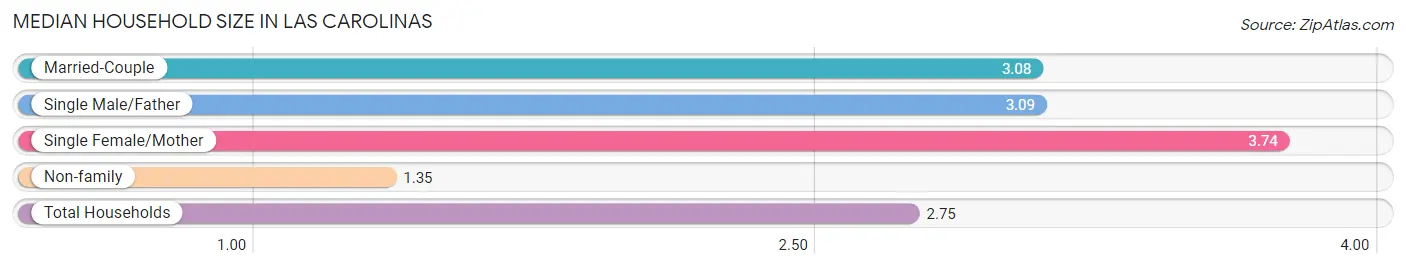
The median household size in Las Carolinas is 2.75 persons per household, with single female/mother households (87 | 13.0%) accounting for the largest median household size of 3.74 persons per household. non-family households (160 | 23.9%) represent the smallest median household size with 1.35 persons per household.
| Household Type | # Households | Household Size |
| Married-Couple | 326 (48.8%) | 3.08 |
| Single Male/Father | 95 (14.2%) | 3.09 |
| Single Female/Mother | 87 (13.0%) | 3.74 |
| Non-family | 160 (23.9%) | 1.35 |
| Total Households | 668 (100.0%) | 2.75 |
Household Size by Marriage Status in Las Carolinas
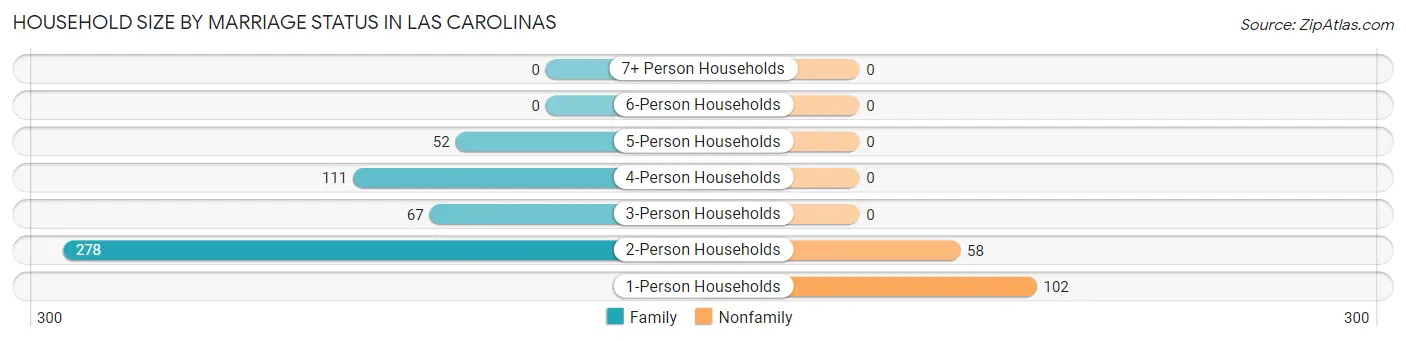
Out of a total of 668 households in Las Carolinas, 508 (76.0%) are family households, while 160 (23.9%) are nonfamily households. The most numerous type of family households are 2-person households, comprising 278, and the most common type of nonfamily households are 1-person households, comprising 102.
| Household Size | Family Households | Nonfamily Households |
| 1-Person Households | - | 102 (15.3%) |
| 2-Person Households | 278 (41.6%) | 58 (8.7%) |
| 3-Person Households | 67 (10.0%) | 0 (0.0%) |
| 4-Person Households | 111 (16.6%) | 0 (0.0%) |
| 5-Person Households | 52 (7.8%) | 0 (0.0%) |
| 6-Person Households | 0 (0.0%) | 0 (0.0%) |
| 7+ Person Households | 0 (0.0%) | 0 (0.0%) |
| Total | 508 (76.0%) | 160 (23.9%) |
Female Fertility in Las Carolinas
Fertility by Age in Las Carolinas
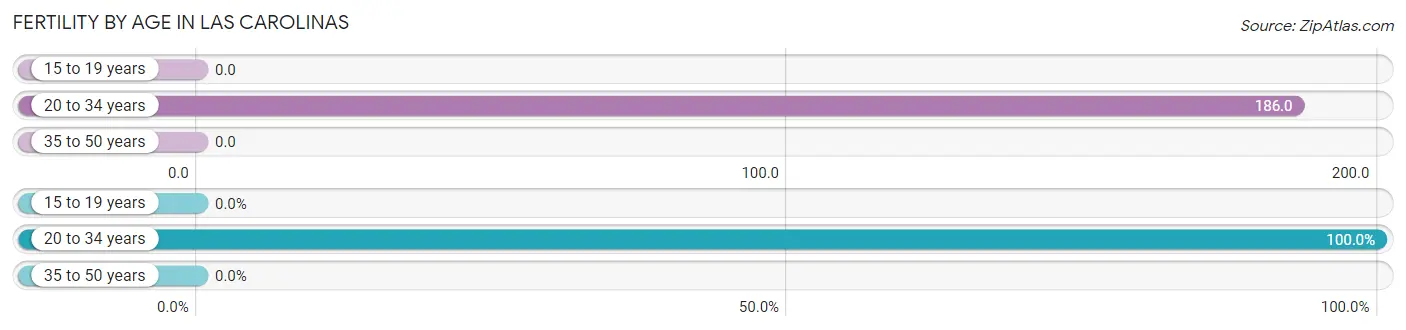
Average fertility rate in Las Carolinas is 96.0 births per 1,000 women. Women in the age bracket of 20 to 34 years have the highest fertility rate with 186.0 births per 1,000 women. Women in the age bracket of 20 to 34 years acount for 100.0% of all women with births.
| Age Bracket | Women with Births | Births / 1,000 Women |
| 15 to 19 years | 0 (0.0%) | 0.0 |
| 20 to 34 years | 48 (100.0%) | 186.0 |
| 35 to 50 years | 0 (0.0%) | 0.0 |
| Total | 48 (100.0%) | 96.0 |
Fertility by Age by Marriage Status in Las Carolinas
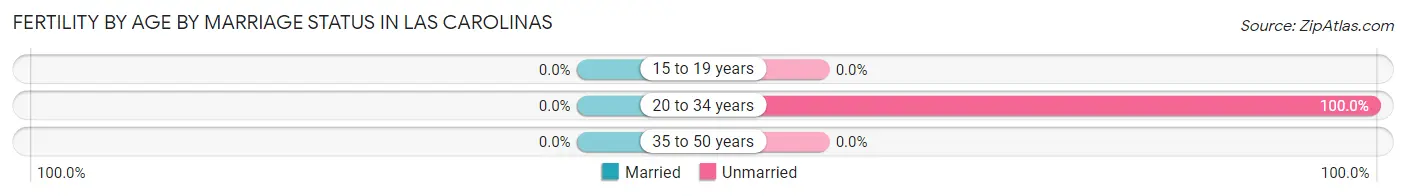
| Age Bracket | Married | Unmarried |
| 15 to 19 years | 0 (0.0%) | 0 (0.0%) |
| 20 to 34 years | 0 (0.0%) | 48 (100.0%) |
| 35 to 50 years | 0 (0.0%) | 0 (0.0%) |
| Total | 0 (0.0%) | 48 (100.0%) |
Fertility by Education in Las Carolinas
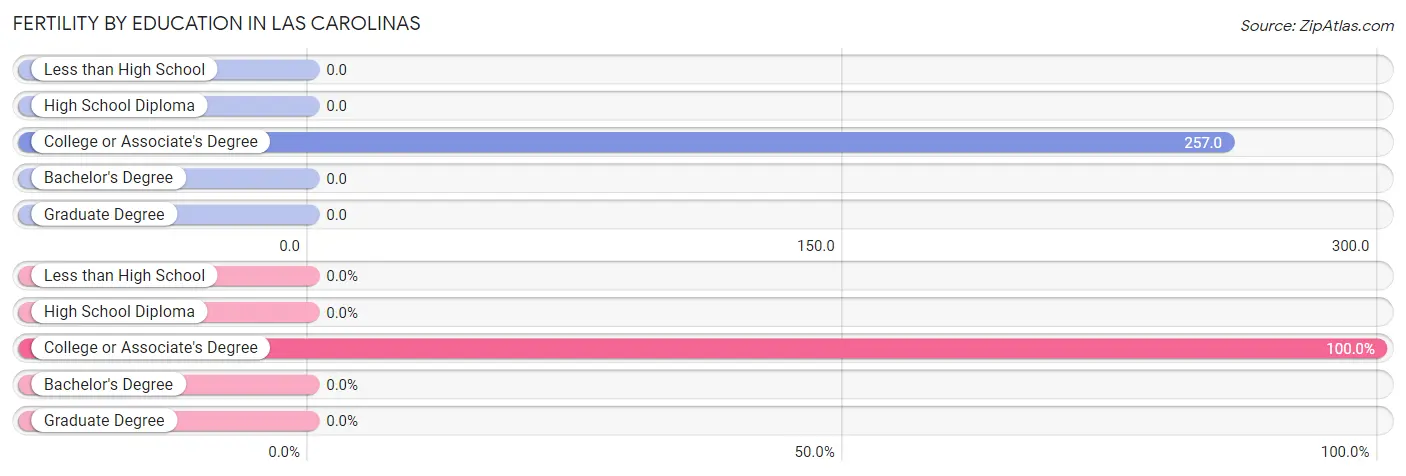
| Educational Attainment | Women with Births | Births / 1,000 Women |
| Less than High School | 0 (0.0%) | 0.0 |
| High School Diploma | 0 (0.0%) | 0.0 |
| College or Associate's Degree | 48 (100.0%) | 257.0 |
| Bachelor's Degree | 0 (0.0%) | 0.0 |
| Graduate Degree | 0 (0.0%) | 0.0 |
| Total | 48 (100.0%) | 96.0 |
Fertility by Education by Marriage Status in Las Carolinas
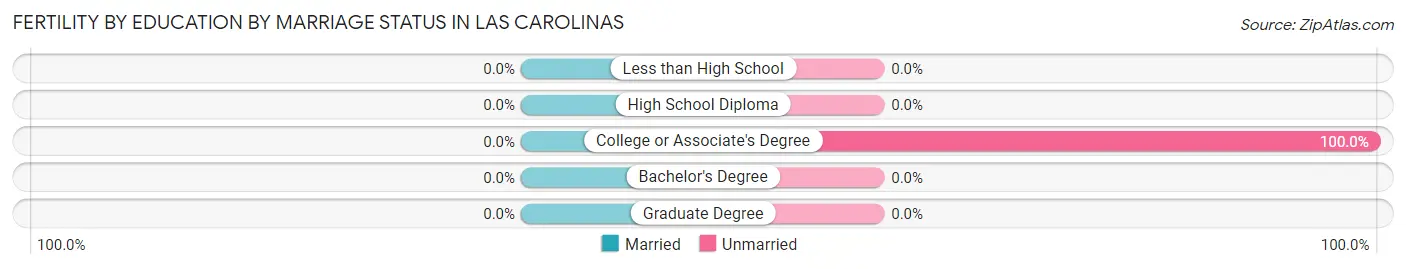
| Educational Attainment | Married | Unmarried |
| Less than High School | 0 (0.0%) | 0 (0.0%) |
| High School Diploma | 0 (0.0%) | 0 (0.0%) |
| College or Associate's Degree | 0 (0.0%) | 48 (100.0%) |
| Bachelor's Degree | 0 (0.0%) | 0 (0.0%) |
| Graduate Degree | 0 (0.0%) | 0 (0.0%) |
| Total | 0 (0.0%) | 48 (100.0%) |
Employment Characteristics in Las Carolinas
Employment by Class of Employer in Las Carolinas
Among the 573 employed individuals in Las Carolinas, private company employees (303 | 52.9%), self-employed (not incorporated) (130 | 22.7%), and state government employees (69 | 12.0%) make up the most common classes of employment.
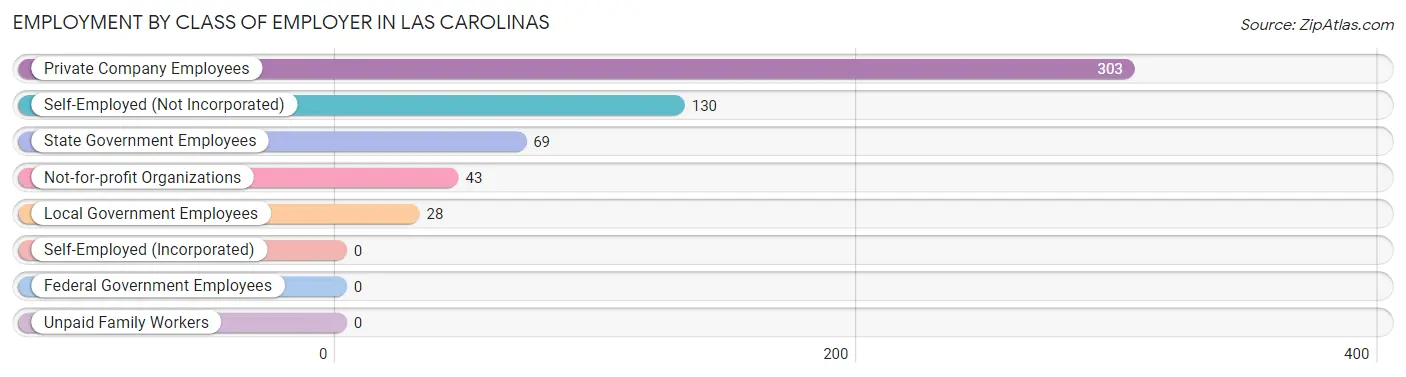
| Employer Class | # Employees | % Employees |
| Private Company Employees | 303 | 52.9% |
| Self-Employed (Incorporated) | 0 | 0.0% |
| Self-Employed (Not Incorporated) | 130 | 22.7% |
| Not-for-profit Organizations | 43 | 7.5% |
| Local Government Employees | 28 | 4.9% |
| State Government Employees | 69 | 12.0% |
| Federal Government Employees | 0 | 0.0% |
| Unpaid Family Workers | 0 | 0.0% |
| Total | 573 | 100.0% |
Employment Status by Age in Las Carolinas
According to the labor force statistics for Las Carolinas, out of the total population over 16 years of age (1,541), 52.2% or 804 individuals are in the labor force, with 23.9% or 192 of them unemployed. The age group with the highest labor force participation rate is 45 to 54 years, with 100.0% or 263 individuals in the labor force. Within the labor force, the 25 to 29 years age range has the highest percentage of unemployed individuals, with 68.3% or 82 of them being unemployed.
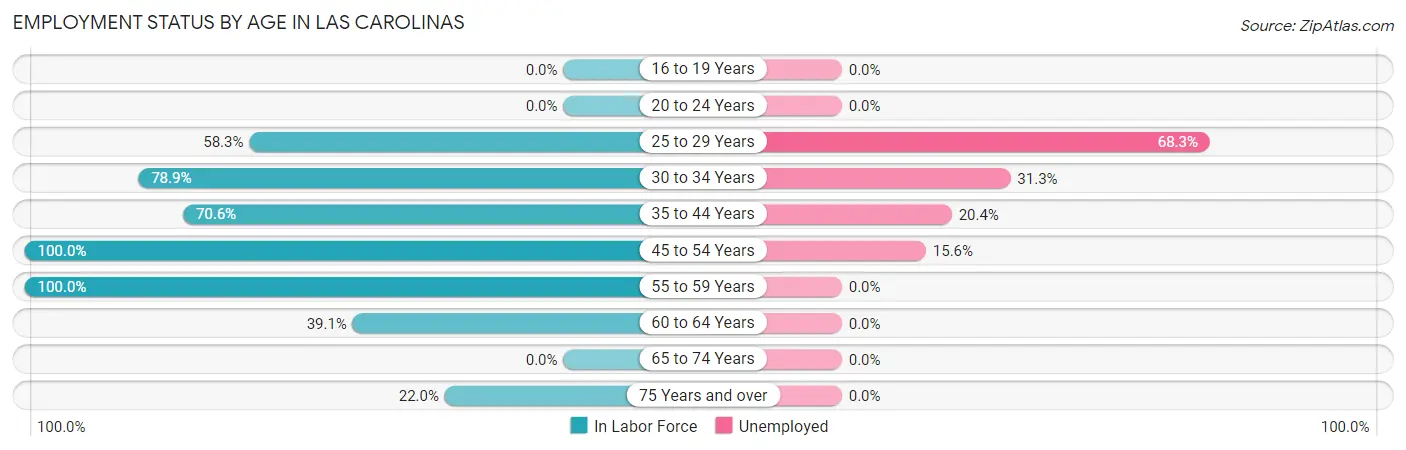
| Age Bracket | In Labor Force | Unemployed |
| 16 to 19 Years | 0 (0.0%) | 0 (0.0%) |
| 20 to 24 Years | 0 (0.0%) | 0 (0.0%) |
| 25 to 29 Years | 120 (58.3%) | 82 (68.3%) |
| 30 to 34 Years | 131 (78.9%) | 41 (31.3%) |
| 35 to 44 Years | 137 (70.6%) | 28 (20.4%) |
| 45 to 54 Years | 263 (100.0%) | 41 (15.6%) |
| 55 to 59 Years | 50 (100.0%) | 0 (0.0%) |
| 60 to 64 Years | 70 (39.1%) | 0 (0.0%) |
| 65 to 74 Years | 0 (0.0%) | 0 (0.0%) |
| 75 Years and over | 33 (22.0%) | 0 (0.0%) |
| Total | 804 (52.2%) | 192 (23.9%) |
Employment Status by Educational Attainment in Las Carolinas
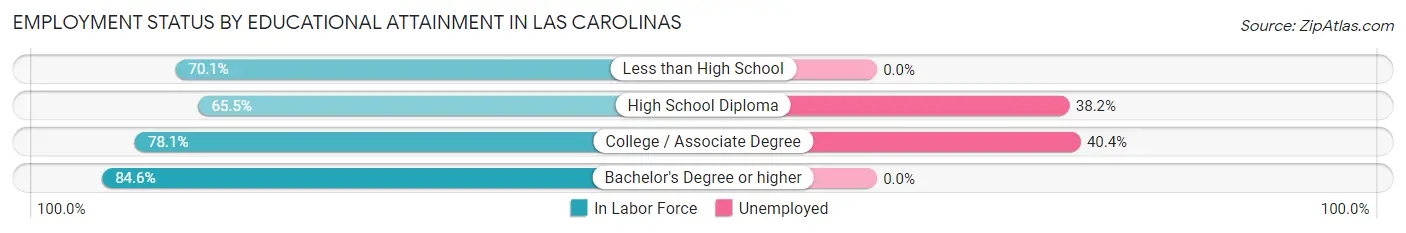
According to labor force statistics for Las Carolinas, 72.9% of individuals (771) out of the total population between 25 and 64 years of age (1,058) are in the labor force, with 24.9% or 192 of them being unemployed. The group with the highest labor force participation rate are those with the educational attainment of bachelor's degree or higher, with 84.6% or 170 individuals in the labor force. Within the labor force, individuals with college / associate degree education have the highest percentage of unemployment, with 40.4% or 82 of them being unemployed.
| Educational Attainment | In Labor Force | Unemployed |
| Less than High School | 110 (70.1%) | 0 (0.0%) |
| High School Diploma | 288 (65.5%) | 168 (38.2%) |
| College / Associate Degree | 203 (78.1%) | 105 (40.4%) |
| Bachelor's Degree or higher | 170 (84.6%) | 0 (0.0%) |
| Total | 771 (72.9%) | 263 (24.9%) |
Employment Occupations by Sex in Las Carolinas
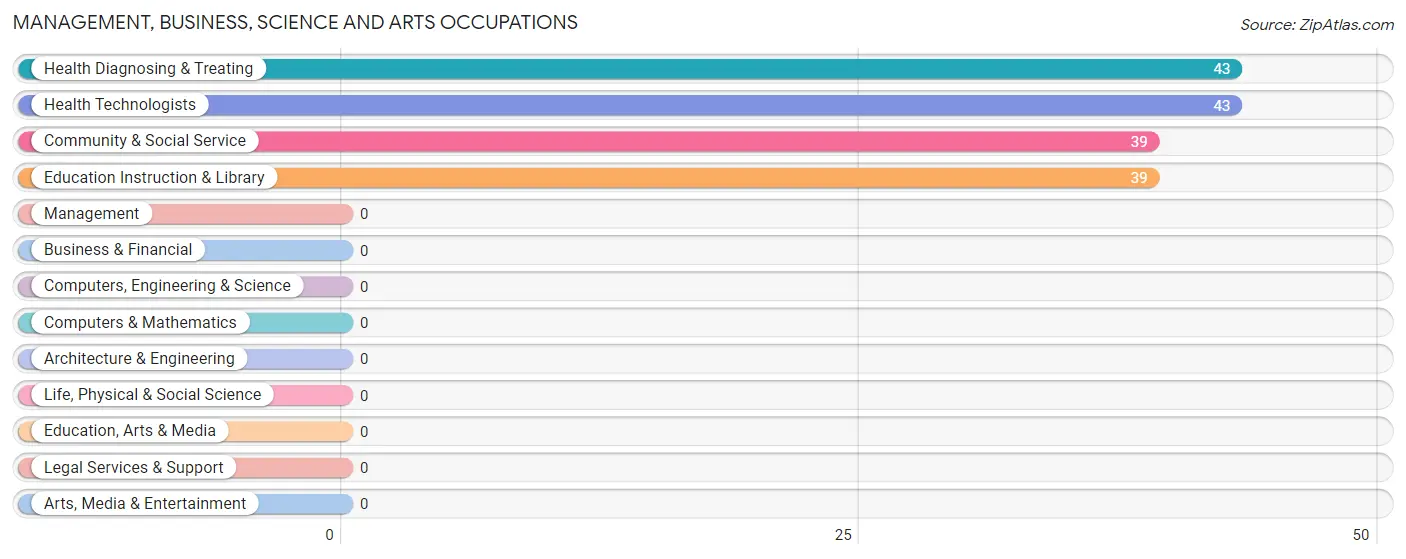
Management, Business, Science and Arts Occupations
The most common Management, Business, Science and Arts occupations in Las Carolinas are Health Diagnosing & Treating (43 | 7.0%), Health Technologists (43 | 7.0%), Community & Social Service (39 | 6.4%), and Education Instruction & Library (39 | 6.4%).
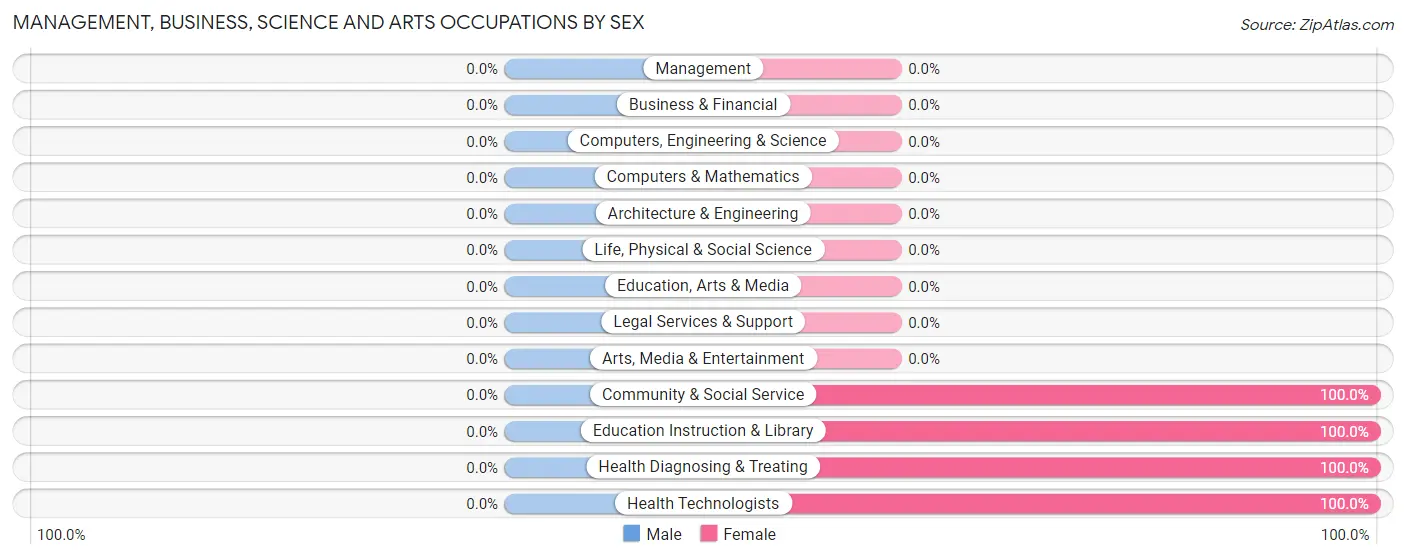
Management, Business, Science and Arts Occupations by Sex
| Occupation | Male | Female |
| Management | 0 (0.0%) | 0 (0.0%) |
| Business & Financial | 0 (0.0%) | 0 (0.0%) |
| Computers, Engineering & Science | 0 (0.0%) | 0 (0.0%) |
| Computers & Mathematics | 0 (0.0%) | 0 (0.0%) |
| Architecture & Engineering | 0 (0.0%) | 0 (0.0%) |
| Life, Physical & Social Science | 0 (0.0%) | 0 (0.0%) |
| Community & Social Service | 0 (0.0%) | 39 (100.0%) |
| Education, Arts & Media | 0 (0.0%) | 0 (0.0%) |
| Legal Services & Support | 0 (0.0%) | 0 (0.0%) |
| Education Instruction & Library | 0 (0.0%) | 39 (100.0%) |
| Arts, Media & Entertainment | 0 (0.0%) | 0 (0.0%) |
| Health Diagnosing & Treating | 0 (0.0%) | 43 (100.0%) |
| Health Technologists | 0 (0.0%) | 43 (100.0%) |
| Total (Category) | 0 (0.0%) | 82 (100.0%) |
| Total (Overall) | 337 (55.1%) | 275 (44.9%) |
Services Occupations
The most common Services occupations in Las Carolinas are Security & Protection (85 | 13.9%), Food Preparation & Serving (84 | 13.7%), Law Enforcement (52 | 8.5%), Personal Care & Service (42 | 6.9%), and Firefighting & Prevention (33 | 5.4%).
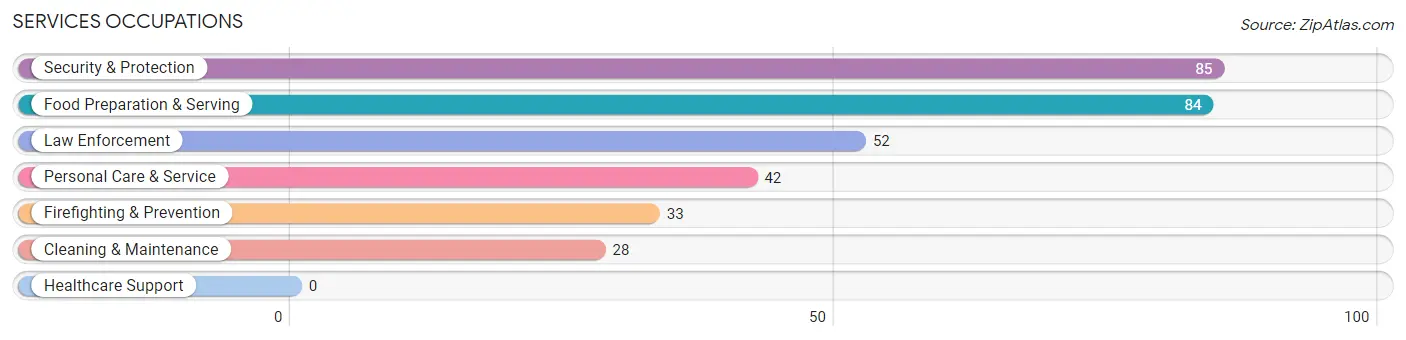
Services Occupations by Sex
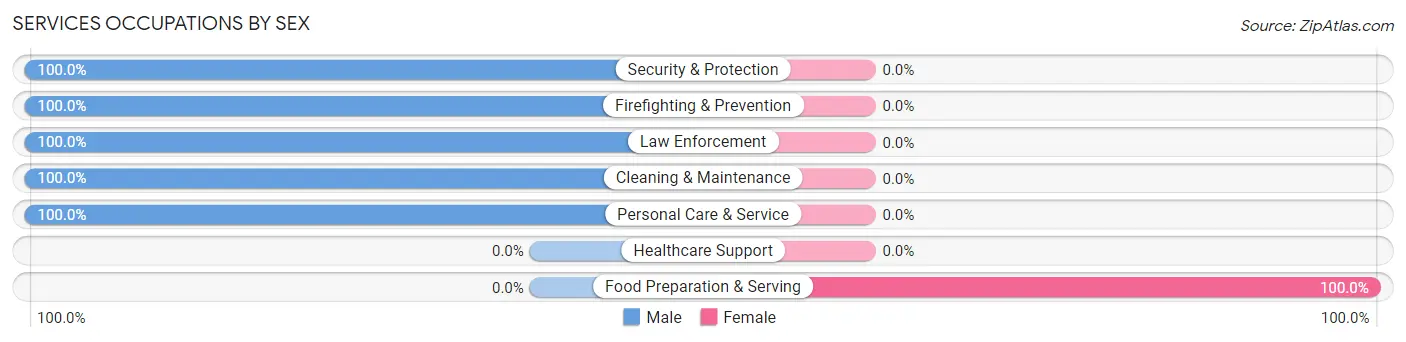
| Occupation | Male | Female |
| Healthcare Support | 0 (0.0%) | 0 (0.0%) |
| Security & Protection | 85 (100.0%) | 0 (0.0%) |
| Firefighting & Prevention | 33 (100.0%) | 0 (0.0%) |
| Law Enforcement | 52 (100.0%) | 0 (0.0%) |
| Food Preparation & Serving | 0 (0.0%) | 84 (100.0%) |
| Cleaning & Maintenance | 28 (100.0%) | 0 (0.0%) |
| Personal Care & Service | 42 (100.0%) | 0 (0.0%) |
| Total (Category) | 155 (64.8%) | 84 (35.1%) |
| Total (Overall) | 337 (55.1%) | 275 (44.9%) |
Sales and Office Occupations
The most common Sales and Office occupations in Las Carolinas are , and Office & Administration (35 | 5.7%).
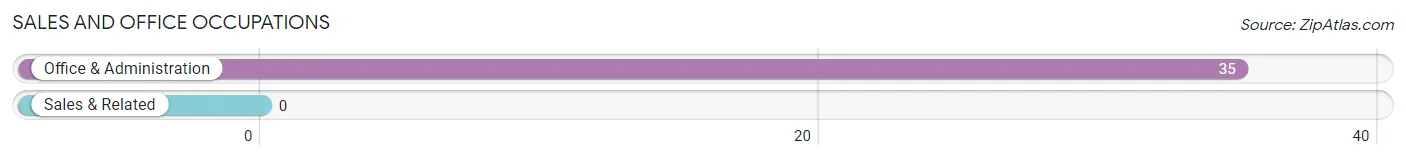
Sales and Office Occupations by Sex
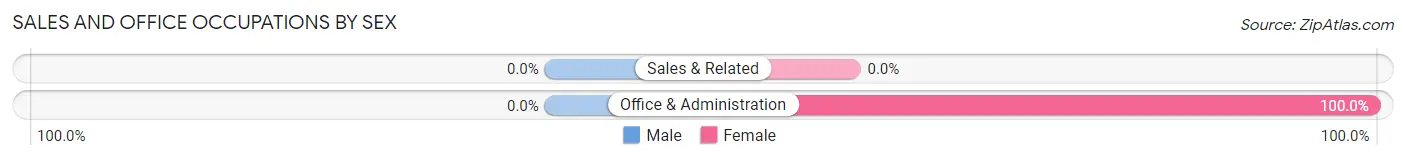
| Occupation | Male | Female |
| Sales & Related | 0 (0.0%) | 0 (0.0%) |
| Office & Administration | 0 (0.0%) | 35 (100.0%) |
| Total (Category) | 0 (0.0%) | 35 (100.0%) |
| Total (Overall) | 337 (55.1%) | 275 (44.9%) |
Natural Resources, Construction and Maintenance Occupations
The most common Natural Resources, Construction and Maintenance occupations in Las Carolinas are , and Construction & Extraction (144 | 23.5%).
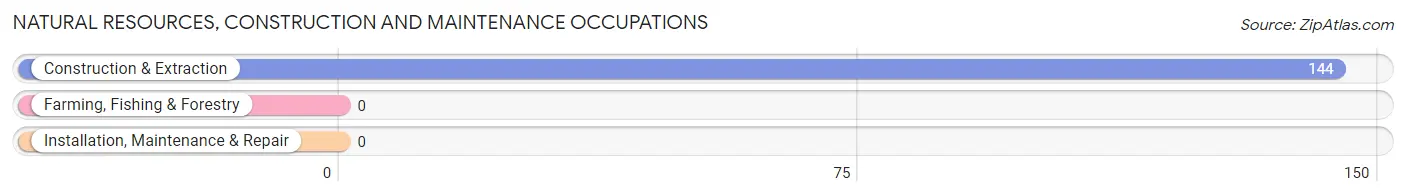
Natural Resources, Construction and Maintenance Occupations by Sex
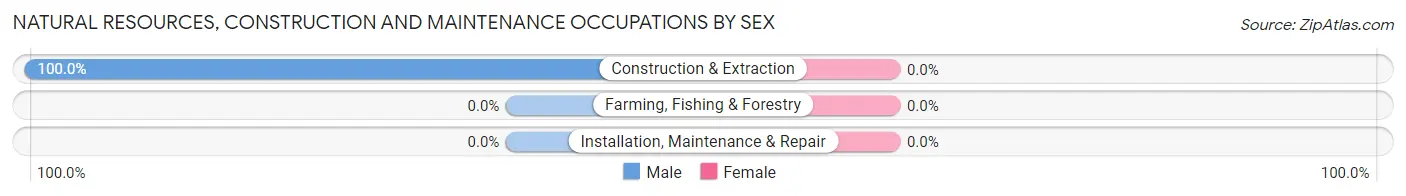
| Occupation | Male | Female |
| Farming, Fishing & Forestry | 0 (0.0%) | 0 (0.0%) |
| Construction & Extraction | 144 (100.0%) | 0 (0.0%) |
| Installation, Maintenance & Repair | 0 (0.0%) | 0 (0.0%) |
| Total (Category) | 144 (100.0%) | 0 (0.0%) |
| Total (Overall) | 337 (55.1%) | 275 (44.9%) |
Production, Transportation and Moving Occupations
The most common Production, Transportation and Moving occupations in Las Carolinas are Transportation (95 | 15.5%), and Production (17 | 2.8%).
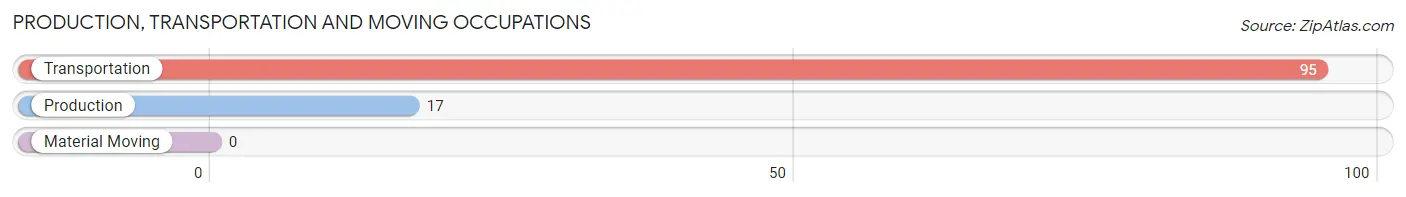
Production, Transportation and Moving Occupations by Sex
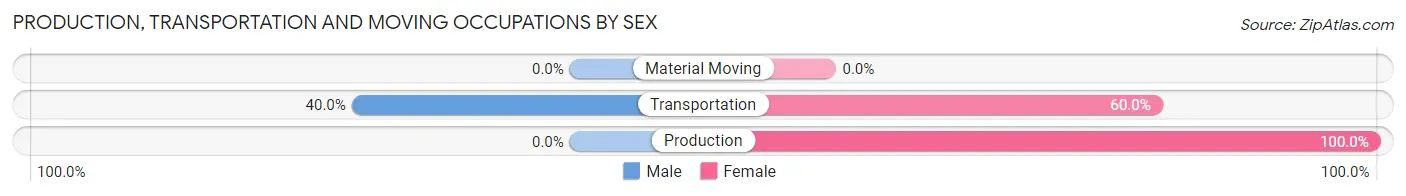
| Occupation | Male | Female |
| Production | 0 (0.0%) | 17 (100.0%) |
| Transportation | 38 (40.0%) | 57 (60.0%) |
| Material Moving | 0 (0.0%) | 0 (0.0%) |
| Total (Category) | 38 (33.9%) | 74 (66.1%) |
| Total (Overall) | 337 (55.1%) | 275 (44.9%) |
Employment Industries by Sex in Las Carolinas
Employment Industries in Las Carolinas
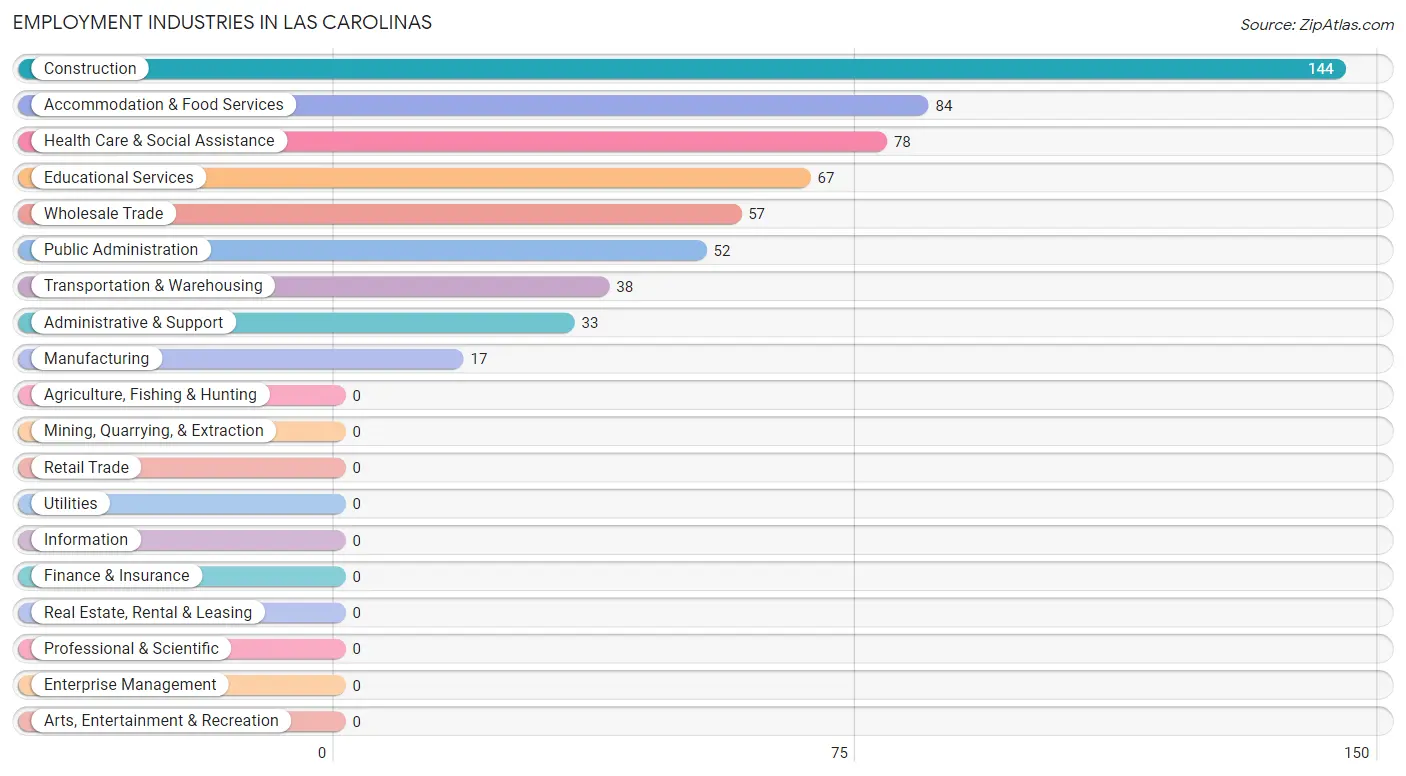
The major employment industries in Las Carolinas include Construction (144 | 23.5%), Accommodation & Food Services (84 | 13.7%), Health Care & Social Assistance (78 | 12.8%), Educational Services (67 | 11.0%), and Wholesale Trade (57 | 9.3%).
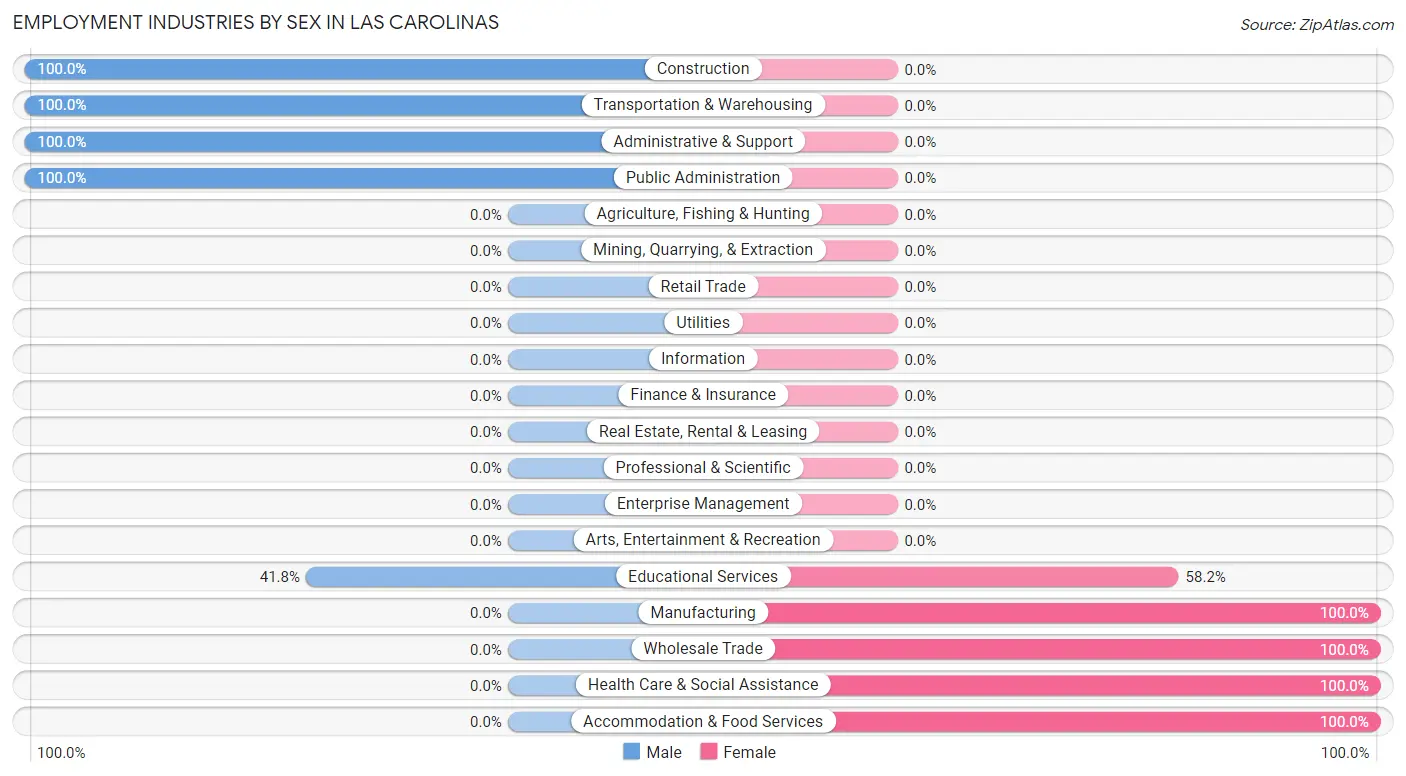
Employment Industries by Sex in Las Carolinas
The Las Carolinas industries that see more men than women are Construction (100.0%), Transportation & Warehousing (100.0%), and Administrative & Support (100.0%), whereas the industries that tend to have a higher number of women are Manufacturing (100.0%), Wholesale Trade (100.0%), and Health Care & Social Assistance (100.0%).
| Industry | Male | Female |
| Agriculture, Fishing & Hunting | 0 (0.0%) | 0 (0.0%) |
| Mining, Quarrying, & Extraction | 0 (0.0%) | 0 (0.0%) |
| Construction | 144 (100.0%) | 0 (0.0%) |
| Manufacturing | 0 (0.0%) | 17 (100.0%) |
| Wholesale Trade | 0 (0.0%) | 57 (100.0%) |
| Retail Trade | 0 (0.0%) | 0 (0.0%) |
| Transportation & Warehousing | 38 (100.0%) | 0 (0.0%) |
| Utilities | 0 (0.0%) | 0 (0.0%) |
| Information | 0 (0.0%) | 0 (0.0%) |
| Finance & Insurance | 0 (0.0%) | 0 (0.0%) |
| Real Estate, Rental & Leasing | 0 (0.0%) | 0 (0.0%) |
| Professional & Scientific | 0 (0.0%) | 0 (0.0%) |
| Enterprise Management | 0 (0.0%) | 0 (0.0%) |
| Administrative & Support | 33 (100.0%) | 0 (0.0%) |
| Educational Services | 28 (41.8%) | 39 (58.2%) |
| Health Care & Social Assistance | 0 (0.0%) | 78 (100.0%) |
| Arts, Entertainment & Recreation | 0 (0.0%) | 0 (0.0%) |
| Accommodation & Food Services | 0 (0.0%) | 84 (100.0%) |
| Public Administration | 52 (100.0%) | 0 (0.0%) |
| Total | 337 (55.1%) | 275 (44.9%) |
Education in Las Carolinas
School Enrollment in Las Carolinas
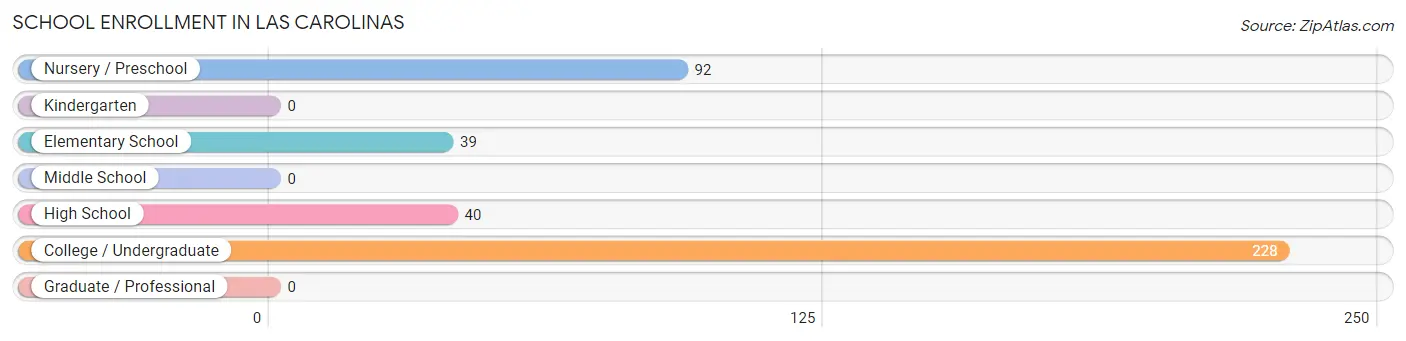
The most common levels of schooling among the 399 students in Las Carolinas are college / undergraduate (228 | 57.1%), nursery / preschool (92 | 23.1%), and high school (40 | 10.0%).
| School Level | # Students | % Students |
| Nursery / Preschool | 92 | 23.1% |
| Kindergarten | 0 | 0.0% |
| Elementary School | 39 | 9.8% |
| Middle School | 0 | 0.0% |
| High School | 40 | 10.0% |
| College / Undergraduate | 228 | 57.1% |
| Graduate / Professional | 0 | 0.0% |
| Total | 399 | 100.0% |
School Enrollment by Age by Funding Source in Las Carolinas
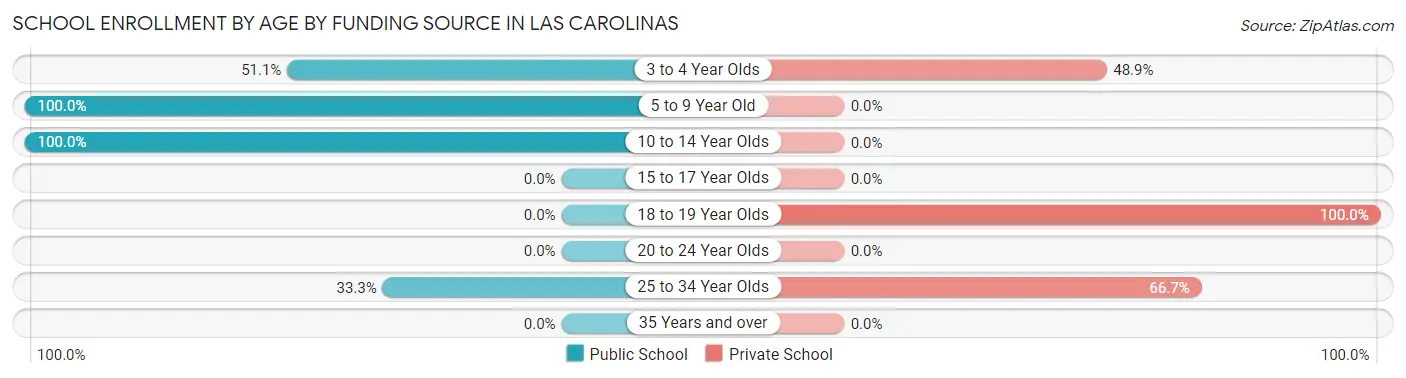
Out of a total of 399 students who are enrolled in schools in Las Carolinas, 232 (58.1%) attend a private institution, while the remaining 167 (41.9%) are enrolled in public schools. The age group of 18 to 19 year olds has the highest likelihood of being enrolled in private schools, with 105 (100.0% in the age bracket) enrolled. Conversely, the age group of 5 to 9 year old has the lowest likelihood of being enrolled in a private school, with 39 (100.0% in the age bracket) attending a public institution.
| Age Bracket | Public School | Private School |
| 3 to 4 Year Olds | 47 (51.1%) | 45 (48.9%) |
| 5 to 9 Year Old | 39 (100.0%) | 0 (0.0%) |
| 10 to 14 Year Olds | 40 (100.0%) | 0 (0.0%) |
| 15 to 17 Year Olds | 0 (0.0%) | 0 (0.0%) |
| 18 to 19 Year Olds | 0 (0.0%) | 105 (100.0%) |
| 20 to 24 Year Olds | 0 (0.0%) | 0 (0.0%) |
| 25 to 34 Year Olds | 41 (33.3%) | 82 (66.7%) |
| 35 Years and over | 0 (0.0%) | 0 (0.0%) |
| Total | 167 (41.9%) | 232 (58.1%) |
Educational Attainment by Field of Study in Las Carolinas
Science & technology (74 | 28.5%), engineering (59 | 22.7%), arts & humanities (52 | 20.0%), business (39 | 15.0%), and liberal arts & history (36 | 13.9%) are the most common fields of study among 260 individuals in Las Carolinas who have obtained a bachelor's degree or higher.
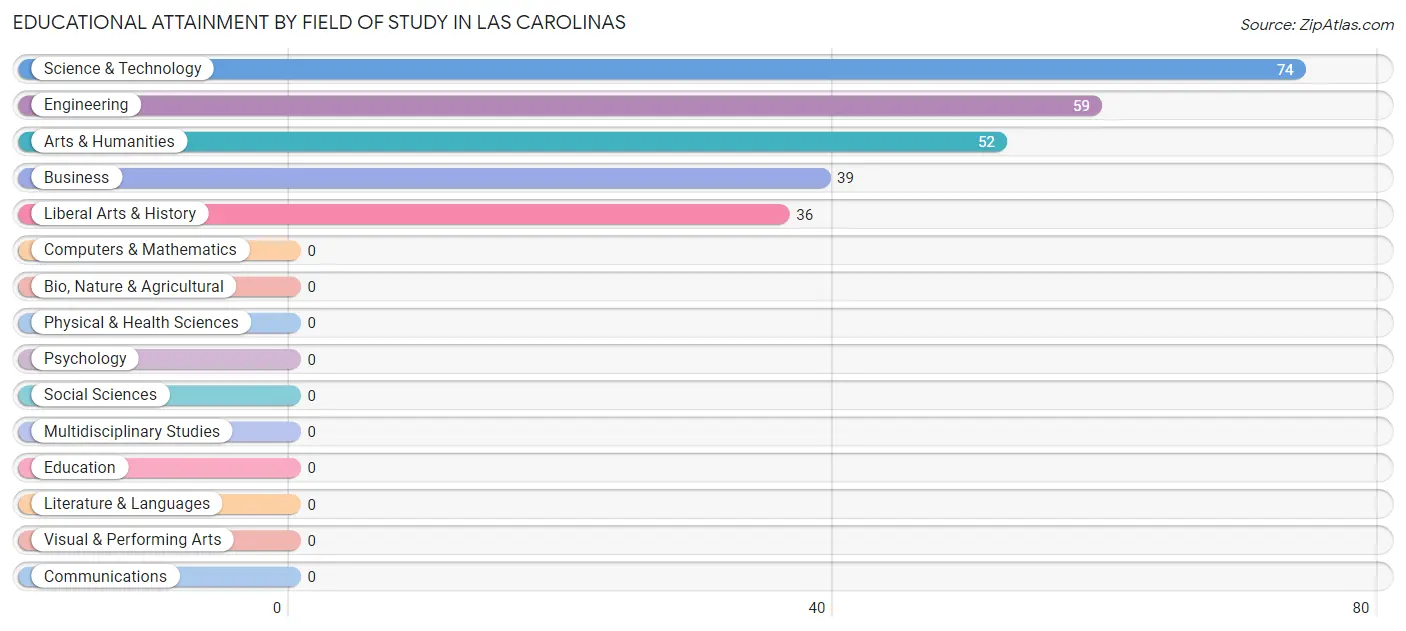
| Field of Study | # Graduates | % Graduates |
| Computers & Mathematics | 0 | 0.0% |
| Bio, Nature & Agricultural | 0 | 0.0% |
| Physical & Health Sciences | 0 | 0.0% |
| Psychology | 0 | 0.0% |
| Social Sciences | 0 | 0.0% |
| Engineering | 59 | 22.7% |
| Multidisciplinary Studies | 0 | 0.0% |
| Science & Technology | 74 | 28.5% |
| Business | 39 | 15.0% |
| Education | 0 | 0.0% |
| Literature & Languages | 0 | 0.0% |
| Liberal Arts & History | 36 | 13.9% |
| Visual & Performing Arts | 0 | 0.0% |
| Communications | 0 | 0.0% |
| Arts & Humanities | 52 | 20.0% |
| Total | 260 | 100.0% |
Transportation & Commute in Las Carolinas
Vehicle Availability by Sex in Las Carolinas
The most prevalent vehicle ownership categories in Las Carolinas are males with 1 vehicle (153, accounting for 45.4%) and females with 1 vehicle (52, making up 64.8%).
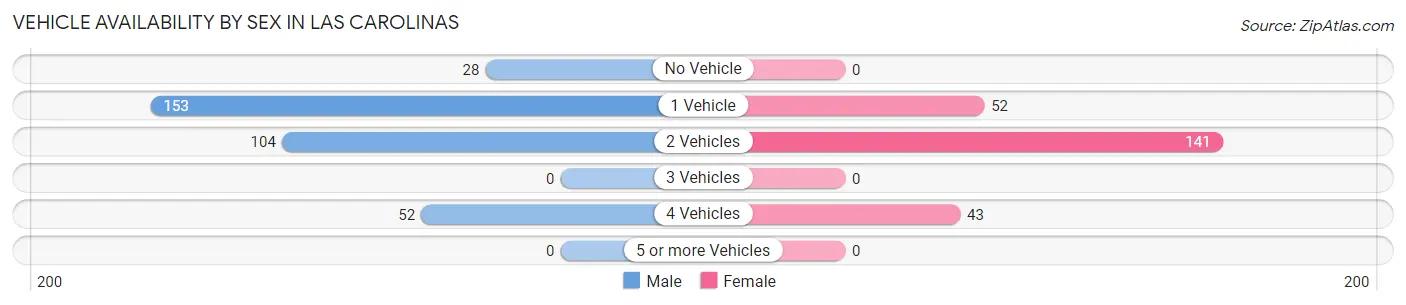
| Vehicles Available | Male | Female |
| No Vehicle | 28 (8.3%) | 0 (0.0%) |
| 1 Vehicle | 153 (45.4%) | 52 (22.0%) |
| 2 Vehicles | 104 (30.9%) | 141 (59.8%) |
| 3 Vehicles | 0 (0.0%) | 0 (0.0%) |
| 4 Vehicles | 52 (15.4%) | 43 (18.2%) |
| 5 or more Vehicles | 0 (0.0%) | 0 (0.0%) |
| Total | 337 (100.0%) | 236 (100.0%) |
Commute Time in Las Carolinas
The most frequently occuring commute durations in Las Carolinas are 30 to 34 minutes (267 commuters, 46.6%), 20 to 24 minutes (133 commuters, 23.2%), and 45 to 59 minutes (73 commuters, 12.7%).
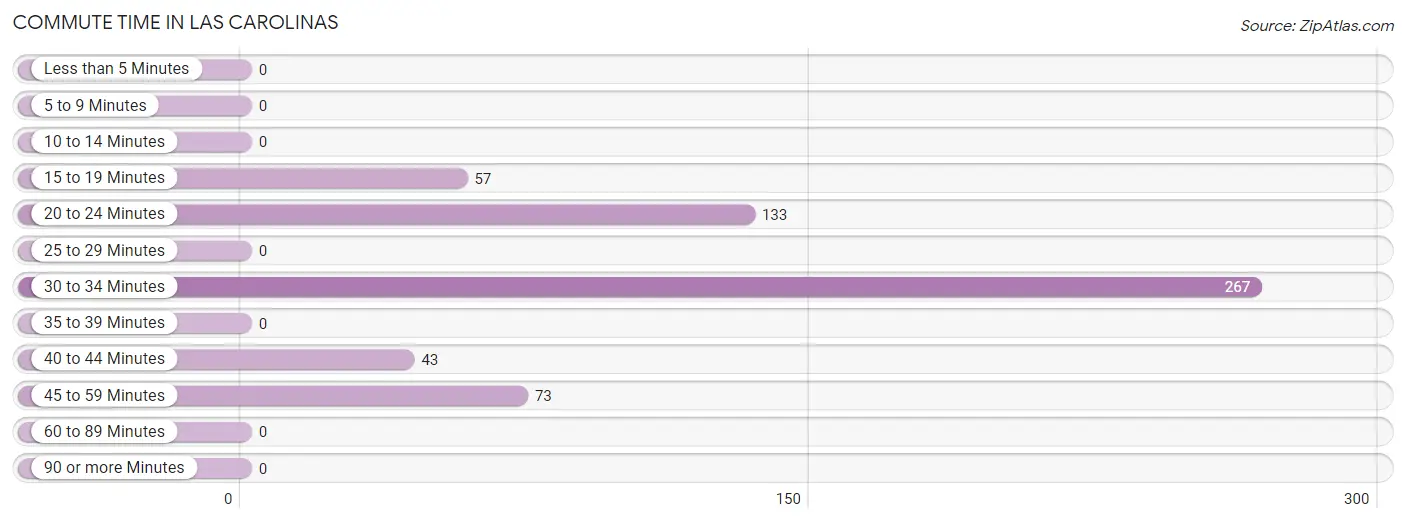
| Commute Time | # Commuters | % Commuters |
| Less than 5 Minutes | 0 | 0.0% |
| 5 to 9 Minutes | 0 | 0.0% |
| 10 to 14 Minutes | 0 | 0.0% |
| 15 to 19 Minutes | 57 | 10.0% |
| 20 to 24 Minutes | 133 | 23.2% |
| 25 to 29 Minutes | 0 | 0.0% |
| 30 to 34 Minutes | 267 | 46.6% |
| 35 to 39 Minutes | 0 | 0.0% |
| 40 to 44 Minutes | 43 | 7.5% |
| 45 to 59 Minutes | 73 | 12.7% |
| 60 to 89 Minutes | 0 | 0.0% |
| 90 or more Minutes | 0 | 0.0% |
Commute Time by Sex in Las Carolinas
The most common commute times in Las Carolinas are 30 to 34 minutes (214 commuters, 63.5%) for males and 15 to 19 minutes (57 commuters, 24.1%) for females.
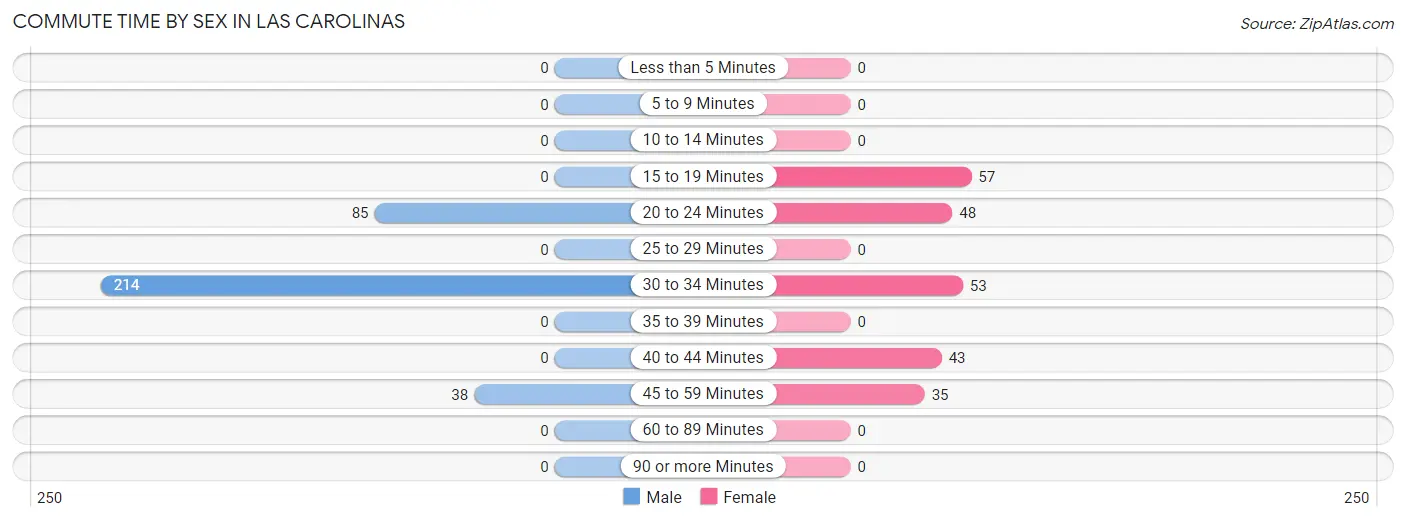
| Commute Time | Male | Female |
| Less than 5 Minutes | 0 (0.0%) | 0 (0.0%) |
| 5 to 9 Minutes | 0 (0.0%) | 0 (0.0%) |
| 10 to 14 Minutes | 0 (0.0%) | 0 (0.0%) |
| 15 to 19 Minutes | 0 (0.0%) | 57 (24.1%) |
| 20 to 24 Minutes | 85 (25.2%) | 48 (20.3%) |
| 25 to 29 Minutes | 0 (0.0%) | 0 (0.0%) |
| 30 to 34 Minutes | 214 (63.5%) | 53 (22.5%) |
| 35 to 39 Minutes | 0 (0.0%) | 0 (0.0%) |
| 40 to 44 Minutes | 0 (0.0%) | 43 (18.2%) |
| 45 to 59 Minutes | 38 (11.3%) | 35 (14.8%) |
| 60 to 89 Minutes | 0 (0.0%) | 0 (0.0%) |
| 90 or more Minutes | 0 (0.0%) | 0 (0.0%) |
Time of Departure to Work by Sex in Las Carolinas
The most frequent times of departure to work in Las Carolinas are 12:00 AM to 4:59 AM (86, 25.5%) for males and 7:30 AM to 7:59 AM (60, 25.4%) for females.
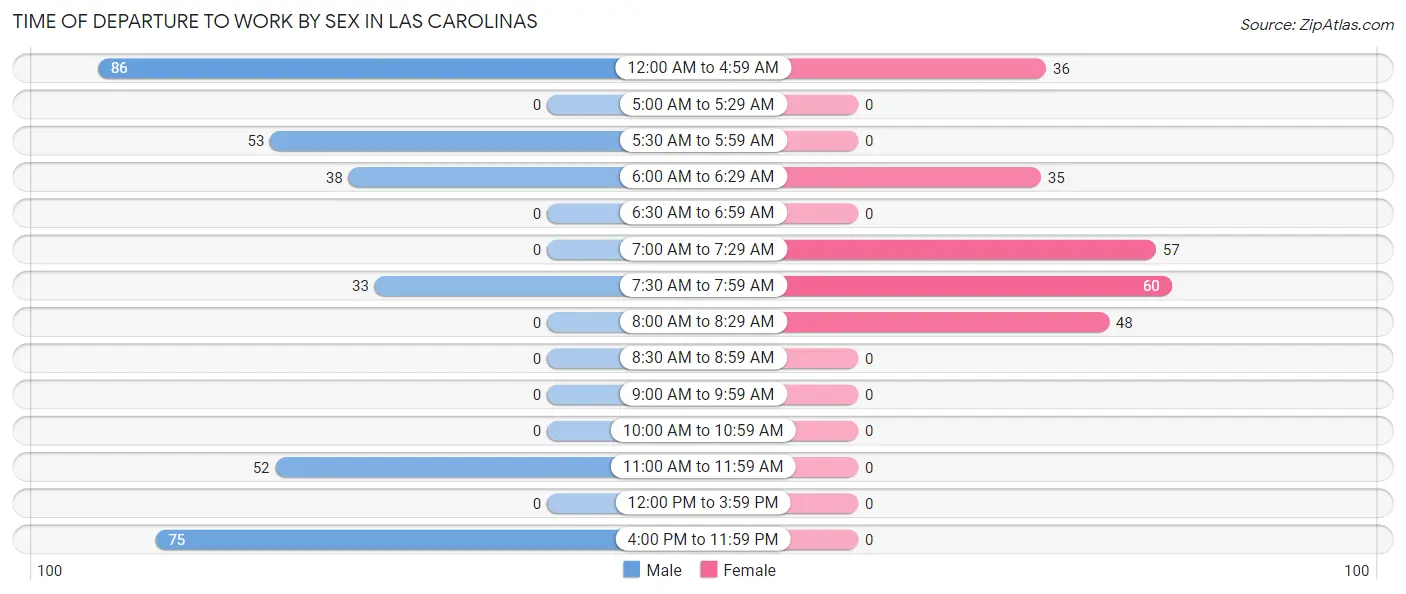
| Time of Departure | Male | Female |
| 12:00 AM to 4:59 AM | 86 (25.5%) | 36 (15.2%) |
| 5:00 AM to 5:29 AM | 0 (0.0%) | 0 (0.0%) |
| 5:30 AM to 5:59 AM | 53 (15.7%) | 0 (0.0%) |
| 6:00 AM to 6:29 AM | 38 (11.3%) | 35 (14.8%) |
| 6:30 AM to 6:59 AM | 0 (0.0%) | 0 (0.0%) |
| 7:00 AM to 7:29 AM | 0 (0.0%) | 57 (24.1%) |
| 7:30 AM to 7:59 AM | 33 (9.8%) | 60 (25.4%) |
| 8:00 AM to 8:29 AM | 0 (0.0%) | 48 (20.3%) |
| 8:30 AM to 8:59 AM | 0 (0.0%) | 0 (0.0%) |
| 9:00 AM to 9:59 AM | 0 (0.0%) | 0 (0.0%) |
| 10:00 AM to 10:59 AM | 0 (0.0%) | 0 (0.0%) |
| 11:00 AM to 11:59 AM | 52 (15.4%) | 0 (0.0%) |
| 12:00 PM to 3:59 PM | 0 (0.0%) | 0 (0.0%) |
| 4:00 PM to 11:59 PM | 75 (22.3%) | 0 (0.0%) |
| Total | 337 (100.0%) | 236 (100.0%) |
Housing Occupancy in Las Carolinas
Occupancy by Ownership in Las Carolinas
Of the total 668 dwellings in Las Carolinas, owner-occupied units account for 374 (56.0%), while renter-occupied units make up 294 (44.0%).
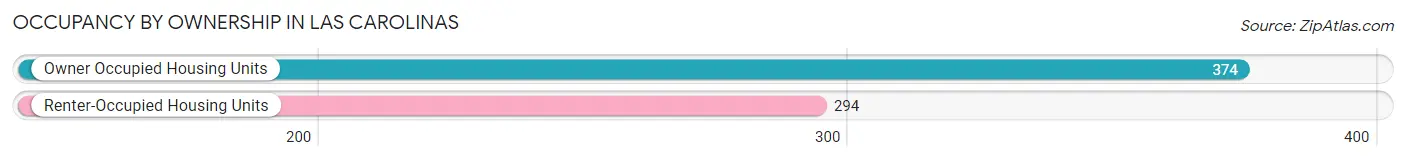
| Occupancy | # Housing Units | % Housing Units |
| Owner Occupied Housing Units | 374 | 56.0% |
| Renter-Occupied Housing Units | 294 | 44.0% |
| Total Occupied Housing Units | 668 | 100.0% |
Occupancy by Household Size in Las Carolinas
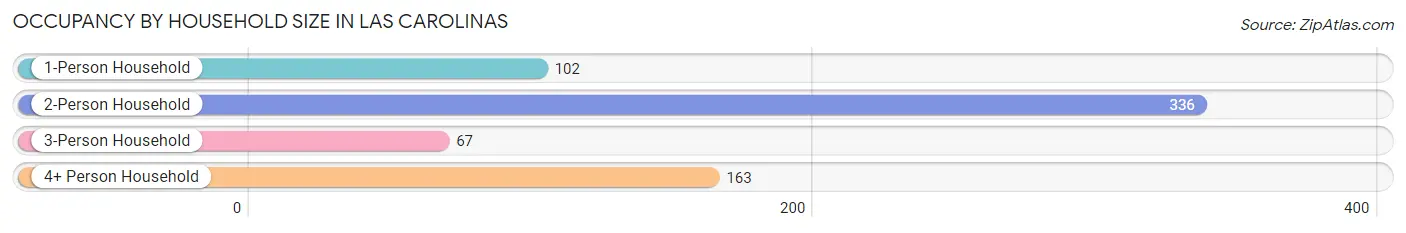
| Household Size | # Housing Units | % Housing Units |
| 1-Person Household | 102 | 15.3% |
| 2-Person Household | 336 | 50.3% |
| 3-Person Household | 67 | 10.0% |
| 4+ Person Household | 163 | 24.4% |
| Total Housing Units | 668 | 100.0% |
Occupancy by Ownership by Household Size in Las Carolinas
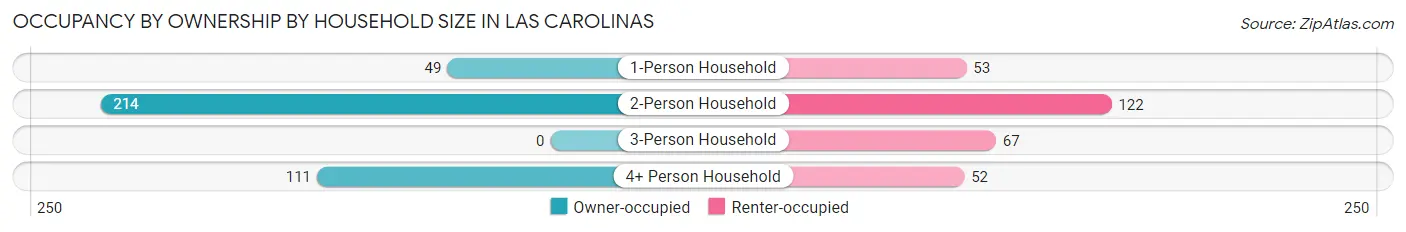
| Household Size | Owner-occupied | Renter-occupied |
| 1-Person Household | 49 (48.0%) | 53 (52.0%) |
| 2-Person Household | 214 (63.7%) | 122 (36.3%) |
| 3-Person Household | 0 (0.0%) | 67 (100.0%) |
| 4+ Person Household | 111 (68.1%) | 52 (31.9%) |
| Total Housing Units | 374 (56.0%) | 294 (44.0%) |
Occupancy by Educational Attainment in Las Carolinas
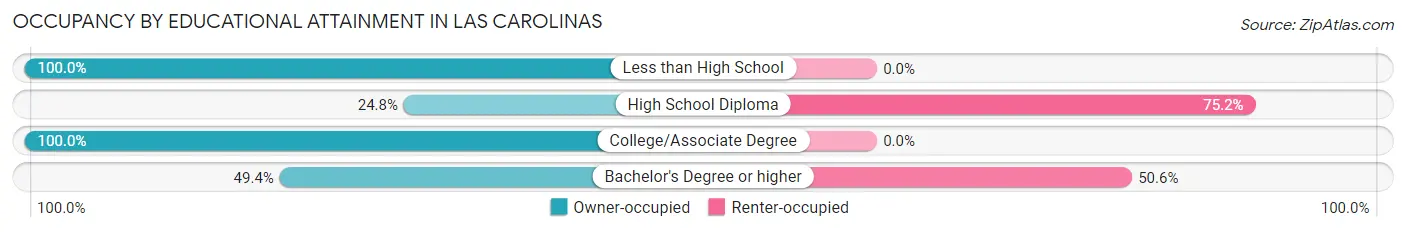
| Household Size | Owner-occupied | Renter-occupied |
| Less than High School | 147 (100.0%) | 0 (0.0%) |
| High School Diploma | 68 (24.8%) | 206 (75.2%) |
| College/Associate Degree | 73 (100.0%) | 0 (0.0%) |
| Bachelor's Degree or higher | 86 (49.4%) | 88 (50.6%) |
Occupancy by Age of Householder in Las Carolinas
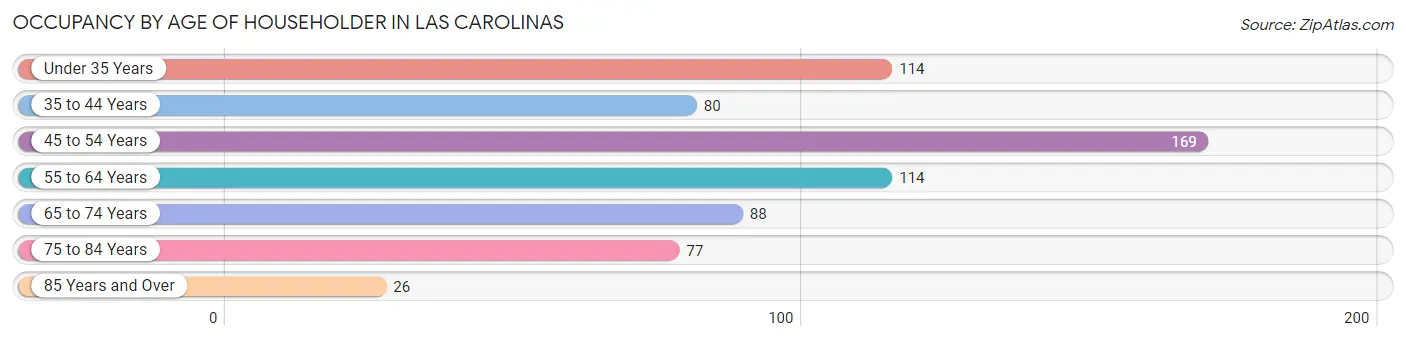
| Age Bracket | # Households | % Households |
| Under 35 Years | 114 | 17.1% |
| 35 to 44 Years | 80 | 12.0% |
| 45 to 54 Years | 169 | 25.3% |
| 55 to 64 Years | 114 | 17.1% |
| 65 to 74 Years | 88 | 13.2% |
| 75 to 84 Years | 77 | 11.5% |
| 85 Years and Over | 26 | 3.9% |
| Total | 668 | 100.0% |
Housing Finances in Las Carolinas
Median Income by Occupancy in Las Carolinas
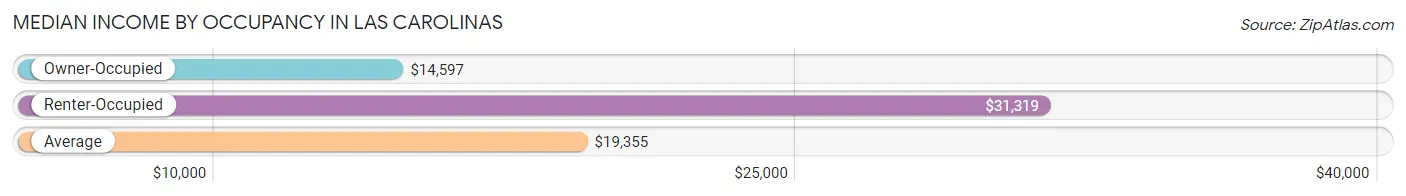
| Occupancy Type | # Households | Median Income |
| Owner-Occupied | 374 (56.0%) | $14,597 |
| Renter-Occupied | 294 (44.0%) | $31,319 |
| Average | 668 (100.0%) | $19,355 |
Occupancy by Householder Income Bracket in Las Carolinas
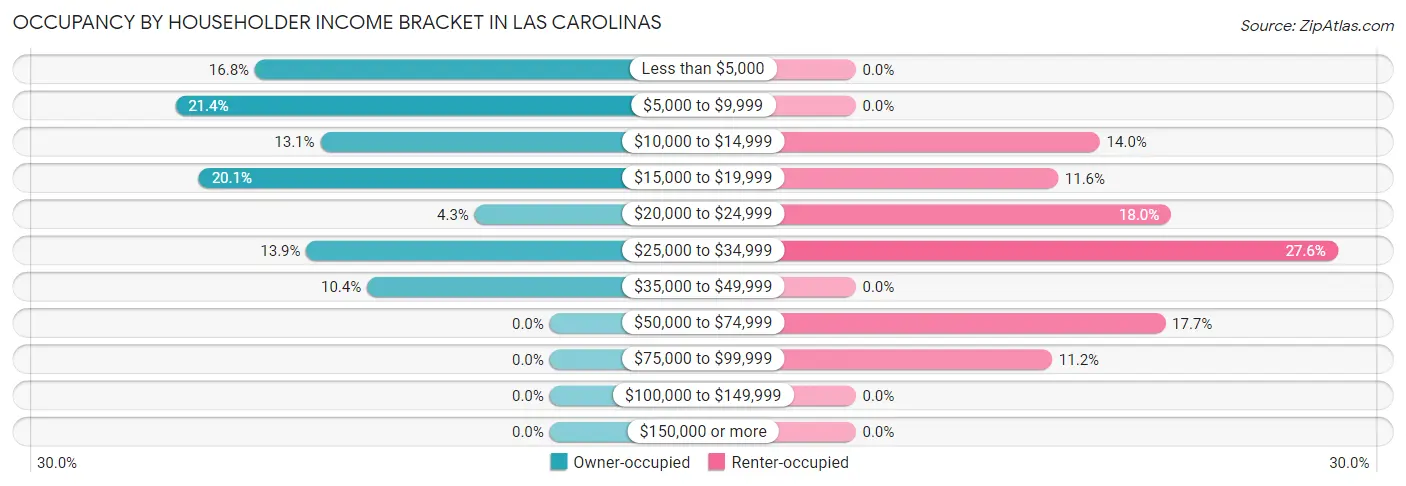
| Income Bracket | Owner-occupied | Renter-occupied |
| Less than $5,000 | 63 (16.8%) | 0 (0.0%) |
| $5,000 to $9,999 | 80 (21.4%) | 0 (0.0%) |
| $10,000 to $14,999 | 49 (13.1%) | 41 (14.0%) |
| $15,000 to $19,999 | 75 (20.1%) | 34 (11.6%) |
| $20,000 to $24,999 | 16 (4.3%) | 53 (18.0%) |
| $25,000 to $34,999 | 52 (13.9%) | 81 (27.6%) |
| $35,000 to $49,999 | 39 (10.4%) | 0 (0.0%) |
| $50,000 to $74,999 | 0 (0.0%) | 52 (17.7%) |
| $75,000 to $99,999 | 0 (0.0%) | 33 (11.2%) |
| $100,000 to $149,999 | 0 (0.0%) | 0 (0.0%) |
| $150,000 or more | 0 (0.0%) | 0 (0.0%) |
| Total | 374 (100.0%) | 294 (100.0%) |
Monthly Housing Cost Tiers in Las Carolinas
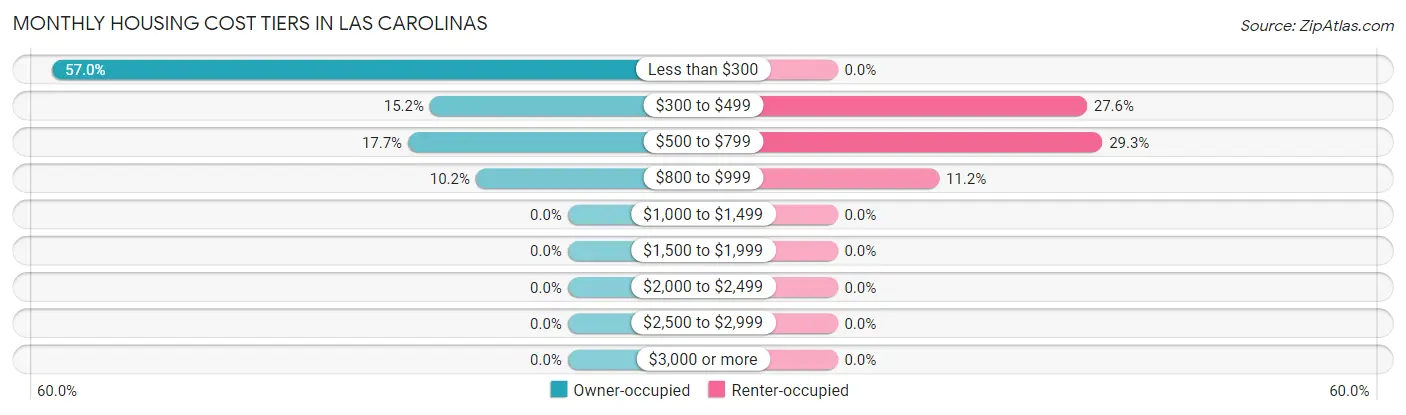
| Monthly Cost | Owner-occupied | Renter-occupied |
| Less than $300 | 213 (57.0%) | 0 (0.0%) |
| $300 to $499 | 57 (15.2%) | 81 (27.6%) |
| $500 to $799 | 66 (17.6%) | 86 (29.2%) |
| $800 to $999 | 38 (10.2%) | 33 (11.2%) |
| $1,000 to $1,499 | 0 (0.0%) | 0 (0.0%) |
| $1,500 to $1,999 | 0 (0.0%) | 0 (0.0%) |
| $2,000 to $2,499 | 0 (0.0%) | 0 (0.0%) |
| $2,500 to $2,999 | 0 (0.0%) | 0 (0.0%) |
| $3,000 or more | 0 (0.0%) | 0 (0.0%) |
| Total | 374 (100.0%) | 294 (100.0%) |
Physical Housing Characteristics in Las Carolinas
Housing Structures in Las Carolinas
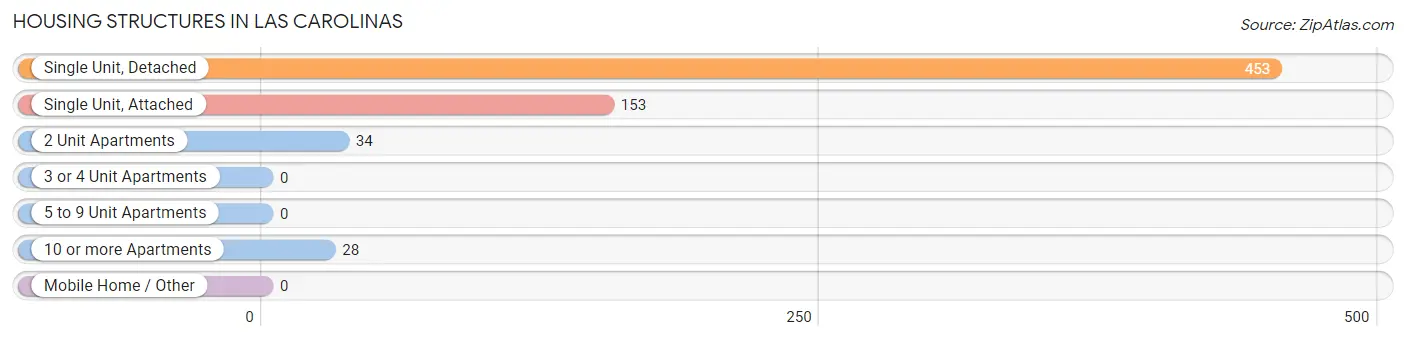
| Structure Type | # Housing Units | % Housing Units |
| Single Unit, Detached | 453 | 67.8% |
| Single Unit, Attached | 153 | 22.9% |
| 2 Unit Apartments | 34 | 5.1% |
| 3 or 4 Unit Apartments | 0 | 0.0% |
| 5 to 9 Unit Apartments | 0 | 0.0% |
| 10 or more Apartments | 28 | 4.2% |
| Mobile Home / Other | 0 | 0.0% |
| Total | 668 | 100.0% |
Housing Structures by Occupancy in Las Carolinas
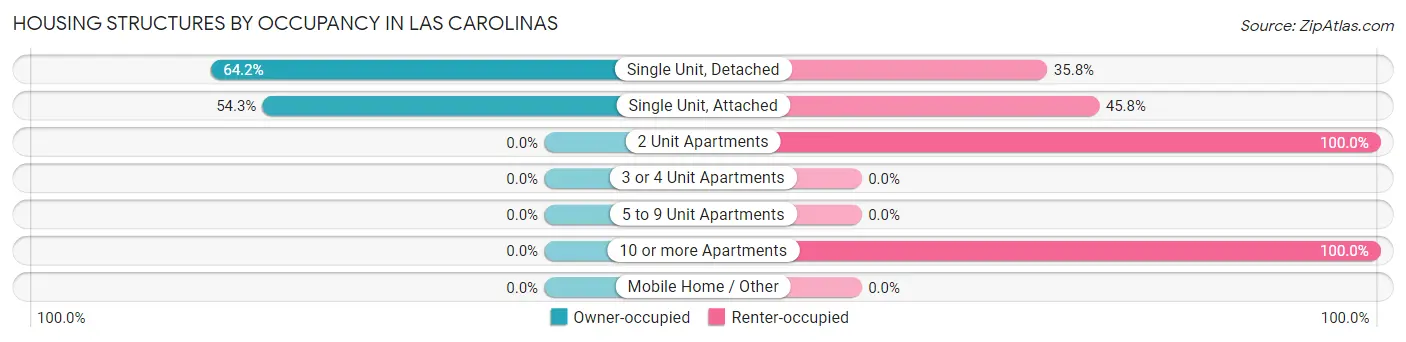
| Structure Type | Owner-occupied | Renter-occupied |
| Single Unit, Detached | 291 (64.2%) | 162 (35.8%) |
| Single Unit, Attached | 83 (54.2%) | 70 (45.8%) |
| 2 Unit Apartments | 0 (0.0%) | 34 (100.0%) |
| 3 or 4 Unit Apartments | 0 (0.0%) | 0 (0.0%) |
| 5 to 9 Unit Apartments | 0 (0.0%) | 0 (0.0%) |
| 10 or more Apartments | 0 (0.0%) | 28 (100.0%) |
| Mobile Home / Other | 0 (0.0%) | 0 (0.0%) |
| Total | 374 (56.0%) | 294 (44.0%) |
Housing Structures by Number of Rooms in Las Carolinas
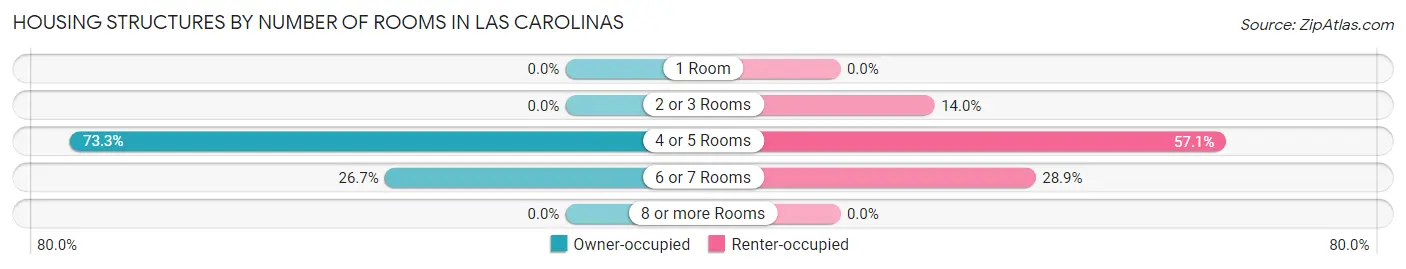
| Number of Rooms | Owner-occupied | Renter-occupied |
| 1 Room | 0 (0.0%) | 0 (0.0%) |
| 2 or 3 Rooms | 0 (0.0%) | 41 (14.0%) |
| 4 or 5 Rooms | 274 (73.3%) | 168 (57.1%) |
| 6 or 7 Rooms | 100 (26.7%) | 85 (28.9%) |
| 8 or more Rooms | 0 (0.0%) | 0 (0.0%) |
| Total | 374 (100.0%) | 294 (100.0%) |
Housing Structure by Heating Type in Las Carolinas
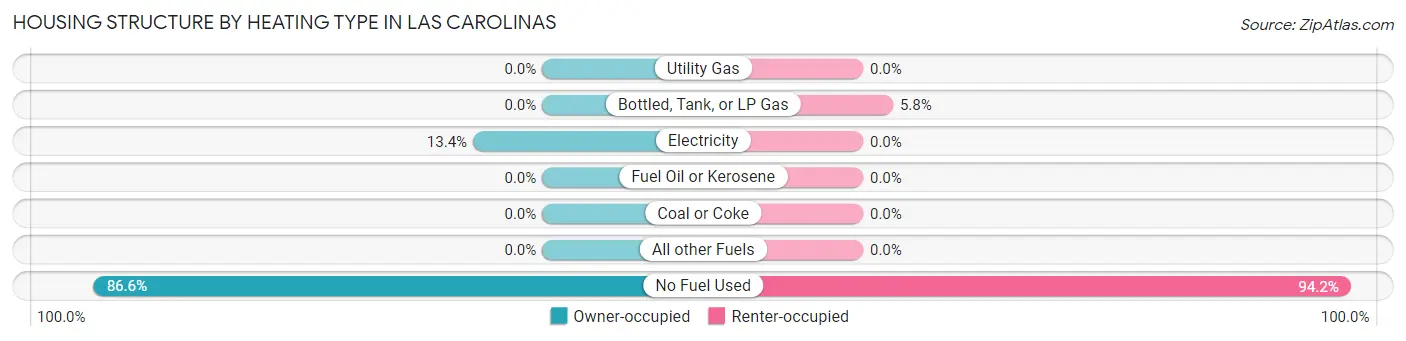
| Heating Type | Owner-occupied | Renter-occupied |
| Utility Gas | 0 (0.0%) | 0 (0.0%) |
| Bottled, Tank, or LP Gas | 0 (0.0%) | 17 (5.8%) |
| Electricity | 50 (13.4%) | 0 (0.0%) |
| Fuel Oil or Kerosene | 0 (0.0%) | 0 (0.0%) |
| Coal or Coke | 0 (0.0%) | 0 (0.0%) |
| All other Fuels | 0 (0.0%) | 0 (0.0%) |
| No Fuel Used | 324 (86.6%) | 277 (94.2%) |
| Total | 374 (100.0%) | 294 (100.0%) |
Household Vehicle Usage in Las Carolinas
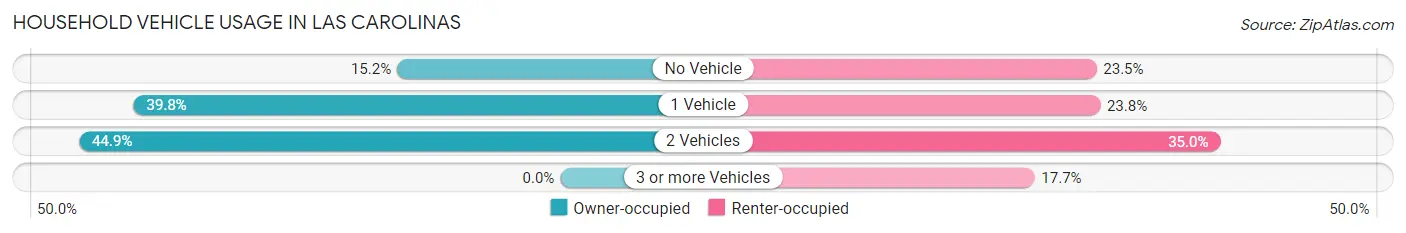
| Vehicles per Household | Owner-occupied | Renter-occupied |
| No Vehicle | 57 (15.2%) | 69 (23.5%) |
| 1 Vehicle | 149 (39.8%) | 70 (23.8%) |
| 2 Vehicles | 168 (44.9%) | 103 (35.0%) |
| 3 or more Vehicles | 0 (0.0%) | 52 (17.7%) |
| Total | 374 (100.0%) | 294 (100.0%) |
Real Estate & Mortgages in Las Carolinas
Real Estate and Mortgage Overview in Las Carolinas
| Characteristic | Without Mortgage | With Mortgage |
| Housing Units | 270 | 104 |
| Median Property Value | $112,100 | $0 |
| Median Household Income | $15,682 | $0 |
| Monthly Housing Costs | $179 | $0 |
| Real Estate Taxes | - | - |
Property Value by Mortgage Status in Las Carolinas
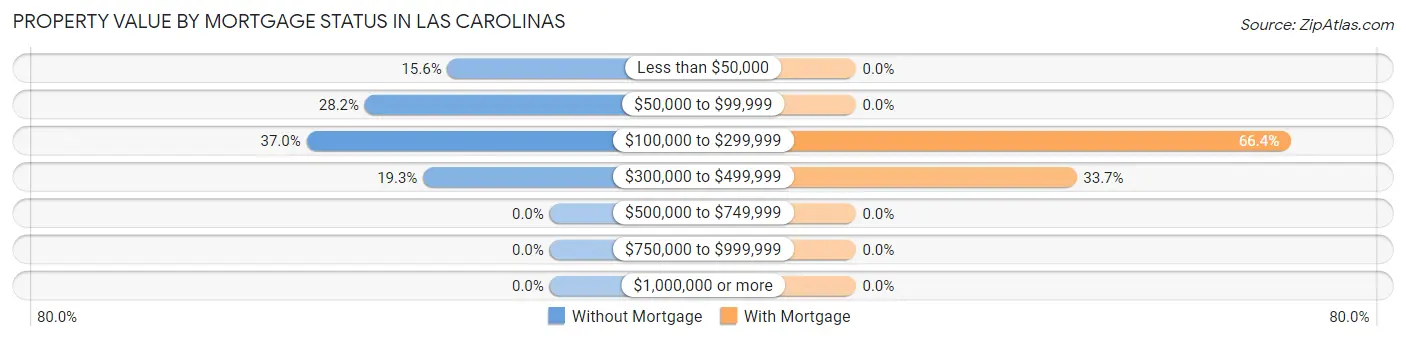
| Property Value | Without Mortgage | With Mortgage |
| Less than $50,000 | 42 (15.6%) | 0 (0.0%) |
| $50,000 to $99,999 | 76 (28.1%) | 0 (0.0%) |
| $100,000 to $299,999 | 100 (37.0%) | 69 (66.3%) |
| $300,000 to $499,999 | 52 (19.3%) | 35 (33.7%) |
| $500,000 to $749,999 | 0 (0.0%) | 0 (0.0%) |
| $750,000 to $999,999 | 0 (0.0%) | 0 (0.0%) |
| $1,000,000 or more | 0 (0.0%) | 0 (0.0%) |
| Total | 270 (100.0%) | 104 (100.0%) |
Household Income by Mortgage Status in Las Carolinas
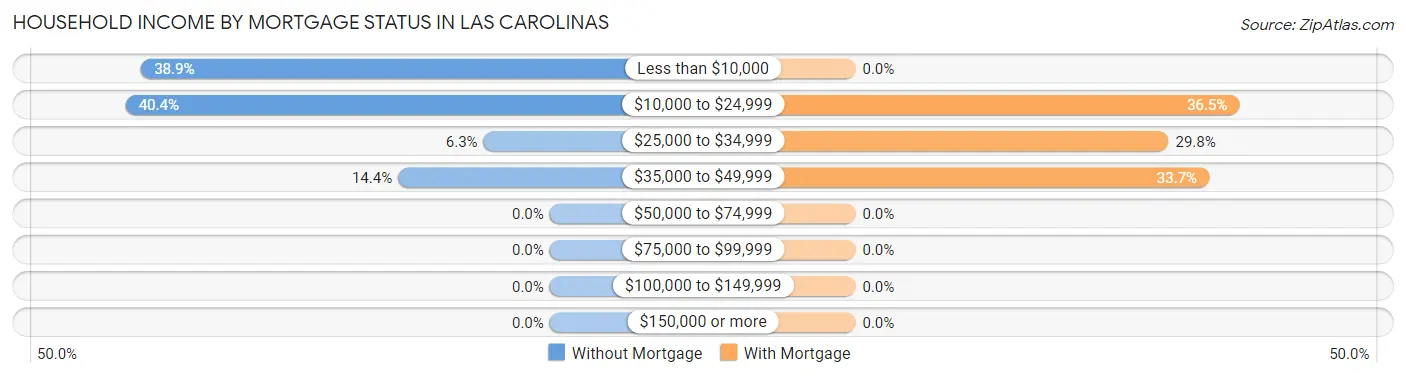
| Household Income | Without Mortgage | With Mortgage |
| Less than $10,000 | 105 (38.9%) | 0 (0.0%) |
| $10,000 to $24,999 | 109 (40.4%) | 38 (36.5%) |
| $25,000 to $34,999 | 17 (6.3%) | 31 (29.8%) |
| $35,000 to $49,999 | 39 (14.4%) | 35 (33.7%) |
| $50,000 to $74,999 | 0 (0.0%) | 0 (0.0%) |
| $75,000 to $99,999 | 0 (0.0%) | 0 (0.0%) |
| $100,000 to $149,999 | 0 (0.0%) | 0 (0.0%) |
| $150,000 or more | 0 (0.0%) | 0 (0.0%) |
| Total | 270 (100.0%) | 104 (100.0%) |
Property Value to Household Income Ratio in Las Carolinas
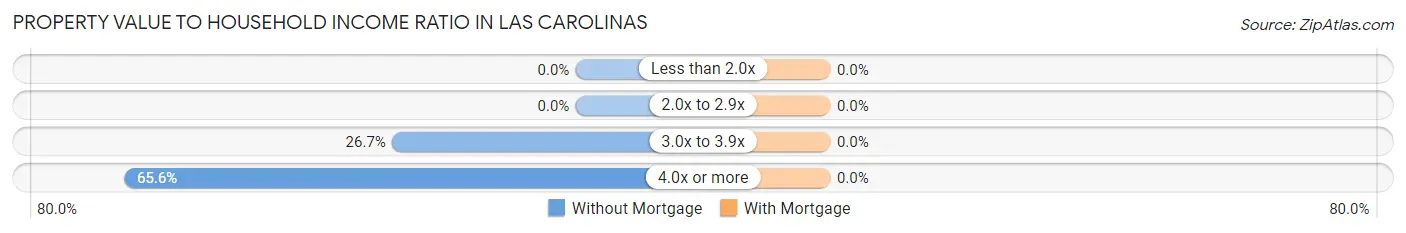
| Value-to-Income Ratio | Without Mortgage | With Mortgage |
| Less than 2.0x | 0 (0.0%) | 0 (0.0%) |
| 2.0x to 2.9x | 0 (0.0%) | 0 (0.0%) |
| 3.0x to 3.9x | 72 (26.7%) | 0 (0.0%) |
| 4.0x or more | 177 (65.6%) | 0 (0.0%) |
| Total | 270 (100.0%) | 104 (100.0%) |
Real Estate Taxes by Mortgage Status in Las Carolinas
| Property Taxes | Without Mortgage | With Mortgage |
| Less than $800 | 0 (0.0%) | 0 (0.0%) |
| $800 to $1,499 | 0 (0.0%) | 0 (0.0%) |
| $800 to $1,499 | 0 (0.0%) | 0 (0.0%) |
| Total | 270 (100.0%) | 104 (100.0%) |
Health & Disability in Las Carolinas
Health Insurance Coverage by Age in Las Carolinas
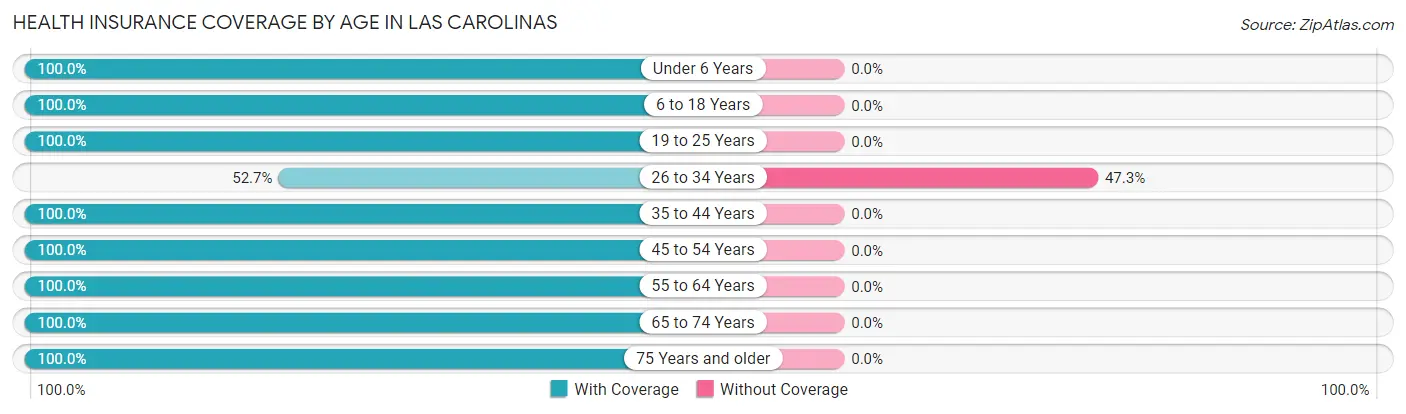
| Age Bracket | With Coverage | Without Coverage |
| Under 6 Years | 179 (100.0%) | 0 (0.0%) |
| 6 to 18 Years | 176 (100.0%) | 0 (0.0%) |
| 19 to 25 Years | 105 (100.0%) | 0 (0.0%) |
| 26 to 34 Years | 196 (52.7%) | 176 (47.3%) |
| 35 to 44 Years | 194 (100.0%) | 0 (0.0%) |
| 45 to 54 Years | 263 (100.0%) | 0 (0.0%) |
| 55 to 64 Years | 229 (100.0%) | 0 (0.0%) |
| 65 to 74 Years | 170 (100.0%) | 0 (0.0%) |
| 75 Years and older | 150 (100.0%) | 0 (0.0%) |
| Total | 1,662 (90.4%) | 176 (9.6%) |
Health Insurance Coverage by Citizenship Status in Las Carolinas
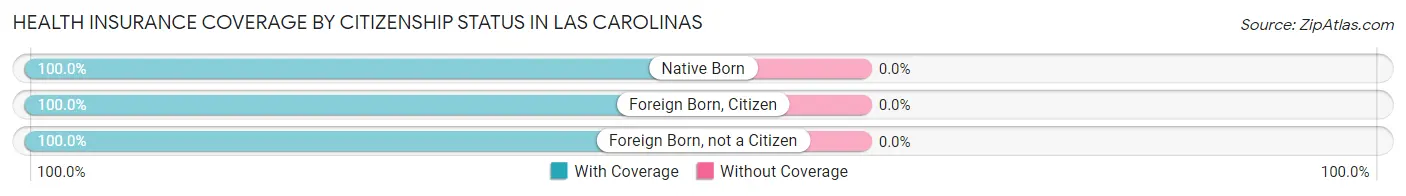
| Citizenship Status | With Coverage | Without Coverage |
| Native Born | 179 (100.0%) | 0 (0.0%) |
| Foreign Born, Citizen | 176 (100.0%) | 0 (0.0%) |
| Foreign Born, not a Citizen | 105 (100.0%) | 0 (0.0%) |
Health Insurance Coverage by Household Income in Las Carolinas
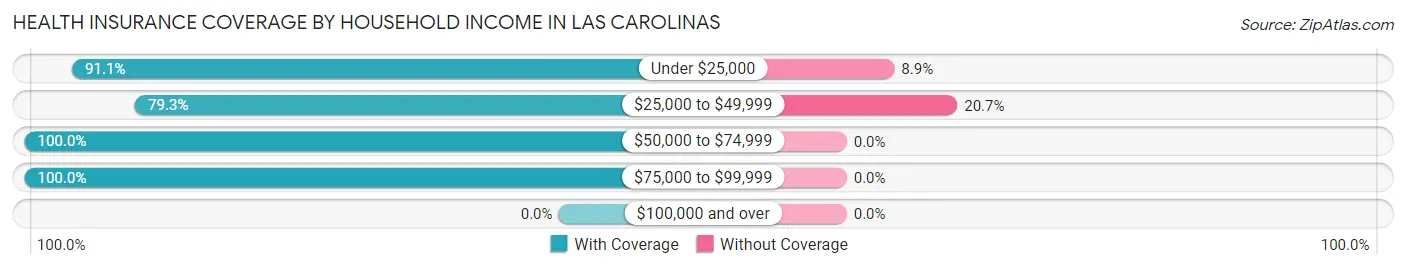
| Household Income | With Coverage | Without Coverage |
| Under $25,000 | 960 (91.1%) | 94 (8.9%) |
| $25,000 to $49,999 | 314 (79.3%) | 82 (20.7%) |
| $50,000 to $74,999 | 258 (100.0%) | 0 (0.0%) |
| $75,000 to $99,999 | 130 (100.0%) | 0 (0.0%) |
| $100,000 and over | 0 (0.0%) | 0 (0.0%) |
Public vs Private Health Insurance Coverage by Age in Las Carolinas
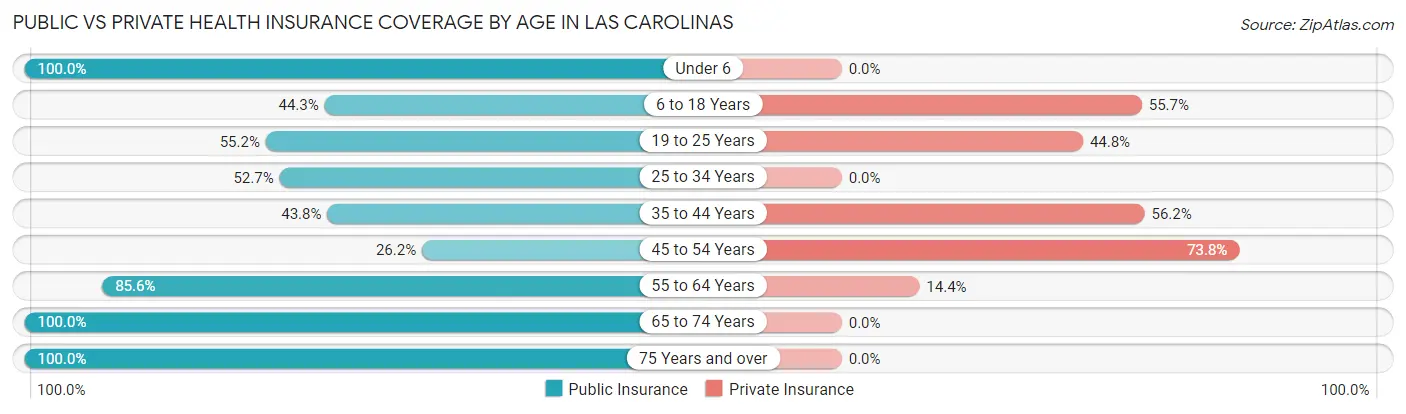
| Age Bracket | Public Insurance | Private Insurance |
| Under 6 | 179 (100.0%) | 0 (0.0%) |
| 6 to 18 Years | 78 (44.3%) | 98 (55.7%) |
| 19 to 25 Years | 58 (55.2%) | 47 (44.8%) |
| 25 to 34 Years | 196 (52.7%) | 0 (0.0%) |
| 35 to 44 Years | 85 (43.8%) | 109 (56.2%) |
| 45 to 54 Years | 69 (26.2%) | 194 (73.8%) |
| 55 to 64 Years | 196 (85.6%) | 33 (14.4%) |
| 65 to 74 Years | 170 (100.0%) | 0 (0.0%) |
| 75 Years and over | 150 (100.0%) | 0 (0.0%) |
| Total | 1,181 (64.2%) | 481 (26.2%) |
Disability Status by Sex by Age in Las Carolinas
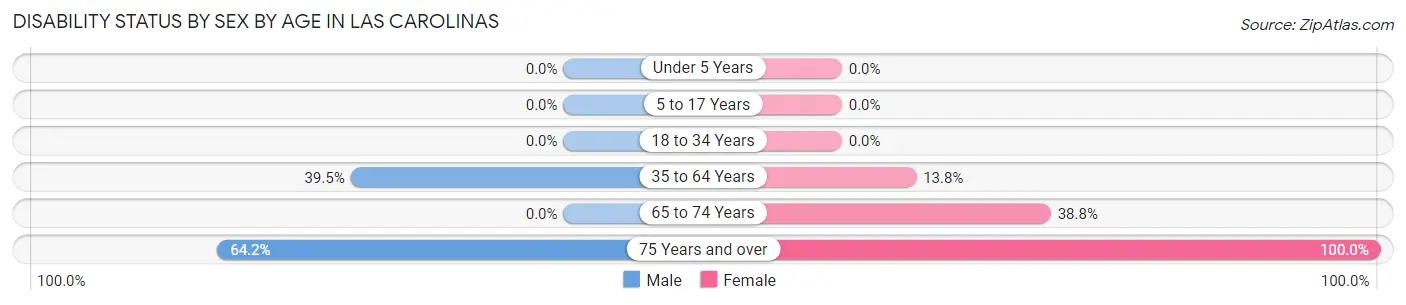
| Age Bracket | Male | Female |
| Under 5 Years | 0 (0.0%) | 0 (0.0%) |
| 5 to 17 Years | 0 (0.0%) | 0 (0.0%) |
| 18 to 34 Years | 0 (0.0%) | 0 (0.0%) |
| 35 to 64 Years | 128 (39.5%) | 50 (13.8%) |
| 65 to 74 Years | 0 (0.0%) | 38 (38.8%) |
| 75 Years and over | 79 (64.2%) | 27 (100.0%) |
Disability Class by Sex by Age in Las Carolinas
Disability Class: Hearing Difficulty
| Age Bracket | Male | Female |
| Under 5 Years | 0 (0.0%) | 0 (0.0%) |
| 5 to 17 Years | 0 (0.0%) | 0 (0.0%) |
| 18 to 34 Years | 0 (0.0%) | 0 (0.0%) |
| 35 to 64 Years | 0 (0.0%) | 0 (0.0%) |
| 65 to 74 Years | 0 (0.0%) | 0 (0.0%) |
| 75 Years and over | 0 (0.0%) | 0 (0.0%) |
Disability Class: Vision Difficulty
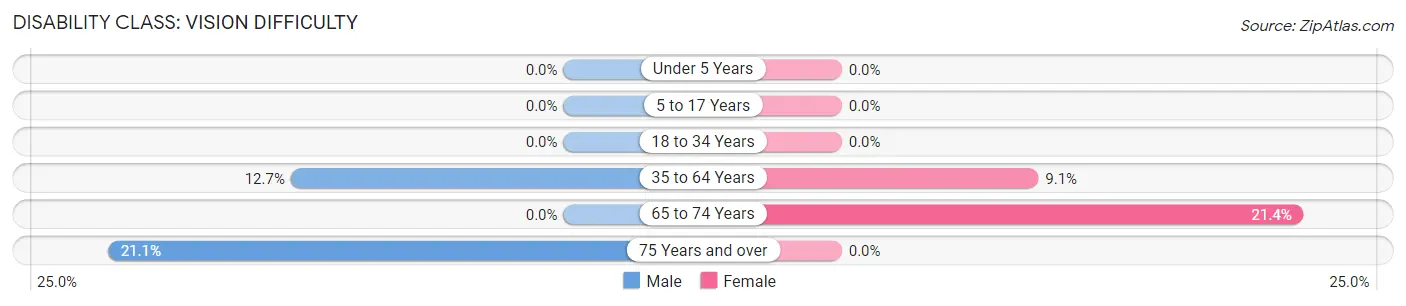
| Age Bracket | Male | Female |
| Under 5 Years | 0 (0.0%) | 0 (0.0%) |
| 5 to 17 Years | 0 (0.0%) | 0 (0.0%) |
| 18 to 34 Years | 0 (0.0%) | 0 (0.0%) |
| 35 to 64 Years | 41 (12.7%) | 33 (9.1%) |
| 65 to 74 Years | 0 (0.0%) | 21 (21.4%) |
| 75 Years and over | 26 (21.1%) | 0 (0.0%) |
Disability Class: Cognitive Difficulty
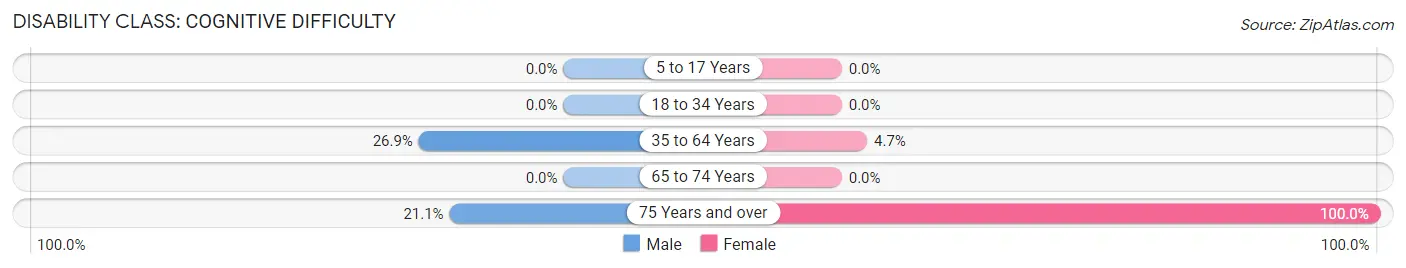
| Age Bracket | Male | Female |
| 5 to 17 Years | 0 (0.0%) | 0 (0.0%) |
| 18 to 34 Years | 0 (0.0%) | 0 (0.0%) |
| 35 to 64 Years | 87 (26.9%) | 17 (4.7%) |
| 65 to 74 Years | 0 (0.0%) | 0 (0.0%) |
| 75 Years and over | 26 (21.1%) | 27 (100.0%) |
Disability Class: Ambulatory Difficulty
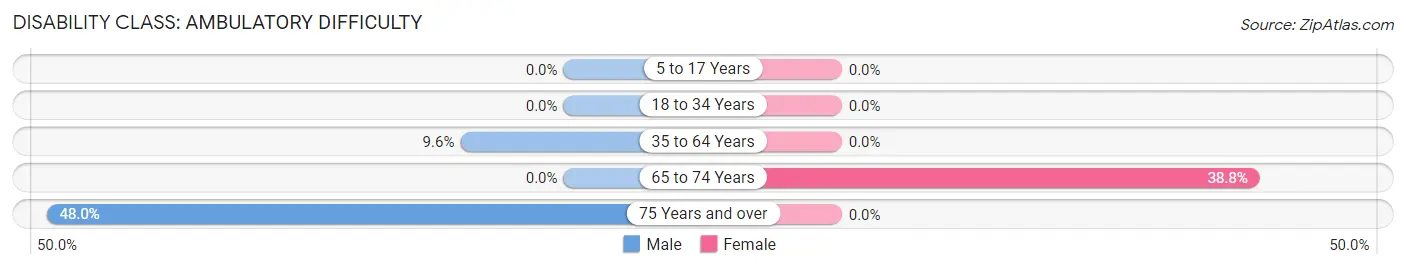
| Age Bracket | Male | Female |
| 5 to 17 Years | 0 (0.0%) | 0 (0.0%) |
| 18 to 34 Years | 0 (0.0%) | 0 (0.0%) |
| 35 to 64 Years | 31 (9.6%) | 0 (0.0%) |
| 65 to 74 Years | 0 (0.0%) | 38 (38.8%) |
| 75 Years and over | 59 (48.0%) | 0 (0.0%) |
Disability Class: Self-Care Difficulty
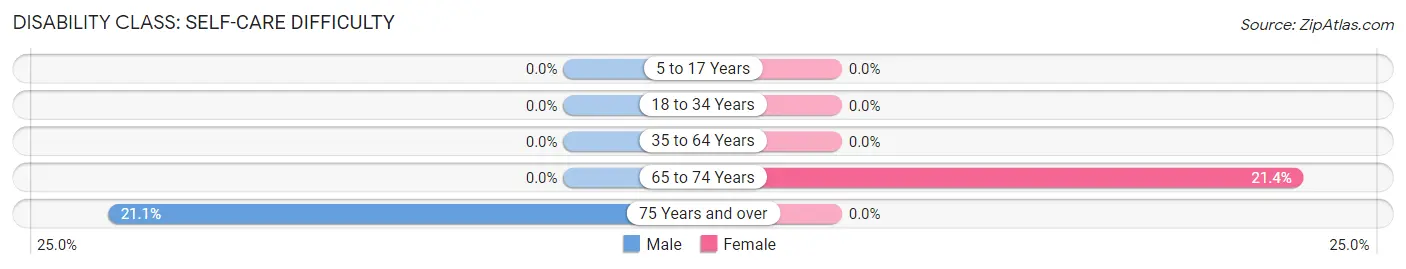
| Age Bracket | Male | Female |
| 5 to 17 Years | 0 (0.0%) | 0 (0.0%) |
| 18 to 34 Years | 0 (0.0%) | 0 (0.0%) |
| 35 to 64 Years | 0 (0.0%) | 0 (0.0%) |
| 65 to 74 Years | 0 (0.0%) | 21 (21.4%) |
| 75 Years and over | 26 (21.1%) | 0 (0.0%) |
Technology Access in Las Carolinas
Computing Device Access in Las Carolinas
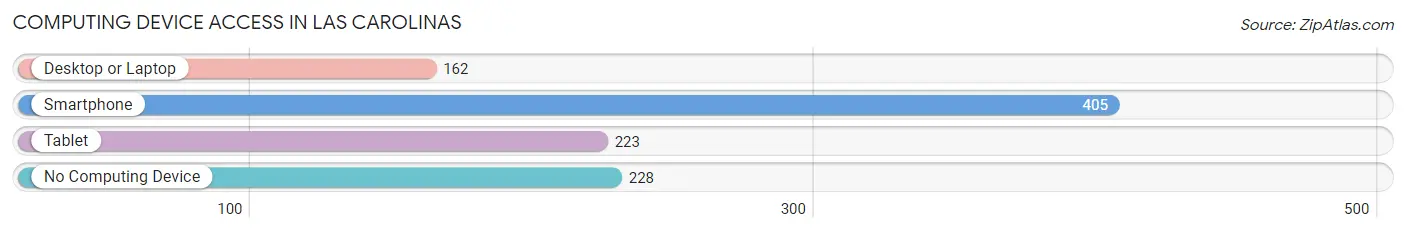
| Device Type | # Households | % Households |
| Desktop or Laptop | 162 | 24.2% |
| Smartphone | 405 | 60.6% |
| Tablet | 223 | 33.4% |
| No Computing Device | 228 | 34.1% |
| Total | 668 | 100.0% |
Internet Access in Las Carolinas
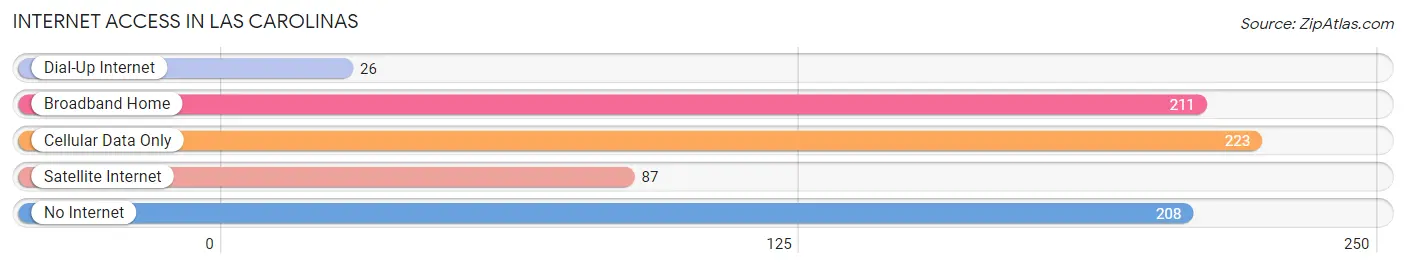
| Internet Type | # Households | % Households |
| Dial-Up Internet | 26 | 3.9% |
| Broadband Home | 211 | 31.6% |
| Cellular Data Only | 223 | 33.4% |
| Satellite Internet | 87 | 13.0% |
| No Internet | 208 | 31.1% |
| Total | 668 | 100.0% |
Las Carolinas Summary
Carolinas, Puerto Rico is a municipality located in the northern coast of Puerto Rico, bordered by the Atlantic Ocean to the north, Loíza to the east, Canóvanas to the south, and Río Grande to the west. It is part of the San Juan-Caguas-Guaynabo Metropolitan Statistical Area. As of the 2010 census, the municipality had a population of 39,186.
History
The area of what is now known as Carolinas was originally inhabited by the Taíno Indians. The first European to arrive in the area was Juan Ponce de León in 1508. The area was later colonized by the Spanish in 1521. The area was part of the municipality of Loíza until 1831, when it was separated and established as its own municipality.
Geography
Carolinas is located in the northern coast of Puerto Rico, bordered by the Atlantic Ocean to the north, Loíza to the east, Canóvanas to the south, and Río Grande to the west. It has a total area of 24.7 square miles (63.9 km2). The terrain is mostly flat with some hills in the interior. The highest point is Cerro La Torre, which has an elevation of 1,065 feet (325 m).
Climate
Carolinas has a tropical climate, with an average temperature of 79°F (26°C). The average annual precipitation is 64 inches (1,630 mm).
Economy
The economy of Carolinas is mainly based on agriculture and tourism. The main agricultural products are sugarcane, bananas, and plantains. The main tourist attractions are the beaches, which attract thousands of visitors each year.
Demographics
As of the 2010 census, the population of Carolinas was 39,186, with a population density of 1,590 people per square mile (613/km2). The racial makeup of the municipality was 79.3% White, 0.7% African American, 0.3% Native American, 0.2% Asian, 0.1% Pacific Islander, 17.3% other races, and 2.3% from two or more races. The median household income was $14,945. The per capita income was $7,945.
The population of Carolinas is mostly Roman Catholic (90.2%), with a small percentage of other religions. The main language spoken is Spanish (97.2%), with a small percentage of English (2.8%).
Common Questions
What is Per Capita Income in Las Carolinas?
Per Capita income in Las Carolinas is $10,516.
What is the Median Family Income in Las Carolinas?
Median Family Income in Las Carolinas is $22,813.
What is the Median Household income in Las Carolinas?
Median Household Income in Las Carolinas is $19,355.
What is Inequality or Gini Index in Las Carolinas?
Inequality or Gini Index in Las Carolinas is 0.42.
What is the Total Population of Las Carolinas?
Total Population of Las Carolinas is 1,838.
What is the Total Male Population of Las Carolinas?
Total Male Population of Las Carolinas is 883.
What is the Total Female Population of Las Carolinas?
Total Female Population of Las Carolinas is 955.
What is the Ratio of Males per 100 Females in Las Carolinas?
There are 92.46 Males per 100 Females in Las Carolinas.
What is the Ratio of Females per 100 Males in Las Carolinas?
There are 108.15 Females per 100 Males in Las Carolinas.
What is the Median Population Age in Las Carolinas?
Median Population Age in Las Carolinas is 40.0 Years.
What is the Average Family Size in Las Carolinas
Average Family Size in Las Carolinas is 3.0 People.
What is the Average Household Size in Las Carolinas
Average Household Size in Las Carolinas is 2.8 People.
How Large is the Labor Force in Las Carolinas?
There are 804 People in the Labor Forcein in Las Carolinas.
What is the Percentage of People in the Labor Force in Las Carolinas?
52.2% of People are in the Labor Force in Las Carolinas.
What is the Unemployment Rate in Las Carolinas?
Unemployment Rate in Las Carolinas is 23.9%.