Lares, PR Map & Demographics
Lares Map
Lares Overview
$11,869
PER CAPITA INCOME
$23,192
AVG FAMILY INCOME
$19,254
AVG HOUSEHOLD INCOME
22.2%
WAGE / INCOME GAP [ % ]
77.8¢/ $1
WAGE / INCOME GAP [ $ ]
$11,300
FAMILY INCOME DEFICIT
0.49
INEQUALITY / GINI INDEX
4,871
TOTAL POPULATION
2,326
MALE POPULATION
2,545
FEMALE POPULATION
91.39
MALES / 100 FEMALES
109.42
FEMALES / 100 MALES
49.5
MEDIAN AGE
2.9
AVG FAMILY SIZE
2.4
AVG HOUSEHOLD SIZE
1,775
LABOR FORCE [ PEOPLE ]
42.0%
PERCENT IN LABOR FORCE
15.1%
UNEMPLOYMENT RATE
Lares Zip Codes
Lares Area Codes
Income in Lares
Income Overview in Lares
Per Capita Income in Lares is $11,869, while median incomes of families and households are $23,192 and $19,254 respectively.
| Characteristic | Number | Measure |
| Per Capita Income | 4,871 | $11,869 |
| Median Family Income | 1,352 | $23,192 |
| Mean Family Income | 1,352 | $30,085 |
| Median Household Income | 2,034 | $19,254 |
| Mean Household Income | 2,034 | $25,925 |
| Income Deficit | 1,352 | $11,300 |
| Wage / Income Gap (%) | 4,871 | 22.20% |
| Wage / Income Gap ($) | 4,871 | 77.80¢ per $1 |
| Gini / Inequality Index | 4,871 | 0.49 |
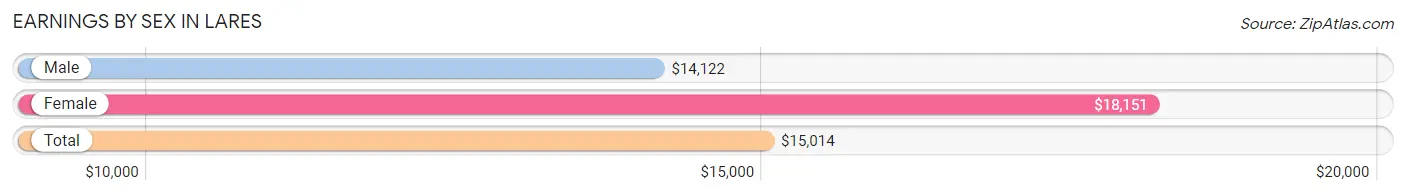
Earnings by Sex in Lares
Average Earnings in Lares are $15,014, $14,122 for men and $18,151 for women, a difference of 22.2%.
| Sex | Number | Average Earnings |
| Male | 1,016 (61.7%) | $14,122 |
| Female | 630 (38.3%) | $18,151 |
| Total | 1,646 (100.0%) | $15,014 |
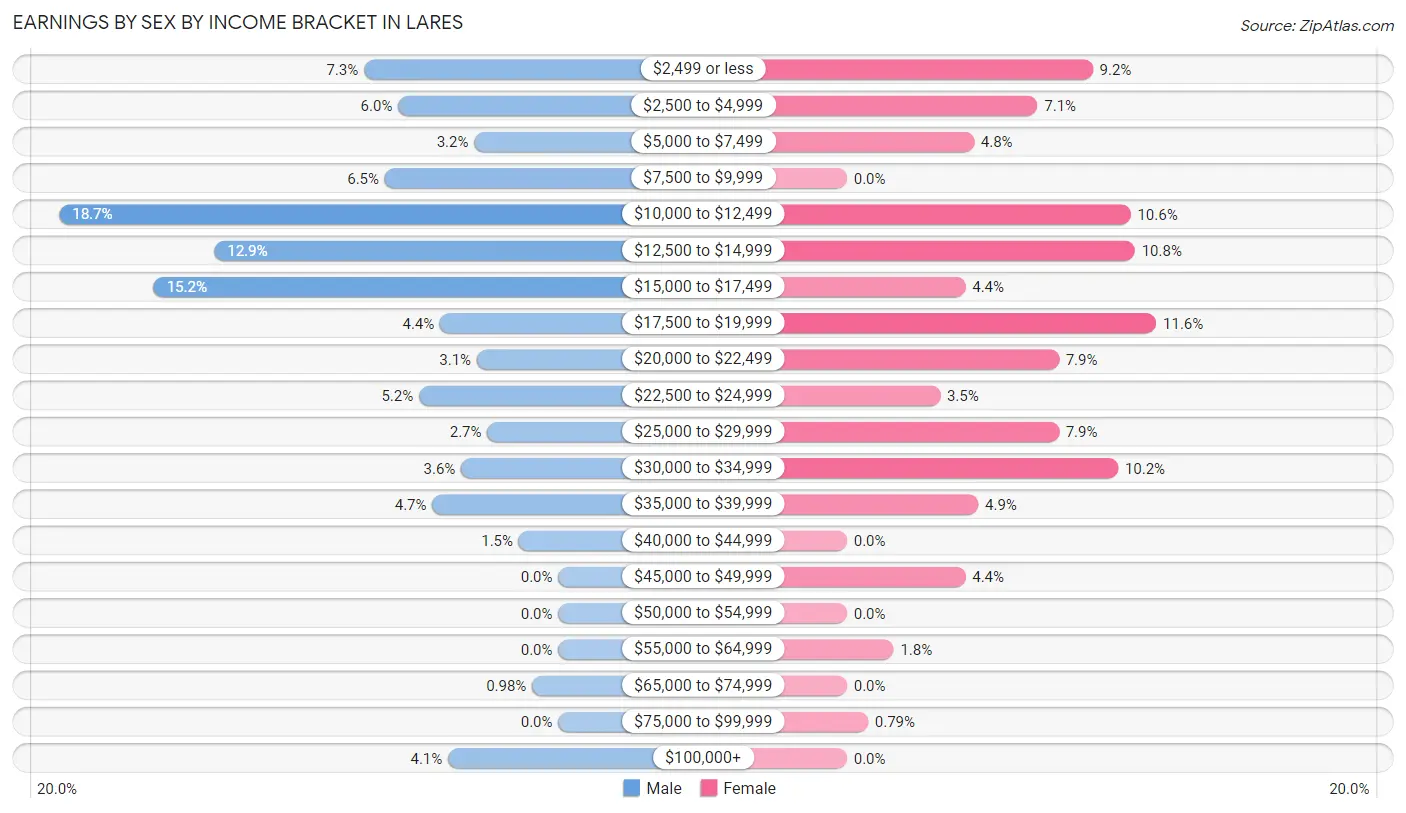
Earnings by Sex by Income Bracket in Lares
The most common earnings brackets in Lares are $10,000 to $12,499 for men (190 | 18.7%) and $17,500 to $19,999 for women (73 | 11.6%).
| Income | Male | Female |
| $2,499 or less | 74 (7.3%) | 58 (9.2%) |
| $2,500 to $4,999 | 61 (6.0%) | 45 (7.1%) |
| $5,000 to $7,499 | 32 (3.2%) | 30 (4.8%) |
| $7,500 to $9,999 | 66 (6.5%) | 0 (0.0%) |
| $10,000 to $12,499 | 190 (18.7%) | 67 (10.6%) |
| $12,500 to $14,999 | 131 (12.9%) | 68 (10.8%) |
| $15,000 to $17,499 | 154 (15.2%) | 28 (4.4%) |
| $17,500 to $19,999 | 45 (4.4%) | 73 (11.6%) |
| $20,000 to $22,499 | 31 (3.0%) | 50 (7.9%) |
| $22,500 to $24,999 | 53 (5.2%) | 22 (3.5%) |
| $25,000 to $29,999 | 27 (2.7%) | 50 (7.9%) |
| $30,000 to $34,999 | 37 (3.6%) | 64 (10.2%) |
| $35,000 to $39,999 | 48 (4.7%) | 31 (4.9%) |
| $40,000 to $44,999 | 15 (1.5%) | 0 (0.0%) |
| $45,000 to $49,999 | 0 (0.0%) | 28 (4.4%) |
| $50,000 to $54,999 | 0 (0.0%) | 0 (0.0%) |
| $55,000 to $64,999 | 0 (0.0%) | 11 (1.8%) |
| $65,000 to $74,999 | 10 (1.0%) | 0 (0.0%) |
| $75,000 to $99,999 | 0 (0.0%) | 5 (0.8%) |
| $100,000+ | 42 (4.1%) | 0 (0.0%) |
| Total | 1,016 (100.0%) | 630 (100.0%) |
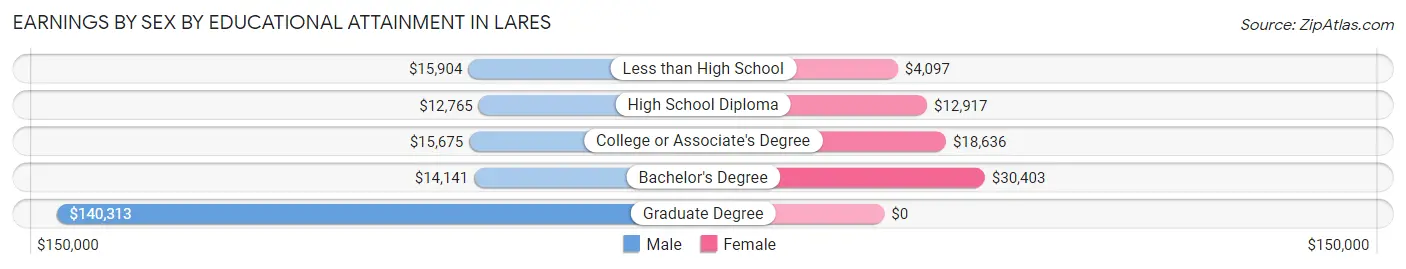
Earnings by Sex by Educational Attainment in Lares
Average earnings in Lares are $14,923 for men and $19,538 for women, a difference of 23.6%. Men with an educational attainment of graduate degree enjoy the highest average annual earnings of $140,313, while those with high school diploma education earn the least with $12,765. Women with an educational attainment of bachelor's degree earn the most with the average annual earnings of $30,403, while those with less than high school education have the smallest earnings of $4,097.
| Educational Attainment | Male Income | Female Income |
| Less than High School | $15,904 | $4,097 |
| High School Diploma | $12,765 | $12,917 |
| College or Associate's Degree | $15,675 | $18,636 |
| Bachelor's Degree | $14,141 | $30,403 |
| Graduate Degree | $140,313 | $0 |
| Total | $14,923 | $19,538 |
Family Income in Lares
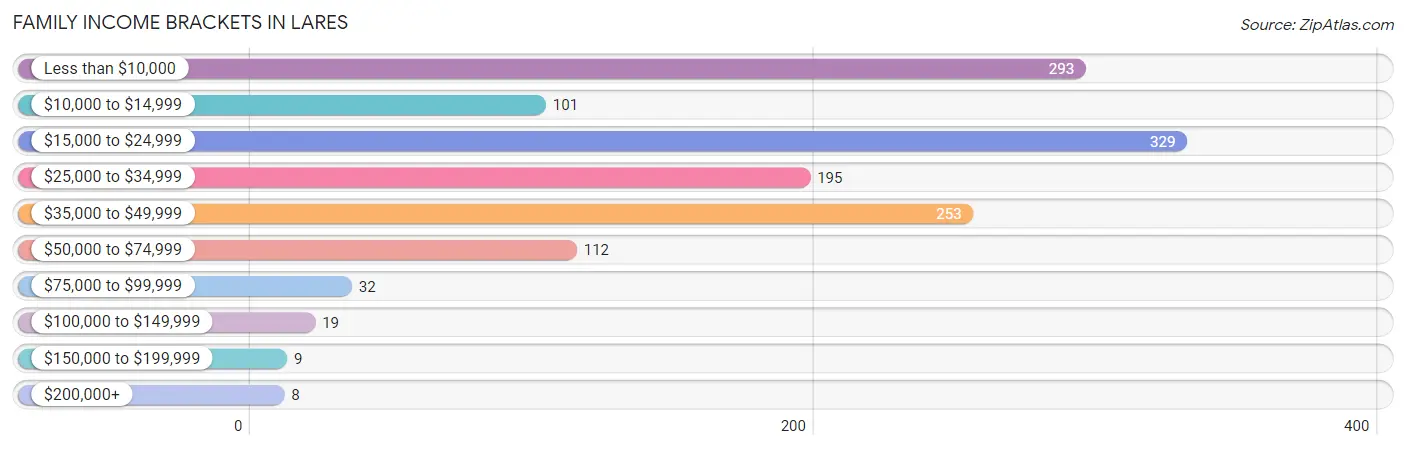
Family Income Brackets in Lares
According to the Lares family income data, there are 329 families falling into the $15,000 to $24,999 income range, which is the most common income bracket and makes up 24.3% of all families. Conversely, the $200,000+ income bracket is the least frequent group with only 8 families (0.6%) belonging to this category.
| Income Bracket | # Families | % Families |
| Less than $10,000 | 293 | 21.7% |
| $10,000 to $14,999 | 101 | 7.5% |
| $15,000 to $24,999 | 329 | 24.3% |
| $25,000 to $34,999 | 195 | 14.4% |
| $35,000 to $49,999 | 253 | 18.7% |
| $50,000 to $74,999 | 112 | 8.3% |
| $75,000 to $99,999 | 32 | 2.4% |
| $100,000 to $149,999 | 19 | 1.4% |
| $150,000 to $199,999 | 9 | 0.7% |
| $200,000+ | 8 | 0.6% |
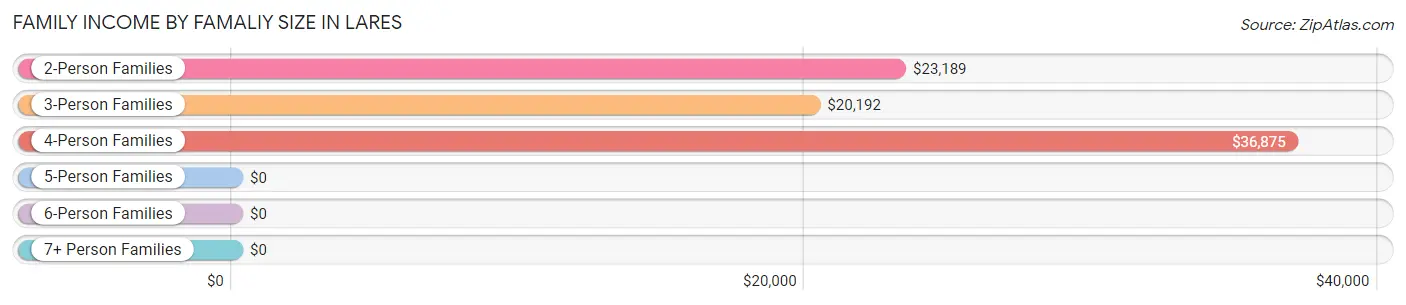
Family Income by Famaliy Size in Lares
4-person families (190 | 14.1%) account for the highest median family income in Lares with $36,875 per family, while 2-person families (749 | 55.4%) have the highest median income of $11,594 per family member.
| Income Bracket | # Families | Median Income |
| 2-Person Families | 749 (55.4%) | $23,189 |
| 3-Person Families | 390 (28.8%) | $20,192 |
| 4-Person Families | 190 (14.1%) | $36,875 |
| 5-Person Families | 23 (1.7%) | $0 |
| 6-Person Families | 0 (0.0%) | $0 |
| 7+ Person Families | 0 (0.0%) | $0 |
| Total | 1,352 (100.0%) | $23,192 |
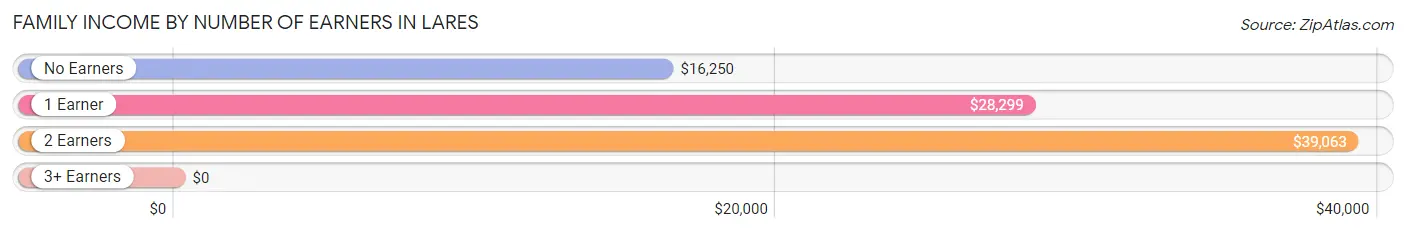
Family Income by Number of Earners in Lares
| Number of Earners | # Families | Median Income |
| No Earners | 513 (37.9%) | $16,250 |
| 1 Earner | 517 (38.2%) | $28,299 |
| 2 Earners | 314 (23.2%) | $39,063 |
| 3+ Earners | 8 (0.6%) | $0 |
| Total | 1,352 (100.0%) | $23,192 |
Household Income in Lares
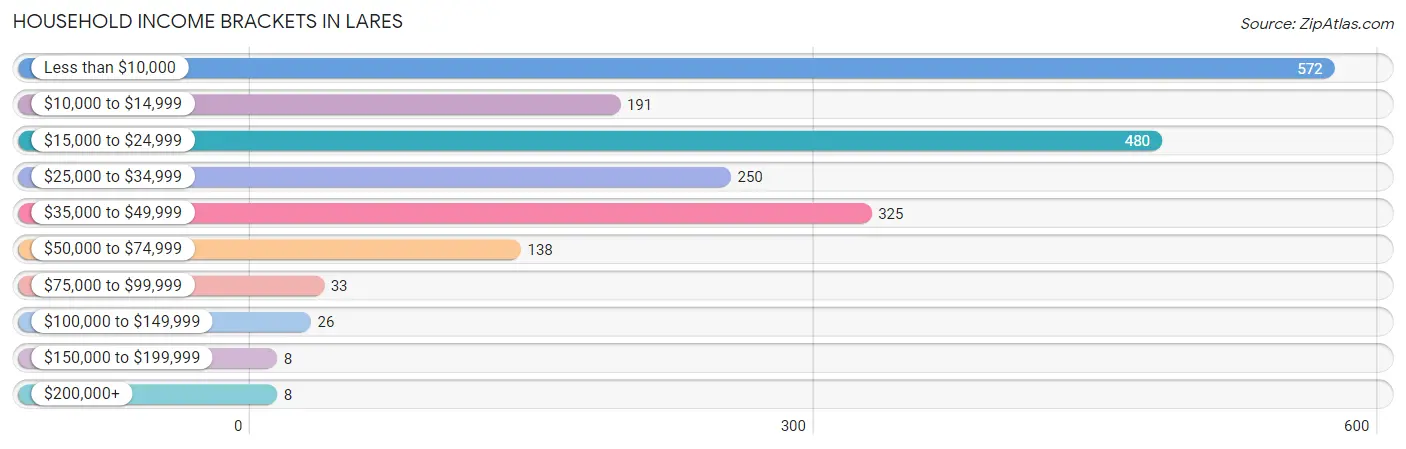
Household Income Brackets in Lares
With 572 households falling in the category, the less than $10,000 income range is the most frequent in Lares, accounting for 28.1% of all households. In contrast, only 8 households (0.4%) fall into the $150,000 to $199,999 income bracket, making it the least populous group.
| Income Bracket | # Households | % Households |
| Less than $10,000 | 572 | 28.1% |
| $10,000 to $14,999 | 191 | 9.4% |
| $15,000 to $24,999 | 480 | 23.6% |
| $25,000 to $34,999 | 250 | 12.3% |
| $35,000 to $49,999 | 325 | 16.0% |
| $50,000 to $74,999 | 138 | 6.8% |
| $75,000 to $99,999 | 33 | 1.6% |
| $100,000 to $149,999 | 26 | 1.3% |
| $150,000 to $199,999 | 8 | 0.4% |
| $200,000+ | 8 | 0.4% |
Household Income by Householder Age in Lares
The median household income in Lares is $19,254, with the highest median household income of $27,679 found in the 25 to 44 years age bracket for the primary householder. A total of 411 households (20.2%) fall into this category. Meanwhile, the 15 to 24 years age bracket for the primary householder has the lowest median household income of $0, with 21 households (1.0%) in this group.
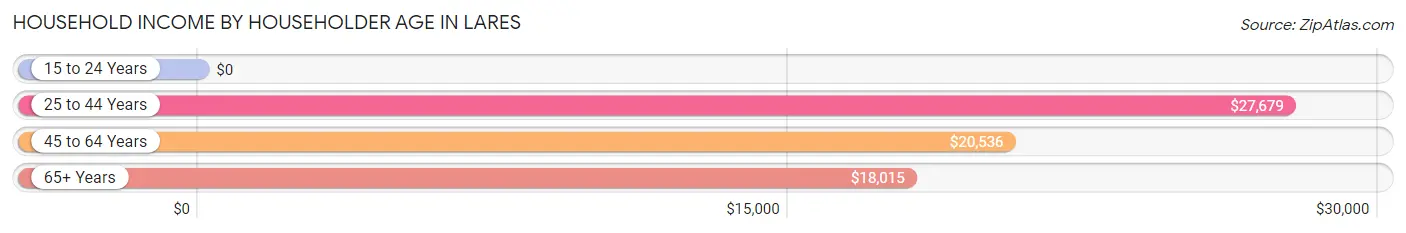
| Income Bracket | # Households | Median Income |
| 15 to 24 Years | 21 (1.0%) | $0 |
| 25 to 44 Years | 411 (20.2%) | $27,679 |
| 45 to 64 Years | 848 (41.7%) | $20,536 |
| 65+ Years | 754 (37.1%) | $18,015 |
| Total | 2,034 (100.0%) | $19,254 |
Poverty in Lares
Income Below Poverty by Sex and Age in Lares
With 48.8% poverty level for males and 51.8% for females among the residents of Lares, 5 year old males and under 5 year old females are the most vulnerable to poverty, with 59 males (100.0%) and 111 females (100.0%) in their respective age groups living below the poverty level.
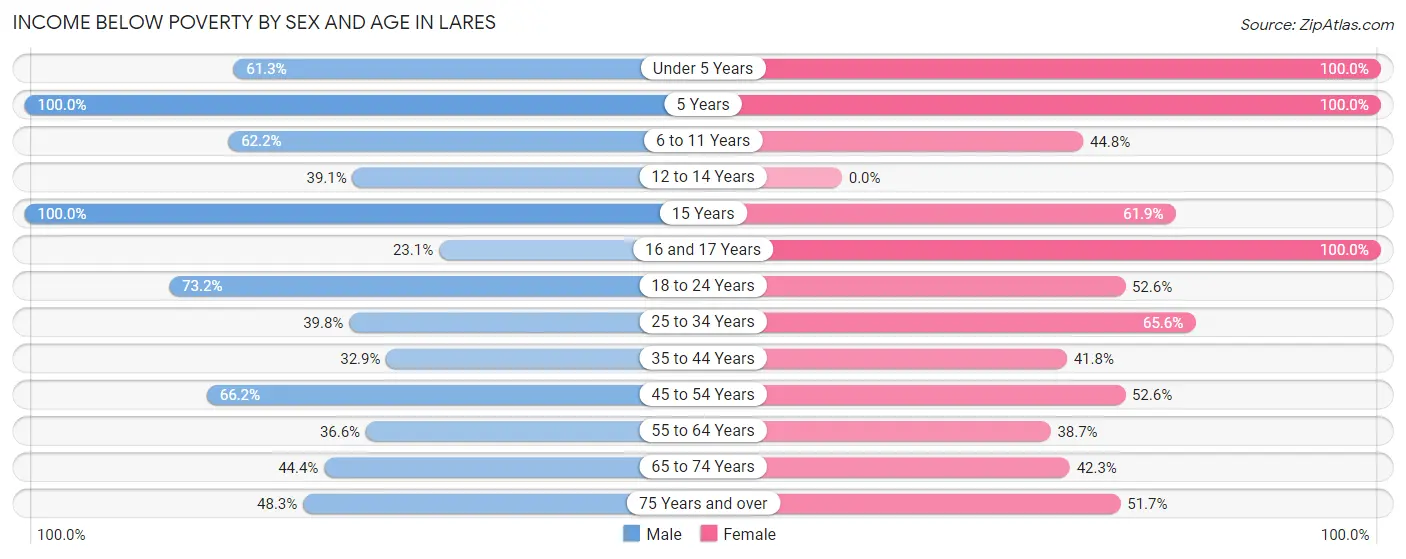
| Age Bracket | Male | Female |
| Under 5 Years | 49 (61.3%) | 111 (100.0%) |
| 5 Years | 59 (100.0%) | 62 (100.0%) |
| 6 to 11 Years | 51 (62.2%) | 30 (44.8%) |
| 12 to 14 Years | 45 (39.1%) | 0 (0.0%) |
| 15 Years | 10 (100.0%) | 13 (61.9%) |
| 16 and 17 Years | 9 (23.1%) | 34 (100.0%) |
| 18 to 24 Years | 139 (73.2%) | 123 (52.6%) |
| 25 to 34 Years | 126 (39.8%) | 139 (65.6%) |
| 35 to 44 Years | 93 (32.9%) | 86 (41.7%) |
| 45 to 54 Years | 178 (66.2%) | 195 (52.6%) |
| 55 to 64 Years | 133 (36.6%) | 177 (38.7%) |
| 65 to 74 Years | 95 (44.4%) | 151 (42.3%) |
| 75 Years and over | 143 (48.3%) | 182 (51.7%) |
| Total | 1,130 (48.8%) | 1,303 (51.8%) |
Income Above Poverty by Sex and Age in Lares
According to the poverty statistics in Lares, males aged 16 and 17 years and females aged 12 to 14 years are the age groups that are most secure financially, with 76.9% of males and 100.0% of females in these age groups living above the poverty line.
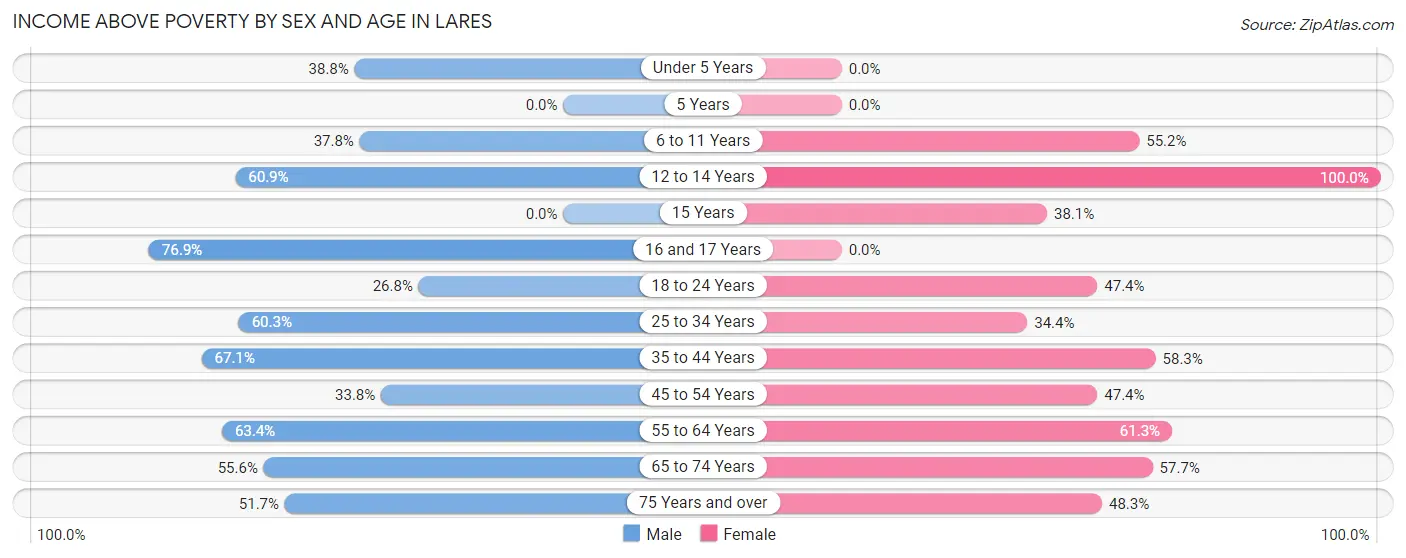
| Age Bracket | Male | Female |
| Under 5 Years | 31 (38.8%) | 0 (0.0%) |
| 5 Years | 0 (0.0%) | 0 (0.0%) |
| 6 to 11 Years | 31 (37.8%) | 37 (55.2%) |
| 12 to 14 Years | 70 (60.9%) | 32 (100.0%) |
| 15 Years | 0 (0.0%) | 8 (38.1%) |
| 16 and 17 Years | 30 (76.9%) | 0 (0.0%) |
| 18 to 24 Years | 51 (26.8%) | 111 (47.4%) |
| 25 to 34 Years | 191 (60.3%) | 73 (34.4%) |
| 35 to 44 Years | 190 (67.1%) | 120 (58.3%) |
| 45 to 54 Years | 91 (33.8%) | 176 (47.4%) |
| 55 to 64 Years | 230 (63.4%) | 280 (61.3%) |
| 65 to 74 Years | 119 (55.6%) | 206 (57.7%) |
| 75 Years and over | 153 (51.7%) | 170 (48.3%) |
| Total | 1,187 (51.2%) | 1,213 (48.2%) |
Income Below Poverty Among Married-Couple Families in Lares
The poverty statistics for married-couple families in Lares show that 36.3% or 261 of the total 719 families live below the poverty line. Families with 3 or 4 children have the highest poverty rate of 100.0%, comprising of 14 families. On the other hand, families with no children have the lowest poverty rate of 32.6%, which includes 184 families.
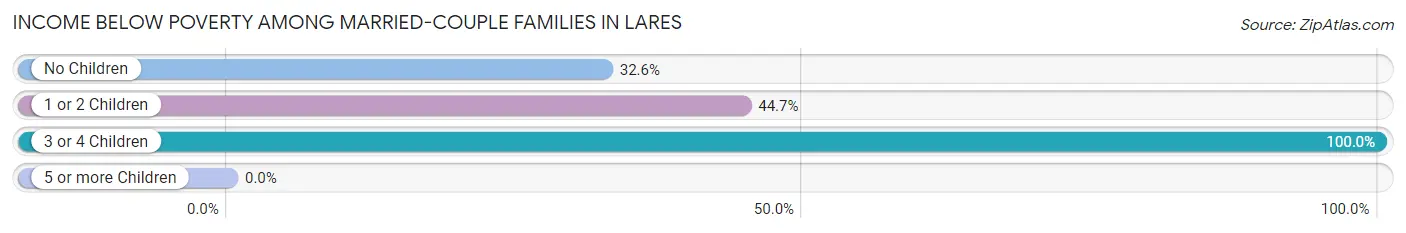
| Children | Above Poverty | Below Poverty |
| No Children | 380 (67.4%) | 184 (32.6%) |
| 1 or 2 Children | 78 (55.3%) | 63 (44.7%) |
| 3 or 4 Children | 0 (0.0%) | 14 (100.0%) |
| 5 or more Children | 0 (0.0%) | 0 (0.0%) |
| Total | 458 (63.7%) | 261 (36.3%) |
Income Below Poverty Among Single-Parent Households in Lares
According to the poverty data in Lares, 66.0% or 124 single-father households and 49.9% or 222 single-mother households are living below the poverty line. Among single-father households, those with 1 or 2 children have the highest poverty rate, with 75 households (100.0%) experiencing poverty. Likewise, among single-mother households, those with 1 or 2 children have the highest poverty rate, with 117 households (69.6%) falling below the poverty line.
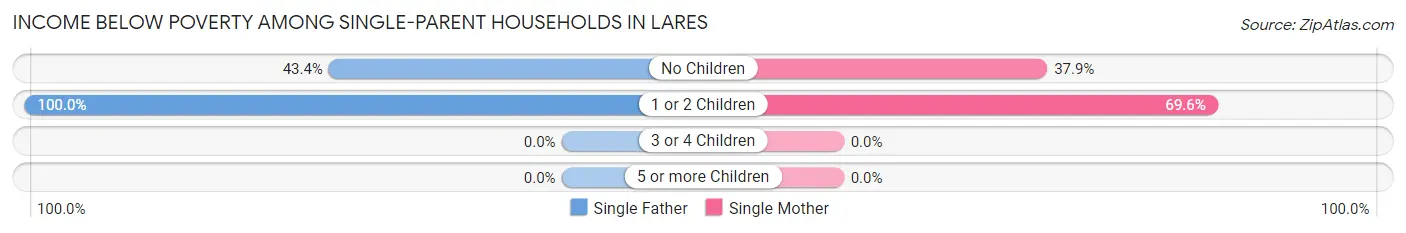
| Children | Single Father | Single Mother |
| No Children | 49 (43.4%) | 105 (37.9%) |
| 1 or 2 Children | 75 (100.0%) | 117 (69.6%) |
| 3 or 4 Children | 0 (0.0%) | 0 (0.0%) |
| 5 or more Children | 0 (0.0%) | 0 (0.0%) |
| Total | 124 (66.0%) | 222 (49.9%) |
Income Below Poverty Among Married-Couple vs Single-Parent Households in Lares
The poverty data for Lares shows that 261 of the married-couple family households (36.3%) and 346 of the single-parent households (54.7%) are living below the poverty level. Within the married-couple family households, those with 3 or 4 children have the highest poverty rate, with 14 households (100.0%) falling below the poverty line. Among the single-parent households, those with 1 or 2 children have the highest poverty rate, with 192 household (79.0%) living below poverty.
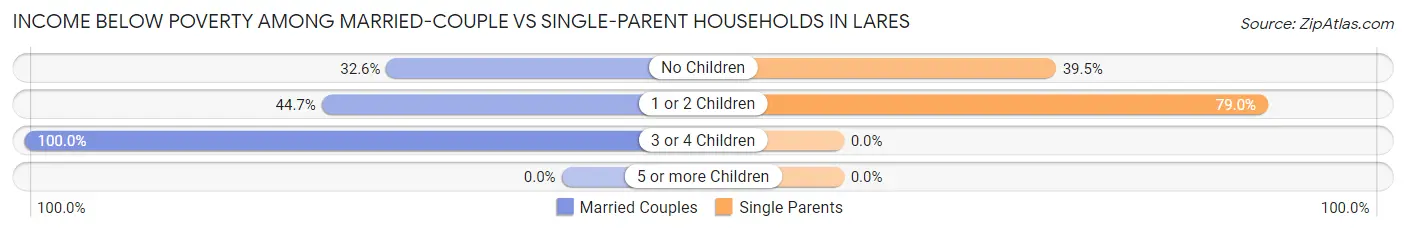
| Children | Married-Couple Families | Single-Parent Households |
| No Children | 184 (32.6%) | 154 (39.5%) |
| 1 or 2 Children | 63 (44.7%) | 192 (79.0%) |
| 3 or 4 Children | 14 (100.0%) | 0 (0.0%) |
| 5 or more Children | 0 (0.0%) | 0 (0.0%) |
| Total | 261 (36.3%) | 346 (54.7%) |
Race in Lares
The most populous races in Lares are Hispanic or Latino (4,819 | 98.9%), White / Caucasian (3,962 | 81.3%), and Two or more Races (468 | 9.6%).
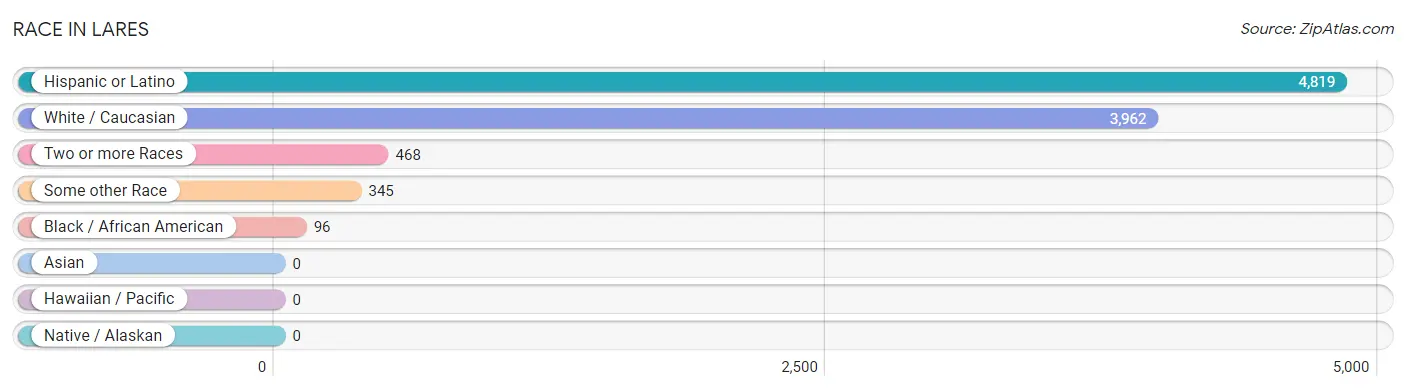
| Race | # Population | % Population |
| Asian | 0 | 0.0% |
| Black / African American | 96 | 2.0% |
| Hawaiian / Pacific | 0 | 0.0% |
| Hispanic or Latino | 4,819 | 98.9% |
| Native / Alaskan | 0 | 0.0% |
| White / Caucasian | 3,962 | 81.3% |
| Two or more Races | 468 | 9.6% |
| Some other Race | 345 | 7.1% |
| Total | 4,871 | 100.0% |
Ancestry in Lares
The most populous ancestries reported in Lares are Puerto Rican (4,753 | 97.6%), Central American Indian (77 | 1.6%), Dominican (29 | 0.6%), Italian (21 | 0.4%), and French (12 | 0.3%), together accounting for 100.4% of all Lares residents.
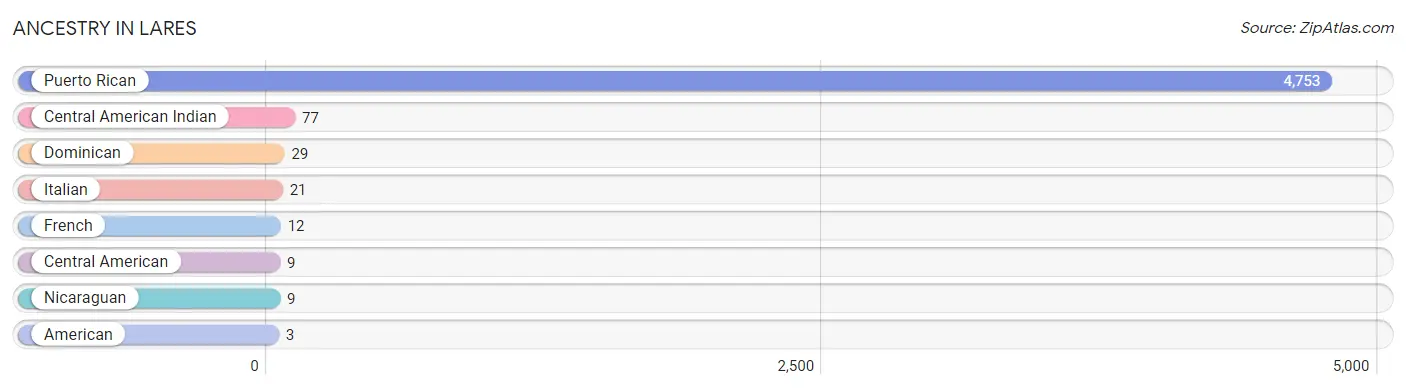
| Ancestry | # Population | % Population |
| American | 3 | 0.1% |
| Central American | 9 | 0.2% |
| Central American Indian | 77 | 1.6% |
| Dominican | 29 | 0.6% |
| French | 12 | 0.3% |
| Italian | 21 | 0.4% |
| Nicaraguan | 9 | 0.2% |
| Puerto Rican | 4,753 | 97.6% | View All 8 Rows |
Immigrants in Lares

| Immigration Origin | # Population | % Population | View All 0 Rows |
Sex and Age in Lares
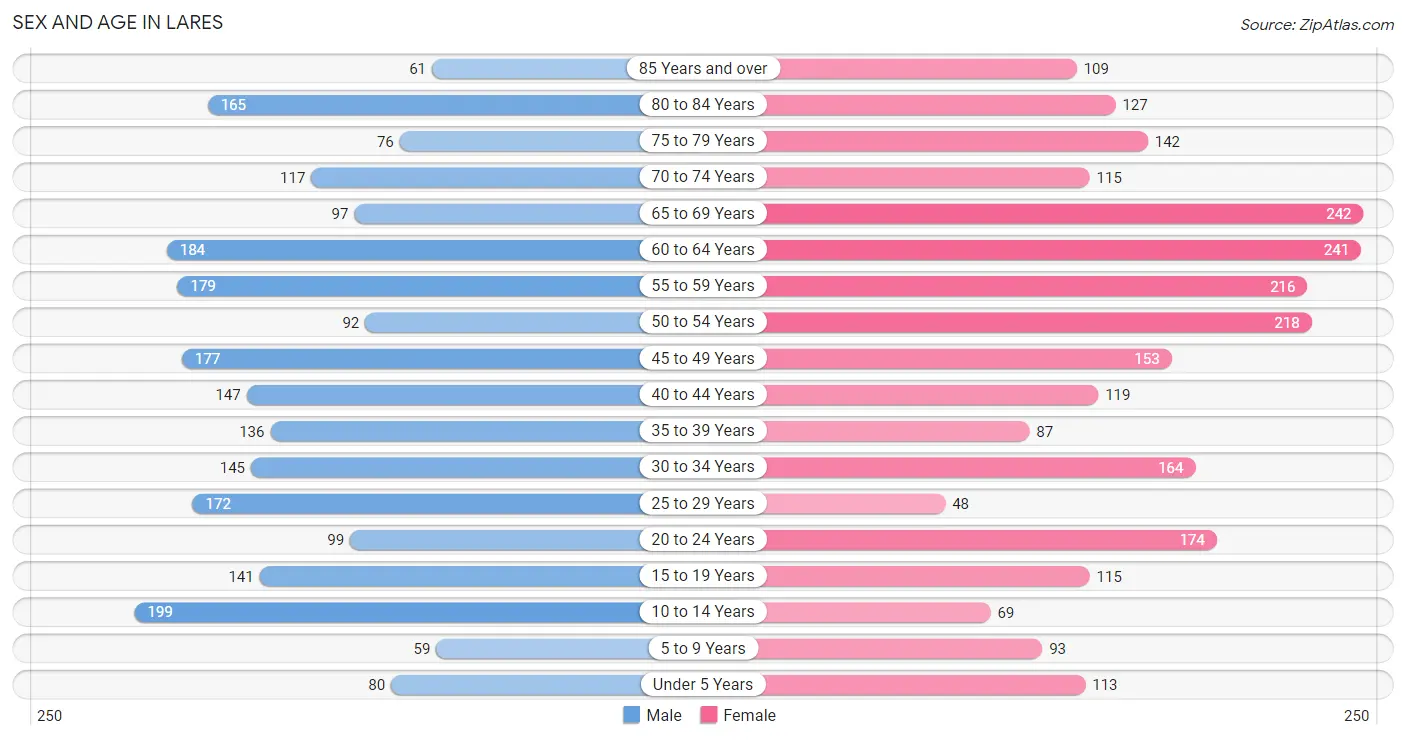
Sex and Age in Lares
The most populous age groups in Lares are 10 to 14 Years (199 | 8.6%) for men and 65 to 69 Years (242 | 9.5%) for women.
| Age Bracket | Male | Female |
| Under 5 Years | 80 (3.4%) | 113 (4.4%) |
| 5 to 9 Years | 59 (2.5%) | 93 (3.6%) |
| 10 to 14 Years | 199 (8.6%) | 69 (2.7%) |
| 15 to 19 Years | 141 (6.1%) | 115 (4.5%) |
| 20 to 24 Years | 99 (4.3%) | 174 (6.8%) |
| 25 to 29 Years | 172 (7.4%) | 48 (1.9%) |
| 30 to 34 Years | 145 (6.2%) | 164 (6.4%) |
| 35 to 39 Years | 136 (5.9%) | 87 (3.4%) |
| 40 to 44 Years | 147 (6.3%) | 119 (4.7%) |
| 45 to 49 Years | 177 (7.6%) | 153 (6.0%) |
| 50 to 54 Years | 92 (4.0%) | 218 (8.6%) |
| 55 to 59 Years | 179 (7.7%) | 216 (8.5%) |
| 60 to 64 Years | 184 (7.9%) | 241 (9.5%) |
| 65 to 69 Years | 97 (4.2%) | 242 (9.5%) |
| 70 to 74 Years | 117 (5.0%) | 115 (4.5%) |
| 75 to 79 Years | 76 (3.3%) | 142 (5.6%) |
| 80 to 84 Years | 165 (7.1%) | 127 (5.0%) |
| 85 Years and over | 61 (2.6%) | 109 (4.3%) |
| Total | 2,326 (100.0%) | 2,545 (100.0%) |
Families and Households in Lares
Median Family Size in Lares
The median family size in Lares is 2.89 persons per family, with single female/mother families (445 | 32.9%) accounting for the largest median family size of 3.02 persons per family. On the other hand, married-couple families (719 | 53.2%) represent the smallest median family size with 2.83 persons per family.
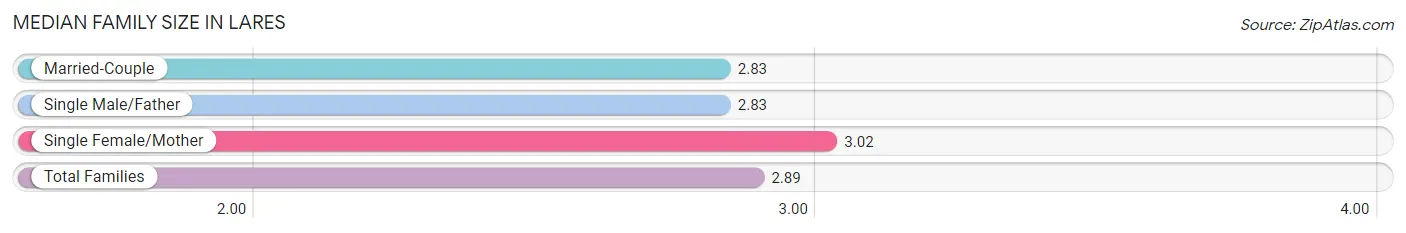
| Family Type | # Families | Family Size |
| Married-Couple | 719 (53.2%) | 2.83 |
| Single Male/Father | 188 (13.9%) | 2.83 |
| Single Female/Mother | 445 (32.9%) | 3.02 |
| Total Families | 1,352 (100.0%) | 2.89 |
Median Household Size in Lares
The median household size in Lares is 2.37 persons per household, with single female/mother households (445 | 21.9%) accounting for the largest median household size of 3.17 persons per household. non-family households (682 | 33.5%) represent the smallest median household size with 1.17 persons per household.
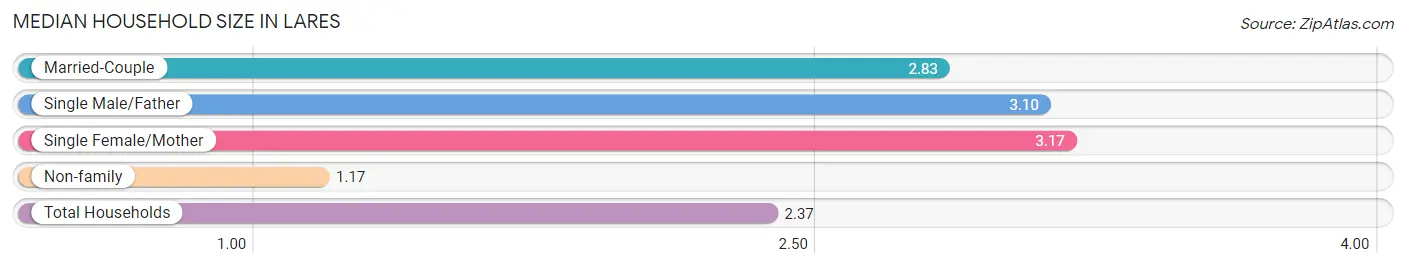
| Household Type | # Households | Household Size |
| Married-Couple | 719 (35.3%) | 2.83 |
| Single Male/Father | 188 (9.2%) | 3.10 |
| Single Female/Mother | 445 (21.9%) | 3.17 |
| Non-family | 682 (33.5%) | 1.17 |
| Total Households | 2,034 (100.0%) | 2.37 |
Household Size by Marriage Status in Lares
Out of a total of 2,034 households in Lares, 1,352 (66.5%) are family households, while 682 (33.5%) are nonfamily households. The most numerous type of family households are 2-person households, comprising 709, and the most common type of nonfamily households are 1-person households, comprising 564.
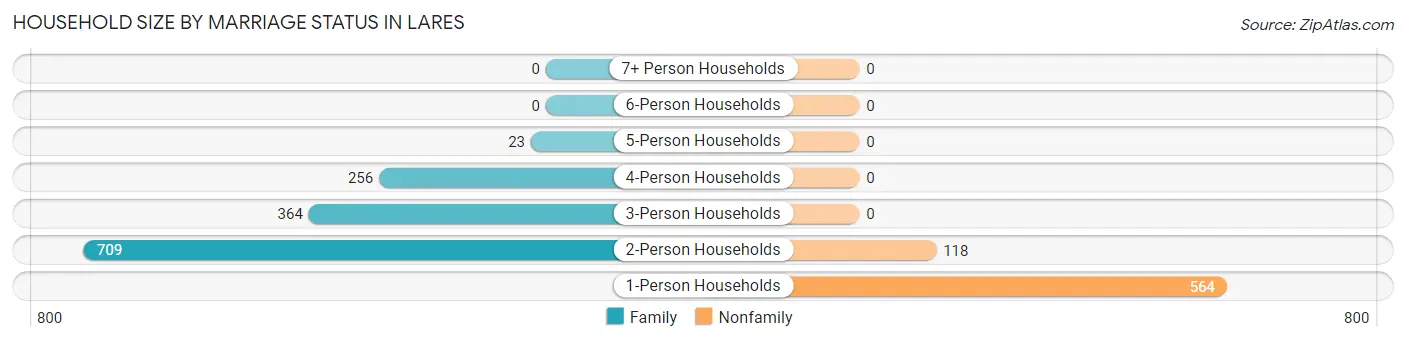
| Household Size | Family Households | Nonfamily Households |
| 1-Person Households | - | 564 (27.7%) |
| 2-Person Households | 709 (34.9%) | 118 (5.8%) |
| 3-Person Households | 364 (17.9%) | 0 (0.0%) |
| 4-Person Households | 256 (12.6%) | 0 (0.0%) |
| 5-Person Households | 23 (1.1%) | 0 (0.0%) |
| 6-Person Households | 0 (0.0%) | 0 (0.0%) |
| 7+ Person Households | 0 (0.0%) | 0 (0.0%) |
| Total | 1,352 (66.5%) | 682 (33.5%) |
Female Fertility in Lares
Fertility by Age in Lares
Average fertility rate in Lares is 34.0 births per 1,000 women. Women in the age bracket of 20 to 34 years have the highest fertility rate with 75.0 births per 1,000 women. Women in the age bracket of 20 to 34 years acount for 100.0% of all women with births.
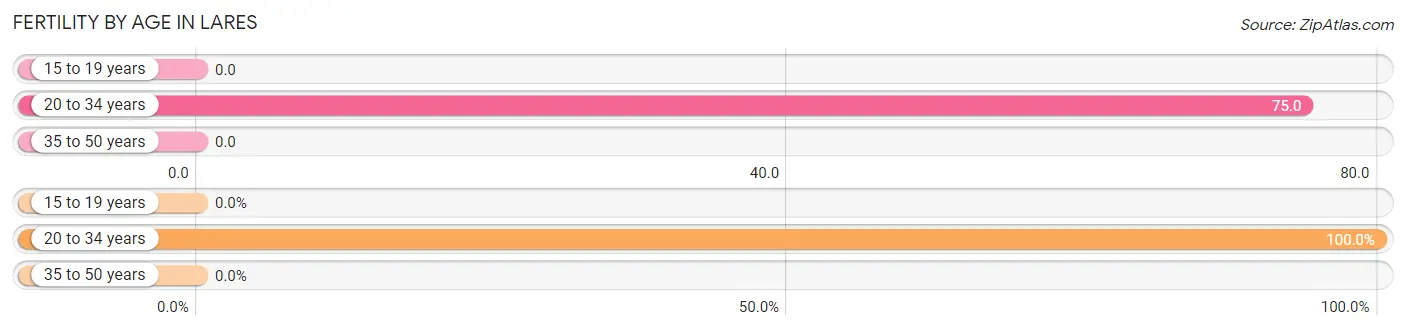
| Age Bracket | Women with Births | Births / 1,000 Women |
| 15 to 19 years | 0 (0.0%) | 0.0 |
| 20 to 34 years | 29 (100.0%) | 75.0 |
| 35 to 50 years | 0 (0.0%) | 0.0 |
| Total | 29 (100.0%) | 34.0 |
Fertility by Age by Marriage Status in Lares
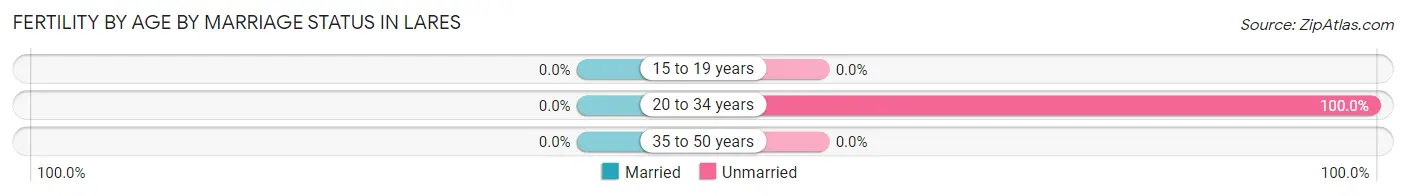
| Age Bracket | Married | Unmarried |
| 15 to 19 years | 0 (0.0%) | 0 (0.0%) |
| 20 to 34 years | 0 (0.0%) | 29 (100.0%) |
| 35 to 50 years | 0 (0.0%) | 0 (0.0%) |
| Total | 0 (0.0%) | 29 (100.0%) |
Fertility by Education in Lares
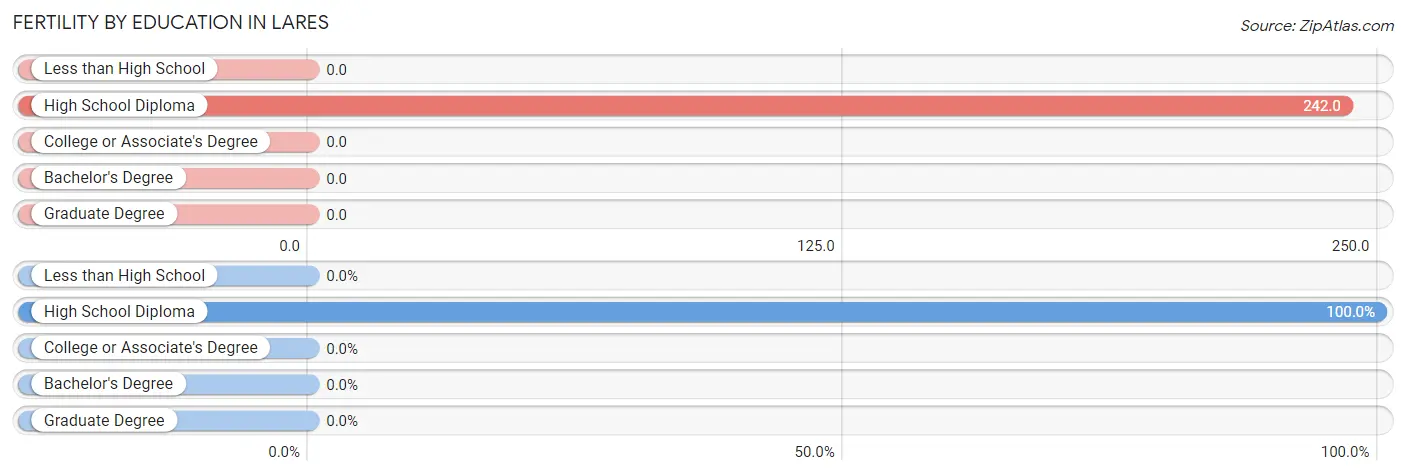
| Educational Attainment | Women with Births | Births / 1,000 Women |
| Less than High School | 0 (0.0%) | 0.0 |
| High School Diploma | 29 (100.0%) | 242.0 |
| College or Associate's Degree | 0 (0.0%) | 0.0 |
| Bachelor's Degree | 0 (0.0%) | 0.0 |
| Graduate Degree | 0 (0.0%) | 0.0 |
| Total | 29 (100.0%) | 34.0 |
Fertility by Education by Marriage Status in Lares
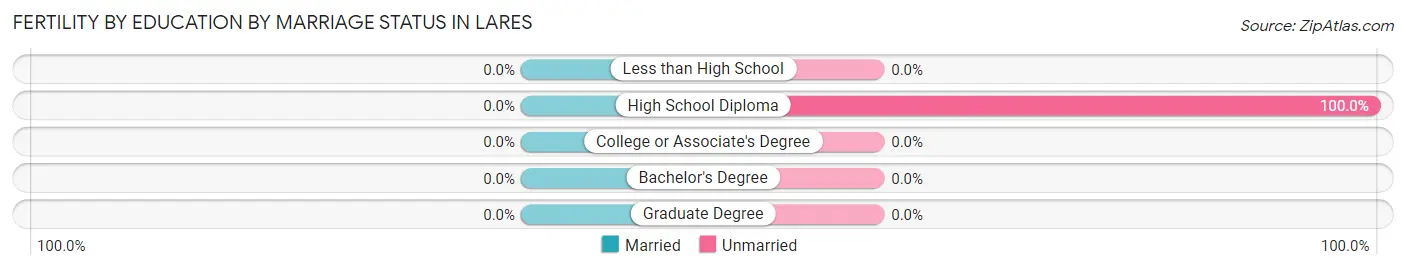
| Educational Attainment | Married | Unmarried |
| Less than High School | 0 (0.0%) | 0 (0.0%) |
| High School Diploma | 0 (0.0%) | 29 (100.0%) |
| College or Associate's Degree | 0 (0.0%) | 0 (0.0%) |
| Bachelor's Degree | 0 (0.0%) | 0 (0.0%) |
| Graduate Degree | 0 (0.0%) | 0 (0.0%) |
| Total | 0 (0.0%) | 29 (100.0%) |
Employment Characteristics in Lares
Employment by Class of Employer in Lares
Among the 1,492 employed individuals in Lares, private company employees (783 | 52.5%), state government employees (267 | 17.9%), and self-employed (not incorporated) (183 | 12.3%) make up the most common classes of employment.
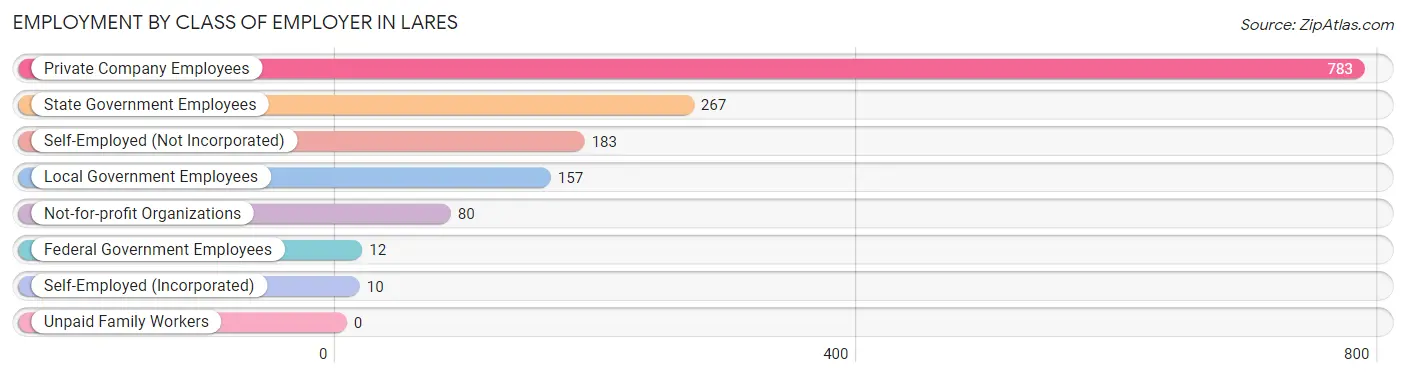
| Employer Class | # Employees | % Employees |
| Private Company Employees | 783 | 52.5% |
| Self-Employed (Incorporated) | 10 | 0.7% |
| Self-Employed (Not Incorporated) | 183 | 12.3% |
| Not-for-profit Organizations | 80 | 5.4% |
| Local Government Employees | 157 | 10.5% |
| State Government Employees | 267 | 17.9% |
| Federal Government Employees | 12 | 0.8% |
| Unpaid Family Workers | 0 | 0.0% |
| Total | 1,492 | 100.0% |
Employment Status by Age in Lares
According to the labor force statistics for Lares, out of the total population over 16 years of age (4,226), 42.0% or 1,775 individuals are in the labor force, with 15.1% or 268 of them unemployed. The age group with the highest labor force participation rate is 25 to 29 years, with 86.8% or 191 individuals in the labor force. Within the labor force, the 16 to 19 years age range has the highest percentage of unemployed individuals, with 61.1% or 11 of them being unemployed.
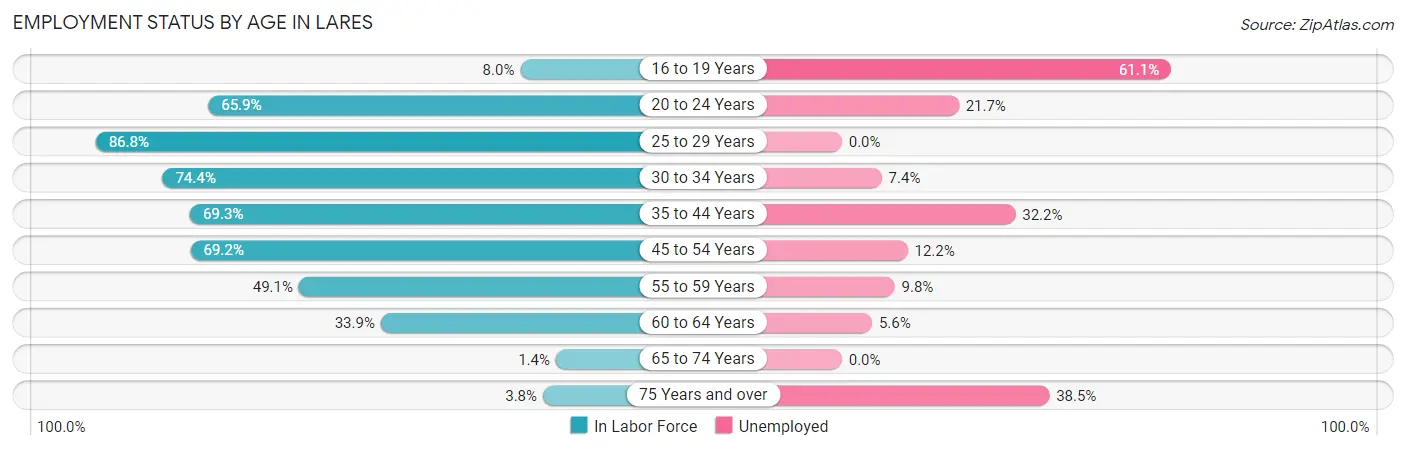
| Age Bracket | In Labor Force | Unemployed |
| 16 to 19 Years | 18 (8.0%) | 11 (61.1%) |
| 20 to 24 Years | 180 (65.9%) | 39 (21.7%) |
| 25 to 29 Years | 191 (86.8%) | 0 (0.0%) |
| 30 to 34 Years | 230 (74.4%) | 17 (7.4%) |
| 35 to 44 Years | 339 (69.3%) | 109 (32.2%) |
| 45 to 54 Years | 443 (69.2%) | 54 (12.2%) |
| 55 to 59 Years | 194 (49.1%) | 19 (9.8%) |
| 60 to 64 Years | 144 (33.9%) | 8 (5.6%) |
| 65 to 74 Years | 8 (1.4%) | 0 (0.0%) |
| 75 Years and over | 26 (3.8%) | 10 (38.5%) |
| Total | 1,775 (42.0%) | 268 (15.1%) |
Employment Status by Educational Attainment in Lares
According to labor force statistics for Lares, 62.2% of individuals (1,541) out of the total population between 25 and 64 years of age (2,478) are in the labor force, with 13.4% or 206 of them being unemployed. The group with the highest labor force participation rate are those with the educational attainment of college / associate degree, with 69.2% or 616 individuals in the labor force. Within the labor force, individuals with college / associate degree education have the highest percentage of unemployment, with 16.1% or 99 of them being unemployed.
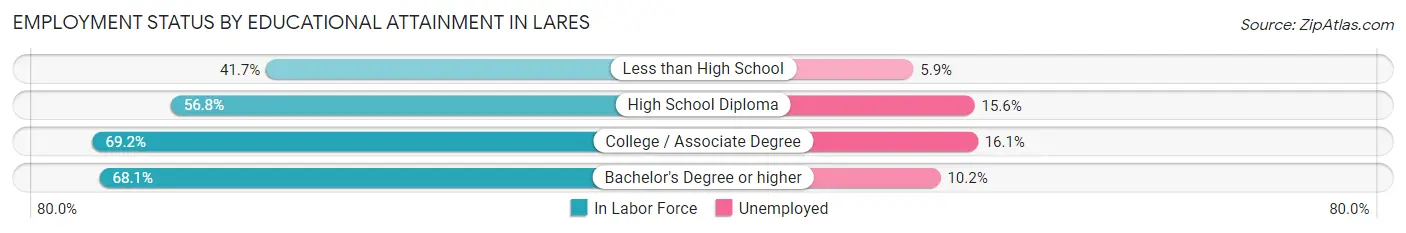
| Educational Attainment | In Labor Force | Unemployed |
| Less than High School | 135 (41.7%) | 19 (5.9%) |
| High School Diploma | 358 (56.8%) | 98 (15.6%) |
| College / Associate Degree | 616 (69.2%) | 143 (16.1%) |
| Bachelor's Degree or higher | 432 (68.1%) | 65 (10.2%) |
| Total | 1,541 (62.2%) | 332 (13.4%) |
Employment Occupations by Sex in Lares
Management, Business, Science and Arts Occupations
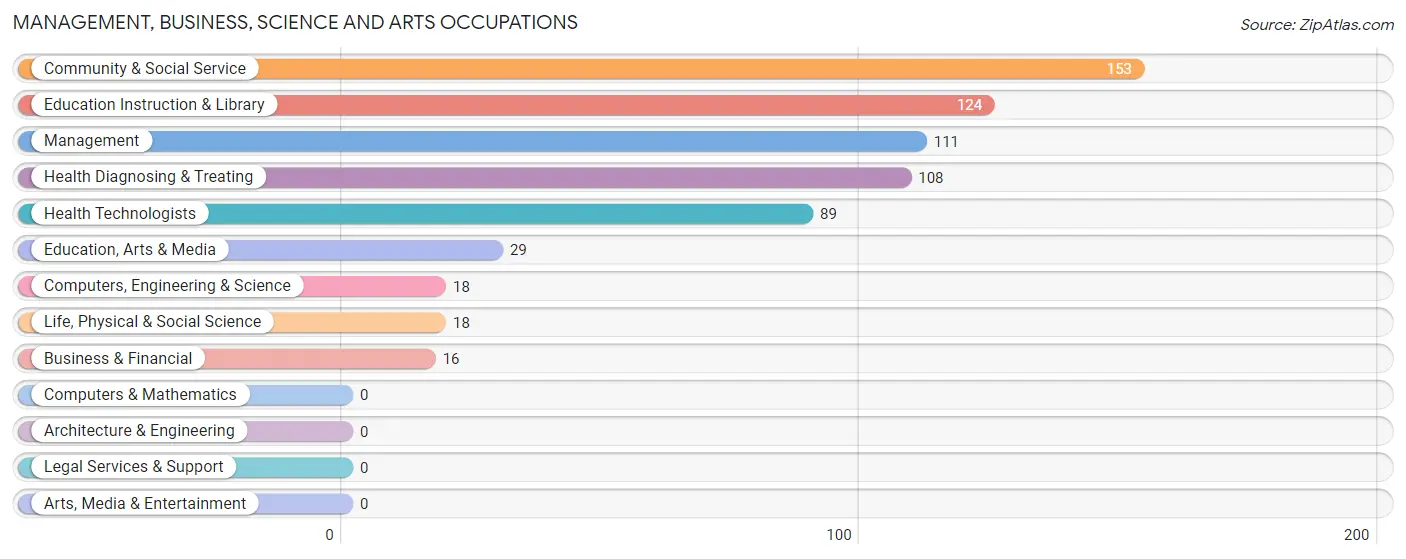
The most common Management, Business, Science and Arts occupations in Lares are Community & Social Service (153 | 10.2%), Education Instruction & Library (124 | 8.2%), Management (111 | 7.4%), Health Diagnosing & Treating (108 | 7.2%), and Health Technologists (89 | 5.9%).
Management, Business, Science and Arts Occupations by Sex
Within the Management, Business, Science and Arts occupations in Lares, the most male-oriented occupations are Business & Financial (100.0%), Management (72.1%), and Health Technologists (68.5%), while the most female-oriented occupations are Education Instruction & Library (90.3%), Community & Social Service (89.5%), and Education, Arts & Media (86.2%).
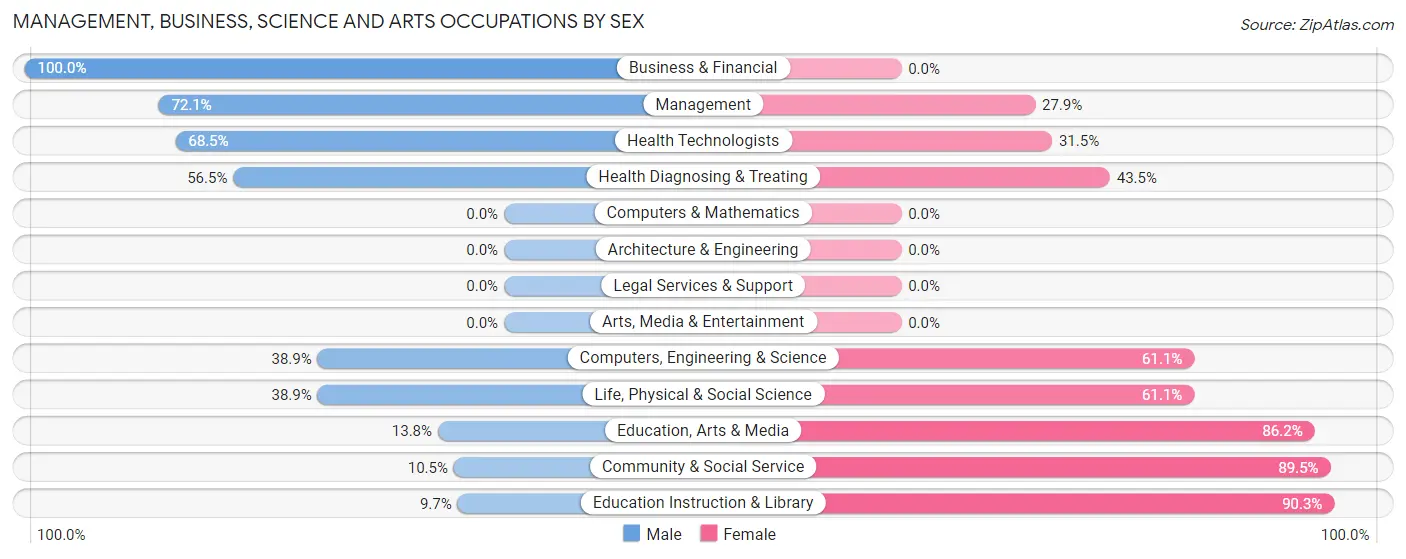
| Occupation | Male | Female |
| Management | 80 (72.1%) | 31 (27.9%) |
| Business & Financial | 16 (100.0%) | 0 (0.0%) |
| Computers, Engineering & Science | 7 (38.9%) | 11 (61.1%) |
| Computers & Mathematics | 0 (0.0%) | 0 (0.0%) |
| Architecture & Engineering | 0 (0.0%) | 0 (0.0%) |
| Life, Physical & Social Science | 7 (38.9%) | 11 (61.1%) |
| Community & Social Service | 16 (10.5%) | 137 (89.5%) |
| Education, Arts & Media | 4 (13.8%) | 25 (86.2%) |
| Legal Services & Support | 0 (0.0%) | 0 (0.0%) |
| Education Instruction & Library | 12 (9.7%) | 112 (90.3%) |
| Arts, Media & Entertainment | 0 (0.0%) | 0 (0.0%) |
| Health Diagnosing & Treating | 61 (56.5%) | 47 (43.5%) |
| Health Technologists | 61 (68.5%) | 28 (31.5%) |
| Total (Category) | 180 (44.3%) | 226 (55.7%) |
| Total (Overall) | 921 (61.2%) | 585 (38.8%) |
Services Occupations
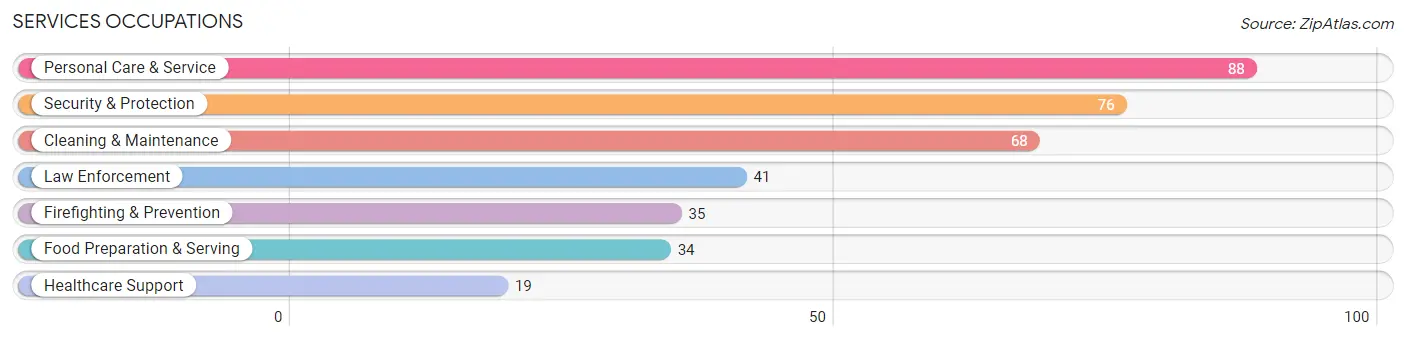
The most common Services occupations in Lares are Personal Care & Service (88 | 5.8%), Security & Protection (76 | 5.1%), Cleaning & Maintenance (68 | 4.5%), Law Enforcement (41 | 2.7%), and Firefighting & Prevention (35 | 2.3%).
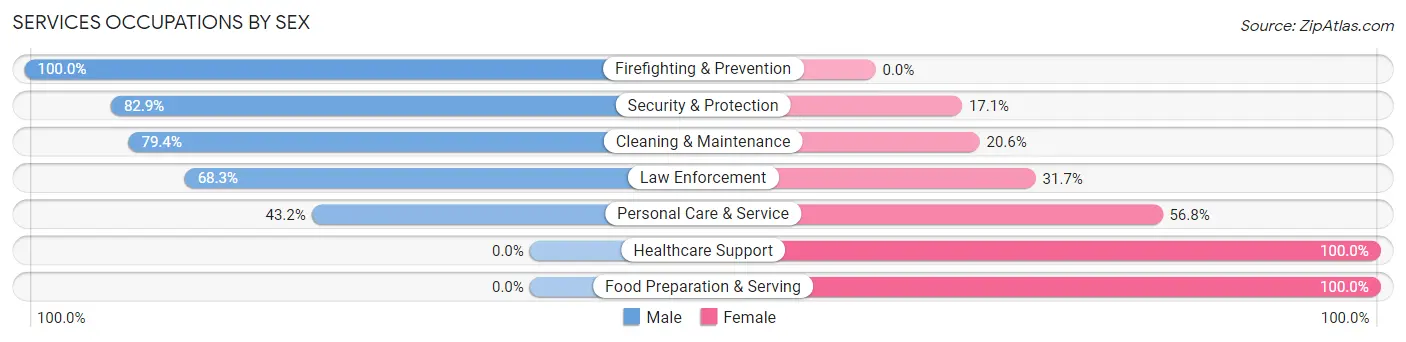
Services Occupations by Sex
Within the Services occupations in Lares, the most male-oriented occupations are Firefighting & Prevention (100.0%), Security & Protection (82.9%), and Cleaning & Maintenance (79.4%), while the most female-oriented occupations are Healthcare Support (100.0%), Food Preparation & Serving (100.0%), and Personal Care & Service (56.8%).
| Occupation | Male | Female |
| Healthcare Support | 0 (0.0%) | 19 (100.0%) |
| Security & Protection | 63 (82.9%) | 13 (17.1%) |
| Firefighting & Prevention | 35 (100.0%) | 0 (0.0%) |
| Law Enforcement | 28 (68.3%) | 13 (31.7%) |
| Food Preparation & Serving | 0 (0.0%) | 34 (100.0%) |
| Cleaning & Maintenance | 54 (79.4%) | 14 (20.6%) |
| Personal Care & Service | 38 (43.2%) | 50 (56.8%) |
| Total (Category) | 155 (54.4%) | 130 (45.6%) |
| Total (Overall) | 921 (61.2%) | 585 (38.8%) |
Sales and Office Occupations
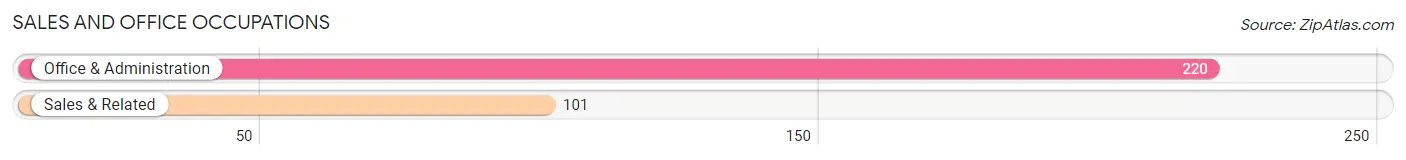
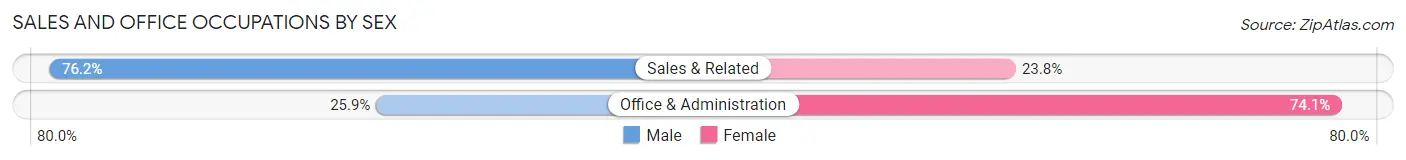
The most common Sales and Office occupations in Lares are Office & Administration (220 | 14.6%), and Sales & Related (101 | 6.7%).
Sales and Office Occupations by Sex
| Occupation | Male | Female |
| Sales & Related | 77 (76.2%) | 24 (23.8%) |
| Office & Administration | 57 (25.9%) | 163 (74.1%) |
| Total (Category) | 134 (41.7%) | 187 (58.3%) |
| Total (Overall) | 921 (61.2%) | 585 (38.8%) |
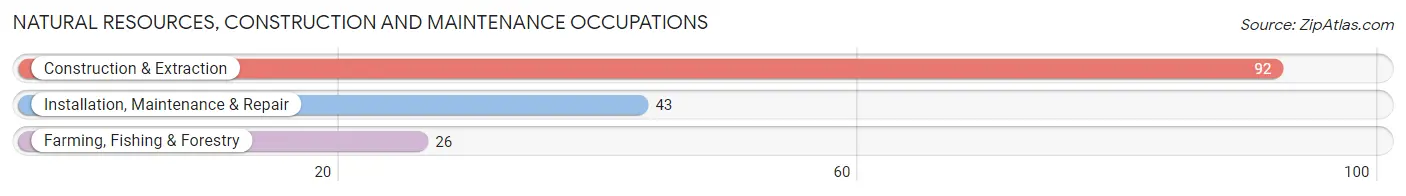
Natural Resources, Construction and Maintenance Occupations
The most common Natural Resources, Construction and Maintenance occupations in Lares are Construction & Extraction (92 | 6.1%), Installation, Maintenance & Repair (43 | 2.9%), and Farming, Fishing & Forestry (26 | 1.7%).
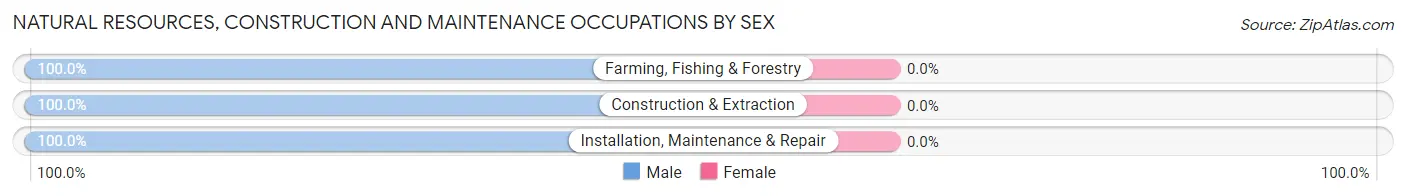
Natural Resources, Construction and Maintenance Occupations by Sex
| Occupation | Male | Female |
| Farming, Fishing & Forestry | 26 (100.0%) | 0 (0.0%) |
| Construction & Extraction | 92 (100.0%) | 0 (0.0%) |
| Installation, Maintenance & Repair | 43 (100.0%) | 0 (0.0%) |
| Total (Category) | 161 (100.0%) | 0 (0.0%) |
| Total (Overall) | 921 (61.2%) | 585 (38.8%) |
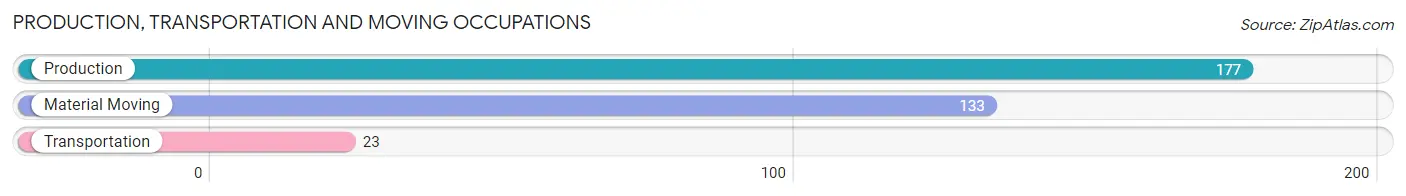
Production, Transportation and Moving Occupations
The most common Production, Transportation and Moving occupations in Lares are Production (177 | 11.7%), Material Moving (133 | 8.8%), and Transportation (23 | 1.5%).
Production, Transportation and Moving Occupations by Sex
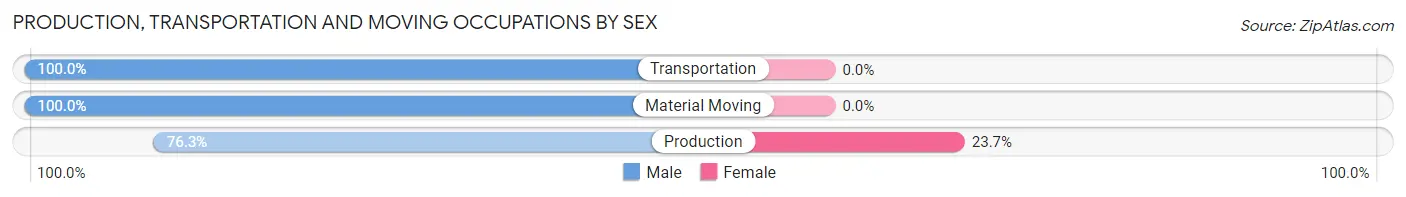
| Occupation | Male | Female |
| Production | 135 (76.3%) | 42 (23.7%) |
| Transportation | 23 (100.0%) | 0 (0.0%) |
| Material Moving | 133 (100.0%) | 0 (0.0%) |
| Total (Category) | 291 (87.4%) | 42 (12.6%) |
| Total (Overall) | 921 (61.2%) | 585 (38.8%) |
Employment Industries by Sex in Lares
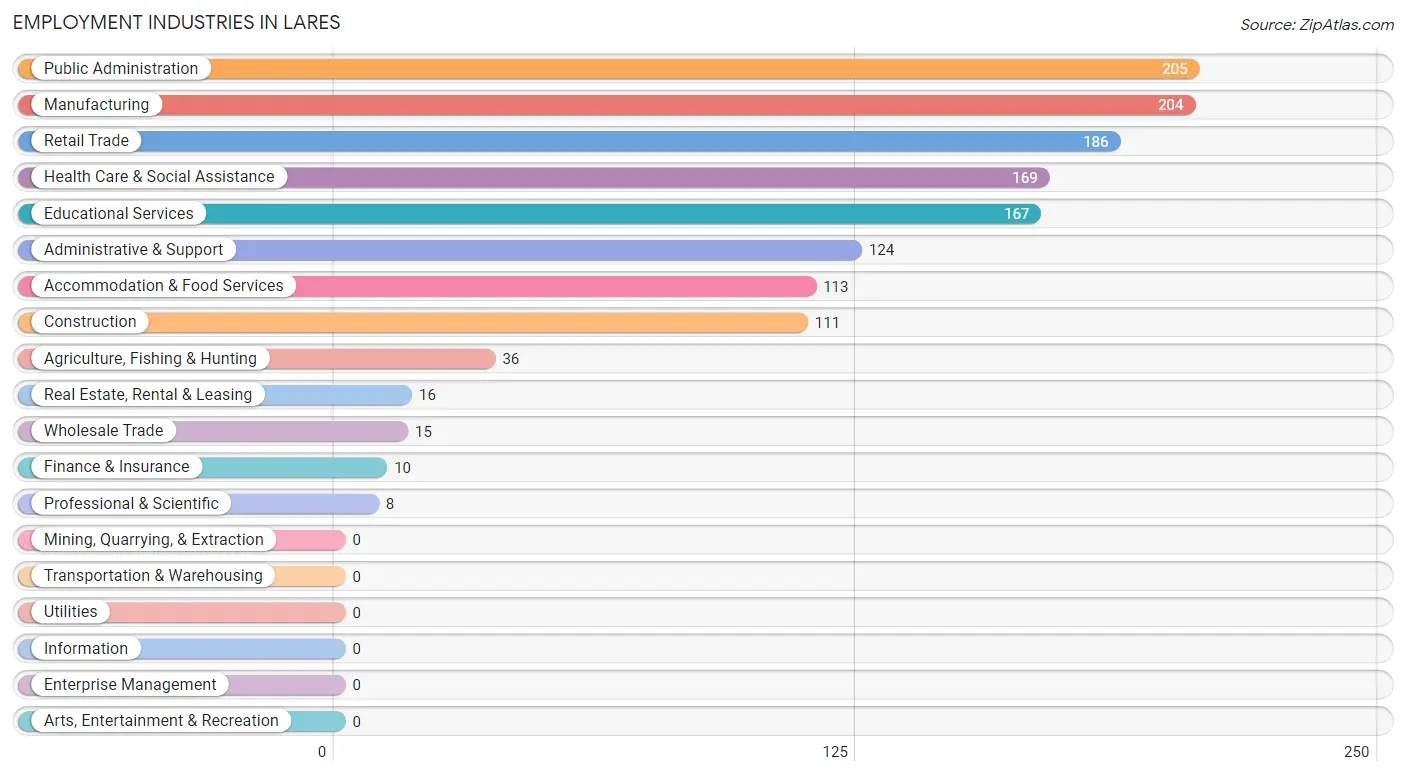
Employment Industries in Lares
The major employment industries in Lares include Public Administration (205 | 13.6%), Manufacturing (204 | 13.6%), Retail Trade (186 | 12.3%), Health Care & Social Assistance (169 | 11.2%), and Educational Services (167 | 11.1%).
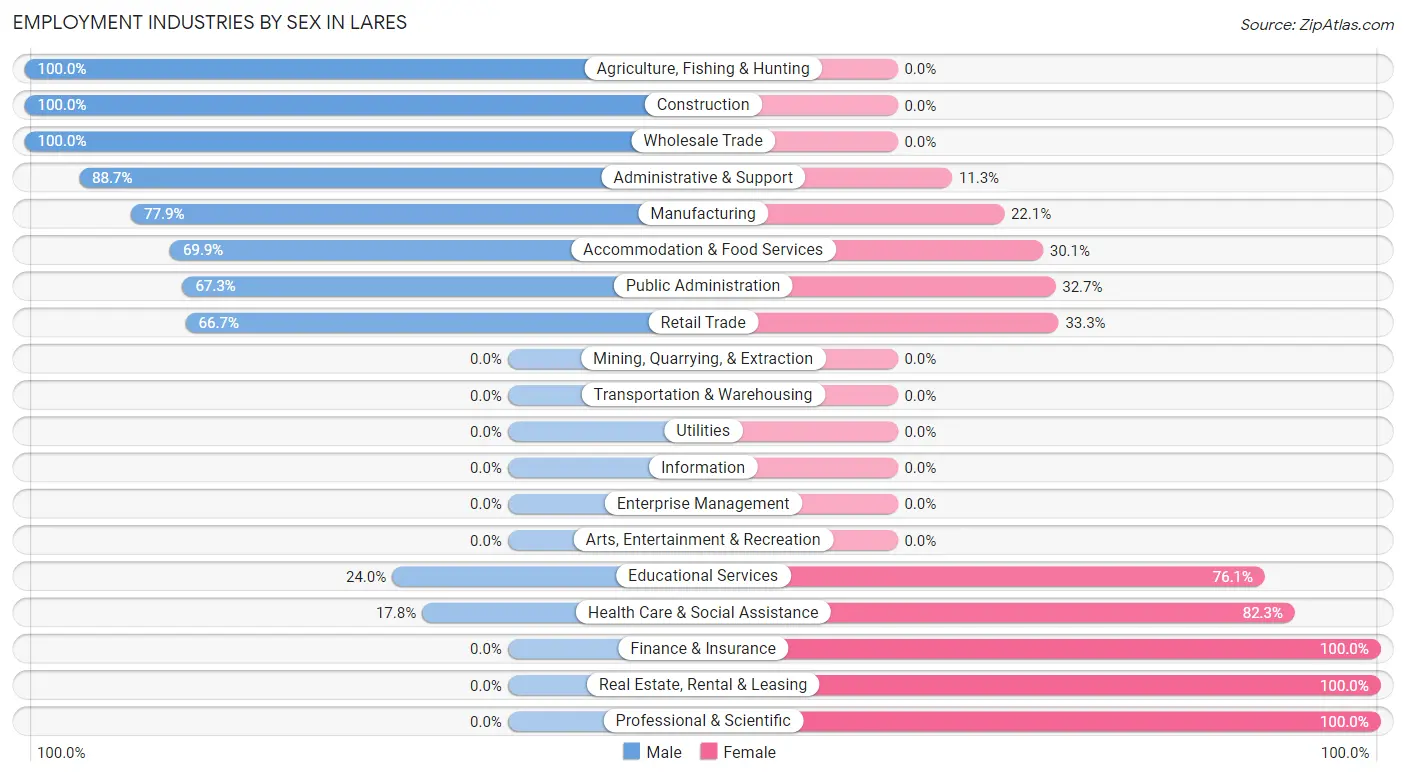
Employment Industries by Sex in Lares
The Lares industries that see more men than women are Agriculture, Fishing & Hunting (100.0%), Construction (100.0%), and Wholesale Trade (100.0%), whereas the industries that tend to have a higher number of women are Finance & Insurance (100.0%), Real Estate, Rental & Leasing (100.0%), and Professional & Scientific (100.0%).
| Industry | Male | Female |
| Agriculture, Fishing & Hunting | 36 (100.0%) | 0 (0.0%) |
| Mining, Quarrying, & Extraction | 0 (0.0%) | 0 (0.0%) |
| Construction | 111 (100.0%) | 0 (0.0%) |
| Manufacturing | 159 (77.9%) | 45 (22.1%) |
| Wholesale Trade | 15 (100.0%) | 0 (0.0%) |
| Retail Trade | 124 (66.7%) | 62 (33.3%) |
| Transportation & Warehousing | 0 (0.0%) | 0 (0.0%) |
| Utilities | 0 (0.0%) | 0 (0.0%) |
| Information | 0 (0.0%) | 0 (0.0%) |
| Finance & Insurance | 0 (0.0%) | 10 (100.0%) |
| Real Estate, Rental & Leasing | 0 (0.0%) | 16 (100.0%) |
| Professional & Scientific | 0 (0.0%) | 8 (100.0%) |
| Enterprise Management | 0 (0.0%) | 0 (0.0%) |
| Administrative & Support | 110 (88.7%) | 14 (11.3%) |
| Educational Services | 40 (23.9%) | 127 (76.0%) |
| Health Care & Social Assistance | 30 (17.7%) | 139 (82.3%) |
| Arts, Entertainment & Recreation | 0 (0.0%) | 0 (0.0%) |
| Accommodation & Food Services | 79 (69.9%) | 34 (30.1%) |
| Public Administration | 138 (67.3%) | 67 (32.7%) |
| Total | 921 (61.2%) | 585 (38.8%) |
Education in Lares
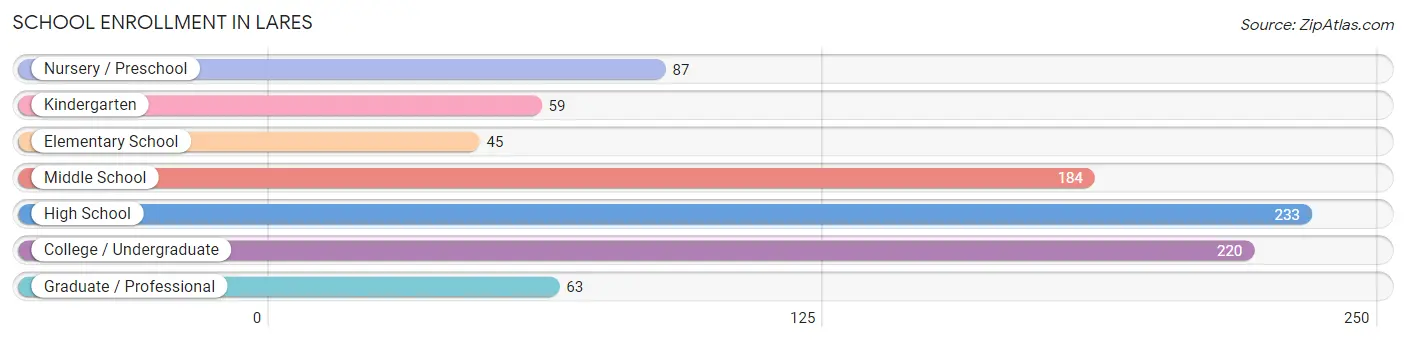
School Enrollment in Lares
The most common levels of schooling among the 891 students in Lares are high school (233 | 26.2%), college / undergraduate (220 | 24.7%), and middle school (184 | 20.6%).
| School Level | # Students | % Students |
| Nursery / Preschool | 87 | 9.8% |
| Kindergarten | 59 | 6.6% |
| Elementary School | 45 | 5.1% |
| Middle School | 184 | 20.6% |
| High School | 233 | 26.2% |
| College / Undergraduate | 220 | 24.7% |
| Graduate / Professional | 63 | 7.1% |
| Total | 891 | 100.0% |
School Enrollment by Age by Funding Source in Lares
Out of a total of 891 students who are enrolled in schools in Lares, 111 (12.5%) attend a private institution, while the remaining 780 (87.5%) are enrolled in public schools. The age group of 25 to 34 year olds has the highest likelihood of being enrolled in private schools, with 26 (100.0% in the age bracket) enrolled. Conversely, the age group of 3 to 4 year olds has the lowest likelihood of being enrolled in a private school, with 25 (100.0% in the age bracket) attending a public institution.
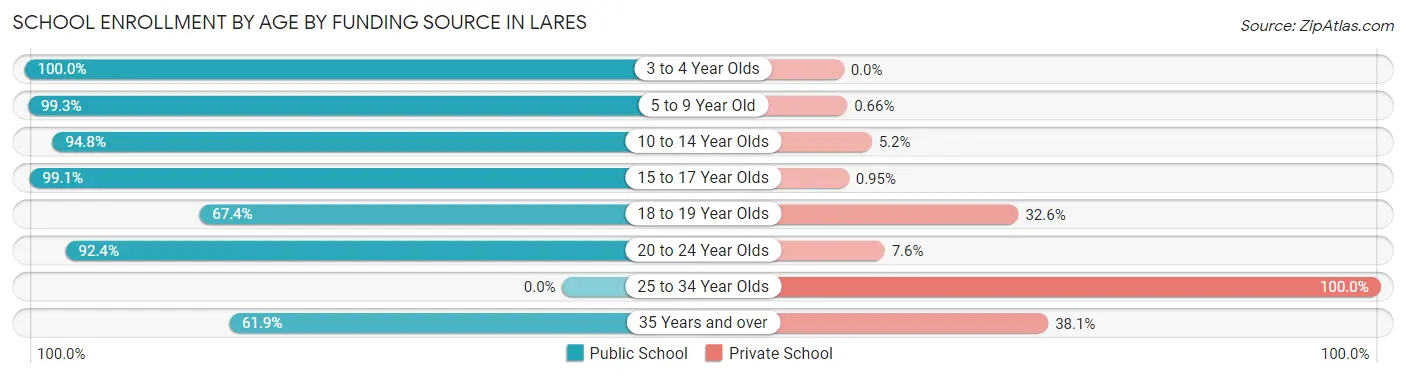
| Age Bracket | Public School | Private School |
| 3 to 4 Year Olds | 25 (100.0%) | 0 (0.0%) |
| 5 to 9 Year Old | 151 (99.3%) | 1 (0.7%) |
| 10 to 14 Year Olds | 254 (94.8%) | 14 (5.2%) |
| 15 to 17 Year Olds | 104 (99.1%) | 1 (0.9%) |
| 18 to 19 Year Olds | 87 (67.4%) | 42 (32.6%) |
| 20 to 24 Year Olds | 133 (92.4%) | 11 (7.6%) |
| 25 to 34 Year Olds | 0 (0.0%) | 26 (100.0%) |
| 35 Years and over | 26 (61.9%) | 16 (38.1%) |
| Total | 780 (87.5%) | 111 (12.5%) |
Educational Attainment by Field of Study in Lares
Education (262 | 28.8%), arts & humanities (132 | 14.5%), business (122 | 13.4%), science & technology (96 | 10.5%), and psychology (79 | 8.7%) are the most common fields of study among 910 individuals in Lares who have obtained a bachelor's degree or higher.
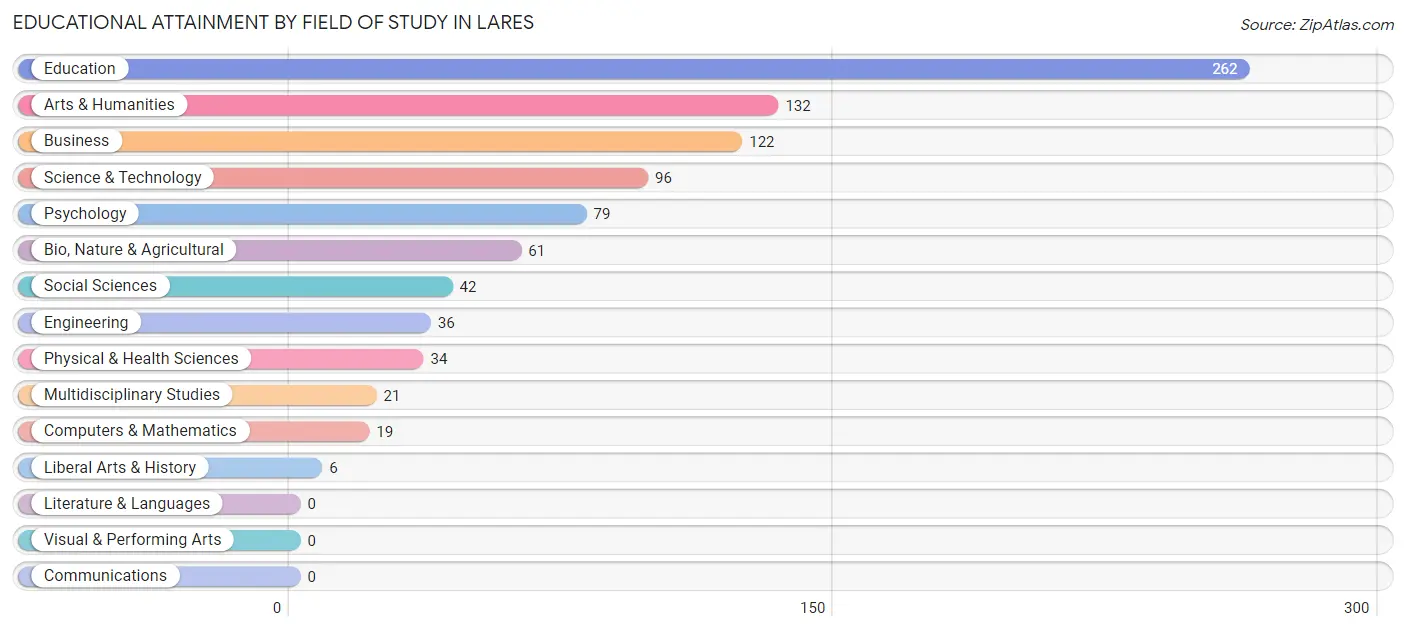
| Field of Study | # Graduates | % Graduates |
| Computers & Mathematics | 19 | 2.1% |
| Bio, Nature & Agricultural | 61 | 6.7% |
| Physical & Health Sciences | 34 | 3.7% |
| Psychology | 79 | 8.7% |
| Social Sciences | 42 | 4.6% |
| Engineering | 36 | 4.0% |
| Multidisciplinary Studies | 21 | 2.3% |
| Science & Technology | 96 | 10.5% |
| Business | 122 | 13.4% |
| Education | 262 | 28.8% |
| Literature & Languages | 0 | 0.0% |
| Liberal Arts & History | 6 | 0.7% |
| Visual & Performing Arts | 0 | 0.0% |
| Communications | 0 | 0.0% |
| Arts & Humanities | 132 | 14.5% |
| Total | 910 | 100.0% |
Transportation & Commute in Lares
Vehicle Availability by Sex in Lares
The most prevalent vehicle ownership categories in Lares are males with 2 vehicles (472, accounting for 52.4%) and females with 2 vehicles (323, making up 80.7%).
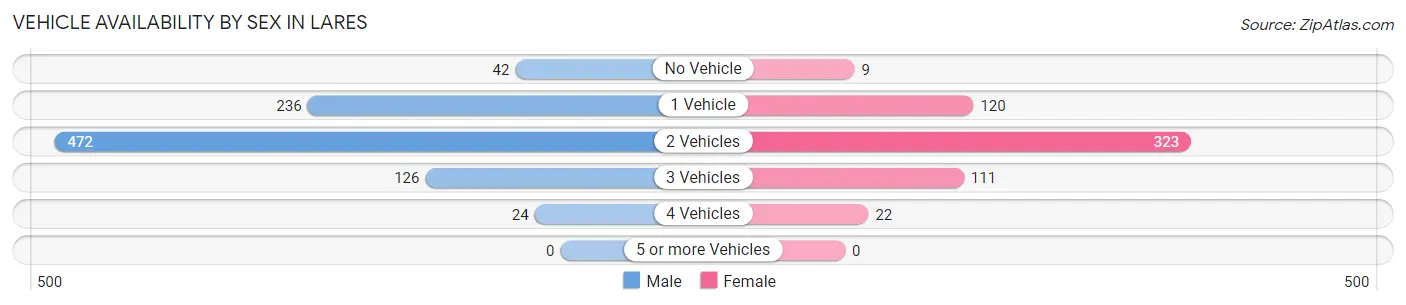
| Vehicles Available | Male | Female |
| No Vehicle | 42 (4.7%) | 9 (1.5%) |
| 1 Vehicle | 236 (26.2%) | 120 (20.5%) |
| 2 Vehicles | 472 (52.4%) | 323 (55.2%) |
| 3 Vehicles | 126 (14.0%) | 111 (19.0%) |
| 4 Vehicles | 24 (2.7%) | 22 (3.8%) |
| 5 or more Vehicles | 0 (0.0%) | 0 (0.0%) |
| Total | 900 (100.0%) | 585 (100.0%) |
Commute Time in Lares
The most frequently occuring commute durations in Lares are 20 to 24 minutes (320 commuters, 22.0%), 5 to 9 minutes (255 commuters, 17.5%), and 10 to 14 minutes (144 commuters, 9.9%).
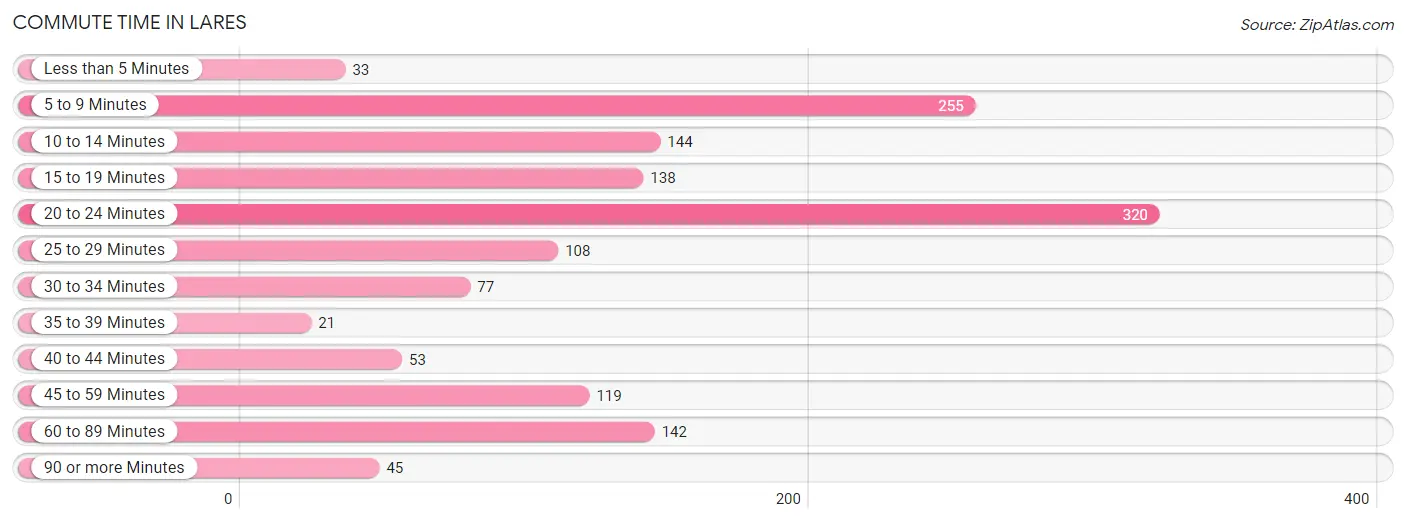
| Commute Time | # Commuters | % Commuters |
| Less than 5 Minutes | 33 | 2.3% |
| 5 to 9 Minutes | 255 | 17.5% |
| 10 to 14 Minutes | 144 | 9.9% |
| 15 to 19 Minutes | 138 | 9.5% |
| 20 to 24 Minutes | 320 | 22.0% |
| 25 to 29 Minutes | 108 | 7.4% |
| 30 to 34 Minutes | 77 | 5.3% |
| 35 to 39 Minutes | 21 | 1.4% |
| 40 to 44 Minutes | 53 | 3.6% |
| 45 to 59 Minutes | 119 | 8.2% |
| 60 to 89 Minutes | 142 | 9.8% |
| 90 or more Minutes | 45 | 3.1% |
Commute Time by Sex in Lares
The most common commute times in Lares are 20 to 24 minutes (165 commuters, 18.6%) for males and 20 to 24 minutes (155 commuters, 27.2%) for females.
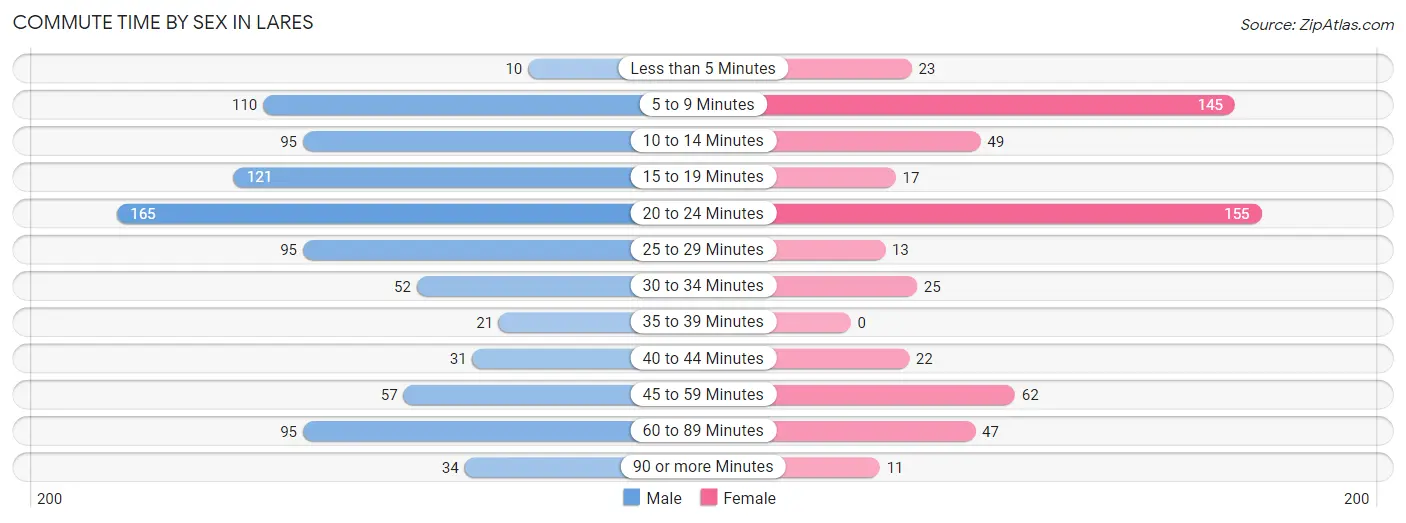
| Commute Time | Male | Female |
| Less than 5 Minutes | 10 (1.1%) | 23 (4.0%) |
| 5 to 9 Minutes | 110 (12.4%) | 145 (25.5%) |
| 10 to 14 Minutes | 95 (10.7%) | 49 (8.6%) |
| 15 to 19 Minutes | 121 (13.7%) | 17 (3.0%) |
| 20 to 24 Minutes | 165 (18.6%) | 155 (27.2%) |
| 25 to 29 Minutes | 95 (10.7%) | 13 (2.3%) |
| 30 to 34 Minutes | 52 (5.9%) | 25 (4.4%) |
| 35 to 39 Minutes | 21 (2.4%) | 0 (0.0%) |
| 40 to 44 Minutes | 31 (3.5%) | 22 (3.9%) |
| 45 to 59 Minutes | 57 (6.4%) | 62 (10.9%) |
| 60 to 89 Minutes | 95 (10.7%) | 47 (8.3%) |
| 90 or more Minutes | 34 (3.8%) | 11 (1.9%) |
Time of Departure to Work by Sex in Lares
The most frequent times of departure to work in Lares are 7:00 AM to 7:29 AM (175, 19.8%) for males and 7:00 AM to 7:29 AM (205, 36.0%) for females.
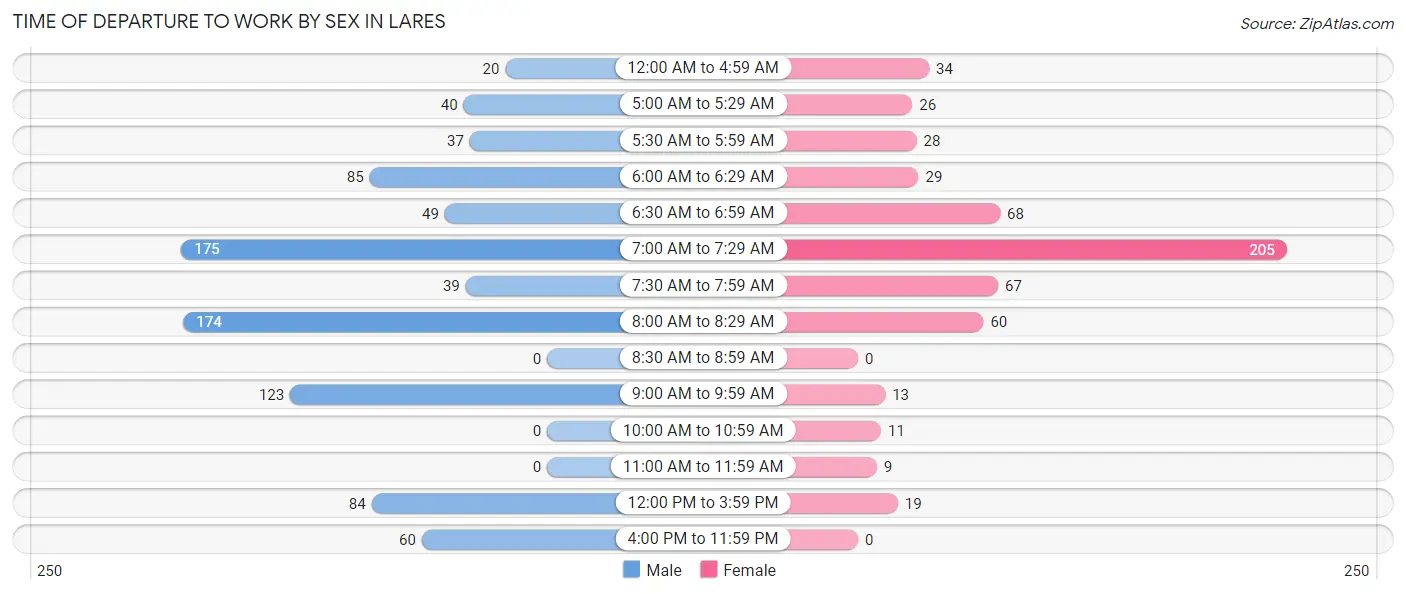
| Time of Departure | Male | Female |
| 12:00 AM to 4:59 AM | 20 (2.3%) | 34 (6.0%) |
| 5:00 AM to 5:29 AM | 40 (4.5%) | 26 (4.6%) |
| 5:30 AM to 5:59 AM | 37 (4.2%) | 28 (4.9%) |
| 6:00 AM to 6:29 AM | 85 (9.6%) | 29 (5.1%) |
| 6:30 AM to 6:59 AM | 49 (5.5%) | 68 (11.9%) |
| 7:00 AM to 7:29 AM | 175 (19.8%) | 205 (36.0%) |
| 7:30 AM to 7:59 AM | 39 (4.4%) | 67 (11.8%) |
| 8:00 AM to 8:29 AM | 174 (19.6%) | 60 (10.5%) |
| 8:30 AM to 8:59 AM | 0 (0.0%) | 0 (0.0%) |
| 9:00 AM to 9:59 AM | 123 (13.9%) | 13 (2.3%) |
| 10:00 AM to 10:59 AM | 0 (0.0%) | 11 (1.9%) |
| 11:00 AM to 11:59 AM | 0 (0.0%) | 9 (1.6%) |
| 12:00 PM to 3:59 PM | 84 (9.5%) | 19 (3.3%) |
| 4:00 PM to 11:59 PM | 60 (6.8%) | 0 (0.0%) |
| Total | 886 (100.0%) | 569 (100.0%) |
Housing Occupancy in Lares
Occupancy by Ownership in Lares
Of the total 2,034 dwellings in Lares, owner-occupied units account for 1,140 (56.0%), while renter-occupied units make up 894 (44.0%).
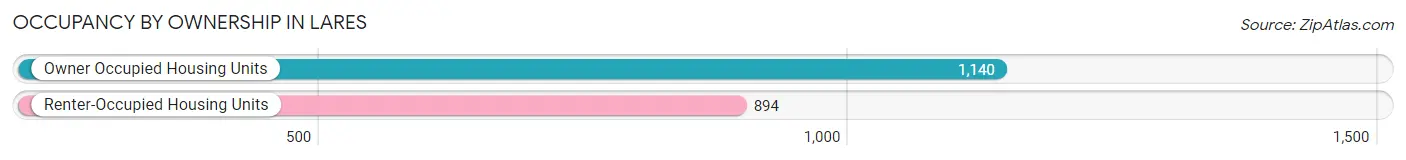
| Occupancy | # Housing Units | % Housing Units |
| Owner Occupied Housing Units | 1,140 | 56.0% |
| Renter-Occupied Housing Units | 894 | 44.0% |
| Total Occupied Housing Units | 2,034 | 100.0% |
Occupancy by Household Size in Lares
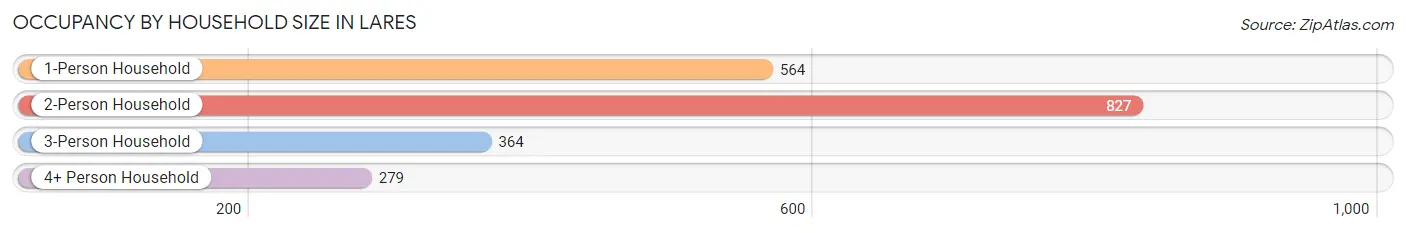
| Household Size | # Housing Units | % Housing Units |
| 1-Person Household | 564 | 27.7% |
| 2-Person Household | 827 | 40.7% |
| 3-Person Household | 364 | 17.9% |
| 4+ Person Household | 279 | 13.7% |
| Total Housing Units | 2,034 | 100.0% |
Occupancy by Ownership by Household Size in Lares
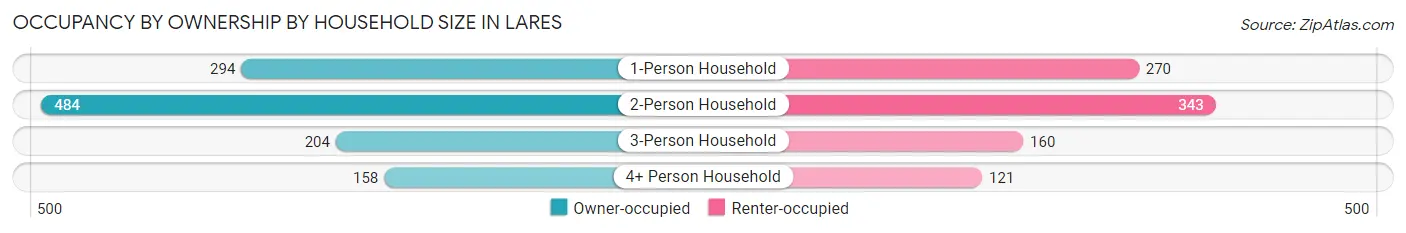
| Household Size | Owner-occupied | Renter-occupied |
| 1-Person Household | 294 (52.1%) | 270 (47.9%) |
| 2-Person Household | 484 (58.5%) | 343 (41.5%) |
| 3-Person Household | 204 (56.0%) | 160 (44.0%) |
| 4+ Person Household | 158 (56.6%) | 121 (43.4%) |
| Total Housing Units | 1,140 (56.0%) | 894 (44.0%) |
Occupancy by Educational Attainment in Lares
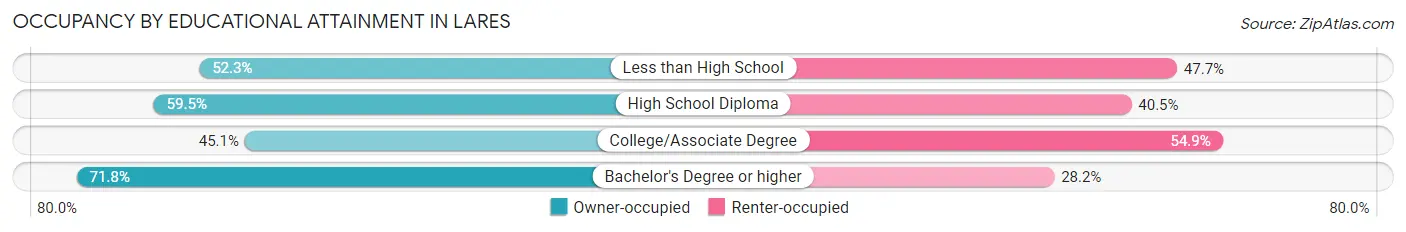
| Household Size | Owner-occupied | Renter-occupied |
| Less than High School | 273 (52.3%) | 249 (47.7%) |
| High School Diploma | 297 (59.5%) | 202 (40.5%) |
| College/Associate Degree | 265 (45.1%) | 323 (54.9%) |
| Bachelor's Degree or higher | 305 (71.8%) | 120 (28.2%) |
Occupancy by Age of Householder in Lares
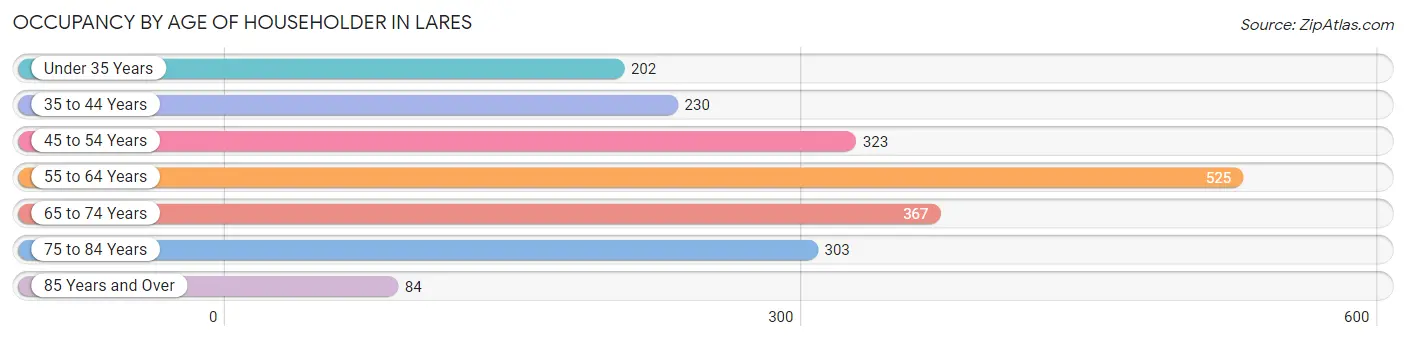
| Age Bracket | # Households | % Households |
| Under 35 Years | 202 | 9.9% |
| 35 to 44 Years | 230 | 11.3% |
| 45 to 54 Years | 323 | 15.9% |
| 55 to 64 Years | 525 | 25.8% |
| 65 to 74 Years | 367 | 18.0% |
| 75 to 84 Years | 303 | 14.9% |
| 85 Years and Over | 84 | 4.1% |
| Total | 2,034 | 100.0% |
Housing Finances in Lares
Median Income by Occupancy in Lares
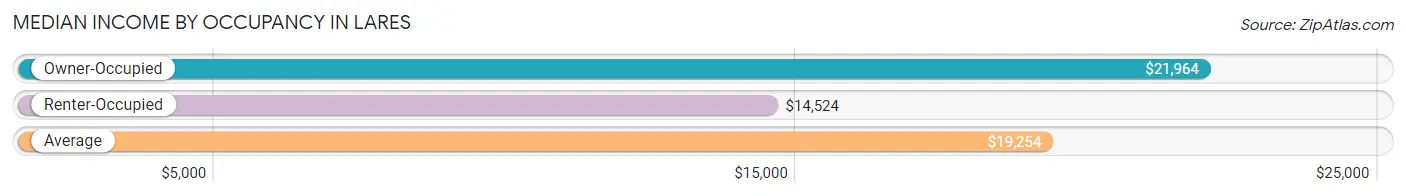
| Occupancy Type | # Households | Median Income |
| Owner-Occupied | 1,140 (56.0%) | $21,964 |
| Renter-Occupied | 894 (44.0%) | $14,524 |
| Average | 2,034 (100.0%) | $19,254 |
Occupancy by Householder Income Bracket in Lares
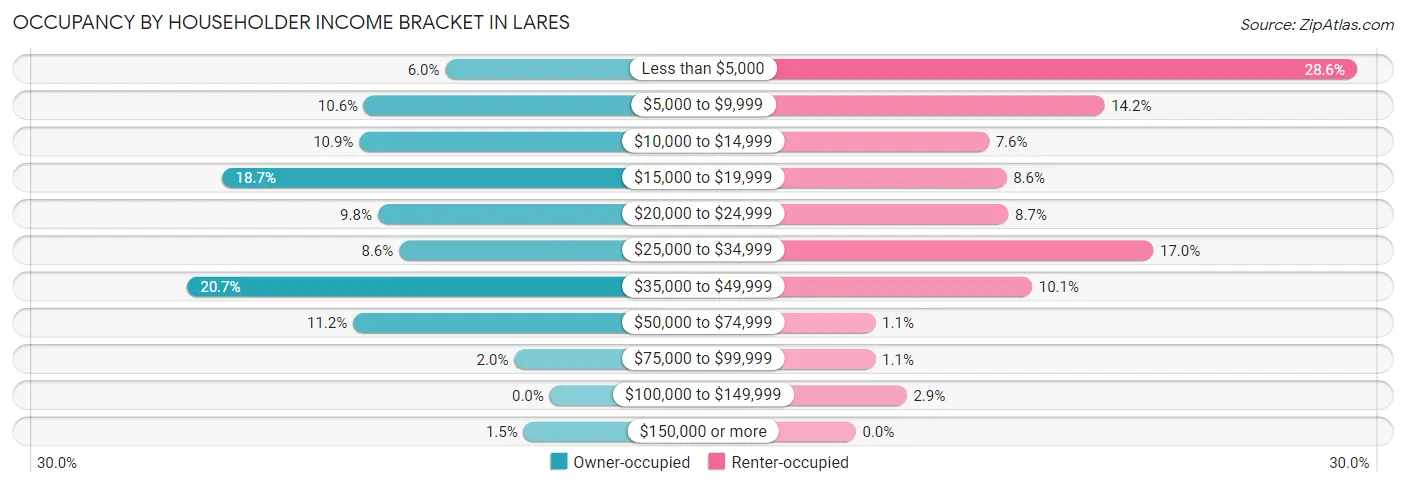
| Income Bracket | Owner-occupied | Renter-occupied |
| Less than $5,000 | 68 (6.0%) | 256 (28.6%) |
| $5,000 to $9,999 | 121 (10.6%) | 127 (14.2%) |
| $10,000 to $14,999 | 124 (10.9%) | 68 (7.6%) |
| $15,000 to $19,999 | 213 (18.7%) | 77 (8.6%) |
| $20,000 to $24,999 | 112 (9.8%) | 78 (8.7%) |
| $25,000 to $34,999 | 98 (8.6%) | 152 (17.0%) |
| $35,000 to $49,999 | 236 (20.7%) | 90 (10.1%) |
| $50,000 to $74,999 | 128 (11.2%) | 10 (1.1%) |
| $75,000 to $99,999 | 23 (2.0%) | 10 (1.1%) |
| $100,000 to $149,999 | 0 (0.0%) | 26 (2.9%) |
| $150,000 or more | 17 (1.5%) | 0 (0.0%) |
| Total | 1,140 (100.0%) | 894 (100.0%) |
Monthly Housing Cost Tiers in Lares
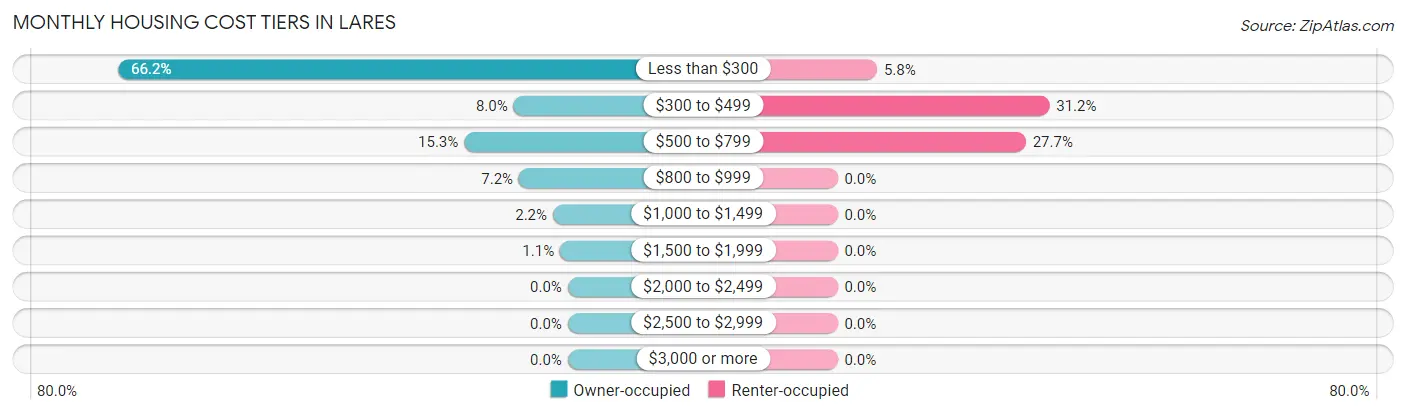
| Monthly Cost | Owner-occupied | Renter-occupied |
| Less than $300 | 755 (66.2%) | 52 (5.8%) |
| $300 to $499 | 91 (8.0%) | 279 (31.2%) |
| $500 to $799 | 174 (15.3%) | 248 (27.7%) |
| $800 to $999 | 82 (7.2%) | 0 (0.0%) |
| $1,000 to $1,499 | 25 (2.2%) | 0 (0.0%) |
| $1,500 to $1,999 | 13 (1.1%) | 0 (0.0%) |
| $2,000 to $2,499 | 0 (0.0%) | 0 (0.0%) |
| $2,500 to $2,999 | 0 (0.0%) | 0 (0.0%) |
| $3,000 or more | 0 (0.0%) | 0 (0.0%) |
| Total | 1,140 (100.0%) | 894 (100.0%) |
Physical Housing Characteristics in Lares
Housing Structures in Lares
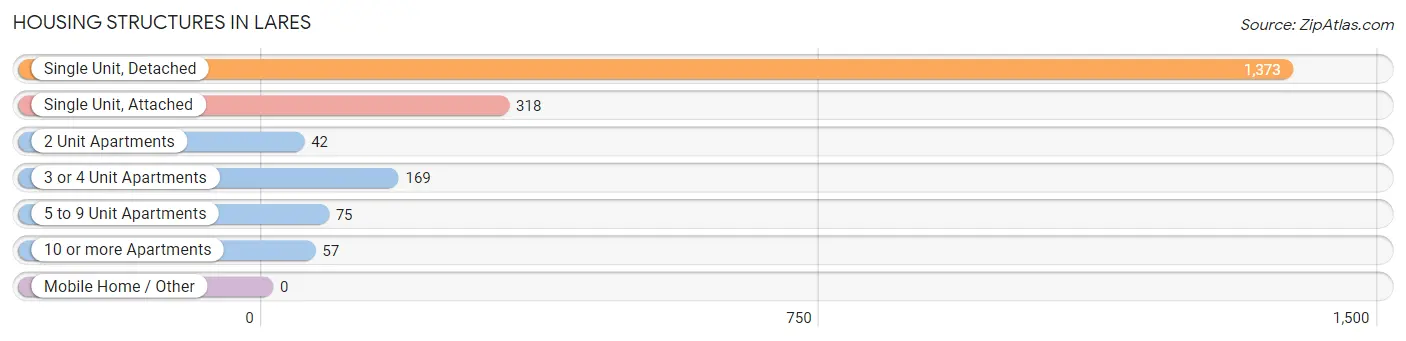
| Structure Type | # Housing Units | % Housing Units |
| Single Unit, Detached | 1,373 | 67.5% |
| Single Unit, Attached | 318 | 15.6% |
| 2 Unit Apartments | 42 | 2.1% |
| 3 or 4 Unit Apartments | 169 | 8.3% |
| 5 to 9 Unit Apartments | 75 | 3.7% |
| 10 or more Apartments | 57 | 2.8% |
| Mobile Home / Other | 0 | 0.0% |
| Total | 2,034 | 100.0% |
Housing Structures by Occupancy in Lares
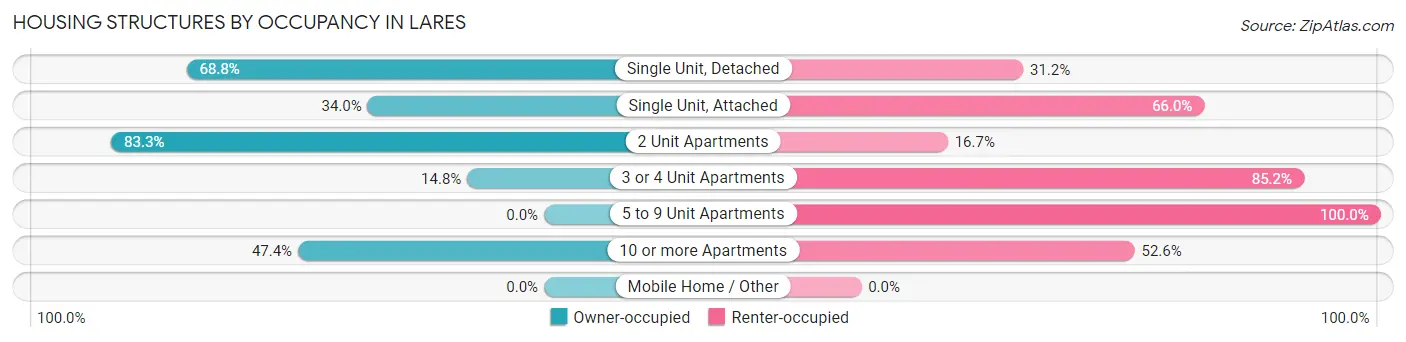
| Structure Type | Owner-occupied | Renter-occupied |
| Single Unit, Detached | 945 (68.8%) | 428 (31.2%) |
| Single Unit, Attached | 108 (34.0%) | 210 (66.0%) |
| 2 Unit Apartments | 35 (83.3%) | 7 (16.7%) |
| 3 or 4 Unit Apartments | 25 (14.8%) | 144 (85.2%) |
| 5 to 9 Unit Apartments | 0 (0.0%) | 75 (100.0%) |
| 10 or more Apartments | 27 (47.4%) | 30 (52.6%) |
| Mobile Home / Other | 0 (0.0%) | 0 (0.0%) |
| Total | 1,140 (56.0%) | 894 (44.0%) |
Housing Structures by Number of Rooms in Lares
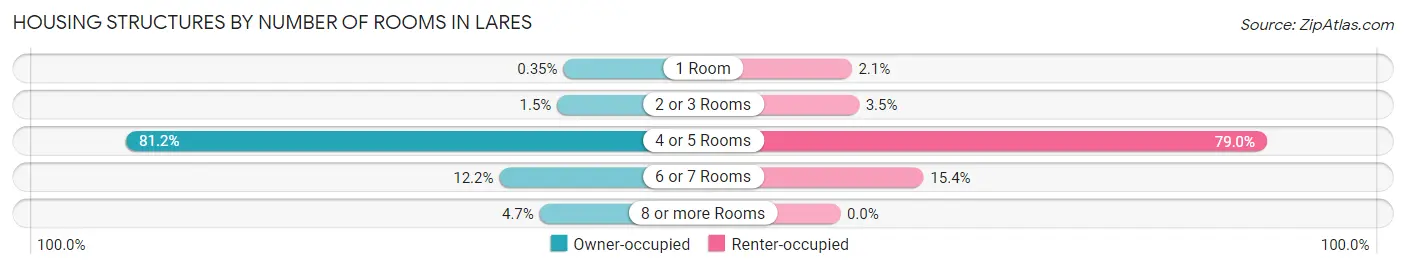
| Number of Rooms | Owner-occupied | Renter-occupied |
| 1 Room | 4 (0.4%) | 19 (2.1%) |
| 2 or 3 Rooms | 17 (1.5%) | 31 (3.5%) |
| 4 or 5 Rooms | 926 (81.2%) | 706 (79.0%) |
| 6 or 7 Rooms | 139 (12.2%) | 138 (15.4%) |
| 8 or more Rooms | 54 (4.7%) | 0 (0.0%) |
| Total | 1,140 (100.0%) | 894 (100.0%) |
Housing Structure by Heating Type in Lares
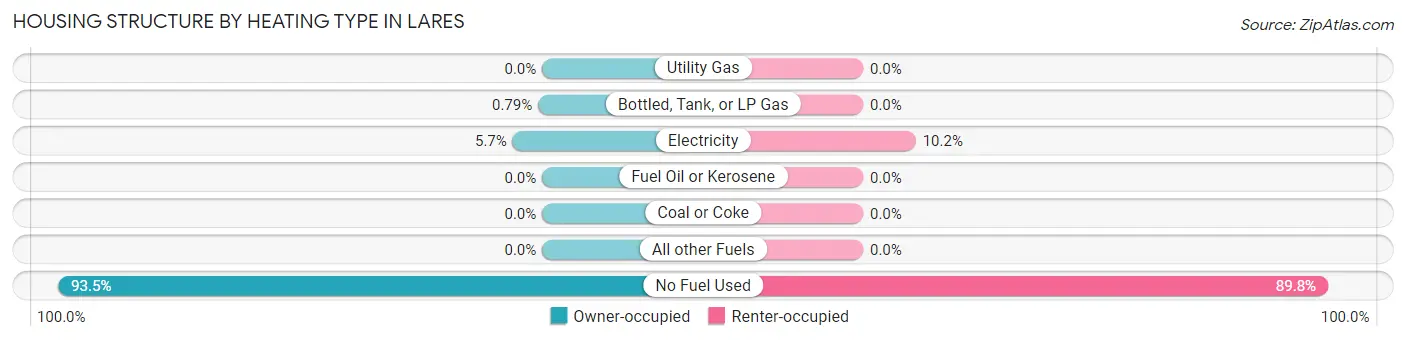
| Heating Type | Owner-occupied | Renter-occupied |
| Utility Gas | 0 (0.0%) | 0 (0.0%) |
| Bottled, Tank, or LP Gas | 9 (0.8%) | 0 (0.0%) |
| Electricity | 65 (5.7%) | 91 (10.2%) |
| Fuel Oil or Kerosene | 0 (0.0%) | 0 (0.0%) |
| Coal or Coke | 0 (0.0%) | 0 (0.0%) |
| All other Fuels | 0 (0.0%) | 0 (0.0%) |
| No Fuel Used | 1,066 (93.5%) | 803 (89.8%) |
| Total | 1,140 (100.0%) | 894 (100.0%) |
Household Vehicle Usage in Lares
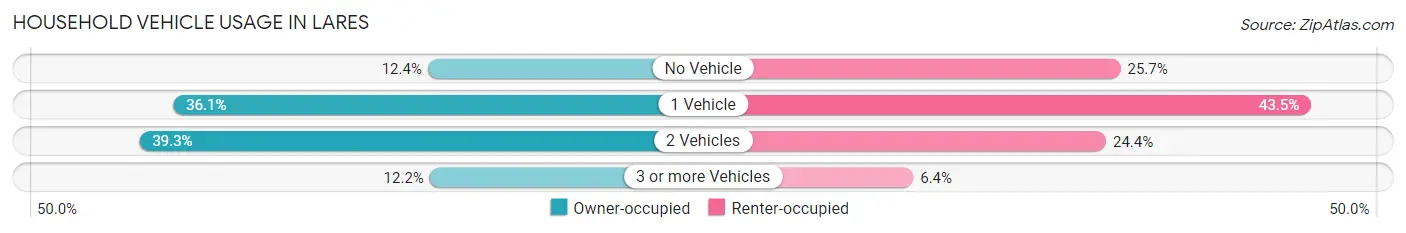
| Vehicles per Household | Owner-occupied | Renter-occupied |
| No Vehicle | 141 (12.4%) | 230 (25.7%) |
| 1 Vehicle | 412 (36.1%) | 389 (43.5%) |
| 2 Vehicles | 448 (39.3%) | 218 (24.4%) |
| 3 or more Vehicles | 139 (12.2%) | 57 (6.4%) |
| Total | 1,140 (100.0%) | 894 (100.0%) |
Real Estate & Mortgages in Lares
Real Estate and Mortgage Overview in Lares
| Characteristic | Without Mortgage | With Mortgage |
| Housing Units | 803 | 337 |
| Median Property Value | $96,800 | $108,400 |
| Median Household Income | $19,408 | $17 |
| Monthly Housing Costs | $153 | $0 |
| Real Estate Taxes | $199 | $322 |
Property Value by Mortgage Status in Lares
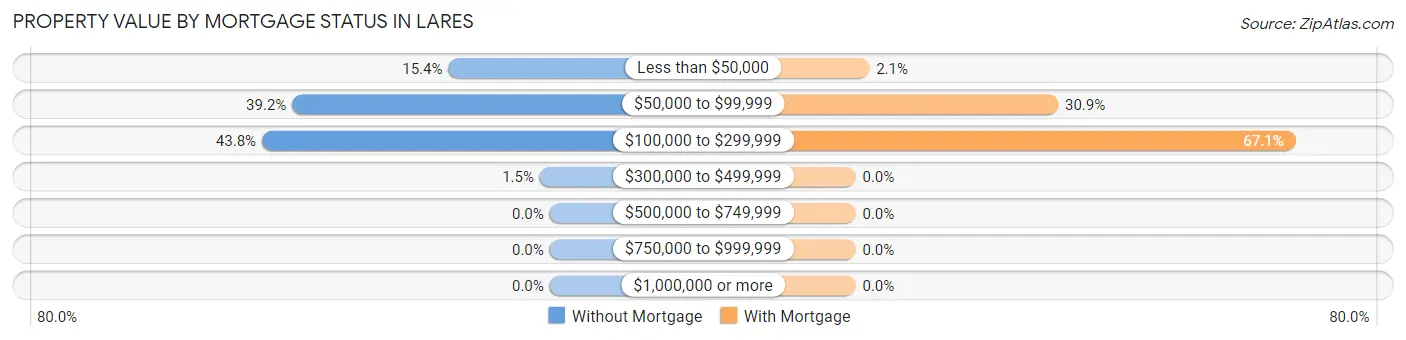
| Property Value | Without Mortgage | With Mortgage |
| Less than $50,000 | 124 (15.4%) | 7 (2.1%) |
| $50,000 to $99,999 | 315 (39.2%) | 104 (30.9%) |
| $100,000 to $299,999 | 352 (43.8%) | 226 (67.1%) |
| $300,000 to $499,999 | 12 (1.5%) | 0 (0.0%) |
| $500,000 to $749,999 | 0 (0.0%) | 0 (0.0%) |
| $750,000 to $999,999 | 0 (0.0%) | 0 (0.0%) |
| $1,000,000 or more | 0 (0.0%) | 0 (0.0%) |
| Total | 803 (100.0%) | 337 (100.0%) |
Household Income by Mortgage Status in Lares
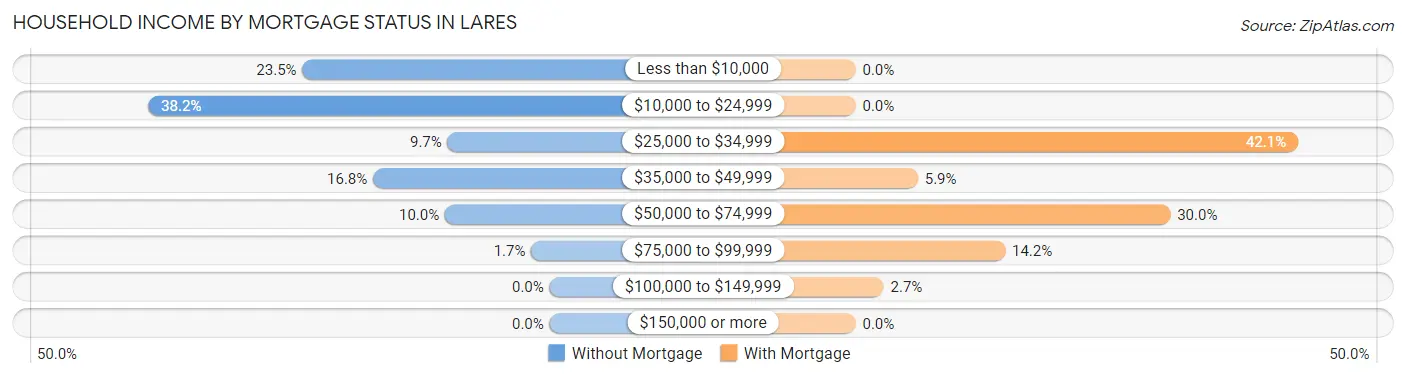
| Household Income | Without Mortgage | With Mortgage |
| Less than $10,000 | 189 (23.5%) | 0 (0.0%) |
| $10,000 to $24,999 | 307 (38.2%) | 0 (0.0%) |
| $25,000 to $34,999 | 78 (9.7%) | 142 (42.1%) |
| $35,000 to $49,999 | 135 (16.8%) | 20 (5.9%) |
| $50,000 to $74,999 | 80 (10.0%) | 101 (30.0%) |
| $75,000 to $99,999 | 14 (1.7%) | 48 (14.2%) |
| $100,000 to $149,999 | 0 (0.0%) | 9 (2.7%) |
| $150,000 or more | 0 (0.0%) | 0 (0.0%) |
| Total | 803 (100.0%) | 337 (100.0%) |
Property Value to Household Income Ratio in Lares
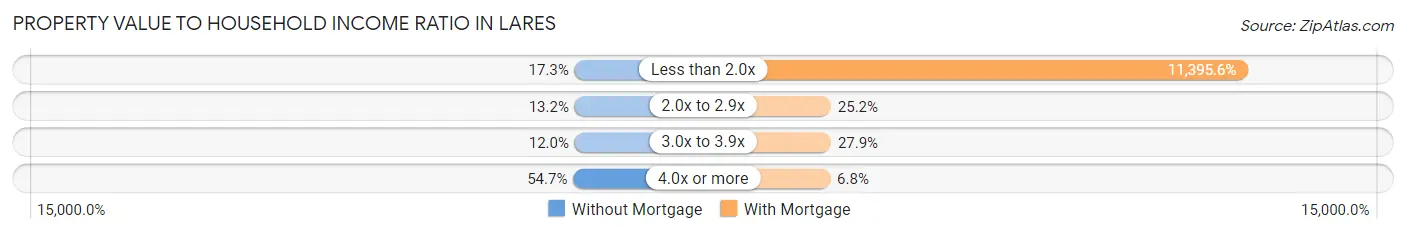
| Value-to-Income Ratio | Without Mortgage | With Mortgage |
| Less than 2.0x | 139 (17.3%) | 38,403 (11,395.6%) |
| 2.0x to 2.9x | 106 (13.2%) | 85 (25.2%) |
| 3.0x to 3.9x | 96 (12.0%) | 94 (27.9%) |
| 4.0x or more | 439 (54.7%) | 23 (6.8%) |
| Total | 803 (100.0%) | 337 (100.0%) |
Real Estate Taxes by Mortgage Status in Lares
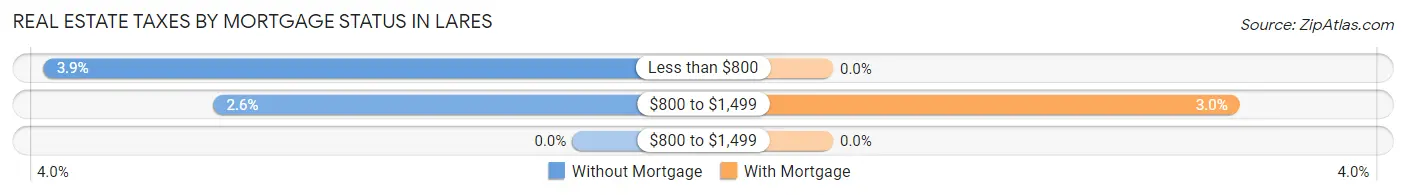
| Property Taxes | Without Mortgage | With Mortgage |
| Less than $800 | 31 (3.9%) | 0 (0.0%) |
| $800 to $1,499 | 21 (2.6%) | 10 (3.0%) |
| $800 to $1,499 | 0 (0.0%) | 0 (0.0%) |
| Total | 803 (100.0%) | 337 (100.0%) |
Health & Disability in Lares
Health Insurance Coverage by Age in Lares
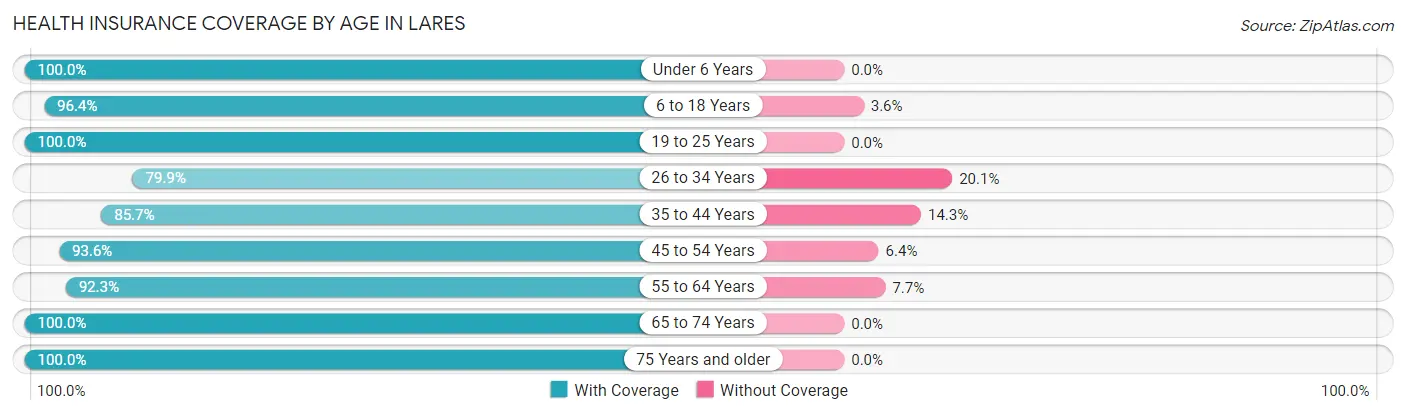
| Age Bracket | With Coverage | Without Coverage |
| Under 6 Years | 312 (100.0%) | 0 (0.0%) |
| 6 to 18 Years | 478 (96.4%) | 18 (3.6%) |
| 19 to 25 Years | 405 (100.0%) | 0 (0.0%) |
| 26 to 34 Years | 361 (79.9%) | 91 (20.1%) |
| 35 to 44 Years | 419 (85.7%) | 70 (14.3%) |
| 45 to 54 Years | 599 (93.6%) | 41 (6.4%) |
| 55 to 64 Years | 757 (92.3%) | 63 (7.7%) |
| 65 to 74 Years | 571 (100.0%) | 0 (0.0%) |
| 75 Years and older | 648 (100.0%) | 0 (0.0%) |
| Total | 4,550 (94.1%) | 283 (5.9%) |
Health Insurance Coverage by Citizenship Status in Lares
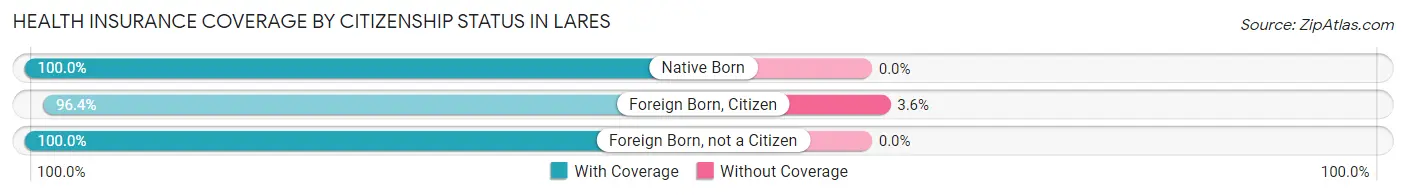
| Citizenship Status | With Coverage | Without Coverage |
| Native Born | 312 (100.0%) | 0 (0.0%) |
| Foreign Born, Citizen | 478 (96.4%) | 18 (3.6%) |
| Foreign Born, not a Citizen | 405 (100.0%) | 0 (0.0%) |
Health Insurance Coverage by Household Income in Lares
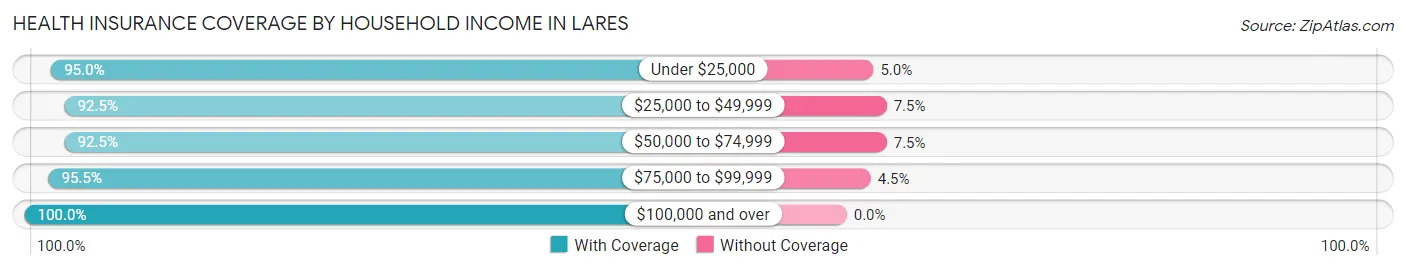
| Household Income | With Coverage | Without Coverage |
| Under $25,000 | 2,469 (95.0%) | 130 (5.0%) |
| $25,000 to $49,999 | 1,422 (92.5%) | 115 (7.5%) |
| $50,000 to $74,999 | 383 (92.5%) | 31 (7.5%) |
| $75,000 to $99,999 | 149 (95.5%) | 7 (4.5%) |
| $100,000 and over | 117 (100.0%) | 0 (0.0%) |
Public vs Private Health Insurance Coverage by Age in Lares
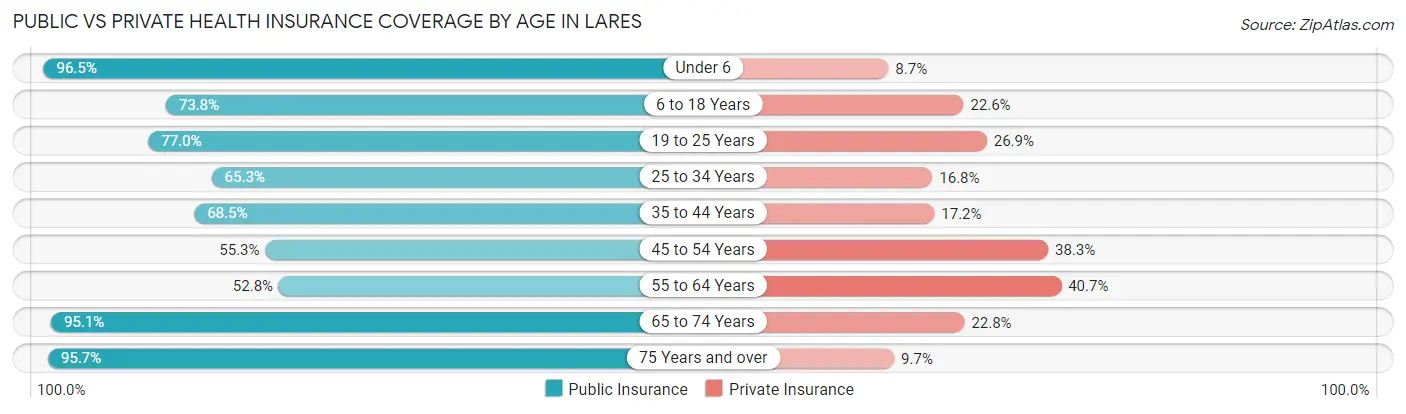
| Age Bracket | Public Insurance | Private Insurance |
| Under 6 | 301 (96.5%) | 27 (8.6%) |
| 6 to 18 Years | 366 (73.8%) | 112 (22.6%) |
| 19 to 25 Years | 312 (77.0%) | 109 (26.9%) |
| 25 to 34 Years | 295 (65.3%) | 76 (16.8%) |
| 35 to 44 Years | 335 (68.5%) | 84 (17.2%) |
| 45 to 54 Years | 354 (55.3%) | 245 (38.3%) |
| 55 to 64 Years | 433 (52.8%) | 334 (40.7%) |
| 65 to 74 Years | 543 (95.1%) | 130 (22.8%) |
| 75 Years and over | 620 (95.7%) | 63 (9.7%) |
| Total | 3,559 (73.6%) | 1,180 (24.4%) |
Disability Status by Sex by Age in Lares
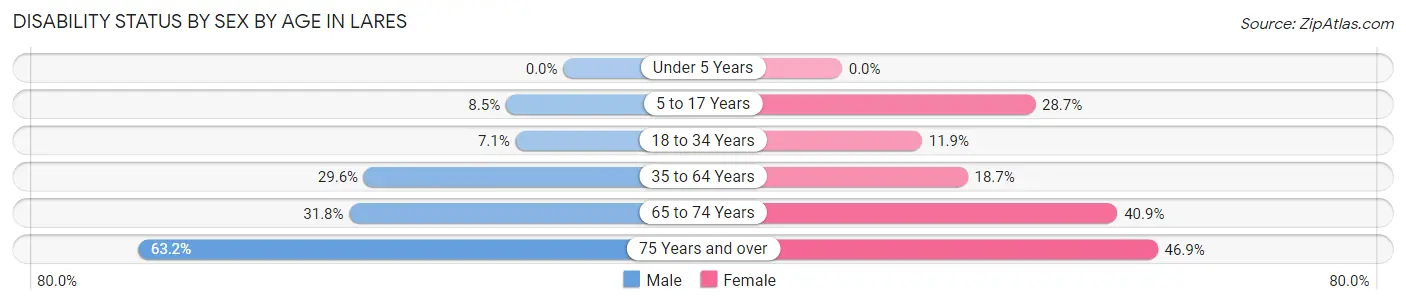
| Age Bracket | Male | Female |
| Under 5 Years | 0 (0.0%) | 0 (0.0%) |
| 5 to 17 Years | 26 (8.5%) | 62 (28.7%) |
| 18 to 34 Years | 36 (7.1%) | 53 (11.9%) |
| 35 to 64 Years | 271 (29.6%) | 193 (18.7%) |
| 65 to 74 Years | 68 (31.8%) | 146 (40.9%) |
| 75 Years and over | 187 (63.2%) | 165 (46.9%) |
Disability Class by Sex by Age in Lares
Disability Class: Hearing Difficulty
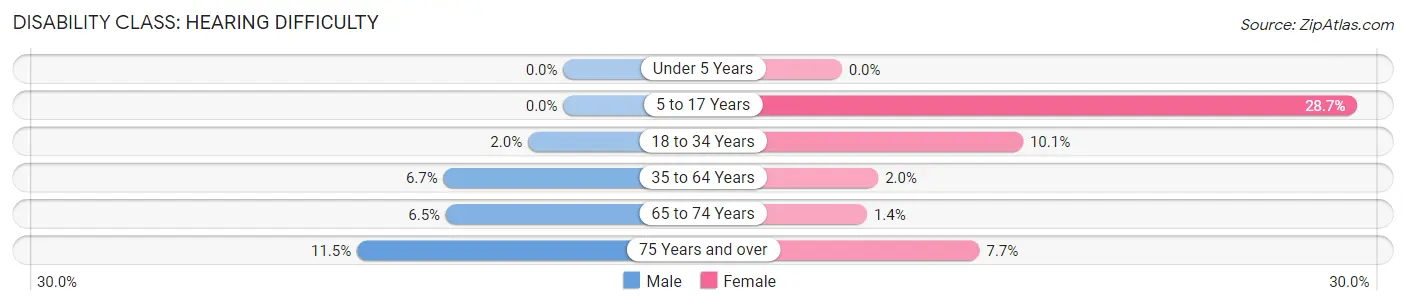
| Age Bracket | Male | Female |
| Under 5 Years | 0 (0.0%) | 0 (0.0%) |
| 5 to 17 Years | 0 (0.0%) | 62 (28.7%) |
| 18 to 34 Years | 10 (2.0%) | 45 (10.1%) |
| 35 to 64 Years | 61 (6.7%) | 21 (2.0%) |
| 65 to 74 Years | 14 (6.5%) | 5 (1.4%) |
| 75 Years and over | 34 (11.5%) | 27 (7.7%) |
Disability Class: Vision Difficulty
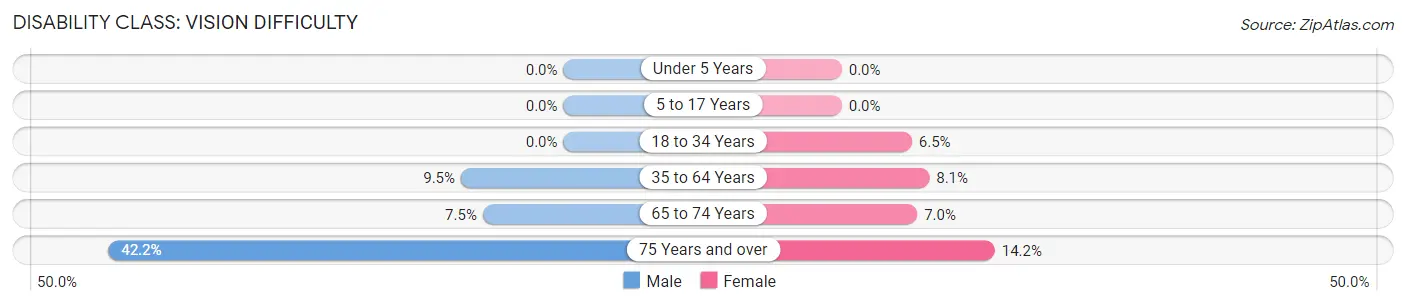
| Age Bracket | Male | Female |
| Under 5 Years | 0 (0.0%) | 0 (0.0%) |
| 5 to 17 Years | 0 (0.0%) | 0 (0.0%) |
| 18 to 34 Years | 0 (0.0%) | 29 (6.5%) |
| 35 to 64 Years | 87 (9.5%) | 84 (8.1%) |
| 65 to 74 Years | 16 (7.5%) | 25 (7.0%) |
| 75 Years and over | 125 (42.2%) | 50 (14.2%) |
Disability Class: Cognitive Difficulty
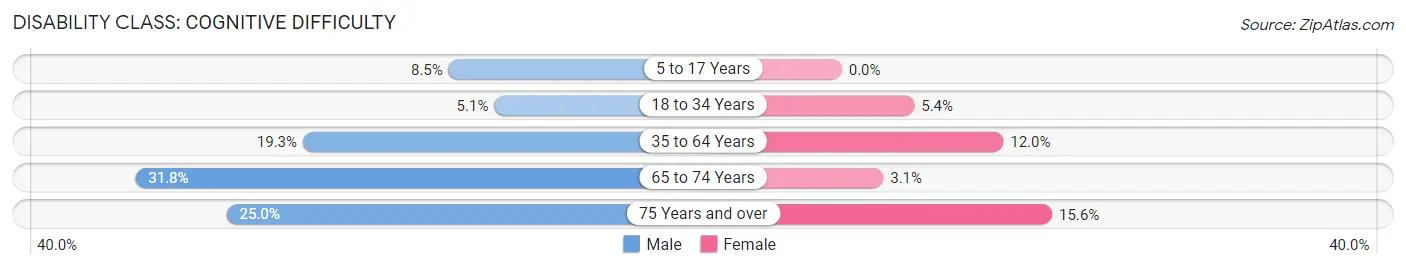
| Age Bracket | Male | Female |
| 5 to 17 Years | 26 (8.5%) | 0 (0.0%) |
| 18 to 34 Years | 26 (5.1%) | 24 (5.4%) |
| 35 to 64 Years | 177 (19.3%) | 124 (12.0%) |
| 65 to 74 Years | 68 (31.8%) | 11 (3.1%) |
| 75 Years and over | 74 (25.0%) | 55 (15.6%) |
Disability Class: Ambulatory Difficulty
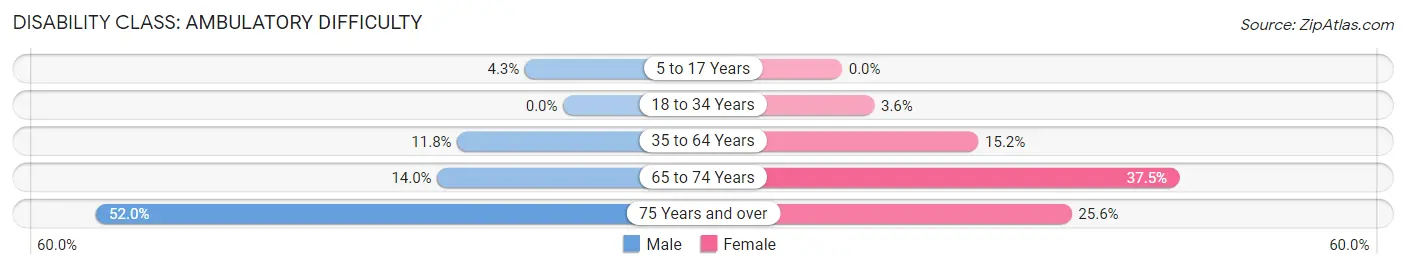
| Age Bracket | Male | Female |
| 5 to 17 Years | 13 (4.3%) | 0 (0.0%) |
| 18 to 34 Years | 0 (0.0%) | 16 (3.6%) |
| 35 to 64 Years | 108 (11.8%) | 157 (15.2%) |
| 65 to 74 Years | 30 (14.0%) | 134 (37.5%) |
| 75 Years and over | 154 (52.0%) | 90 (25.6%) |
Disability Class: Self-Care Difficulty
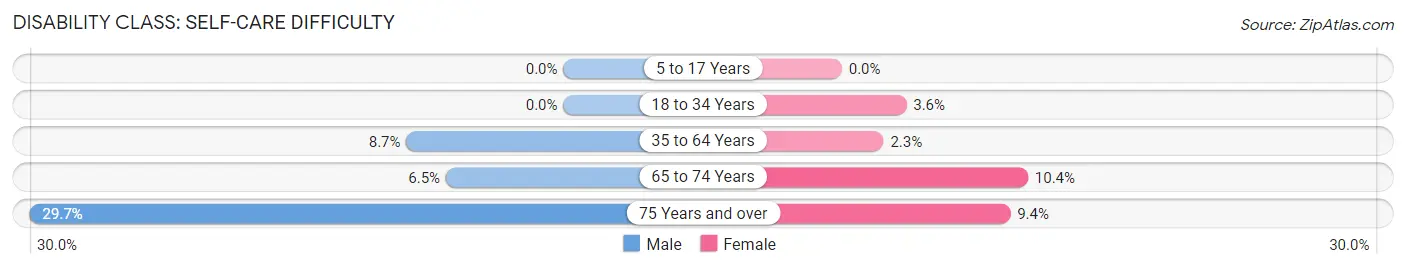
| Age Bracket | Male | Female |
| 5 to 17 Years | 0 (0.0%) | 0 (0.0%) |
| 18 to 34 Years | 0 (0.0%) | 16 (3.6%) |
| 35 to 64 Years | 80 (8.7%) | 24 (2.3%) |
| 65 to 74 Years | 14 (6.5%) | 37 (10.4%) |
| 75 Years and over | 88 (29.7%) | 33 (9.4%) |
Technology Access in Lares
Computing Device Access in Lares
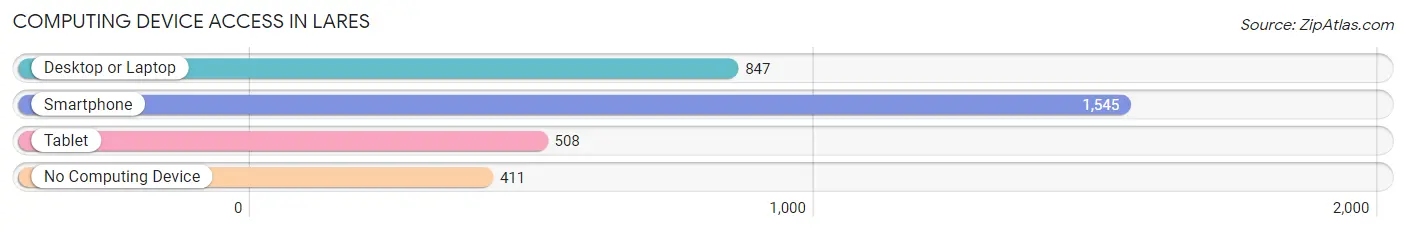
| Device Type | # Households | % Households |
| Desktop or Laptop | 847 | 41.6% |
| Smartphone | 1,545 | 76.0% |
| Tablet | 508 | 25.0% |
| No Computing Device | 411 | 20.2% |
| Total | 2,034 | 100.0% |
Internet Access in Lares
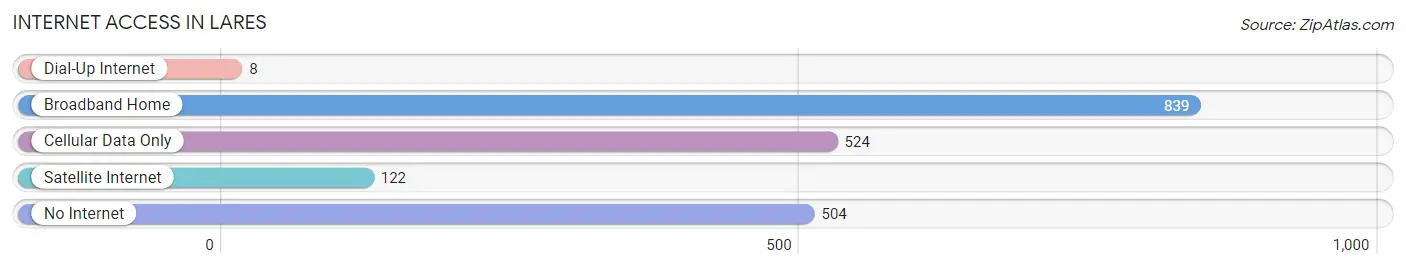
| Internet Type | # Households | % Households |
| Dial-Up Internet | 8 | 0.4% |
| Broadband Home | 839 | 41.2% |
| Cellular Data Only | 524 | 25.8% |
| Satellite Internet | 122 | 6.0% |
| No Internet | 504 | 24.8% |
| Total | 2,034 | 100.0% |
Lares Summary
Lares, Puerto Rico is a municipality located in the western region of the island of Puerto Rico. It is bordered by the municipalities of Adjuntas, Utuado, and Hatillo. The town of Lares is the administrative center of the municipality and is located in the central part of the municipality.
History
The area of Lares was originally inhabited by the Taíno Indians. The Taíno Indians were the first inhabitants of Puerto Rico and were a peaceful people who lived in small villages and practiced agriculture. The Taíno Indians were eventually displaced by the Spanish who arrived in Puerto Rico in the early 16th century.
The town of Lares was founded in 1827 by Don Salvador Meléndez and Don Manuel de la Torre. The town was named after the Spanish word for “valley”, which is “lares”. The town was originally a small agricultural village and was known for its coffee production.
In 1868, the town of Lares was the site of the Grito de Lares, a revolt against Spanish rule. The revolt was led by Ramón Emeterio Betances and Segundo Ruiz Belvis and was the first major revolt against Spanish rule in Puerto Rico. The revolt was unsuccessful and the leaders were exiled.
In 1898, Puerto Rico was ceded to the United States as a result of the Spanish-American War. The town of Lares was incorporated as a municipality in 1902.
Geography
Lares is located in the western region of Puerto Rico and is bordered by the municipalities of Adjuntas, Utuado, and Hatillo. The municipality has a total area of 79.9 square miles and is divided into 11 barrios. The terrain of the municipality is mostly mountainous and is part of the Cordillera Central mountain range.
The highest point in the municipality is Cerro de Punta, which has an elevation of 4,390 feet. The municipality is also home to several rivers, including the Grande de Lares, the Guajataca, and the Culebrinas.
Economy
The economy of Lares is largely based on agriculture and tourism. The municipality is known for its production of coffee, bananas, and other agricultural products. Tourism is also an important part of the economy, with many visitors coming to the municipality to enjoy its natural beauty and outdoor activities.
Demographics
As of the 2010 census, the population of Lares was 24,824. The population is mostly of Puerto Rican descent, with a small percentage of African and European descent. The majority of the population is Roman Catholic.
The median household income in Lares is $14,845, which is lower than the median household income for Puerto Rico as a whole. The unemployment rate in Lares is also higher than the national average, at 16.2%.
Conclusion
Lares, Puerto Rico is a municipality located in the western region of the island of Puerto Rico. It is bordered by the municipalities of Adjuntas, Utuado, and Hatillo. The town of Lares is the administrative center of the municipality and is located in the central part of the municipality. The economy of Lares is largely based on agriculture and tourism, and the population is mostly of Puerto Rican descent. The median household income in Lares is lower than the median household income for Puerto Rico as a whole, and the unemployment rate is higher than the national average.
Common Questions
What is Per Capita Income in Lares?
Per Capita income in Lares is $11,869.
What is the Median Family Income in Lares?
Median Family Income in Lares is $23,192.
What is the Median Household income in Lares?
Median Household Income in Lares is $19,254.
What is Income or Wage Gap in Lares?
Income or Wage Gap in Lares is 22.2%.
Women in Lares earn 77.8 cents for every dollar earned by a man.
What is Family Income Deficit in Lares?
Family Income Deficit in Lares is $11,300.
Families that are below poverty line in Lares earn $11,300 less on average than the poverty threshold level.
What is Inequality or Gini Index in Lares?
Inequality or Gini Index in Lares is 0.49.
What is the Total Population of Lares?
Total Population of Lares is 4,871.
What is the Total Male Population of Lares?
Total Male Population of Lares is 2,326.
What is the Total Female Population of Lares?
Total Female Population of Lares is 2,545.
What is the Ratio of Males per 100 Females in Lares?
There are 91.39 Males per 100 Females in Lares.
What is the Ratio of Females per 100 Males in Lares?
There are 109.42 Females per 100 Males in Lares.
What is the Median Population Age in Lares?
Median Population Age in Lares is 49.5 Years.
What is the Average Family Size in Lares
Average Family Size in Lares is 2.9 People.
What is the Average Household Size in Lares
Average Household Size in Lares is 2.4 People.
How Large is the Labor Force in Lares?
There are 1,775 People in the Labor Forcein in Lares.
What is the Percentage of People in the Labor Force in Lares?
42.0% of People are in the Labor Force in Lares.
What is the Unemployment Rate in Lares?
Unemployment Rate in Lares is 15.1%.