Lamboglia, PR Map & Demographics
Lamboglia Map
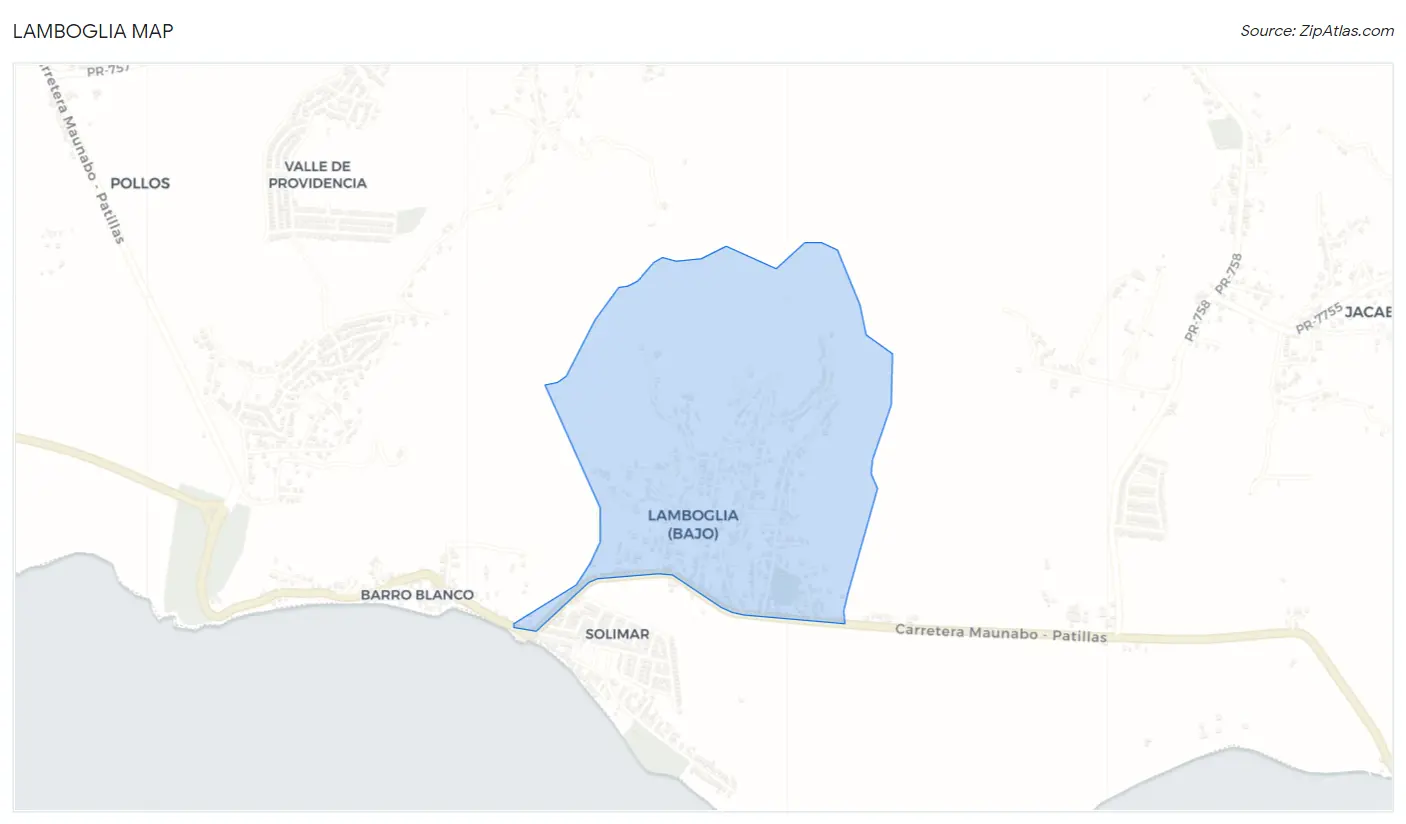
Lamboglia Overview
$13,092
PER CAPITA INCOME
$30,852
AVG FAMILY INCOME
$27,857
AVG HOUSEHOLD INCOME
0.7%
WAGE / INCOME GAP [ % ]
99.3¢/ $1
WAGE / INCOME GAP [ $ ]
0.44
INEQUALITY / GINI INDEX
933
TOTAL POPULATION
475
MALE POPULATION
458
FEMALE POPULATION
103.71
MALES / 100 FEMALES
96.42
FEMALES / 100 MALES
45.4
MEDIAN AGE
2.8
AVG FAMILY SIZE
2.4
AVG HOUSEHOLD SIZE
317
LABOR FORCE [ PEOPLE ]
42.1%
PERCENT IN LABOR FORCE
Income in Lamboglia
Income Overview in Lamboglia
Per Capita Income in Lamboglia is $13,092, while median incomes of families and households are $30,852 and $27,857 respectively.
| Characteristic | Number | Measure |
| Per Capita Income | 933 | $13,092 |
| Median Family Income | 261 | $30,852 |
| Mean Family Income | 261 | $23,688 |
| Median Household Income | 384 | $27,857 |
| Mean Household Income | 384 | $29,180 |
| Income Deficit | 261 | $0 |
| Wage / Income Gap (%) | 933 | 0.74% |
| Wage / Income Gap ($) | 933 | 99.26¢ per $1 |
| Gini / Inequality Index | 933 | 0.44 |
Earnings by Sex in Lamboglia
Average Earnings in Lamboglia are $19,718, $19,766 for men and $19,620 for women, a difference of 0.7%.
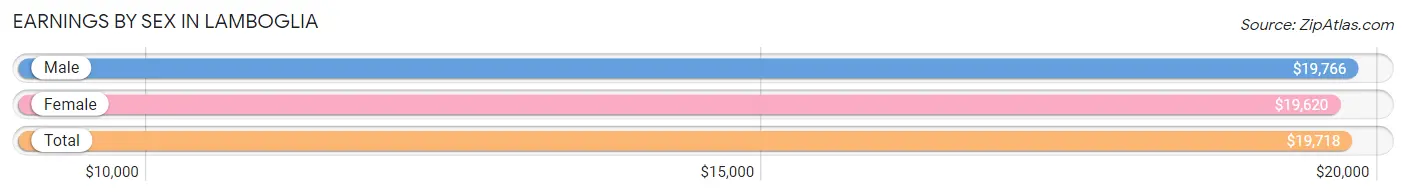
| Sex | Number | Average Earnings |
| Male | 235 (71.2%) | $19,766 |
| Female | 95 (28.8%) | $19,620 |
| Total | 330 (100.0%) | $19,718 |
Earnings by Sex by Income Bracket in Lamboglia
The most common earnings brackets in Lamboglia are $25,000 to $29,999 for men (70 | 29.8%) and $25,000 to $29,999 for women (26 | 27.4%).
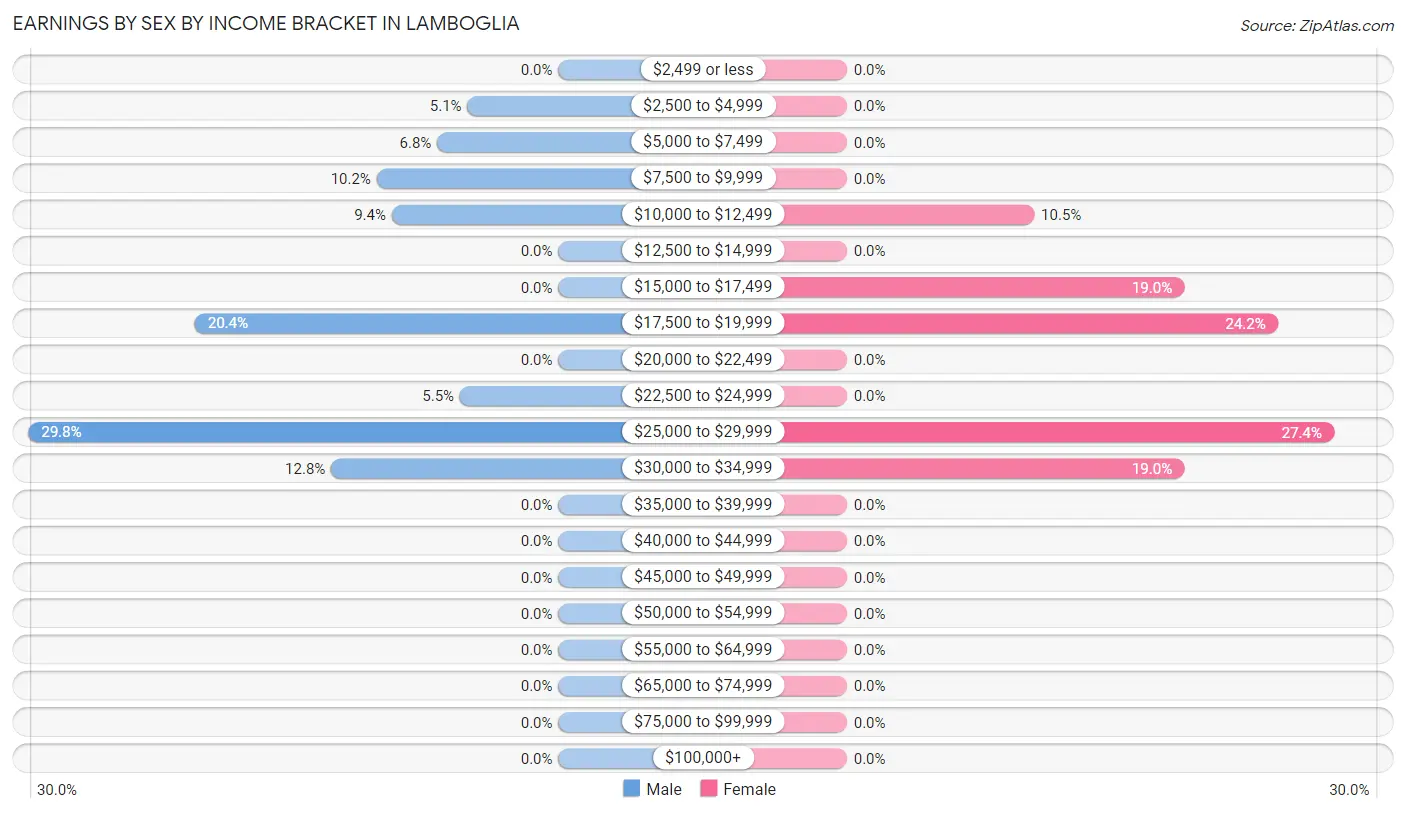
| Income | Male | Female |
| $2,499 or less | 0 (0.0%) | 0 (0.0%) |
| $2,500 to $4,999 | 12 (5.1%) | 0 (0.0%) |
| $5,000 to $7,499 | 16 (6.8%) | 0 (0.0%) |
| $7,500 to $9,999 | 24 (10.2%) | 0 (0.0%) |
| $10,000 to $12,499 | 22 (9.4%) | 10 (10.5%) |
| $12,500 to $14,999 | 0 (0.0%) | 0 (0.0%) |
| $15,000 to $17,499 | 0 (0.0%) | 18 (19.0%) |
| $17,500 to $19,999 | 48 (20.4%) | 23 (24.2%) |
| $20,000 to $22,499 | 0 (0.0%) | 0 (0.0%) |
| $22,500 to $24,999 | 13 (5.5%) | 0 (0.0%) |
| $25,000 to $29,999 | 70 (29.8%) | 26 (27.4%) |
| $30,000 to $34,999 | 30 (12.8%) | 18 (19.0%) |
| $35,000 to $39,999 | 0 (0.0%) | 0 (0.0%) |
| $40,000 to $44,999 | 0 (0.0%) | 0 (0.0%) |
| $45,000 to $49,999 | 0 (0.0%) | 0 (0.0%) |
| $50,000 to $54,999 | 0 (0.0%) | 0 (0.0%) |
| $55,000 to $64,999 | 0 (0.0%) | 0 (0.0%) |
| $65,000 to $74,999 | 0 (0.0%) | 0 (0.0%) |
| $75,000 to $99,999 | 0 (0.0%) | 0 (0.0%) |
| $100,000+ | 0 (0.0%) | 0 (0.0%) |
| Total | 235 (100.0%) | 95 (100.0%) |
Earnings by Sex by Educational Attainment in Lamboglia
Average earnings in Lamboglia are $22,788 for men and $25,208 for women, a difference of 9.6%. Men with an educational attainment of college or associate's degree enjoy the highest average annual earnings of $19,297, while those with college or associate's degree education earn the least with $19,297. Women with an educational attainment of bachelor's degree earn the most with the average annual earnings of $25,208, while those with bachelor's degree education have the smallest earnings of $25,208.
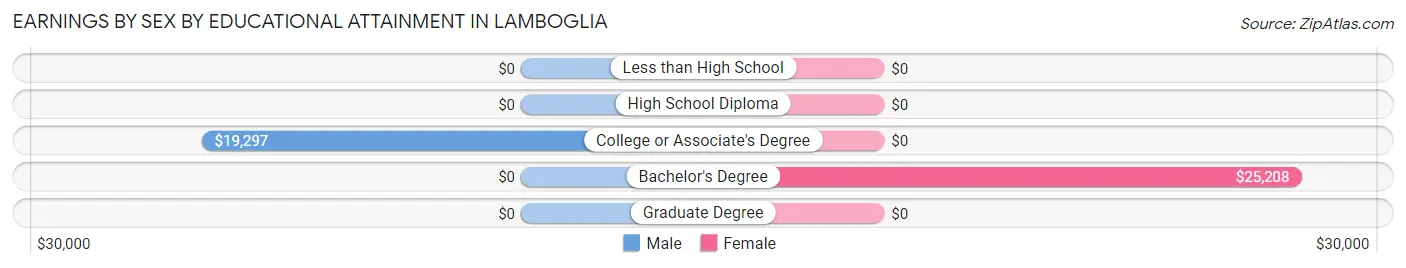
| Educational Attainment | Male Income | Female Income |
| Less than High School | - | - |
| High School Diploma | - | - |
| College or Associate's Degree | $19,297 | $0 |
| Bachelor's Degree | - | - |
| Graduate Degree | - | - |
| Total | $22,788 | $25,208 |
Family Income in Lamboglia
Family Income Brackets in Lamboglia
According to the Lamboglia family income data, there are 88 families falling into the less than $10,000 income range, which is the most common income bracket and makes up 33.7% of all families.
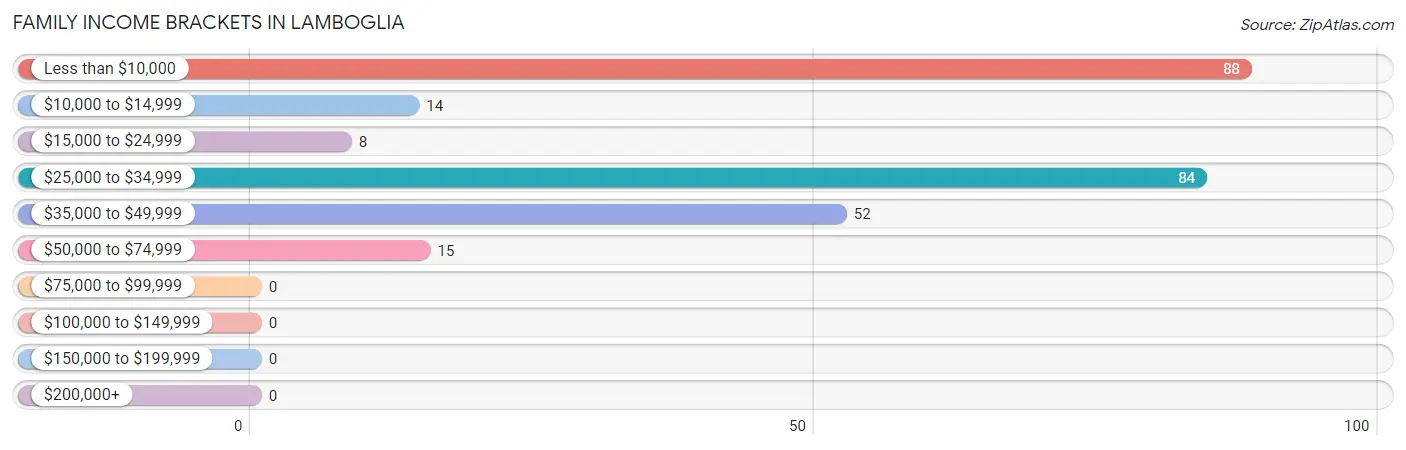
| Income Bracket | # Families | % Families |
| Less than $10,000 | 88 | 33.7% |
| $10,000 to $14,999 | 14 | 5.4% |
| $15,000 to $24,999 | 8 | 3.1% |
| $25,000 to $34,999 | 84 | 32.2% |
| $35,000 to $49,999 | 52 | 19.9% |
| $50,000 to $74,999 | 15 | 5.7% |
| $75,000 to $99,999 | 0 | 0.0% |
| $100,000 to $149,999 | 0 | 0.0% |
| $150,000 to $199,999 | 0 | 0.0% |
| $200,000+ | 0 | 0.0% |
Family Income by Famaliy Size in Lamboglia
2-person families (179 | 68.6%) account for the highest median family income in Lamboglia with $32,102 per family, while 2-person families (179 | 68.6%) have the highest median income of $16,051 per family member.
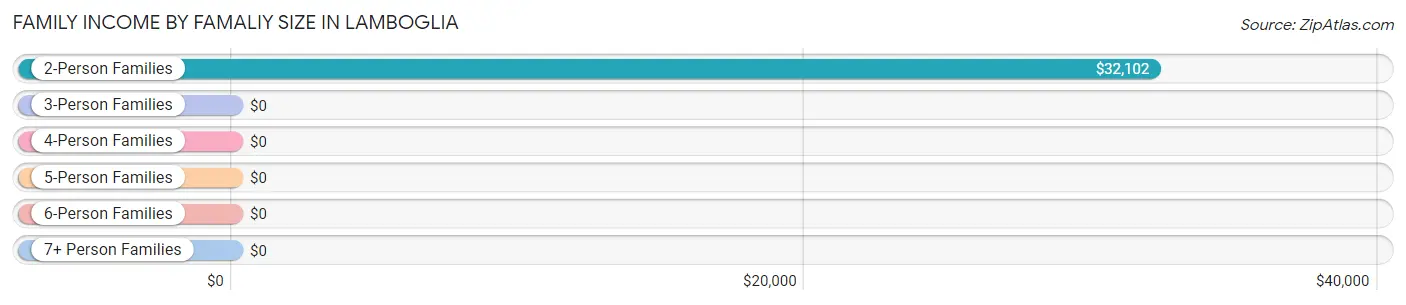
| Income Bracket | # Families | Median Income |
| 2-Person Families | 179 (68.6%) | $32,102 |
| 3-Person Families | 43 (16.5%) | $0 |
| 4-Person Families | 39 (14.9%) | $0 |
| 5-Person Families | 0 (0.0%) | $0 |
| 6-Person Families | 0 (0.0%) | $0 |
| 7+ Person Families | 0 (0.0%) | $0 |
| Total | 261 (100.0%) | $30,852 |
Family Income by Number of Earners in Lamboglia
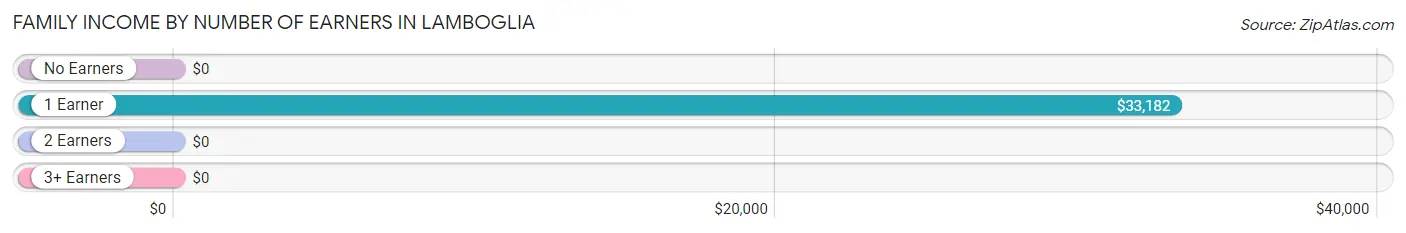
| Number of Earners | # Families | Median Income |
| No Earners | 91 (34.9%) | $0 |
| 1 Earner | 148 (56.7%) | $33,182 |
| 2 Earners | 22 (8.4%) | $0 |
| 3+ Earners | 0 (0.0%) | $0 |
| Total | 261 (100.0%) | $30,852 |
Household Income in Lamboglia
Household Income Brackets in Lamboglia
With 108 households falling in the category, the less than $10,000 income range is the most frequent in Lamboglia, accounting for 28.1% of all households.
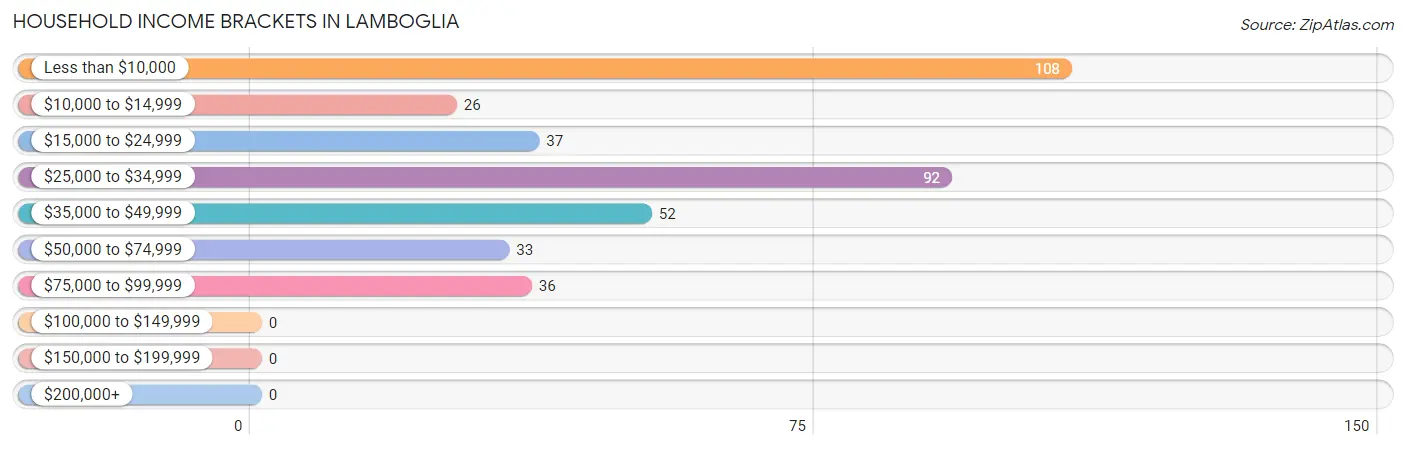
| Income Bracket | # Households | % Households |
| Less than $10,000 | 108 | 28.1% |
| $10,000 to $14,999 | 26 | 6.8% |
| $15,000 to $24,999 | 37 | 9.6% |
| $25,000 to $34,999 | 92 | 24.0% |
| $35,000 to $49,999 | 52 | 13.5% |
| $50,000 to $74,999 | 33 | 8.6% |
| $75,000 to $99,999 | 36 | 9.4% |
| $100,000 to $149,999 | 0 | 0.0% |
| $150,000 to $199,999 | 0 | 0.0% |
| $200,000+ | 0 | 0.0% |
Household Income by Householder Age in Lamboglia
The median household income in Lamboglia is $27,857, with the highest median household income of $31,932 found in the 45 to 64 years age bracket for the primary householder. A total of 176 households (45.8%) fall into this category. Meanwhile, the 15 to 24 years age bracket for the primary householder has the lowest median household income of $0, with 12 households (3.1%) in this group.
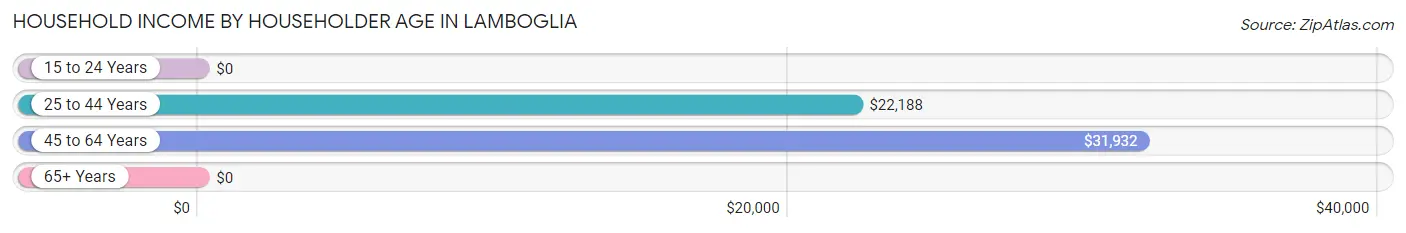
| Income Bracket | # Households | Median Income |
| 15 to 24 Years | 12 (3.1%) | $0 |
| 25 to 44 Years | 76 (19.8%) | $22,188 |
| 45 to 64 Years | 176 (45.8%) | $31,932 |
| 65+ Years | 120 (31.2%) | $0 |
| Total | 384 (100.0%) | $27,857 |
Poverty in Lamboglia
Income Below Poverty by Sex and Age in Lamboglia
With 41.5% poverty level for males and 43.7% for females among the residents of Lamboglia, 6 to 11 year old males and under 5 year old females are the most vulnerable to poverty, with 32 males (100.0%) and 30 females (100.0%) in their respective age groups living below the poverty level.
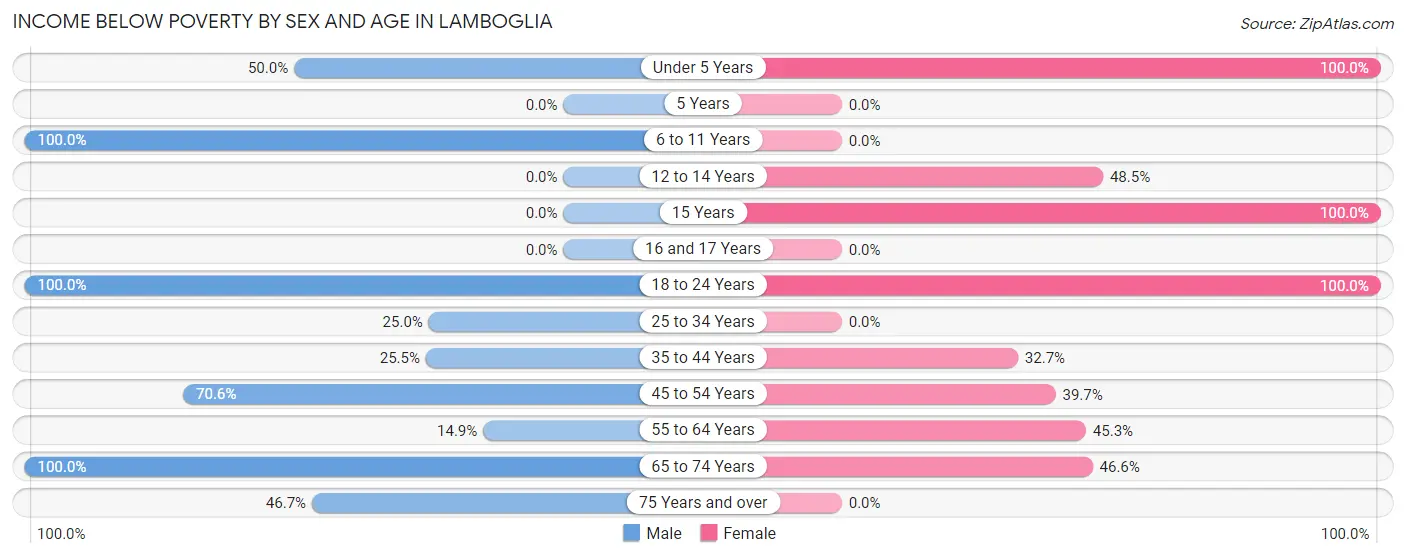
| Age Bracket | Male | Female |
| Under 5 Years | 17 (50.0%) | 30 (100.0%) |
| 5 Years | 0 (0.0%) | 0 (0.0%) |
| 6 to 11 Years | 32 (100.0%) | 0 (0.0%) |
| 12 to 14 Years | 0 (0.0%) | 16 (48.5%) |
| 15 Years | 0 (0.0%) | 19 (100.0%) |
| 16 and 17 Years | 0 (0.0%) | 0 (0.0%) |
| 18 to 24 Years | 12 (100.0%) | 10 (100.0%) |
| 25 to 34 Years | 16 (25.0%) | 0 (0.0%) |
| 35 to 44 Years | 24 (25.5%) | 17 (32.7%) |
| 45 to 54 Years | 36 (70.6%) | 25 (39.7%) |
| 55 to 64 Years | 14 (14.9%) | 29 (45.3%) |
| 65 to 74 Years | 32 (100.0%) | 54 (46.6%) |
| 75 Years and over | 14 (46.7%) | 0 (0.0%) |
| Total | 197 (41.5%) | 200 (43.7%) |
Income Above Poverty by Sex and Age in Lamboglia
According to the poverty statistics in Lamboglia, males aged 12 to 14 years and females aged 25 to 34 years are the age groups that are most secure financially, with 100.0% of males and 100.0% of females in these age groups living above the poverty line.
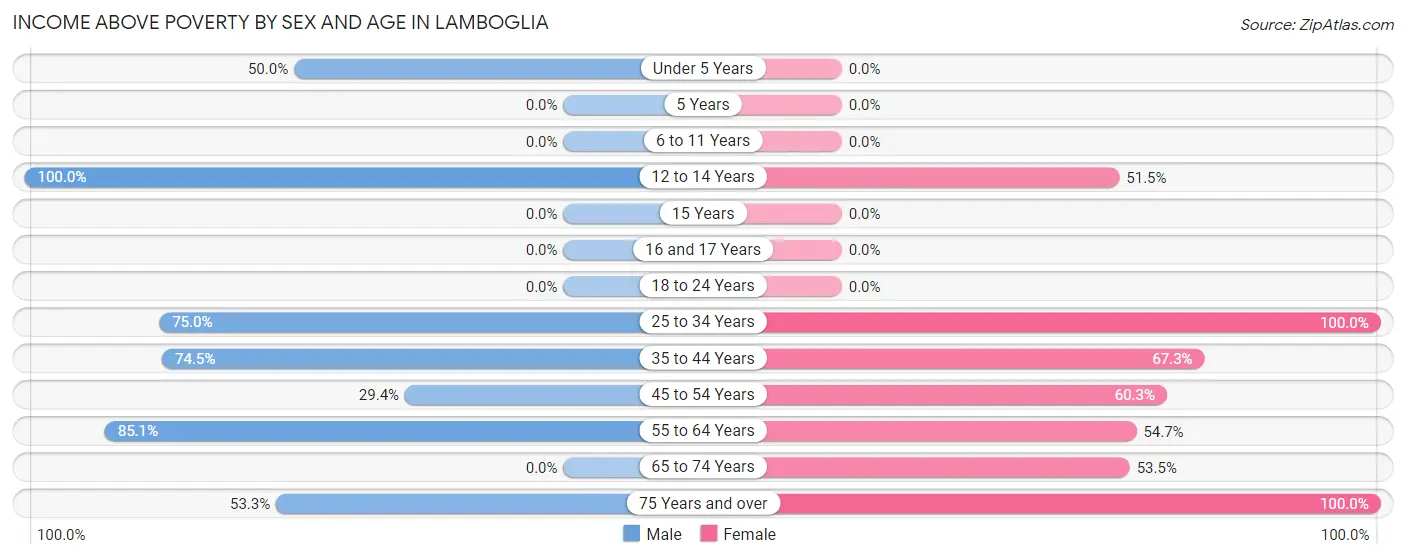
| Age Bracket | Male | Female |
| Under 5 Years | 17 (50.0%) | 0 (0.0%) |
| 5 Years | 0 (0.0%) | 0 (0.0%) |
| 6 to 11 Years | 0 (0.0%) | 0 (0.0%) |
| 12 to 14 Years | 32 (100.0%) | 17 (51.5%) |
| 15 Years | 0 (0.0%) | 0 (0.0%) |
| 16 and 17 Years | 0 (0.0%) | 0 (0.0%) |
| 18 to 24 Years | 0 (0.0%) | 0 (0.0%) |
| 25 to 34 Years | 48 (75.0%) | 36 (100.0%) |
| 35 to 44 Years | 70 (74.5%) | 35 (67.3%) |
| 45 to 54 Years | 15 (29.4%) | 38 (60.3%) |
| 55 to 64 Years | 80 (85.1%) | 35 (54.7%) |
| 65 to 74 Years | 0 (0.0%) | 62 (53.4%) |
| 75 Years and over | 16 (53.3%) | 35 (100.0%) |
| Total | 278 (58.5%) | 258 (56.3%) |
Income Below Poverty Among Married-Couple Families in Lamboglia
The poverty statistics for married-couple families in Lamboglia show that 51.4% or 73 of the total 142 families live below the poverty line. Families with no children have the highest poverty rate of 55.7%, comprising of 49 families. On the other hand, families with 1 or 2 children have the lowest poverty rate of 44.4%, which includes 24 families.
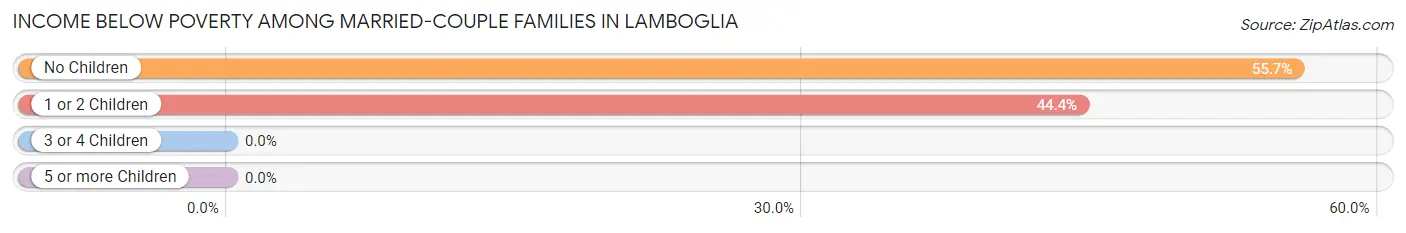
| Children | Above Poverty | Below Poverty |
| No Children | 39 (44.3%) | 49 (55.7%) |
| 1 or 2 Children | 30 (55.6%) | 24 (44.4%) |
| 3 or 4 Children | 0 (0.0%) | 0 (0.0%) |
| 5 or more Children | 0 (0.0%) | 0 (0.0%) |
| Total | 69 (48.6%) | 73 (51.4%) |
Income Below Poverty Among Single-Parent Households in Lamboglia
According to the poverty data in Lamboglia, 49.1% or 28 single-father households and 14.5% or 9 single-mother households are living below the poverty line. Among single-father households, those with 1 or 2 children have the highest poverty rate, with 28 households (100.0%) experiencing poverty. Likewise, among single-mother households, those with 1 or 2 children have the highest poverty rate, with 9 households (33.3%) falling below the poverty line.
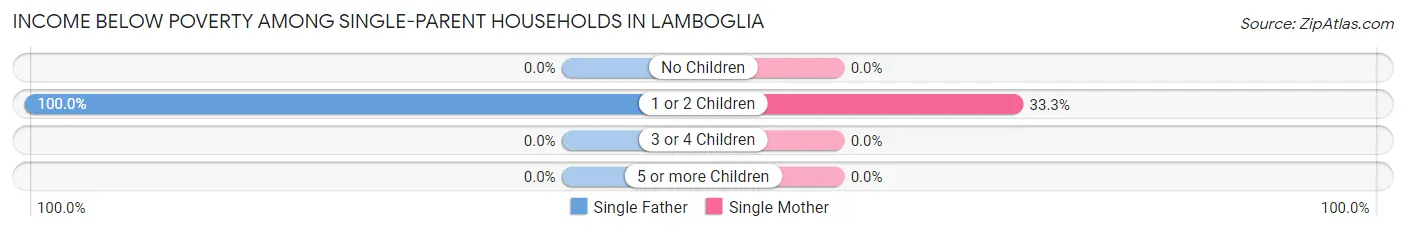
| Children | Single Father | Single Mother |
| No Children | 0 (0.0%) | 0 (0.0%) |
| 1 or 2 Children | 28 (100.0%) | 9 (33.3%) |
| 3 or 4 Children | 0 (0.0%) | 0 (0.0%) |
| 5 or more Children | 0 (0.0%) | 0 (0.0%) |
| Total | 28 (49.1%) | 9 (14.5%) |
Income Below Poverty Among Married-Couple vs Single-Parent Households in Lamboglia
The poverty data for Lamboglia shows that 73 of the married-couple family households (51.4%) and 37 of the single-parent households (31.1%) are living below the poverty level. Within the married-couple family households, those with no children have the highest poverty rate, with 49 households (55.7%) falling below the poverty line. Among the single-parent households, those with 1 or 2 children have the highest poverty rate, with 37 household (67.3%) living below poverty.
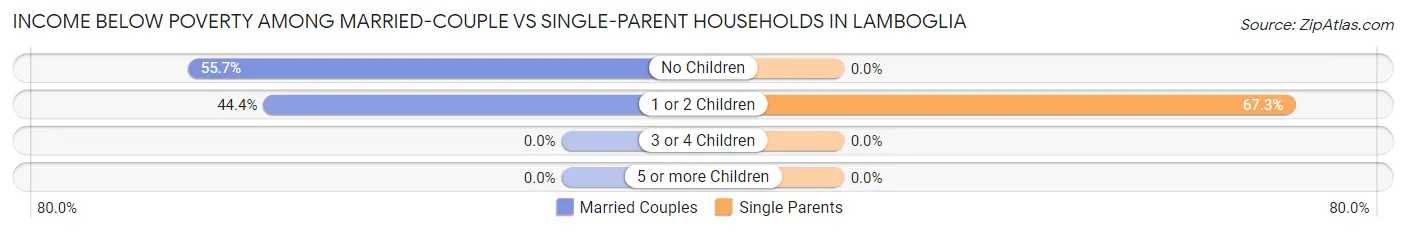
| Children | Married-Couple Families | Single-Parent Households |
| No Children | 49 (55.7%) | 0 (0.0%) |
| 1 or 2 Children | 24 (44.4%) | 37 (67.3%) |
| 3 or 4 Children | 0 (0.0%) | 0 (0.0%) |
| 5 or more Children | 0 (0.0%) | 0 (0.0%) |
| Total | 73 (51.4%) | 37 (31.1%) |
Race in Lamboglia
The most populous races in Lamboglia are Hispanic or Latino (933 | 100.0%), Some other Race (551 | 59.1%), and Black / African American (382 | 40.9%).
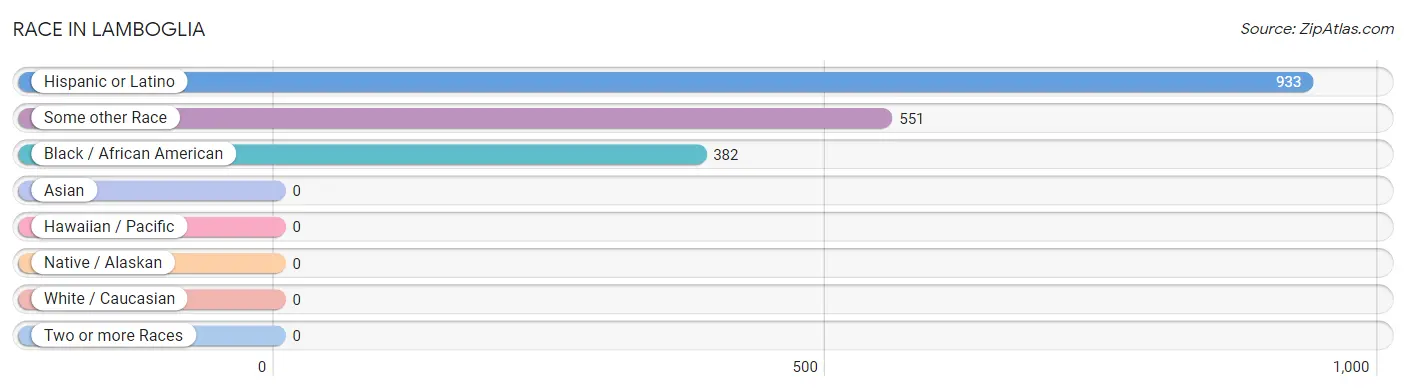
| Race | # Population | % Population |
| Asian | 0 | 0.0% |
| Black / African American | 382 | 40.9% |
| Hawaiian / Pacific | 0 | 0.0% |
| Hispanic or Latino | 933 | 100.0% |
| Native / Alaskan | 0 | 0.0% |
| White / Caucasian | 0 | 0.0% |
| Two or more Races | 0 | 0.0% |
| Some other Race | 551 | 59.1% |
| Total | 933 | 100.0% |
Ancestry in Lamboglia
The most populous ancestries reported in Lamboglia are , and Puerto Rican (933 | 100.0%), together accounting for 100.0% of all Lamboglia residents.

| Ancestry | # Population | % Population |
| Puerto Rican | 933 | 100.0% | View All 1 Rows |
Immigrants in Lamboglia

| Immigration Origin | # Population | % Population | View All 0 Rows |
Sex and Age in Lamboglia
Sex and Age in Lamboglia
The most populous age groups in Lamboglia are 40 to 44 Years (94 | 19.8%) for men and 65 to 69 Years (97 | 21.2%) for women.
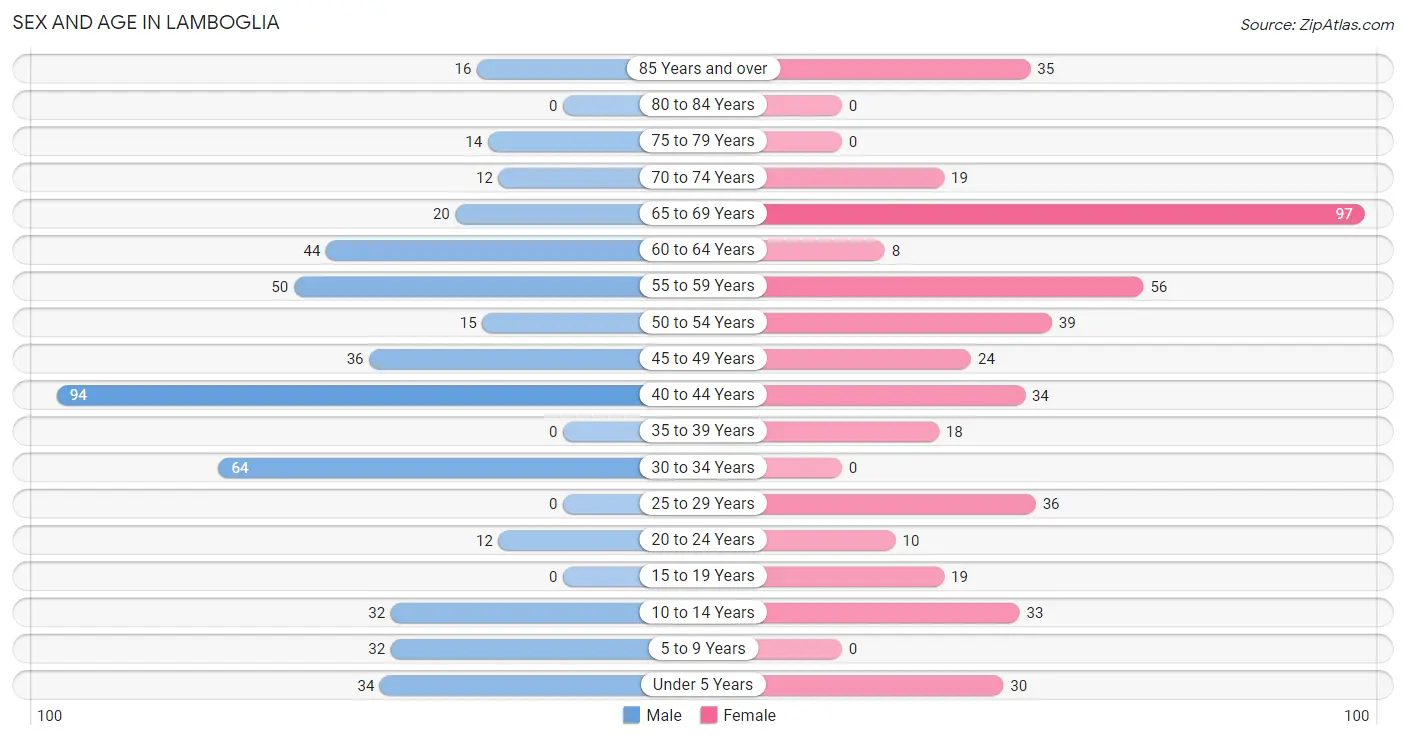
| Age Bracket | Male | Female |
| Under 5 Years | 34 (7.2%) | 30 (6.6%) |
| 5 to 9 Years | 32 (6.7%) | 0 (0.0%) |
| 10 to 14 Years | 32 (6.7%) | 33 (7.2%) |
| 15 to 19 Years | 0 (0.0%) | 19 (4.2%) |
| 20 to 24 Years | 12 (2.5%) | 10 (2.2%) |
| 25 to 29 Years | 0 (0.0%) | 36 (7.9%) |
| 30 to 34 Years | 64 (13.5%) | 0 (0.0%) |
| 35 to 39 Years | 0 (0.0%) | 18 (3.9%) |
| 40 to 44 Years | 94 (19.8%) | 34 (7.4%) |
| 45 to 49 Years | 36 (7.6%) | 24 (5.2%) |
| 50 to 54 Years | 15 (3.2%) | 39 (8.5%) |
| 55 to 59 Years | 50 (10.5%) | 56 (12.2%) |
| 60 to 64 Years | 44 (9.3%) | 8 (1.8%) |
| 65 to 69 Years | 20 (4.2%) | 97 (21.2%) |
| 70 to 74 Years | 12 (2.5%) | 19 (4.2%) |
| 75 to 79 Years | 14 (2.9%) | 0 (0.0%) |
| 80 to 84 Years | 0 (0.0%) | 0 (0.0%) |
| 85 Years and over | 16 (3.4%) | 35 (7.6%) |
| Total | 475 (100.0%) | 458 (100.0%) |
Families and Households in Lamboglia
Median Family Size in Lamboglia
The median family size in Lamboglia is 2.78 persons per family, with single male/father families (57 | 21.8%) accounting for the largest median family size of 3.32 persons per family. On the other hand, married-couple families (142 | 54.4%) represent the smallest median family size with 2.60 persons per family.
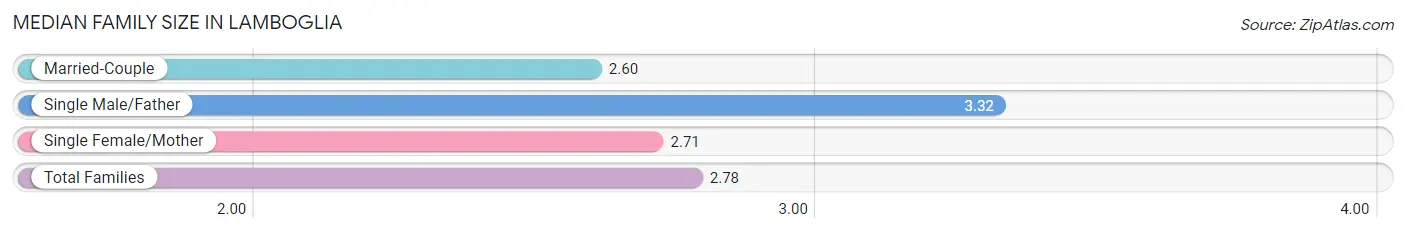
| Family Type | # Families | Family Size |
| Married-Couple | 142 (54.4%) | 2.60 |
| Single Male/Father | 57 (21.8%) | 3.32 |
| Single Female/Mother | 62 (23.7%) | 2.71 |
| Total Families | 261 (100.0%) | 2.78 |
Median Household Size in Lamboglia
The median household size in Lamboglia is 2.43 persons per household, with single male/father households (57 | 14.8%) accounting for the largest median household size of 3.81 persons per household. non-family households (123 | 32.0%) represent the smallest median household size with 1.32 persons per household.
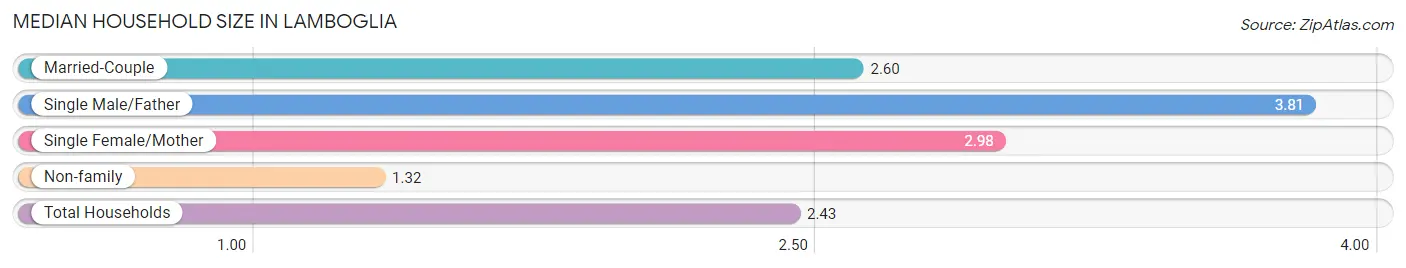
| Household Type | # Households | Household Size |
| Married-Couple | 142 (37.0%) | 2.60 |
| Single Male/Father | 57 (14.8%) | 3.81 |
| Single Female/Mother | 62 (16.2%) | 2.98 |
| Non-family | 123 (32.0%) | 1.32 |
| Total Households | 384 (100.0%) | 2.43 |
Household Size by Marriage Status in Lamboglia
Out of a total of 384 households in Lamboglia, 261 (68.0%) are family households, while 123 (32.0%) are nonfamily households. The most numerous type of family households are 2-person households, comprising 161, and the most common type of nonfamily households are 1-person households, comprising 75.
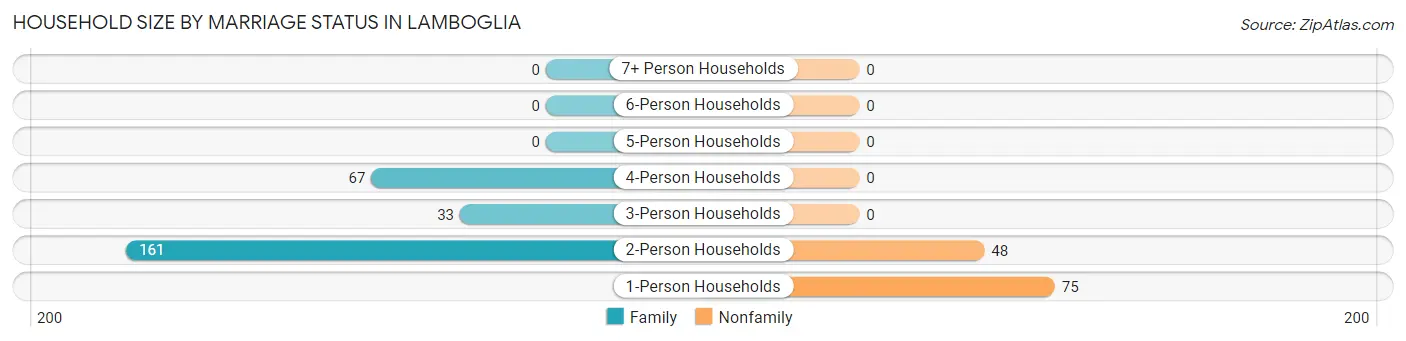
| Household Size | Family Households | Nonfamily Households |
| 1-Person Households | - | 75 (19.5%) |
| 2-Person Households | 161 (41.9%) | 48 (12.5%) |
| 3-Person Households | 33 (8.6%) | 0 (0.0%) |
| 4-Person Households | 67 (17.4%) | 0 (0.0%) |
| 5-Person Households | 0 (0.0%) | 0 (0.0%) |
| 6-Person Households | 0 (0.0%) | 0 (0.0%) |
| 7+ Person Households | 0 (0.0%) | 0 (0.0%) |
| Total | 261 (68.0%) | 123 (32.0%) |
Female Fertility in Lamboglia
Fertility by Age in Lamboglia
| Age Bracket | Women with Births | Births / 1,000 Women |
| 15 to 19 years | 0 (0.0%) | 0.0 |
| 20 to 34 years | 0 (0.0%) | 0.0 |
| 35 to 50 years | 0 (0.0%) | 0.0 |
| Total | 0 (0.0%) | 0.0 |
Fertility by Age by Marriage Status in Lamboglia
| Age Bracket | Married | Unmarried |
| 15 to 19 years | 0 (0.0%) | 0 (0.0%) |
| 20 to 34 years | 0 (0.0%) | 0 (0.0%) |
| 35 to 50 years | 0 (0.0%) | 0 (0.0%) |
| Total | 0 (0.0%) | 0 (0.0%) |
Fertility by Education in Lamboglia
| Educational Attainment | Women with Births | Births / 1,000 Women |
| Less than High School | 0 (0.0%) | 0.0 |
| High School Diploma | 0 (0.0%) | 0.0 |
| College or Associate's Degree | 0 (0.0%) | 0.0 |
| Bachelor's Degree | 0 (0.0%) | 0.0 |
| Graduate Degree | 0 (0.0%) | 0.0 |
| Total | 0 (0.0%) | 0.0 |
Fertility by Education by Marriage Status in Lamboglia
| Educational Attainment | Married | Unmarried |
| Less than High School | 0 (0.0%) | 0 (0.0%) |
| High School Diploma | 0 (0.0%) | 0 (0.0%) |
| College or Associate's Degree | 0 (0.0%) | 0 (0.0%) |
| Bachelor's Degree | 0 (0.0%) | 0 (0.0%) |
| Graduate Degree | 0 (0.0%) | 0 (0.0%) |
| Total | 0 (0.0%) | 0 (0.0%) |
Employment Characteristics in Lamboglia
Employment by Class of Employer in Lamboglia
Among the 299 employed individuals in Lamboglia, private company employees (202 | 67.6%), state government employees (38 | 12.7%), and self-employed (not incorporated) (34 | 11.4%) make up the most common classes of employment.
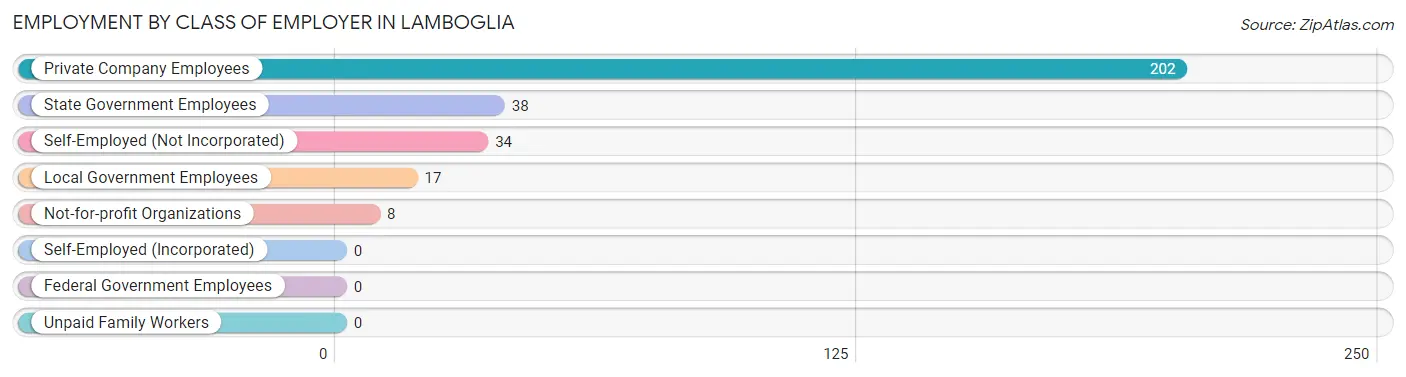
| Employer Class | # Employees | % Employees |
| Private Company Employees | 202 | 67.6% |
| Self-Employed (Incorporated) | 0 | 0.0% |
| Self-Employed (Not Incorporated) | 34 | 11.4% |
| Not-for-profit Organizations | 8 | 2.7% |
| Local Government Employees | 17 | 5.7% |
| State Government Employees | 38 | 12.7% |
| Federal Government Employees | 0 | 0.0% |
| Unpaid Family Workers | 0 | 0.0% |
| Total | 299 | 100.0% |
Employment Status by Age in Lamboglia
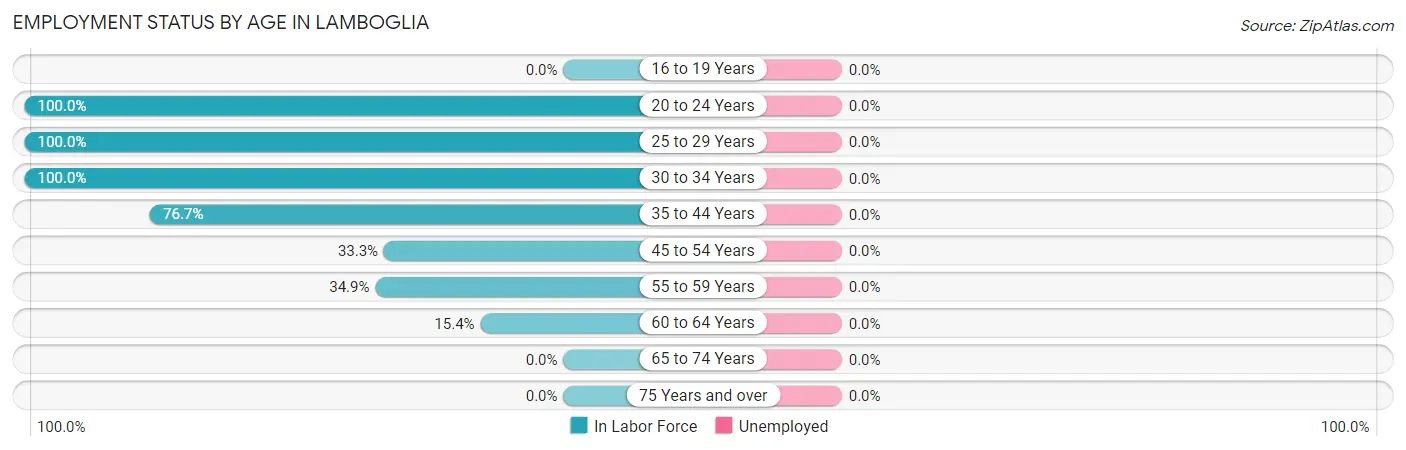
| Age Bracket | In Labor Force | Unemployed |
| 16 to 19 Years | 0 (0.0%) | 0 (0.0%) |
| 20 to 24 Years | 22 (100.0%) | 0 (0.0%) |
| 25 to 29 Years | 36 (100.0%) | 0 (0.0%) |
| 30 to 34 Years | 64 (100.0%) | 0 (0.0%) |
| 35 to 44 Years | 112 (76.7%) | 0 (0.0%) |
| 45 to 54 Years | 38 (33.3%) | 0 (0.0%) |
| 55 to 59 Years | 37 (34.9%) | 0 (0.0%) |
| 60 to 64 Years | 8 (15.4%) | 0 (0.0%) |
| 65 to 74 Years | 0 (0.0%) | 0 (0.0%) |
| 75 Years and over | 0 (0.0%) | 0 (0.0%) |
| Total | 317 (42.1%) | 0 (0.0%) |
Employment Status by Educational Attainment in Lamboglia
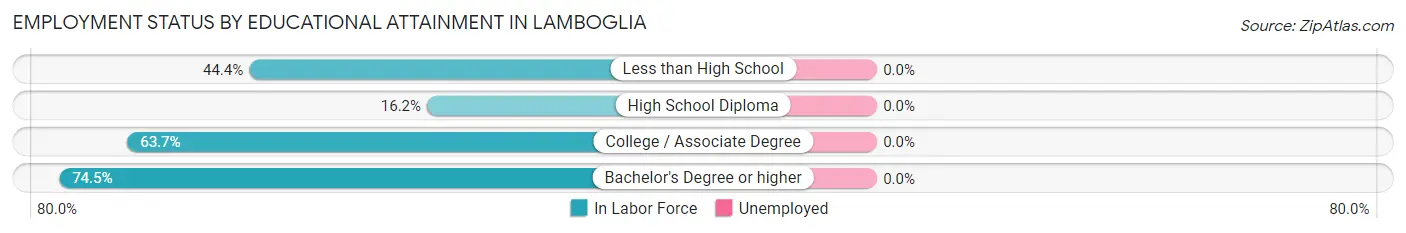
| Educational Attainment | In Labor Force | Unemployed |
| Less than High School | 24 (44.4%) | 0 (0.0%) |
| High School Diploma | 16 (16.2%) | 0 (0.0%) |
| College / Associate Degree | 100 (63.7%) | 0 (0.0%) |
| Bachelor's Degree or higher | 155 (74.5%) | 0 (0.0%) |
| Total | 295 (56.9%) | 0 (0.0%) |
Employment Occupations by Sex in Lamboglia
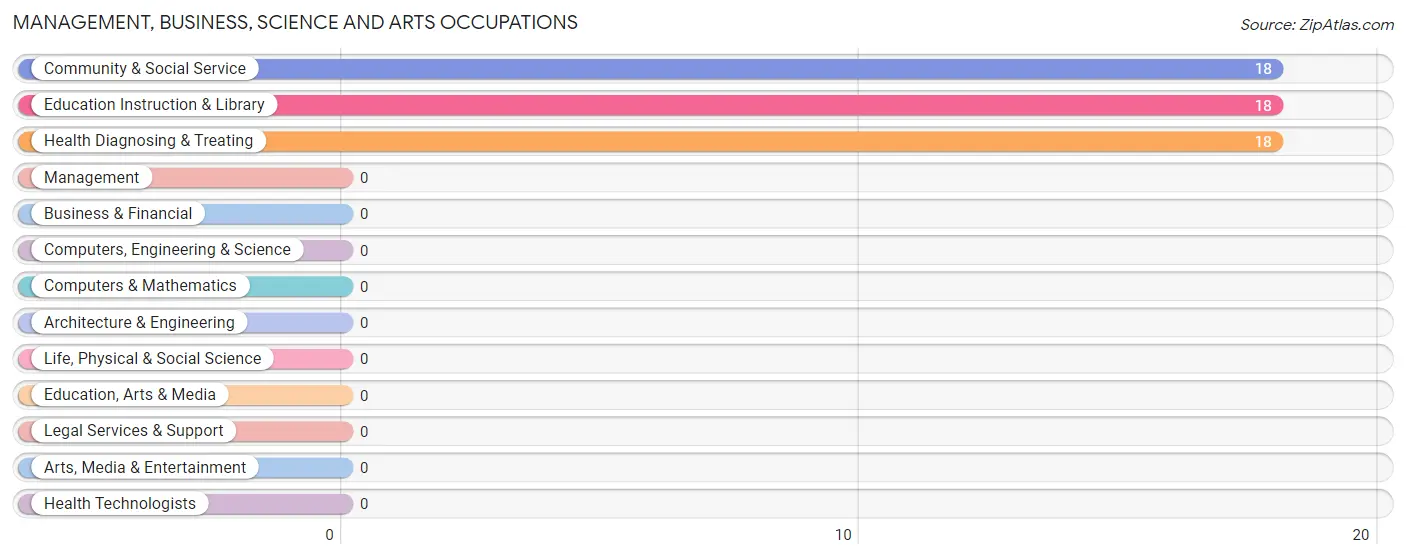
Management, Business, Science and Arts Occupations
The most common Management, Business, Science and Arts occupations in Lamboglia are Community & Social Service (18 | 5.7%), Education Instruction & Library (18 | 5.7%), and Health Diagnosing & Treating (18 | 5.7%).
Management, Business, Science and Arts Occupations by Sex
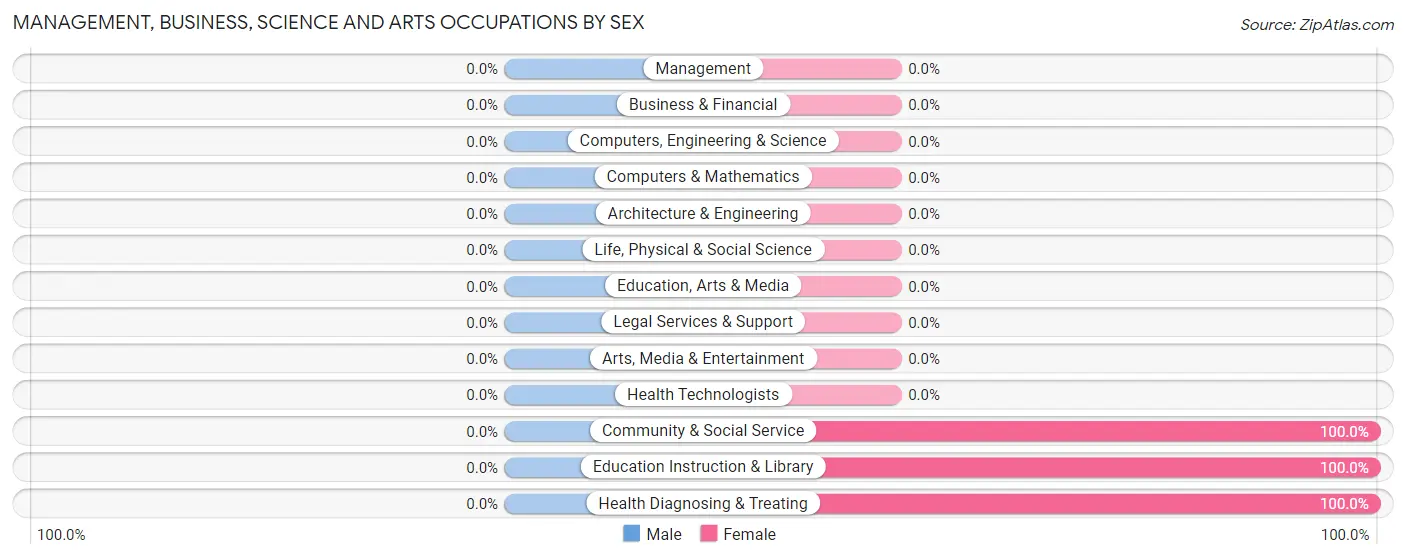
| Occupation | Male | Female |
| Management | 0 (0.0%) | 0 (0.0%) |
| Business & Financial | 0 (0.0%) | 0 (0.0%) |
| Computers, Engineering & Science | 0 (0.0%) | 0 (0.0%) |
| Computers & Mathematics | 0 (0.0%) | 0 (0.0%) |
| Architecture & Engineering | 0 (0.0%) | 0 (0.0%) |
| Life, Physical & Social Science | 0 (0.0%) | 0 (0.0%) |
| Community & Social Service | 0 (0.0%) | 18 (100.0%) |
| Education, Arts & Media | 0 (0.0%) | 0 (0.0%) |
| Legal Services & Support | 0 (0.0%) | 0 (0.0%) |
| Education Instruction & Library | 0 (0.0%) | 18 (100.0%) |
| Arts, Media & Entertainment | 0 (0.0%) | 0 (0.0%) |
| Health Diagnosing & Treating | 0 (0.0%) | 18 (100.0%) |
| Health Technologists | 0 (0.0%) | 0 (0.0%) |
| Total (Category) | 0 (0.0%) | 36 (100.0%) |
| Total (Overall) | 222 (70.0%) | 95 (30.0%) |
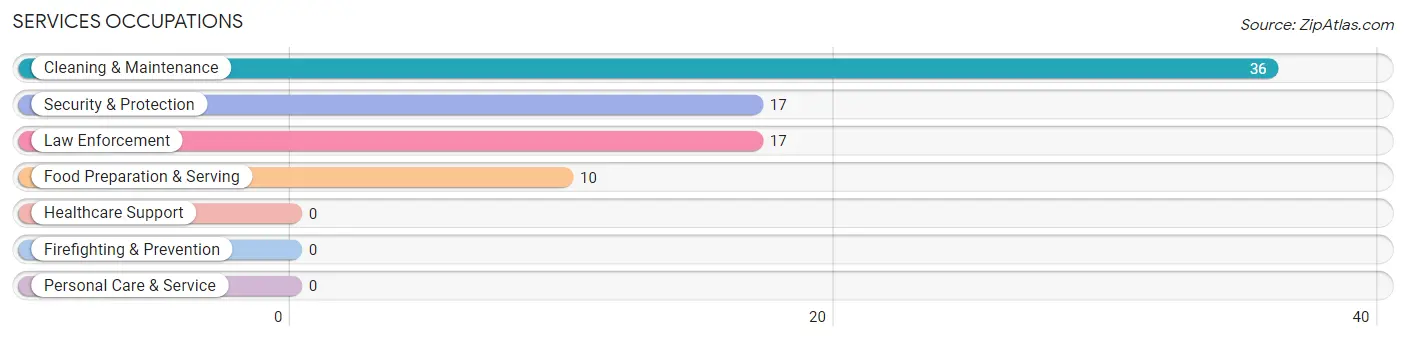
Services Occupations
The most common Services occupations in Lamboglia are Cleaning & Maintenance (36 | 11.4%), Security & Protection (17 | 5.4%), Law Enforcement (17 | 5.4%), and Food Preparation & Serving (10 | 3.2%).
Services Occupations by Sex
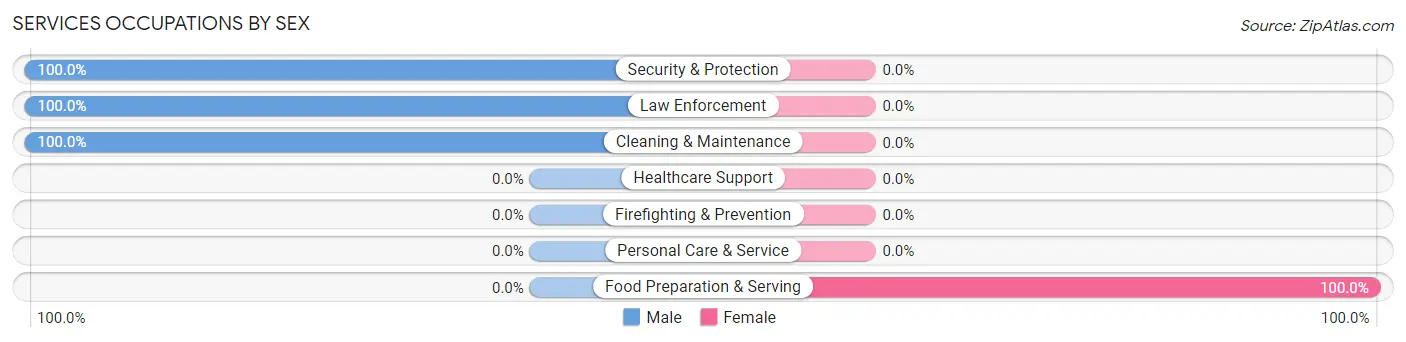
| Occupation | Male | Female |
| Healthcare Support | 0 (0.0%) | 0 (0.0%) |
| Security & Protection | 17 (100.0%) | 0 (0.0%) |
| Firefighting & Prevention | 0 (0.0%) | 0 (0.0%) |
| Law Enforcement | 17 (100.0%) | 0 (0.0%) |
| Food Preparation & Serving | 0 (0.0%) | 10 (100.0%) |
| Cleaning & Maintenance | 36 (100.0%) | 0 (0.0%) |
| Personal Care & Service | 0 (0.0%) | 0 (0.0%) |
| Total (Category) | 53 (84.1%) | 10 (15.9%) |
| Total (Overall) | 222 (70.0%) | 95 (30.0%) |
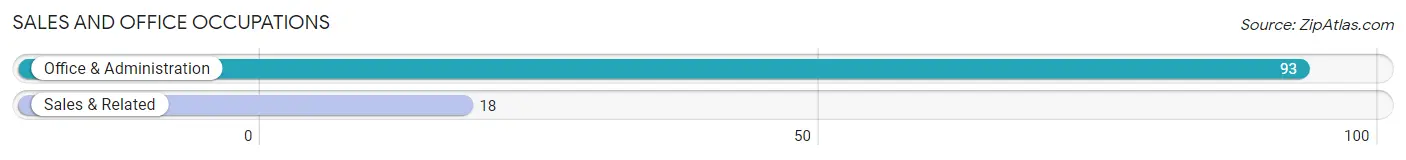
Sales and Office Occupations
The most common Sales and Office occupations in Lamboglia are Office & Administration (93 | 29.3%), and Sales & Related (18 | 5.7%).
Sales and Office Occupations by Sex
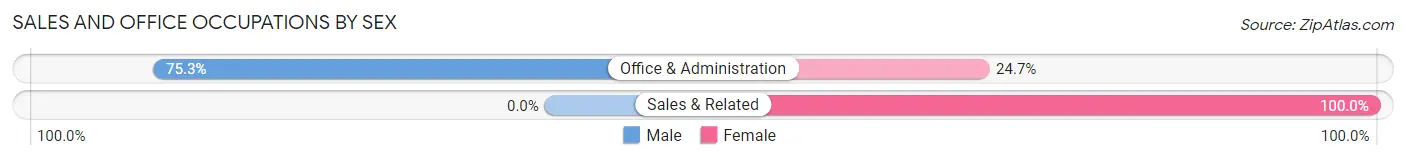
| Occupation | Male | Female |
| Sales & Related | 0 (0.0%) | 18 (100.0%) |
| Office & Administration | 70 (75.3%) | 23 (24.7%) |
| Total (Category) | 70 (63.1%) | 41 (36.9%) |
| Total (Overall) | 222 (70.0%) | 95 (30.0%) |
Natural Resources, Construction and Maintenance Occupations
The most common Natural Resources, Construction and Maintenance occupations in Lamboglia are Installation, Maintenance & Repair (37 | 11.7%), and Construction & Extraction (15 | 4.7%).
Natural Resources, Construction and Maintenance Occupations by Sex
| Occupation | Male | Female |
| Farming, Fishing & Forestry | 0 (0.0%) | 0 (0.0%) |
| Construction & Extraction | 15 (100.0%) | 0 (0.0%) |
| Installation, Maintenance & Repair | 37 (100.0%) | 0 (0.0%) |
| Total (Category) | 52 (100.0%) | 0 (0.0%) |
| Total (Overall) | 222 (70.0%) | 95 (30.0%) |
Production, Transportation and Moving Occupations
The most common Production, Transportation and Moving occupations in Lamboglia are Transportation (31 | 9.8%), and Production (24 | 7.6%).
Production, Transportation and Moving Occupations by Sex
| Occupation | Male | Female |
| Production | 16 (66.7%) | 8 (33.3%) |
| Transportation | 31 (100.0%) | 0 (0.0%) |
| Material Moving | 0 (0.0%) | 0 (0.0%) |
| Total (Category) | 47 (85.5%) | 8 (14.5%) |
| Total (Overall) | 222 (70.0%) | 95 (30.0%) |
Employment Industries by Sex in Lamboglia
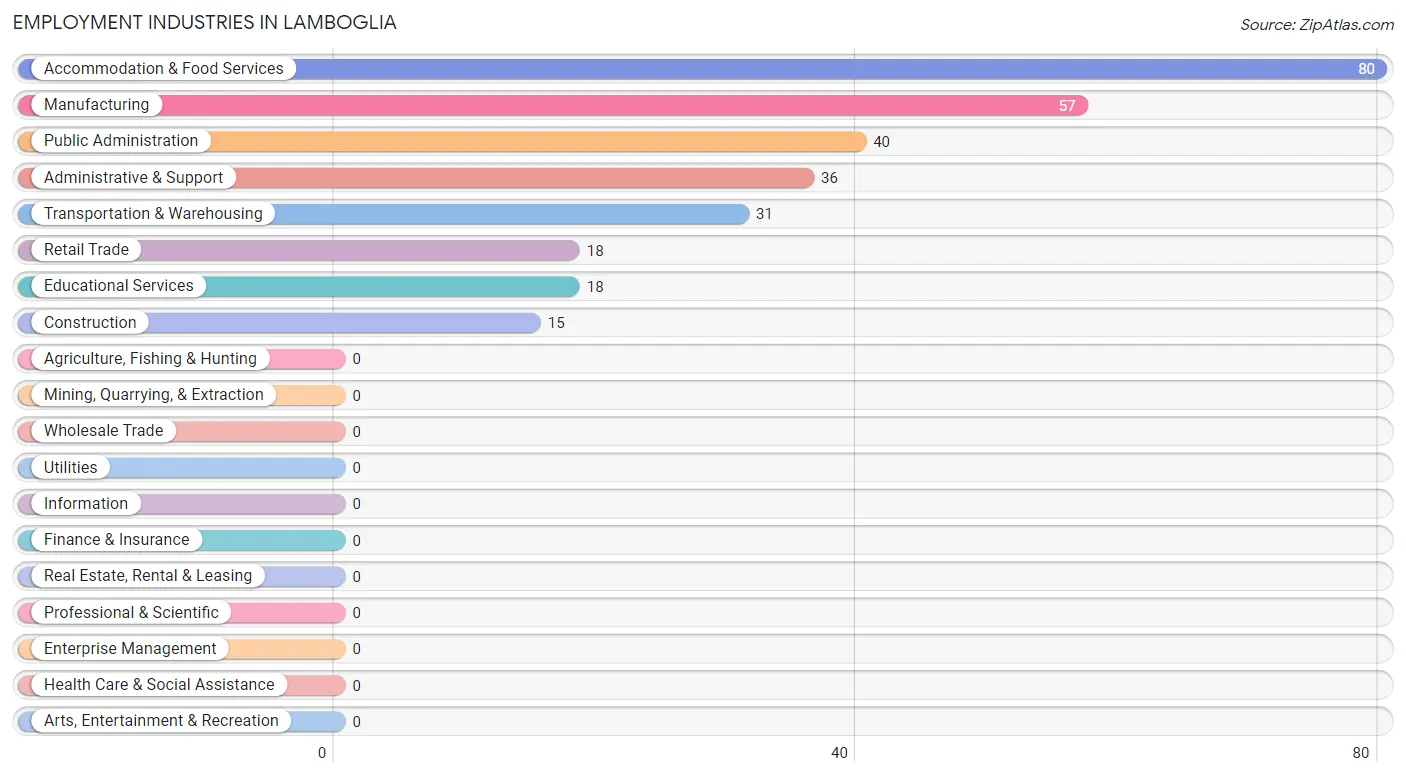
Employment Industries in Lamboglia
The major employment industries in Lamboglia include Accommodation & Food Services (80 | 25.2%), Manufacturing (57 | 18.0%), Public Administration (40 | 12.6%), Administrative & Support (36 | 11.4%), and Transportation & Warehousing (31 | 9.8%).
Employment Industries by Sex in Lamboglia
The Lamboglia industries that see more men than women are Construction (100.0%), Transportation & Warehousing (100.0%), and Administrative & Support (100.0%), whereas the industries that tend to have a higher number of women are Retail Trade (100.0%), Educational Services (100.0%), and Public Administration (57.5%).
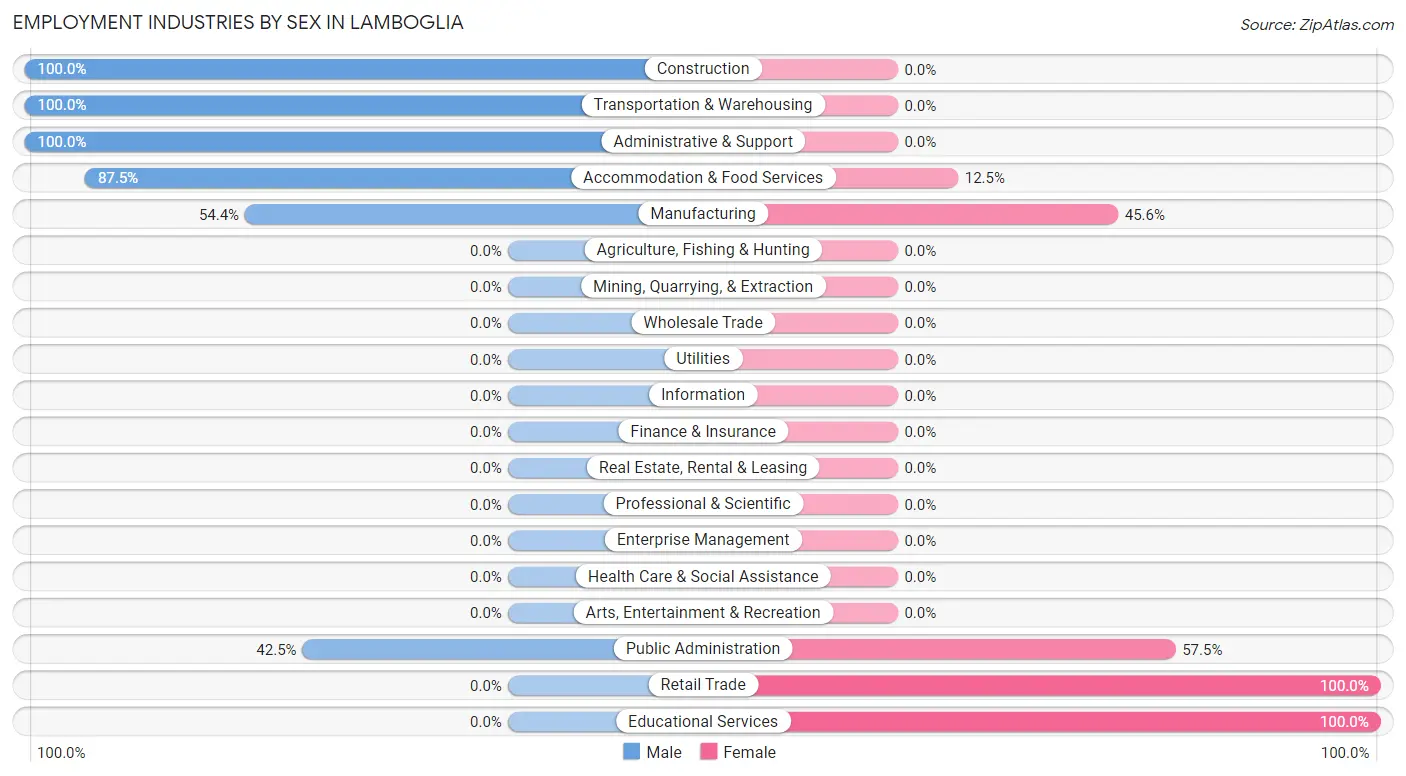
| Industry | Male | Female |
| Agriculture, Fishing & Hunting | 0 (0.0%) | 0 (0.0%) |
| Mining, Quarrying, & Extraction | 0 (0.0%) | 0 (0.0%) |
| Construction | 15 (100.0%) | 0 (0.0%) |
| Manufacturing | 31 (54.4%) | 26 (45.6%) |
| Wholesale Trade | 0 (0.0%) | 0 (0.0%) |
| Retail Trade | 0 (0.0%) | 18 (100.0%) |
| Transportation & Warehousing | 31 (100.0%) | 0 (0.0%) |
| Utilities | 0 (0.0%) | 0 (0.0%) |
| Information | 0 (0.0%) | 0 (0.0%) |
| Finance & Insurance | 0 (0.0%) | 0 (0.0%) |
| Real Estate, Rental & Leasing | 0 (0.0%) | 0 (0.0%) |
| Professional & Scientific | 0 (0.0%) | 0 (0.0%) |
| Enterprise Management | 0 (0.0%) | 0 (0.0%) |
| Administrative & Support | 36 (100.0%) | 0 (0.0%) |
| Educational Services | 0 (0.0%) | 18 (100.0%) |
| Health Care & Social Assistance | 0 (0.0%) | 0 (0.0%) |
| Arts, Entertainment & Recreation | 0 (0.0%) | 0 (0.0%) |
| Accommodation & Food Services | 70 (87.5%) | 10 (12.5%) |
| Public Administration | 17 (42.5%) | 23 (57.5%) |
| Total | 222 (70.0%) | 95 (30.0%) |
Education in Lamboglia
School Enrollment in Lamboglia
The most common levels of schooling among the 142 students in Lamboglia are middle school (49 | 34.5%), high school (44 | 31.0%), and elementary school (32 | 22.5%).
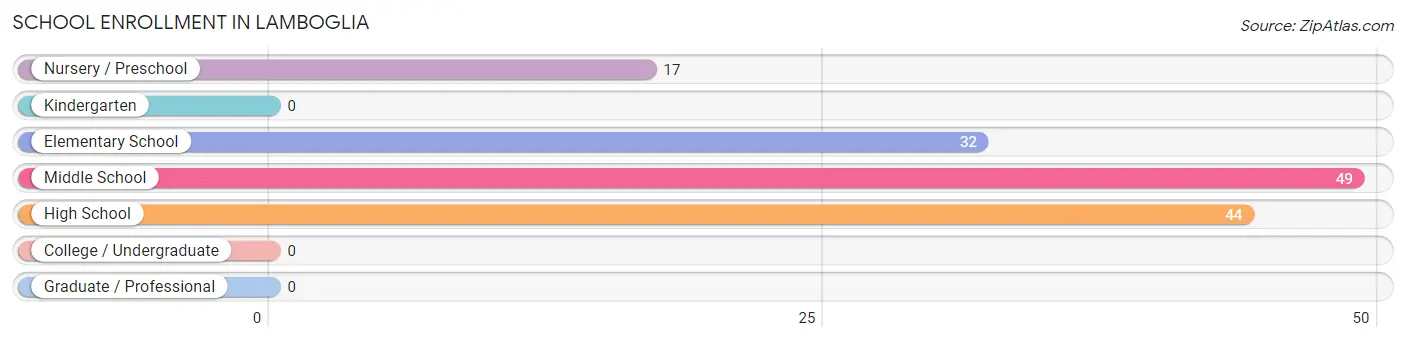
| School Level | # Students | % Students |
| Nursery / Preschool | 17 | 12.0% |
| Kindergarten | 0 | 0.0% |
| Elementary School | 32 | 22.5% |
| Middle School | 49 | 34.5% |
| High School | 44 | 31.0% |
| College / Undergraduate | 0 | 0.0% |
| Graduate / Professional | 0 | 0.0% |
| Total | 142 | 100.0% |
School Enrollment by Age by Funding Source in Lamboglia
Out of a total of 142 students who are enrolled in schools in Lamboglia, 32 (22.5%) attend a private institution, while the remaining 110 (77.5%) are enrolled in public schools. The age group of 10 to 14 year olds has the highest likelihood of being enrolled in private schools, with 32 (49.2% in the age bracket) enrolled. Conversely, the age group of 3 to 4 year olds has the lowest likelihood of being enrolled in a private school, with 17 (100.0% in the age bracket) attending a public institution.
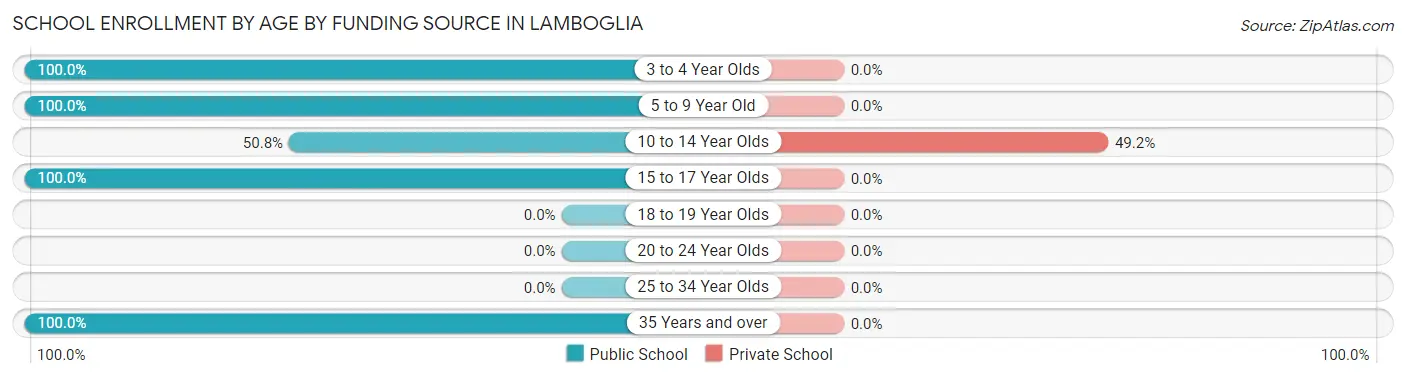
| Age Bracket | Public School | Private School |
| 3 to 4 Year Olds | 17 (100.0%) | 0 (0.0%) |
| 5 to 9 Year Old | 32 (100.0%) | 0 (0.0%) |
| 10 to 14 Year Olds | 33 (50.8%) | 32 (49.2%) |
| 15 to 17 Year Olds | 19 (100.0%) | 0 (0.0%) |
| 18 to 19 Year Olds | 0 (0.0%) | 0 (0.0%) |
| 20 to 24 Year Olds | 0 (0.0%) | 0 (0.0%) |
| 25 to 34 Year Olds | 0 (0.0%) | 0 (0.0%) |
| 35 Years and over | 9 (100.0%) | 0 (0.0%) |
| Total | 110 (77.5%) | 32 (22.5%) |
Educational Attainment by Field of Study in Lamboglia
Business (87 | 37.5%), arts & humanities (67 | 28.9%), bio, nature & agricultural (18 | 7.8%), psychology (18 | 7.8%), and education (18 | 7.8%) are the most common fields of study among 232 individuals in Lamboglia who have obtained a bachelor's degree or higher.
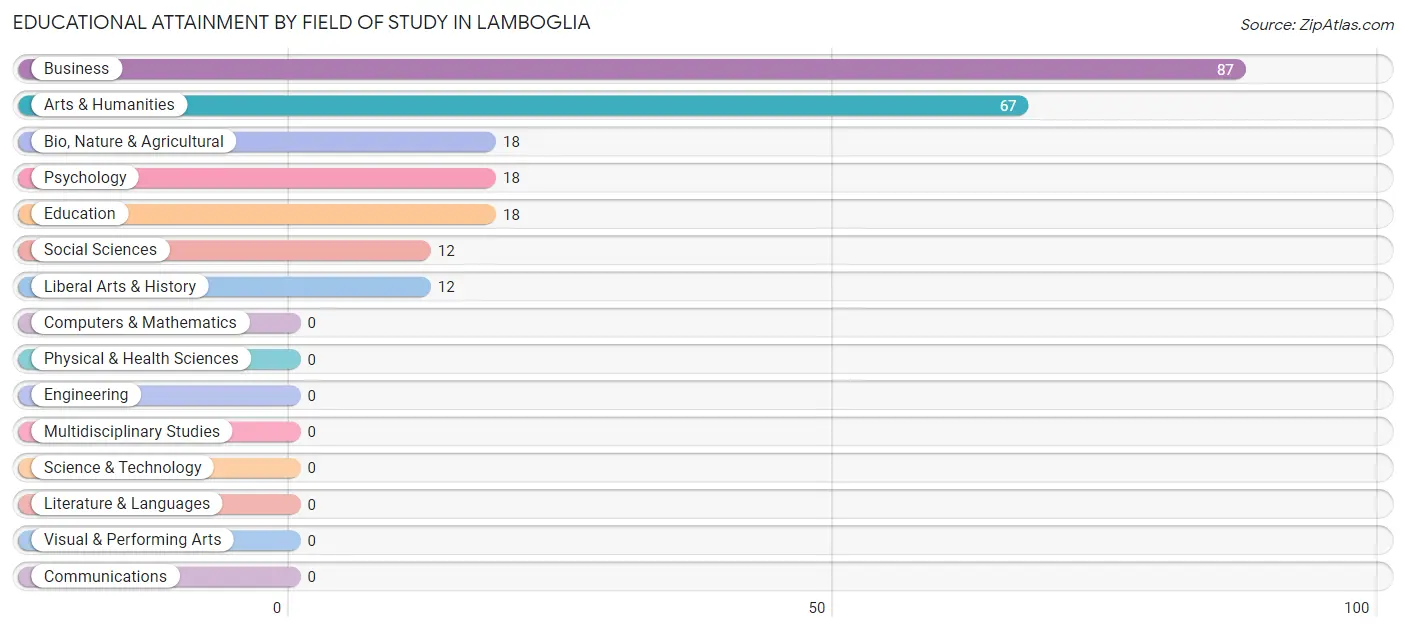
| Field of Study | # Graduates | % Graduates |
| Computers & Mathematics | 0 | 0.0% |
| Bio, Nature & Agricultural | 18 | 7.8% |
| Physical & Health Sciences | 0 | 0.0% |
| Psychology | 18 | 7.8% |
| Social Sciences | 12 | 5.2% |
| Engineering | 0 | 0.0% |
| Multidisciplinary Studies | 0 | 0.0% |
| Science & Technology | 0 | 0.0% |
| Business | 87 | 37.5% |
| Education | 18 | 7.8% |
| Literature & Languages | 0 | 0.0% |
| Liberal Arts & History | 12 | 5.2% |
| Visual & Performing Arts | 0 | 0.0% |
| Communications | 0 | 0.0% |
| Arts & Humanities | 67 | 28.9% |
| Total | 232 | 100.0% |
Transportation & Commute in Lamboglia
Vehicle Availability by Sex in Lamboglia
The most prevalent vehicle ownership categories in Lamboglia are males with 2 vehicles (99, accounting for 44.6%) and females with 2 vehicles (28, making up 128.6%).
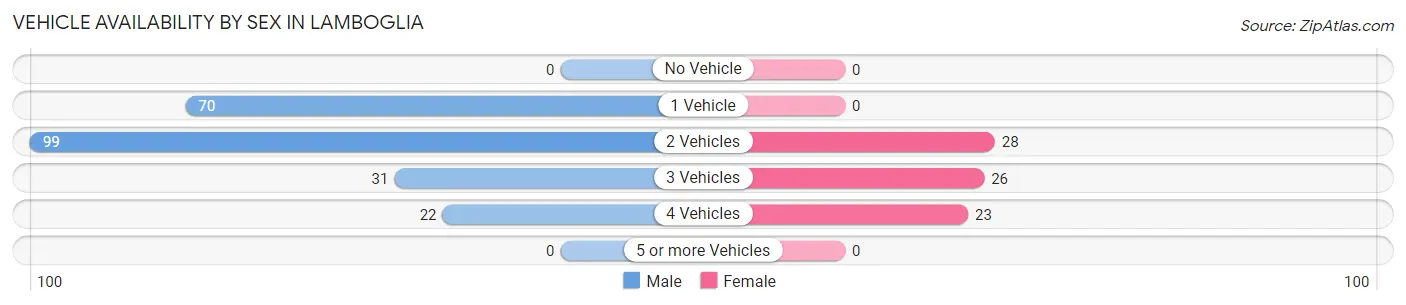
| Vehicles Available | Male | Female |
| No Vehicle | 0 (0.0%) | 0 (0.0%) |
| 1 Vehicle | 70 (31.5%) | 0 (0.0%) |
| 2 Vehicles | 99 (44.6%) | 28 (36.4%) |
| 3 Vehicles | 31 (14.0%) | 26 (33.8%) |
| 4 Vehicles | 22 (9.9%) | 23 (29.9%) |
| 5 or more Vehicles | 0 (0.0%) | 0 (0.0%) |
| Total | 222 (100.0%) | 77 (100.0%) |
Commute Time in Lamboglia
The most frequently occuring commute durations in Lamboglia are 20 to 24 minutes (98 commuters, 32.8%), 15 to 19 minutes (57 commuters, 19.1%), and 30 to 34 minutes (49 commuters, 16.4%).
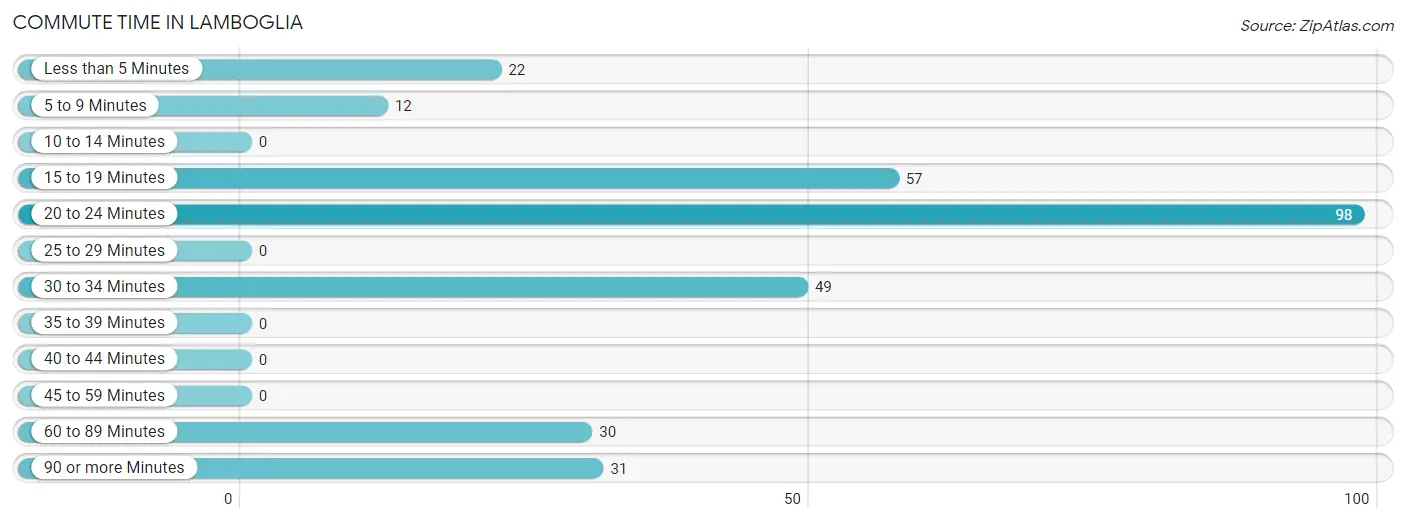
| Commute Time | # Commuters | % Commuters |
| Less than 5 Minutes | 22 | 7.4% |
| 5 to 9 Minutes | 12 | 4.0% |
| 10 to 14 Minutes | 0 | 0.0% |
| 15 to 19 Minutes | 57 | 19.1% |
| 20 to 24 Minutes | 98 | 32.8% |
| 25 to 29 Minutes | 0 | 0.0% |
| 30 to 34 Minutes | 49 | 16.4% |
| 35 to 39 Minutes | 0 | 0.0% |
| 40 to 44 Minutes | 0 | 0.0% |
| 45 to 59 Minutes | 0 | 0.0% |
| 60 to 89 Minutes | 30 | 10.0% |
| 90 or more Minutes | 31 | 10.4% |
Commute Time by Sex in Lamboglia
The most common commute times in Lamboglia are 20 to 24 minutes (70 commuters, 31.5%) for males and 30 to 34 minutes (49 commuters, 63.6%) for females.
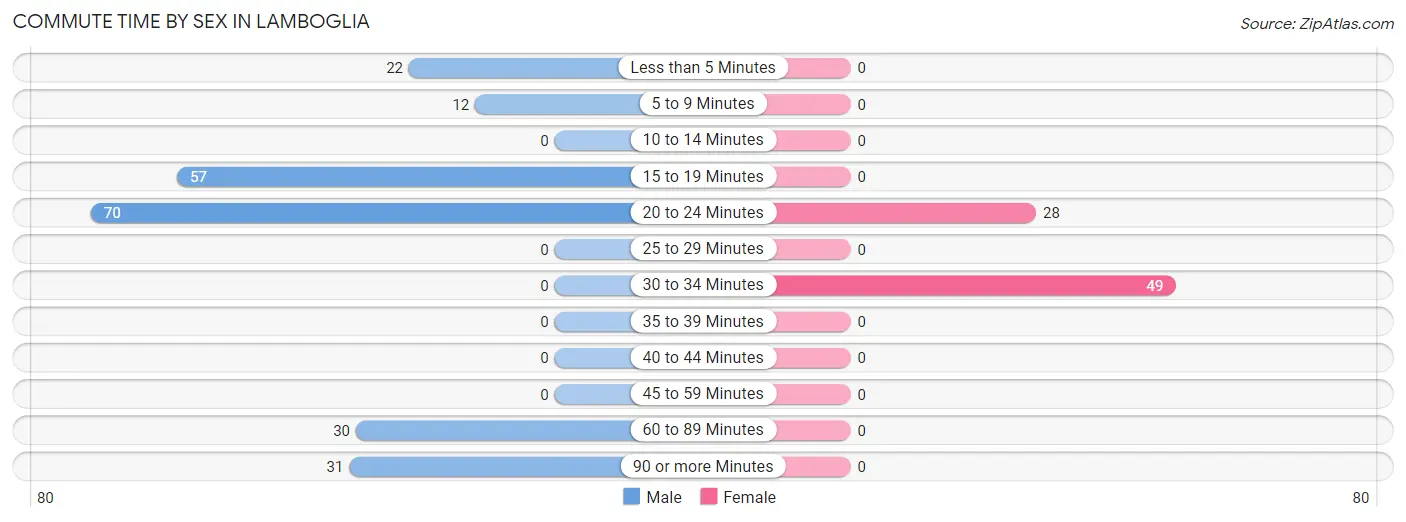
| Commute Time | Male | Female |
| Less than 5 Minutes | 22 (9.9%) | 0 (0.0%) |
| 5 to 9 Minutes | 12 (5.4%) | 0 (0.0%) |
| 10 to 14 Minutes | 0 (0.0%) | 0 (0.0%) |
| 15 to 19 Minutes | 57 (25.7%) | 0 (0.0%) |
| 20 to 24 Minutes | 70 (31.5%) | 28 (36.4%) |
| 25 to 29 Minutes | 0 (0.0%) | 0 (0.0%) |
| 30 to 34 Minutes | 0 (0.0%) | 49 (63.6%) |
| 35 to 39 Minutes | 0 (0.0%) | 0 (0.0%) |
| 40 to 44 Minutes | 0 (0.0%) | 0 (0.0%) |
| 45 to 59 Minutes | 0 (0.0%) | 0 (0.0%) |
| 60 to 89 Minutes | 30 (13.5%) | 0 (0.0%) |
| 90 or more Minutes | 31 (14.0%) | 0 (0.0%) |
Time of Departure to Work by Sex in Lamboglia
The most frequent times of departure to work in Lamboglia are 6:00 AM to 6:29 AM (94, 42.3%) for males and 6:30 AM to 6:59 AM (23, 29.9%) for females.
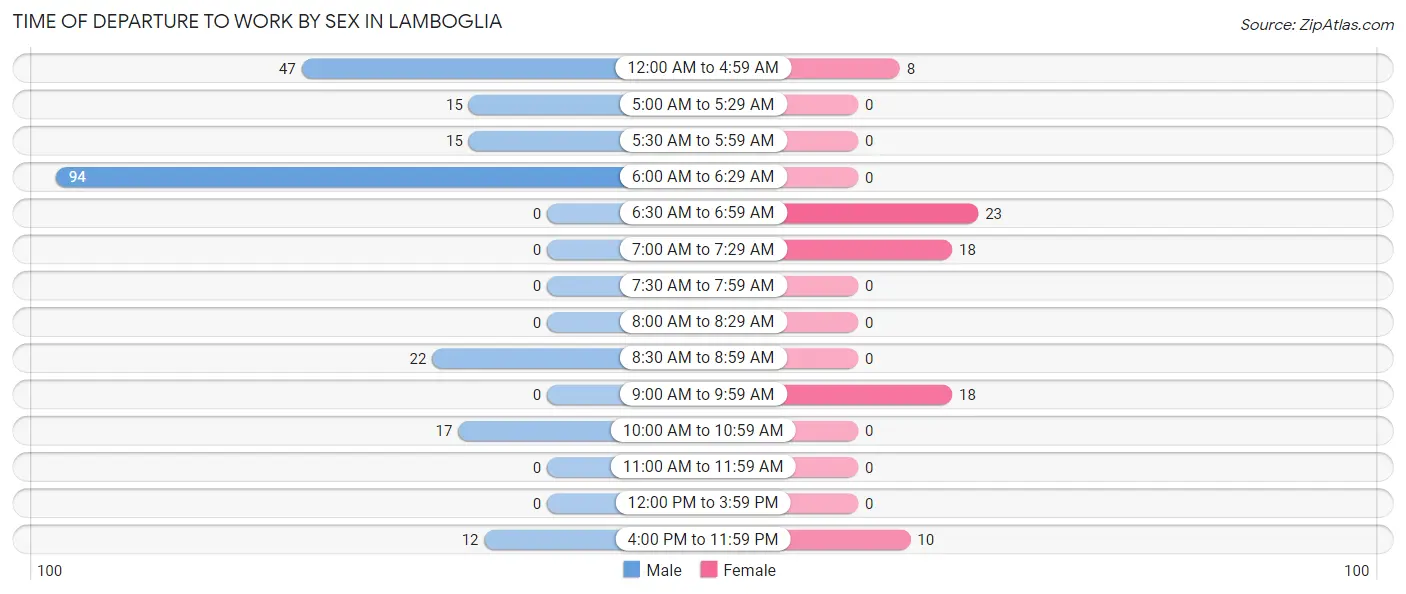
| Time of Departure | Male | Female |
| 12:00 AM to 4:59 AM | 47 (21.2%) | 8 (10.4%) |
| 5:00 AM to 5:29 AM | 15 (6.8%) | 0 (0.0%) |
| 5:30 AM to 5:59 AM | 15 (6.8%) | 0 (0.0%) |
| 6:00 AM to 6:29 AM | 94 (42.3%) | 0 (0.0%) |
| 6:30 AM to 6:59 AM | 0 (0.0%) | 23 (29.9%) |
| 7:00 AM to 7:29 AM | 0 (0.0%) | 18 (23.4%) |
| 7:30 AM to 7:59 AM | 0 (0.0%) | 0 (0.0%) |
| 8:00 AM to 8:29 AM | 0 (0.0%) | 0 (0.0%) |
| 8:30 AM to 8:59 AM | 22 (9.9%) | 0 (0.0%) |
| 9:00 AM to 9:59 AM | 0 (0.0%) | 18 (23.4%) |
| 10:00 AM to 10:59 AM | 17 (7.7%) | 0 (0.0%) |
| 11:00 AM to 11:59 AM | 0 (0.0%) | 0 (0.0%) |
| 12:00 PM to 3:59 PM | 0 (0.0%) | 0 (0.0%) |
| 4:00 PM to 11:59 PM | 12 (5.4%) | 10 (13.0%) |
| Total | 222 (100.0%) | 77 (100.0%) |
Housing Occupancy in Lamboglia
Occupancy by Ownership in Lamboglia
Of the total 384 dwellings in Lamboglia, owner-occupied units account for 282 (73.4%), while renter-occupied units make up 102 (26.6%).
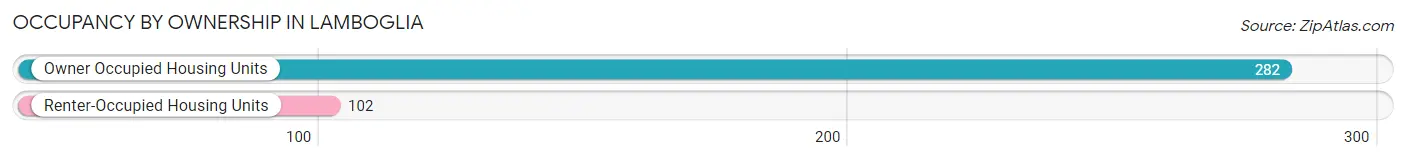
| Occupancy | # Housing Units | % Housing Units |
| Owner Occupied Housing Units | 282 | 73.4% |
| Renter-Occupied Housing Units | 102 | 26.6% |
| Total Occupied Housing Units | 384 | 100.0% |
Occupancy by Household Size in Lamboglia
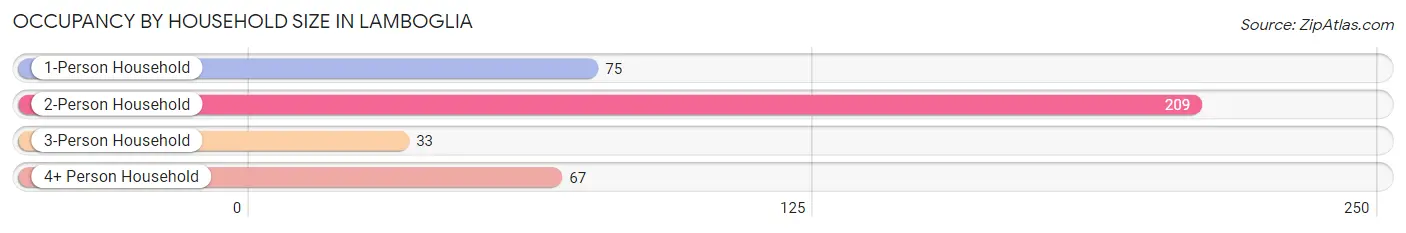
| Household Size | # Housing Units | % Housing Units |
| 1-Person Household | 75 | 19.5% |
| 2-Person Household | 209 | 54.4% |
| 3-Person Household | 33 | 8.6% |
| 4+ Person Household | 67 | 17.4% |
| Total Housing Units | 384 | 100.0% |
Occupancy by Ownership by Household Size in Lamboglia
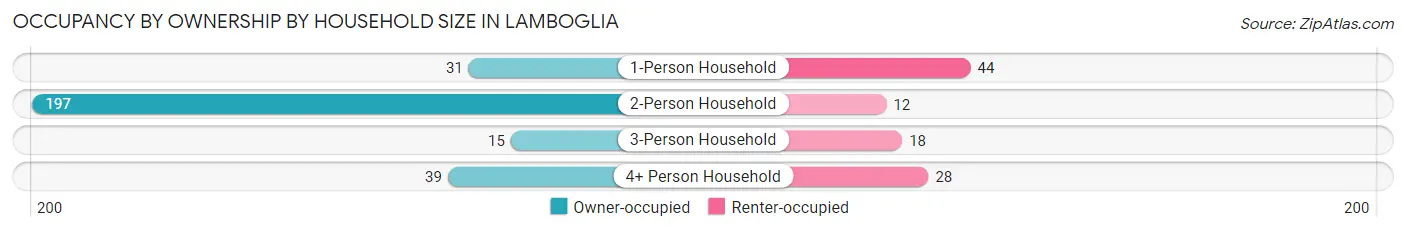
| Household Size | Owner-occupied | Renter-occupied |
| 1-Person Household | 31 (41.3%) | 44 (58.7%) |
| 2-Person Household | 197 (94.3%) | 12 (5.7%) |
| 3-Person Household | 15 (45.5%) | 18 (54.5%) |
| 4+ Person Household | 39 (58.2%) | 28 (41.8%) |
| Total Housing Units | 282 (73.4%) | 102 (26.6%) |
Occupancy by Educational Attainment in Lamboglia
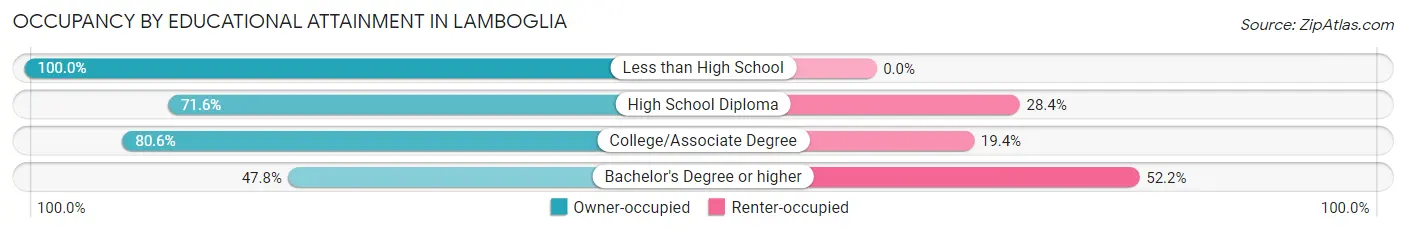
| Household Size | Owner-occupied | Renter-occupied |
| Less than High School | 61 (100.0%) | 0 (0.0%) |
| High School Diploma | 73 (71.6%) | 29 (28.4%) |
| College/Associate Degree | 104 (80.6%) | 25 (19.4%) |
| Bachelor's Degree or higher | 44 (47.8%) | 48 (52.2%) |
Occupancy by Age of Householder in Lamboglia
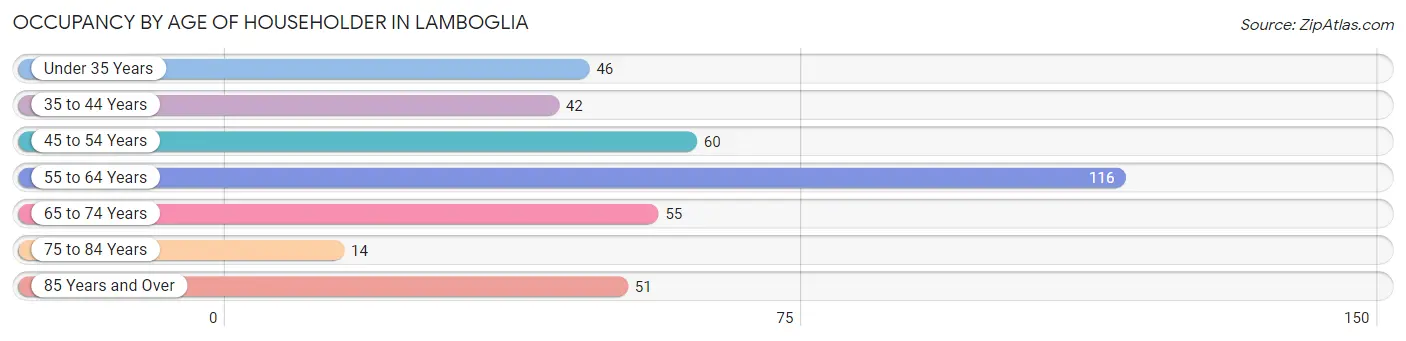
| Age Bracket | # Households | % Households |
| Under 35 Years | 46 | 12.0% |
| 35 to 44 Years | 42 | 10.9% |
| 45 to 54 Years | 60 | 15.6% |
| 55 to 64 Years | 116 | 30.2% |
| 65 to 74 Years | 55 | 14.3% |
| 75 to 84 Years | 14 | 3.6% |
| 85 Years and Over | 51 | 13.3% |
| Total | 384 | 100.0% |
Housing Finances in Lamboglia
Median Income by Occupancy in Lamboglia
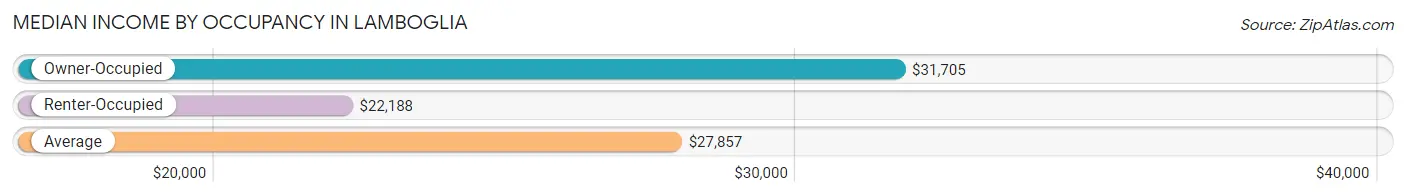
| Occupancy Type | # Households | Median Income |
| Owner-Occupied | 282 (73.4%) | $31,705 |
| Renter-Occupied | 102 (26.6%) | $22,188 |
| Average | 384 (100.0%) | $27,857 |
Occupancy by Householder Income Bracket in Lamboglia
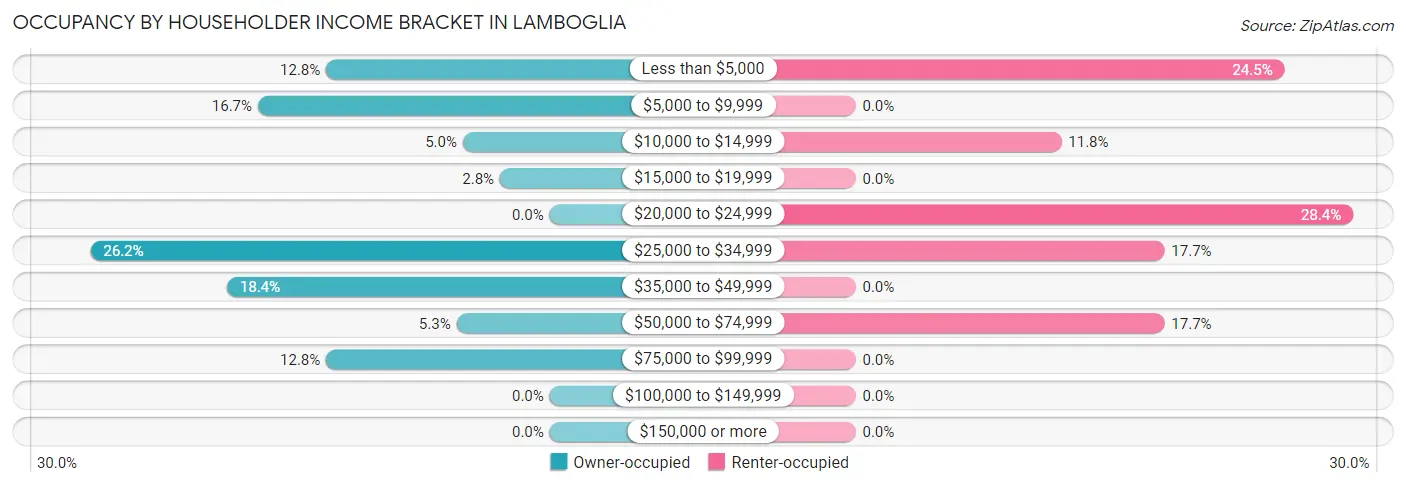
| Income Bracket | Owner-occupied | Renter-occupied |
| Less than $5,000 | 36 (12.8%) | 25 (24.5%) |
| $5,000 to $9,999 | 47 (16.7%) | 0 (0.0%) |
| $10,000 to $14,999 | 14 (5.0%) | 12 (11.8%) |
| $15,000 to $19,999 | 8 (2.8%) | 0 (0.0%) |
| $20,000 to $24,999 | 0 (0.0%) | 29 (28.4%) |
| $25,000 to $34,999 | 74 (26.2%) | 18 (17.6%) |
| $35,000 to $49,999 | 52 (18.4%) | 0 (0.0%) |
| $50,000 to $74,999 | 15 (5.3%) | 18 (17.6%) |
| $75,000 to $99,999 | 36 (12.8%) | 0 (0.0%) |
| $100,000 to $149,999 | 0 (0.0%) | 0 (0.0%) |
| $150,000 or more | 0 (0.0%) | 0 (0.0%) |
| Total | 282 (100.0%) | 102 (100.0%) |
Monthly Housing Cost Tiers in Lamboglia
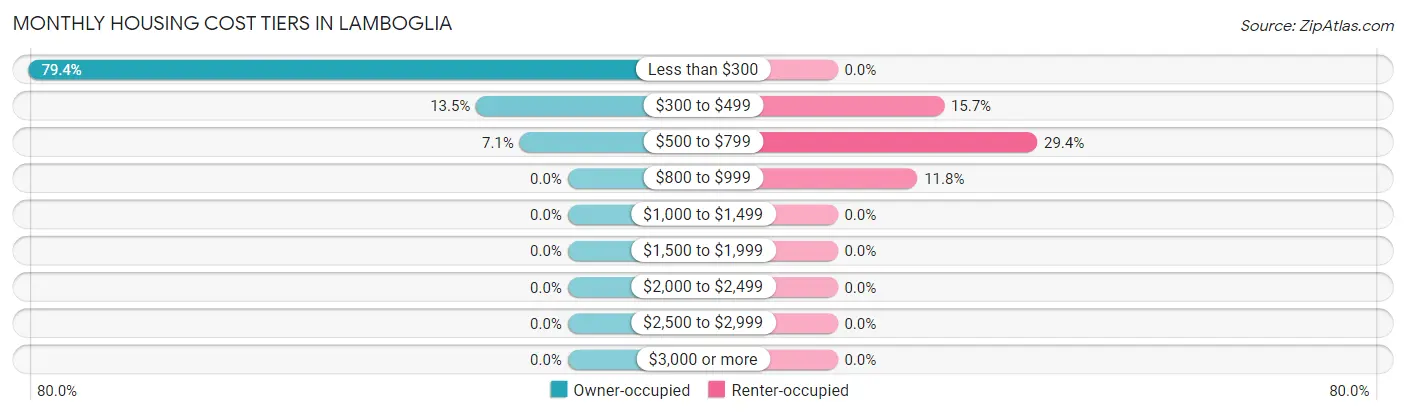
| Monthly Cost | Owner-occupied | Renter-occupied |
| Less than $300 | 224 (79.4%) | 0 (0.0%) |
| $300 to $499 | 38 (13.5%) | 16 (15.7%) |
| $500 to $799 | 20 (7.1%) | 30 (29.4%) |
| $800 to $999 | 0 (0.0%) | 12 (11.8%) |
| $1,000 to $1,499 | 0 (0.0%) | 0 (0.0%) |
| $1,500 to $1,999 | 0 (0.0%) | 0 (0.0%) |
| $2,000 to $2,499 | 0 (0.0%) | 0 (0.0%) |
| $2,500 to $2,999 | 0 (0.0%) | 0 (0.0%) |
| $3,000 or more | 0 (0.0%) | 0 (0.0%) |
| Total | 282 (100.0%) | 102 (100.0%) |
Physical Housing Characteristics in Lamboglia
Housing Structures in Lamboglia
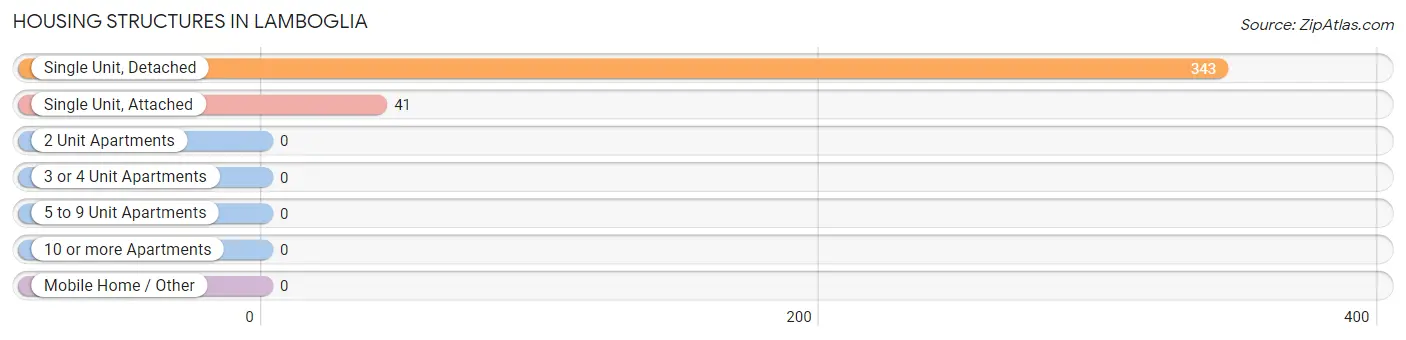
| Structure Type | # Housing Units | % Housing Units |
| Single Unit, Detached | 343 | 89.3% |
| Single Unit, Attached | 41 | 10.7% |
| 2 Unit Apartments | 0 | 0.0% |
| 3 or 4 Unit Apartments | 0 | 0.0% |
| 5 to 9 Unit Apartments | 0 | 0.0% |
| 10 or more Apartments | 0 | 0.0% |
| Mobile Home / Other | 0 | 0.0% |
| Total | 384 | 100.0% |
Housing Structures by Occupancy in Lamboglia
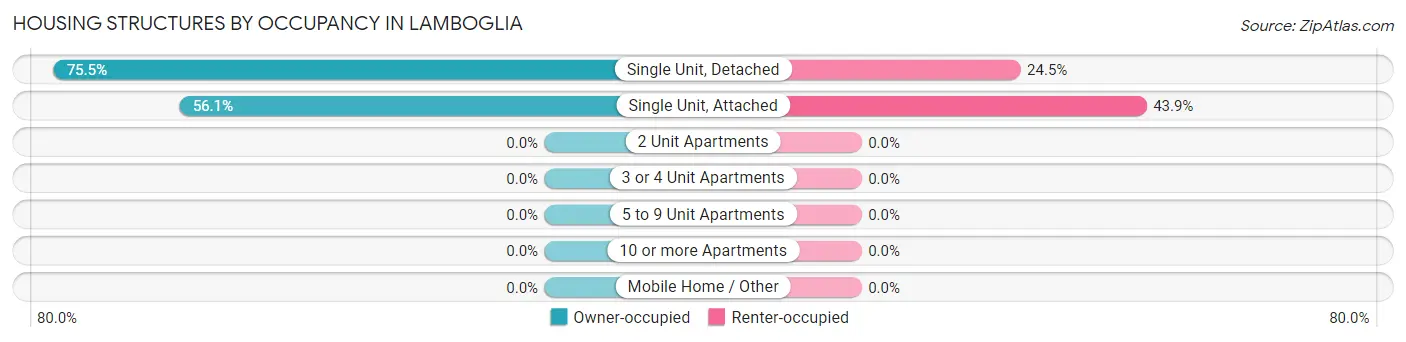
| Structure Type | Owner-occupied | Renter-occupied |
| Single Unit, Detached | 259 (75.5%) | 84 (24.5%) |
| Single Unit, Attached | 23 (56.1%) | 18 (43.9%) |
| 2 Unit Apartments | 0 (0.0%) | 0 (0.0%) |
| 3 or 4 Unit Apartments | 0 (0.0%) | 0 (0.0%) |
| 5 to 9 Unit Apartments | 0 (0.0%) | 0 (0.0%) |
| 10 or more Apartments | 0 (0.0%) | 0 (0.0%) |
| Mobile Home / Other | 0 (0.0%) | 0 (0.0%) |
| Total | 282 (73.4%) | 102 (26.6%) |
Housing Structures by Number of Rooms in Lamboglia
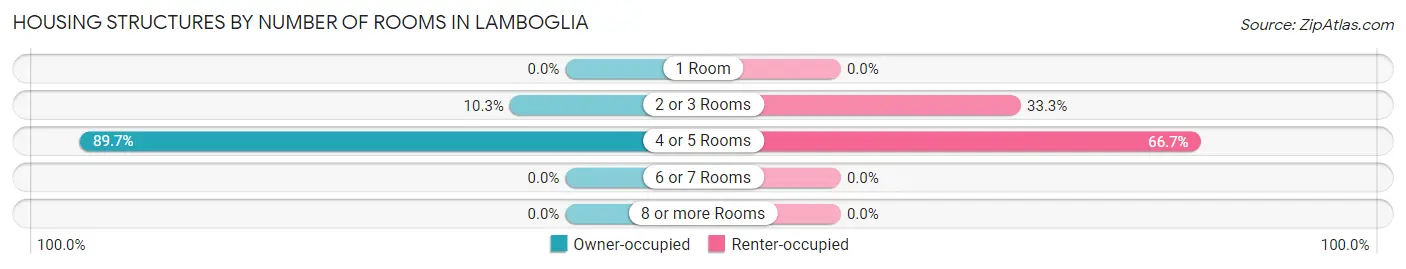
| Number of Rooms | Owner-occupied | Renter-occupied |
| 1 Room | 0 (0.0%) | 0 (0.0%) |
| 2 or 3 Rooms | 29 (10.3%) | 34 (33.3%) |
| 4 or 5 Rooms | 253 (89.7%) | 68 (66.7%) |
| 6 or 7 Rooms | 0 (0.0%) | 0 (0.0%) |
| 8 or more Rooms | 0 (0.0%) | 0 (0.0%) |
| Total | 282 (100.0%) | 102 (100.0%) |
Housing Structure by Heating Type in Lamboglia
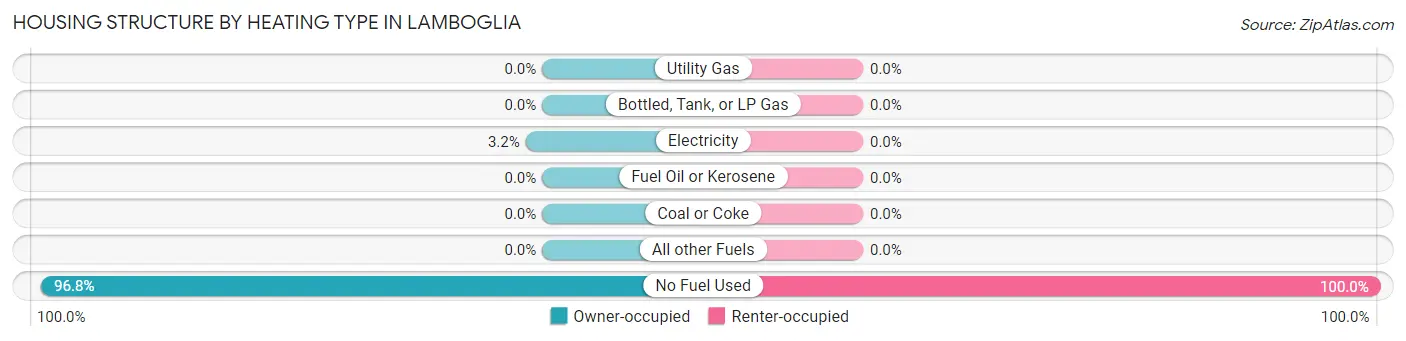
| Heating Type | Owner-occupied | Renter-occupied |
| Utility Gas | 0 (0.0%) | 0 (0.0%) |
| Bottled, Tank, or LP Gas | 0 (0.0%) | 0 (0.0%) |
| Electricity | 9 (3.2%) | 0 (0.0%) |
| Fuel Oil or Kerosene | 0 (0.0%) | 0 (0.0%) |
| Coal or Coke | 0 (0.0%) | 0 (0.0%) |
| All other Fuels | 0 (0.0%) | 0 (0.0%) |
| No Fuel Used | 273 (96.8%) | 102 (100.0%) |
| Total | 282 (100.0%) | 102 (100.0%) |
Household Vehicle Usage in Lamboglia
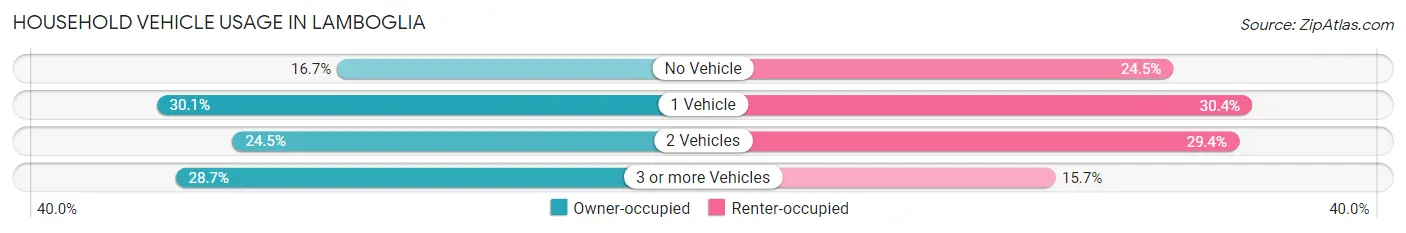
| Vehicles per Household | Owner-occupied | Renter-occupied |
| No Vehicle | 47 (16.7%) | 25 (24.5%) |
| 1 Vehicle | 85 (30.1%) | 31 (30.4%) |
| 2 Vehicles | 69 (24.5%) | 30 (29.4%) |
| 3 or more Vehicles | 81 (28.7%) | 16 (15.7%) |
| Total | 282 (100.0%) | 102 (100.0%) |
Real Estate & Mortgages in Lamboglia
Real Estate and Mortgage Overview in Lamboglia
| Characteristic | Without Mortgage | With Mortgage |
| Housing Units | 282 | 0 |
| Median Property Value | $76,100 | $0 |
| Median Household Income | $31,705 | $0 |
| Monthly Housing Costs | $201 | $0 |
| Real Estate Taxes | - | - |
Property Value by Mortgage Status in Lamboglia
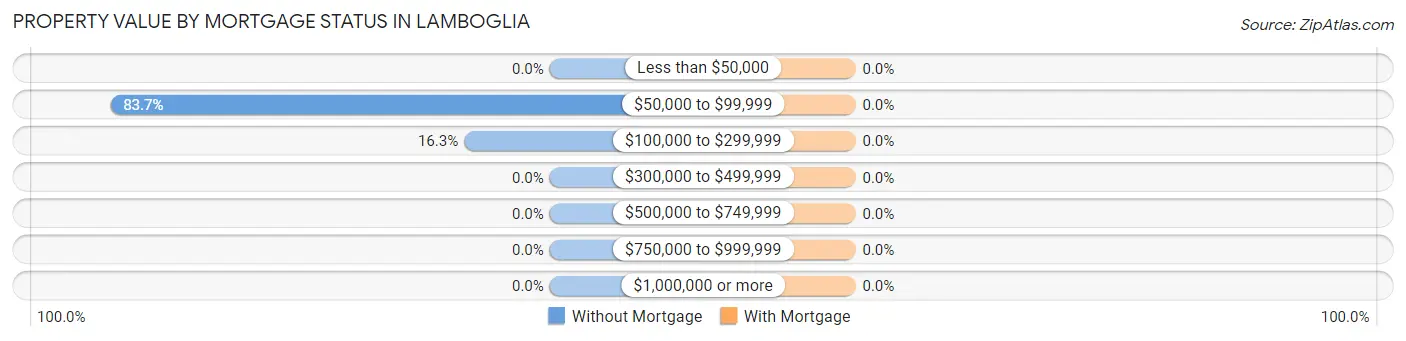
| Property Value | Without Mortgage | With Mortgage |
| Less than $50,000 | 0 (0.0%) | 0 (0.0%) |
| $50,000 to $99,999 | 236 (83.7%) | 0 (0.0%) |
| $100,000 to $299,999 | 46 (16.3%) | 0 (0.0%) |
| $300,000 to $499,999 | 0 (0.0%) | 0 (0.0%) |
| $500,000 to $749,999 | 0 (0.0%) | 0 (0.0%) |
| $750,000 to $999,999 | 0 (0.0%) | 0 (0.0%) |
| $1,000,000 or more | 0 (0.0%) | 0 (0.0%) |
| Total | 282 (100.0%) | 0 (0.0%) |
Household Income by Mortgage Status in Lamboglia
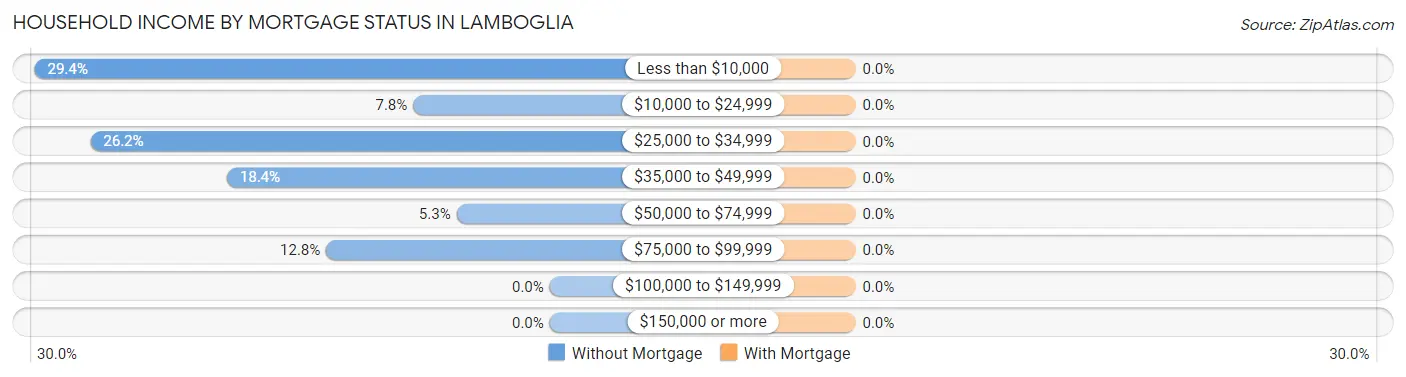
| Household Income | Without Mortgage | With Mortgage |
| Less than $10,000 | 83 (29.4%) | 0 (0.0%) |
| $10,000 to $24,999 | 22 (7.8%) | 0 (0.0%) |
| $25,000 to $34,999 | 74 (26.2%) | 0 (0.0%) |
| $35,000 to $49,999 | 52 (18.4%) | 0 (0.0%) |
| $50,000 to $74,999 | 15 (5.3%) | 0 (0.0%) |
| $75,000 to $99,999 | 36 (12.8%) | 0 (0.0%) |
| $100,000 to $149,999 | 0 (0.0%) | 0 (0.0%) |
| $150,000 or more | 0 (0.0%) | 0 (0.0%) |
| Total | 282 (100.0%) | 0 (0.0%) |
Property Value to Household Income Ratio in Lamboglia
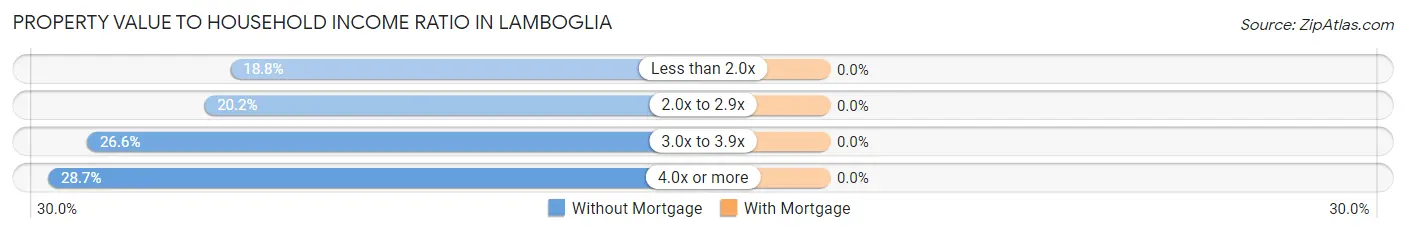
| Value-to-Income Ratio | Without Mortgage | With Mortgage |
| Less than 2.0x | 53 (18.8%) | 0 (0.0%) |
| 2.0x to 2.9x | 57 (20.2%) | 0 (0.0%) |
| 3.0x to 3.9x | 75 (26.6%) | 0 (0.0%) |
| 4.0x or more | 81 (28.7%) | 0 (0.0%) |
| Total | 282 (100.0%) | 0 (0.0%) |
Real Estate Taxes by Mortgage Status in Lamboglia
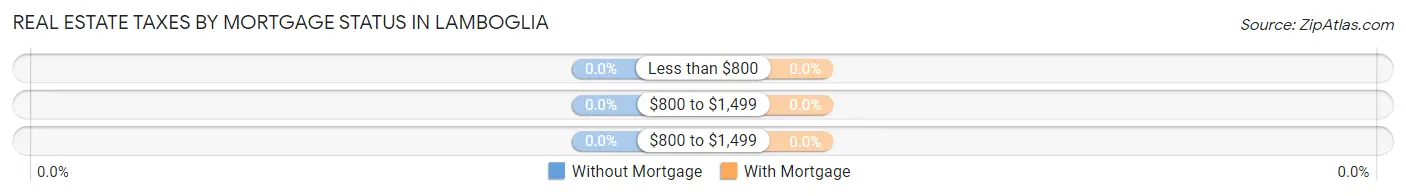
| Property Taxes | Without Mortgage | With Mortgage |
| Less than $800 | 0 (0.0%) | 0 (0.0%) |
| $800 to $1,499 | 0 (0.0%) | 0 (0.0%) |
| $800 to $1,499 | 0 (0.0%) | 0 (0.0%) |
| Total | 282 (100.0%) | 0 (0.0%) |
Health & Disability in Lamboglia
Health Insurance Coverage by Age in Lamboglia
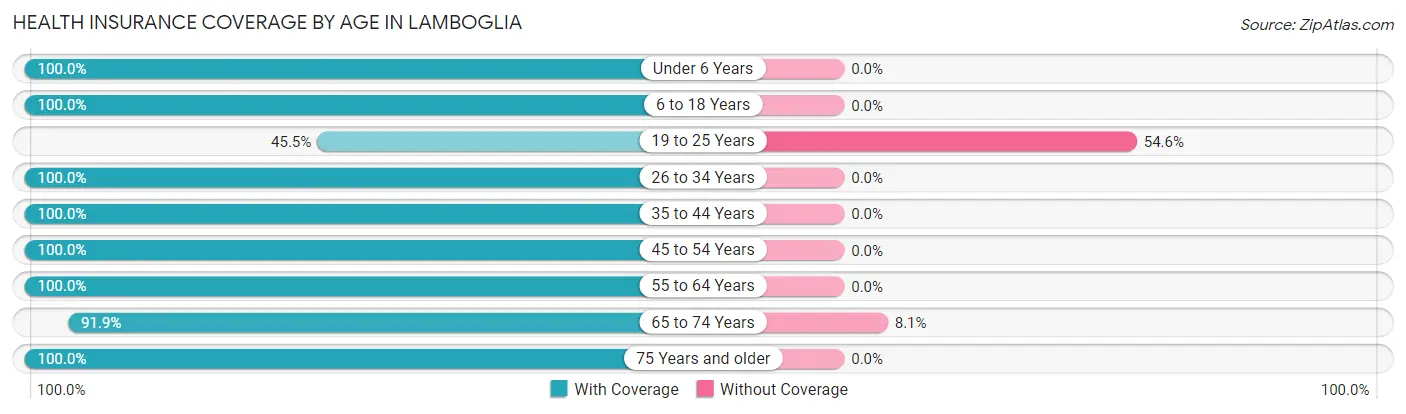
| Age Bracket | With Coverage | Without Coverage |
| Under 6 Years | 64 (100.0%) | 0 (0.0%) |
| 6 to 18 Years | 116 (100.0%) | 0 (0.0%) |
| 19 to 25 Years | 10 (45.5%) | 12 (54.5%) |
| 26 to 34 Years | 100 (100.0%) | 0 (0.0%) |
| 35 to 44 Years | 146 (100.0%) | 0 (0.0%) |
| 45 to 54 Years | 114 (100.0%) | 0 (0.0%) |
| 55 to 64 Years | 158 (100.0%) | 0 (0.0%) |
| 65 to 74 Years | 136 (91.9%) | 12 (8.1%) |
| 75 Years and older | 65 (100.0%) | 0 (0.0%) |
| Total | 909 (97.4%) | 24 (2.6%) |
Health Insurance Coverage by Citizenship Status in Lamboglia
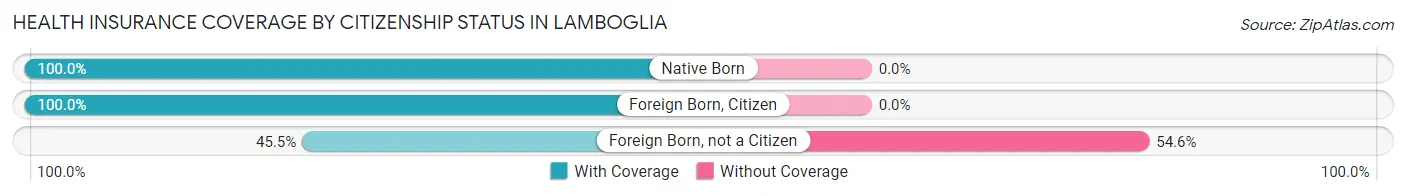
| Citizenship Status | With Coverage | Without Coverage |
| Native Born | 64 (100.0%) | 0 (0.0%) |
| Foreign Born, Citizen | 116 (100.0%) | 0 (0.0%) |
| Foreign Born, not a Citizen | 10 (45.5%) | 12 (54.5%) |
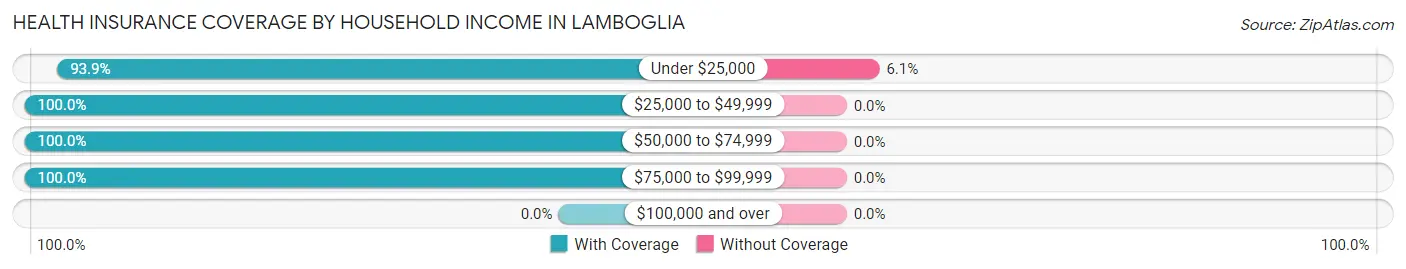
Health Insurance Coverage by Household Income in Lamboglia
| Household Income | With Coverage | Without Coverage |
| Under $25,000 | 368 (93.9%) | 24 (6.1%) |
| $25,000 to $49,999 | 362 (100.0%) | 0 (0.0%) |
| $50,000 to $74,999 | 116 (100.0%) | 0 (0.0%) |
| $75,000 to $99,999 | 63 (100.0%) | 0 (0.0%) |
| $100,000 and over | 0 (0.0%) | 0 (0.0%) |
Public vs Private Health Insurance Coverage by Age in Lamboglia
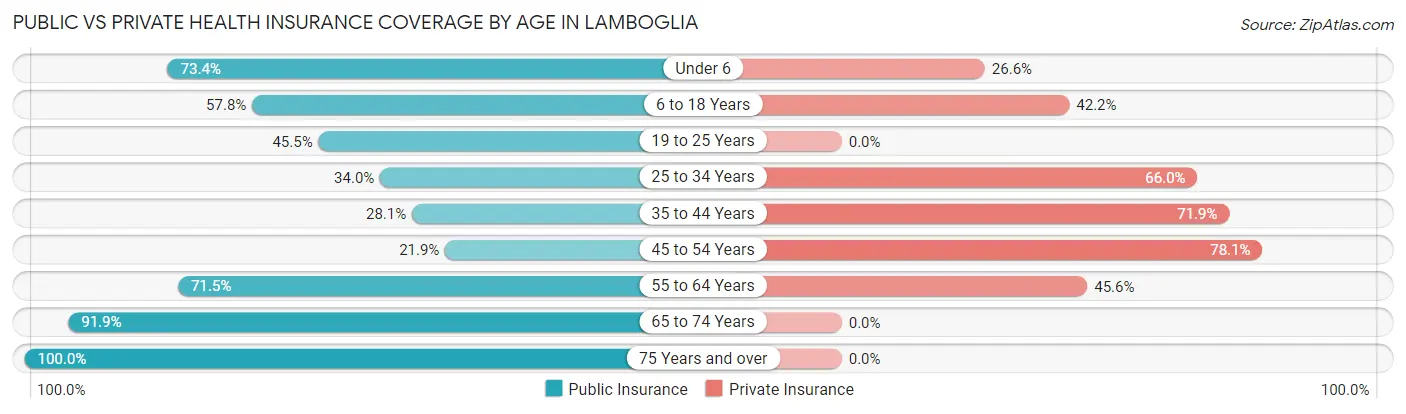
| Age Bracket | Public Insurance | Private Insurance |
| Under 6 | 47 (73.4%) | 17 (26.6%) |
| 6 to 18 Years | 67 (57.8%) | 49 (42.2%) |
| 19 to 25 Years | 10 (45.5%) | 0 (0.0%) |
| 25 to 34 Years | 34 (34.0%) | 66 (66.0%) |
| 35 to 44 Years | 41 (28.1%) | 105 (71.9%) |
| 45 to 54 Years | 25 (21.9%) | 89 (78.1%) |
| 55 to 64 Years | 113 (71.5%) | 72 (45.6%) |
| 65 to 74 Years | 136 (91.9%) | 0 (0.0%) |
| 75 Years and over | 65 (100.0%) | 0 (0.0%) |
| Total | 538 (57.7%) | 398 (42.7%) |
Disability Status by Sex by Age in Lamboglia
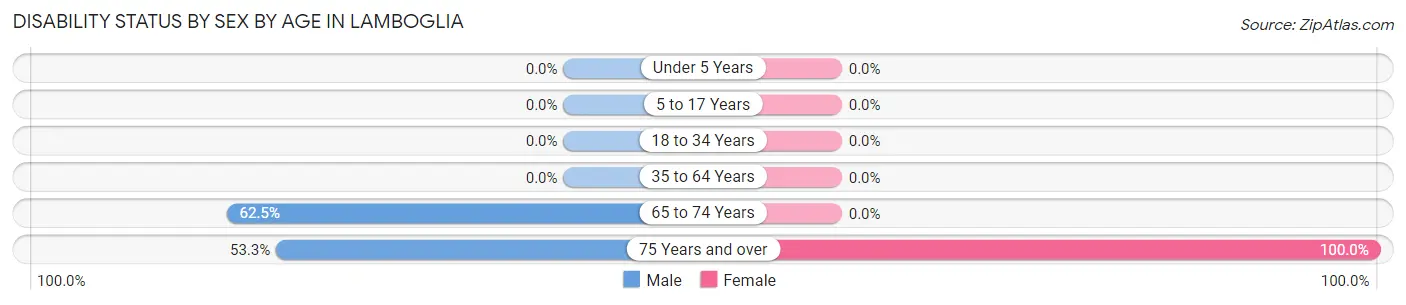
| Age Bracket | Male | Female |
| Under 5 Years | 0 (0.0%) | 0 (0.0%) |
| 5 to 17 Years | 0 (0.0%) | 0 (0.0%) |
| 18 to 34 Years | 0 (0.0%) | 0 (0.0%) |
| 35 to 64 Years | 0 (0.0%) | 0 (0.0%) |
| 65 to 74 Years | 20 (62.5%) | 0 (0.0%) |
| 75 Years and over | 16 (53.3%) | 35 (100.0%) |
Disability Class by Sex by Age in Lamboglia
Disability Class: Hearing Difficulty
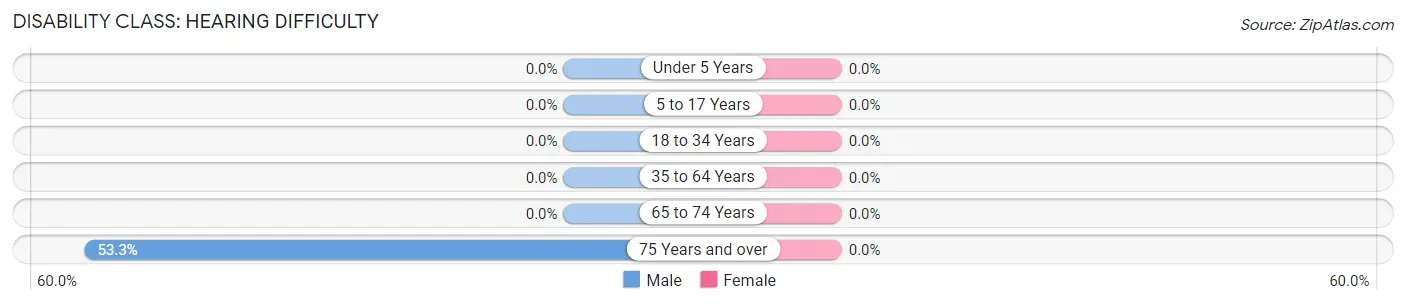
| Age Bracket | Male | Female |
| Under 5 Years | 0 (0.0%) | 0 (0.0%) |
| 5 to 17 Years | 0 (0.0%) | 0 (0.0%) |
| 18 to 34 Years | 0 (0.0%) | 0 (0.0%) |
| 35 to 64 Years | 0 (0.0%) | 0 (0.0%) |
| 65 to 74 Years | 0 (0.0%) | 0 (0.0%) |
| 75 Years and over | 16 (53.3%) | 0 (0.0%) |
Disability Class: Vision Difficulty
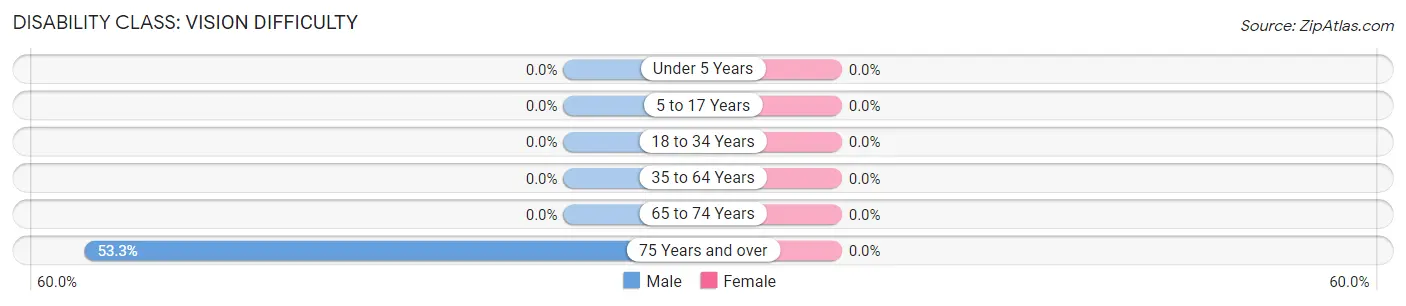
| Age Bracket | Male | Female |
| Under 5 Years | 0 (0.0%) | 0 (0.0%) |
| 5 to 17 Years | 0 (0.0%) | 0 (0.0%) |
| 18 to 34 Years | 0 (0.0%) | 0 (0.0%) |
| 35 to 64 Years | 0 (0.0%) | 0 (0.0%) |
| 65 to 74 Years | 0 (0.0%) | 0 (0.0%) |
| 75 Years and over | 16 (53.3%) | 0 (0.0%) |
Disability Class: Cognitive Difficulty
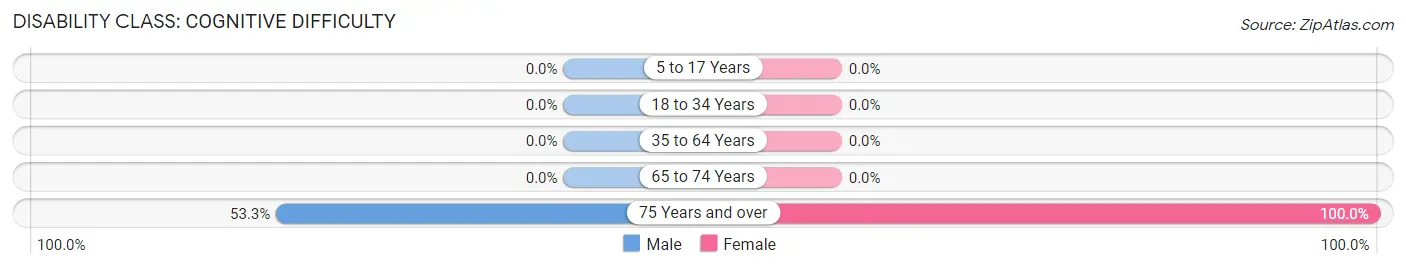
| Age Bracket | Male | Female |
| 5 to 17 Years | 0 (0.0%) | 0 (0.0%) |
| 18 to 34 Years | 0 (0.0%) | 0 (0.0%) |
| 35 to 64 Years | 0 (0.0%) | 0 (0.0%) |
| 65 to 74 Years | 0 (0.0%) | 0 (0.0%) |
| 75 Years and over | 16 (53.3%) | 35 (100.0%) |
Disability Class: Ambulatory Difficulty
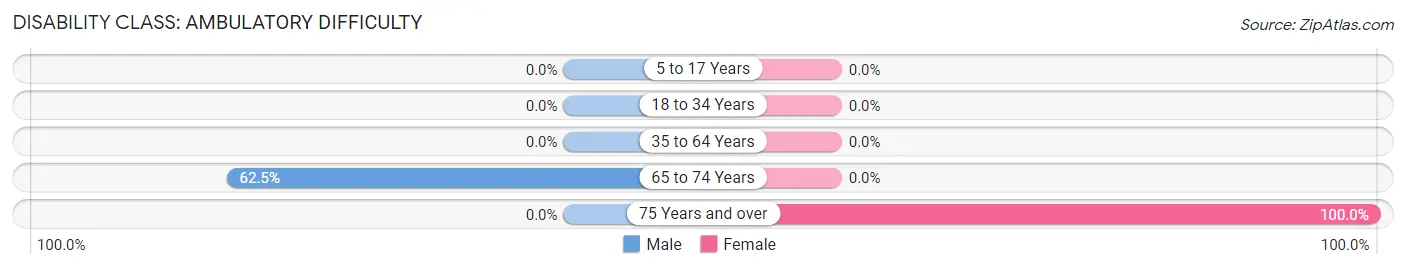
| Age Bracket | Male | Female |
| 5 to 17 Years | 0 (0.0%) | 0 (0.0%) |
| 18 to 34 Years | 0 (0.0%) | 0 (0.0%) |
| 35 to 64 Years | 0 (0.0%) | 0 (0.0%) |
| 65 to 74 Years | 20 (62.5%) | 0 (0.0%) |
| 75 Years and over | 0 (0.0%) | 35 (100.0%) |
Disability Class: Self-Care Difficulty
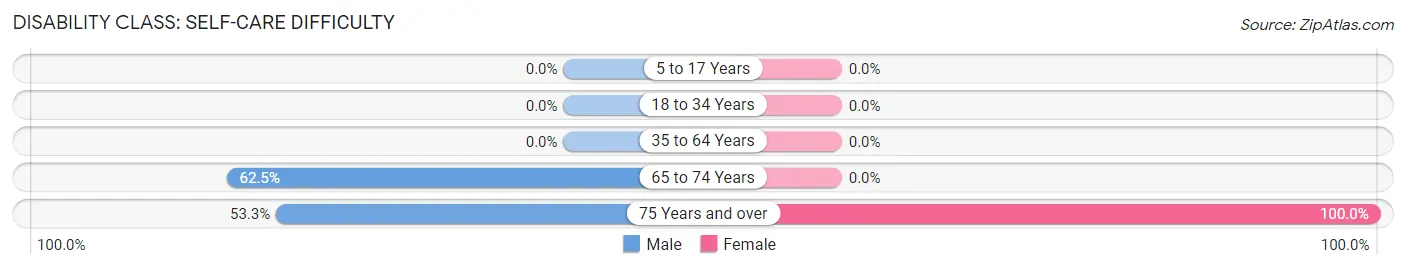
| Age Bracket | Male | Female |
| 5 to 17 Years | 0 (0.0%) | 0 (0.0%) |
| 18 to 34 Years | 0 (0.0%) | 0 (0.0%) |
| 35 to 64 Years | 0 (0.0%) | 0 (0.0%) |
| 65 to 74 Years | 20 (62.5%) | 0 (0.0%) |
| 75 Years and over | 16 (53.3%) | 35 (100.0%) |
Technology Access in Lamboglia
Computing Device Access in Lamboglia
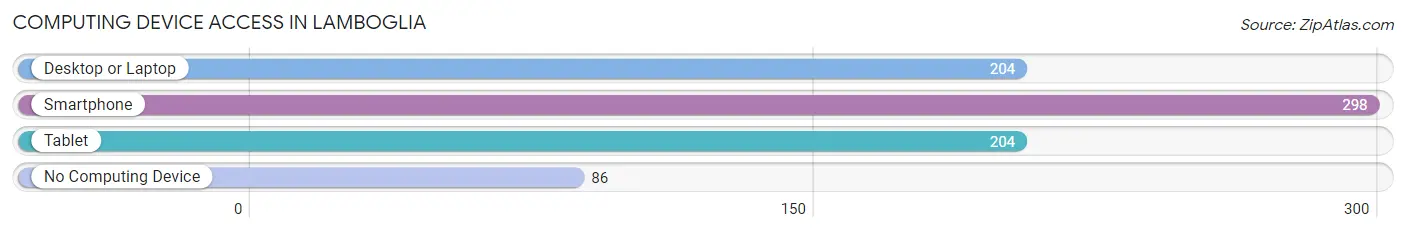
| Device Type | # Households | % Households |
| Desktop or Laptop | 204 | 53.1% |
| Smartphone | 298 | 77.6% |
| Tablet | 204 | 53.1% |
| No Computing Device | 86 | 22.4% |
| Total | 384 | 100.0% |
Internet Access in Lamboglia
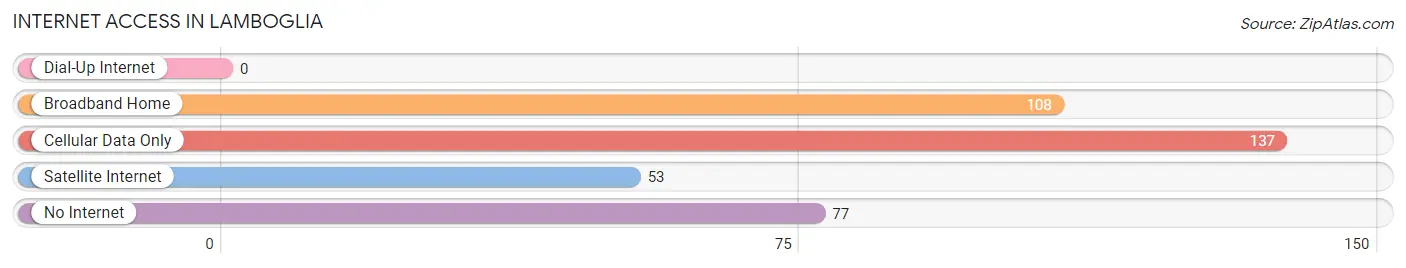
| Internet Type | # Households | % Households |
| Dial-Up Internet | 0 | 0.0% |
| Broadband Home | 108 | 28.1% |
| Cellular Data Only | 137 | 35.7% |
| Satellite Internet | 53 | 13.8% |
| No Internet | 77 | 20.1% |
| Total | 384 | 100.0% |
Lamboglia Summary
The small Caribbean nation of Puerto Rico is a self-governing commonwealth of the United States. Located in the northeastern Caribbean Sea, the island is home to a population of over 3.2 million people. Puerto Rico is known for its rich culture, vibrant history, and diverse geography.
Geography
Puerto Rico is an archipelago located in the northeastern Caribbean Sea, east of the Dominican Republic and west of the Virgin Islands. The main island is approximately 100 miles long and 35 miles wide, with a total land area of 3,515 square miles. The island is divided into 78 municipalities, each with its own government. The capital and largest city is San Juan, located on the northern coast.
The terrain of Puerto Rico is mostly mountainous, with the highest peak, Cerro de Punta, reaching 4,390 feet. The island is surrounded by coral reefs and has many bays and beaches. The climate is tropical, with temperatures ranging from the mid-70s to the mid-80s year-round.
History
Puerto Rico has a long and complex history. The island was first inhabited by the Taíno people, who were later displaced by Spanish settlers in the 16th century. The Spanish colonized the island and established a plantation economy based on sugar cane and other agricultural products.
In 1898, Puerto Rico was ceded to the United States as part of the Treaty of Paris, ending the Spanish-American War. The island became a U.S. territory and was granted limited autonomy. In 1952, Puerto Rico became a self-governing commonwealth of the United States.
Economy
Puerto Rico has a mixed economy, with a large public sector and a growing private sector. The island’s main industries are tourism, pharmaceuticals, and manufacturing. The government has implemented a number of tax incentives to attract foreign investment.
The island’s GDP was estimated at $103.3 billion in 2019. The unemployment rate was 11.2% in 2019, down from a high of 14.2% in 2017. The poverty rate was 44.3% in 2019, down from a high of 45.5% in 2017.
Demographics
Puerto Rico has a population of over 3.2 million people, with a median age of 40.7 years. The population is predominantly of Hispanic or Latino origin, with a small minority of African and Asian descent. The official language is Spanish, although English is widely spoken.
The majority of the population is Roman Catholic, with a small minority of Protestants and other religions. The literacy rate is 94.1%, and the life expectancy is 79.3 years.
Conclusion
Puerto Rico is a small Caribbean nation with a rich history, diverse geography, and vibrant culture. The island has a mixed economy, with a large public sector and a growing private sector. The population is predominantly of Hispanic or Latino origin, with a small minority of African and Asian descent. Puerto Rico is a self-governing commonwealth of the United States, with a population of over 3.2 million people.
Common Questions
What is Per Capita Income in Lamboglia?
Per Capita income in Lamboglia is $13,092.
What is the Median Family Income in Lamboglia?
Median Family Income in Lamboglia is $30,852.
What is the Median Household income in Lamboglia?
Median Household Income in Lamboglia is $27,857.
What is Income or Wage Gap in Lamboglia?
Income or Wage Gap in Lamboglia is 0.7%.
Women in Lamboglia earn 99.3 cents for every dollar earned by a man.
What is Inequality or Gini Index in Lamboglia?
Inequality or Gini Index in Lamboglia is 0.44.
What is the Total Population of Lamboglia?
Total Population of Lamboglia is 933.
What is the Total Male Population of Lamboglia?
Total Male Population of Lamboglia is 475.
What is the Total Female Population of Lamboglia?
Total Female Population of Lamboglia is 458.
What is the Ratio of Males per 100 Females in Lamboglia?
There are 103.71 Males per 100 Females in Lamboglia.
What is the Ratio of Females per 100 Males in Lamboglia?
There are 96.42 Females per 100 Males in Lamboglia.
What is the Median Population Age in Lamboglia?
Median Population Age in Lamboglia is 45.4 Years.
What is the Average Family Size in Lamboglia
Average Family Size in Lamboglia is 2.8 People.
What is the Average Household Size in Lamboglia
Average Household Size in Lamboglia is 2.4 People.
How Large is the Labor Force in Lamboglia?
There are 317 People in the Labor Forcein in Lamboglia.
What is the Percentage of People in the Labor Force in Lamboglia?
42.1% of People are in the Labor Force in Lamboglia.