Garrochales, PR Map & Demographics
Garrochales Map
Garrochales Overview
$17,877
PER CAPITA INCOME
$35,213
AVG FAMILY INCOME
$13,000
AVG HOUSEHOLD INCOME
83.2%
WAGE / INCOME GAP [ % ]
16.8¢/ $1
WAGE / INCOME GAP [ $ ]
0.63
INEQUALITY / GINI INDEX
876
TOTAL POPULATION
397
MALE POPULATION
479
FEMALE POPULATION
82.88
MALES / 100 FEMALES
120.65
FEMALES / 100 MALES
50.3
MEDIAN AGE
3.6
AVG FAMILY SIZE
2.6
AVG HOUSEHOLD SIZE
298
LABOR FORCE [ PEOPLE ]
39.9%
PERCENT IN LABOR FORCE
6.4%
UNEMPLOYMENT RATE
Garrochales Zip Codes
Garrochales Area Codes
Income in Garrochales
Income Overview in Garrochales
Per Capita Income in Garrochales is $17,877, while median incomes of families and households are $35,213 and $13,000 respectively.
| Characteristic | Number | Measure |
| Per Capita Income | 876 | $17,877 |
| Median Family Income | 195 | $35,213 |
| Mean Family Income | 195 | $52,194 |
| Median Household Income | 340 | $13,000 |
| Mean Household Income | 340 | $33,383 |
| Income Deficit | 195 | $0 |
| Wage / Income Gap (%) | 876 | 83.20% |
| Wage / Income Gap ($) | 876 | 16.80¢ per $1 |
| Gini / Inequality Index | 876 | 0.63 |
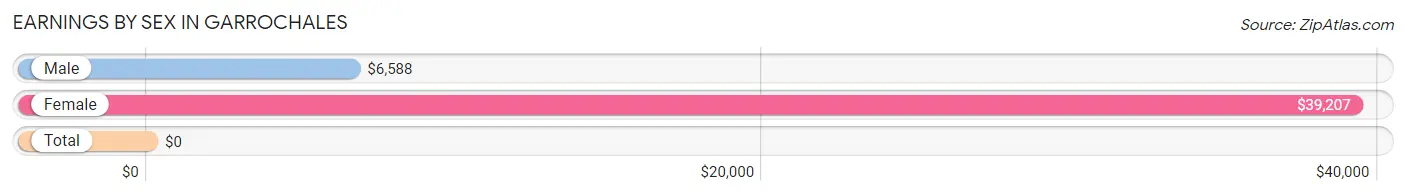
Earnings by Sex in Garrochales
| Sex | Number | Average Earnings |
| Male | 108 (38.7%) | $6,588 |
| Female | 171 (61.3%) | $39,207 |
| Total | 279 (100.0%) | $0 |
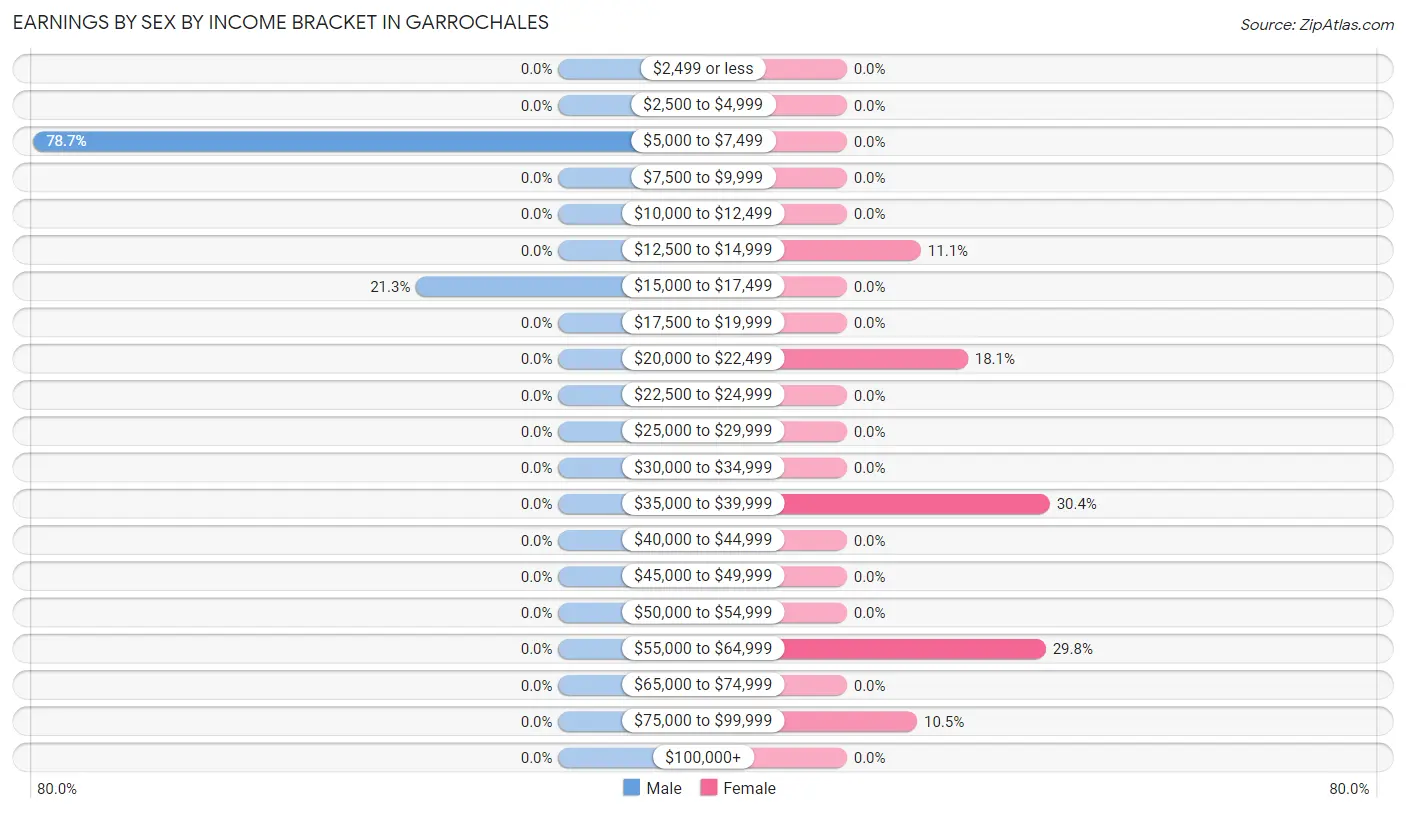
Earnings by Sex by Income Bracket in Garrochales
The most common earnings brackets in Garrochales are $5,000 to $7,499 for men (85 | 78.7%) and $35,000 to $39,999 for women (52 | 30.4%).
| Income | Male | Female |
| $2,499 or less | 0 (0.0%) | 0 (0.0%) |
| $2,500 to $4,999 | 0 (0.0%) | 0 (0.0%) |
| $5,000 to $7,499 | 85 (78.7%) | 0 (0.0%) |
| $7,500 to $9,999 | 0 (0.0%) | 0 (0.0%) |
| $10,000 to $12,499 | 0 (0.0%) | 0 (0.0%) |
| $12,500 to $14,999 | 0 (0.0%) | 19 (11.1%) |
| $15,000 to $17,499 | 23 (21.3%) | 0 (0.0%) |
| $17,500 to $19,999 | 0 (0.0%) | 0 (0.0%) |
| $20,000 to $22,499 | 0 (0.0%) | 31 (18.1%) |
| $22,500 to $24,999 | 0 (0.0%) | 0 (0.0%) |
| $25,000 to $29,999 | 0 (0.0%) | 0 (0.0%) |
| $30,000 to $34,999 | 0 (0.0%) | 0 (0.0%) |
| $35,000 to $39,999 | 0 (0.0%) | 52 (30.4%) |
| $40,000 to $44,999 | 0 (0.0%) | 0 (0.0%) |
| $45,000 to $49,999 | 0 (0.0%) | 0 (0.0%) |
| $50,000 to $54,999 | 0 (0.0%) | 0 (0.0%) |
| $55,000 to $64,999 | 0 (0.0%) | 51 (29.8%) |
| $65,000 to $74,999 | 0 (0.0%) | 0 (0.0%) |
| $75,000 to $99,999 | 0 (0.0%) | 18 (10.5%) |
| $100,000+ | 0 (0.0%) | 0 (0.0%) |
| Total | 108 (100.0%) | 171 (100.0%) |
Earnings by Sex by Educational Attainment in Garrochales
| Educational Attainment | Male Income | Female Income |
| Less than High School | - | - |
| High School Diploma | - | - |
| College or Associate's Degree | - | - |
| Bachelor's Degree | - | - |
| Graduate Degree | - | - |
| Total | $6,588 | $39,207 |
Family Income in Garrochales
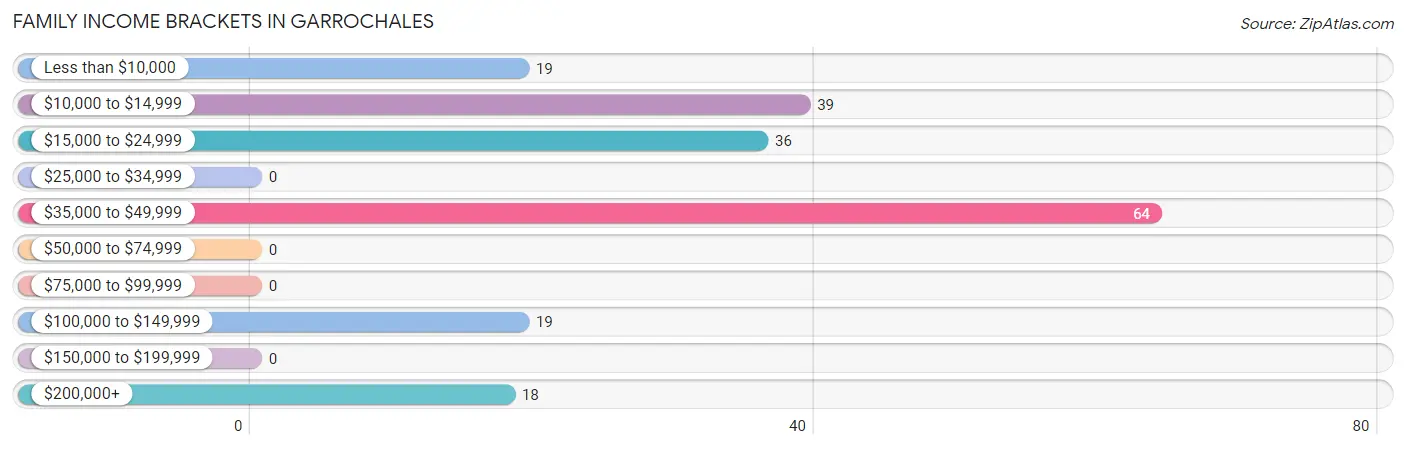
Family Income Brackets in Garrochales
According to the Garrochales family income data, there are 64 families falling into the $35,000 to $49,999 income range, which is the most common income bracket and makes up 32.8% of all families.
| Income Bracket | # Families | % Families |
| Less than $10,000 | 19 | 9.7% |
| $10,000 to $14,999 | 39 | 20.0% |
| $15,000 to $24,999 | 36 | 18.5% |
| $25,000 to $34,999 | 0 | 0.0% |
| $35,000 to $49,999 | 64 | 32.8% |
| $50,000 to $74,999 | 0 | 0.0% |
| $75,000 to $99,999 | 0 | 0.0% |
| $100,000 to $149,999 | 19 | 9.7% |
| $150,000 to $199,999 | 0 | 0.0% |
| $200,000+ | 18 | 9.2% |
Family Income by Famaliy Size in Garrochales
| Income Bracket | # Families | Median Income |
| 2-Person Families | 116 (59.5%) | $0 |
| 3-Person Families | 37 (19.0%) | $0 |
| 4-Person Families | 23 (11.8%) | $0 |
| 5-Person Families | 19 (9.7%) | $0 |
| 6-Person Families | 0 (0.0%) | $0 |
| 7+ Person Families | 0 (0.0%) | $0 |
| Total | 195 (100.0%) | $35,213 |
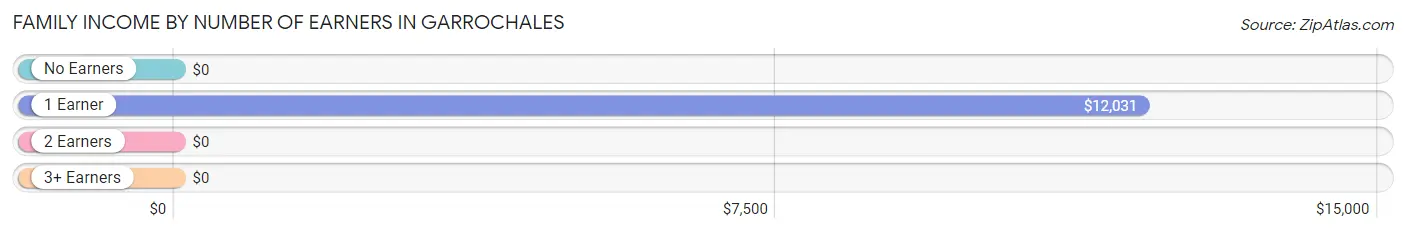
Family Income by Number of Earners in Garrochales
| Number of Earners | # Families | Median Income |
| No Earners | 77 (39.5%) | $0 |
| 1 Earner | 77 (39.5%) | $12,031 |
| 2 Earners | 41 (21.0%) | $0 |
| 3+ Earners | 0 (0.0%) | $0 |
| Total | 195 (100.0%) | $35,213 |
Household Income in Garrochales
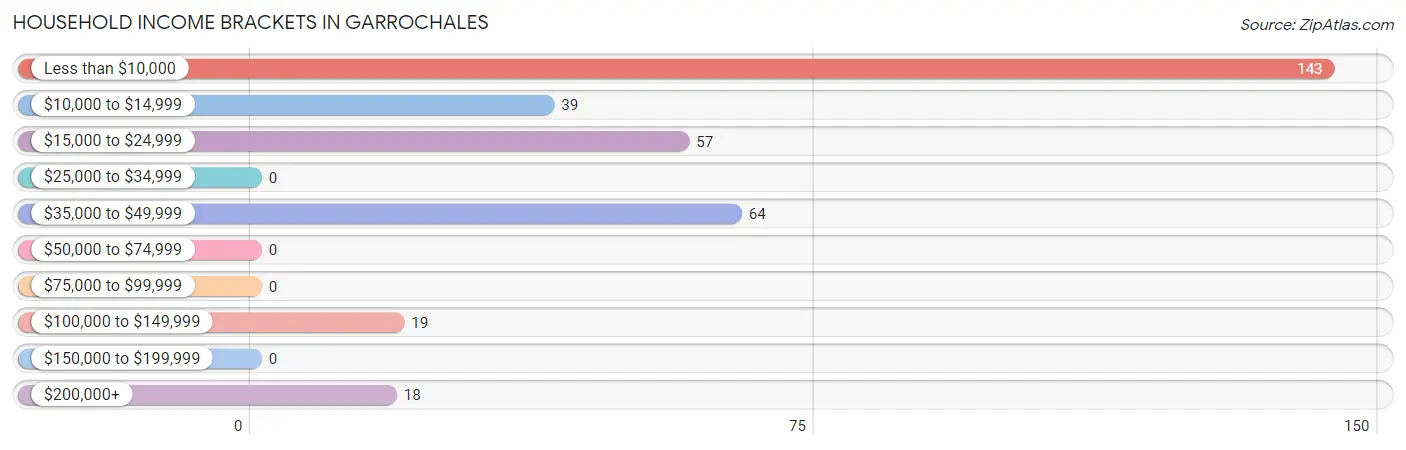
Household Income Brackets in Garrochales
With 143 households falling in the category, the less than $10,000 income range is the most frequent in Garrochales, accounting for 42.1% of all households.
| Income Bracket | # Households | % Households |
| Less than $10,000 | 143 | 42.1% |
| $10,000 to $14,999 | 39 | 11.5% |
| $15,000 to $24,999 | 57 | 16.8% |
| $25,000 to $34,999 | 0 | 0.0% |
| $35,000 to $49,999 | 64 | 18.8% |
| $50,000 to $74,999 | 0 | 0.0% |
| $75,000 to $99,999 | 0 | 0.0% |
| $100,000 to $149,999 | 19 | 5.6% |
| $150,000 to $199,999 | 0 | 0.0% |
| $200,000+ | 18 | 5.3% |
Household Income by Householder Age in Garrochales
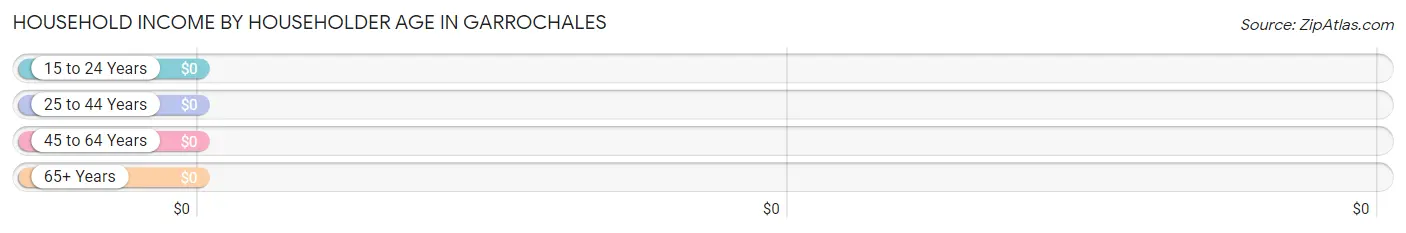
| Income Bracket | # Households | Median Income |
| 15 to 24 Years | 0 (0.0%) | $0 |
| 25 to 44 Years | 23 (6.8%) | $0 |
| 45 to 64 Years | 110 (32.4%) | $0 |
| 65+ Years | 207 (60.9%) | $0 |
| Total | 340 (100.0%) | $13,000 |
Poverty in Garrochales
Income Below Poverty by Sex and Age in Garrochales
With 43.6% poverty level for males and 38.0% for females among the residents of Garrochales, 45 to 54 year old males and 45 to 54 year old females are the most vulnerable to poverty, with 35 males (100.0%) and 77 females (100.0%) in their respective age groups living below the poverty level.
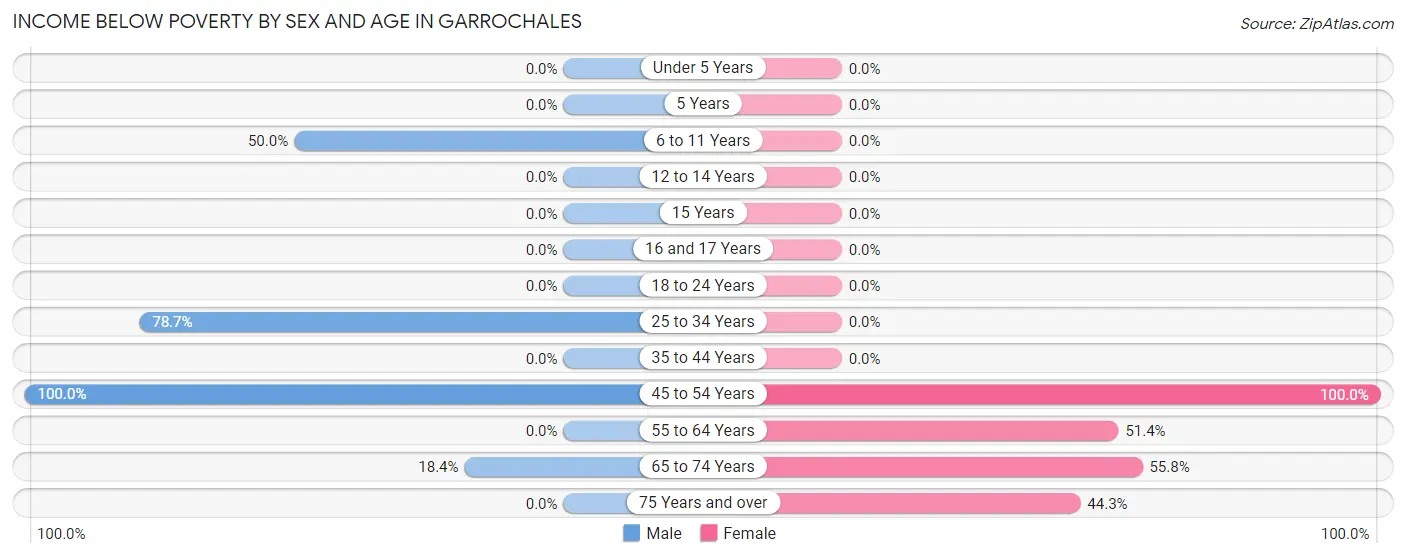
| Age Bracket | Male | Female |
| Under 5 Years | 0 (0.0%) | 0 (0.0%) |
| 5 Years | 0 (0.0%) | 0 (0.0%) |
| 6 to 11 Years | 28 (50.0%) | 0 (0.0%) |
| 12 to 14 Years | 0 (0.0%) | 0 (0.0%) |
| 15 Years | 0 (0.0%) | 0 (0.0%) |
| 16 and 17 Years | 0 (0.0%) | 0 (0.0%) |
| 18 to 24 Years | 0 (0.0%) | 0 (0.0%) |
| 25 to 34 Years | 85 (78.7%) | 0 (0.0%) |
| 35 to 44 Years | 0 (0.0%) | 0 (0.0%) |
| 45 to 54 Years | 35 (100.0%) | 77 (100.0%) |
| 55 to 64 Years | 0 (0.0%) | 19 (51.3%) |
| 65 to 74 Years | 25 (18.4%) | 24 (55.8%) |
| 75 Years and over | 0 (0.0%) | 62 (44.3%) |
| Total | 173 (43.6%) | 182 (38.0%) |
Income Above Poverty by Sex and Age in Garrochales
According to the poverty statistics in Garrochales, males aged under 5 years and females aged under 5 years are the age groups that are most secure financially, with 100.0% of males and 100.0% of females in these age groups living above the poverty line.
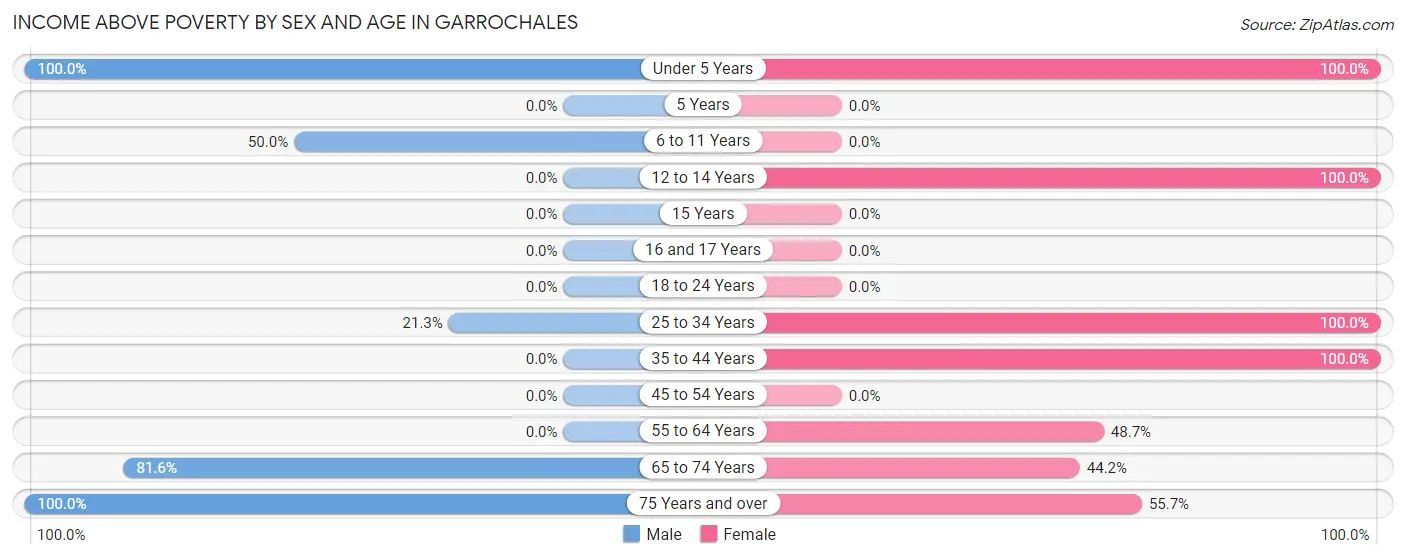
| Age Bracket | Male | Female |
| Under 5 Years | 26 (100.0%) | 21 (100.0%) |
| 5 Years | 0 (0.0%) | 0 (0.0%) |
| 6 to 11 Years | 28 (50.0%) | 0 (0.0%) |
| 12 to 14 Years | 0 (0.0%) | 27 (100.0%) |
| 15 Years | 0 (0.0%) | 0 (0.0%) |
| 16 and 17 Years | 0 (0.0%) | 0 (0.0%) |
| 18 to 24 Years | 0 (0.0%) | 0 (0.0%) |
| 25 to 34 Years | 23 (21.3%) | 82 (100.0%) |
| 35 to 44 Years | 0 (0.0%) | 52 (100.0%) |
| 45 to 54 Years | 0 (0.0%) | 0 (0.0%) |
| 55 to 64 Years | 0 (0.0%) | 18 (48.6%) |
| 65 to 74 Years | 111 (81.6%) | 19 (44.2%) |
| 75 Years and over | 36 (100.0%) | 78 (55.7%) |
| Total | 224 (56.4%) | 297 (62.0%) |
Income Below Poverty Among Married-Couple Families in Garrochales
The poverty statistics for married-couple families in Garrochales show that 13.5% or 15 of the total 111 families live below the poverty line. Families with no children have the highest poverty rate of 21.7%, comprising of 15 families. On the other hand, families with 1 or 2 children have the lowest poverty rate of 0.0%, which includes 0 families.
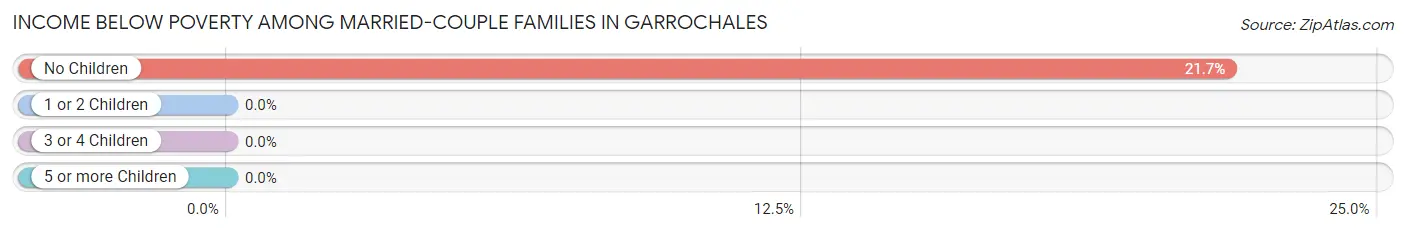
| Children | Above Poverty | Below Poverty |
| No Children | 54 (78.3%) | 15 (21.7%) |
| 1 or 2 Children | 42 (100.0%) | 0 (0.0%) |
| 3 or 4 Children | 0 (0.0%) | 0 (0.0%) |
| 5 or more Children | 0 (0.0%) | 0 (0.0%) |
| Total | 96 (86.5%) | 15 (13.5%) |
Income Below Poverty Among Single-Parent Households in Garrochales
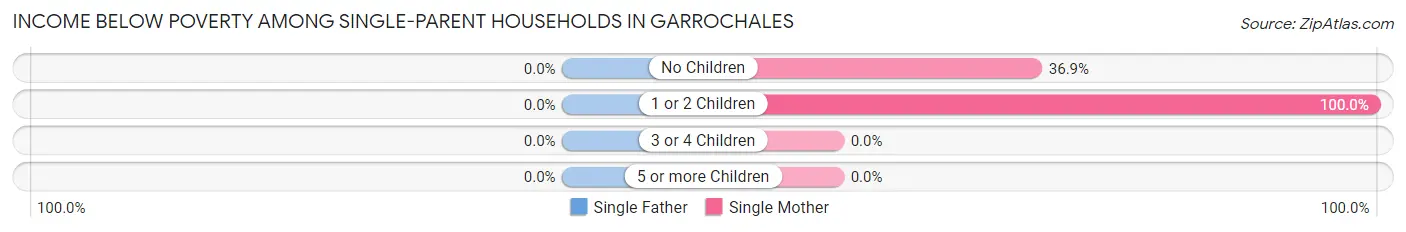
| Children | Single Father | Single Mother |
| No Children | 0 (0.0%) | 24 (36.9%) |
| 1 or 2 Children | 0 (0.0%) | 19 (100.0%) |
| 3 or 4 Children | 0 (0.0%) | 0 (0.0%) |
| 5 or more Children | 0 (0.0%) | 0 (0.0%) |
| Total | 0 (0.0%) | 43 (51.2%) |
Income Below Poverty Among Married-Couple vs Single-Parent Households in Garrochales
The poverty data for Garrochales shows that 15 of the married-couple family households (13.5%) and 43 of the single-parent households (51.2%) are living below the poverty level. Within the married-couple family households, those with no children have the highest poverty rate, with 15 households (21.7%) falling below the poverty line. Among the single-parent households, those with 1 or 2 children have the highest poverty rate, with 19 household (100.0%) living below poverty.
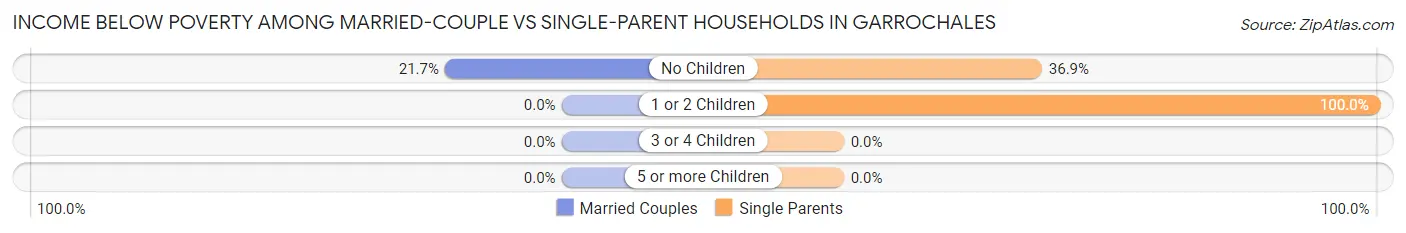
| Children | Married-Couple Families | Single-Parent Households |
| No Children | 15 (21.7%) | 24 (36.9%) |
| 1 or 2 Children | 0 (0.0%) | 19 (100.0%) |
| 3 or 4 Children | 0 (0.0%) | 0 (0.0%) |
| 5 or more Children | 0 (0.0%) | 0 (0.0%) |
| Total | 15 (13.5%) | 43 (51.2%) |
Race in Garrochales
The most populous races in Garrochales are Hispanic or Latino (876 | 100.0%), White / Caucasian (311 | 35.5%), and Some other Race (297 | 33.9%).
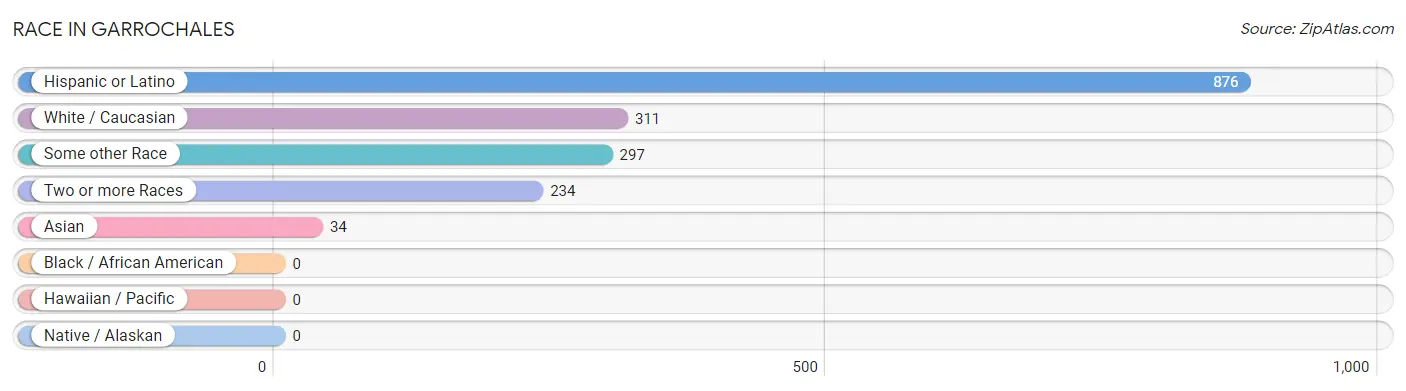
| Race | # Population | % Population |
| Asian | 34 | 3.9% |
| Black / African American | 0 | 0.0% |
| Hawaiian / Pacific | 0 | 0.0% |
| Hispanic or Latino | 876 | 100.0% |
| Native / Alaskan | 0 | 0.0% |
| White / Caucasian | 311 | 35.5% |
| Two or more Races | 234 | 26.7% |
| Some other Race | 297 | 33.9% |
| Total | 876 | 100.0% |
Ancestry in Garrochales
The most populous ancestries reported in Garrochales are Puerto Rican (876 | 100.0%), and Thai (34 | 3.9%), together accounting for 103.9% of all Garrochales residents.
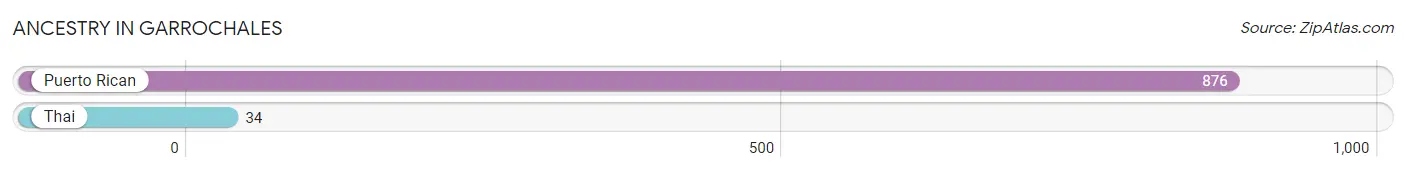
| Ancestry | # Population | % Population |
| Puerto Rican | 876 | 100.0% |
| Thai | 34 | 3.9% | View All 2 Rows |
Immigrants in Garrochales

| Immigration Origin | # Population | % Population | View All 0 Rows |
Sex and Age in Garrochales
Sex and Age in Garrochales
The most populous age groups in Garrochales are 65 to 69 Years (111 | 28.0%) for men and 75 to 79 Years (99 | 20.7%) for women.
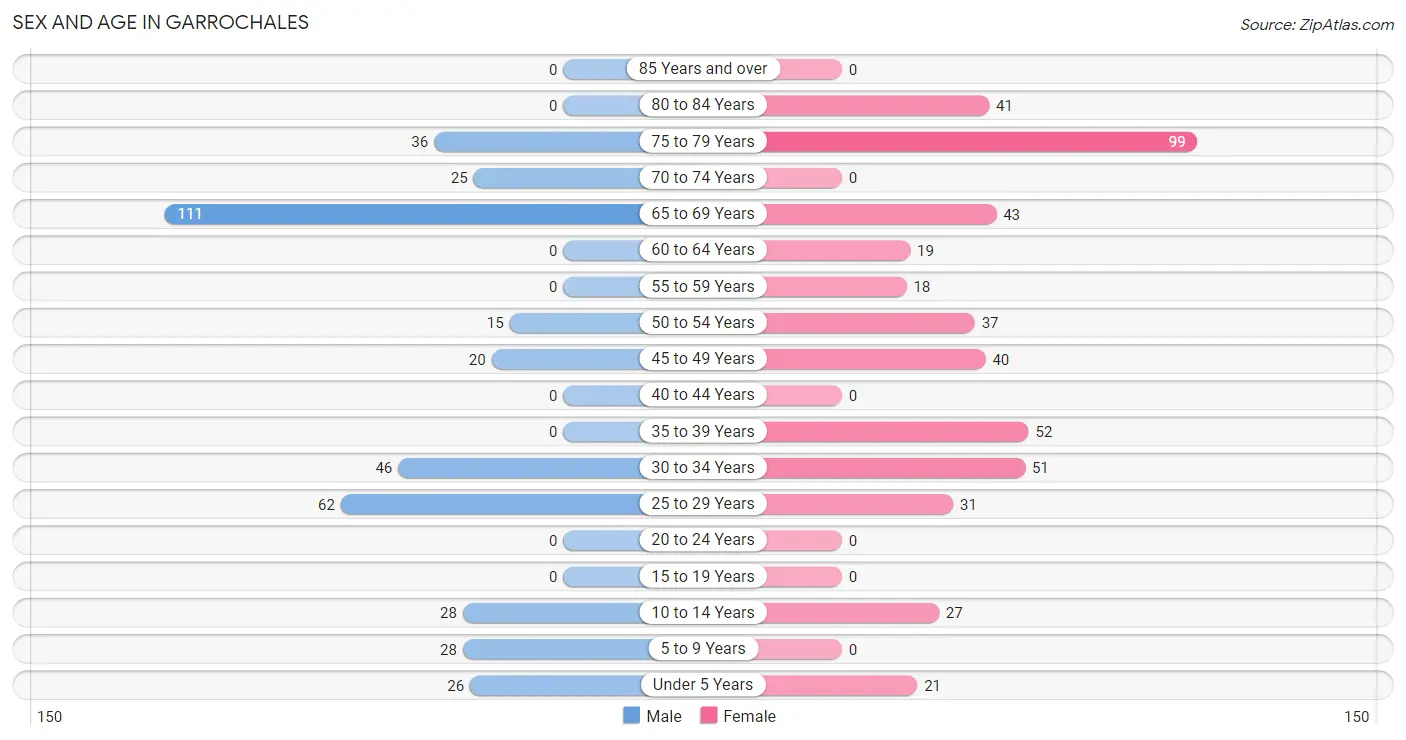
| Age Bracket | Male | Female |
| Under 5 Years | 26 (6.6%) | 21 (4.4%) |
| 5 to 9 Years | 28 (7.0%) | 0 (0.0%) |
| 10 to 14 Years | 28 (7.0%) | 27 (5.6%) |
| 15 to 19 Years | 0 (0.0%) | 0 (0.0%) |
| 20 to 24 Years | 0 (0.0%) | 0 (0.0%) |
| 25 to 29 Years | 62 (15.6%) | 31 (6.5%) |
| 30 to 34 Years | 46 (11.6%) | 51 (10.6%) |
| 35 to 39 Years | 0 (0.0%) | 52 (10.9%) |
| 40 to 44 Years | 0 (0.0%) | 0 (0.0%) |
| 45 to 49 Years | 20 (5.0%) | 40 (8.4%) |
| 50 to 54 Years | 15 (3.8%) | 37 (7.7%) |
| 55 to 59 Years | 0 (0.0%) | 18 (3.8%) |
| 60 to 64 Years | 0 (0.0%) | 19 (4.0%) |
| 65 to 69 Years | 111 (28.0%) | 43 (9.0%) |
| 70 to 74 Years | 25 (6.3%) | 0 (0.0%) |
| 75 to 79 Years | 36 (9.1%) | 99 (20.7%) |
| 80 to 84 Years | 0 (0.0%) | 41 (8.6%) |
| 85 Years and over | 0 (0.0%) | 0 (0.0%) |
| Total | 397 (100.0%) | 479 (100.0%) |
Families and Households in Garrochales
Median Family Size in Garrochales
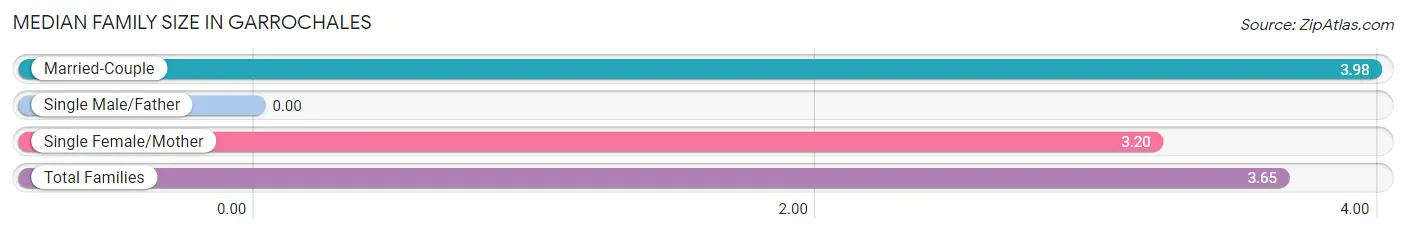
| Family Type | # Families | Family Size |
| Married-Couple | 111 (56.9%) | 3.98 |
| Single Male/Father | 0 (0.0%) | - |
| Single Female/Mother | 84 (43.1%) | 3.20 |
| Total Families | 195 (100.0%) | 3.65 |
Median Household Size in Garrochales
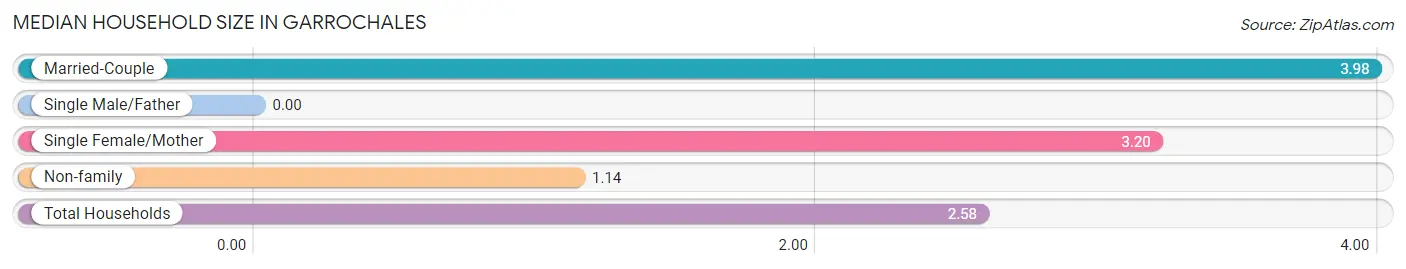
| Household Type | # Households | Household Size |
| Married-Couple | 111 (32.7%) | 3.98 |
| Single Male/Father | 0 (0.0%) | - |
| Single Female/Mother | 84 (24.7%) | 3.20 |
| Non-family | 145 (42.6%) | 1.14 |
| Total Households | 340 (100.0%) | 2.58 |
Household Size by Marriage Status in Garrochales
Out of a total of 340 households in Garrochales, 195 (57.4%) are family households, while 145 (42.6%) are nonfamily households. The most numerous type of family households are 2-person households, comprising 116, and the most common type of nonfamily households are 1-person households, comprising 124.
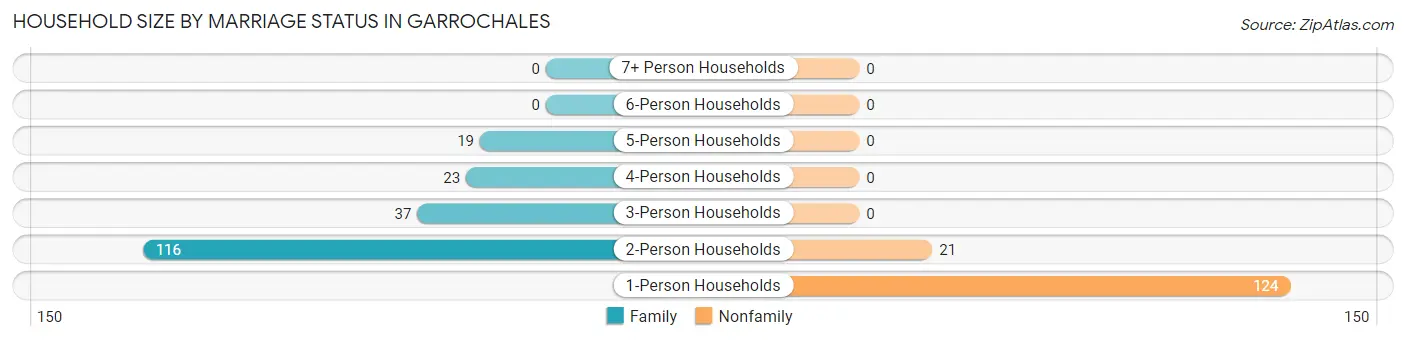
| Household Size | Family Households | Nonfamily Households |
| 1-Person Households | - | 124 (36.5%) |
| 2-Person Households | 116 (34.1%) | 21 (6.2%) |
| 3-Person Households | 37 (10.9%) | 0 (0.0%) |
| 4-Person Households | 23 (6.8%) | 0 (0.0%) |
| 5-Person Households | 19 (5.6%) | 0 (0.0%) |
| 6-Person Households | 0 (0.0%) | 0 (0.0%) |
| 7+ Person Households | 0 (0.0%) | 0 (0.0%) |
| Total | 195 (57.4%) | 145 (42.6%) |
Female Fertility in Garrochales
Fertility by Age in Garrochales
| Age Bracket | Women with Births | Births / 1,000 Women |
| 15 to 19 years | 0 (0.0%) | 0.0 |
| 20 to 34 years | 0 (0.0%) | 0.0 |
| 35 to 50 years | 0 (0.0%) | 0.0 |
| Total | 0 (0.0%) | 0.0 |
Fertility by Age by Marriage Status in Garrochales
| Age Bracket | Married | Unmarried |
| 15 to 19 years | 0 (0.0%) | 0 (0.0%) |
| 20 to 34 years | 0 (0.0%) | 0 (0.0%) |
| 35 to 50 years | 0 (0.0%) | 0 (0.0%) |
| Total | 0 (0.0%) | 0 (0.0%) |
Fertility by Education in Garrochales
| Educational Attainment | Women with Births | Births / 1,000 Women |
| Less than High School | 0 (0.0%) | 0.0 |
| High School Diploma | 0 (0.0%) | 0.0 |
| College or Associate's Degree | 0 (0.0%) | 0.0 |
| Bachelor's Degree | 0 (0.0%) | 0.0 |
| Graduate Degree | 0 (0.0%) | 0.0 |
| Total | 0 (0.0%) | 0.0 |
Fertility by Education by Marriage Status in Garrochales
| Educational Attainment | Married | Unmarried |
| Less than High School | 0 (0.0%) | 0 (0.0%) |
| High School Diploma | 0 (0.0%) | 0 (0.0%) |
| College or Associate's Degree | 0 (0.0%) | 0 (0.0%) |
| Bachelor's Degree | 0 (0.0%) | 0 (0.0%) |
| Graduate Degree | 0 (0.0%) | 0 (0.0%) |
| Total | 0 (0.0%) | 0 (0.0%) |
Employment Characteristics in Garrochales
Employment by Class of Employer in Garrochales
Among the 279 employed individuals in Garrochales, private company employees (158 | 56.6%), state government employees (69 | 24.7%), and local government employees (52 | 18.6%) make up the most common classes of employment.
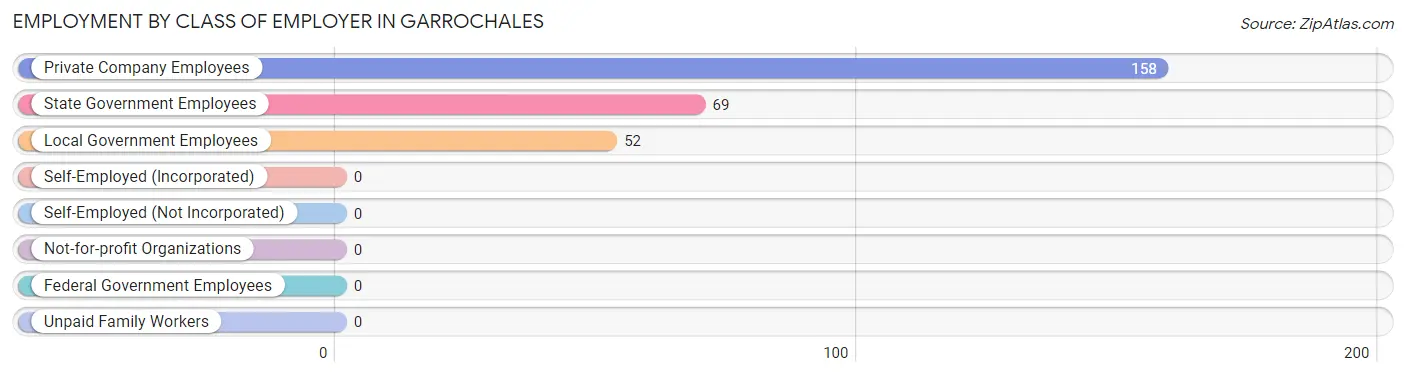
| Employer Class | # Employees | % Employees |
| Private Company Employees | 158 | 56.6% |
| Self-Employed (Incorporated) | 0 | 0.0% |
| Self-Employed (Not Incorporated) | 0 | 0.0% |
| Not-for-profit Organizations | 0 | 0.0% |
| Local Government Employees | 52 | 18.6% |
| State Government Employees | 69 | 24.7% |
| Federal Government Employees | 0 | 0.0% |
| Unpaid Family Workers | 0 | 0.0% |
| Total | 279 | 100.0% |
Employment Status by Age in Garrochales
According to the labor force statistics for Garrochales, out of the total population over 16 years of age (746), 39.9% or 298 individuals are in the labor force, with 6.4% or 19 of them unemployed. The age group with the highest labor force participation rate is 25 to 29 years, with 100.0% or 93 individuals in the labor force. Within the labor force, the 45 to 54 years age range has the highest percentage of unemployed individuals, with 50.0% or 19 of them being unemployed.
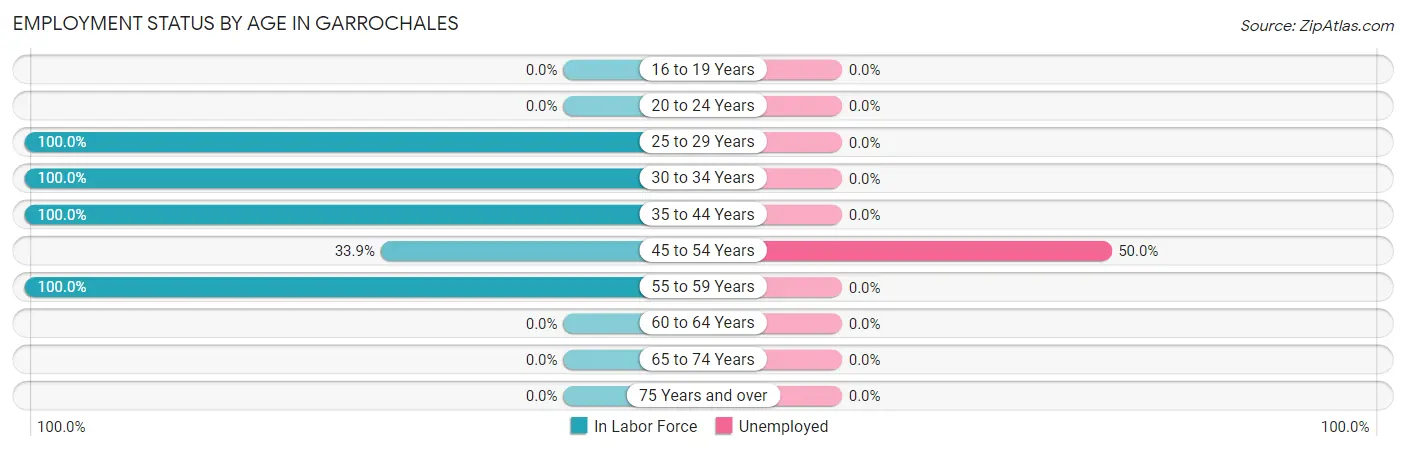
| Age Bracket | In Labor Force | Unemployed |
| 16 to 19 Years | 0 (0.0%) | 0 (0.0%) |
| 20 to 24 Years | 0 (0.0%) | 0 (0.0%) |
| 25 to 29 Years | 93 (100.0%) | 0 (0.0%) |
| 30 to 34 Years | 97 (100.0%) | 0 (0.0%) |
| 35 to 44 Years | 52 (100.0%) | 0 (0.0%) |
| 45 to 54 Years | 38 (33.9%) | 19 (50.0%) |
| 55 to 59 Years | 18 (100.0%) | 0 (0.0%) |
| 60 to 64 Years | 0 (0.0%) | 0 (0.0%) |
| 65 to 74 Years | 0 (0.0%) | 0 (0.0%) |
| 75 Years and over | 0 (0.0%) | 0 (0.0%) |
| Total | 298 (39.9%) | 19 (6.4%) |
Employment Status by Educational Attainment in Garrochales
According to labor force statistics for Garrochales, 76.2% of individuals (298) out of the total population between 25 and 64 years of age (391) are in the labor force, with 6.4% or 19 of them being unemployed. The group with the highest labor force participation rate are those with the educational attainment of bachelor's degree or higher, with 100.0% or 121 individuals in the labor force. Within the labor force, individuals with high school diploma education have the highest percentage of unemployment, with 18.3% or 19 of them being unemployed.
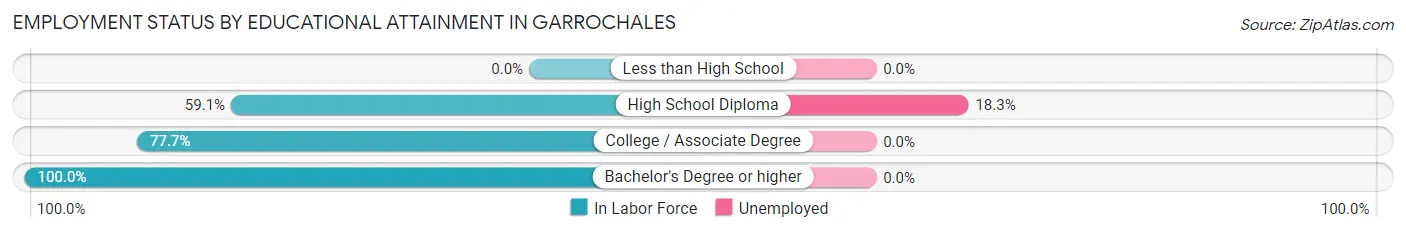
| Educational Attainment | In Labor Force | Unemployed |
| Less than High School | 0 (0.0%) | 0 (0.0%) |
| High School Diploma | 104 (59.1%) | 32 (18.3%) |
| College / Associate Degree | 73 (77.7%) | 0 (0.0%) |
| Bachelor's Degree or higher | 121 (100.0%) | 0 (0.0%) |
| Total | 298 (76.2%) | 25 (6.4%) |
Employment Occupations by Sex in Garrochales
Management, Business, Science and Arts Occupations
The most common Management, Business, Science and Arts occupations in Garrochales are Business & Financial (69 | 24.7%), Community & Social Service (52 | 18.6%), Legal Services & Support (52 | 18.6%), and Health Diagnosing & Treating (23 | 8.2%).
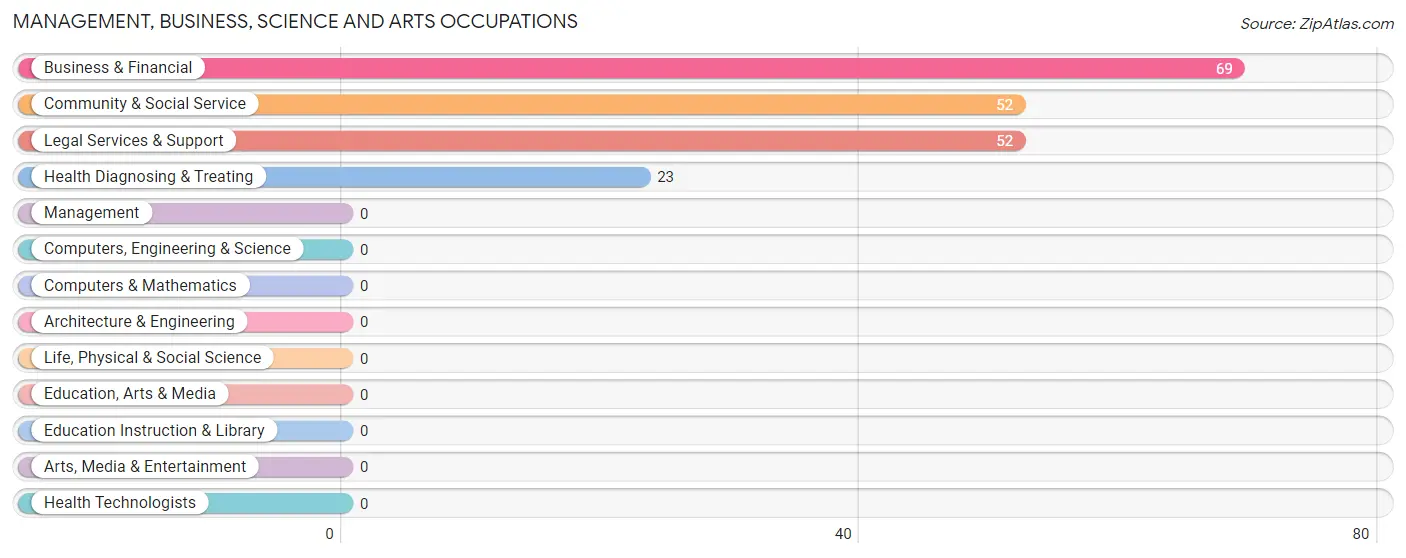
Management, Business, Science and Arts Occupations by Sex
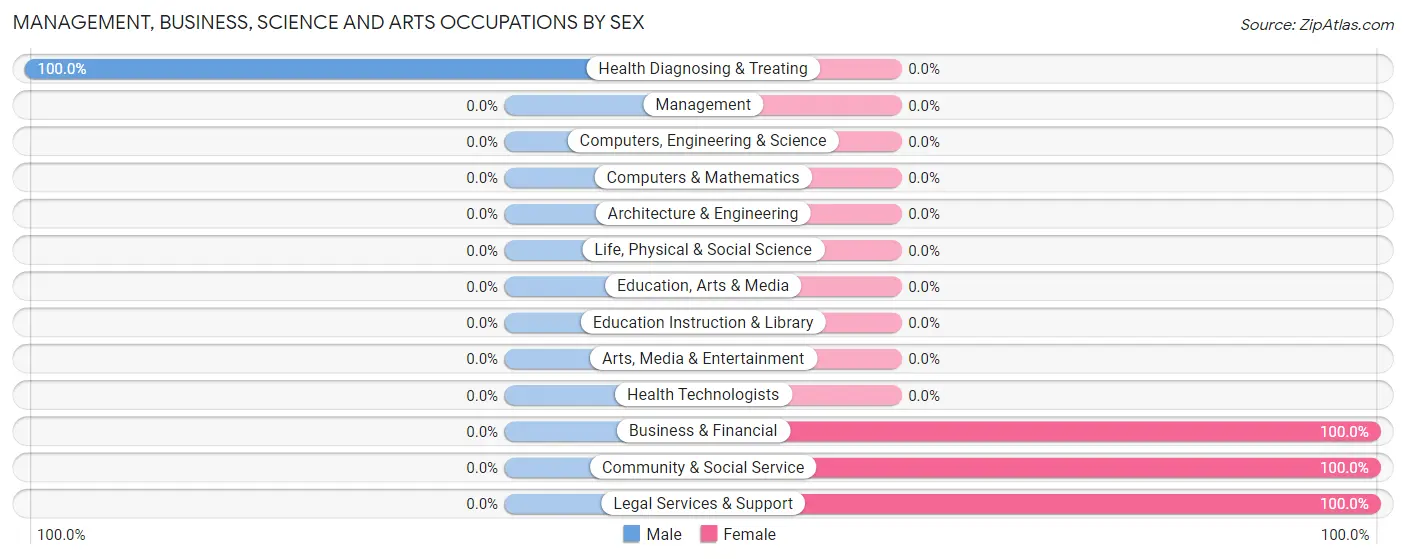
| Occupation | Male | Female |
| Management | 0 (0.0%) | 0 (0.0%) |
| Business & Financial | 0 (0.0%) | 69 (100.0%) |
| Computers, Engineering & Science | 0 (0.0%) | 0 (0.0%) |
| Computers & Mathematics | 0 (0.0%) | 0 (0.0%) |
| Architecture & Engineering | 0 (0.0%) | 0 (0.0%) |
| Life, Physical & Social Science | 0 (0.0%) | 0 (0.0%) |
| Community & Social Service | 0 (0.0%) | 52 (100.0%) |
| Education, Arts & Media | 0 (0.0%) | 0 (0.0%) |
| Legal Services & Support | 0 (0.0%) | 52 (100.0%) |
| Education Instruction & Library | 0 (0.0%) | 0 (0.0%) |
| Arts, Media & Entertainment | 0 (0.0%) | 0 (0.0%) |
| Health Diagnosing & Treating | 23 (100.0%) | 0 (0.0%) |
| Health Technologists | 0 (0.0%) | 0 (0.0%) |
| Total (Category) | 23 (16.0%) | 121 (84.0%) |
| Total (Overall) | 108 (38.7%) | 171 (61.3%) |
Services Occupations
Services Occupations by Sex
| Occupation | Male | Female |
| Healthcare Support | 0 (0.0%) | 0 (0.0%) |
| Security & Protection | 0 (0.0%) | 0 (0.0%) |
| Firefighting & Prevention | 0 (0.0%) | 0 (0.0%) |
| Law Enforcement | 0 (0.0%) | 0 (0.0%) |
| Food Preparation & Serving | 0 (0.0%) | 0 (0.0%) |
| Cleaning & Maintenance | 0 (0.0%) | 0 (0.0%) |
| Personal Care & Service | 0 (0.0%) | 0 (0.0%) |
| Total (Category) | 0 (0.0%) | 0 (0.0%) |
| Total (Overall) | 108 (38.7%) | 171 (61.3%) |
Sales and Office Occupations
The most common Sales and Office occupations in Garrochales are , and Office & Administration (50 | 17.9%).
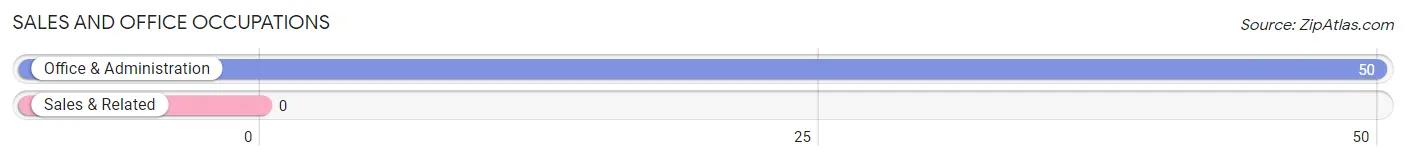
Sales and Office Occupations by Sex
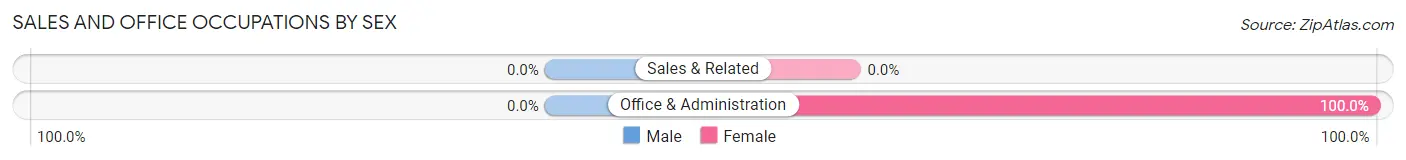
| Occupation | Male | Female |
| Sales & Related | 0 (0.0%) | 0 (0.0%) |
| Office & Administration | 0 (0.0%) | 50 (100.0%) |
| Total (Category) | 0 (0.0%) | 50 (100.0%) |
| Total (Overall) | 108 (38.7%) | 171 (61.3%) |
Natural Resources, Construction and Maintenance Occupations
The most common Natural Resources, Construction and Maintenance occupations in Garrochales are , and Construction & Extraction (46 | 16.5%).
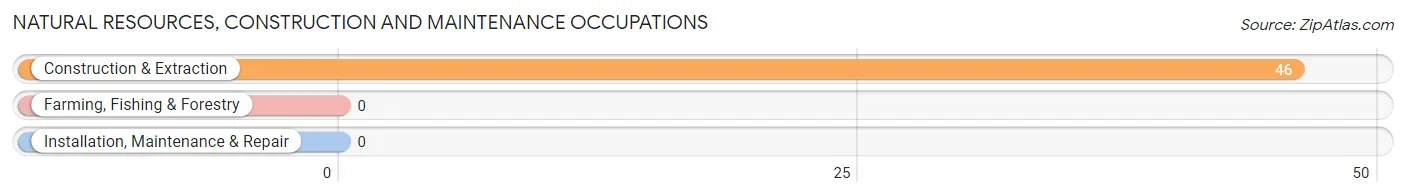
Natural Resources, Construction and Maintenance Occupations by Sex

| Occupation | Male | Female |
| Farming, Fishing & Forestry | 0 (0.0%) | 0 (0.0%) |
| Construction & Extraction | 46 (100.0%) | 0 (0.0%) |
| Installation, Maintenance & Repair | 0 (0.0%) | 0 (0.0%) |
| Total (Category) | 46 (100.0%) | 0 (0.0%) |
| Total (Overall) | 108 (38.7%) | 171 (61.3%) |
Production, Transportation and Moving Occupations
The most common Production, Transportation and Moving occupations in Garrochales are , and Material Moving (39 | 14.0%).
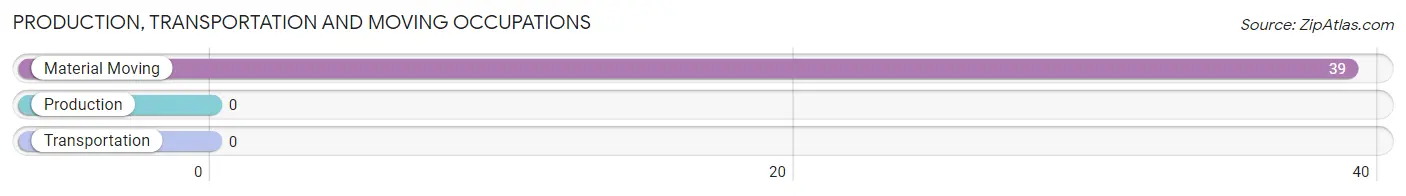
Production, Transportation and Moving Occupations by Sex
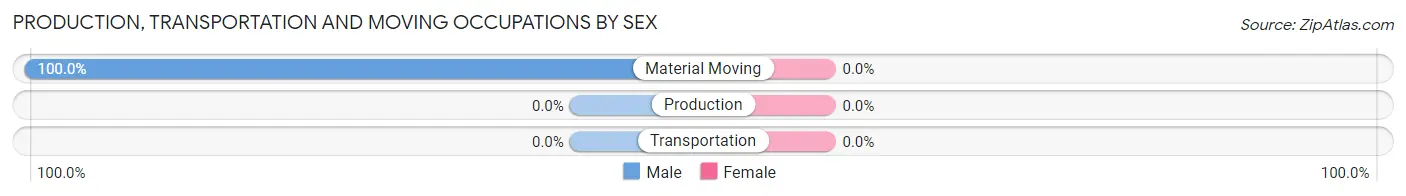
| Occupation | Male | Female |
| Production | 0 (0.0%) | 0 (0.0%) |
| Transportation | 0 (0.0%) | 0 (0.0%) |
| Material Moving | 39 (100.0%) | 0 (0.0%) |
| Total (Category) | 39 (100.0%) | 0 (0.0%) |
| Total (Overall) | 108 (38.7%) | 171 (61.3%) |
Employment Industries by Sex in Garrochales
Employment Industries in Garrochales
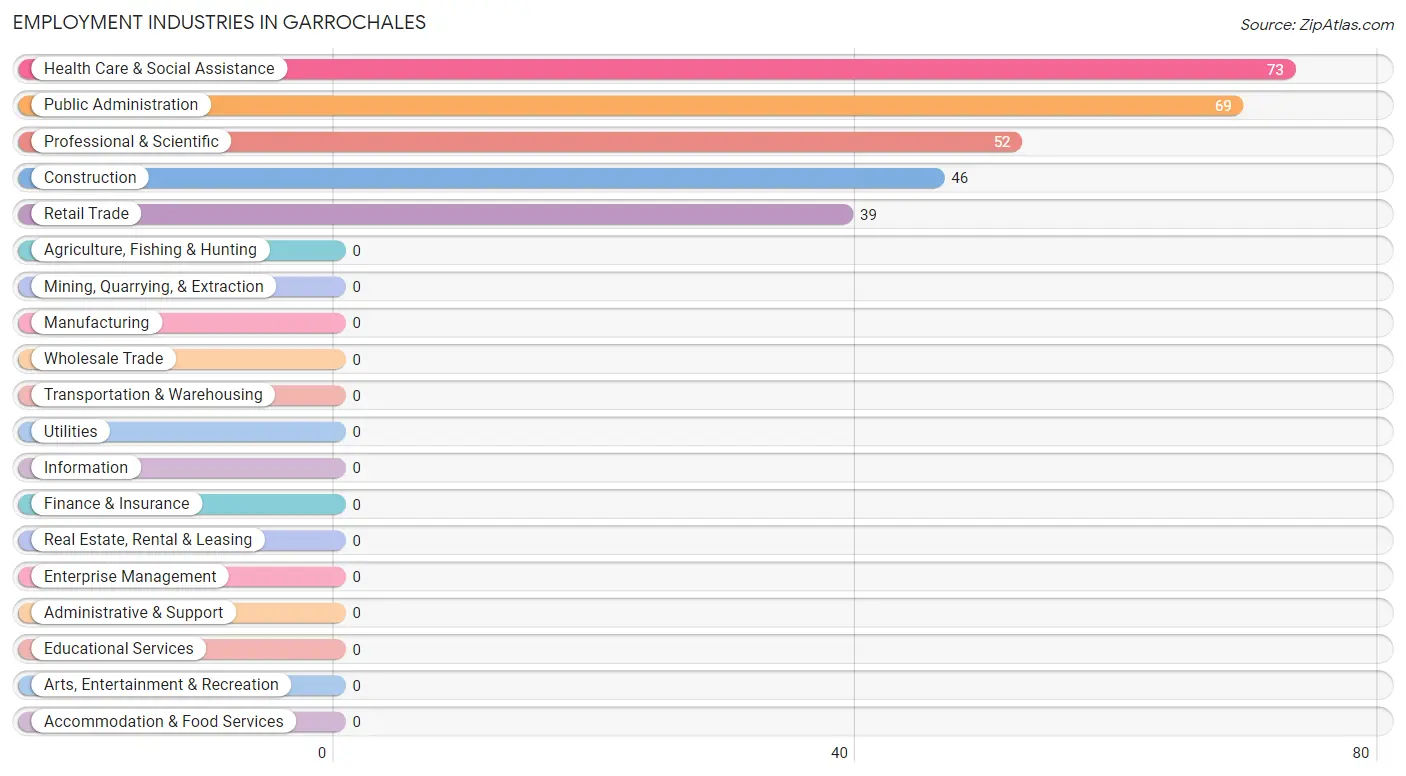
The major employment industries in Garrochales include Health Care & Social Assistance (73 | 26.2%), Public Administration (69 | 24.7%), Professional & Scientific (52 | 18.6%), Construction (46 | 16.5%), and Retail Trade (39 | 14.0%).
Employment Industries by Sex in Garrochales
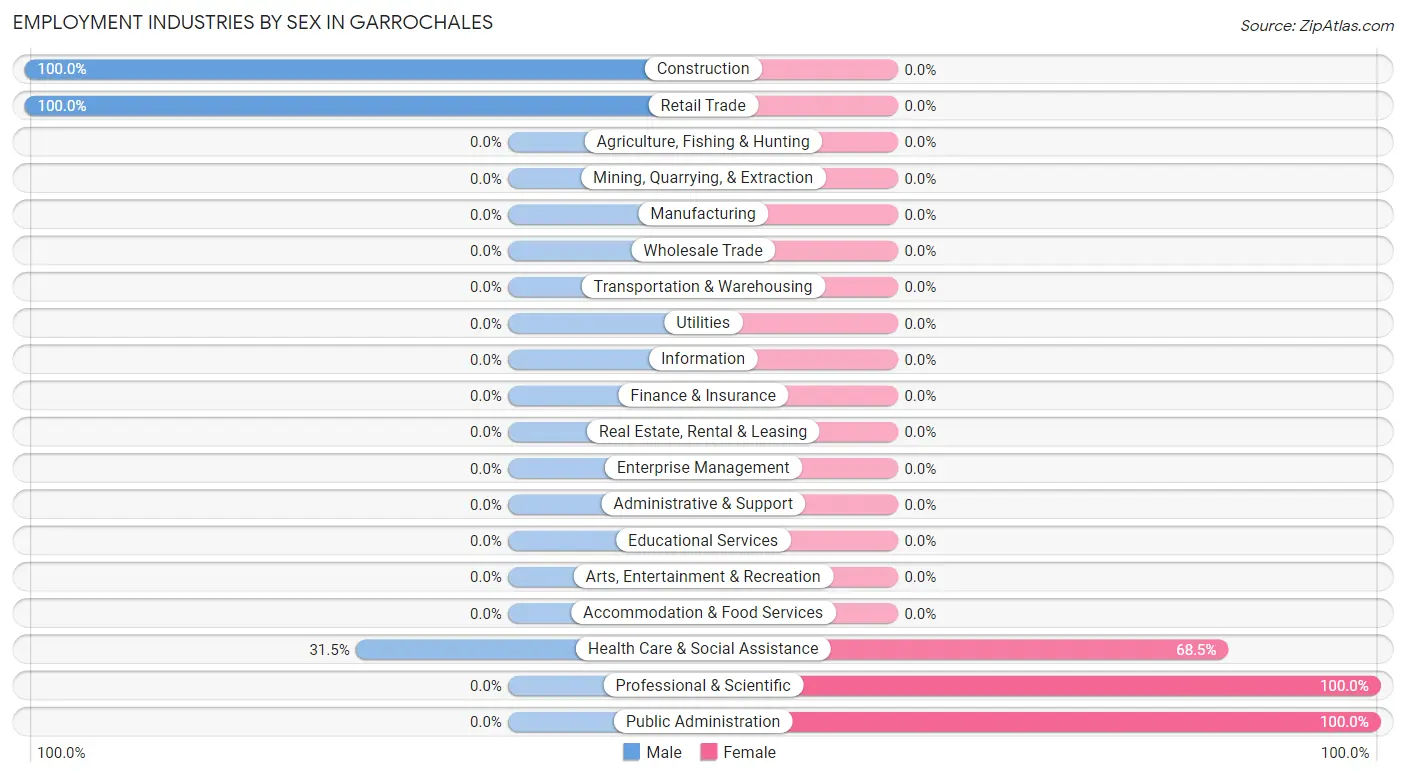
The Garrochales industries that see more men than women are Construction (100.0%), Retail Trade (100.0%), and Health Care & Social Assistance (31.5%), whereas the industries that tend to have a higher number of women are Professional & Scientific (100.0%), Public Administration (100.0%), and Health Care & Social Assistance (68.5%).
| Industry | Male | Female |
| Agriculture, Fishing & Hunting | 0 (0.0%) | 0 (0.0%) |
| Mining, Quarrying, & Extraction | 0 (0.0%) | 0 (0.0%) |
| Construction | 46 (100.0%) | 0 (0.0%) |
| Manufacturing | 0 (0.0%) | 0 (0.0%) |
| Wholesale Trade | 0 (0.0%) | 0 (0.0%) |
| Retail Trade | 39 (100.0%) | 0 (0.0%) |
| Transportation & Warehousing | 0 (0.0%) | 0 (0.0%) |
| Utilities | 0 (0.0%) | 0 (0.0%) |
| Information | 0 (0.0%) | 0 (0.0%) |
| Finance & Insurance | 0 (0.0%) | 0 (0.0%) |
| Real Estate, Rental & Leasing | 0 (0.0%) | 0 (0.0%) |
| Professional & Scientific | 0 (0.0%) | 52 (100.0%) |
| Enterprise Management | 0 (0.0%) | 0 (0.0%) |
| Administrative & Support | 0 (0.0%) | 0 (0.0%) |
| Educational Services | 0 (0.0%) | 0 (0.0%) |
| Health Care & Social Assistance | 23 (31.5%) | 50 (68.5%) |
| Arts, Entertainment & Recreation | 0 (0.0%) | 0 (0.0%) |
| Accommodation & Food Services | 0 (0.0%) | 0 (0.0%) |
| Public Administration | 0 (0.0%) | 69 (100.0%) |
| Total | 108 (38.7%) | 171 (61.3%) |
Education in Garrochales
School Enrollment in Garrochales
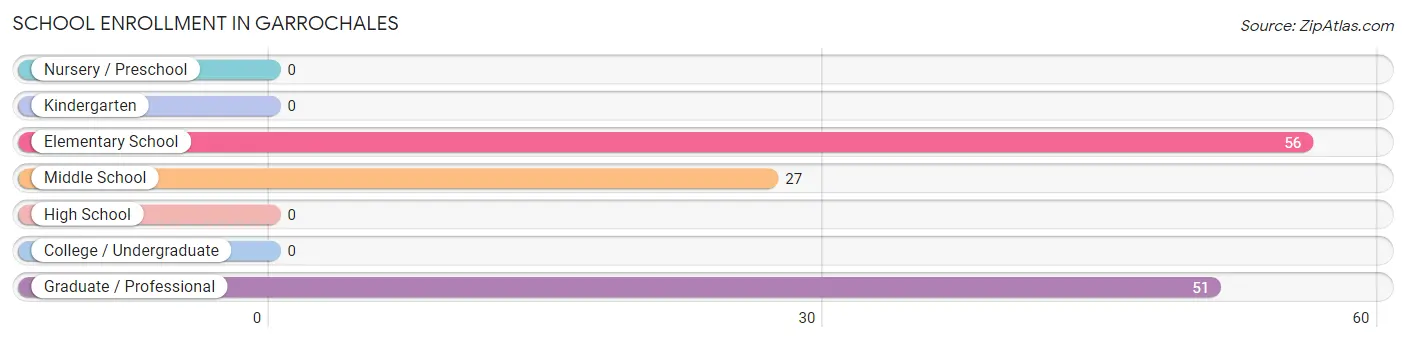
The most common levels of schooling among the 134 students in Garrochales are elementary school (56 | 41.8%), graduate / professional (51 | 38.1%), and middle school (27 | 20.2%).
| School Level | # Students | % Students |
| Nursery / Preschool | 0 | 0.0% |
| Kindergarten | 0 | 0.0% |
| Elementary School | 56 | 41.8% |
| Middle School | 27 | 20.2% |
| High School | 0 | 0.0% |
| College / Undergraduate | 0 | 0.0% |
| Graduate / Professional | 51 | 38.1% |
| Total | 134 | 100.0% |
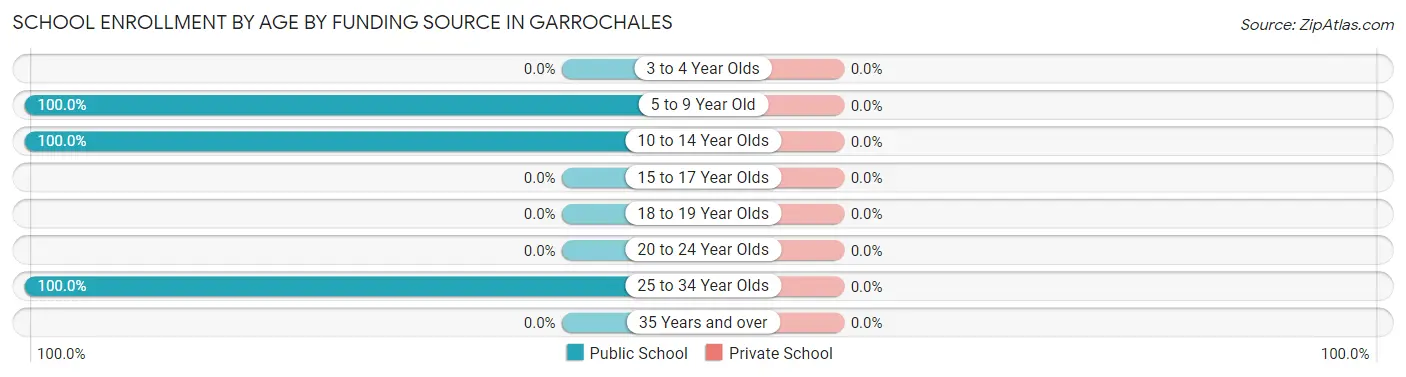
School Enrollment by Age by Funding Source in Garrochales
| Age Bracket | Public School | Private School |
| 3 to 4 Year Olds | 0 (0.0%) | 0 (0.0%) |
| 5 to 9 Year Old | 28 (100.0%) | 0 (0.0%) |
| 10 to 14 Year Olds | 55 (100.0%) | 0 (0.0%) |
| 15 to 17 Year Olds | 0 (0.0%) | 0 (0.0%) |
| 18 to 19 Year Olds | 0 (0.0%) | 0 (0.0%) |
| 20 to 24 Year Olds | 0 (0.0%) | 0 (0.0%) |
| 25 to 34 Year Olds | 51 (100.0%) | 0 (0.0%) |
| 35 Years and over | 0 (0.0%) | 0 (0.0%) |
| Total | 134 (100.0%) | 0 (0.0%) |
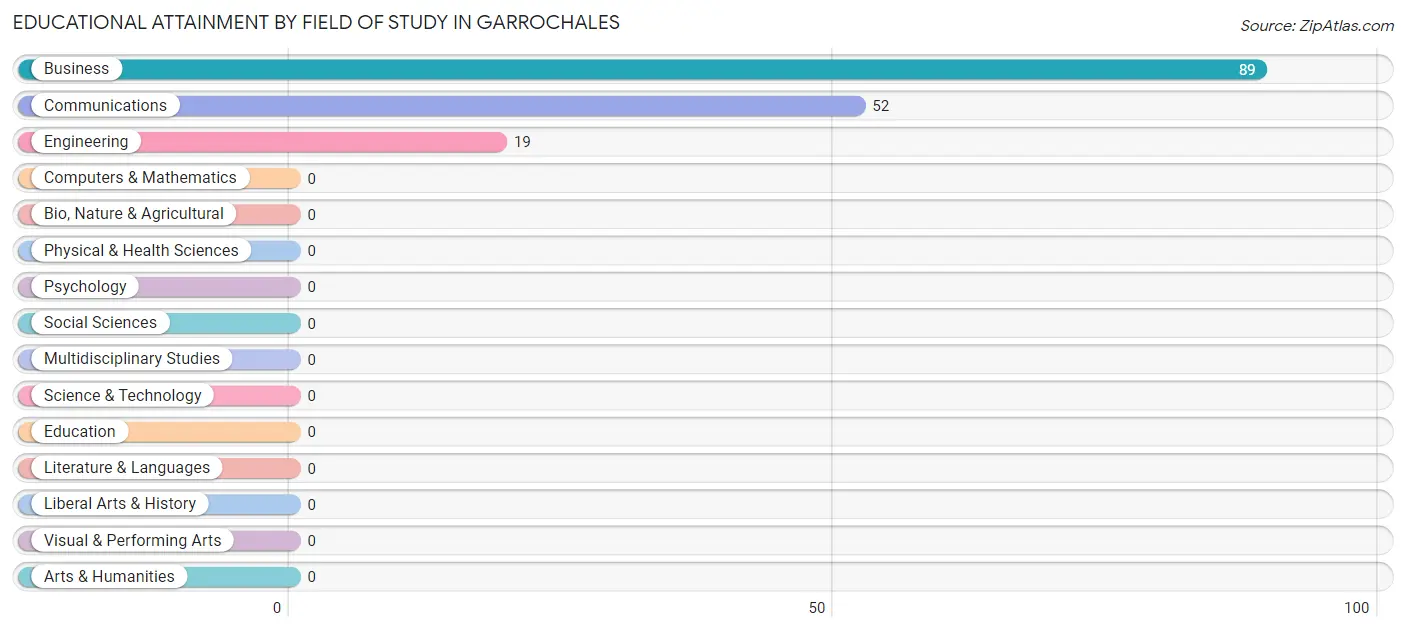
Educational Attainment by Field of Study in Garrochales
Business (89 | 55.6%), communications (52 | 32.5%), and engineering (19 | 11.9%) are the most common fields of study among 160 individuals in Garrochales who have obtained a bachelor's degree or higher.
| Field of Study | # Graduates | % Graduates |
| Computers & Mathematics | 0 | 0.0% |
| Bio, Nature & Agricultural | 0 | 0.0% |
| Physical & Health Sciences | 0 | 0.0% |
| Psychology | 0 | 0.0% |
| Social Sciences | 0 | 0.0% |
| Engineering | 19 | 11.9% |
| Multidisciplinary Studies | 0 | 0.0% |
| Science & Technology | 0 | 0.0% |
| Business | 89 | 55.6% |
| Education | 0 | 0.0% |
| Literature & Languages | 0 | 0.0% |
| Liberal Arts & History | 0 | 0.0% |
| Visual & Performing Arts | 0 | 0.0% |
| Communications | 52 | 32.5% |
| Arts & Humanities | 0 | 0.0% |
| Total | 160 | 100.0% |
Transportation & Commute in Garrochales
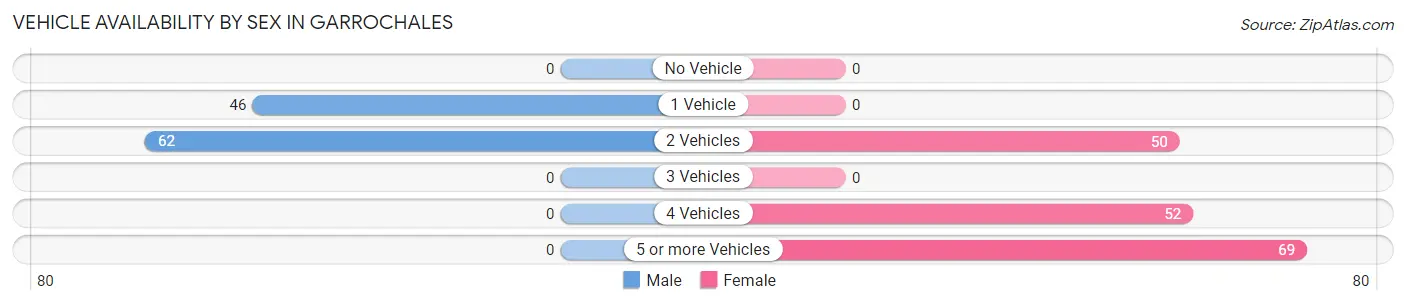
Vehicle Availability by Sex in Garrochales
The most prevalent vehicle ownership categories in Garrochales are males with 2 vehicles (62, accounting for 57.4%) and females with 2 vehicles (50, making up 36.3%).
| Vehicles Available | Male | Female |
| No Vehicle | 0 (0.0%) | 0 (0.0%) |
| 1 Vehicle | 46 (42.6%) | 0 (0.0%) |
| 2 Vehicles | 62 (57.4%) | 50 (29.2%) |
| 3 Vehicles | 0 (0.0%) | 0 (0.0%) |
| 4 Vehicles | 0 (0.0%) | 52 (30.4%) |
| 5 or more Vehicles | 0 (0.0%) | 69 (40.4%) |
| Total | 108 (100.0%) | 171 (100.0%) |
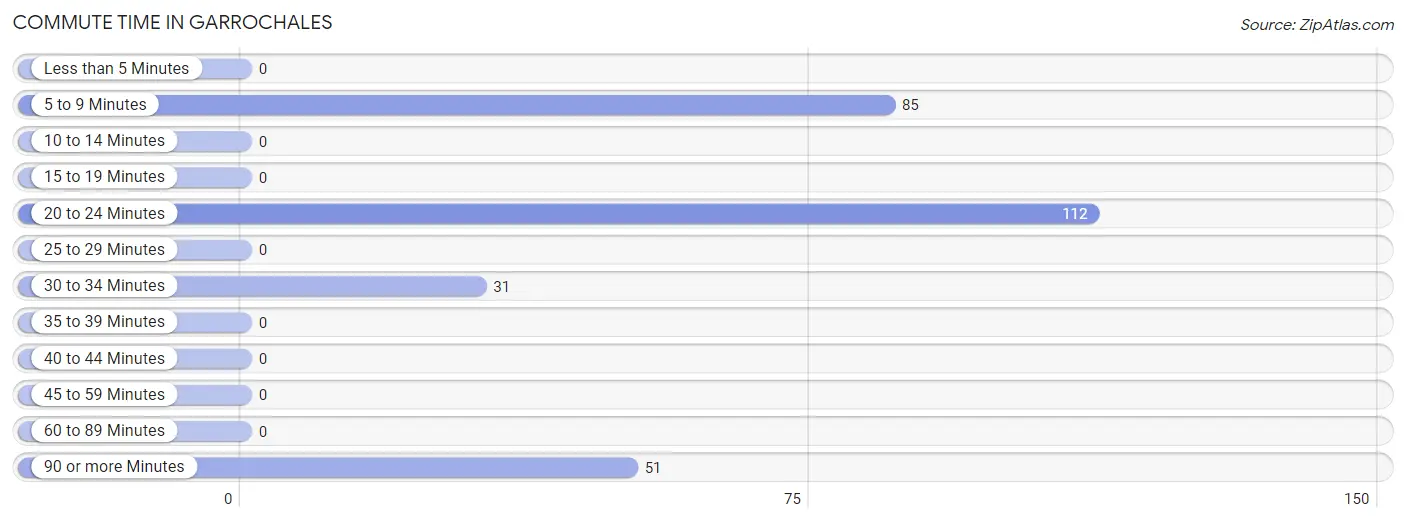
Commute Time in Garrochales
The most frequently occuring commute durations in Garrochales are 20 to 24 minutes (112 commuters, 40.1%), 5 to 9 minutes (85 commuters, 30.5%), and 90 or more minutes (51 commuters, 18.3%).
| Commute Time | # Commuters | % Commuters |
| Less than 5 Minutes | 0 | 0.0% |
| 5 to 9 Minutes | 85 | 30.5% |
| 10 to 14 Minutes | 0 | 0.0% |
| 15 to 19 Minutes | 0 | 0.0% |
| 20 to 24 Minutes | 112 | 40.1% |
| 25 to 29 Minutes | 0 | 0.0% |
| 30 to 34 Minutes | 31 | 11.1% |
| 35 to 39 Minutes | 0 | 0.0% |
| 40 to 44 Minutes | 0 | 0.0% |
| 45 to 59 Minutes | 0 | 0.0% |
| 60 to 89 Minutes | 0 | 0.0% |
| 90 or more Minutes | 51 | 18.3% |
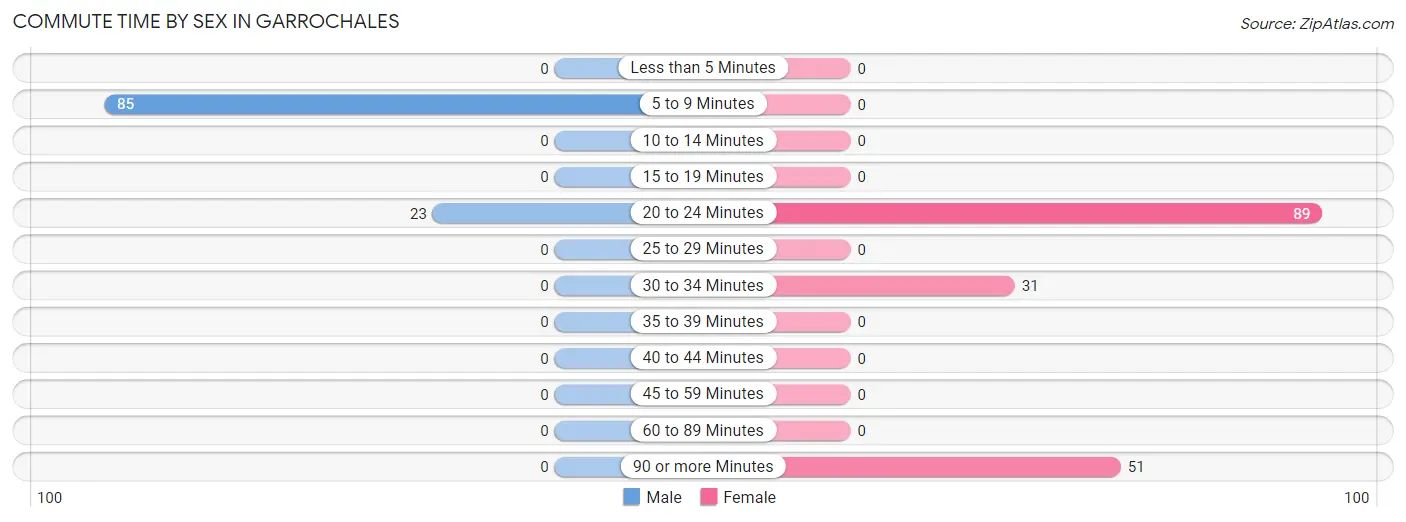
Commute Time by Sex in Garrochales
The most common commute times in Garrochales are 5 to 9 minutes (85 commuters, 78.7%) for males and 20 to 24 minutes (89 commuters, 52.0%) for females.
| Commute Time | Male | Female |
| Less than 5 Minutes | 0 (0.0%) | 0 (0.0%) |
| 5 to 9 Minutes | 85 (78.7%) | 0 (0.0%) |
| 10 to 14 Minutes | 0 (0.0%) | 0 (0.0%) |
| 15 to 19 Minutes | 0 (0.0%) | 0 (0.0%) |
| 20 to 24 Minutes | 23 (21.3%) | 89 (52.0%) |
| 25 to 29 Minutes | 0 (0.0%) | 0 (0.0%) |
| 30 to 34 Minutes | 0 (0.0%) | 31 (18.1%) |
| 35 to 39 Minutes | 0 (0.0%) | 0 (0.0%) |
| 40 to 44 Minutes | 0 (0.0%) | 0 (0.0%) |
| 45 to 59 Minutes | 0 (0.0%) | 0 (0.0%) |
| 60 to 89 Minutes | 0 (0.0%) | 0 (0.0%) |
| 90 or more Minutes | 0 (0.0%) | 51 (29.8%) |
Time of Departure to Work by Sex in Garrochales
The most frequent times of departure to work in Garrochales are 7:30 AM to 7:59 AM (46, 42.6%) for males and 8:00 AM to 8:29 AM (52, 30.4%) for females.

| Time of Departure | Male | Female |
| 12:00 AM to 4:59 AM | 23 (21.3%) | 0 (0.0%) |
| 5:00 AM to 5:29 AM | 0 (0.0%) | 0 (0.0%) |
| 5:30 AM to 5:59 AM | 0 (0.0%) | 51 (29.8%) |
| 6:00 AM to 6:29 AM | 0 (0.0%) | 31 (18.1%) |
| 6:30 AM to 6:59 AM | 0 (0.0%) | 18 (10.5%) |
| 7:00 AM to 7:29 AM | 0 (0.0%) | 19 (11.1%) |
| 7:30 AM to 7:59 AM | 46 (42.6%) | 0 (0.0%) |
| 8:00 AM to 8:29 AM | 0 (0.0%) | 52 (30.4%) |
| 8:30 AM to 8:59 AM | 0 (0.0%) | 0 (0.0%) |
| 9:00 AM to 9:59 AM | 0 (0.0%) | 0 (0.0%) |
| 10:00 AM to 10:59 AM | 0 (0.0%) | 0 (0.0%) |
| 11:00 AM to 11:59 AM | 39 (36.1%) | 0 (0.0%) |
| 12:00 PM to 3:59 PM | 0 (0.0%) | 0 (0.0%) |
| 4:00 PM to 11:59 PM | 0 (0.0%) | 0 (0.0%) |
| Total | 108 (100.0%) | 171 (100.0%) |
Housing Occupancy in Garrochales
Occupancy by Ownership in Garrochales
Of the total 340 dwellings in Garrochales, owner-occupied units account for 292 (85.9%), while renter-occupied units make up 48 (14.1%).
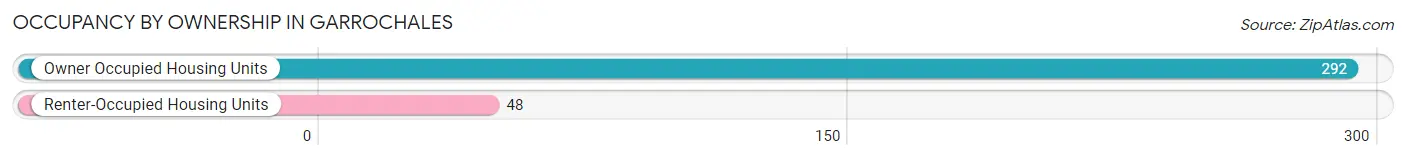
| Occupancy | # Housing Units | % Housing Units |
| Owner Occupied Housing Units | 292 | 85.9% |
| Renter-Occupied Housing Units | 48 | 14.1% |
| Total Occupied Housing Units | 340 | 100.0% |
Occupancy by Household Size in Garrochales
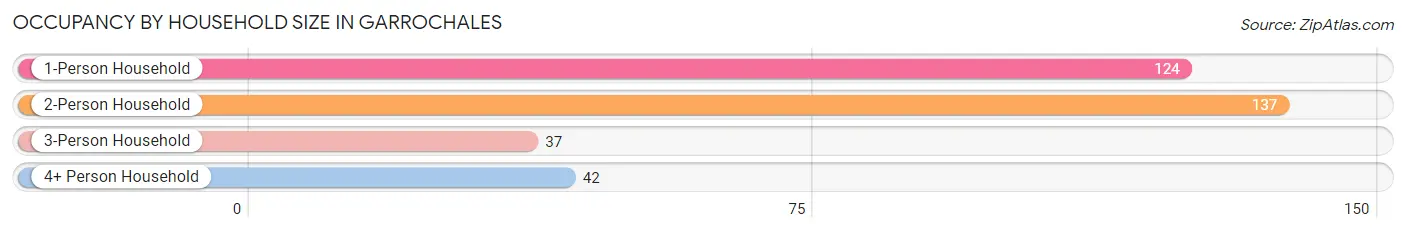
| Household Size | # Housing Units | % Housing Units |
| 1-Person Household | 124 | 36.5% |
| 2-Person Household | 137 | 40.3% |
| 3-Person Household | 37 | 10.9% |
| 4+ Person Household | 42 | 12.3% |
| Total Housing Units | 340 | 100.0% |
Occupancy by Ownership by Household Size in Garrochales
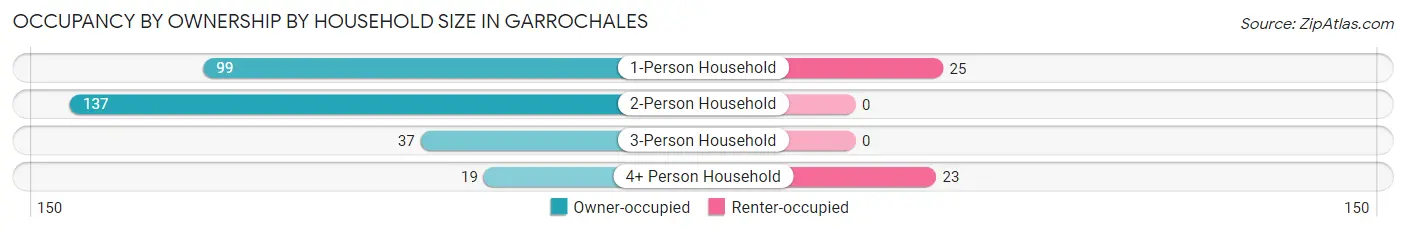
| Household Size | Owner-occupied | Renter-occupied |
| 1-Person Household | 99 (79.8%) | 25 (20.2%) |
| 2-Person Household | 137 (100.0%) | 0 (0.0%) |
| 3-Person Household | 37 (100.0%) | 0 (0.0%) |
| 4+ Person Household | 19 (45.2%) | 23 (54.8%) |
| Total Housing Units | 292 (85.9%) | 48 (14.1%) |
Occupancy by Educational Attainment in Garrochales
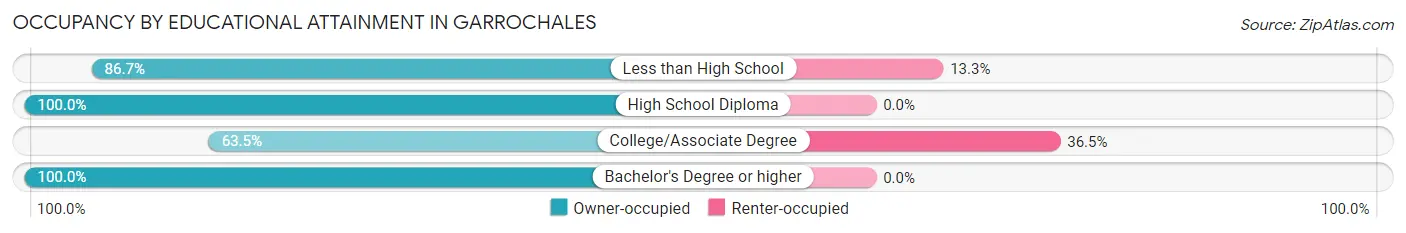
| Household Size | Owner-occupied | Renter-occupied |
| Less than High School | 163 (86.7%) | 25 (13.3%) |
| High School Diploma | 71 (100.0%) | 0 (0.0%) |
| College/Associate Degree | 40 (63.5%) | 23 (36.5%) |
| Bachelor's Degree or higher | 18 (100.0%) | 0 (0.0%) |
Occupancy by Age of Householder in Garrochales
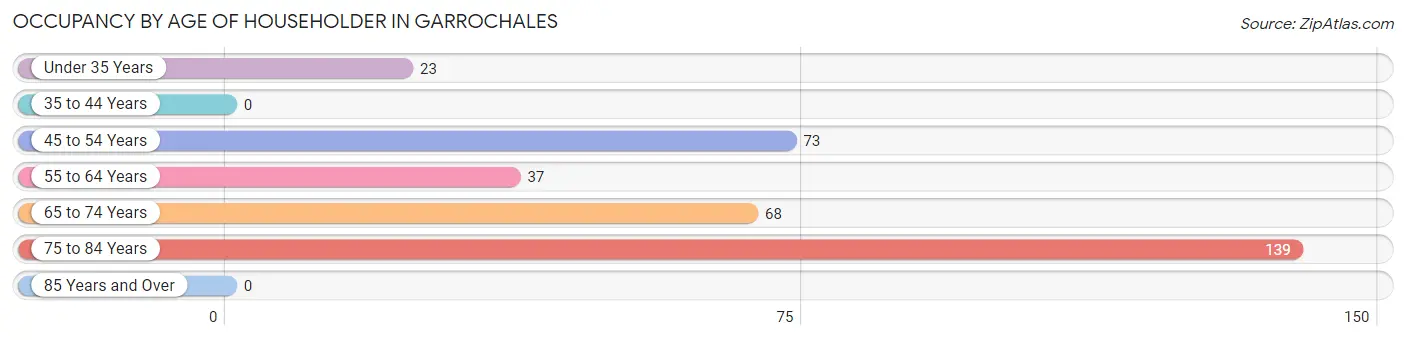
| Age Bracket | # Households | % Households |
| Under 35 Years | 23 | 6.8% |
| 35 to 44 Years | 0 | 0.0% |
| 45 to 54 Years | 73 | 21.5% |
| 55 to 64 Years | 37 | 10.9% |
| 65 to 74 Years | 68 | 20.0% |
| 75 to 84 Years | 139 | 40.9% |
| 85 Years and Over | 0 | 0.0% |
| Total | 340 | 100.0% |
Housing Finances in Garrochales
Median Income by Occupancy in Garrochales
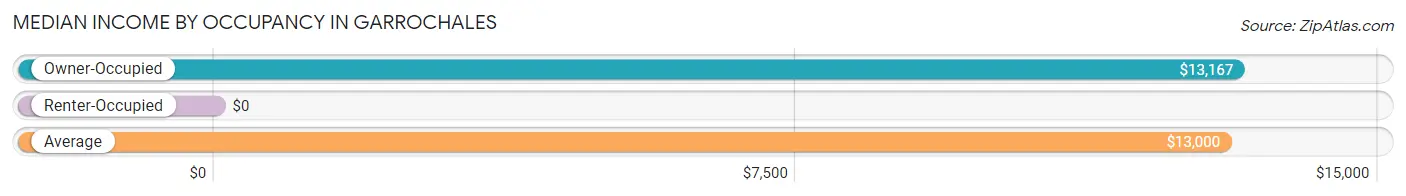
| Occupancy Type | # Households | Median Income |
| Owner-Occupied | 292 (85.9%) | $13,167 |
| Renter-Occupied | 48 (14.1%) | $0 |
| Average | 340 (100.0%) | $13,000 |
Occupancy by Householder Income Bracket in Garrochales
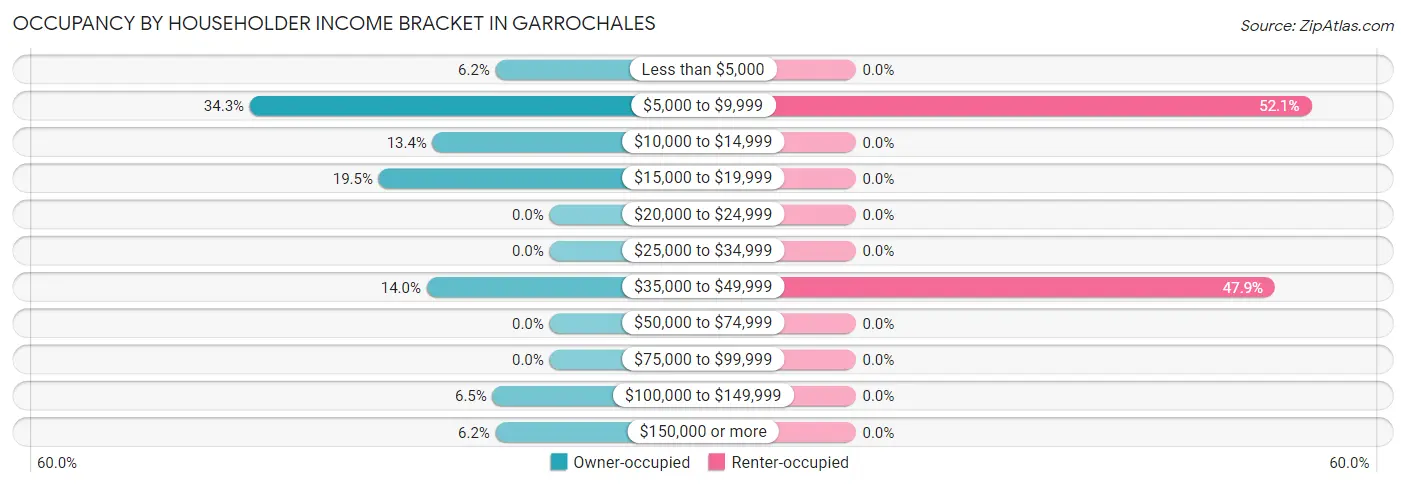
| Income Bracket | Owner-occupied | Renter-occupied |
| Less than $5,000 | 18 (6.2%) | 0 (0.0%) |
| $5,000 to $9,999 | 100 (34.3%) | 25 (52.1%) |
| $10,000 to $14,999 | 39 (13.4%) | 0 (0.0%) |
| $15,000 to $19,999 | 57 (19.5%) | 0 (0.0%) |
| $20,000 to $24,999 | 0 (0.0%) | 0 (0.0%) |
| $25,000 to $34,999 | 0 (0.0%) | 0 (0.0%) |
| $35,000 to $49,999 | 41 (14.0%) | 23 (47.9%) |
| $50,000 to $74,999 | 0 (0.0%) | 0 (0.0%) |
| $75,000 to $99,999 | 0 (0.0%) | 0 (0.0%) |
| $100,000 to $149,999 | 19 (6.5%) | 0 (0.0%) |
| $150,000 or more | 18 (6.2%) | 0 (0.0%) |
| Total | 292 (100.0%) | 48 (100.0%) |
Monthly Housing Cost Tiers in Garrochales
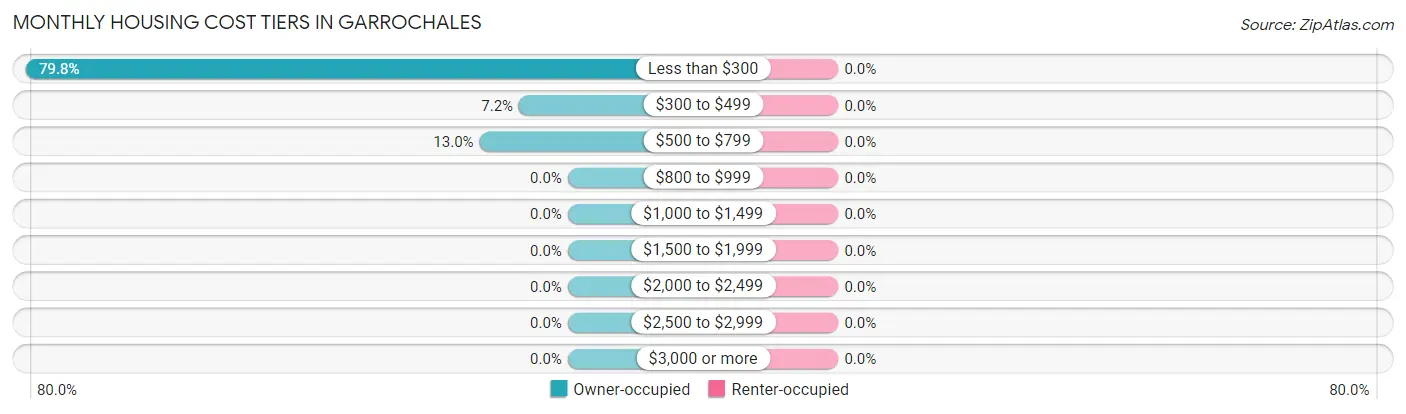
| Monthly Cost | Owner-occupied | Renter-occupied |
| Less than $300 | 233 (79.8%) | 0 (0.0%) |
| $300 to $499 | 21 (7.2%) | 0 (0.0%) |
| $500 to $799 | 38 (13.0%) | 0 (0.0%) |
| $800 to $999 | 0 (0.0%) | 0 (0.0%) |
| $1,000 to $1,499 | 0 (0.0%) | 0 (0.0%) |
| $1,500 to $1,999 | 0 (0.0%) | 0 (0.0%) |
| $2,000 to $2,499 | 0 (0.0%) | 0 (0.0%) |
| $2,500 to $2,999 | 0 (0.0%) | 0 (0.0%) |
| $3,000 or more | 0 (0.0%) | 0 (0.0%) |
| Total | 292 (100.0%) | 48 (100.0%) |
Physical Housing Characteristics in Garrochales
Housing Structures in Garrochales
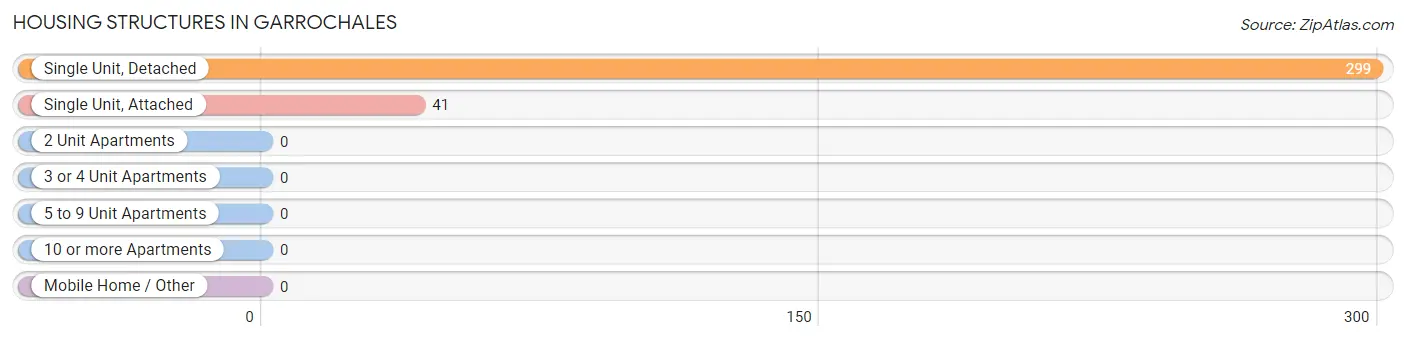
| Structure Type | # Housing Units | % Housing Units |
| Single Unit, Detached | 299 | 87.9% |
| Single Unit, Attached | 41 | 12.1% |
| 2 Unit Apartments | 0 | 0.0% |
| 3 or 4 Unit Apartments | 0 | 0.0% |
| 5 to 9 Unit Apartments | 0 | 0.0% |
| 10 or more Apartments | 0 | 0.0% |
| Mobile Home / Other | 0 | 0.0% |
| Total | 340 | 100.0% |
Housing Structures by Occupancy in Garrochales
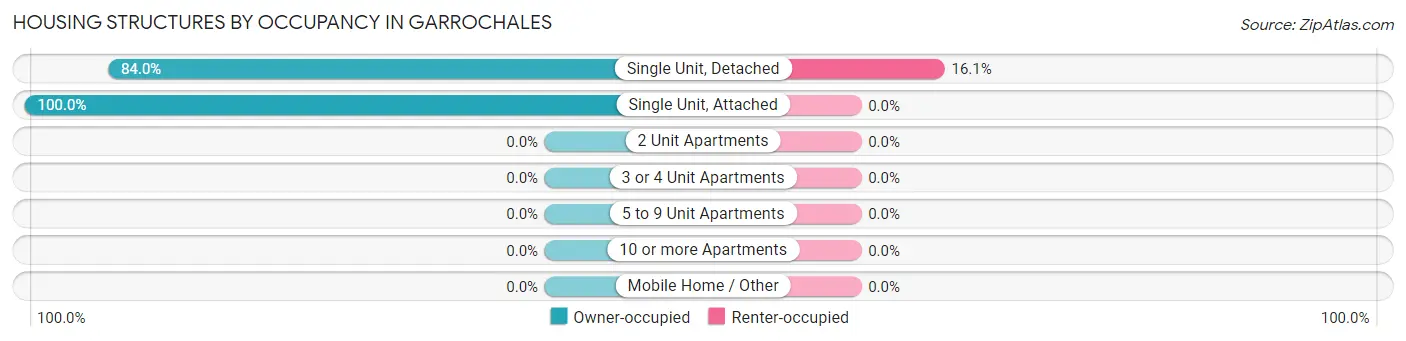
| Structure Type | Owner-occupied | Renter-occupied |
| Single Unit, Detached | 251 (84.0%) | 48 (16.1%) |
| Single Unit, Attached | 41 (100.0%) | 0 (0.0%) |
| 2 Unit Apartments | 0 (0.0%) | 0 (0.0%) |
| 3 or 4 Unit Apartments | 0 (0.0%) | 0 (0.0%) |
| 5 to 9 Unit Apartments | 0 (0.0%) | 0 (0.0%) |
| 10 or more Apartments | 0 (0.0%) | 0 (0.0%) |
| Mobile Home / Other | 0 (0.0%) | 0 (0.0%) |
| Total | 292 (85.9%) | 48 (14.1%) |
Housing Structures by Number of Rooms in Garrochales
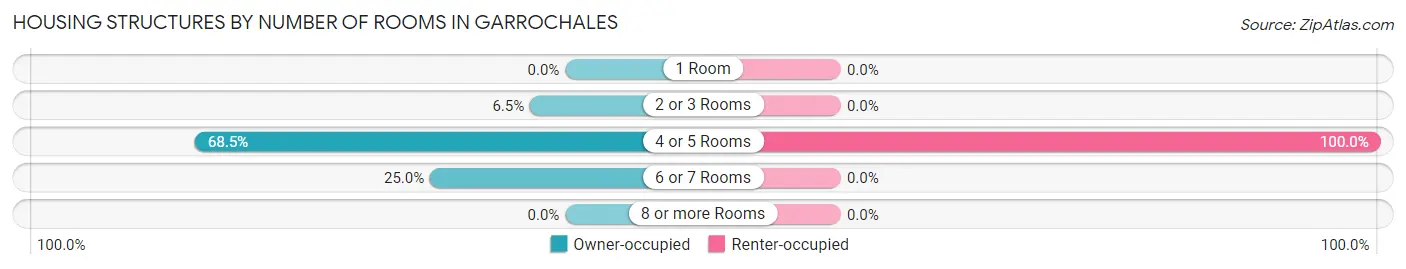
| Number of Rooms | Owner-occupied | Renter-occupied |
| 1 Room | 0 (0.0%) | 0 (0.0%) |
| 2 or 3 Rooms | 19 (6.5%) | 0 (0.0%) |
| 4 or 5 Rooms | 200 (68.5%) | 48 (100.0%) |
| 6 or 7 Rooms | 73 (25.0%) | 0 (0.0%) |
| 8 or more Rooms | 0 (0.0%) | 0 (0.0%) |
| Total | 292 (100.0%) | 48 (100.0%) |
Housing Structure by Heating Type in Garrochales
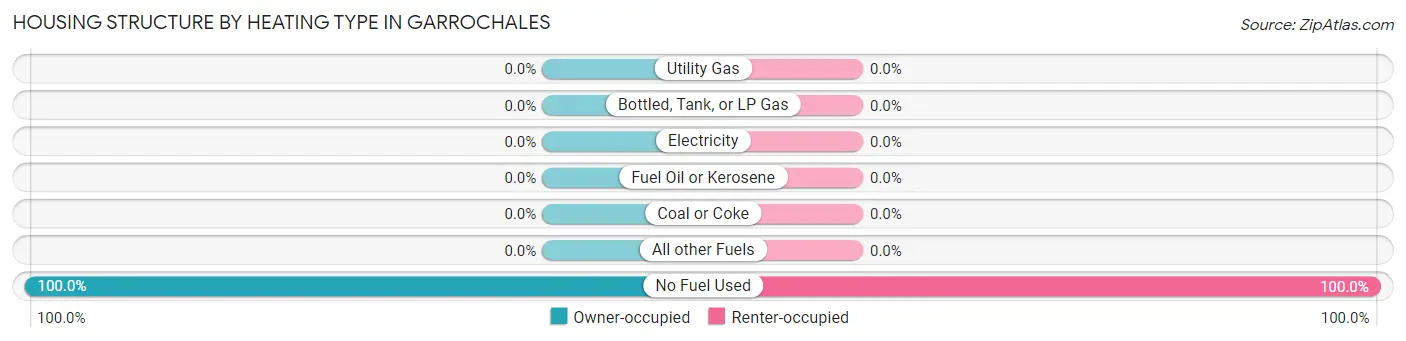
| Heating Type | Owner-occupied | Renter-occupied |
| Utility Gas | 0 (0.0%) | 0 (0.0%) |
| Bottled, Tank, or LP Gas | 0 (0.0%) | 0 (0.0%) |
| Electricity | 0 (0.0%) | 0 (0.0%) |
| Fuel Oil or Kerosene | 0 (0.0%) | 0 (0.0%) |
| Coal or Coke | 0 (0.0%) | 0 (0.0%) |
| All other Fuels | 0 (0.0%) | 0 (0.0%) |
| No Fuel Used | 292 (100.0%) | 48 (100.0%) |
| Total | 292 (100.0%) | 48 (100.0%) |
Household Vehicle Usage in Garrochales
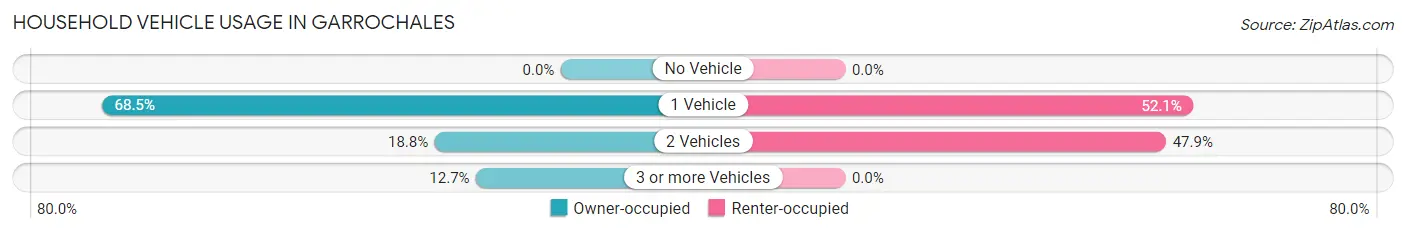
| Vehicles per Household | Owner-occupied | Renter-occupied |
| No Vehicle | 0 (0.0%) | 0 (0.0%) |
| 1 Vehicle | 200 (68.5%) | 25 (52.1%) |
| 2 Vehicles | 55 (18.8%) | 23 (47.9%) |
| 3 or more Vehicles | 37 (12.7%) | 0 (0.0%) |
| Total | 292 (100.0%) | 48 (100.0%) |
Real Estate & Mortgages in Garrochales
Real Estate and Mortgage Overview in Garrochales
| Characteristic | Without Mortgage | With Mortgage |
| Housing Units | 273 | 19 |
| Median Property Value | $99,700 | $0 |
| Median Household Income | $14,750 | $0 |
| Monthly Housing Costs | $126 | $0 |
| Real Estate Taxes | - | - |
Property Value by Mortgage Status in Garrochales
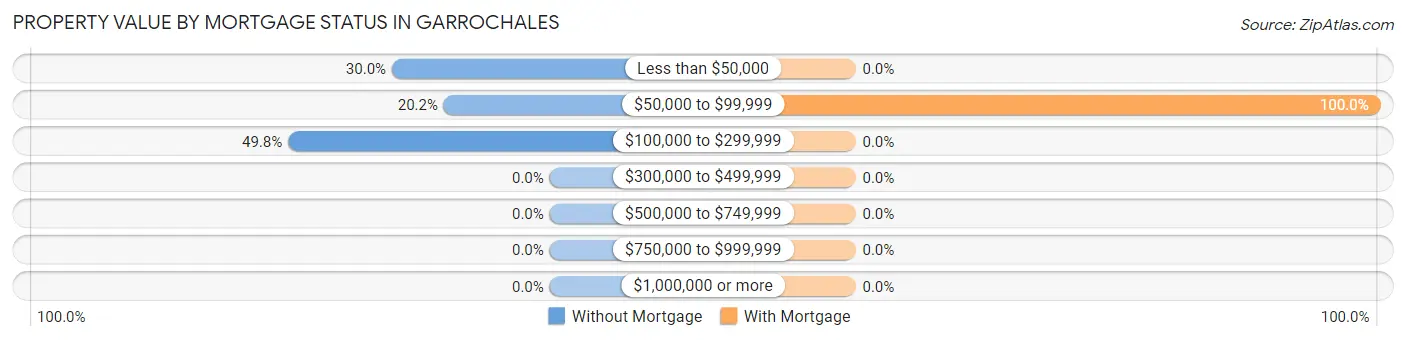
| Property Value | Without Mortgage | With Mortgage |
| Less than $50,000 | 82 (30.0%) | 0 (0.0%) |
| $50,000 to $99,999 | 55 (20.2%) | 19 (100.0%) |
| $100,000 to $299,999 | 136 (49.8%) | 0 (0.0%) |
| $300,000 to $499,999 | 0 (0.0%) | 0 (0.0%) |
| $500,000 to $749,999 | 0 (0.0%) | 0 (0.0%) |
| $750,000 to $999,999 | 0 (0.0%) | 0 (0.0%) |
| $1,000,000 or more | 0 (0.0%) | 0 (0.0%) |
| Total | 273 (100.0%) | 19 (100.0%) |
Household Income by Mortgage Status in Garrochales
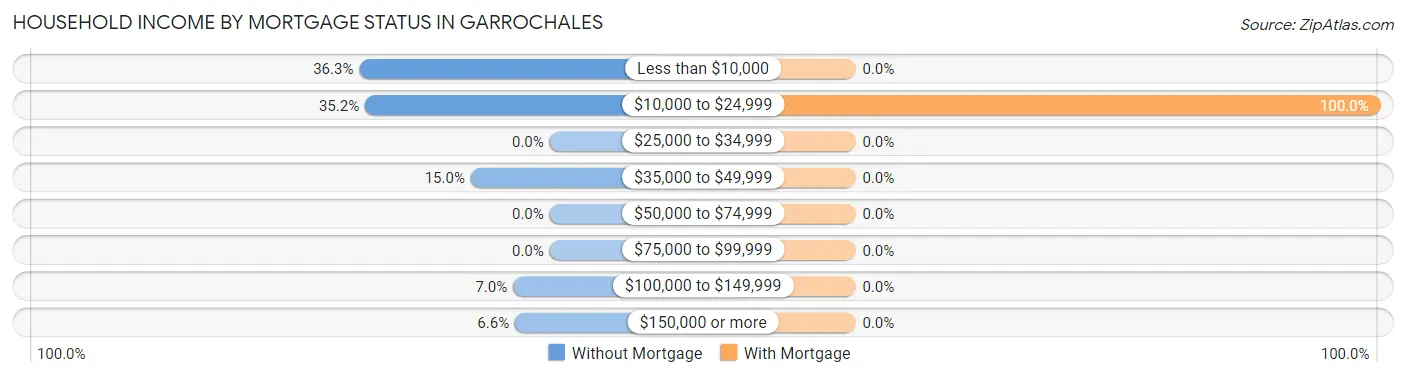
| Household Income | Without Mortgage | With Mortgage |
| Less than $10,000 | 99 (36.3%) | 0 (0.0%) |
| $10,000 to $24,999 | 96 (35.2%) | 19 (100.0%) |
| $25,000 to $34,999 | 0 (0.0%) | 0 (0.0%) |
| $35,000 to $49,999 | 41 (15.0%) | 0 (0.0%) |
| $50,000 to $74,999 | 0 (0.0%) | 0 (0.0%) |
| $75,000 to $99,999 | 0 (0.0%) | 0 (0.0%) |
| $100,000 to $149,999 | 19 (7.0%) | 0 (0.0%) |
| $150,000 or more | 18 (6.6%) | 0 (0.0%) |
| Total | 273 (100.0%) | 19 (100.0%) |
Property Value to Household Income Ratio in Garrochales
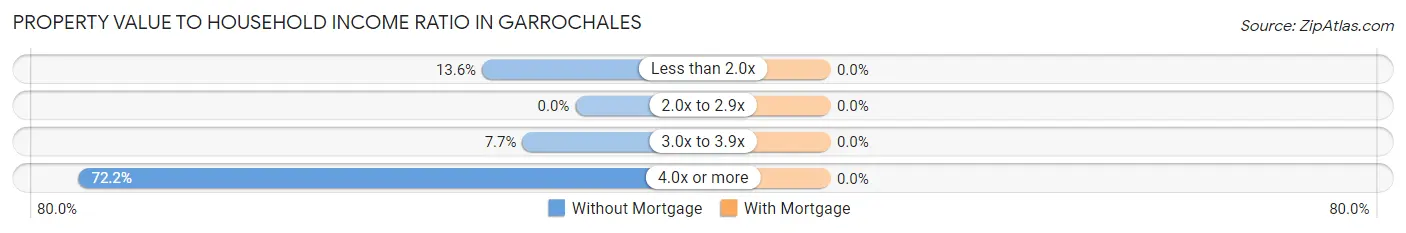
| Value-to-Income Ratio | Without Mortgage | With Mortgage |
| Less than 2.0x | 37 (13.6%) | 0 (0.0%) |
| 2.0x to 2.9x | 0 (0.0%) | 0 (0.0%) |
| 3.0x to 3.9x | 21 (7.7%) | 0 (0.0%) |
| 4.0x or more | 197 (72.2%) | 0 (0.0%) |
| Total | 273 (100.0%) | 19 (100.0%) |
Real Estate Taxes by Mortgage Status in Garrochales
| Property Taxes | Without Mortgage | With Mortgage |
| Less than $800 | 0 (0.0%) | 0 (0.0%) |
| $800 to $1,499 | 0 (0.0%) | 0 (0.0%) |
| $800 to $1,499 | 0 (0.0%) | 0 (0.0%) |
| Total | 273 (100.0%) | 19 (100.0%) |
Health & Disability in Garrochales
Health Insurance Coverage by Age in Garrochales
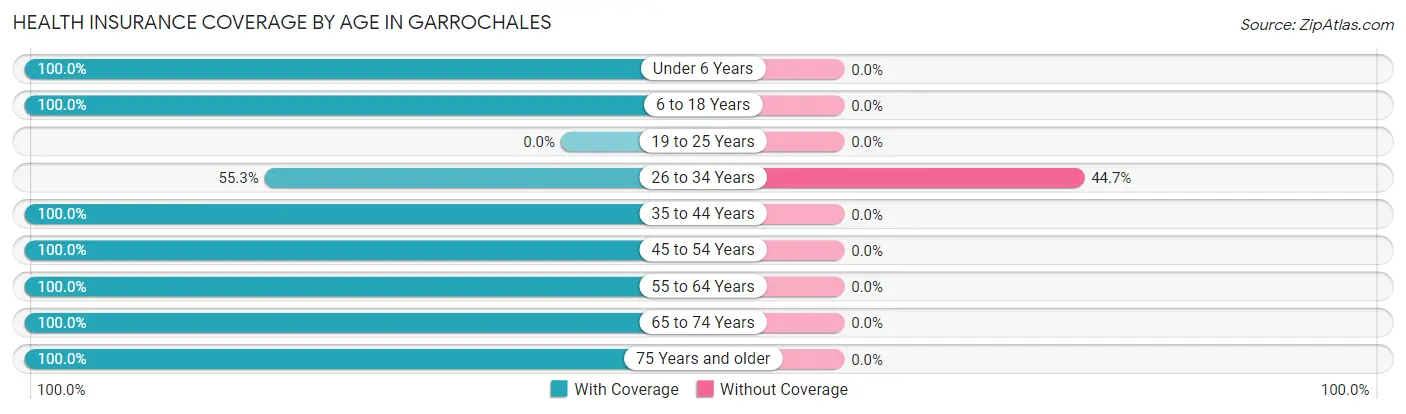
| Age Bracket | With Coverage | Without Coverage |
| Under 6 Years | 47 (100.0%) | 0 (0.0%) |
| 6 to 18 Years | 83 (100.0%) | 0 (0.0%) |
| 19 to 25 Years | 0 (0.0%) | 0 (0.0%) |
| 26 to 34 Years | 105 (55.3%) | 85 (44.7%) |
| 35 to 44 Years | 52 (100.0%) | 0 (0.0%) |
| 45 to 54 Years | 112 (100.0%) | 0 (0.0%) |
| 55 to 64 Years | 37 (100.0%) | 0 (0.0%) |
| 65 to 74 Years | 179 (100.0%) | 0 (0.0%) |
| 75 Years and older | 176 (100.0%) | 0 (0.0%) |
| Total | 791 (90.3%) | 85 (9.7%) |
Health Insurance Coverage by Citizenship Status in Garrochales
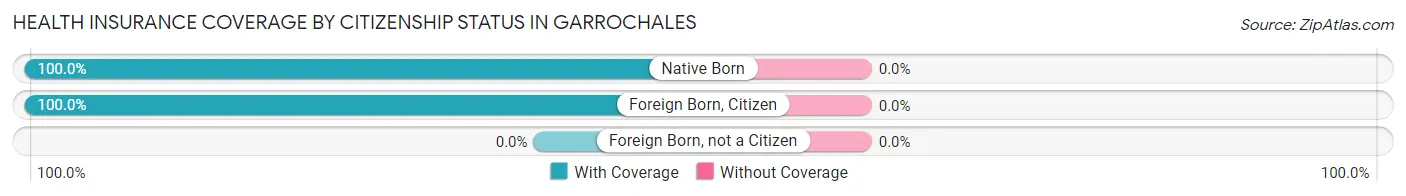
| Citizenship Status | With Coverage | Without Coverage |
| Native Born | 47 (100.0%) | 0 (0.0%) |
| Foreign Born, Citizen | 83 (100.0%) | 0 (0.0%) |
| Foreign Born, not a Citizen | 0 (0.0%) | 0 (0.0%) |
Health Insurance Coverage by Household Income in Garrochales
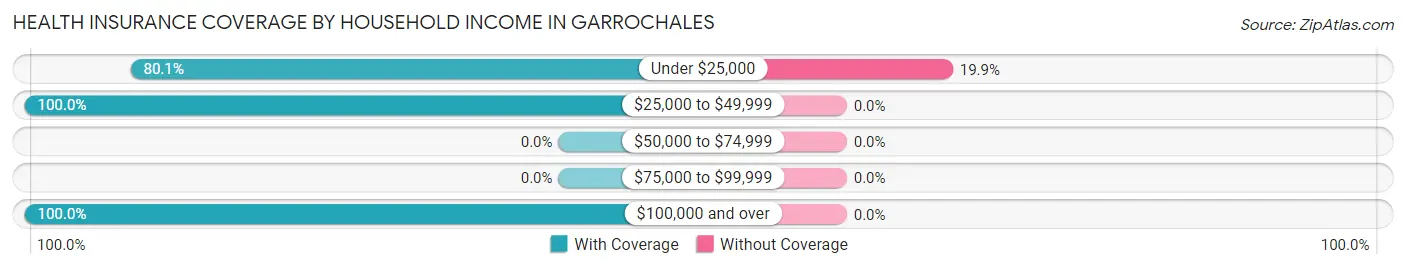
| Household Income | With Coverage | Without Coverage |
| Under $25,000 | 343 (80.1%) | 85 (19.9%) |
| $25,000 to $49,999 | 214 (100.0%) | 0 (0.0%) |
| $50,000 to $74,999 | 0 (0.0%) | 0 (0.0%) |
| $75,000 to $99,999 | 0 (0.0%) | 0 (0.0%) |
| $100,000 and over | 234 (100.0%) | 0 (0.0%) |
Public vs Private Health Insurance Coverage by Age in Garrochales
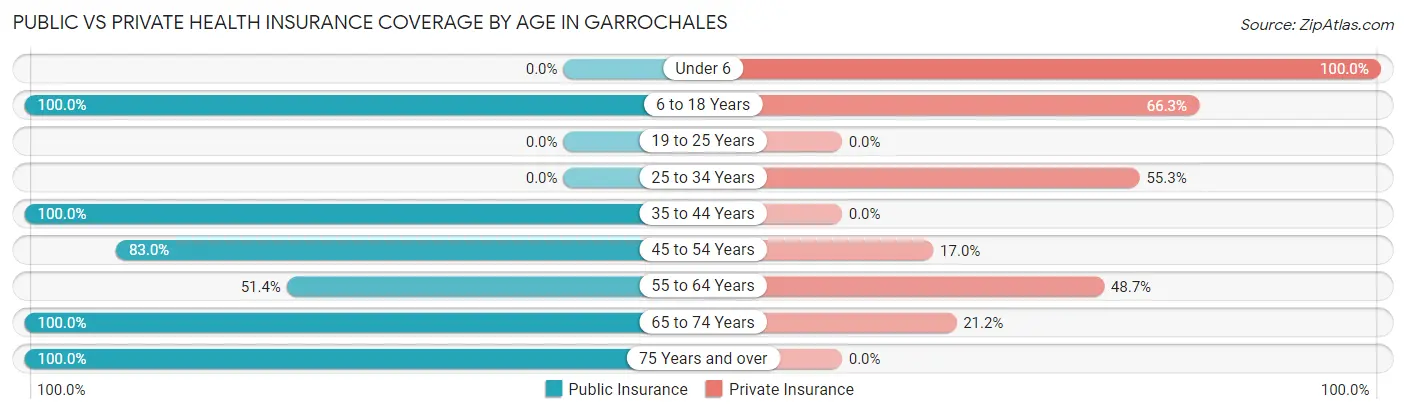
| Age Bracket | Public Insurance | Private Insurance |
| Under 6 | 0 (0.0%) | 47 (100.0%) |
| 6 to 18 Years | 83 (100.0%) | 55 (66.3%) |
| 19 to 25 Years | 0 (0.0%) | 0 (0.0%) |
| 25 to 34 Years | 0 (0.0%) | 105 (55.3%) |
| 35 to 44 Years | 52 (100.0%) | 0 (0.0%) |
| 45 to 54 Years | 93 (83.0%) | 19 (17.0%) |
| 55 to 64 Years | 19 (51.3%) | 18 (48.6%) |
| 65 to 74 Years | 179 (100.0%) | 38 (21.2%) |
| 75 Years and over | 176 (100.0%) | 0 (0.0%) |
| Total | 602 (68.7%) | 282 (32.2%) |
Disability Status by Sex by Age in Garrochales
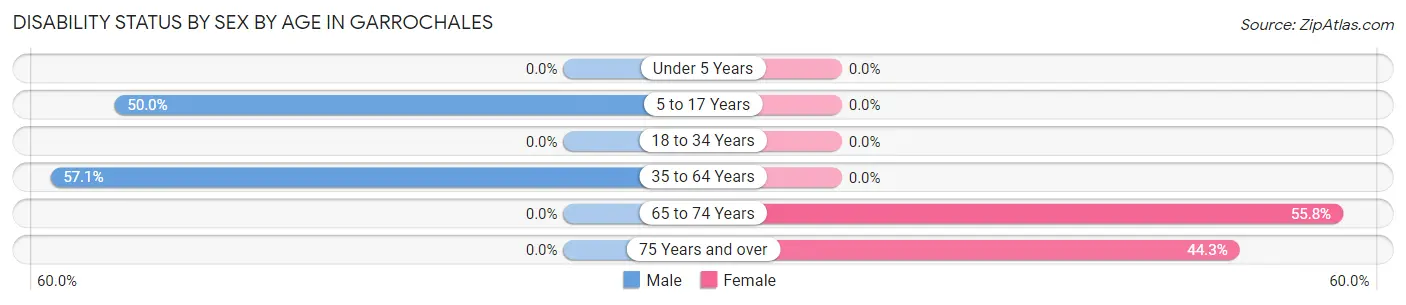
| Age Bracket | Male | Female |
| Under 5 Years | 0 (0.0%) | 0 (0.0%) |
| 5 to 17 Years | 28 (50.0%) | 0 (0.0%) |
| 18 to 34 Years | 0 (0.0%) | 0 (0.0%) |
| 35 to 64 Years | 20 (57.1%) | 0 (0.0%) |
| 65 to 74 Years | 0 (0.0%) | 24 (55.8%) |
| 75 Years and over | 0 (0.0%) | 62 (44.3%) |
Disability Class by Sex by Age in Garrochales
Disability Class: Hearing Difficulty
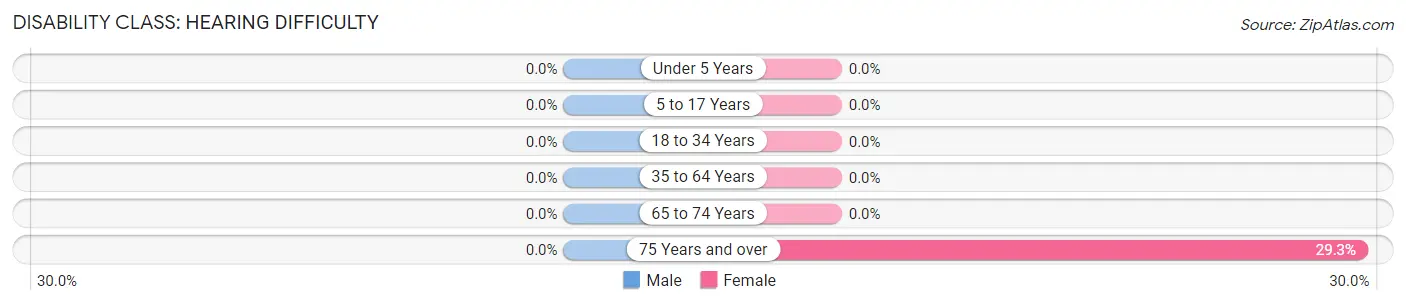
| Age Bracket | Male | Female |
| Under 5 Years | 0 (0.0%) | 0 (0.0%) |
| 5 to 17 Years | 0 (0.0%) | 0 (0.0%) |
| 18 to 34 Years | 0 (0.0%) | 0 (0.0%) |
| 35 to 64 Years | 0 (0.0%) | 0 (0.0%) |
| 65 to 74 Years | 0 (0.0%) | 0 (0.0%) |
| 75 Years and over | 0 (0.0%) | 41 (29.3%) |
Disability Class: Vision Difficulty
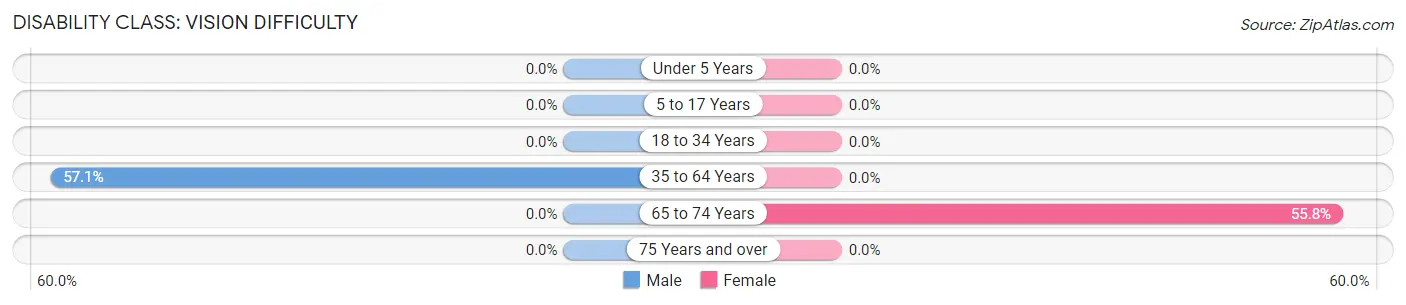
| Age Bracket | Male | Female |
| Under 5 Years | 0 (0.0%) | 0 (0.0%) |
| 5 to 17 Years | 0 (0.0%) | 0 (0.0%) |
| 18 to 34 Years | 0 (0.0%) | 0 (0.0%) |
| 35 to 64 Years | 20 (57.1%) | 0 (0.0%) |
| 65 to 74 Years | 0 (0.0%) | 24 (55.8%) |
| 75 Years and over | 0 (0.0%) | 0 (0.0%) |
Disability Class: Cognitive Difficulty
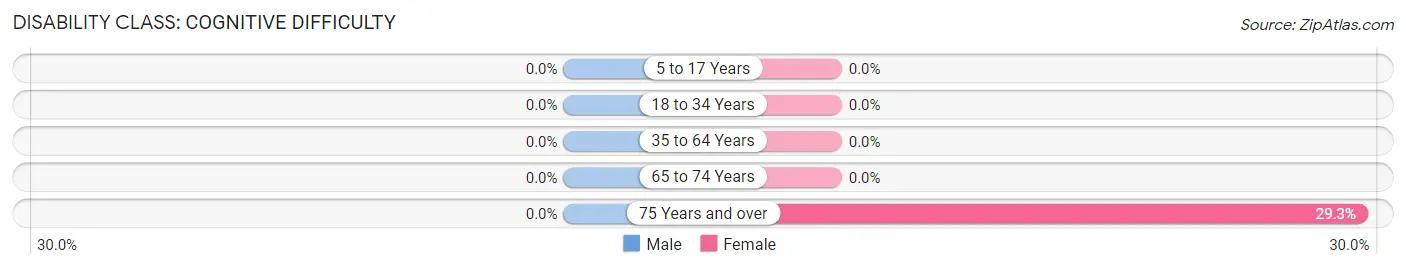
| Age Bracket | Male | Female |
| 5 to 17 Years | 0 (0.0%) | 0 (0.0%) |
| 18 to 34 Years | 0 (0.0%) | 0 (0.0%) |
| 35 to 64 Years | 0 (0.0%) | 0 (0.0%) |
| 65 to 74 Years | 0 (0.0%) | 0 (0.0%) |
| 75 Years and over | 0 (0.0%) | 41 (29.3%) |
Disability Class: Ambulatory Difficulty
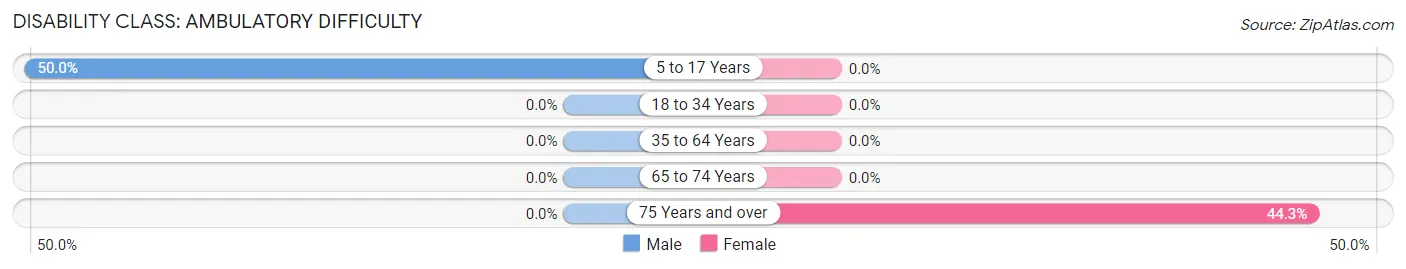
| Age Bracket | Male | Female |
| 5 to 17 Years | 28 (50.0%) | 0 (0.0%) |
| 18 to 34 Years | 0 (0.0%) | 0 (0.0%) |
| 35 to 64 Years | 0 (0.0%) | 0 (0.0%) |
| 65 to 74 Years | 0 (0.0%) | 0 (0.0%) |
| 75 Years and over | 0 (0.0%) | 62 (44.3%) |
Disability Class: Self-Care Difficulty
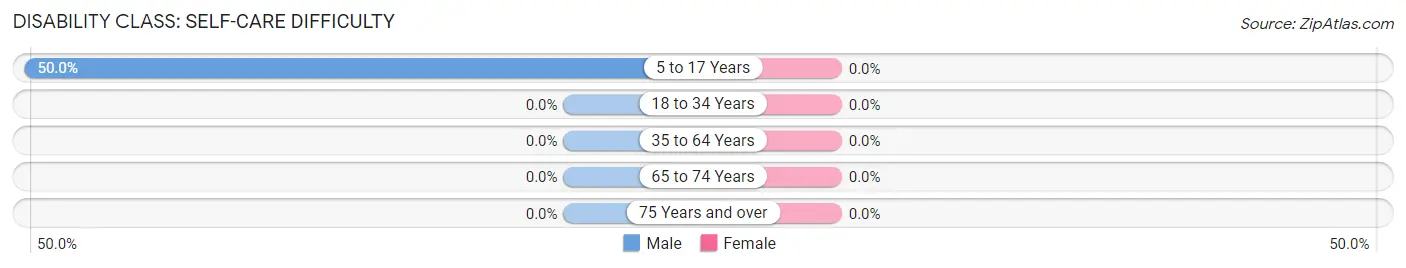
| Age Bracket | Male | Female |
| 5 to 17 Years | 28 (50.0%) | 0 (0.0%) |
| 18 to 34 Years | 0 (0.0%) | 0 (0.0%) |
| 35 to 64 Years | 0 (0.0%) | 0 (0.0%) |
| 65 to 74 Years | 0 (0.0%) | 0 (0.0%) |
| 75 Years and over | 0 (0.0%) | 0 (0.0%) |
Technology Access in Garrochales
Computing Device Access in Garrochales
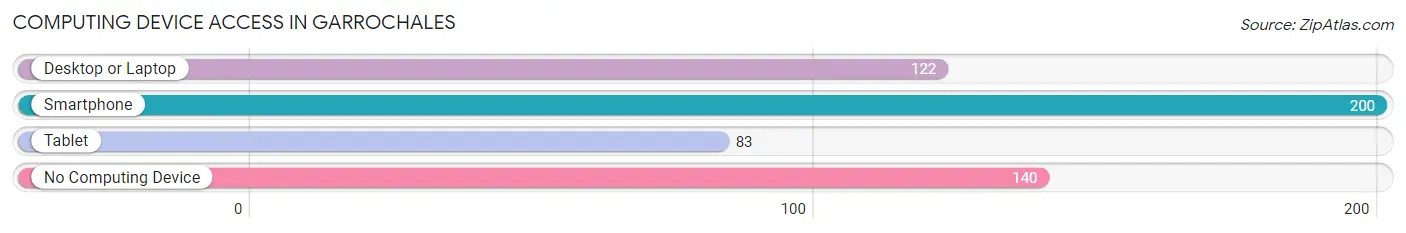
| Device Type | # Households | % Households |
| Desktop or Laptop | 122 | 35.9% |
| Smartphone | 200 | 58.8% |
| Tablet | 83 | 24.4% |
| No Computing Device | 140 | 41.2% |
| Total | 340 | 100.0% |
Internet Access in Garrochales
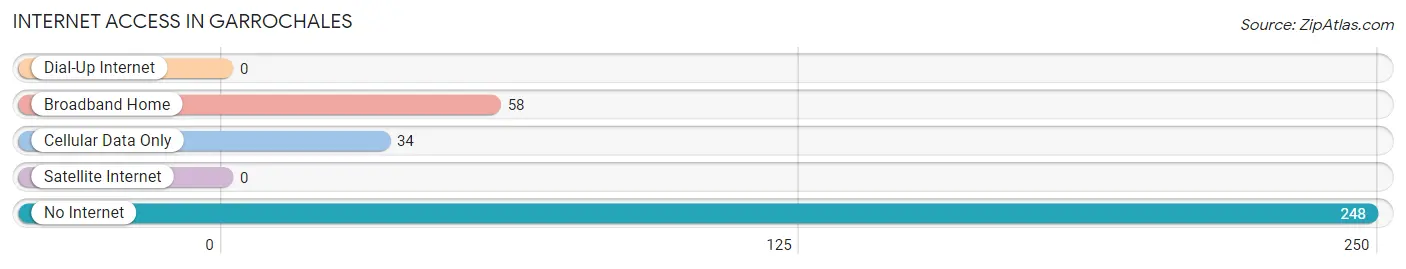
| Internet Type | # Households | % Households |
| Dial-Up Internet | 0 | 0.0% |
| Broadband Home | 58 | 17.1% |
| Cellular Data Only | 34 | 10.0% |
| Satellite Internet | 0 | 0.0% |
| No Internet | 248 | 72.9% |
| Total | 340 | 100.0% |
Garrochales Summary
Garrochales is a small municipality located in the northwest corner of Puerto Rico, in the region of Arecibo. It is bordered by the municipalities of Arecibo, Camuy, Hatillo, and Quebradillas. The municipality has a population of approximately 8,000 people, and covers an area of approximately 11.5 square miles.
History
Garrochales was founded in 1820 by Don Francisco de Garrochales, a Spanish soldier who was stationed in the area. The town was originally called “Garrochales de Arecibo”, but the name was later shortened to just “Garrochales”. The town was officially recognized as a municipality in 1824.
Geography
Garrochales is located in the northwest corner of Puerto Rico, in the region of Arecibo. It is bordered by the municipalities of Arecibo, Camuy, Hatillo, and Quebradillas. The municipality has a total area of 11.5 square miles, and is located at an elevation of approximately 1,000 feet above sea level. The terrain is mostly flat, with some hills in the northern part of the municipality. The climate is tropical, with temperatures ranging from the mid-70s to the mid-80s throughout the year.
Economy
The economy of Garrochales is largely based on agriculture and tourism. The main crops grown in the area are coffee, bananas, and plantains. The municipality also has several small businesses, including restaurants, shops, and hotels. Tourism is also an important part of the local economy, with many visitors coming to the area to enjoy the beaches, mountains, and other attractions.
Demographics
As of the 2010 census, the population of Garrochales was 8,039. The population is mostly of Puerto Rican descent, with a small percentage of other ethnicities. The median age of the population is 38.5 years, and the median household income is $17,845. The unemployment rate is 8.3%, and the poverty rate is 28.3%.
Conclusion
Garrochales is a small municipality located in the northwest corner of Puerto Rico, in the region of Arecibo. It has a population of approximately 8,000 people, and covers an area of approximately 11.5 square miles. The economy of Garrochales is largely based on agriculture and tourism, and the population is mostly of Puerto Rican descent. The median age of the population is 38.5 years, and the median household income is $17,845. The unemployment rate is 8.3%, and the poverty rate is 28.3%.
Common Questions
What is Per Capita Income in Garrochales?
Per Capita income in Garrochales is $17,877.
What is the Median Family Income in Garrochales?
Median Family Income in Garrochales is $35,213.
What is the Median Household income in Garrochales?
Median Household Income in Garrochales is $13,000.
What is Income or Wage Gap in Garrochales?
Income or Wage Gap in Garrochales is 83.2%.
Women in Garrochales earn 16.8 cents for every dollar earned by a man.
What is Inequality or Gini Index in Garrochales?
Inequality or Gini Index in Garrochales is 0.63.
What is the Total Population of Garrochales?
Total Population of Garrochales is 876.
What is the Total Male Population of Garrochales?
Total Male Population of Garrochales is 397.
What is the Total Female Population of Garrochales?
Total Female Population of Garrochales is 479.
What is the Ratio of Males per 100 Females in Garrochales?
There are 82.88 Males per 100 Females in Garrochales.
What is the Ratio of Females per 100 Males in Garrochales?
There are 120.65 Females per 100 Males in Garrochales.
What is the Median Population Age in Garrochales?
Median Population Age in Garrochales is 50.3 Years.
What is the Average Family Size in Garrochales
Average Family Size in Garrochales is 3.6 People.
What is the Average Household Size in Garrochales
Average Household Size in Garrochales is 2.6 People.
How Large is the Labor Force in Garrochales?
There are 298 People in the Labor Forcein in Garrochales.
What is the Percentage of People in the Labor Force in Garrochales?
39.9% of People are in the Labor Force in Garrochales.
What is the Unemployment Rate in Garrochales?
Unemployment Rate in Garrochales is 6.4%.