Culebra, PR Map & Demographics
Culebra Map
Culebra Overview
$16,362
PER CAPITA INCOME
$36,765
AVG FAMILY INCOME
$25,031
AVG HOUSEHOLD INCOME
1.2%
WAGE / INCOME GAP [ % ]
98.8¢/ $1
WAGE / INCOME GAP [ $ ]
0.46
INEQUALITY / GINI INDEX
1,021
TOTAL POPULATION
573
MALE POPULATION
448
FEMALE POPULATION
127.90
MALES / 100 FEMALES
78.18
FEMALES / 100 MALES
44.6
MEDIAN AGE
3.9
AVG FAMILY SIZE
2.6
AVG HOUSEHOLD SIZE
532
LABOR FORCE [ PEOPLE ]
60.5%
PERCENT IN LABOR FORCE
3.6%
UNEMPLOYMENT RATE
Culebra Zip Codes
Income in Culebra
Income Overview in Culebra
Per Capita Income in Culebra is $16,362, while median incomes of families and households are $36,765 and $25,031 respectively.
| Characteristic | Number | Measure |
| Per Capita Income | 1,021 | $16,362 |
| Median Family Income | 186 | $36,765 |
| Mean Family Income | 186 | $49,402 |
| Median Household Income | 395 | $25,031 |
| Mean Household Income | 395 | $33,034 |
| Income Deficit | 186 | $0 |
| Wage / Income Gap (%) | 1,021 | 1.20% |
| Wage / Income Gap ($) | 1,021 | 98.80¢ per $1 |
| Gini / Inequality Index | 1,021 | 0.46 |
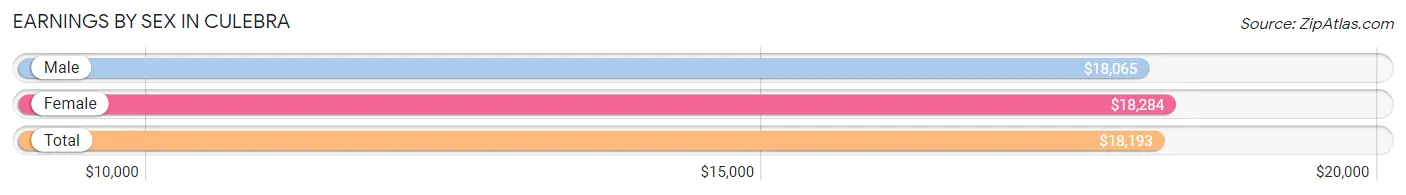
Earnings by Sex in Culebra
Average Earnings in Culebra are $18,193, $18,065 for men and $18,284 for women, a difference of 1.2%.
| Sex | Number | Average Earnings |
| Male | 277 (53.5%) | $18,065 |
| Female | 241 (46.5%) | $18,284 |
| Total | 518 (100.0%) | $18,193 |
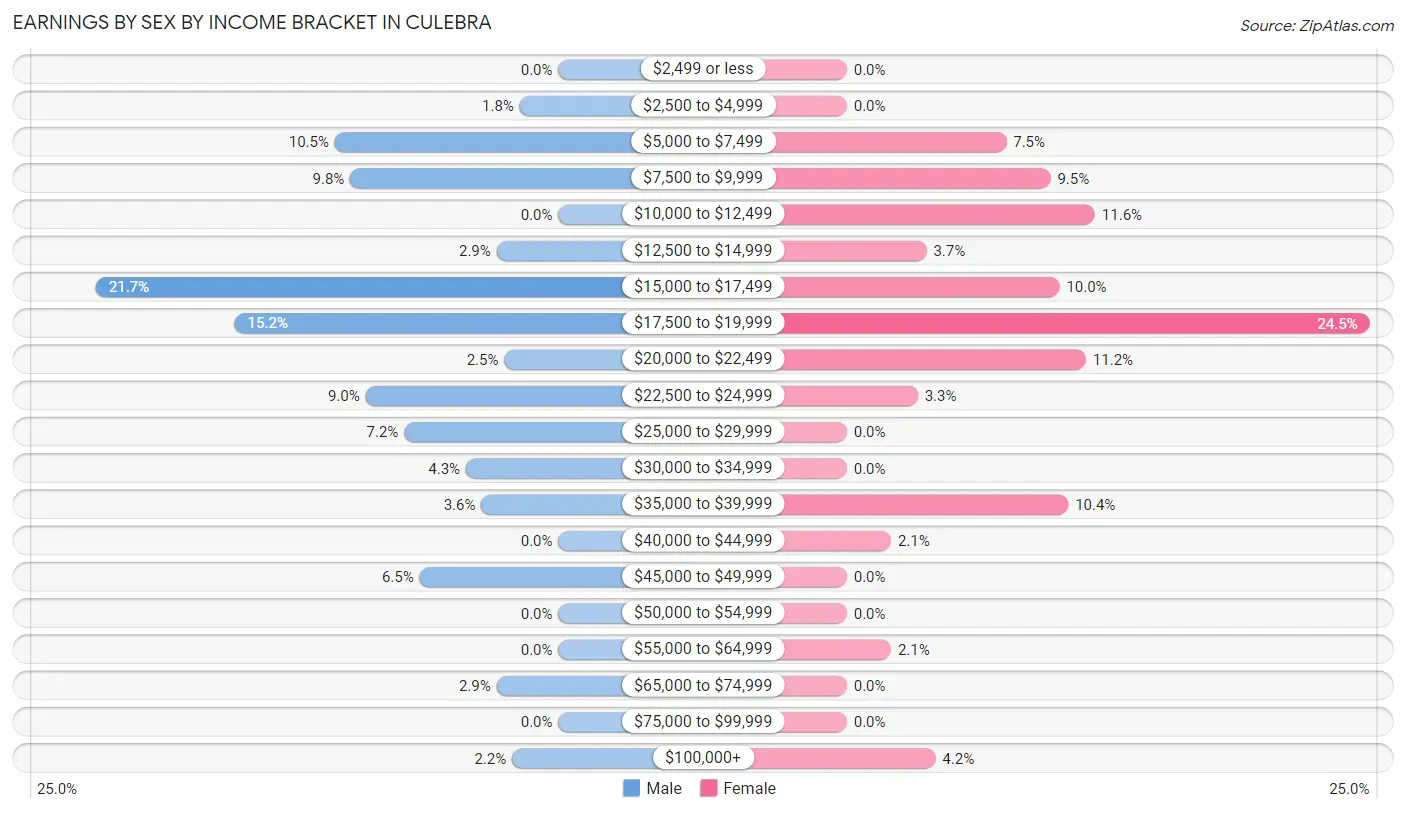
Earnings by Sex by Income Bracket in Culebra
The most common earnings brackets in Culebra are $15,000 to $17,499 for men (60 | 21.7%) and $17,500 to $19,999 for women (59 | 24.5%).
| Income | Male | Female |
| $2,499 or less | 0 (0.0%) | 0 (0.0%) |
| $2,500 to $4,999 | 5 (1.8%) | 0 (0.0%) |
| $5,000 to $7,499 | 29 (10.5%) | 18 (7.5%) |
| $7,500 to $9,999 | 27 (9.8%) | 23 (9.5%) |
| $10,000 to $12,499 | 0 (0.0%) | 28 (11.6%) |
| $12,500 to $14,999 | 8 (2.9%) | 9 (3.7%) |
| $15,000 to $17,499 | 60 (21.7%) | 24 (10.0%) |
| $17,500 to $19,999 | 42 (15.2%) | 59 (24.5%) |
| $20,000 to $22,499 | 7 (2.5%) | 27 (11.2%) |
| $22,500 to $24,999 | 25 (9.0%) | 8 (3.3%) |
| $25,000 to $29,999 | 20 (7.2%) | 0 (0.0%) |
| $30,000 to $34,999 | 12 (4.3%) | 0 (0.0%) |
| $35,000 to $39,999 | 10 (3.6%) | 25 (10.4%) |
| $40,000 to $44,999 | 0 (0.0%) | 5 (2.1%) |
| $45,000 to $49,999 | 18 (6.5%) | 0 (0.0%) |
| $50,000 to $54,999 | 0 (0.0%) | 0 (0.0%) |
| $55,000 to $64,999 | 0 (0.0%) | 5 (2.1%) |
| $65,000 to $74,999 | 8 (2.9%) | 0 (0.0%) |
| $75,000 to $99,999 | 0 (0.0%) | 0 (0.0%) |
| $100,000+ | 6 (2.2%) | 10 (4.2%) |
| Total | 277 (100.0%) | 241 (100.0%) |
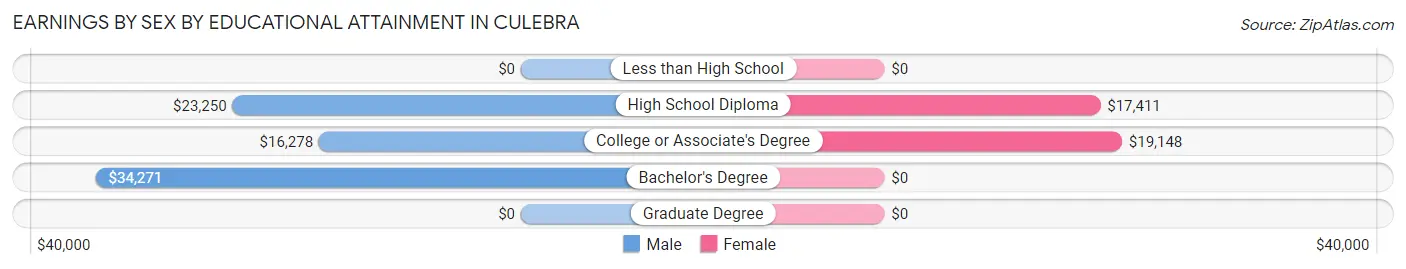
Earnings by Sex by Educational Attainment in Culebra
Average earnings in Culebra are $19,286 for men and $19,100 for women, a difference of 1.0%. Men with an educational attainment of bachelor's degree enjoy the highest average annual earnings of $34,271, while those with college or associate's degree education earn the least with $16,278. Women with an educational attainment of college or associate's degree earn the most with the average annual earnings of $19,148, while those with high school diploma education have the smallest earnings of $17,411.
| Educational Attainment | Male Income | Female Income |
| Less than High School | - | - |
| High School Diploma | $23,250 | $17,411 |
| College or Associate's Degree | $16,278 | $19,148 |
| Bachelor's Degree | $34,271 | $0 |
| Graduate Degree | - | - |
| Total | $19,286 | $19,100 |
Family Income in Culebra
Family Income Brackets in Culebra
According to the Culebra family income data, there are 51 families falling into the $35,000 to $49,999 income range, which is the most common income bracket and makes up 27.4% of all families.
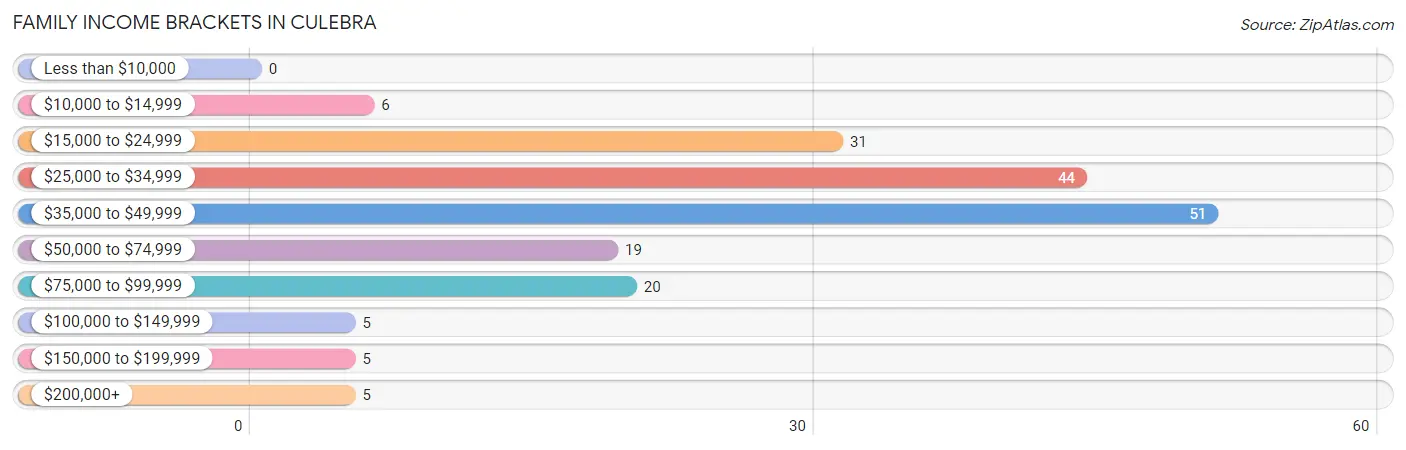
| Income Bracket | # Families | % Families |
| Less than $10,000 | 0 | 0.0% |
| $10,000 to $14,999 | 6 | 3.2% |
| $15,000 to $24,999 | 31 | 16.7% |
| $25,000 to $34,999 | 44 | 23.7% |
| $35,000 to $49,999 | 51 | 27.4% |
| $50,000 to $74,999 | 19 | 10.2% |
| $75,000 to $99,999 | 20 | 10.8% |
| $100,000 to $149,999 | 5 | 2.7% |
| $150,000 to $199,999 | 5 | 2.7% |
| $200,000+ | 5 | 2.7% |
Family Income by Famaliy Size in Culebra
5-person families (14 | 7.5%) account for the highest median family income in Culebra with $58,125 per family, while 2-person families (71 | 38.2%) have the highest median income of $15,625 per family member.
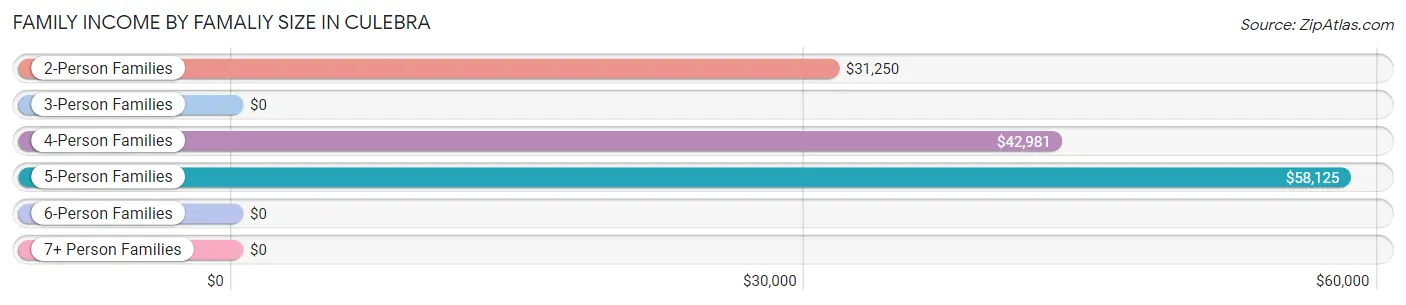
| Income Bracket | # Families | Median Income |
| 2-Person Families | 71 (38.2%) | $31,250 |
| 3-Person Families | 64 (34.4%) | $0 |
| 4-Person Families | 37 (19.9%) | $42,981 |
| 5-Person Families | 14 (7.5%) | $58,125 |
| 6-Person Families | 0 (0.0%) | $0 |
| 7+ Person Families | 0 (0.0%) | $0 |
| Total | 186 (100.0%) | $36,765 |
Family Income by Number of Earners in Culebra
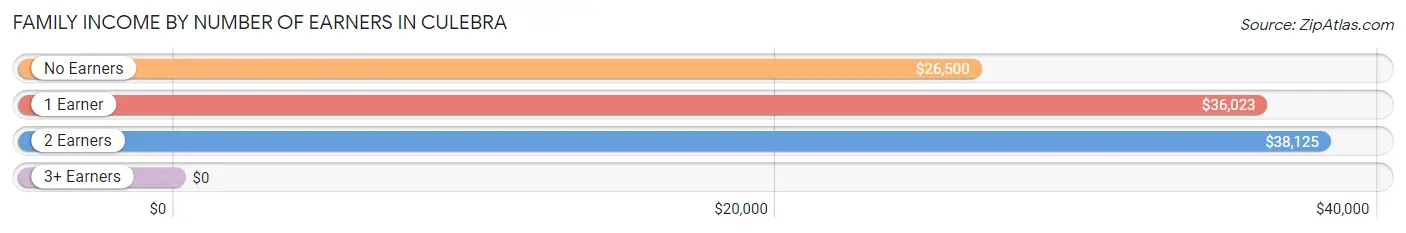
| Number of Earners | # Families | Median Income |
| No Earners | 26 (14.0%) | $26,500 |
| 1 Earner | 51 (27.4%) | $36,023 |
| 2 Earners | 96 (51.6%) | $38,125 |
| 3+ Earners | 13 (7.0%) | $0 |
| Total | 186 (100.0%) | $36,765 |
Household Income in Culebra
Household Income Brackets in Culebra
With 75 households falling in the category, the $10,000 to $14,999 income range is the most frequent in Culebra, accounting for 19.0% of all households. In contrast, only 5 households (1.3%) fall into the $150,000 to $199,999 income bracket, making it the least populous group.
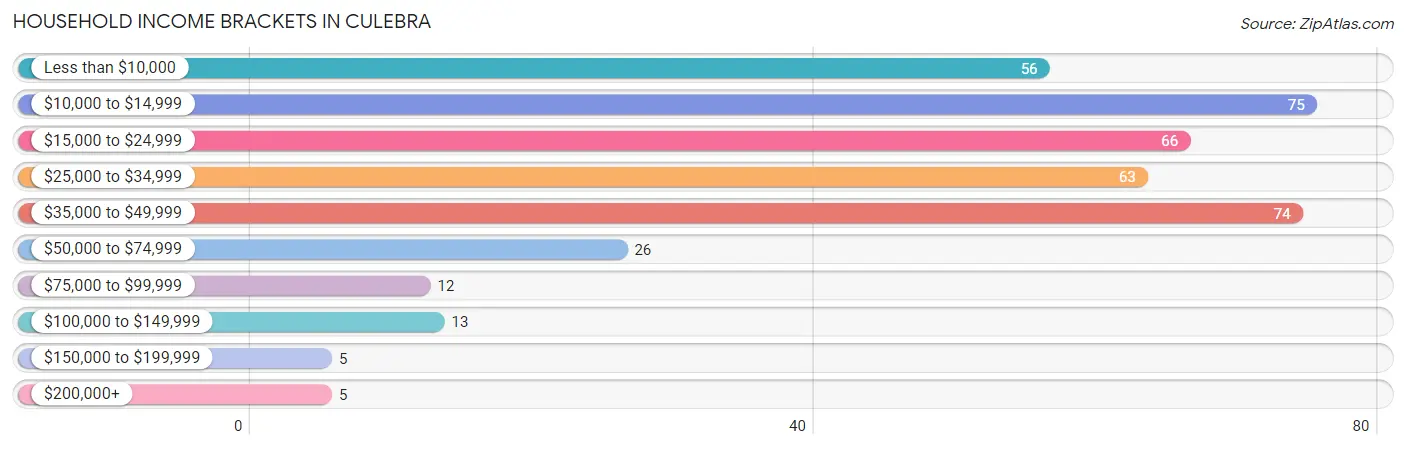
| Income Bracket | # Households | % Households |
| Less than $10,000 | 56 | 14.2% |
| $10,000 to $14,999 | 75 | 19.0% |
| $15,000 to $24,999 | 66 | 16.7% |
| $25,000 to $34,999 | 63 | 15.9% |
| $35,000 to $49,999 | 74 | 18.7% |
| $50,000 to $74,999 | 26 | 6.6% |
| $75,000 to $99,999 | 12 | 3.0% |
| $100,000 to $149,999 | 13 | 3.3% |
| $150,000 to $199,999 | 5 | 1.3% |
| $200,000+ | 5 | 1.3% |
Household Income by Householder Age in Culebra
The median household income in Culebra is $25,031, with the highest median household income of $37,500 found in the 25 to 44 years age bracket for the primary householder. A total of 64 households (16.2%) fall into this category. Meanwhile, the 15 to 24 years age bracket for the primary householder has the lowest median household income of $0, with 19 households (4.8%) in this group.
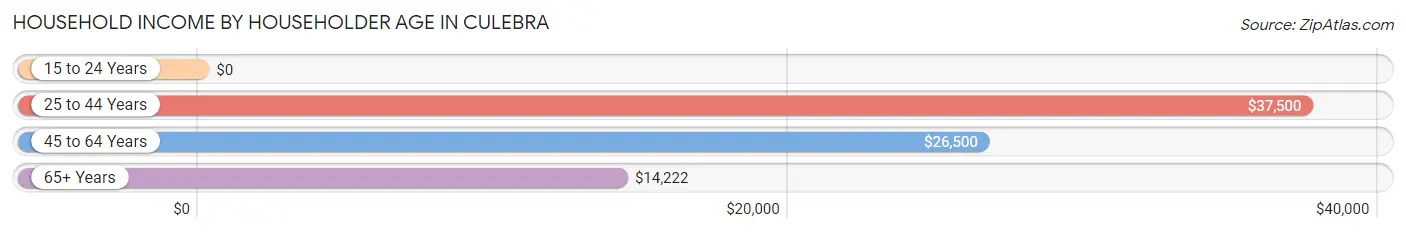
| Income Bracket | # Households | Median Income |
| 15 to 24 Years | 19 (4.8%) | $0 |
| 25 to 44 Years | 64 (16.2%) | $37,500 |
| 45 to 64 Years | 156 (39.5%) | $26,500 |
| 65+ Years | 156 (39.5%) | $14,222 |
| Total | 395 (100.0%) | $25,031 |
Poverty in Culebra
Income Below Poverty by Sex and Age in Culebra
With 18.1% poverty level for males and 33.3% for females among the residents of Culebra, under 5 year old males and 12 to 14 year old females are the most vulnerable to poverty, with 9 males (69.2%) and 15 females (100.0%) in their respective age groups living below the poverty level.
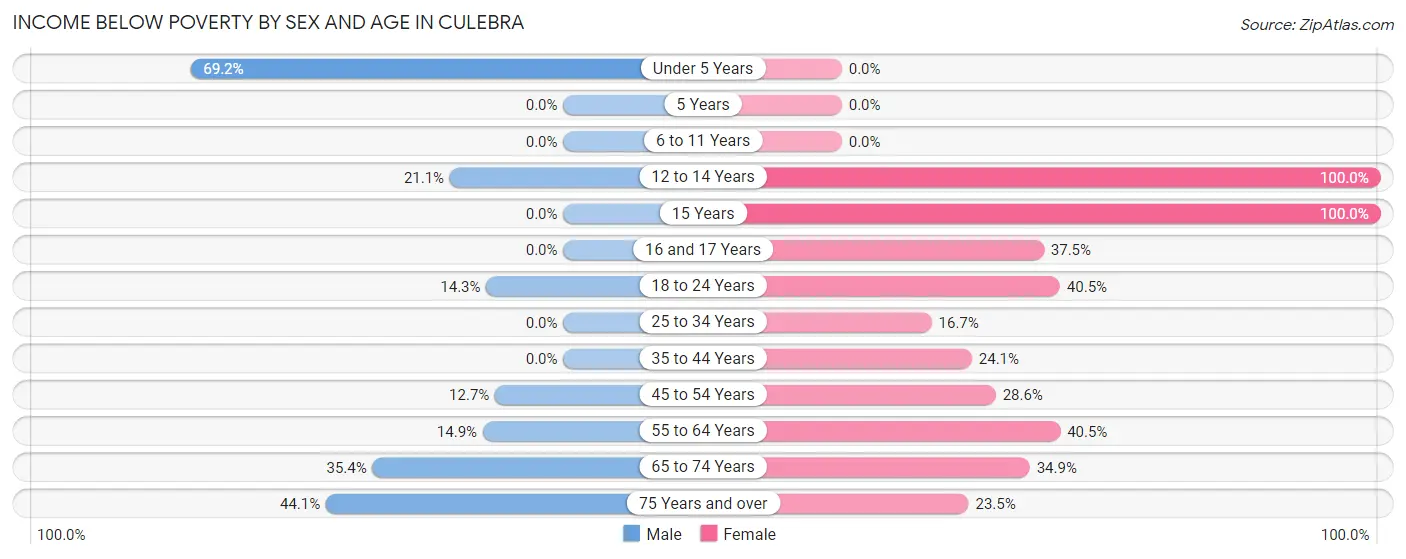
| Age Bracket | Male | Female |
| Under 5 Years | 9 (69.2%) | 0 (0.0%) |
| 5 Years | 0 (0.0%) | 0 (0.0%) |
| 6 to 11 Years | 0 (0.0%) | 0 (0.0%) |
| 12 to 14 Years | 8 (21.0%) | 15 (100.0%) |
| 15 Years | 0 (0.0%) | 6 (100.0%) |
| 16 and 17 Years | 0 (0.0%) | 6 (37.5%) |
| 18 to 24 Years | 12 (14.3%) | 34 (40.5%) |
| 25 to 34 Years | 0 (0.0%) | 6 (16.7%) |
| 35 to 44 Years | 0 (0.0%) | 14 (24.1%) |
| 45 to 54 Years | 10 (12.7%) | 26 (28.6%) |
| 55 to 64 Years | 10 (14.9%) | 15 (40.5%) |
| 65 to 74 Years | 17 (35.4%) | 15 (34.9%) |
| 75 Years and over | 37 (44.1%) | 12 (23.5%) |
| Total | 103 (18.1%) | 149 (33.3%) |
Income Above Poverty by Sex and Age in Culebra
According to the poverty statistics in Culebra, males aged 5 years and females aged under 5 years are the age groups that are most secure financially, with 100.0% of males and 100.0% of females in these age groups living above the poverty line.
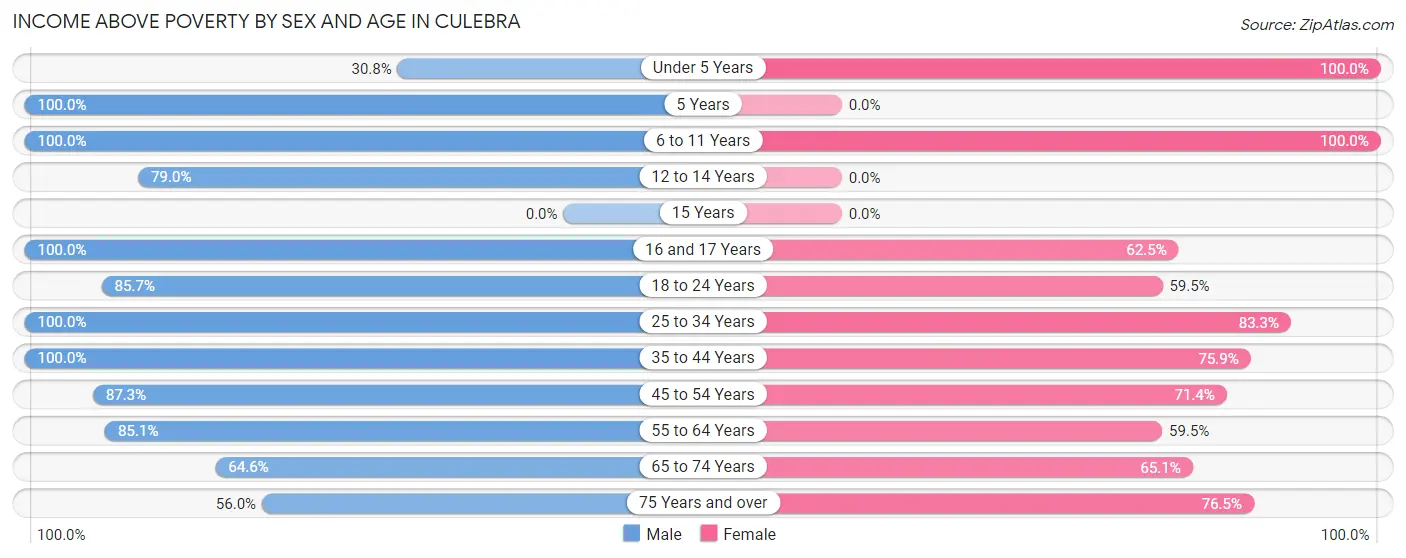
| Age Bracket | Male | Female |
| Under 5 Years | 4 (30.8%) | 4 (100.0%) |
| 5 Years | 6 (100.0%) | 0 (0.0%) |
| 6 to 11 Years | 48 (100.0%) | 7 (100.0%) |
| 12 to 14 Years | 30 (78.9%) | 0 (0.0%) |
| 15 Years | 0 (0.0%) | 0 (0.0%) |
| 16 and 17 Years | 5 (100.0%) | 10 (62.5%) |
| 18 to 24 Years | 72 (85.7%) | 50 (59.5%) |
| 25 to 34 Years | 31 (100.0%) | 30 (83.3%) |
| 35 to 44 Years | 66 (100.0%) | 44 (75.9%) |
| 45 to 54 Years | 69 (87.3%) | 65 (71.4%) |
| 55 to 64 Years | 57 (85.1%) | 22 (59.5%) |
| 65 to 74 Years | 31 (64.6%) | 28 (65.1%) |
| 75 Years and over | 47 (55.9%) | 39 (76.5%) |
| Total | 466 (81.9%) | 299 (66.7%) |
Income Below Poverty Among Married-Couple Families in Culebra
The poverty statistics for married-couple families in Culebra show that 10.9% or 15 of the total 138 families live below the poverty line. Families with no children have the highest poverty rate of 14.3%, comprising of 15 families. On the other hand, families with 1 or 2 children have the lowest poverty rate of 0.0%, which includes 0 families.
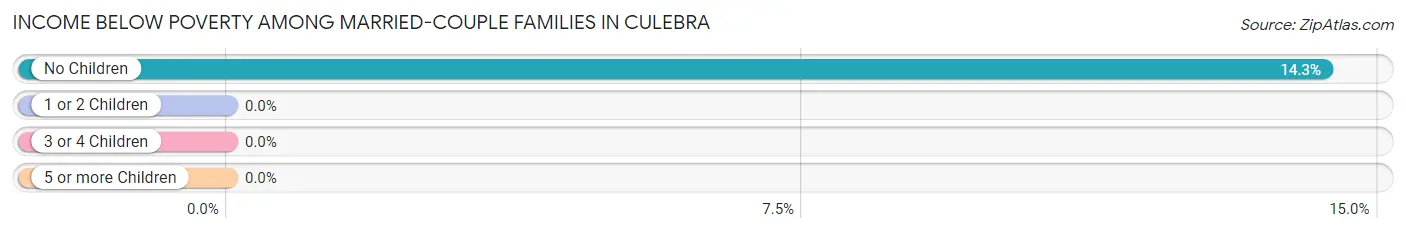
| Children | Above Poverty | Below Poverty |
| No Children | 90 (85.7%) | 15 (14.3%) |
| 1 or 2 Children | 33 (100.0%) | 0 (0.0%) |
| 3 or 4 Children | 0 (0.0%) | 0 (0.0%) |
| 5 or more Children | 0 (0.0%) | 0 (0.0%) |
| Total | 123 (89.1%) | 15 (10.9%) |
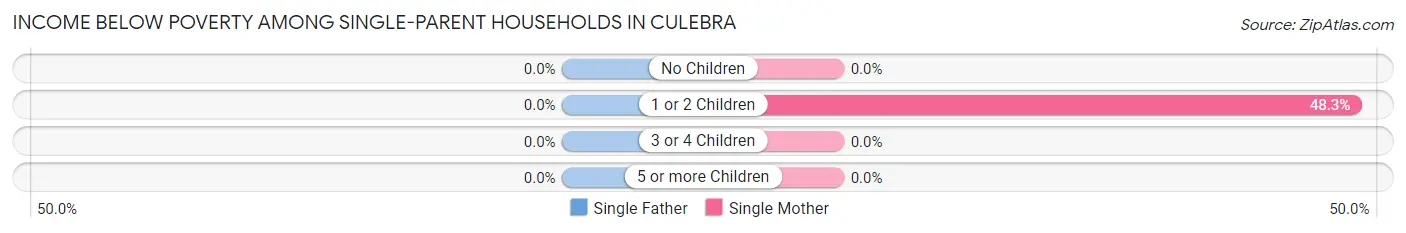
Income Below Poverty Among Single-Parent Households in Culebra
| Children | Single Father | Single Mother |
| No Children | 0 (0.0%) | 0 (0.0%) |
| 1 or 2 Children | 0 (0.0%) | 14 (48.3%) |
| 3 or 4 Children | 0 (0.0%) | 0 (0.0%) |
| 5 or more Children | 0 (0.0%) | 0 (0.0%) |
| Total | 0 (0.0%) | 14 (40.0%) |
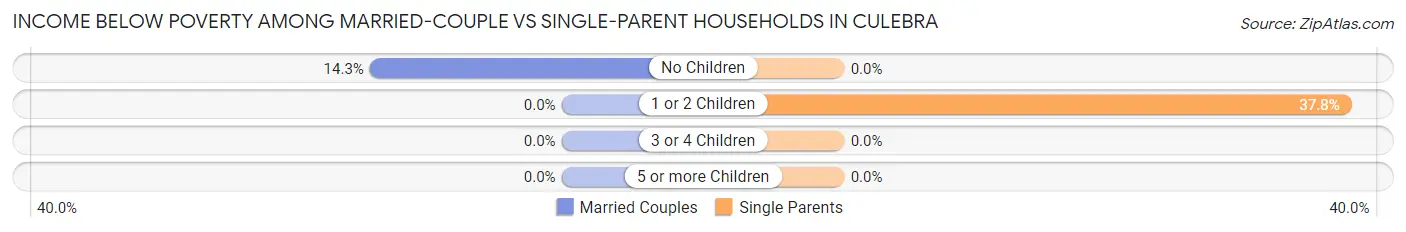
Income Below Poverty Among Married-Couple vs Single-Parent Households in Culebra
The poverty data for Culebra shows that 15 of the married-couple family households (10.9%) and 14 of the single-parent households (29.2%) are living below the poverty level. Within the married-couple family households, those with no children have the highest poverty rate, with 15 households (14.3%) falling below the poverty line. Among the single-parent households, those with 1 or 2 children have the highest poverty rate, with 14 household (37.8%) living below poverty.
| Children | Married-Couple Families | Single-Parent Households |
| No Children | 15 (14.3%) | 0 (0.0%) |
| 1 or 2 Children | 0 (0.0%) | 14 (37.8%) |
| 3 or 4 Children | 0 (0.0%) | 0 (0.0%) |
| 5 or more Children | 0 (0.0%) | 0 (0.0%) |
| Total | 15 (10.9%) | 14 (29.2%) |
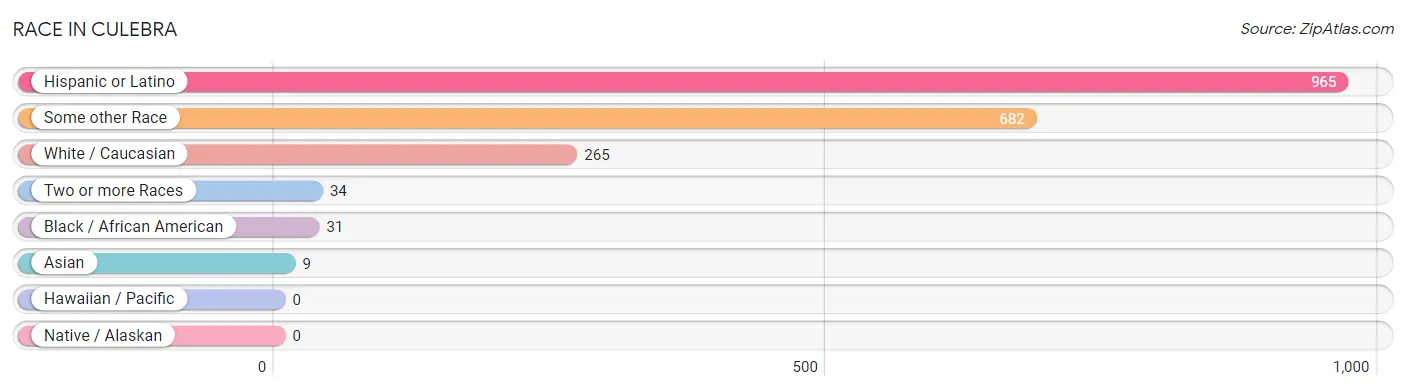
Race in Culebra
The most populous races in Culebra are Hispanic or Latino (965 | 94.5%), Some other Race (682 | 66.8%), and White / Caucasian (265 | 26.0%).
| Race | # Population | % Population |
| Asian | 9 | 0.9% |
| Black / African American | 31 | 3.0% |
| Hawaiian / Pacific | 0 | 0.0% |
| Hispanic or Latino | 965 | 94.5% |
| Native / Alaskan | 0 | 0.0% |
| White / Caucasian | 265 | 26.0% |
| Two or more Races | 34 | 3.3% |
| Some other Race | 682 | 66.8% |
| Total | 1,021 | 100.0% |
Ancestry in Culebra
The most populous ancestries reported in Culebra are Puerto Rican (957 | 93.7%), American (22 | 2.1%), German (19 | 1.9%), Indian (Asian) (9 | 0.9%), and Cuban (8 | 0.8%), together accounting for 99.4% of all Culebra residents.

| Ancestry | # Population | % Population |
| American | 22 | 2.1% |
| Cuban | 8 | 0.8% |
| Czech | 6 | 0.6% |
| German | 19 | 1.9% |
| Indian (Asian) | 9 | 0.9% |
| Irish | 5 | 0.5% |
| Norwegian | 6 | 0.6% |
| Puerto Rican | 957 | 93.7% | View All 8 Rows |
Immigrants in Culebra

| Immigration Origin | # Population | % Population | View All 0 Rows |
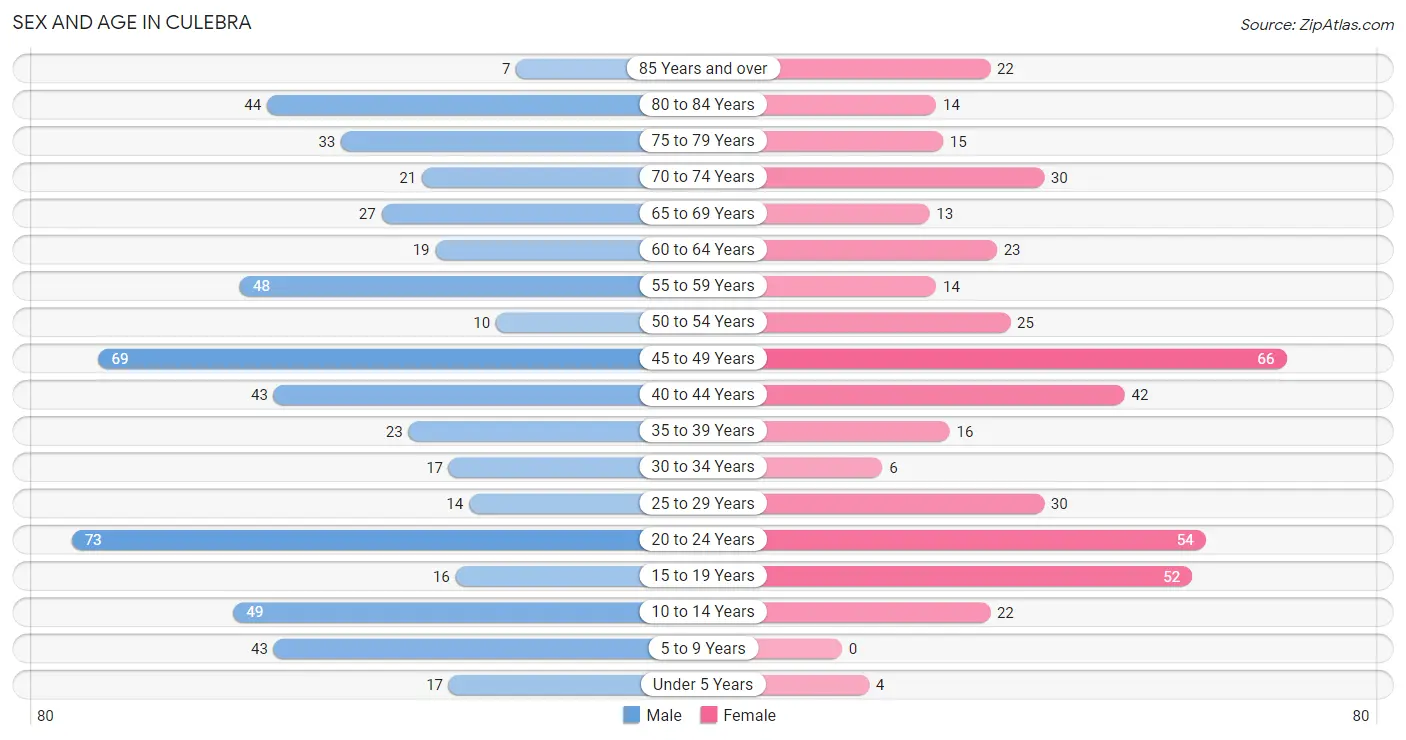
Sex and Age in Culebra
Sex and Age in Culebra
The most populous age groups in Culebra are 20 to 24 Years (73 | 12.7%) for men and 45 to 49 Years (66 | 14.7%) for women.
| Age Bracket | Male | Female |
| Under 5 Years | 17 (3.0%) | 4 (0.9%) |
| 5 to 9 Years | 43 (7.5%) | 0 (0.0%) |
| 10 to 14 Years | 49 (8.6%) | 22 (4.9%) |
| 15 to 19 Years | 16 (2.8%) | 52 (11.6%) |
| 20 to 24 Years | 73 (12.7%) | 54 (12.0%) |
| 25 to 29 Years | 14 (2.4%) | 30 (6.7%) |
| 30 to 34 Years | 17 (3.0%) | 6 (1.3%) |
| 35 to 39 Years | 23 (4.0%) | 16 (3.6%) |
| 40 to 44 Years | 43 (7.5%) | 42 (9.4%) |
| 45 to 49 Years | 69 (12.0%) | 66 (14.7%) |
| 50 to 54 Years | 10 (1.8%) | 25 (5.6%) |
| 55 to 59 Years | 48 (8.4%) | 14 (3.1%) |
| 60 to 64 Years | 19 (3.3%) | 23 (5.1%) |
| 65 to 69 Years | 27 (4.7%) | 13 (2.9%) |
| 70 to 74 Years | 21 (3.7%) | 30 (6.7%) |
| 75 to 79 Years | 33 (5.8%) | 15 (3.4%) |
| 80 to 84 Years | 44 (7.7%) | 14 (3.1%) |
| 85 Years and over | 7 (1.2%) | 22 (4.9%) |
| Total | 573 (100.0%) | 448 (100.0%) |
Families and Households in Culebra
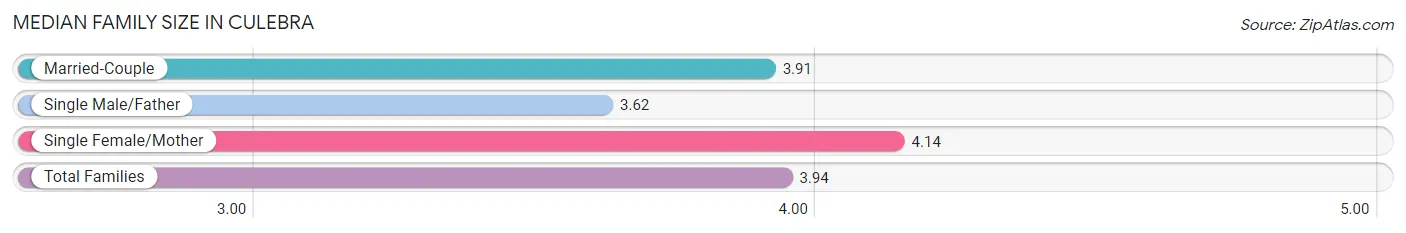
Median Family Size in Culebra
The median family size in Culebra is 3.94 persons per family, with single female/mother families (35 | 18.8%) accounting for the largest median family size of 4.14 persons per family. On the other hand, single male/father families (13 | 7.0%) represent the smallest median family size with 3.62 persons per family.
| Family Type | # Families | Family Size |
| Married-Couple | 138 (74.2%) | 3.91 |
| Single Male/Father | 13 (7.0%) | 3.62 |
| Single Female/Mother | 35 (18.8%) | 4.14 |
| Total Families | 186 (100.0%) | 3.94 |
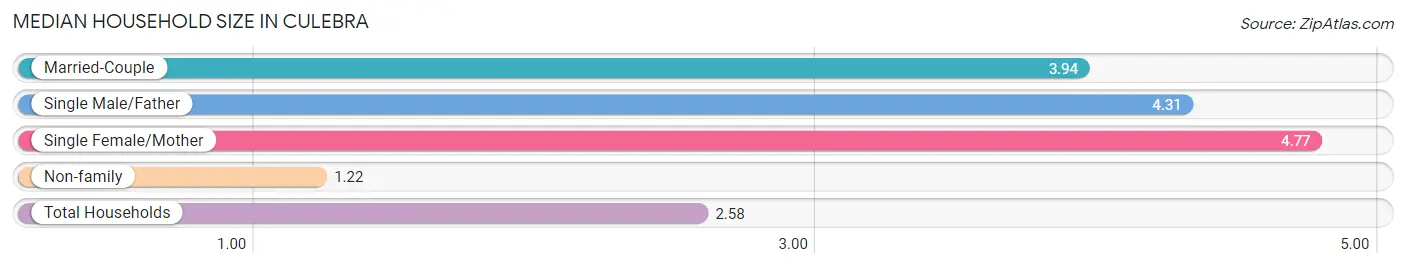
Median Household Size in Culebra
The median household size in Culebra is 2.58 persons per household, with single female/mother households (35 | 8.9%) accounting for the largest median household size of 4.77 persons per household. non-family households (209 | 52.9%) represent the smallest median household size with 1.22 persons per household.
| Household Type | # Households | Household Size |
| Married-Couple | 138 (34.9%) | 3.94 |
| Single Male/Father | 13 (3.3%) | 4.31 |
| Single Female/Mother | 35 (8.9%) | 4.77 |
| Non-family | 209 (52.9%) | 1.22 |
| Total Households | 395 (100.0%) | 2.58 |
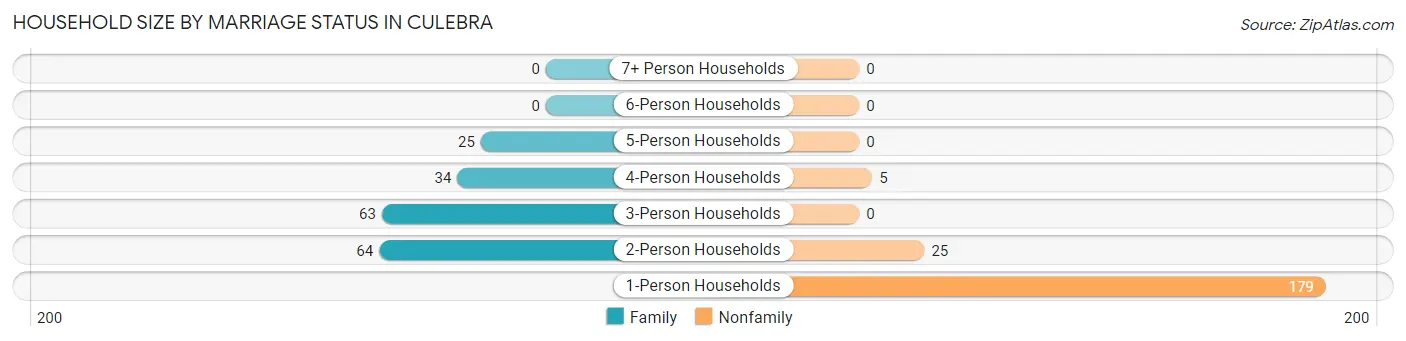
Household Size by Marriage Status in Culebra
Out of a total of 395 households in Culebra, 186 (47.1%) are family households, while 209 (52.9%) are nonfamily households. The most numerous type of family households are 2-person households, comprising 64, and the most common type of nonfamily households are 1-person households, comprising 179.
| Household Size | Family Households | Nonfamily Households |
| 1-Person Households | - | 179 (45.3%) |
| 2-Person Households | 64 (16.2%) | 25 (6.3%) |
| 3-Person Households | 63 (16.0%) | 0 (0.0%) |
| 4-Person Households | 34 (8.6%) | 5 (1.3%) |
| 5-Person Households | 25 (6.3%) | 0 (0.0%) |
| 6-Person Households | 0 (0.0%) | 0 (0.0%) |
| 7+ Person Households | 0 (0.0%) | 0 (0.0%) |
| Total | 186 (47.1%) | 209 (52.9%) |
Female Fertility in Culebra
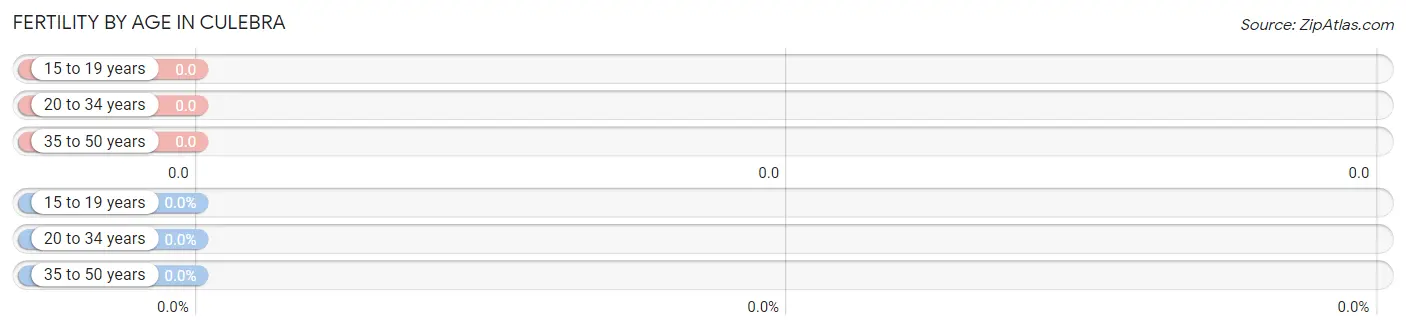
Fertility by Age in Culebra
| Age Bracket | Women with Births | Births / 1,000 Women |
| 15 to 19 years | 0 (0.0%) | 0.0 |
| 20 to 34 years | 0 (0.0%) | 0.0 |
| 35 to 50 years | 0 (0.0%) | 0.0 |
| Total | 0 (0.0%) | 0.0 |
Fertility by Age by Marriage Status in Culebra
| Age Bracket | Married | Unmarried |
| 15 to 19 years | 0 (0.0%) | 0 (0.0%) |
| 20 to 34 years | 0 (0.0%) | 0 (0.0%) |
| 35 to 50 years | 0 (0.0%) | 0 (0.0%) |
| Total | 0 (0.0%) | 0 (0.0%) |
Fertility by Education in Culebra
| Educational Attainment | Women with Births | Births / 1,000 Women |
| Less than High School | 0 (0.0%) | 0.0 |
| High School Diploma | 0 (0.0%) | 0.0 |
| College or Associate's Degree | 0 (0.0%) | 0.0 |
| Bachelor's Degree | 0 (0.0%) | 0.0 |
| Graduate Degree | 0 (0.0%) | 0.0 |
| Total | 0 (0.0%) | 0.0 |
Fertility by Education by Marriage Status in Culebra
| Educational Attainment | Married | Unmarried |
| Less than High School | 0 (0.0%) | 0 (0.0%) |
| High School Diploma | 0 (0.0%) | 0 (0.0%) |
| College or Associate's Degree | 0 (0.0%) | 0 (0.0%) |
| Bachelor's Degree | 0 (0.0%) | 0 (0.0%) |
| Graduate Degree | 0 (0.0%) | 0 (0.0%) |
| Total | 0 (0.0%) | 0 (0.0%) |
Employment Characteristics in Culebra
Employment by Class of Employer in Culebra
Among the 513 employed individuals in Culebra, private company employees (151 | 29.4%), local government employees (143 | 27.9%), and self-employed (not incorporated) (126 | 24.6%) make up the most common classes of employment.
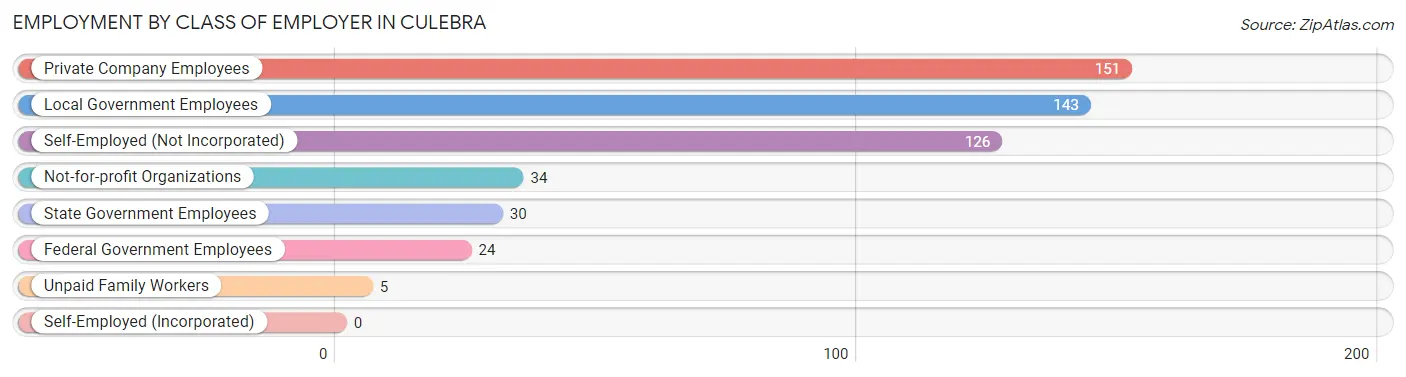
| Employer Class | # Employees | % Employees |
| Private Company Employees | 151 | 29.4% |
| Self-Employed (Incorporated) | 0 | 0.0% |
| Self-Employed (Not Incorporated) | 126 | 24.6% |
| Not-for-profit Organizations | 34 | 6.6% |
| Local Government Employees | 143 | 27.9% |
| State Government Employees | 30 | 5.9% |
| Federal Government Employees | 24 | 4.7% |
| Unpaid Family Workers | 5 | 1.0% |
| Total | 513 | 100.0% |
Employment Status by Age in Culebra
According to the labor force statistics for Culebra, out of the total population over 16 years of age (880), 60.5% or 532 individuals are in the labor force, with 3.6% or 19 of them unemployed. The age group with the highest labor force participation rate is 30 to 34 years, with 100.0% or 23 individuals in the labor force. Within the labor force, the 35 to 44 years age range has the highest percentage of unemployed individuals, with 9.4% or 11 of them being unemployed.
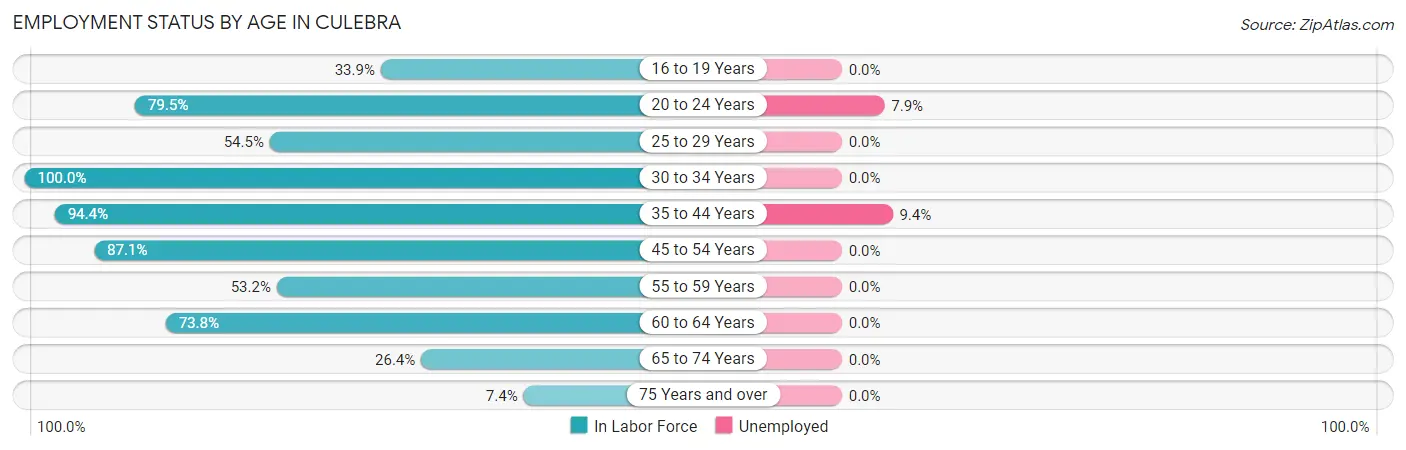
| Age Bracket | In Labor Force | Unemployed |
| 16 to 19 Years | 21 (33.9%) | 0 (0.0%) |
| 20 to 24 Years | 101 (79.5%) | 8 (7.9%) |
| 25 to 29 Years | 24 (54.5%) | 0 (0.0%) |
| 30 to 34 Years | 23 (100.0%) | 0 (0.0%) |
| 35 to 44 Years | 117 (94.4%) | 11 (9.4%) |
| 45 to 54 Years | 148 (87.1%) | 0 (0.0%) |
| 55 to 59 Years | 33 (53.2%) | 0 (0.0%) |
| 60 to 64 Years | 31 (73.8%) | 0 (0.0%) |
| 65 to 74 Years | 24 (26.4%) | 0 (0.0%) |
| 75 Years and over | 10 (7.4%) | 0 (0.0%) |
| Total | 532 (60.5%) | 19 (3.6%) |
Employment Status by Educational Attainment in Culebra
According to labor force statistics for Culebra, 80.9% of individuals (376) out of the total population between 25 and 64 years of age (465) are in the labor force, with 2.9% or 11 of them being unemployed. The group with the highest labor force participation rate are those with the educational attainment of bachelor's degree or higher, with 93.5% or 72 individuals in the labor force. Within the labor force, individuals with college / associate degree education have the highest percentage of unemployment, with 8.6% or 11 of them being unemployed.
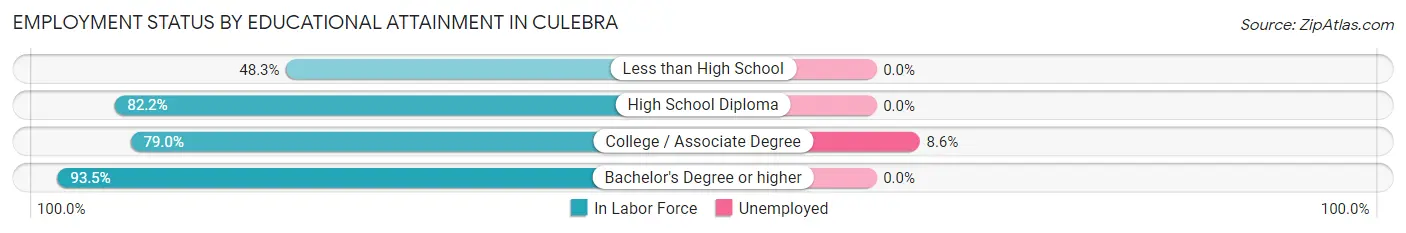
| Educational Attainment | In Labor Force | Unemployed |
| Less than High School | 14 (48.3%) | 0 (0.0%) |
| High School Diploma | 162 (82.2%) | 0 (0.0%) |
| College / Associate Degree | 128 (79.0%) | 14 (8.6%) |
| Bachelor's Degree or higher | 72 (93.5%) | 0 (0.0%) |
| Total | 376 (80.9%) | 13 (2.9%) |
Employment Occupations by Sex in Culebra
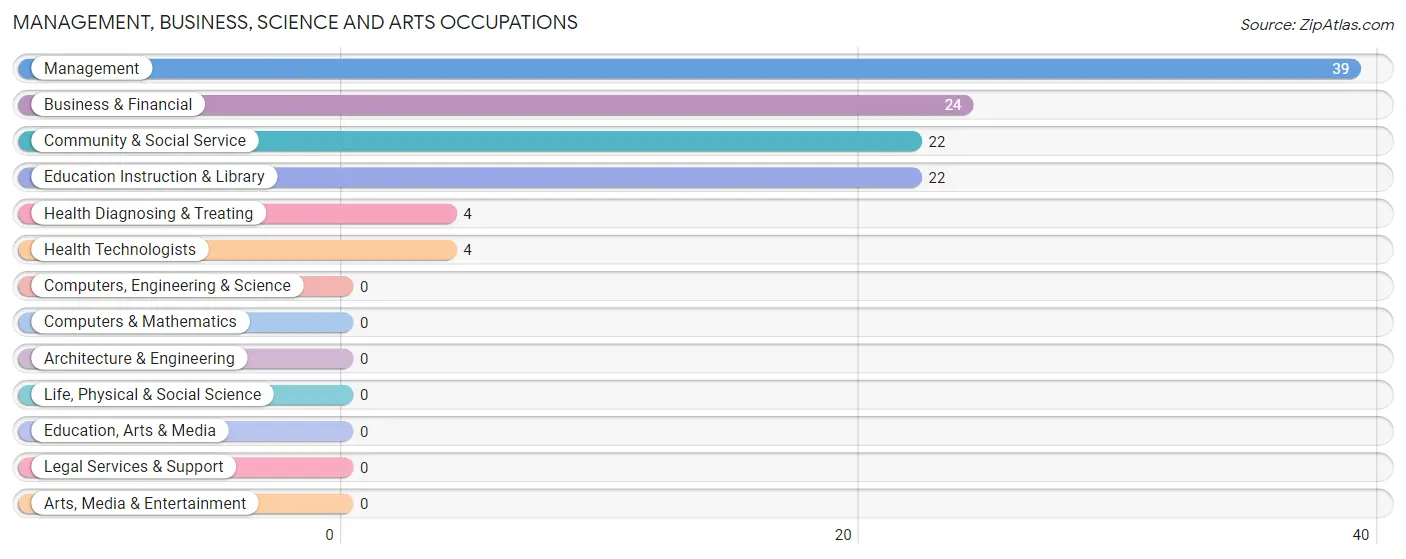
Management, Business, Science and Arts Occupations
The most common Management, Business, Science and Arts occupations in Culebra are Management (39 | 7.6%), Business & Financial (24 | 4.7%), Community & Social Service (22 | 4.3%), Education Instruction & Library (22 | 4.3%), and Health Diagnosing & Treating (4 | 0.8%).
Management, Business, Science and Arts Occupations by Sex
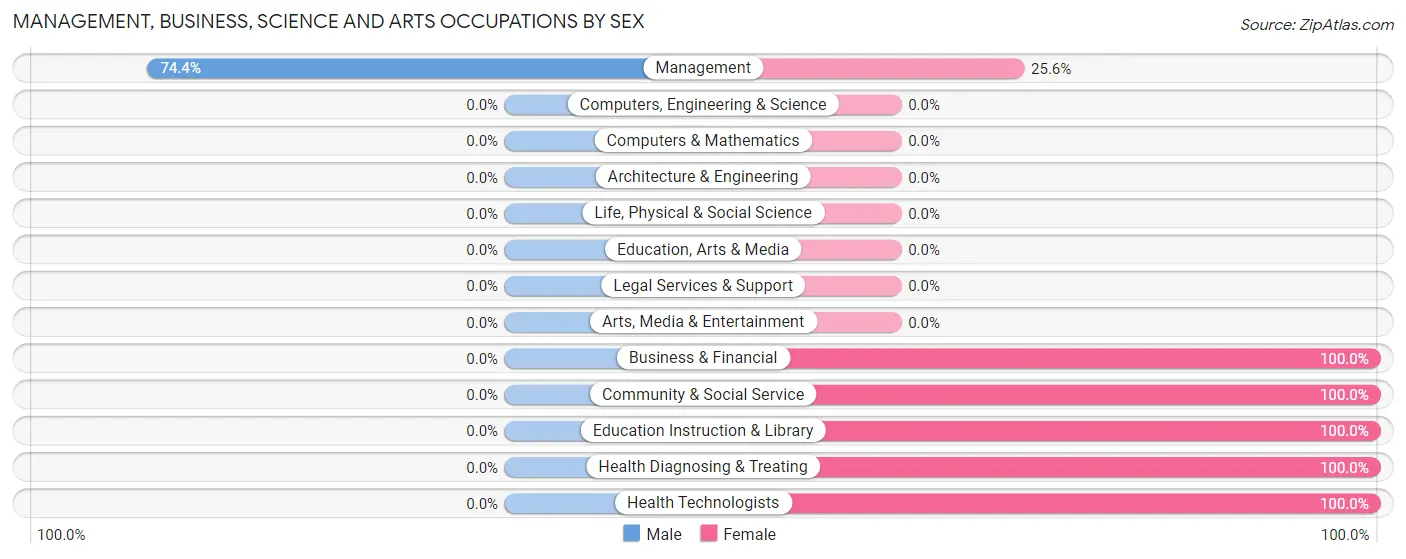
| Occupation | Male | Female |
| Management | 29 (74.4%) | 10 (25.6%) |
| Business & Financial | 0 (0.0%) | 24 (100.0%) |
| Computers, Engineering & Science | 0 (0.0%) | 0 (0.0%) |
| Computers & Mathematics | 0 (0.0%) | 0 (0.0%) |
| Architecture & Engineering | 0 (0.0%) | 0 (0.0%) |
| Life, Physical & Social Science | 0 (0.0%) | 0 (0.0%) |
| Community & Social Service | 0 (0.0%) | 22 (100.0%) |
| Education, Arts & Media | 0 (0.0%) | 0 (0.0%) |
| Legal Services & Support | 0 (0.0%) | 0 (0.0%) |
| Education Instruction & Library | 0 (0.0%) | 22 (100.0%) |
| Arts, Media & Entertainment | 0 (0.0%) | 0 (0.0%) |
| Health Diagnosing & Treating | 0 (0.0%) | 4 (100.0%) |
| Health Technologists | 0 (0.0%) | 4 (100.0%) |
| Total (Category) | 29 (32.6%) | 60 (67.4%) |
| Total (Overall) | 272 (53.0%) | 241 (47.0%) |
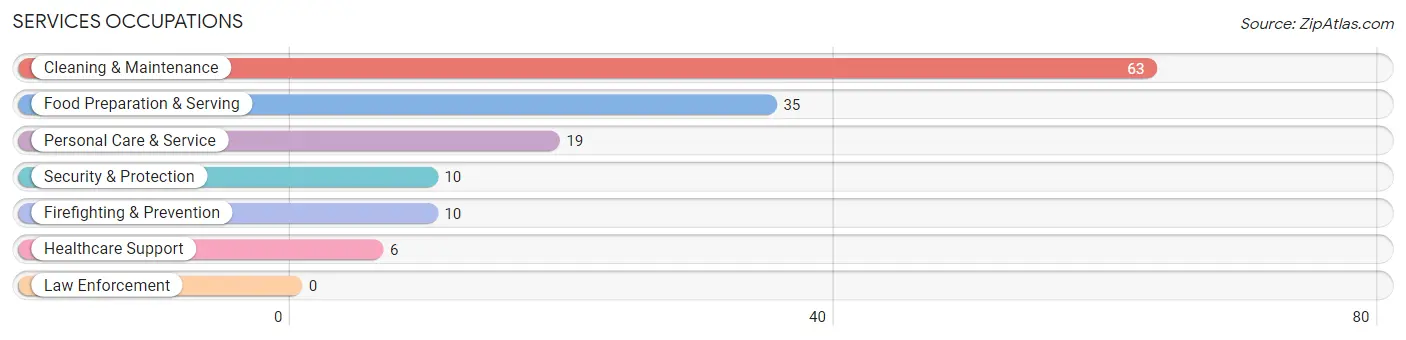
Services Occupations
The most common Services occupations in Culebra are Cleaning & Maintenance (63 | 12.3%), Food Preparation & Serving (35 | 6.8%), Personal Care & Service (19 | 3.7%), Security & Protection (10 | 1.9%), and Firefighting & Prevention (10 | 1.9%).
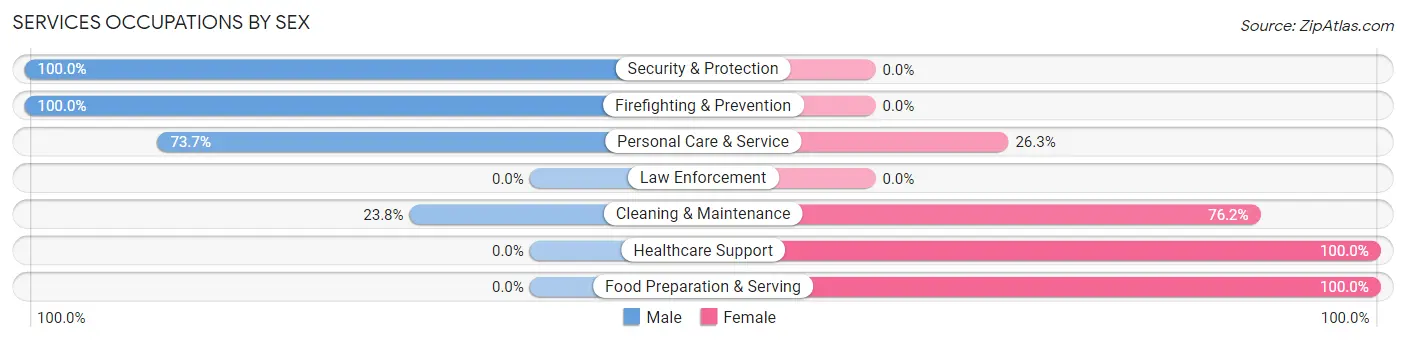
Services Occupations by Sex
Within the Services occupations in Culebra, the most male-oriented occupations are Security & Protection (100.0%), Firefighting & Prevention (100.0%), and Personal Care & Service (73.7%), while the most female-oriented occupations are Healthcare Support (100.0%), Food Preparation & Serving (100.0%), and Cleaning & Maintenance (76.2%).
| Occupation | Male | Female |
| Healthcare Support | 0 (0.0%) | 6 (100.0%) |
| Security & Protection | 10 (100.0%) | 0 (0.0%) |
| Firefighting & Prevention | 10 (100.0%) | 0 (0.0%) |
| Law Enforcement | 0 (0.0%) | 0 (0.0%) |
| Food Preparation & Serving | 0 (0.0%) | 35 (100.0%) |
| Cleaning & Maintenance | 15 (23.8%) | 48 (76.2%) |
| Personal Care & Service | 14 (73.7%) | 5 (26.3%) |
| Total (Category) | 39 (29.3%) | 94 (70.7%) |
| Total (Overall) | 272 (53.0%) | 241 (47.0%) |
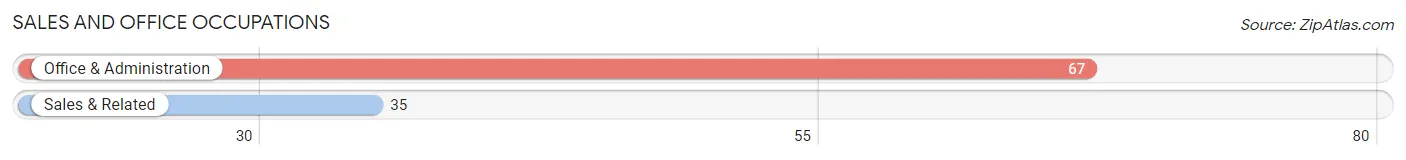
Sales and Office Occupations
The most common Sales and Office occupations in Culebra are Office & Administration (67 | 13.1%), and Sales & Related (35 | 6.8%).
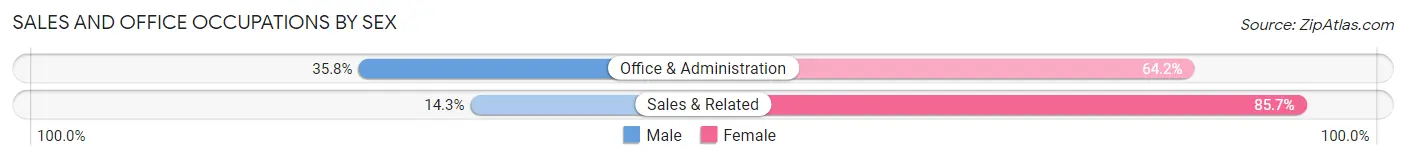
Sales and Office Occupations by Sex
| Occupation | Male | Female |
| Sales & Related | 5 (14.3%) | 30 (85.7%) |
| Office & Administration | 24 (35.8%) | 43 (64.2%) |
| Total (Category) | 29 (28.4%) | 73 (71.6%) |
| Total (Overall) | 272 (53.0%) | 241 (47.0%) |
Natural Resources, Construction and Maintenance Occupations
The most common Natural Resources, Construction and Maintenance occupations in Culebra are Construction & Extraction (71 | 13.8%), Installation, Maintenance & Repair (23 | 4.5%), and Farming, Fishing & Forestry (12 | 2.3%).
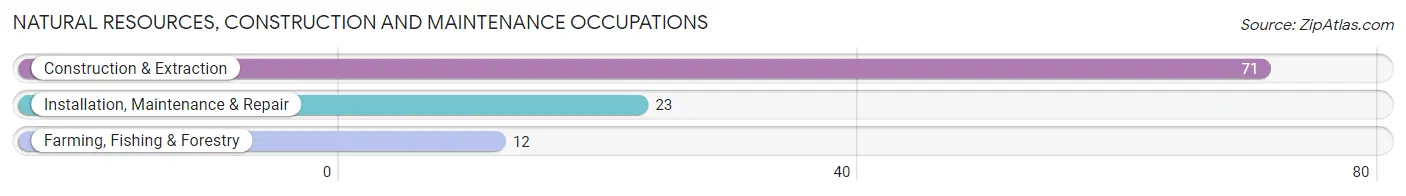
Natural Resources, Construction and Maintenance Occupations by Sex
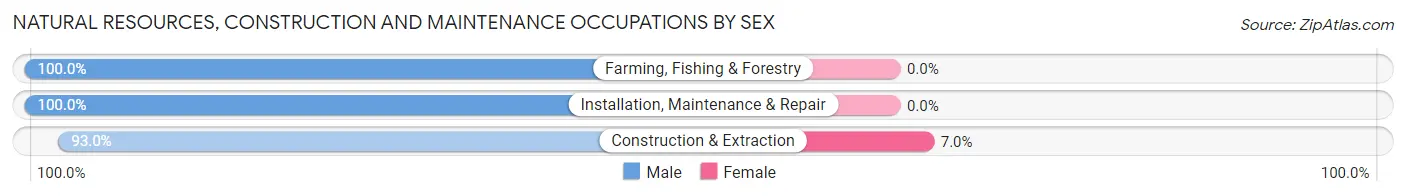
| Occupation | Male | Female |
| Farming, Fishing & Forestry | 12 (100.0%) | 0 (0.0%) |
| Construction & Extraction | 66 (93.0%) | 5 (7.0%) |
| Installation, Maintenance & Repair | 23 (100.0%) | 0 (0.0%) |
| Total (Category) | 101 (95.3%) | 5 (4.7%) |
| Total (Overall) | 272 (53.0%) | 241 (47.0%) |
Production, Transportation and Moving Occupations
The most common Production, Transportation and Moving occupations in Culebra are Transportation (42 | 8.2%), Material Moving (33 | 6.4%), and Production (8 | 1.6%).
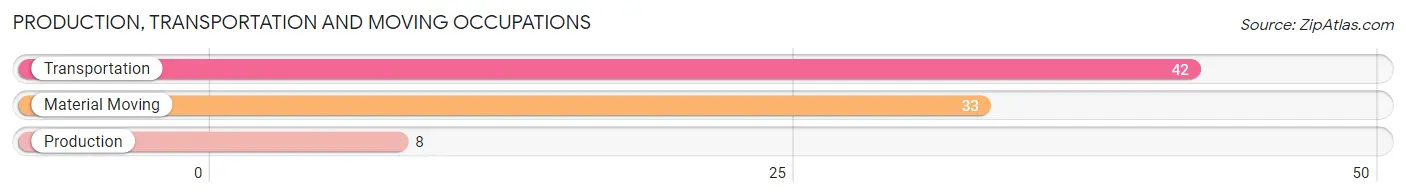
Production, Transportation and Moving Occupations by Sex
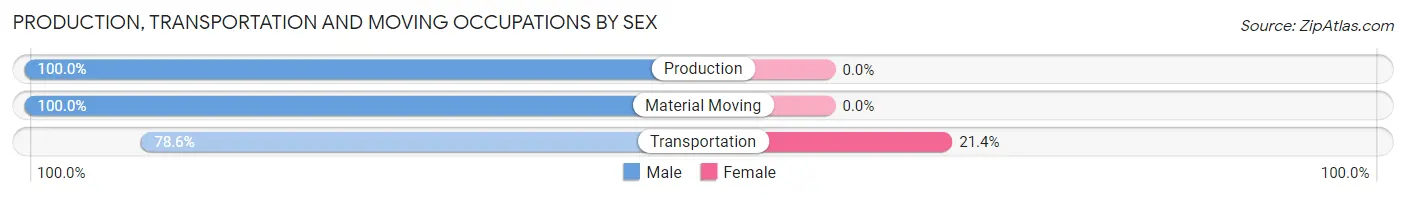
| Occupation | Male | Female |
| Production | 8 (100.0%) | 0 (0.0%) |
| Transportation | 33 (78.6%) | 9 (21.4%) |
| Material Moving | 33 (100.0%) | 0 (0.0%) |
| Total (Category) | 74 (89.2%) | 9 (10.8%) |
| Total (Overall) | 272 (53.0%) | 241 (47.0%) |
Employment Industries by Sex in Culebra
Employment Industries in Culebra
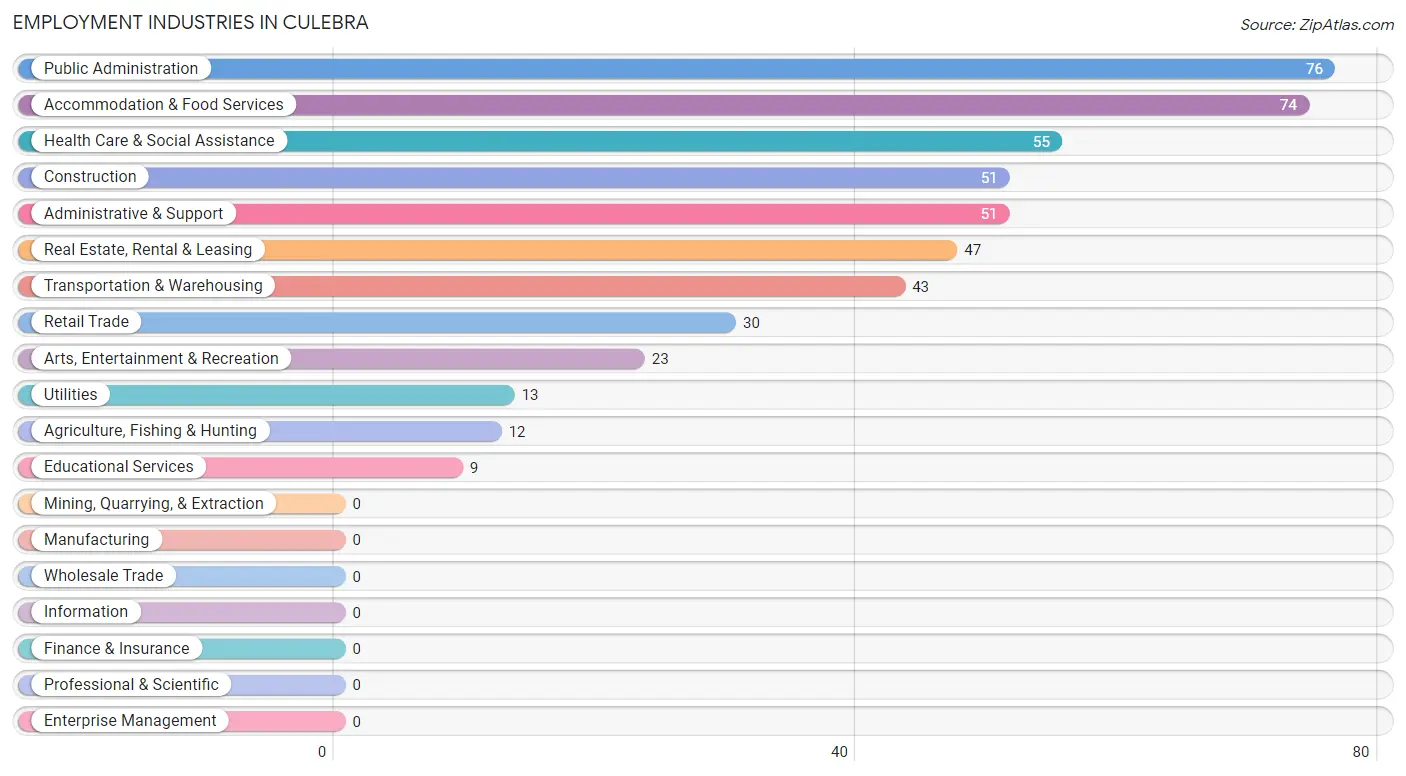
The major employment industries in Culebra include Public Administration (76 | 14.8%), Accommodation & Food Services (74 | 14.4%), Health Care & Social Assistance (55 | 10.7%), Construction (51 | 9.9%), and Administrative & Support (51 | 9.9%).
Employment Industries by Sex in Culebra
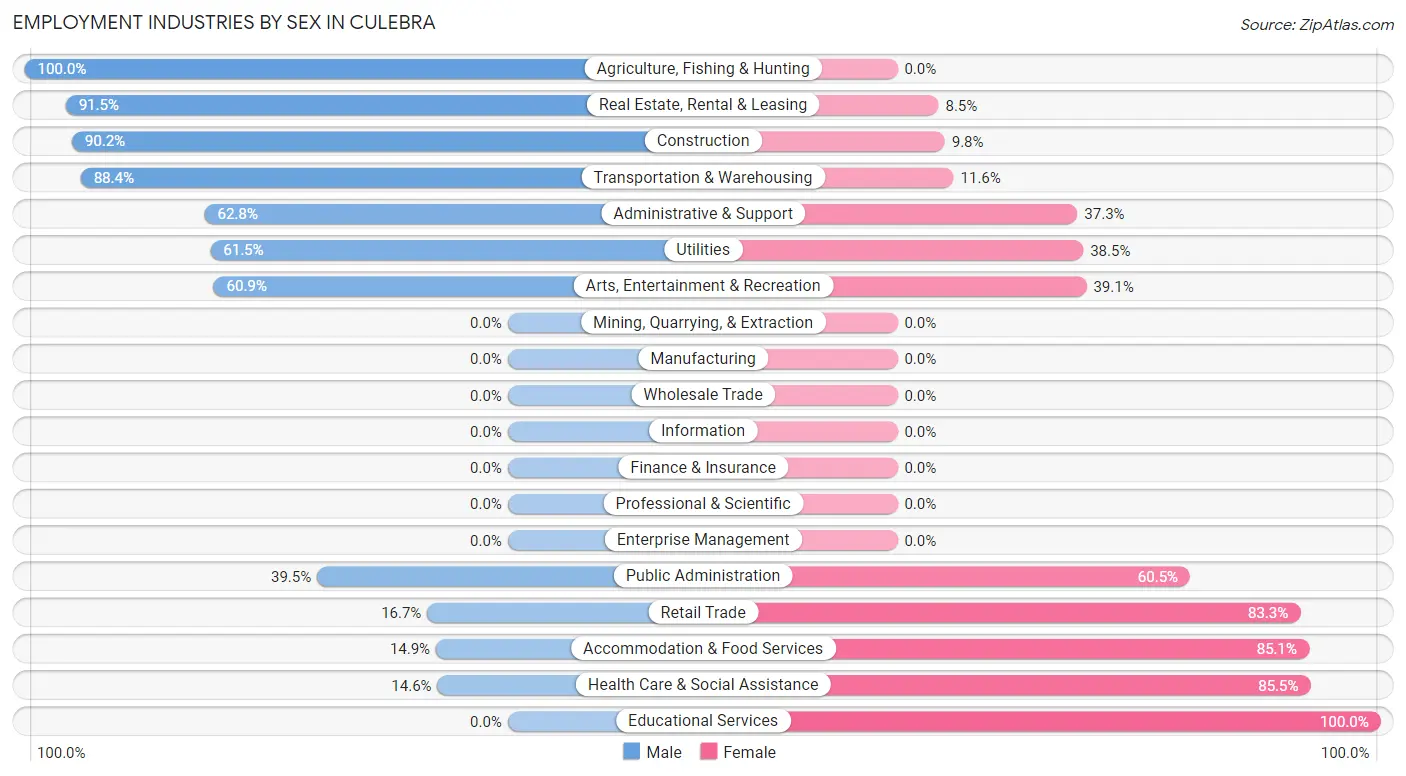
The Culebra industries that see more men than women are Agriculture, Fishing & Hunting (100.0%), Real Estate, Rental & Leasing (91.5%), and Construction (90.2%), whereas the industries that tend to have a higher number of women are Educational Services (100.0%), Health Care & Social Assistance (85.5%), and Accommodation & Food Services (85.1%).
| Industry | Male | Female |
| Agriculture, Fishing & Hunting | 12 (100.0%) | 0 (0.0%) |
| Mining, Quarrying, & Extraction | 0 (0.0%) | 0 (0.0%) |
| Construction | 46 (90.2%) | 5 (9.8%) |
| Manufacturing | 0 (0.0%) | 0 (0.0%) |
| Wholesale Trade | 0 (0.0%) | 0 (0.0%) |
| Retail Trade | 5 (16.7%) | 25 (83.3%) |
| Transportation & Warehousing | 38 (88.4%) | 5 (11.6%) |
| Utilities | 8 (61.5%) | 5 (38.5%) |
| Information | 0 (0.0%) | 0 (0.0%) |
| Finance & Insurance | 0 (0.0%) | 0 (0.0%) |
| Real Estate, Rental & Leasing | 43 (91.5%) | 4 (8.5%) |
| Professional & Scientific | 0 (0.0%) | 0 (0.0%) |
| Enterprise Management | 0 (0.0%) | 0 (0.0%) |
| Administrative & Support | 32 (62.7%) | 19 (37.2%) |
| Educational Services | 0 (0.0%) | 9 (100.0%) |
| Health Care & Social Assistance | 8 (14.5%) | 47 (85.5%) |
| Arts, Entertainment & Recreation | 14 (60.9%) | 9 (39.1%) |
| Accommodation & Food Services | 11 (14.9%) | 63 (85.1%) |
| Public Administration | 30 (39.5%) | 46 (60.5%) |
| Total | 272 (53.0%) | 241 (47.0%) |
Education in Culebra
School Enrollment in Culebra
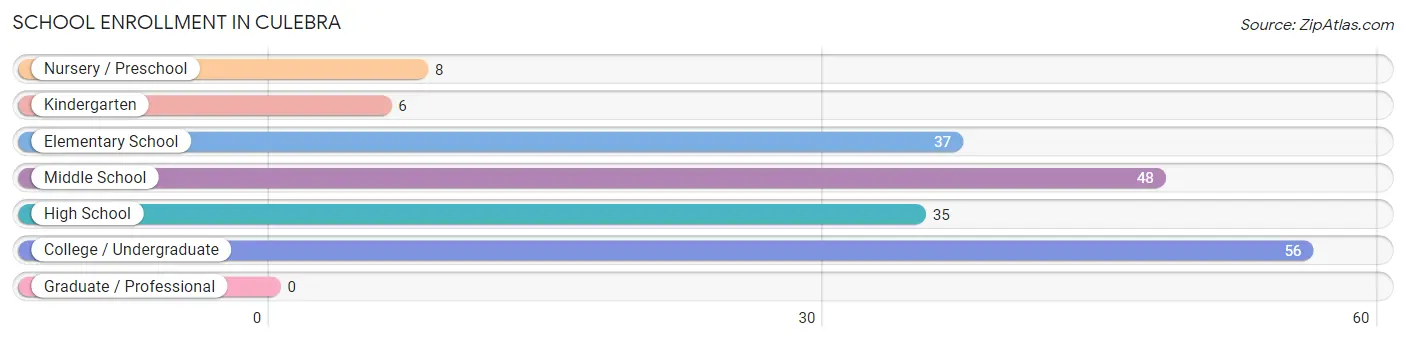
The most common levels of schooling among the 190 students in Culebra are college / undergraduate (56 | 29.5%), middle school (48 | 25.3%), and elementary school (37 | 19.5%).
| School Level | # Students | % Students |
| Nursery / Preschool | 8 | 4.2% |
| Kindergarten | 6 | 3.2% |
| Elementary School | 37 | 19.5% |
| Middle School | 48 | 25.3% |
| High School | 35 | 18.4% |
| College / Undergraduate | 56 | 29.5% |
| Graduate / Professional | 0 | 0.0% |
| Total | 190 | 100.0% |
School Enrollment by Age by Funding Source in Culebra
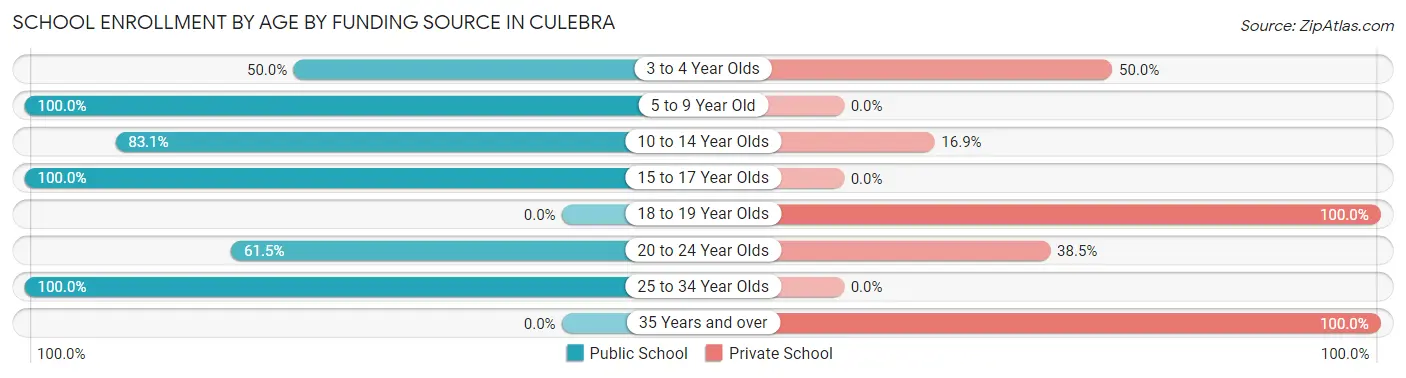
Out of a total of 190 students who are enrolled in schools in Culebra, 36 (18.9%) attend a private institution, while the remaining 154 (81.1%) are enrolled in public schools. The age group of 18 to 19 year olds has the highest likelihood of being enrolled in private schools, with 3 (100.0% in the age bracket) enrolled. Conversely, the age group of 5 to 9 year old has the lowest likelihood of being enrolled in a private school, with 43 (100.0% in the age bracket) attending a public institution.
| Age Bracket | Public School | Private School |
| 3 to 4 Year Olds | 4 (50.0%) | 4 (50.0%) |
| 5 to 9 Year Old | 43 (100.0%) | 0 (0.0%) |
| 10 to 14 Year Olds | 59 (83.1%) | 12 (16.9%) |
| 15 to 17 Year Olds | 12 (100.0%) | 0 (0.0%) |
| 18 to 19 Year Olds | 0 (0.0%) | 3 (100.0%) |
| 20 to 24 Year Olds | 16 (61.5%) | 10 (38.5%) |
| 25 to 34 Year Olds | 20 (100.0%) | 0 (0.0%) |
| 35 Years and over | 0 (0.0%) | 7 (100.0%) |
| Total | 154 (81.1%) | 36 (18.9%) |
Educational Attainment by Field of Study in Culebra
Business (49 | 45.4%), education (15 | 13.9%), computers & mathematics (7 | 6.5%), bio, nature & agricultural (6 | 5.6%), and physical & health sciences (6 | 5.6%) are the most common fields of study among 108 individuals in Culebra who have obtained a bachelor's degree or higher.
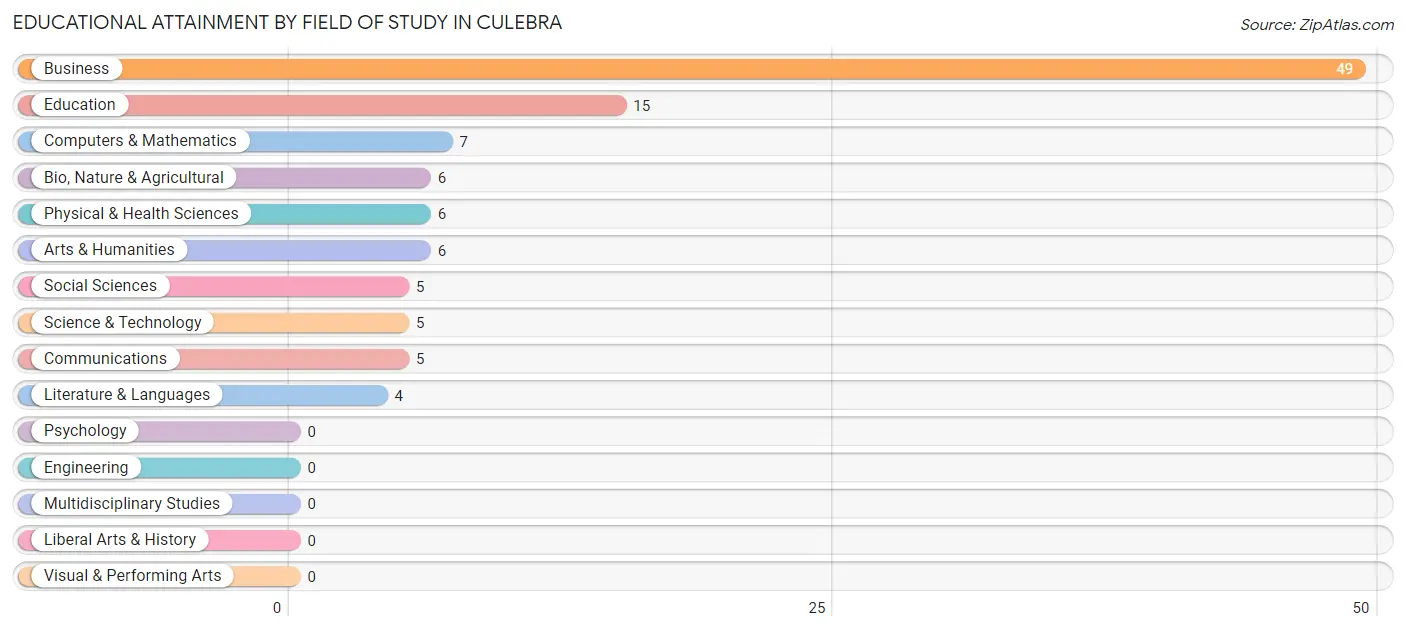
| Field of Study | # Graduates | % Graduates |
| Computers & Mathematics | 7 | 6.5% |
| Bio, Nature & Agricultural | 6 | 5.6% |
| Physical & Health Sciences | 6 | 5.6% |
| Psychology | 0 | 0.0% |
| Social Sciences | 5 | 4.6% |
| Engineering | 0 | 0.0% |
| Multidisciplinary Studies | 0 | 0.0% |
| Science & Technology | 5 | 4.6% |
| Business | 49 | 45.4% |
| Education | 15 | 13.9% |
| Literature & Languages | 4 | 3.7% |
| Liberal Arts & History | 0 | 0.0% |
| Visual & Performing Arts | 0 | 0.0% |
| Communications | 5 | 4.6% |
| Arts & Humanities | 6 | 5.6% |
| Total | 108 | 100.0% |
Transportation & Commute in Culebra
Vehicle Availability by Sex in Culebra
The most prevalent vehicle ownership categories in Culebra are males with 2 vehicles (171, accounting for 62.9%) and females with 2 vehicles (95, making up 71.0%).
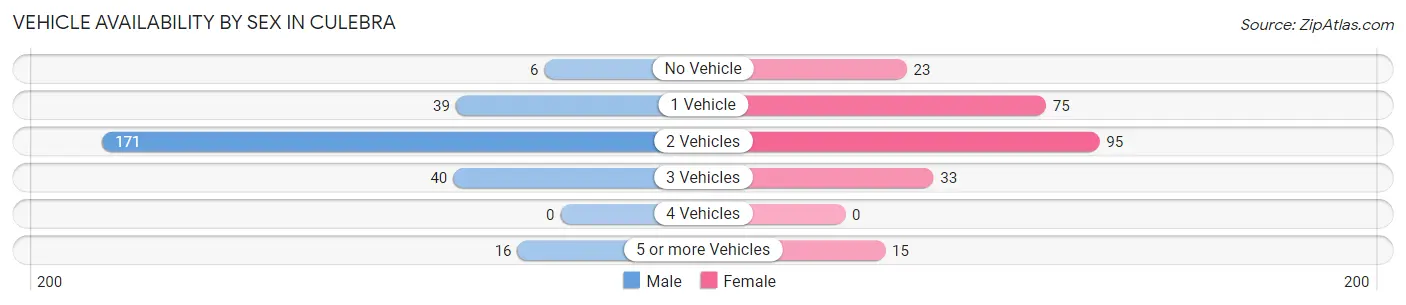
| Vehicles Available | Male | Female |
| No Vehicle | 6 (2.2%) | 23 (9.5%) |
| 1 Vehicle | 39 (14.3%) | 75 (31.1%) |
| 2 Vehicles | 171 (62.9%) | 95 (39.4%) |
| 3 Vehicles | 40 (14.7%) | 33 (13.7%) |
| 4 Vehicles | 0 (0.0%) | 0 (0.0%) |
| 5 or more Vehicles | 16 (5.9%) | 15 (6.2%) |
| Total | 272 (100.0%) | 241 (100.0%) |
Commute Time in Culebra
The most frequently occuring commute durations in Culebra are 10 to 14 minutes (291 commuters, 59.2%), 15 to 19 minutes (104 commuters, 21.1%), and 5 to 9 minutes (47 commuters, 9.6%).
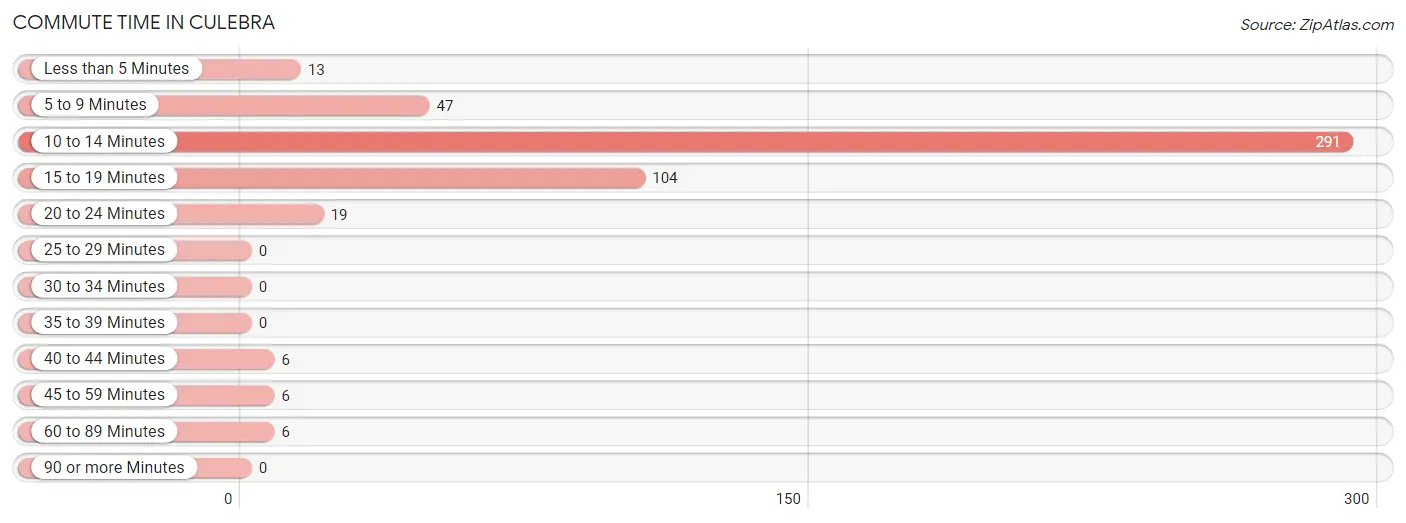
| Commute Time | # Commuters | % Commuters |
| Less than 5 Minutes | 13 | 2.6% |
| 5 to 9 Minutes | 47 | 9.6% |
| 10 to 14 Minutes | 291 | 59.2% |
| 15 to 19 Minutes | 104 | 21.1% |
| 20 to 24 Minutes | 19 | 3.9% |
| 25 to 29 Minutes | 0 | 0.0% |
| 30 to 34 Minutes | 0 | 0.0% |
| 35 to 39 Minutes | 0 | 0.0% |
| 40 to 44 Minutes | 6 | 1.2% |
| 45 to 59 Minutes | 6 | 1.2% |
| 60 to 89 Minutes | 6 | 1.2% |
| 90 or more Minutes | 0 | 0.0% |
Commute Time by Sex in Culebra
The most common commute times in Culebra are 10 to 14 minutes (143 commuters, 53.8%) for males and 10 to 14 minutes (148 commuters, 65.5%) for females.
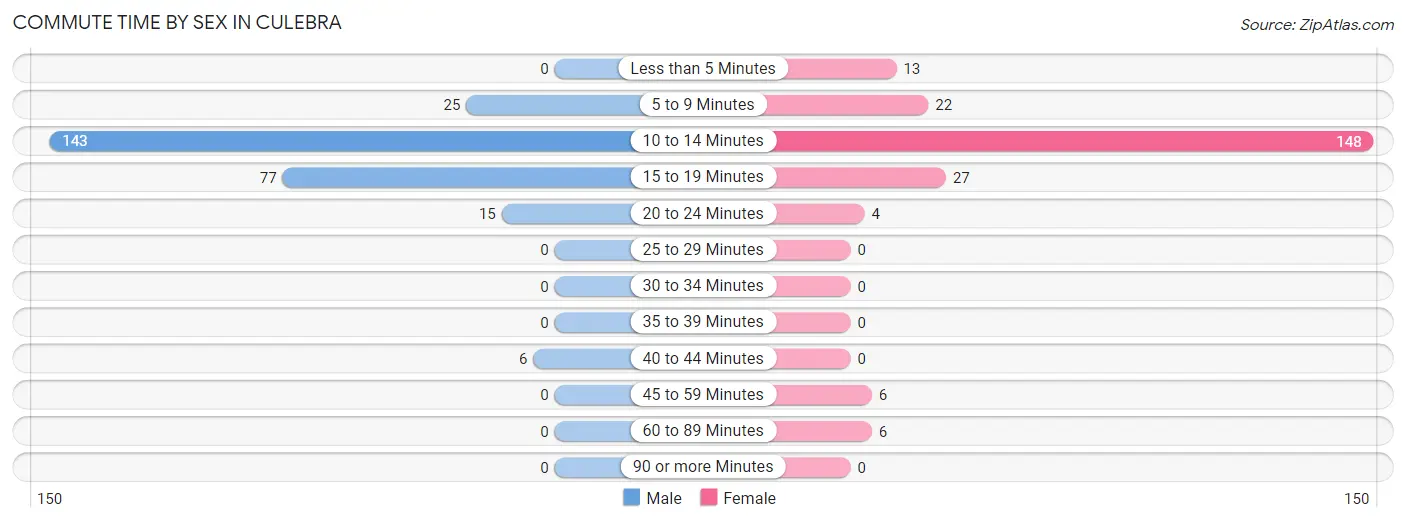
| Commute Time | Male | Female |
| Less than 5 Minutes | 0 (0.0%) | 13 (5.8%) |
| 5 to 9 Minutes | 25 (9.4%) | 22 (9.7%) |
| 10 to 14 Minutes | 143 (53.8%) | 148 (65.5%) |
| 15 to 19 Minutes | 77 (28.9%) | 27 (11.9%) |
| 20 to 24 Minutes | 15 (5.6%) | 4 (1.8%) |
| 25 to 29 Minutes | 0 (0.0%) | 0 (0.0%) |
| 30 to 34 Minutes | 0 (0.0%) | 0 (0.0%) |
| 35 to 39 Minutes | 0 (0.0%) | 0 (0.0%) |
| 40 to 44 Minutes | 6 (2.3%) | 0 (0.0%) |
| 45 to 59 Minutes | 0 (0.0%) | 6 (2.6%) |
| 60 to 89 Minutes | 0 (0.0%) | 6 (2.6%) |
| 90 or more Minutes | 0 (0.0%) | 0 (0.0%) |
Time of Departure to Work by Sex in Culebra
The most frequent times of departure to work in Culebra are 6:30 AM to 6:59 AM (55, 20.7%) for males and 6:30 AM to 6:59 AM (43, 19.0%) for females.
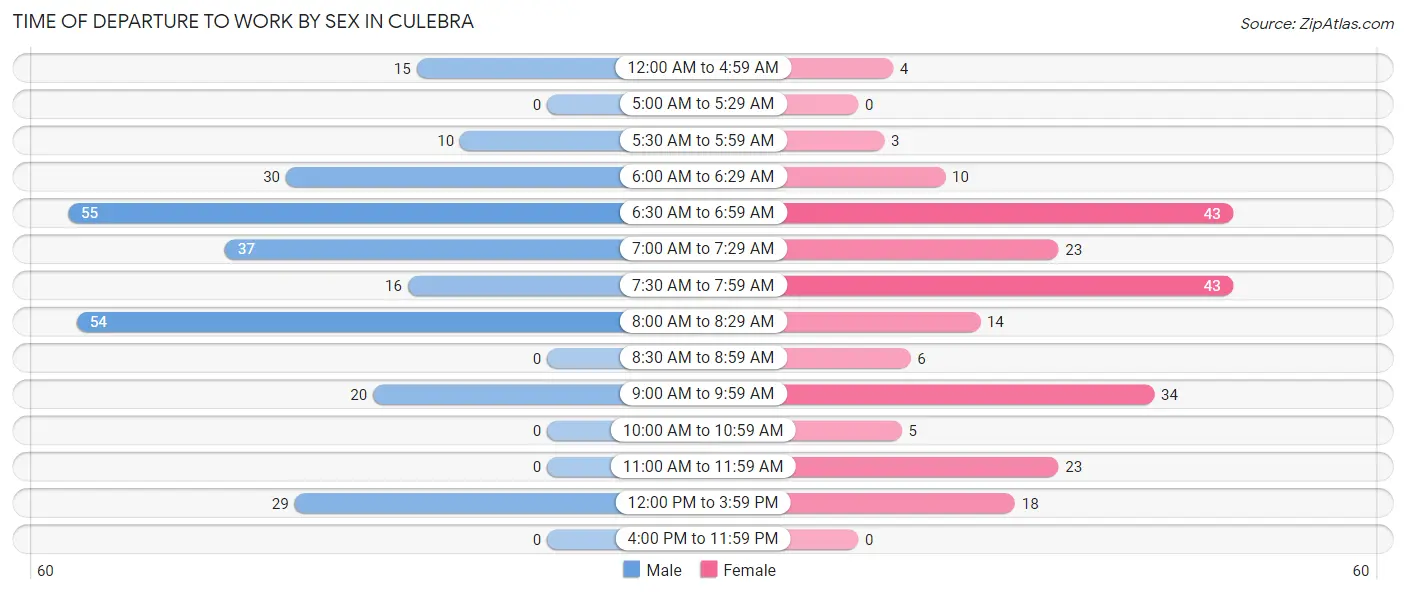
| Time of Departure | Male | Female |
| 12:00 AM to 4:59 AM | 15 (5.6%) | 4 (1.8%) |
| 5:00 AM to 5:29 AM | 0 (0.0%) | 0 (0.0%) |
| 5:30 AM to 5:59 AM | 10 (3.8%) | 3 (1.3%) |
| 6:00 AM to 6:29 AM | 30 (11.3%) | 10 (4.4%) |
| 6:30 AM to 6:59 AM | 55 (20.7%) | 43 (19.0%) |
| 7:00 AM to 7:29 AM | 37 (13.9%) | 23 (10.2%) |
| 7:30 AM to 7:59 AM | 16 (6.0%) | 43 (19.0%) |
| 8:00 AM to 8:29 AM | 54 (20.3%) | 14 (6.2%) |
| 8:30 AM to 8:59 AM | 0 (0.0%) | 6 (2.6%) |
| 9:00 AM to 9:59 AM | 20 (7.5%) | 34 (15.0%) |
| 10:00 AM to 10:59 AM | 0 (0.0%) | 5 (2.2%) |
| 11:00 AM to 11:59 AM | 0 (0.0%) | 23 (10.2%) |
| 12:00 PM to 3:59 PM | 29 (10.9%) | 18 (8.0%) |
| 4:00 PM to 11:59 PM | 0 (0.0%) | 0 (0.0%) |
| Total | 266 (100.0%) | 226 (100.0%) |
Housing Occupancy in Culebra
Occupancy by Ownership in Culebra
Of the total 395 dwellings in Culebra, owner-occupied units account for 236 (59.8%), while renter-occupied units make up 159 (40.3%).
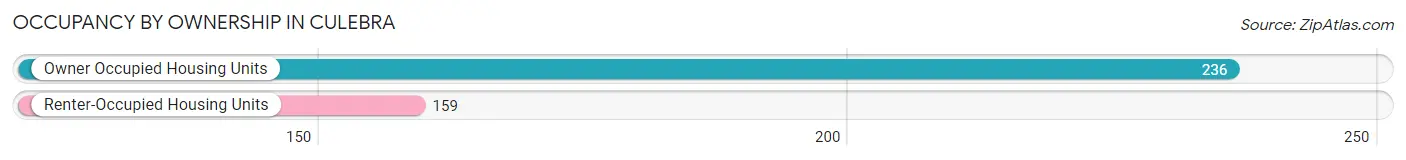
| Occupancy | # Housing Units | % Housing Units |
| Owner Occupied Housing Units | 236 | 59.8% |
| Renter-Occupied Housing Units | 159 | 40.3% |
| Total Occupied Housing Units | 395 | 100.0% |
Occupancy by Household Size in Culebra
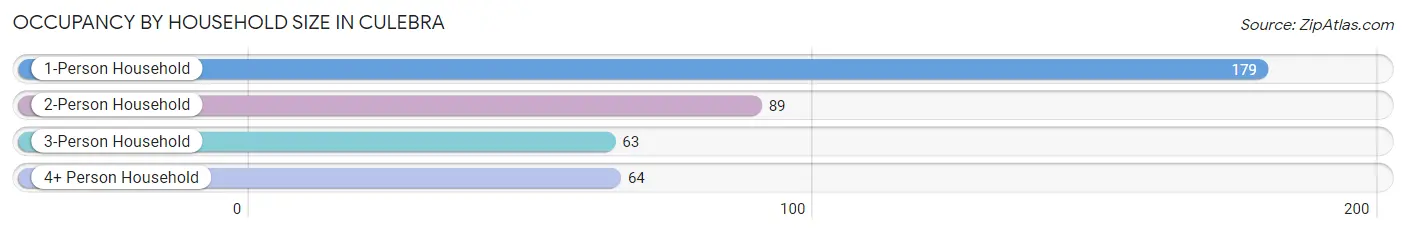
| Household Size | # Housing Units | % Housing Units |
| 1-Person Household | 179 | 45.3% |
| 2-Person Household | 89 | 22.5% |
| 3-Person Household | 63 | 16.0% |
| 4+ Person Household | 64 | 16.2% |
| Total Housing Units | 395 | 100.0% |
Occupancy by Ownership by Household Size in Culebra
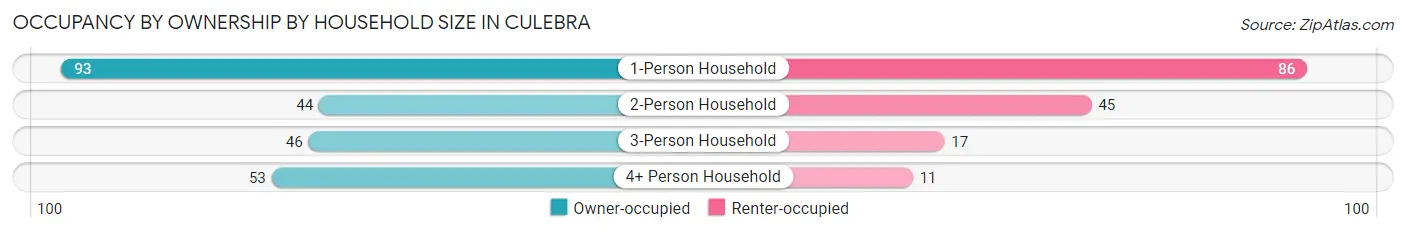
| Household Size | Owner-occupied | Renter-occupied |
| 1-Person Household | 93 (52.0%) | 86 (48.0%) |
| 2-Person Household | 44 (49.4%) | 45 (50.6%) |
| 3-Person Household | 46 (73.0%) | 17 (27.0%) |
| 4+ Person Household | 53 (82.8%) | 11 (17.2%) |
| Total Housing Units | 236 (59.8%) | 159 (40.3%) |
Occupancy by Educational Attainment in Culebra
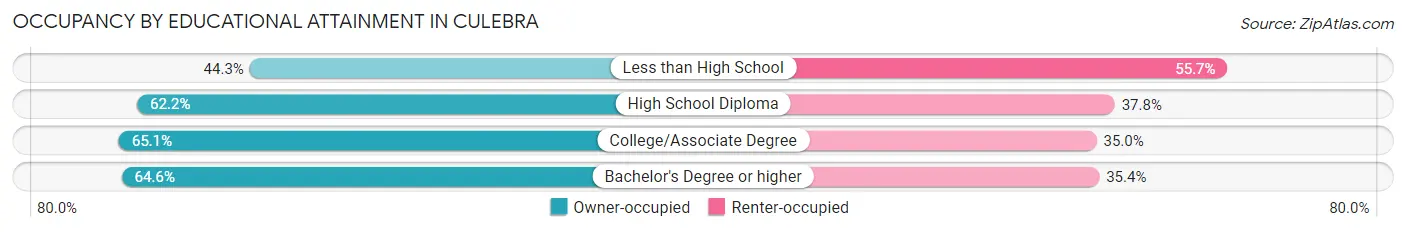
| Household Size | Owner-occupied | Renter-occupied |
| Less than High School | 35 (44.3%) | 44 (55.7%) |
| High School Diploma | 92 (62.2%) | 56 (37.8%) |
| College/Associate Degree | 67 (65.0%) | 36 (34.9%) |
| Bachelor's Degree or higher | 42 (64.6%) | 23 (35.4%) |
Occupancy by Age of Householder in Culebra
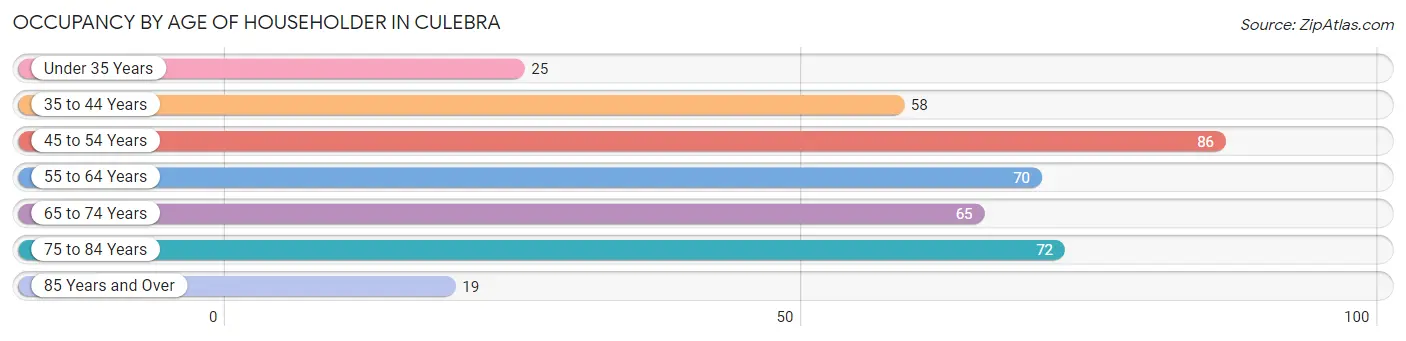
| Age Bracket | # Households | % Households |
| Under 35 Years | 25 | 6.3% |
| 35 to 44 Years | 58 | 14.7% |
| 45 to 54 Years | 86 | 21.8% |
| 55 to 64 Years | 70 | 17.7% |
| 65 to 74 Years | 65 | 16.5% |
| 75 to 84 Years | 72 | 18.2% |
| 85 Years and Over | 19 | 4.8% |
| Total | 395 | 100.0% |
Housing Finances in Culebra
Median Income by Occupancy in Culebra
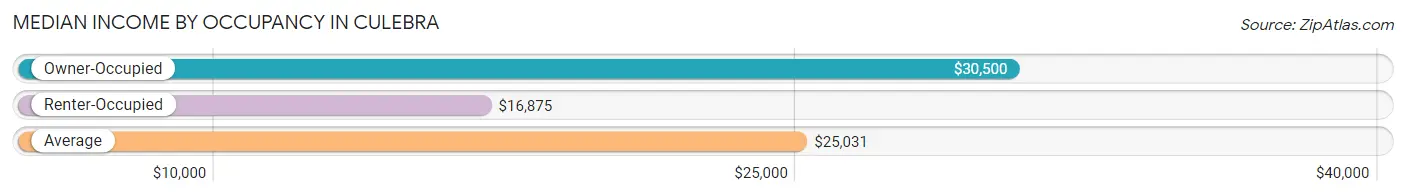
| Occupancy Type | # Households | Median Income |
| Owner-Occupied | 236 (59.8%) | $30,500 |
| Renter-Occupied | 159 (40.3%) | $16,875 |
| Average | 395 (100.0%) | $25,031 |
Occupancy by Householder Income Bracket in Culebra
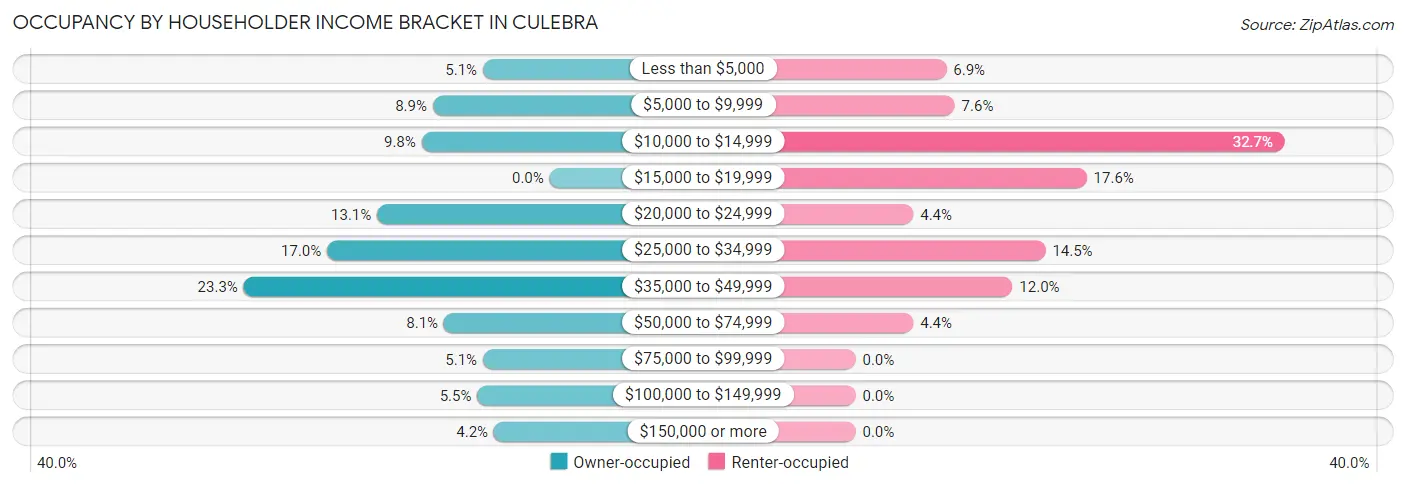
| Income Bracket | Owner-occupied | Renter-occupied |
| Less than $5,000 | 12 (5.1%) | 11 (6.9%) |
| $5,000 to $9,999 | 21 (8.9%) | 12 (7.5%) |
| $10,000 to $14,999 | 23 (9.8%) | 52 (32.7%) |
| $15,000 to $19,999 | 0 (0.0%) | 28 (17.6%) |
| $20,000 to $24,999 | 31 (13.1%) | 7 (4.4%) |
| $25,000 to $34,999 | 40 (17.0%) | 23 (14.5%) |
| $35,000 to $49,999 | 55 (23.3%) | 19 (11.9%) |
| $50,000 to $74,999 | 19 (8.1%) | 7 (4.4%) |
| $75,000 to $99,999 | 12 (5.1%) | 0 (0.0%) |
| $100,000 to $149,999 | 13 (5.5%) | 0 (0.0%) |
| $150,000 or more | 10 (4.2%) | 0 (0.0%) |
| Total | 236 (100.0%) | 159 (100.0%) |
Monthly Housing Cost Tiers in Culebra
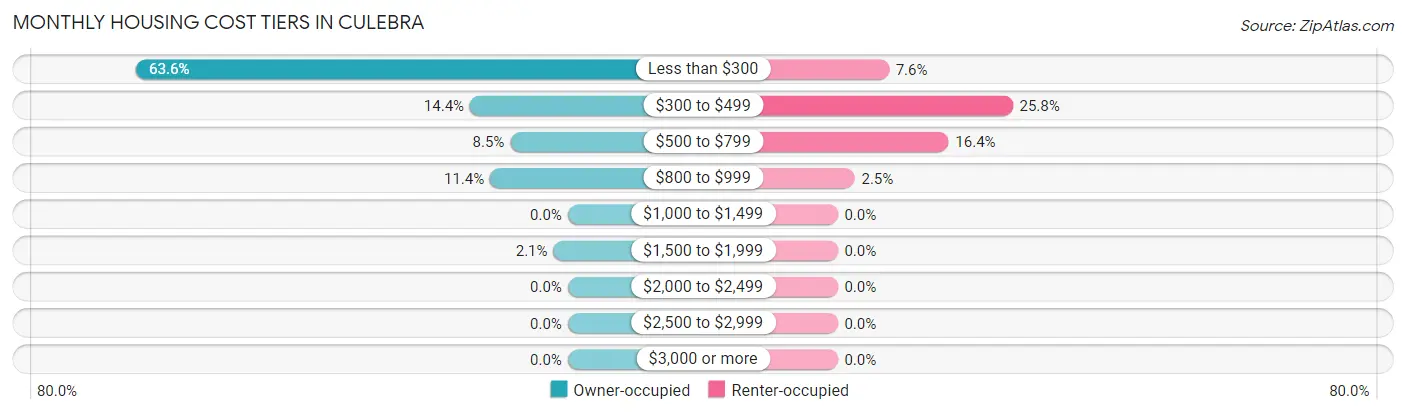
| Monthly Cost | Owner-occupied | Renter-occupied |
| Less than $300 | 150 (63.6%) | 12 (7.5%) |
| $300 to $499 | 34 (14.4%) | 41 (25.8%) |
| $500 to $799 | 20 (8.5%) | 26 (16.4%) |
| $800 to $999 | 27 (11.4%) | 4 (2.5%) |
| $1,000 to $1,499 | 0 (0.0%) | 0 (0.0%) |
| $1,500 to $1,999 | 5 (2.1%) | 0 (0.0%) |
| $2,000 to $2,499 | 0 (0.0%) | 0 (0.0%) |
| $2,500 to $2,999 | 0 (0.0%) | 0 (0.0%) |
| $3,000 or more | 0 (0.0%) | 0 (0.0%) |
| Total | 236 (100.0%) | 159 (100.0%) |
Physical Housing Characteristics in Culebra
Housing Structures in Culebra
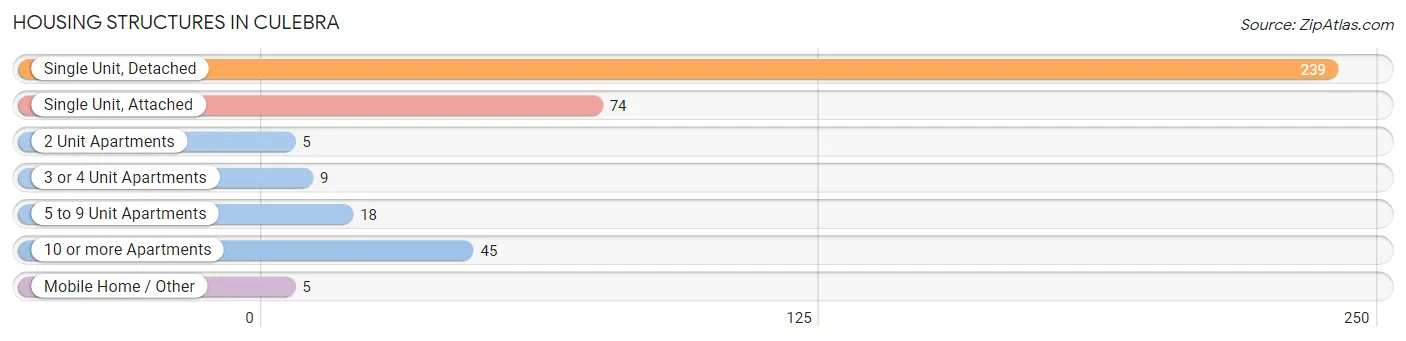
| Structure Type | # Housing Units | % Housing Units |
| Single Unit, Detached | 239 | 60.5% |
| Single Unit, Attached | 74 | 18.7% |
| 2 Unit Apartments | 5 | 1.3% |
| 3 or 4 Unit Apartments | 9 | 2.3% |
| 5 to 9 Unit Apartments | 18 | 4.6% |
| 10 or more Apartments | 45 | 11.4% |
| Mobile Home / Other | 5 | 1.3% |
| Total | 395 | 100.0% |
Housing Structures by Occupancy in Culebra
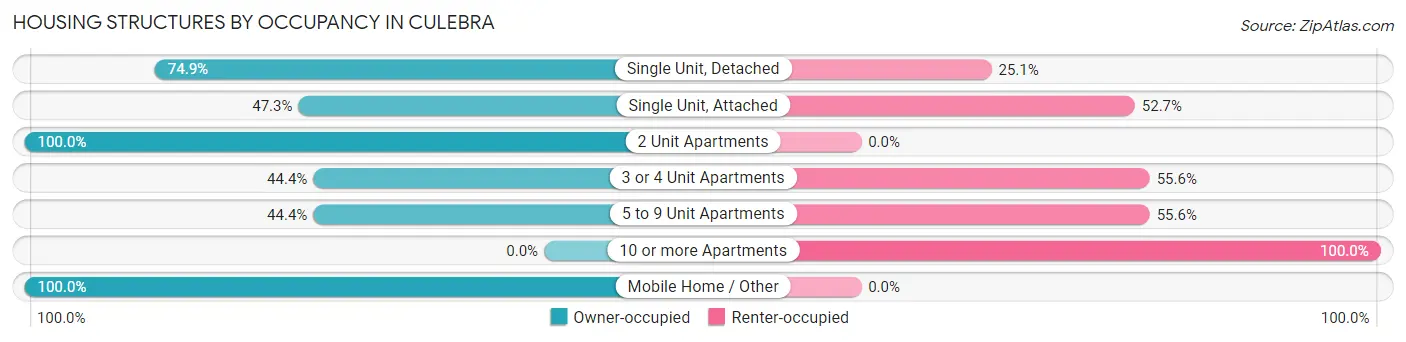
| Structure Type | Owner-occupied | Renter-occupied |
| Single Unit, Detached | 179 (74.9%) | 60 (25.1%) |
| Single Unit, Attached | 35 (47.3%) | 39 (52.7%) |
| 2 Unit Apartments | 5 (100.0%) | 0 (0.0%) |
| 3 or 4 Unit Apartments | 4 (44.4%) | 5 (55.6%) |
| 5 to 9 Unit Apartments | 8 (44.4%) | 10 (55.6%) |
| 10 or more Apartments | 0 (0.0%) | 45 (100.0%) |
| Mobile Home / Other | 5 (100.0%) | 0 (0.0%) |
| Total | 236 (59.8%) | 159 (40.3%) |
Housing Structures by Number of Rooms in Culebra
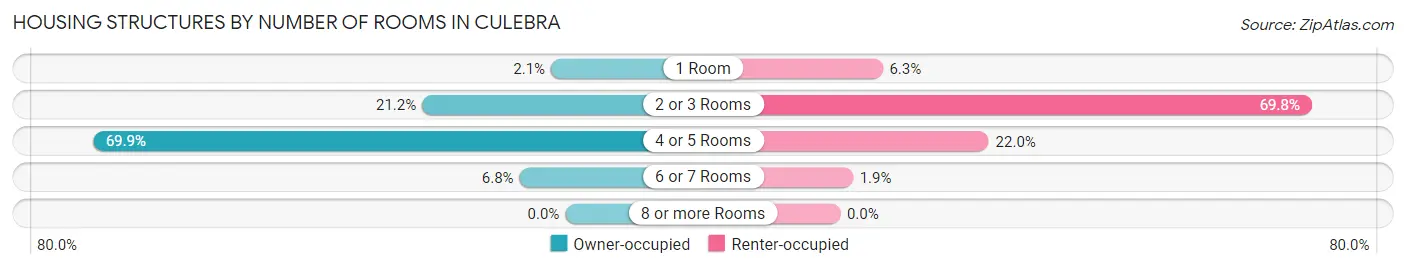
| Number of Rooms | Owner-occupied | Renter-occupied |
| 1 Room | 5 (2.1%) | 10 (6.3%) |
| 2 or 3 Rooms | 50 (21.2%) | 111 (69.8%) |
| 4 or 5 Rooms | 165 (69.9%) | 35 (22.0%) |
| 6 or 7 Rooms | 16 (6.8%) | 3 (1.9%) |
| 8 or more Rooms | 0 (0.0%) | 0 (0.0%) |
| Total | 236 (100.0%) | 159 (100.0%) |
Housing Structure by Heating Type in Culebra
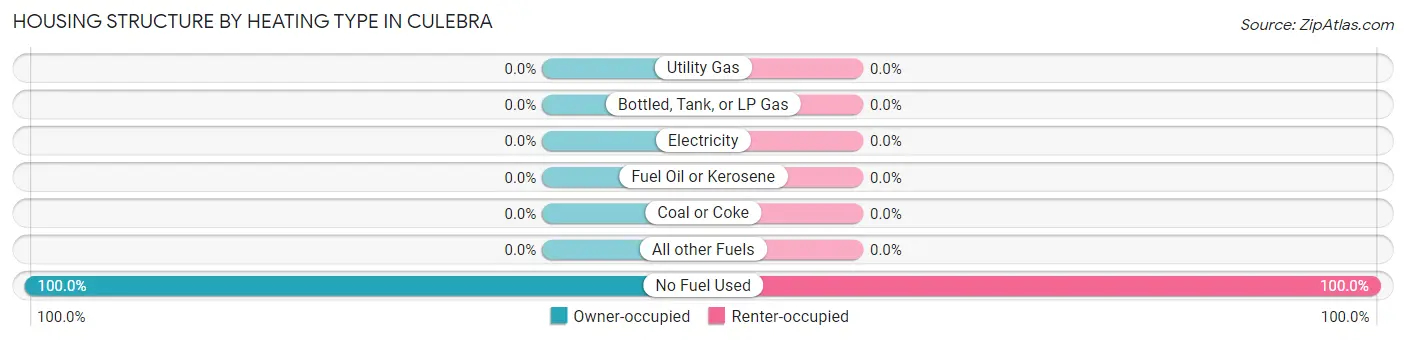
| Heating Type | Owner-occupied | Renter-occupied |
| Utility Gas | 0 (0.0%) | 0 (0.0%) |
| Bottled, Tank, or LP Gas | 0 (0.0%) | 0 (0.0%) |
| Electricity | 0 (0.0%) | 0 (0.0%) |
| Fuel Oil or Kerosene | 0 (0.0%) | 0 (0.0%) |
| Coal or Coke | 0 (0.0%) | 0 (0.0%) |
| All other Fuels | 0 (0.0%) | 0 (0.0%) |
| No Fuel Used | 236 (100.0%) | 159 (100.0%) |
| Total | 236 (100.0%) | 159 (100.0%) |
Household Vehicle Usage in Culebra
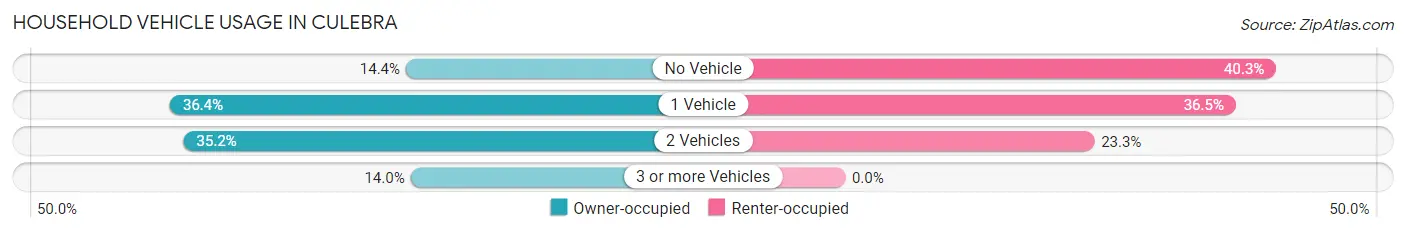
| Vehicles per Household | Owner-occupied | Renter-occupied |
| No Vehicle | 34 (14.4%) | 64 (40.3%) |
| 1 Vehicle | 86 (36.4%) | 58 (36.5%) |
| 2 Vehicles | 83 (35.2%) | 37 (23.3%) |
| 3 or more Vehicles | 33 (14.0%) | 0 (0.0%) |
| Total | 236 (100.0%) | 159 (100.0%) |
Real Estate & Mortgages in Culebra
Real Estate and Mortgage Overview in Culebra
| Characteristic | Without Mortgage | With Mortgage |
| Housing Units | 208 | 28 |
| Median Property Value | $122,900 | $188,200 |
| Median Household Income | $33,000 | $5 |
| Monthly Housing Costs | $217 | $0 |
| Real Estate Taxes | $517 | $23 |
Property Value by Mortgage Status in Culebra
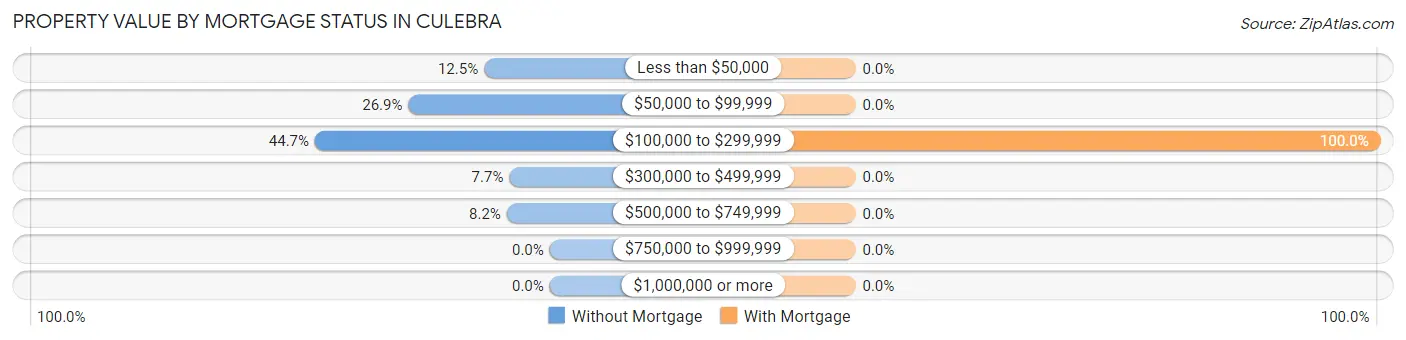
| Property Value | Without Mortgage | With Mortgage |
| Less than $50,000 | 26 (12.5%) | 0 (0.0%) |
| $50,000 to $99,999 | 56 (26.9%) | 0 (0.0%) |
| $100,000 to $299,999 | 93 (44.7%) | 28 (100.0%) |
| $300,000 to $499,999 | 16 (7.7%) | 0 (0.0%) |
| $500,000 to $749,999 | 17 (8.2%) | 0 (0.0%) |
| $750,000 to $999,999 | 0 (0.0%) | 0 (0.0%) |
| $1,000,000 or more | 0 (0.0%) | 0 (0.0%) |
| Total | 208 (100.0%) | 28 (100.0%) |
Household Income by Mortgage Status in Culebra
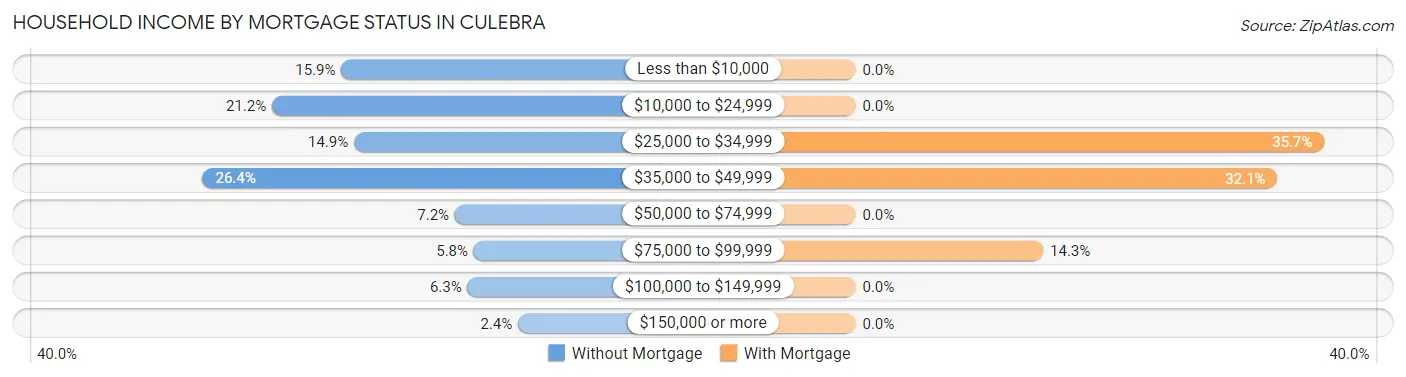
| Household Income | Without Mortgage | With Mortgage |
| Less than $10,000 | 33 (15.9%) | 0 (0.0%) |
| $10,000 to $24,999 | 44 (21.1%) | 0 (0.0%) |
| $25,000 to $34,999 | 31 (14.9%) | 10 (35.7%) |
| $35,000 to $49,999 | 55 (26.4%) | 9 (32.1%) |
| $50,000 to $74,999 | 15 (7.2%) | 0 (0.0%) |
| $75,000 to $99,999 | 12 (5.8%) | 4 (14.3%) |
| $100,000 to $149,999 | 13 (6.2%) | 0 (0.0%) |
| $150,000 or more | 5 (2.4%) | 0 (0.0%) |
| Total | 208 (100.0%) | 28 (100.0%) |
Property Value to Household Income Ratio in Culebra
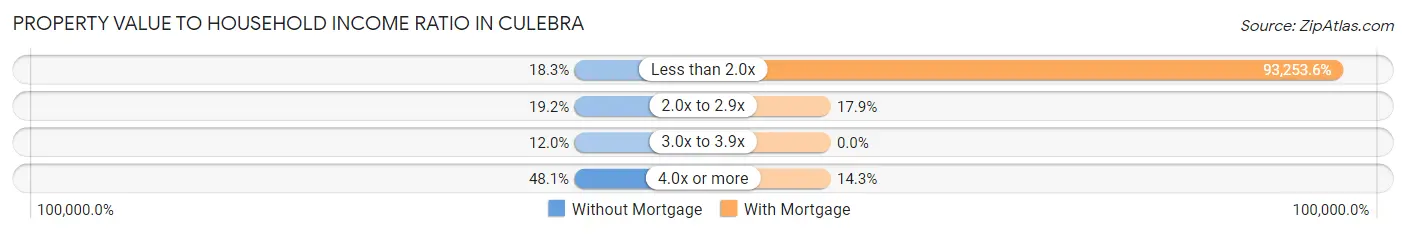
| Value-to-Income Ratio | Without Mortgage | With Mortgage |
| Less than 2.0x | 38 (18.3%) | 26,111 (93,253.6%) |
| 2.0x to 2.9x | 40 (19.2%) | 5 (17.9%) |
| 3.0x to 3.9x | 25 (12.0%) | 0 (0.0%) |
| 4.0x or more | 100 (48.1%) | 4 (14.3%) |
| Total | 208 (100.0%) | 28 (100.0%) |
Real Estate Taxes by Mortgage Status in Culebra
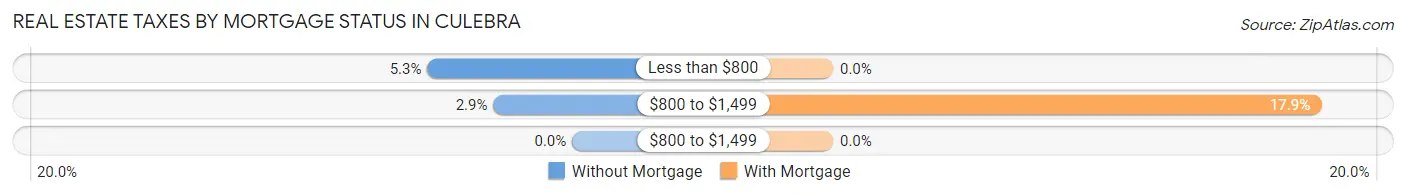
| Property Taxes | Without Mortgage | With Mortgage |
| Less than $800 | 11 (5.3%) | 0 (0.0%) |
| $800 to $1,499 | 6 (2.9%) | 5 (17.9%) |
| $800 to $1,499 | 0 (0.0%) | 0 (0.0%) |
| Total | 208 (100.0%) | 28 (100.0%) |
Health & Disability in Culebra
Health Insurance Coverage by Age in Culebra
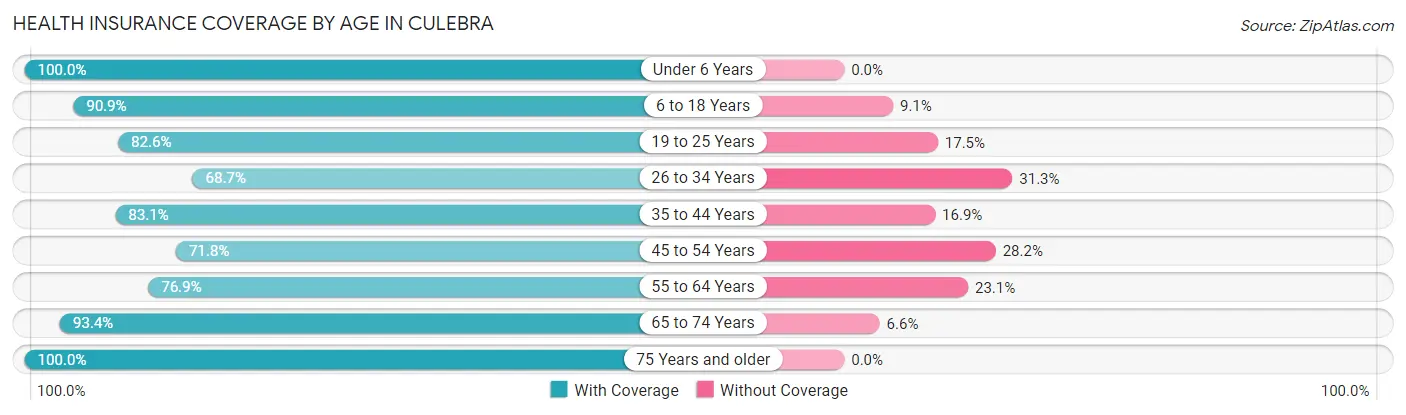
| Age Bracket | With Coverage | Without Coverage |
| Under 6 Years | 27 (100.0%) | 0 (0.0%) |
| 6 to 18 Years | 140 (90.9%) | 14 (9.1%) |
| 19 to 25 Years | 123 (82.6%) | 26 (17.4%) |
| 26 to 34 Years | 46 (68.7%) | 21 (31.3%) |
| 35 to 44 Years | 103 (83.1%) | 21 (16.9%) |
| 45 to 54 Years | 122 (71.8%) | 48 (28.2%) |
| 55 to 64 Years | 80 (76.9%) | 24 (23.1%) |
| 65 to 74 Years | 85 (93.4%) | 6 (6.6%) |
| 75 Years and older | 135 (100.0%) | 0 (0.0%) |
| Total | 861 (84.3%) | 160 (15.7%) |
Health Insurance Coverage by Citizenship Status in Culebra
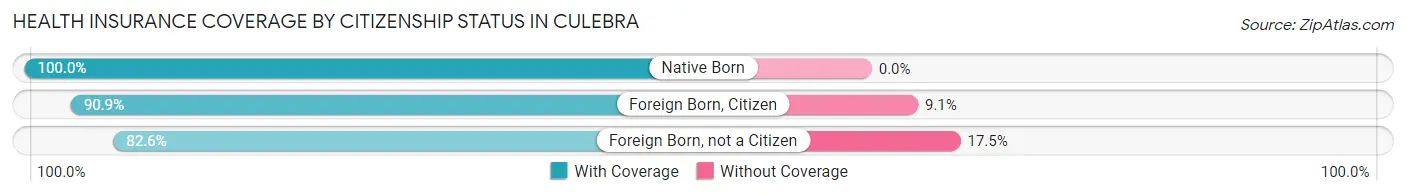
| Citizenship Status | With Coverage | Without Coverage |
| Native Born | 27 (100.0%) | 0 (0.0%) |
| Foreign Born, Citizen | 140 (90.9%) | 14 (9.1%) |
| Foreign Born, not a Citizen | 123 (82.6%) | 26 (17.4%) |
Health Insurance Coverage by Household Income in Culebra
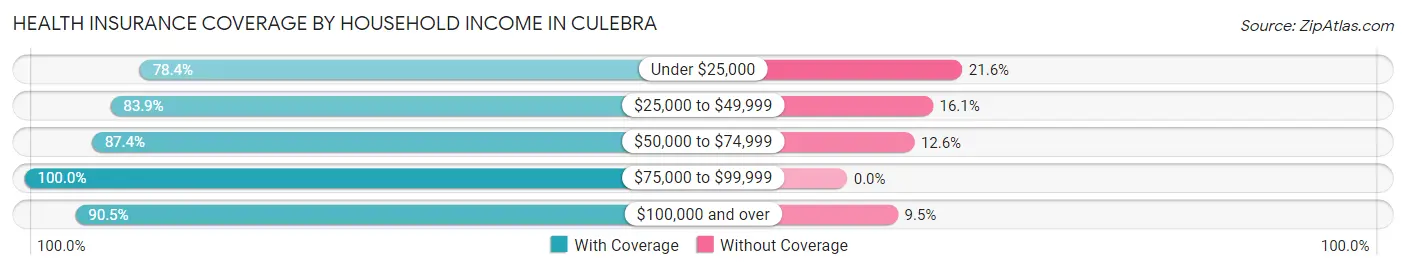
| Household Income | With Coverage | Without Coverage |
| Under $25,000 | 200 (78.4%) | 55 (21.6%) |
| $25,000 to $49,999 | 397 (83.9%) | 76 (16.1%) |
| $50,000 to $74,999 | 132 (87.4%) | 19 (12.6%) |
| $75,000 to $99,999 | 37 (100.0%) | 0 (0.0%) |
| $100,000 and over | 95 (90.5%) | 10 (9.5%) |
Public vs Private Health Insurance Coverage by Age in Culebra
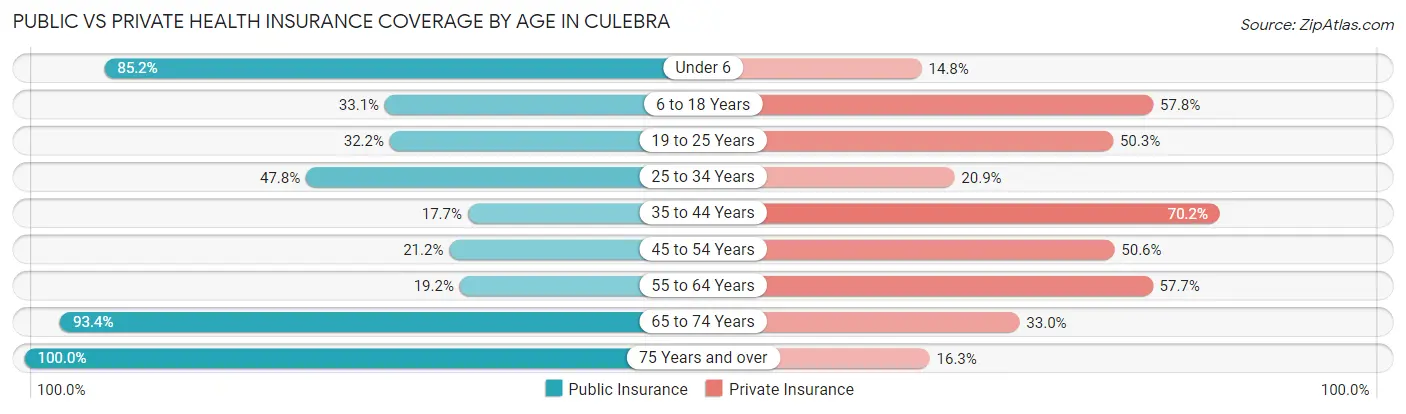
| Age Bracket | Public Insurance | Private Insurance |
| Under 6 | 23 (85.2%) | 4 (14.8%) |
| 6 to 18 Years | 51 (33.1%) | 89 (57.8%) |
| 19 to 25 Years | 48 (32.2%) | 75 (50.3%) |
| 25 to 34 Years | 32 (47.8%) | 14 (20.9%) |
| 35 to 44 Years | 22 (17.7%) | 87 (70.2%) |
| 45 to 54 Years | 36 (21.2%) | 86 (50.6%) |
| 55 to 64 Years | 20 (19.2%) | 60 (57.7%) |
| 65 to 74 Years | 85 (93.4%) | 30 (33.0%) |
| 75 Years and over | 135 (100.0%) | 22 (16.3%) |
| Total | 452 (44.3%) | 467 (45.7%) |
Disability Status by Sex by Age in Culebra
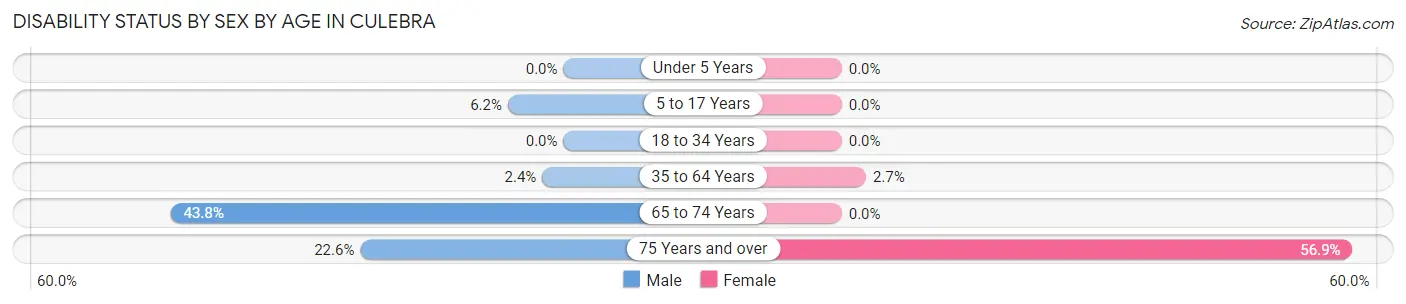
| Age Bracket | Male | Female |
| Under 5 Years | 0 (0.0%) | 0 (0.0%) |
| 5 to 17 Years | 6 (6.2%) | 0 (0.0%) |
| 18 to 34 Years | 0 (0.0%) | 0 (0.0%) |
| 35 to 64 Years | 5 (2.4%) | 5 (2.7%) |
| 65 to 74 Years | 21 (43.8%) | 0 (0.0%) |
| 75 Years and over | 19 (22.6%) | 29 (56.9%) |
Disability Class by Sex by Age in Culebra
Disability Class: Hearing Difficulty
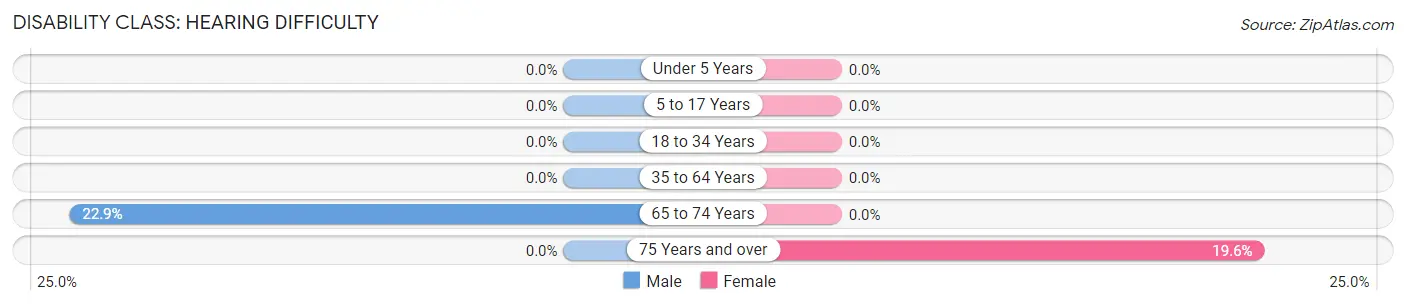
| Age Bracket | Male | Female |
| Under 5 Years | 0 (0.0%) | 0 (0.0%) |
| 5 to 17 Years | 0 (0.0%) | 0 (0.0%) |
| 18 to 34 Years | 0 (0.0%) | 0 (0.0%) |
| 35 to 64 Years | 0 (0.0%) | 0 (0.0%) |
| 65 to 74 Years | 11 (22.9%) | 0 (0.0%) |
| 75 Years and over | 0 (0.0%) | 10 (19.6%) |
Disability Class: Vision Difficulty
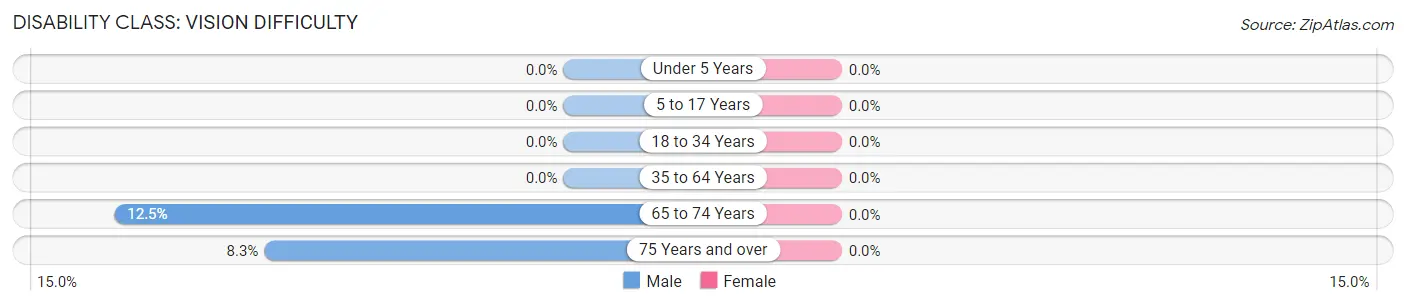
| Age Bracket | Male | Female |
| Under 5 Years | 0 (0.0%) | 0 (0.0%) |
| 5 to 17 Years | 0 (0.0%) | 0 (0.0%) |
| 18 to 34 Years | 0 (0.0%) | 0 (0.0%) |
| 35 to 64 Years | 0 (0.0%) | 0 (0.0%) |
| 65 to 74 Years | 6 (12.5%) | 0 (0.0%) |
| 75 Years and over | 7 (8.3%) | 0 (0.0%) |
Disability Class: Cognitive Difficulty
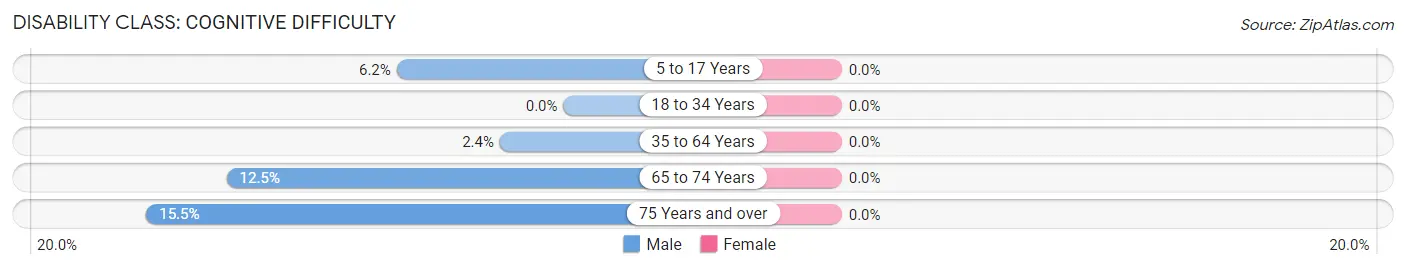
| Age Bracket | Male | Female |
| 5 to 17 Years | 6 (6.2%) | 0 (0.0%) |
| 18 to 34 Years | 0 (0.0%) | 0 (0.0%) |
| 35 to 64 Years | 5 (2.4%) | 0 (0.0%) |
| 65 to 74 Years | 6 (12.5%) | 0 (0.0%) |
| 75 Years and over | 13 (15.5%) | 0 (0.0%) |
Disability Class: Ambulatory Difficulty
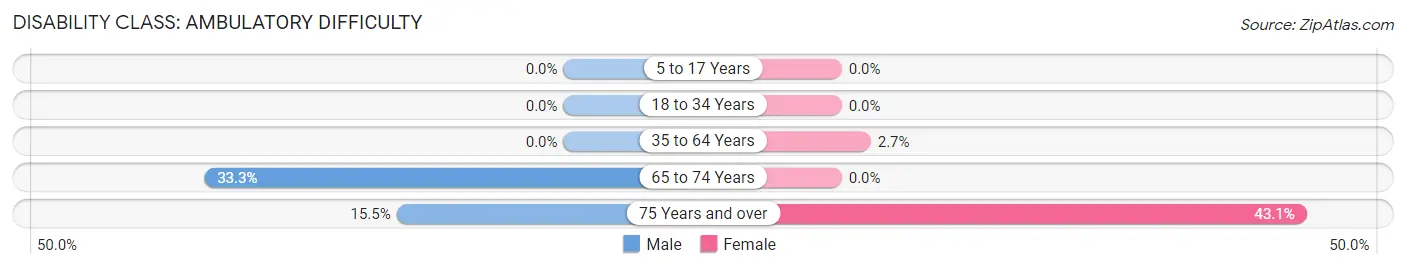
| Age Bracket | Male | Female |
| 5 to 17 Years | 0 (0.0%) | 0 (0.0%) |
| 18 to 34 Years | 0 (0.0%) | 0 (0.0%) |
| 35 to 64 Years | 0 (0.0%) | 5 (2.7%) |
| 65 to 74 Years | 16 (33.3%) | 0 (0.0%) |
| 75 Years and over | 13 (15.5%) | 22 (43.1%) |
Disability Class: Self-Care Difficulty
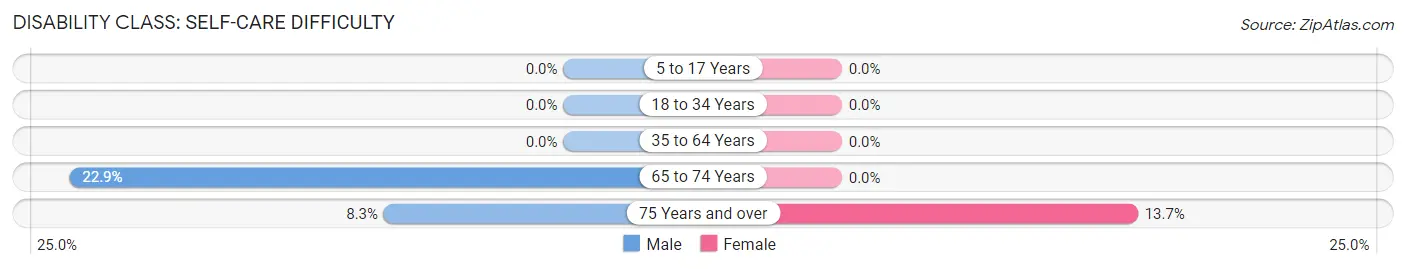
| Age Bracket | Male | Female |
| 5 to 17 Years | 0 (0.0%) | 0 (0.0%) |
| 18 to 34 Years | 0 (0.0%) | 0 (0.0%) |
| 35 to 64 Years | 0 (0.0%) | 0 (0.0%) |
| 65 to 74 Years | 11 (22.9%) | 0 (0.0%) |
| 75 Years and over | 7 (8.3%) | 7 (13.7%) |
Technology Access in Culebra
Computing Device Access in Culebra
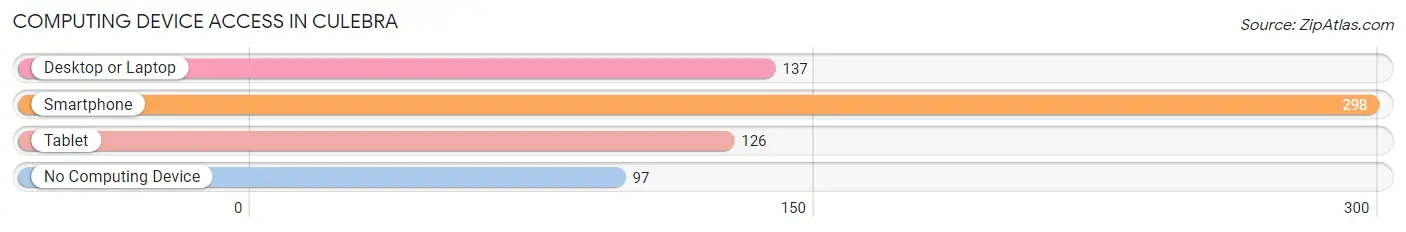
| Device Type | # Households | % Households |
| Desktop or Laptop | 137 | 34.7% |
| Smartphone | 298 | 75.4% |
| Tablet | 126 | 31.9% |
| No Computing Device | 97 | 24.6% |
| Total | 395 | 100.0% |
Internet Access in Culebra
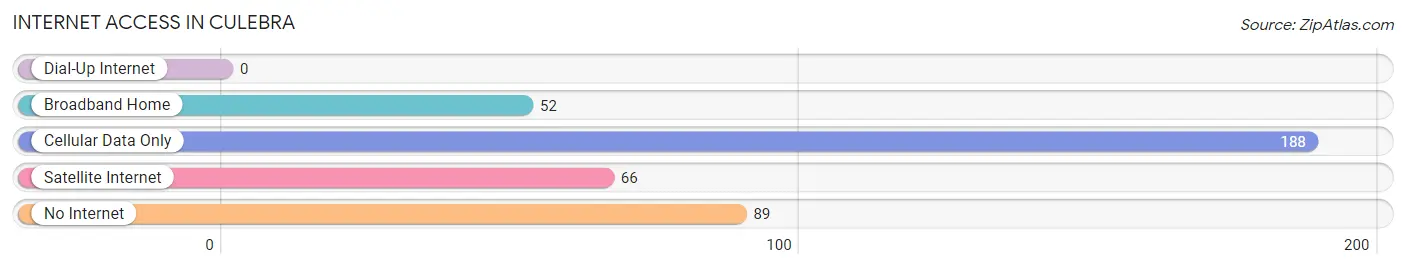
| Internet Type | # Households | % Households |
| Dial-Up Internet | 0 | 0.0% |
| Broadband Home | 52 | 13.2% |
| Cellular Data Only | 188 | 47.6% |
| Satellite Internet | 66 | 16.7% |
| No Internet | 89 | 22.5% |
| Total | 395 | 100.0% |
Culebra Summary
Culebra, Puerto Rico is a small island located off the east coast of Puerto Rico, approximately 17 miles east of the main island. It is part of the Spanish Virgin Islands and is the smallest of the inhabited islands in the archipelago. Culebra is known for its pristine beaches, crystal clear waters, and abundant wildlife.
Geography
Culebra is a small island, measuring only 7.5 miles long and 2.5 miles wide. It is located 17 miles east of the main island of Puerto Rico and is part of the Spanish Virgin Islands. The island is surrounded by the Caribbean Sea to the north, the Atlantic Ocean to the east, and the Mona Passage to the south. The terrain of the island is mostly flat, with some hills in the center. The highest point on the island is Cerro de la Cruz, which is 545 feet above sea level.
The climate of Culebra is tropical, with temperatures ranging from the mid-70s to the mid-80s year-round. The island receives an average of 60 inches of rain per year, with the majority of the rain falling during the wet season from May to October.
Economy
The economy of Culebra is largely based on tourism. The island is known for its pristine beaches, crystal clear waters, and abundant wildlife. The island is home to several resorts, hotels, and restaurants, as well as a variety of water sports and activities.
The island also has a small fishing industry, with fishermen catching a variety of fish, including snapper, grouper, and barracuda. The island also has a small agricultural sector, with farmers growing a variety of fruits and vegetables, including bananas, plantains, and coconuts.
Demographics
As of the 2010 census, the population of Culebra was 1,818. The majority of the population is of Hispanic or Latino descent, with a small percentage of African-American and white residents. The median age of the population is 40.5 years, and the median household income is $20,000.
The majority of the population is Roman Catholic, with a small percentage of other religious affiliations. The official language of the island is Spanish, although English is also widely spoken.
History
Culebra has been inhabited since the 16th century, when it was first settled by the Spanish. The island was used as a base for the Spanish Navy during the Spanish-American War, and was later used as a training ground for the U.S. Navy during World War II.
In the 1970s, the island was declared a wildlife refuge, and in 1978, it was designated as a National Wildlife Refuge. In 2000, the island was designated as a National Historic Site, and in 2001, it was designated as a National Natural Landmark.
Today, Culebra is a popular tourist destination, known for its pristine beaches, crystal clear waters, and abundant wildlife. The island is home to several resorts, hotels, and restaurants, as well as a variety of water sports and activities.
Common Questions
What is Per Capita Income in Culebra?
Per Capita income in Culebra is $16,362.
What is the Median Family Income in Culebra?
Median Family Income in Culebra is $36,765.
What is the Median Household income in Culebra?
Median Household Income in Culebra is $25,031.
What is Income or Wage Gap in Culebra?
Income or Wage Gap in Culebra is 1.2%.
Women in Culebra earn 98.8 cents for every dollar earned by a man.
What is Inequality or Gini Index in Culebra?
Inequality or Gini Index in Culebra is 0.46.
What is the Total Population of Culebra?
Total Population of Culebra is 1,021.
What is the Total Male Population of Culebra?
Total Male Population of Culebra is 573.
What is the Total Female Population of Culebra?
Total Female Population of Culebra is 448.
What is the Ratio of Males per 100 Females in Culebra?
There are 127.90 Males per 100 Females in Culebra.
What is the Ratio of Females per 100 Males in Culebra?
There are 78.18 Females per 100 Males in Culebra.
What is the Median Population Age in Culebra?
Median Population Age in Culebra is 44.6 Years.
What is the Average Family Size in Culebra
Average Family Size in Culebra is 3.9 People.
What is the Average Household Size in Culebra
Average Household Size in Culebra is 2.6 People.
How Large is the Labor Force in Culebra?
There are 532 People in the Labor Forcein in Culebra.
What is the Percentage of People in the Labor Force in Culebra?
60.5% of People are in the Labor Force in Culebra.
What is the Unemployment Rate in Culebra?
Unemployment Rate in Culebra is 3.6%.