Coto Laurel, PR Map & Demographics
Coto Laurel Map
Coto Laurel Overview
$8,446
PER CAPITA INCOME
$16,771
AVG FAMILY INCOME
$15,669
AVG HOUSEHOLD INCOME
0.46
INEQUALITY / GINI INDEX
2,347
TOTAL POPULATION
1,374
MALE POPULATION
973
FEMALE POPULATION
141.21
MALES / 100 FEMALES
70.82
FEMALES / 100 MALES
58.2
MEDIAN AGE
2.8
AVG FAMILY SIZE
2.3
AVG HOUSEHOLD SIZE
597
LABOR FORCE [ PEOPLE ]
29.2%
PERCENT IN LABOR FORCE
22.3%
UNEMPLOYMENT RATE
Coto Laurel Zip Codes
Income in Coto Laurel
Income Overview in Coto Laurel
Per Capita Income in Coto Laurel is $8,446, while median incomes of families and households are $16,771 and $15,669 respectively.
| Characteristic | Number | Measure |
| Per Capita Income | 2,347 | $8,446 |
| Median Family Income | 763 | $16,771 |
| Mean Family Income | 763 | $20,086 |
| Median Household Income | 1,010 | $15,669 |
| Mean Household Income | 1,010 | $18,269 |
| Income Deficit | 763 | $0 |
| Wage / Income Gap (%) | 2,347 | 0.00% |
| Wage / Income Gap ($) | 2,347 | 100.00¢ per $1 |
| Gini / Inequality Index | 2,347 | 0.46 |
Earnings by Sex in Coto Laurel
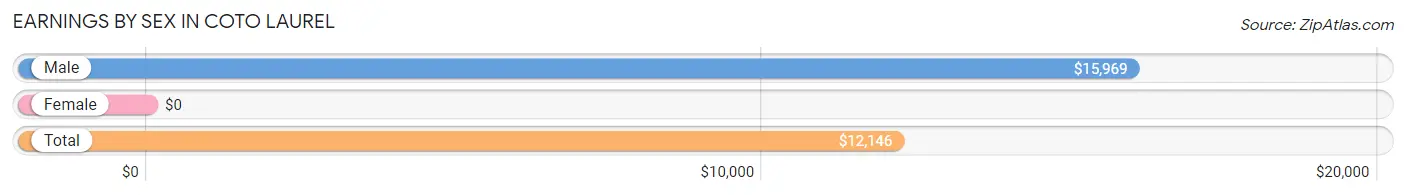
| Sex | Number | Average Earnings |
| Male | 241 (52.0%) | $15,969 |
| Female | 222 (47.9%) | $0 |
| Total | 463 (100.0%) | $12,146 |
Earnings by Sex by Income Bracket in Coto Laurel
The most common earnings brackets in Coto Laurel are $17,500 to $19,999 for men (76 | 31.5%) and $17,500 to $19,999 for women (86 | 38.7%).
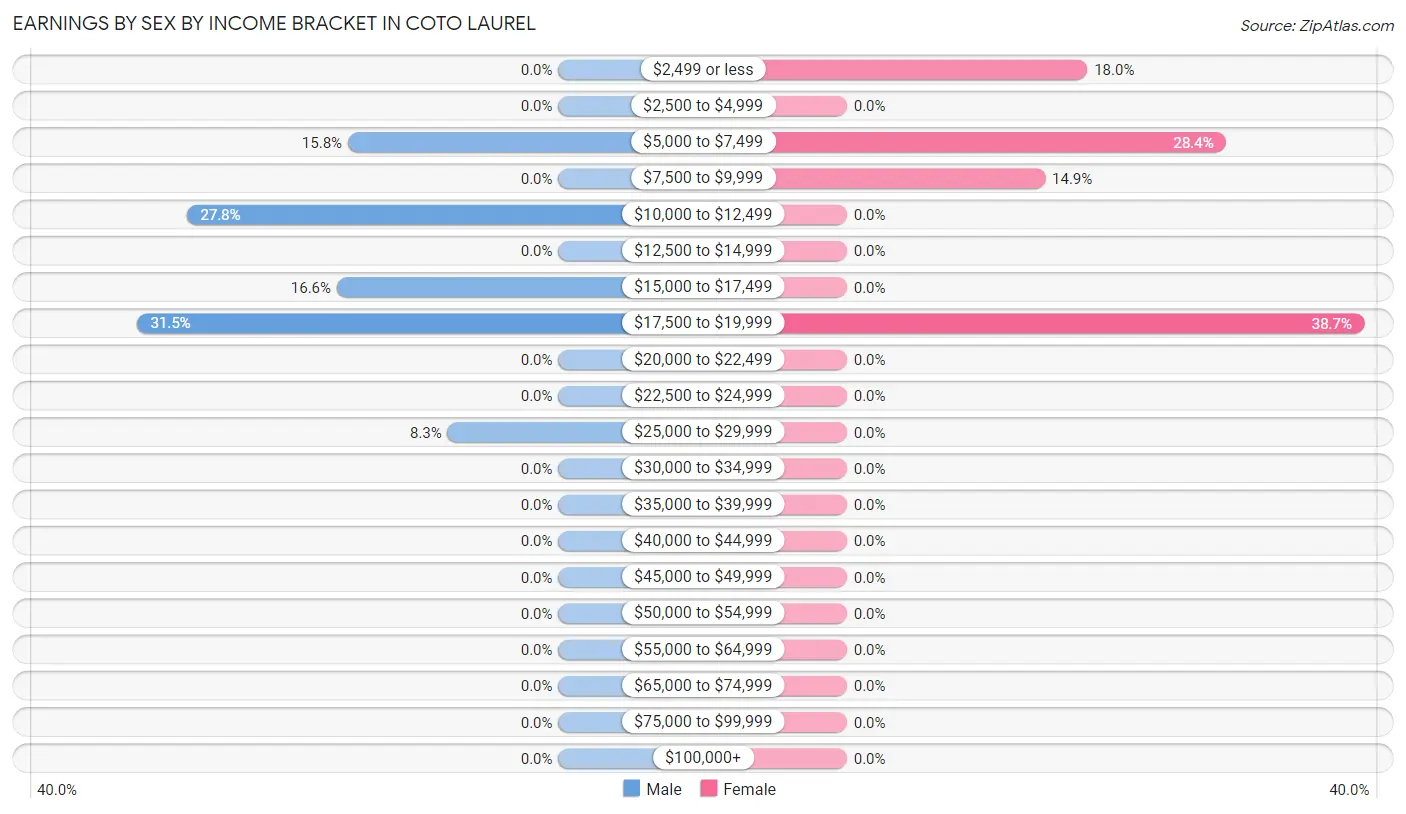
| Income | Male | Female |
| $2,499 or less | 0 (0.0%) | 40 (18.0%) |
| $2,500 to $4,999 | 0 (0.0%) | 0 (0.0%) |
| $5,000 to $7,499 | 38 (15.8%) | 63 (28.4%) |
| $7,500 to $9,999 | 0 (0.0%) | 33 (14.9%) |
| $10,000 to $12,499 | 67 (27.8%) | 0 (0.0%) |
| $12,500 to $14,999 | 0 (0.0%) | 0 (0.0%) |
| $15,000 to $17,499 | 40 (16.6%) | 0 (0.0%) |
| $17,500 to $19,999 | 76 (31.5%) | 86 (38.7%) |
| $20,000 to $22,499 | 0 (0.0%) | 0 (0.0%) |
| $22,500 to $24,999 | 0 (0.0%) | 0 (0.0%) |
| $25,000 to $29,999 | 20 (8.3%) | 0 (0.0%) |
| $30,000 to $34,999 | 0 (0.0%) | 0 (0.0%) |
| $35,000 to $39,999 | 0 (0.0%) | 0 (0.0%) |
| $40,000 to $44,999 | 0 (0.0%) | 0 (0.0%) |
| $45,000 to $49,999 | 0 (0.0%) | 0 (0.0%) |
| $50,000 to $54,999 | 0 (0.0%) | 0 (0.0%) |
| $55,000 to $64,999 | 0 (0.0%) | 0 (0.0%) |
| $65,000 to $74,999 | 0 (0.0%) | 0 (0.0%) |
| $75,000 to $99,999 | 0 (0.0%) | 0 (0.0%) |
| $100,000+ | 0 (0.0%) | 0 (0.0%) |
| Total | 241 (100.0%) | 222 (100.0%) |
Earnings by Sex by Educational Attainment in Coto Laurel
| Educational Attainment | Male Income | Female Income |
| Less than High School | - | - |
| High School Diploma | - | - |
| College or Associate's Degree | - | - |
| Bachelor's Degree | - | - |
| Graduate Degree | - | - |
| Total | $11,660 | $0 |
Family Income in Coto Laurel
Family Income Brackets in Coto Laurel
According to the Coto Laurel family income data, there are 262 families falling into the $15,000 to $24,999 income range, which is the most common income bracket and makes up 34.3% of all families.
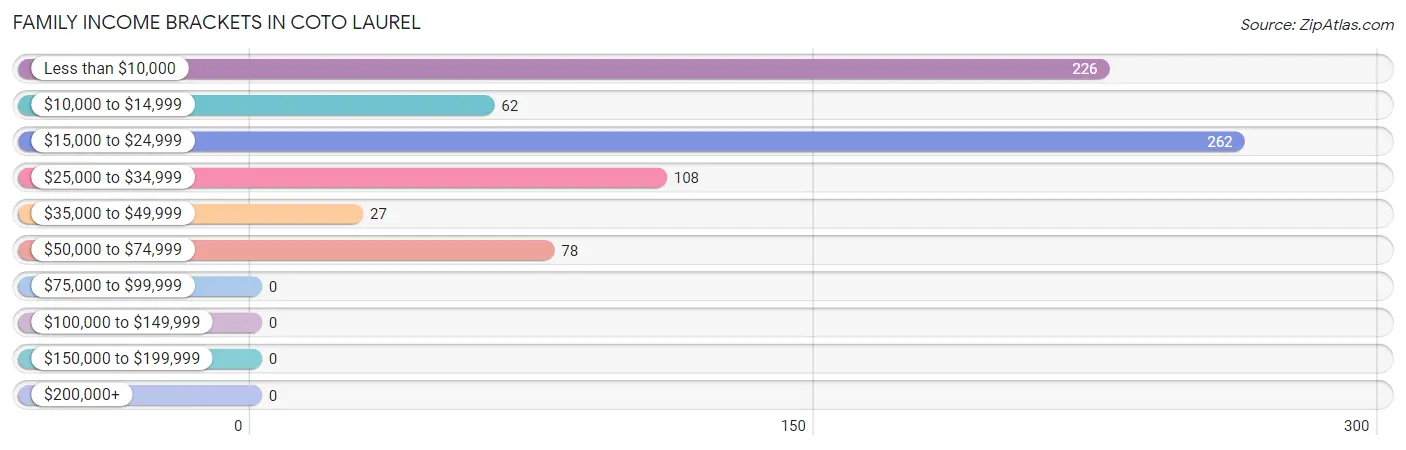
| Income Bracket | # Families | % Families |
| Less than $10,000 | 226 | 29.6% |
| $10,000 to $14,999 | 62 | 8.1% |
| $15,000 to $24,999 | 262 | 34.3% |
| $25,000 to $34,999 | 108 | 14.2% |
| $35,000 to $49,999 | 27 | 3.5% |
| $50,000 to $74,999 | 78 | 10.2% |
| $75,000 to $99,999 | 0 | 0.0% |
| $100,000 to $149,999 | 0 | 0.0% |
| $150,000 to $199,999 | 0 | 0.0% |
| $200,000+ | 0 | 0.0% |
Family Income by Famaliy Size in Coto Laurel
2-person families (525 | 68.8%) account for the highest median family income in Coto Laurel with $17,056 per family, while 2-person families (525 | 68.8%) have the highest median income of $8,528 per family member.
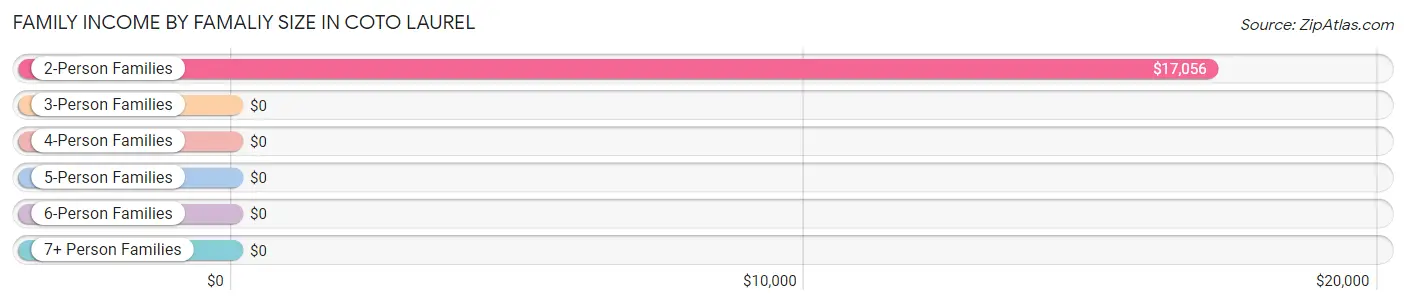
| Income Bracket | # Families | Median Income |
| 2-Person Families | 525 (68.8%) | $17,056 |
| 3-Person Families | 116 (15.2%) | $0 |
| 4-Person Families | 122 (16.0%) | $0 |
| 5-Person Families | 0 (0.0%) | $0 |
| 6-Person Families | 0 (0.0%) | $0 |
| 7+ Person Families | 0 (0.0%) | $0 |
| Total | 763 (100.0%) | $16,771 |
Family Income by Number of Earners in Coto Laurel
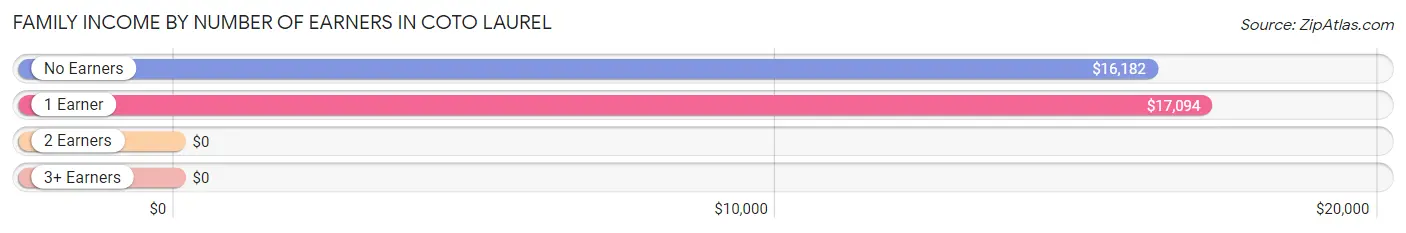
| Number of Earners | # Families | Median Income |
| No Earners | 548 (71.8%) | $16,182 |
| 1 Earner | 129 (16.9%) | $17,094 |
| 2 Earners | 40 (5.2%) | $0 |
| 3+ Earners | 46 (6.0%) | $0 |
| Total | 763 (100.0%) | $16,771 |
Household Income in Coto Laurel
Household Income Brackets in Coto Laurel
With 362 households falling in the category, the less than $10,000 income range is the most frequent in Coto Laurel, accounting for 35.8% of all households.
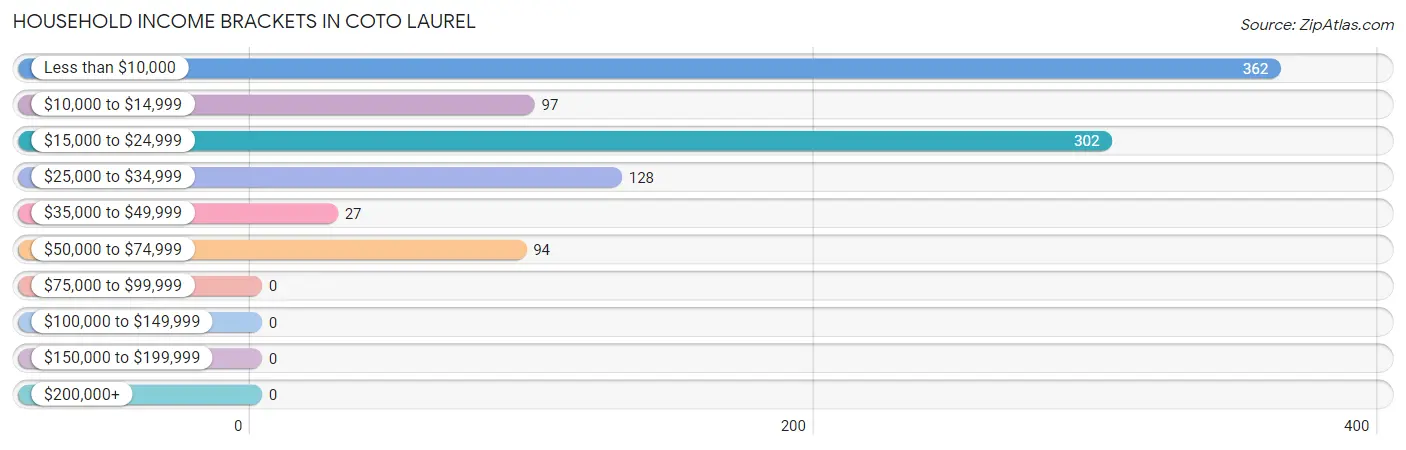
| Income Bracket | # Households | % Households |
| Less than $10,000 | 362 | 35.8% |
| $10,000 to $14,999 | 97 | 9.6% |
| $15,000 to $24,999 | 302 | 29.9% |
| $25,000 to $34,999 | 128 | 12.7% |
| $35,000 to $49,999 | 27 | 2.7% |
| $50,000 to $74,999 | 94 | 9.3% |
| $75,000 to $99,999 | 0 | 0.0% |
| $100,000 to $149,999 | 0 | 0.0% |
| $150,000 to $199,999 | 0 | 0.0% |
| $200,000+ | 0 | 0.0% |
Household Income by Householder Age in Coto Laurel
The median household income in Coto Laurel is $15,669, with the highest median household income of $21,111 found in the 65+ years age bracket for the primary householder. A total of 506 households (50.1%) fall into this category. Meanwhile, the 15 to 24 years age bracket for the primary householder has the lowest median household income of $0, with 43 households (4.3%) in this group.
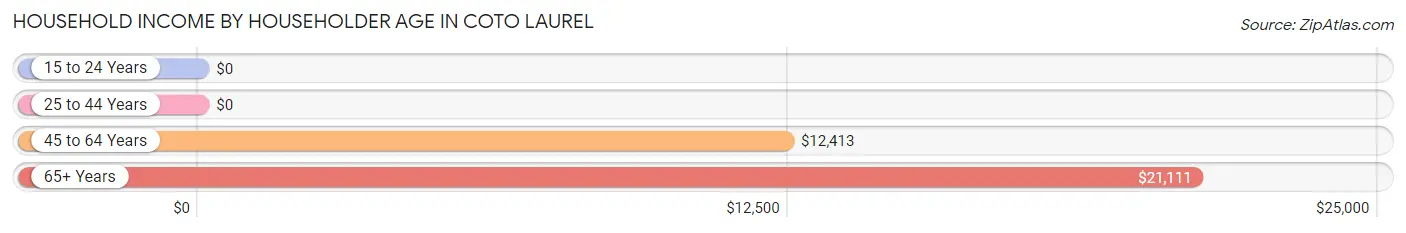
| Income Bracket | # Households | Median Income |
| 15 to 24 Years | 43 (4.3%) | $0 |
| 25 to 44 Years | 46 (4.5%) | $0 |
| 45 to 64 Years | 415 (41.1%) | $12,413 |
| 65+ Years | 506 (50.1%) | $21,111 |
| Total | 1,010 (100.0%) | $15,669 |
Poverty in Coto Laurel
Income Below Poverty by Sex and Age in Coto Laurel
With 62.2% poverty level for males and 66.3% for females among the residents of Coto Laurel, under 5 year old males and 12 to 14 year old females are the most vulnerable to poverty, with 104 males (100.0%) and 43 females (100.0%) in their respective age groups living below the poverty level.
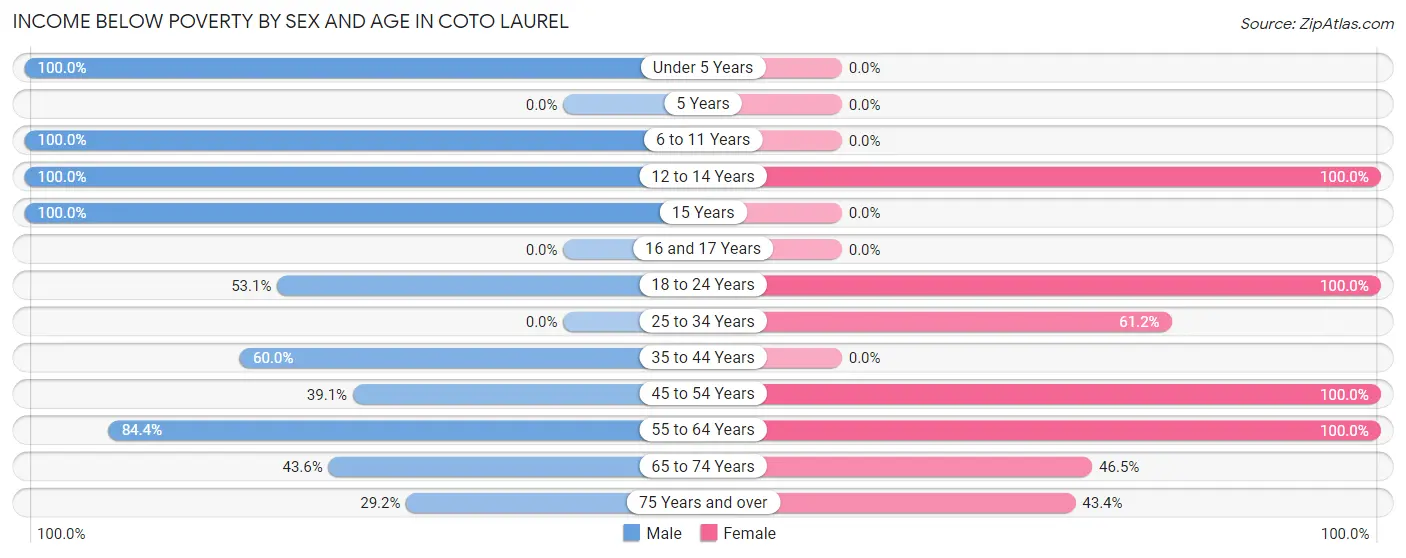
| Age Bracket | Male | Female |
| Under 5 Years | 104 (100.0%) | 0 (0.0%) |
| 5 Years | 0 (0.0%) | 0 (0.0%) |
| 6 to 11 Years | 86 (100.0%) | 0 (0.0%) |
| 12 to 14 Years | 40 (100.0%) | 43 (100.0%) |
| 15 Years | 31 (100.0%) | 0 (0.0%) |
| 16 and 17 Years | 0 (0.0%) | 0 (0.0%) |
| 18 to 24 Years | 128 (53.1%) | 43 (100.0%) |
| 25 to 34 Years | 0 (0.0%) | 63 (61.2%) |
| 35 to 44 Years | 48 (60.0%) | 0 (0.0%) |
| 45 to 54 Years | 25 (39.1%) | 127 (100.0%) |
| 55 to 64 Years | 216 (84.4%) | 169 (100.0%) |
| 65 to 74 Years | 119 (43.6%) | 125 (46.5%) |
| 75 Years and over | 58 (29.1%) | 75 (43.3%) |
| Total | 855 (62.2%) | 645 (66.3%) |
Income Above Poverty by Sex and Age in Coto Laurel
According to the poverty statistics in Coto Laurel, males aged 75 years and over and females aged 35 to 44 years are the age groups that are most secure financially, with 70.9% of males and 100.0% of females in these age groups living above the poverty line.
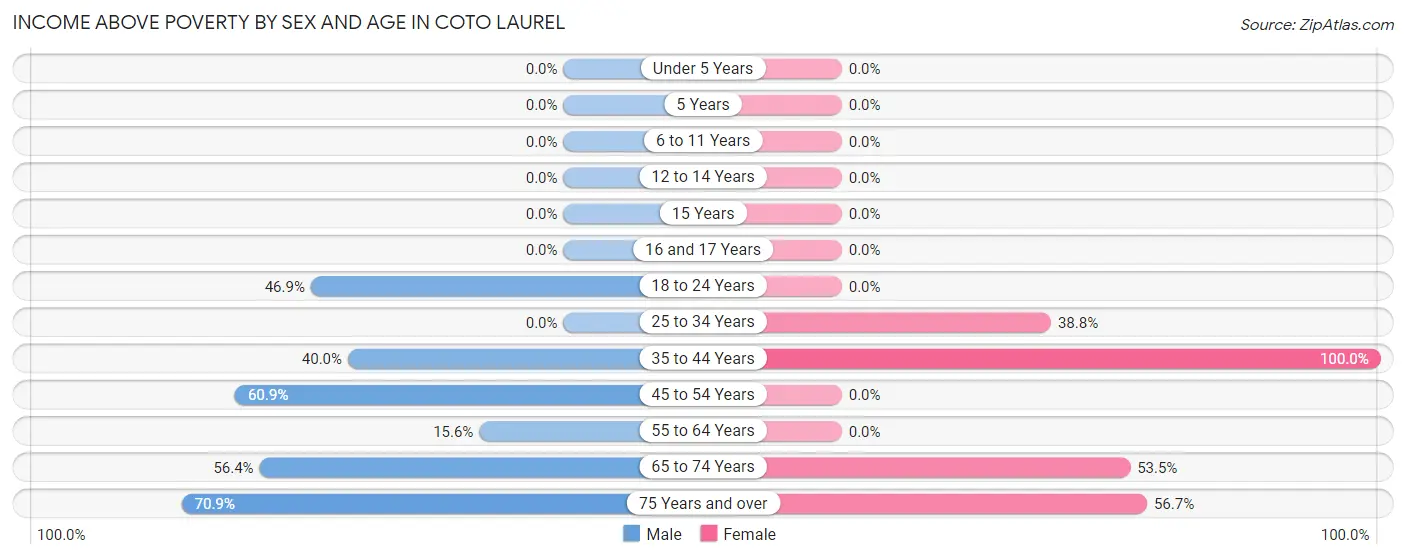
| Age Bracket | Male | Female |
| Under 5 Years | 0 (0.0%) | 0 (0.0%) |
| 5 Years | 0 (0.0%) | 0 (0.0%) |
| 6 to 11 Years | 0 (0.0%) | 0 (0.0%) |
| 12 to 14 Years | 0 (0.0%) | 0 (0.0%) |
| 15 Years | 0 (0.0%) | 0 (0.0%) |
| 16 and 17 Years | 0 (0.0%) | 0 (0.0%) |
| 18 to 24 Years | 113 (46.9%) | 0 (0.0%) |
| 25 to 34 Years | 0 (0.0%) | 40 (38.8%) |
| 35 to 44 Years | 32 (40.0%) | 46 (100.0%) |
| 45 to 54 Years | 39 (60.9%) | 0 (0.0%) |
| 55 to 64 Years | 40 (15.6%) | 0 (0.0%) |
| 65 to 74 Years | 154 (56.4%) | 144 (53.5%) |
| 75 Years and over | 141 (70.9%) | 98 (56.7%) |
| Total | 519 (37.8%) | 328 (33.7%) |
Income Below Poverty Among Married-Couple Families in Coto Laurel
The poverty statistics for married-couple families in Coto Laurel show that 60.4% or 325 of the total 538 families live below the poverty line. Families with 1 or 2 children have the highest poverty rate of 100.0%, comprising of 33 families. On the other hand, families with no children have the lowest poverty rate of 57.8%, which includes 292 families.
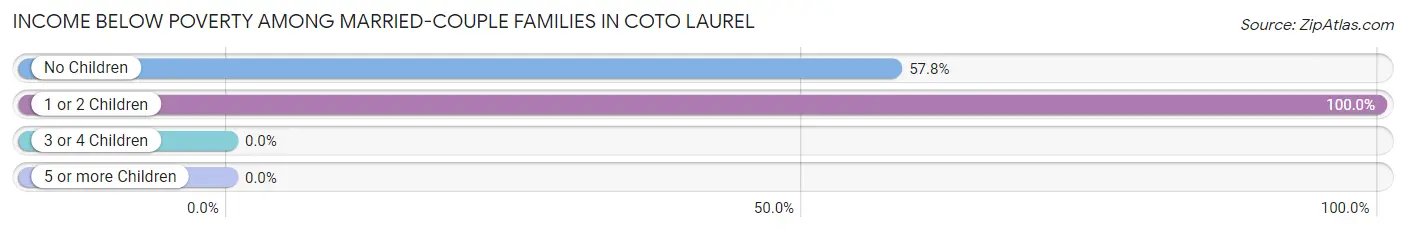
| Children | Above Poverty | Below Poverty |
| No Children | 213 (42.2%) | 292 (57.8%) |
| 1 or 2 Children | 0 (0.0%) | 33 (100.0%) |
| 3 or 4 Children | 0 (0.0%) | 0 (0.0%) |
| 5 or more Children | 0 (0.0%) | 0 (0.0%) |
| Total | 213 (39.6%) | 325 (60.4%) |
Income Below Poverty Among Single-Parent Households in Coto Laurel
According to the poverty data in Coto Laurel, 49.4% or 45 single-father households and 61.9% or 83 single-mother households are living below the poverty line. Among single-father households, those with 1 or 2 children have the highest poverty rate, with 27 households (100.0%) experiencing poverty. Likewise, among single-mother households, those with 1 or 2 children have the highest poverty rate, with 40 households (100.0%) falling below the poverty line.
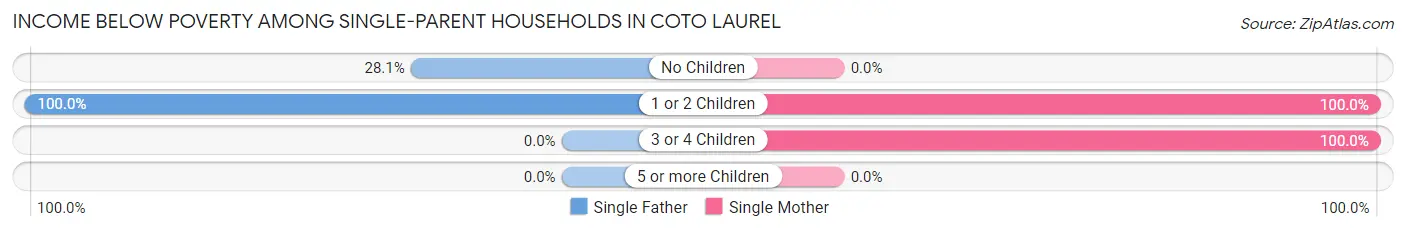
| Children | Single Father | Single Mother |
| No Children | 18 (28.1%) | 0 (0.0%) |
| 1 or 2 Children | 27 (100.0%) | 40 (100.0%) |
| 3 or 4 Children | 0 (0.0%) | 43 (100.0%) |
| 5 or more Children | 0 (0.0%) | 0 (0.0%) |
| Total | 45 (49.4%) | 83 (61.9%) |
Income Below Poverty Among Married-Couple vs Single-Parent Households in Coto Laurel
The poverty data for Coto Laurel shows that 325 of the married-couple family households (60.4%) and 128 of the single-parent households (56.9%) are living below the poverty level. Within the married-couple family households, those with 1 or 2 children have the highest poverty rate, with 33 households (100.0%) falling below the poverty line. Among the single-parent households, those with 1 or 2 children have the highest poverty rate, with 67 household (100.0%) living below poverty.
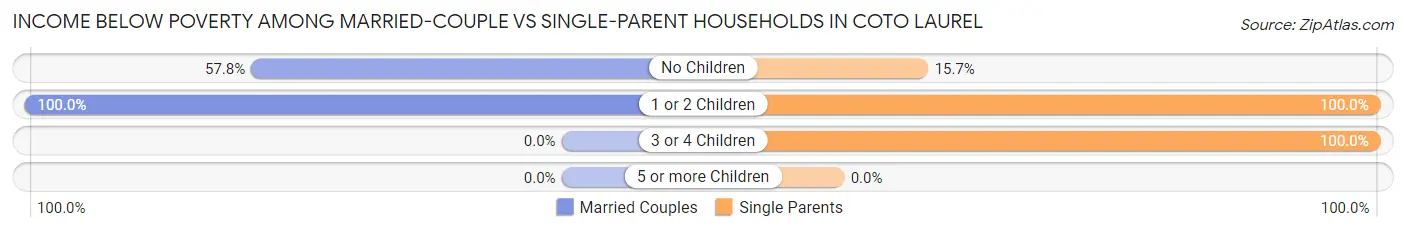
| Children | Married-Couple Families | Single-Parent Households |
| No Children | 292 (57.8%) | 18 (15.7%) |
| 1 or 2 Children | 33 (100.0%) | 67 (100.0%) |
| 3 or 4 Children | 0 (0.0%) | 43 (100.0%) |
| 5 or more Children | 0 (0.0%) | 0 (0.0%) |
| Total | 325 (60.4%) | 128 (56.9%) |
Race in Coto Laurel
The most populous races in Coto Laurel are Hispanic or Latino (2,347 | 100.0%), Two or more Races (1,095 | 46.7%), and White / Caucasian (1,074 | 45.8%).
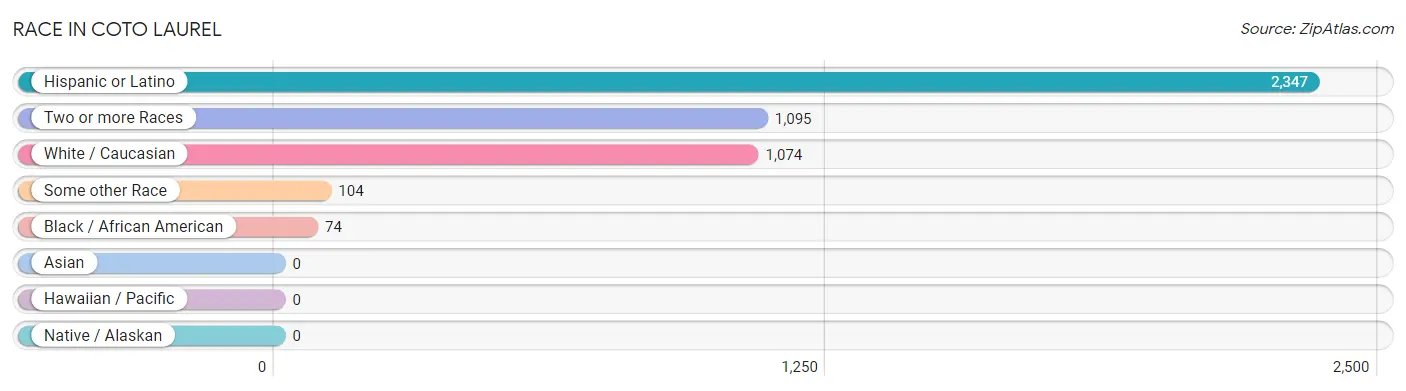
| Race | # Population | % Population |
| Asian | 0 | 0.0% |
| Black / African American | 74 | 3.2% |
| Hawaiian / Pacific | 0 | 0.0% |
| Hispanic or Latino | 2,347 | 100.0% |
| Native / Alaskan | 0 | 0.0% |
| White / Caucasian | 1,074 | 45.8% |
| Two or more Races | 1,095 | 46.7% |
| Some other Race | 104 | 4.4% |
| Total | 2,347 | 100.0% |
Ancestry in Coto Laurel
The most populous ancestries reported in Coto Laurel are , and Puerto Rican (2,347 | 100.0%), together accounting for 100.0% of all Coto Laurel residents.

| Ancestry | # Population | % Population |
| Puerto Rican | 2,347 | 100.0% | View All 1 Rows |
Immigrants in Coto Laurel

| Immigration Origin | # Population | % Population | View All 0 Rows |
Sex and Age in Coto Laurel
Sex and Age in Coto Laurel
The most populous age groups in Coto Laurel are 20 to 24 Years (189 | 13.8%) for men and 70 to 74 Years (216 | 22.2%) for women.
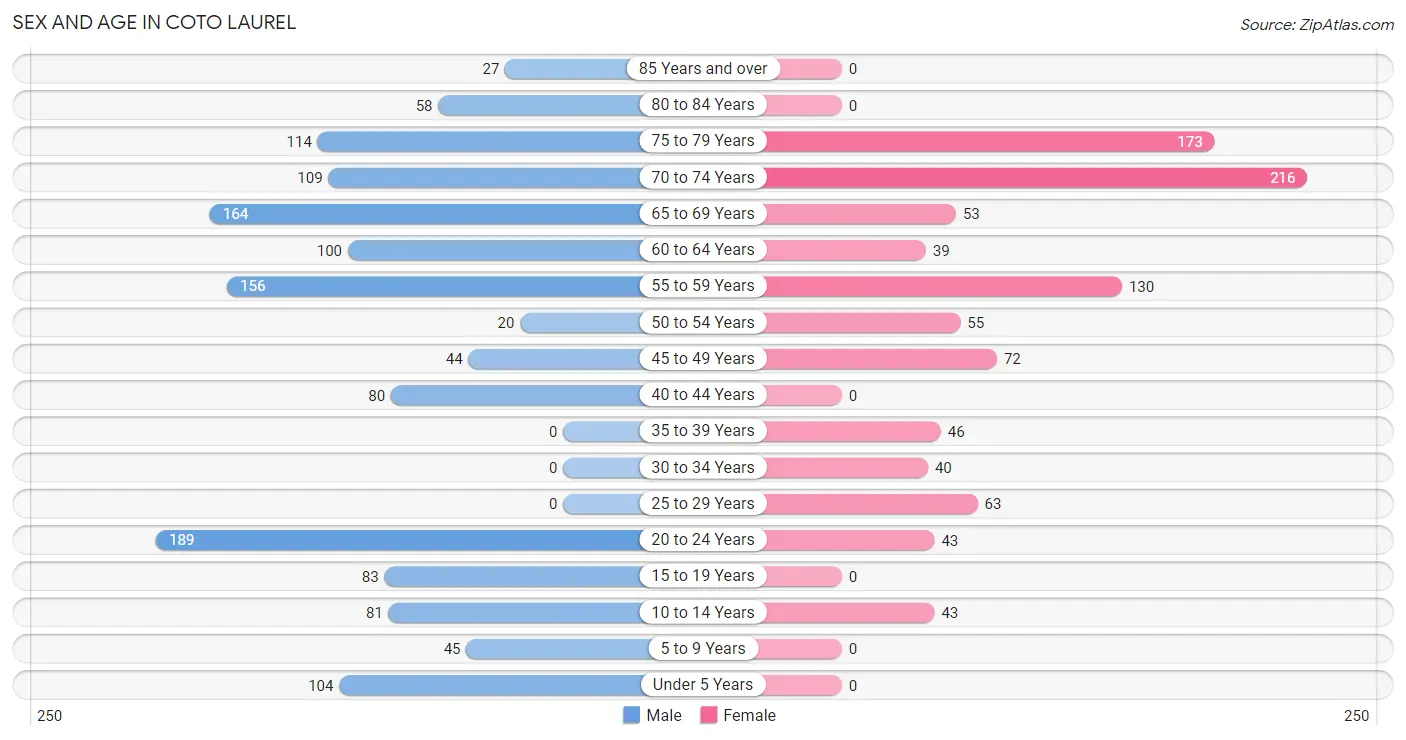
| Age Bracket | Male | Female |
| Under 5 Years | 104 (7.6%) | 0 (0.0%) |
| 5 to 9 Years | 45 (3.3%) | 0 (0.0%) |
| 10 to 14 Years | 81 (5.9%) | 43 (4.4%) |
| 15 to 19 Years | 83 (6.0%) | 0 (0.0%) |
| 20 to 24 Years | 189 (13.8%) | 43 (4.4%) |
| 25 to 29 Years | 0 (0.0%) | 63 (6.5%) |
| 30 to 34 Years | 0 (0.0%) | 40 (4.1%) |
| 35 to 39 Years | 0 (0.0%) | 46 (4.7%) |
| 40 to 44 Years | 80 (5.8%) | 0 (0.0%) |
| 45 to 49 Years | 44 (3.2%) | 72 (7.4%) |
| 50 to 54 Years | 20 (1.5%) | 55 (5.7%) |
| 55 to 59 Years | 156 (11.4%) | 130 (13.4%) |
| 60 to 64 Years | 100 (7.3%) | 39 (4.0%) |
| 65 to 69 Years | 164 (11.9%) | 53 (5.4%) |
| 70 to 74 Years | 109 (7.9%) | 216 (22.2%) |
| 75 to 79 Years | 114 (8.3%) | 173 (17.8%) |
| 80 to 84 Years | 58 (4.2%) | 0 (0.0%) |
| 85 Years and over | 27 (2.0%) | 0 (0.0%) |
| Total | 1,374 (100.0%) | 973 (100.0%) |
Families and Households in Coto Laurel
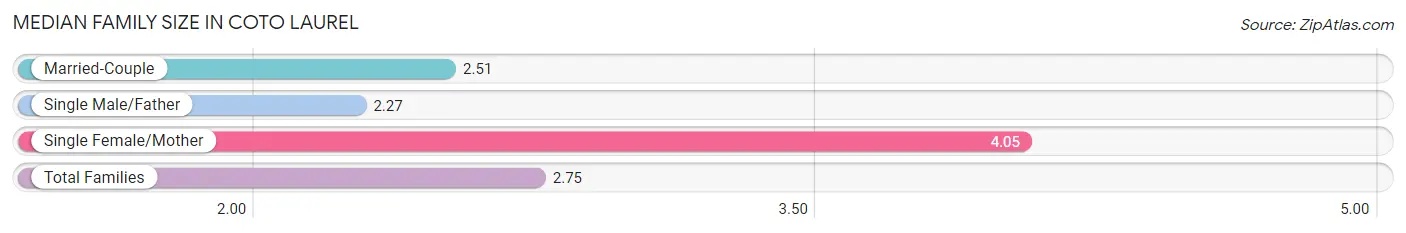
Median Family Size in Coto Laurel
The median family size in Coto Laurel is 2.75 persons per family, with single female/mother families (134 | 17.6%) accounting for the largest median family size of 4.05 persons per family. On the other hand, single male/father families (91 | 11.9%) represent the smallest median family size with 2.27 persons per family.
| Family Type | # Families | Family Size |
| Married-Couple | 538 (70.5%) | 2.51 |
| Single Male/Father | 91 (11.9%) | 2.27 |
| Single Female/Mother | 134 (17.6%) | 4.05 |
| Total Families | 763 (100.0%) | 2.75 |
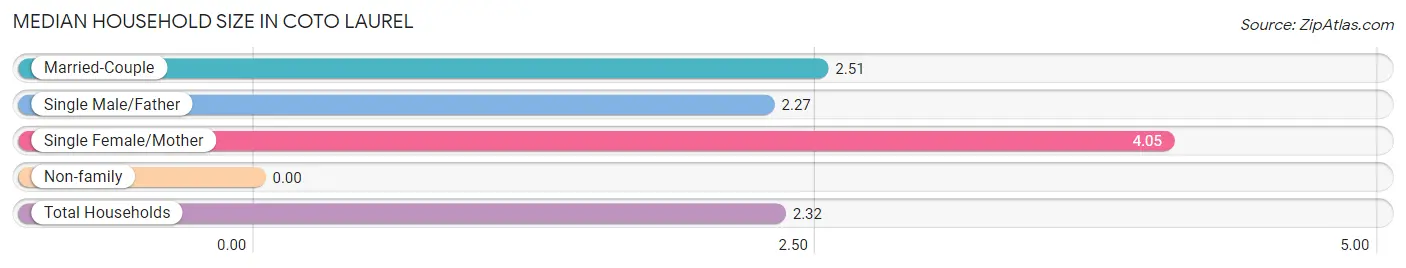
Median Household Size in Coto Laurel
| Household Type | # Households | Household Size |
| Married-Couple | 538 (53.3%) | 2.51 |
| Single Male/Father | 91 (9.0%) | 2.27 |
| Single Female/Mother | 134 (13.3%) | 4.05 |
| Non-family | 247 (24.5%) | - |
| Total Households | 1,010 (100.0%) | 2.32 |
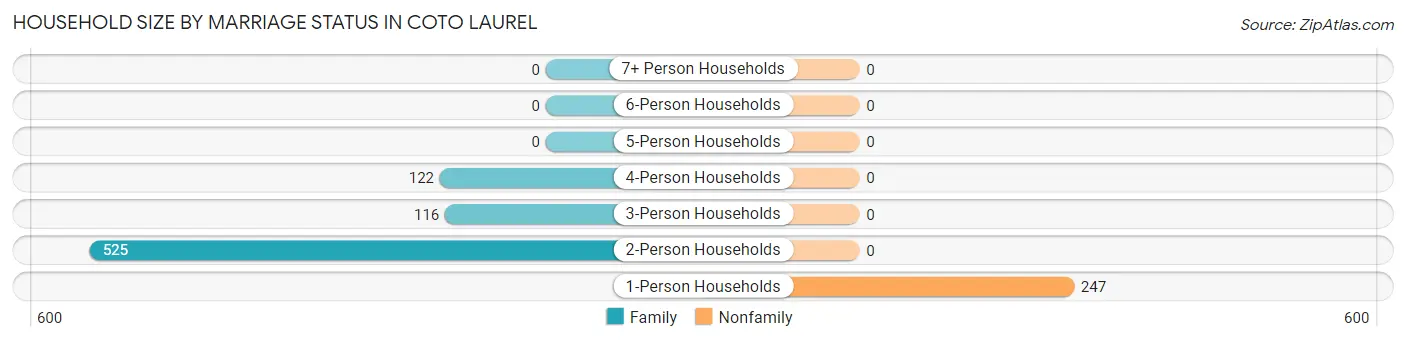
Household Size by Marriage Status in Coto Laurel
Out of a total of 1,010 households in Coto Laurel, 763 (75.5%) are family households, while 247 (24.5%) are nonfamily households. The most numerous type of family households are 2-person households, comprising 525, and the most common type of nonfamily households are 1-person households, comprising 247.
| Household Size | Family Households | Nonfamily Households |
| 1-Person Households | - | 247 (24.5%) |
| 2-Person Households | 525 (52.0%) | 0 (0.0%) |
| 3-Person Households | 116 (11.5%) | 0 (0.0%) |
| 4-Person Households | 122 (12.1%) | 0 (0.0%) |
| 5-Person Households | 0 (0.0%) | 0 (0.0%) |
| 6-Person Households | 0 (0.0%) | 0 (0.0%) |
| 7+ Person Households | 0 (0.0%) | 0 (0.0%) |
| Total | 763 (75.5%) | 247 (24.5%) |
Female Fertility in Coto Laurel
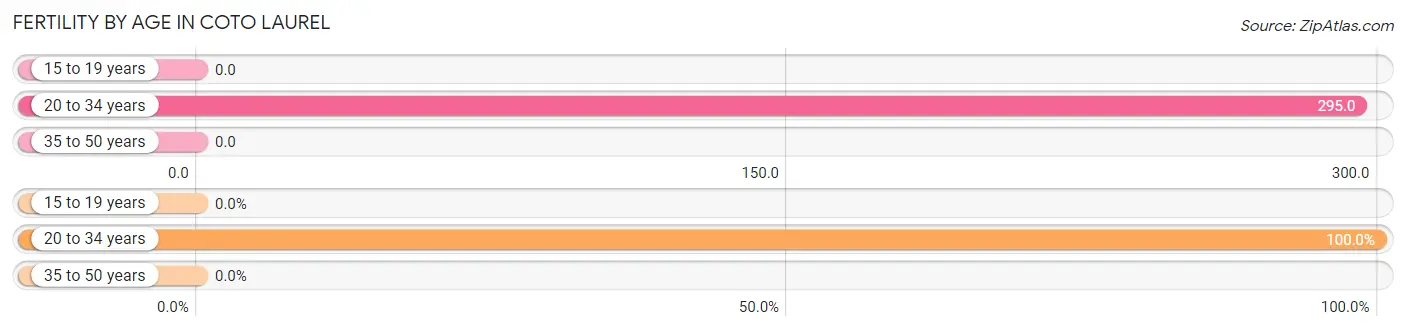
Fertility by Age in Coto Laurel
Average fertility rate in Coto Laurel is 163.0 births per 1,000 women. Women in the age bracket of 20 to 34 years have the highest fertility rate with 295.0 births per 1,000 women. Women in the age bracket of 20 to 34 years acount for 100.0% of all women with births.
| Age Bracket | Women with Births | Births / 1,000 Women |
| 15 to 19 years | 0 (0.0%) | 0.0 |
| 20 to 34 years | 43 (100.0%) | 295.0 |
| 35 to 50 years | 0 (0.0%) | 0.0 |
| Total | 43 (100.0%) | 163.0 |
Fertility by Age by Marriage Status in Coto Laurel
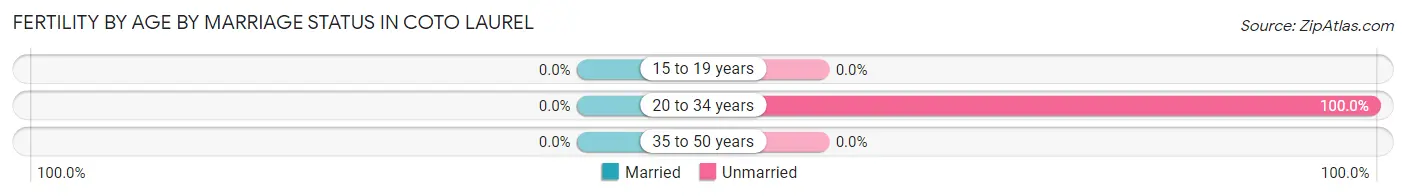
| Age Bracket | Married | Unmarried |
| 15 to 19 years | 0 (0.0%) | 0 (0.0%) |
| 20 to 34 years | 0 (0.0%) | 43 (100.0%) |
| 35 to 50 years | 0 (0.0%) | 0 (0.0%) |
| Total | 0 (0.0%) | 43 (100.0%) |
Fertility by Education in Coto Laurel
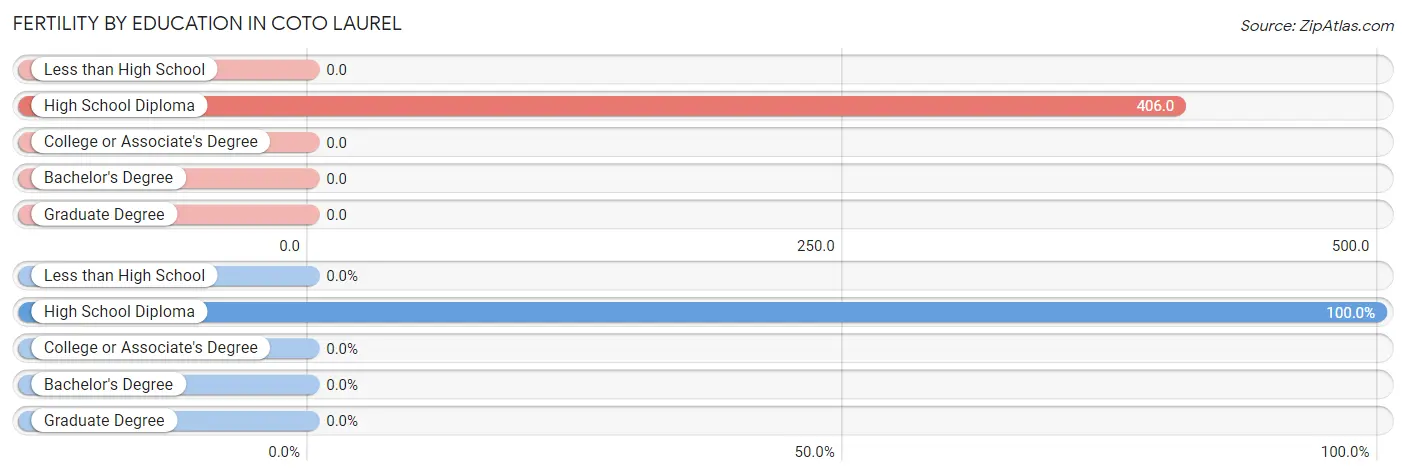
| Educational Attainment | Women with Births | Births / 1,000 Women |
| Less than High School | 0 (0.0%) | 0.0 |
| High School Diploma | 43 (100.0%) | 406.0 |
| College or Associate's Degree | 0 (0.0%) | 0.0 |
| Bachelor's Degree | 0 (0.0%) | 0.0 |
| Graduate Degree | 0 (0.0%) | 0.0 |
| Total | 43 (100.0%) | 163.0 |
Fertility by Education by Marriage Status in Coto Laurel
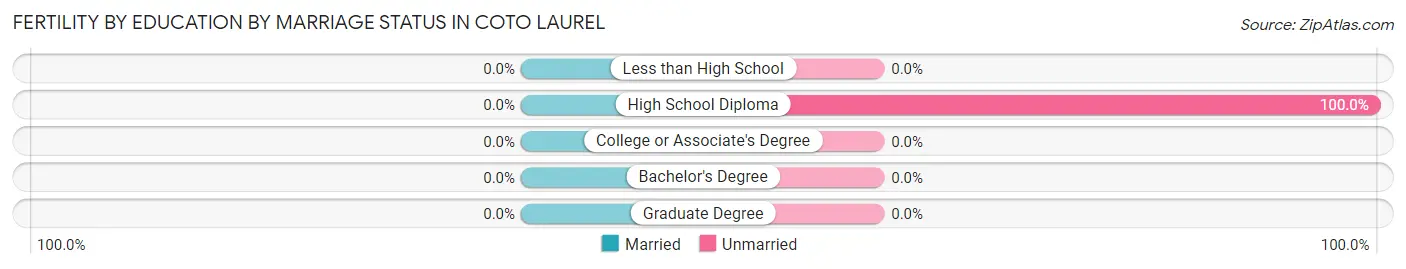
| Educational Attainment | Married | Unmarried |
| Less than High School | 0 (0.0%) | 0 (0.0%) |
| High School Diploma | 0 (0.0%) | 43 (100.0%) |
| College or Associate's Degree | 0 (0.0%) | 0 (0.0%) |
| Bachelor's Degree | 0 (0.0%) | 0 (0.0%) |
| Graduate Degree | 0 (0.0%) | 0 (0.0%) |
| Total | 0 (0.0%) | 43 (100.0%) |
Employment Characteristics in Coto Laurel
Employment by Class of Employer in Coto Laurel
Among the 381 employed individuals in Coto Laurel, private company employees (237 | 62.2%), local government employees (78 | 20.5%), and state government employees (66 | 17.3%) make up the most common classes of employment.
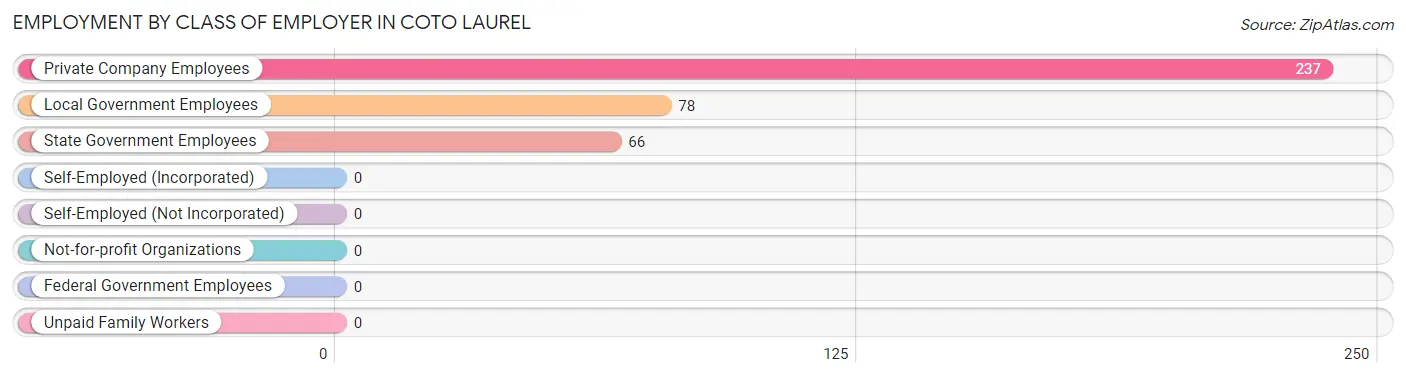
| Employer Class | # Employees | % Employees |
| Private Company Employees | 237 | 62.2% |
| Self-Employed (Incorporated) | 0 | 0.0% |
| Self-Employed (Not Incorporated) | 0 | 0.0% |
| Not-for-profit Organizations | 0 | 0.0% |
| Local Government Employees | 78 | 20.5% |
| State Government Employees | 66 | 17.3% |
| Federal Government Employees | 0 | 0.0% |
| Unpaid Family Workers | 0 | 0.0% |
| Total | 381 | 100.0% |
Employment Status by Age in Coto Laurel
According to the labor force statistics for Coto Laurel, out of the total population over 16 years of age (2,043), 29.2% or 597 individuals are in the labor force, with 22.3% or 133 of them unemployed. The age group with the highest labor force participation rate is 25 to 29 years, with 100.0% or 63 individuals in the labor force. Within the labor force, the 20 to 24 years age range has the highest percentage of unemployed individuals, with 50.0% or 76 of them being unemployed.
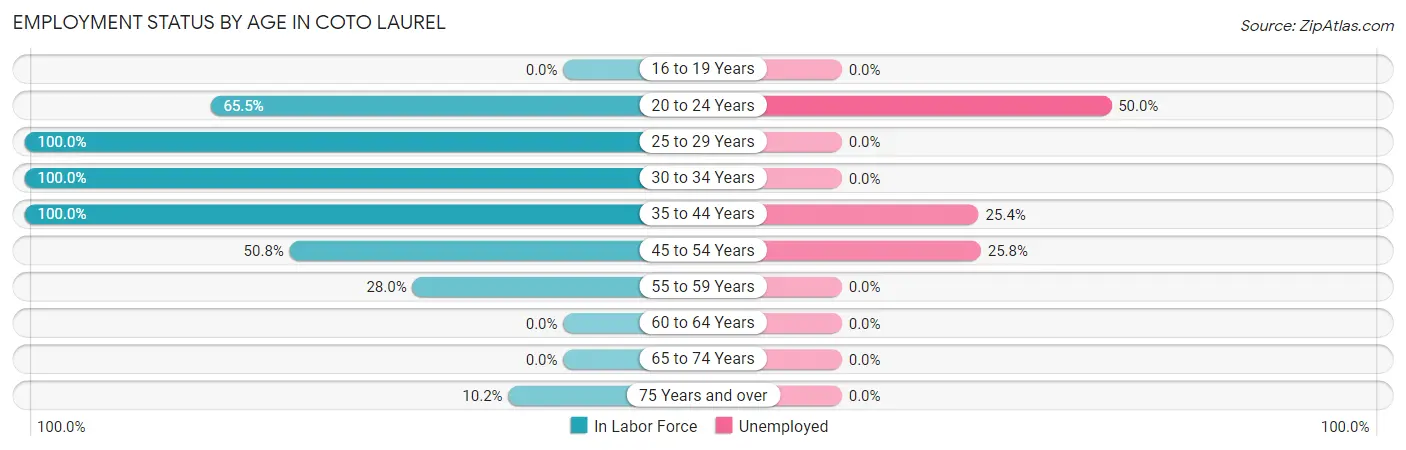
| Age Bracket | In Labor Force | Unemployed |
| 16 to 19 Years | 0 (0.0%) | 0 (0.0%) |
| 20 to 24 Years | 152 (65.5%) | 76 (50.0%) |
| 25 to 29 Years | 63 (100.0%) | 0 (0.0%) |
| 30 to 34 Years | 40 (100.0%) | 0 (0.0%) |
| 35 to 44 Years | 126 (100.0%) | 32 (25.4%) |
| 45 to 54 Years | 97 (50.8%) | 25 (25.8%) |
| 55 to 59 Years | 80 (28.0%) | 0 (0.0%) |
| 60 to 64 Years | 0 (0.0%) | 0 (0.0%) |
| 65 to 74 Years | 0 (0.0%) | 0 (0.0%) |
| 75 Years and over | 38 (10.2%) | 0 (0.0%) |
| Total | 597 (29.2%) | 133 (22.3%) |
Employment Status by Educational Attainment in Coto Laurel
According to labor force statistics for Coto Laurel, 48.0% of individuals (406) out of the total population between 25 and 64 years of age (845) are in the labor force, with 14.0% or 57 of them being unemployed. The group with the highest labor force participation rate are those with the educational attainment of college / associate degree, with 100.0% or 88 individuals in the labor force. Within the labor force, individuals with bachelor's degree or higher education have the highest percentage of unemployment, with 24.4% or 32 of them being unemployed.
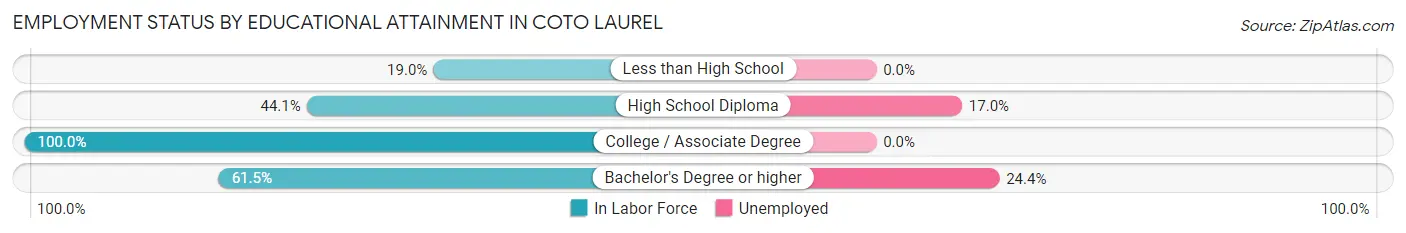
| Educational Attainment | In Labor Force | Unemployed |
| Less than High School | 40 (19.0%) | 0 (0.0%) |
| High School Diploma | 147 (44.1%) | 57 (17.0%) |
| College / Associate Degree | 88 (100.0%) | 0 (0.0%) |
| Bachelor's Degree or higher | 131 (61.5%) | 52 (24.4%) |
| Total | 406 (48.0%) | 118 (14.0%) |
Employment Occupations by Sex in Coto Laurel
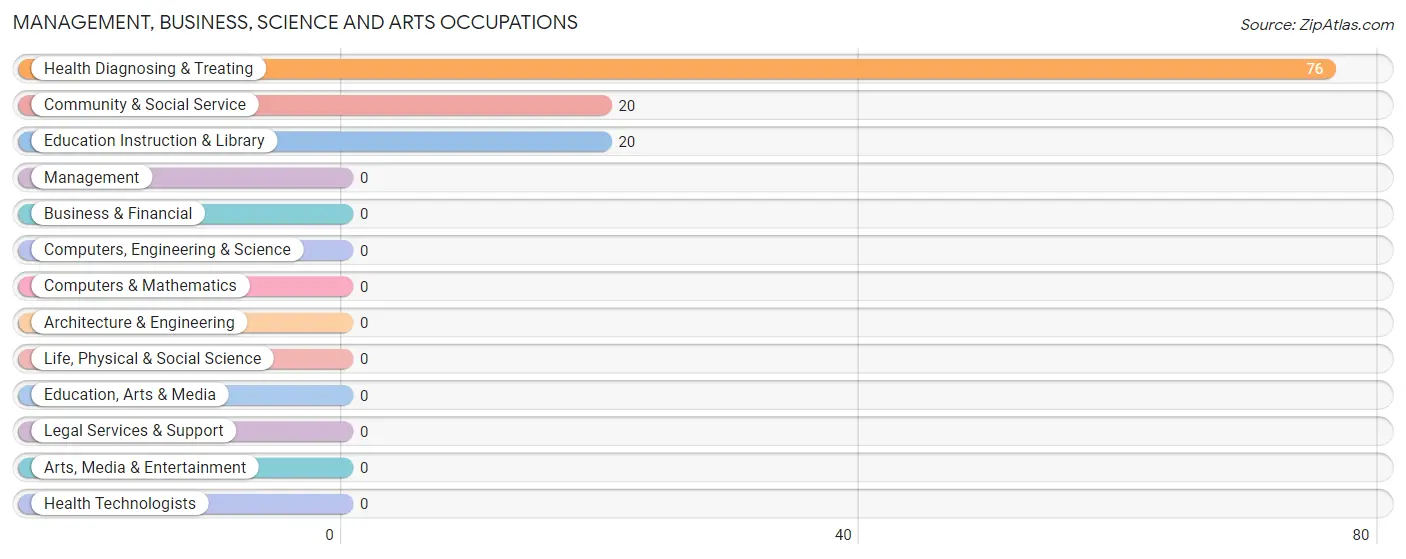
Management, Business, Science and Arts Occupations
The most common Management, Business, Science and Arts occupations in Coto Laurel are Health Diagnosing & Treating (76 | 16.4%), Community & Social Service (20 | 4.3%), and Education Instruction & Library (20 | 4.3%).
Management, Business, Science and Arts Occupations by Sex
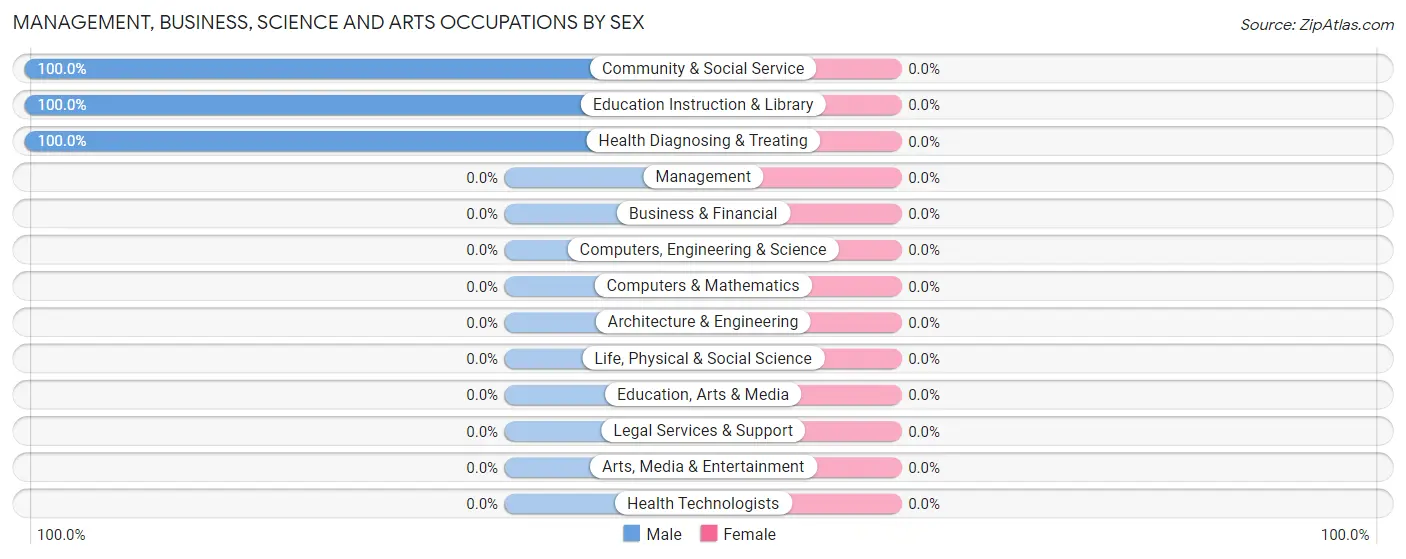
| Occupation | Male | Female |
| Management | 0 (0.0%) | 0 (0.0%) |
| Business & Financial | 0 (0.0%) | 0 (0.0%) |
| Computers, Engineering & Science | 0 (0.0%) | 0 (0.0%) |
| Computers & Mathematics | 0 (0.0%) | 0 (0.0%) |
| Architecture & Engineering | 0 (0.0%) | 0 (0.0%) |
| Life, Physical & Social Science | 0 (0.0%) | 0 (0.0%) |
| Community & Social Service | 20 (100.0%) | 0 (0.0%) |
| Education, Arts & Media | 0 (0.0%) | 0 (0.0%) |
| Legal Services & Support | 0 (0.0%) | 0 (0.0%) |
| Education Instruction & Library | 20 (100.0%) | 0 (0.0%) |
| Arts, Media & Entertainment | 0 (0.0%) | 0 (0.0%) |
| Health Diagnosing & Treating | 76 (100.0%) | 0 (0.0%) |
| Health Technologists | 0 (0.0%) | 0 (0.0%) |
| Total (Category) | 96 (100.0%) | 0 (0.0%) |
| Total (Overall) | 241 (52.0%) | 222 (47.9%) |
Services Occupations
The most common Services occupations in Coto Laurel are Food Preparation & Serving (63 | 13.6%), Healthcare Support (40 | 8.6%), and Cleaning & Maintenance (38 | 8.2%).
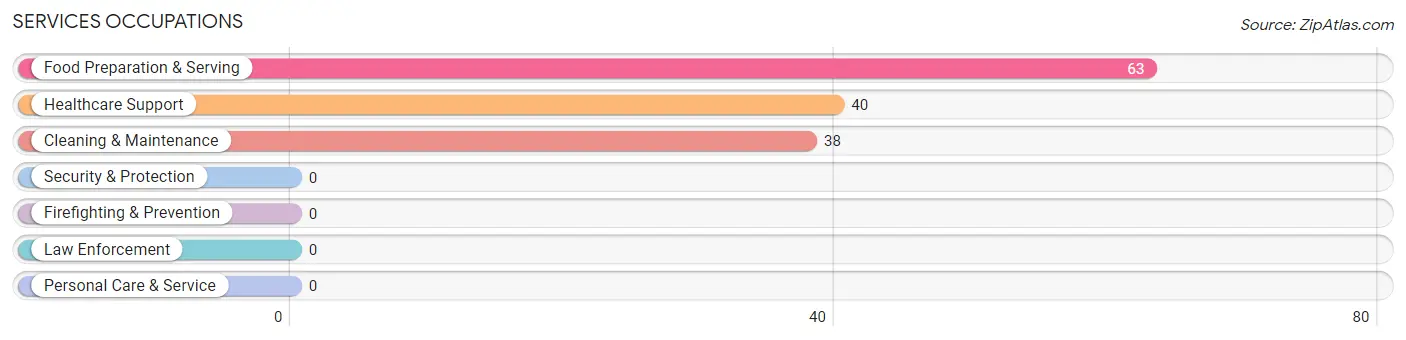
Services Occupations by Sex
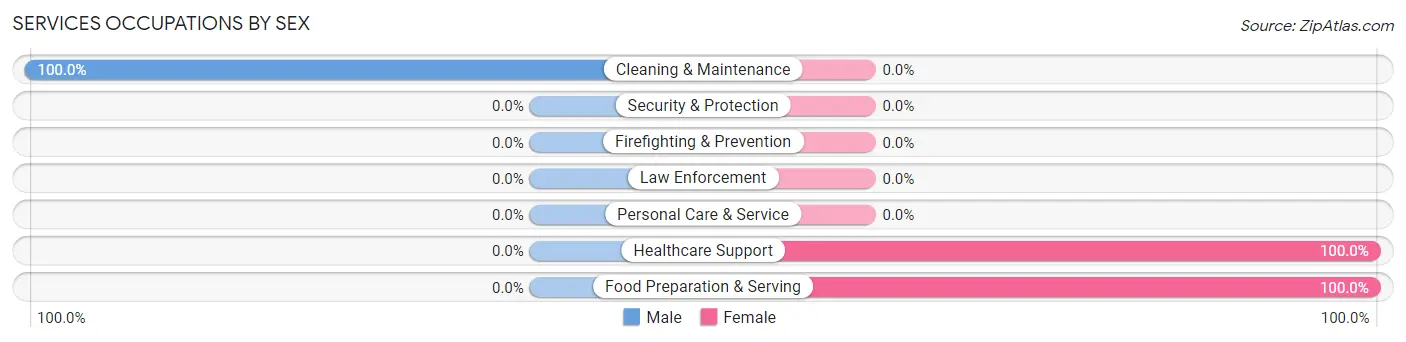
| Occupation | Male | Female |
| Healthcare Support | 0 (0.0%) | 40 (100.0%) |
| Security & Protection | 0 (0.0%) | 0 (0.0%) |
| Firefighting & Prevention | 0 (0.0%) | 0 (0.0%) |
| Law Enforcement | 0 (0.0%) | 0 (0.0%) |
| Food Preparation & Serving | 0 (0.0%) | 63 (100.0%) |
| Cleaning & Maintenance | 38 (100.0%) | 0 (0.0%) |
| Personal Care & Service | 0 (0.0%) | 0 (0.0%) |
| Total (Category) | 38 (27.0%) | 103 (73.1%) |
| Total (Overall) | 241 (52.0%) | 222 (47.9%) |
Sales and Office Occupations
The most common Sales and Office occupations in Coto Laurel are Office & Administration (46 | 9.9%), and Sales & Related (33 | 7.1%).
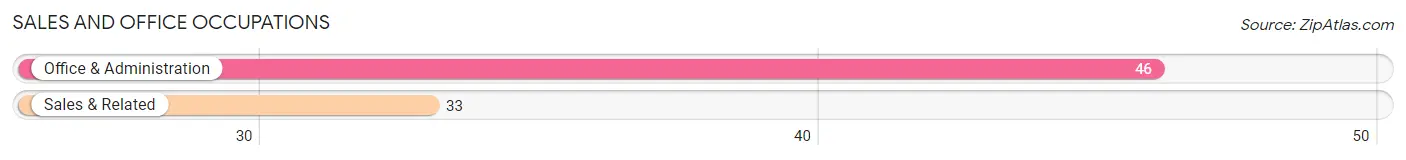
Sales and Office Occupations by Sex
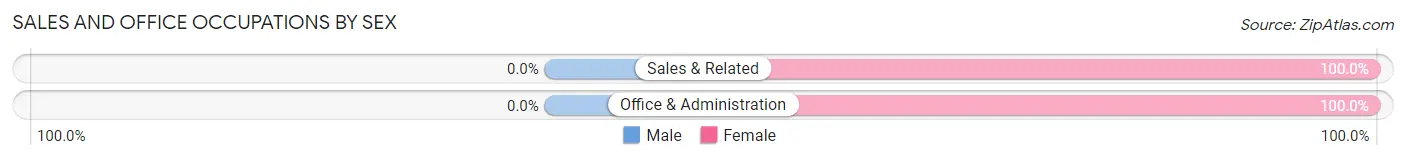
| Occupation | Male | Female |
| Sales & Related | 0 (0.0%) | 33 (100.0%) |
| Office & Administration | 0 (0.0%) | 46 (100.0%) |
| Total (Category) | 0 (0.0%) | 79 (100.0%) |
| Total (Overall) | 241 (52.0%) | 222 (47.9%) |
Natural Resources, Construction and Maintenance Occupations
The most common Natural Resources, Construction and Maintenance occupations in Coto Laurel are Farming, Fishing & Forestry (40 | 8.6%), and Construction & Extraction (19 | 4.1%).

Natural Resources, Construction and Maintenance Occupations by Sex
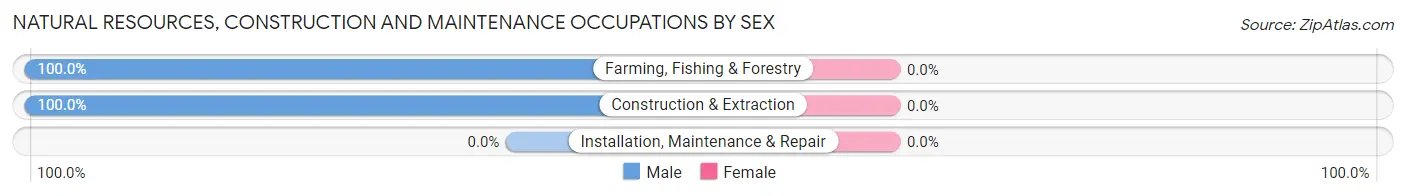
| Occupation | Male | Female |
| Farming, Fishing & Forestry | 40 (100.0%) | 0 (0.0%) |
| Construction & Extraction | 19 (100.0%) | 0 (0.0%) |
| Installation, Maintenance & Repair | 0 (0.0%) | 0 (0.0%) |
| Total (Category) | 59 (100.0%) | 0 (0.0%) |
| Total (Overall) | 241 (52.0%) | 222 (47.9%) |
Production, Transportation and Moving Occupations
The most common Production, Transportation and Moving occupations in Coto Laurel are Material Moving (48 | 10.4%), and Production (40 | 8.6%).
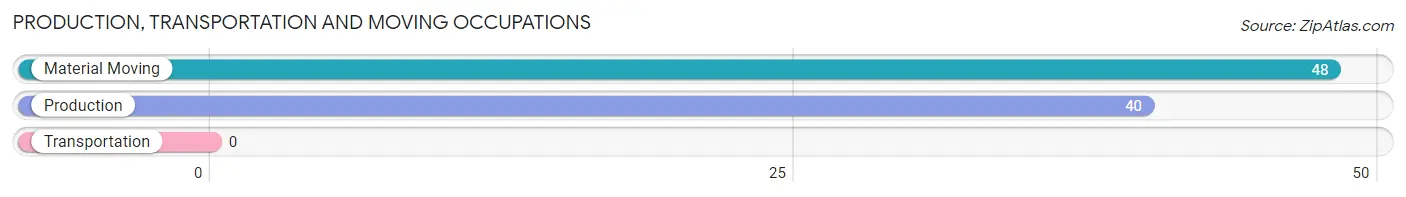
Production, Transportation and Moving Occupations by Sex
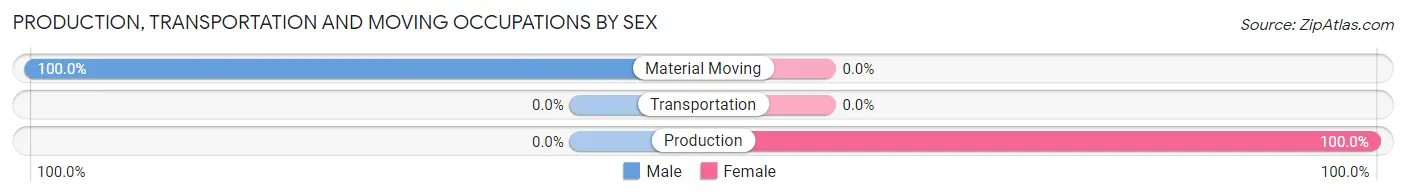
| Occupation | Male | Female |
| Production | 0 (0.0%) | 40 (100.0%) |
| Transportation | 0 (0.0%) | 0 (0.0%) |
| Material Moving | 48 (100.0%) | 0 (0.0%) |
| Total (Category) | 48 (54.5%) | 40 (45.5%) |
| Total (Overall) | 241 (52.0%) | 222 (47.9%) |
Employment Industries by Sex in Coto Laurel
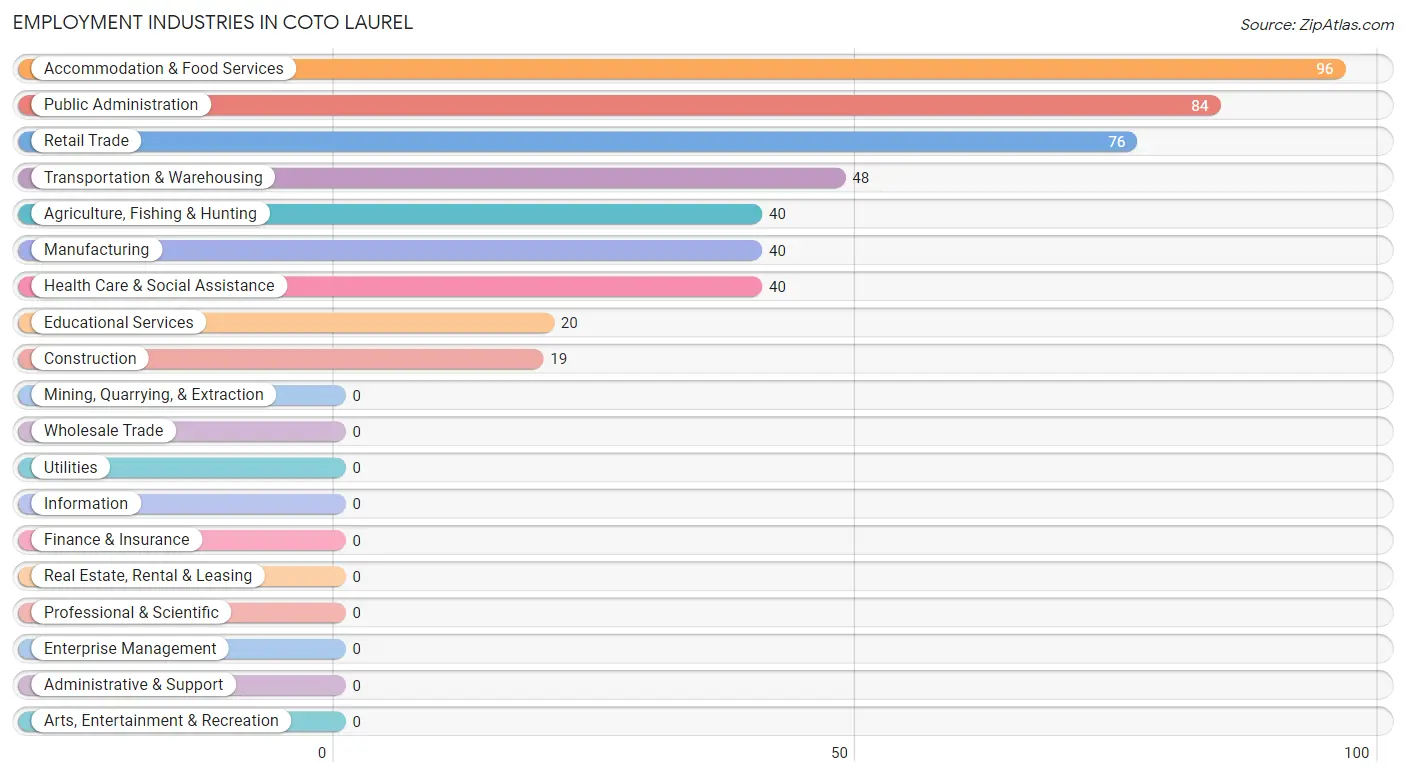
Employment Industries in Coto Laurel
The major employment industries in Coto Laurel include Accommodation & Food Services (96 | 20.7%), Public Administration (84 | 18.1%), Retail Trade (76 | 16.4%), Transportation & Warehousing (48 | 10.4%), and Agriculture, Fishing & Hunting (40 | 8.6%).
Employment Industries by Sex in Coto Laurel
The Coto Laurel industries that see more men than women are Agriculture, Fishing & Hunting (100.0%), Construction (100.0%), and Retail Trade (100.0%), whereas the industries that tend to have a higher number of women are Manufacturing (100.0%), Health Care & Social Assistance (100.0%), and Accommodation & Food Services (100.0%).
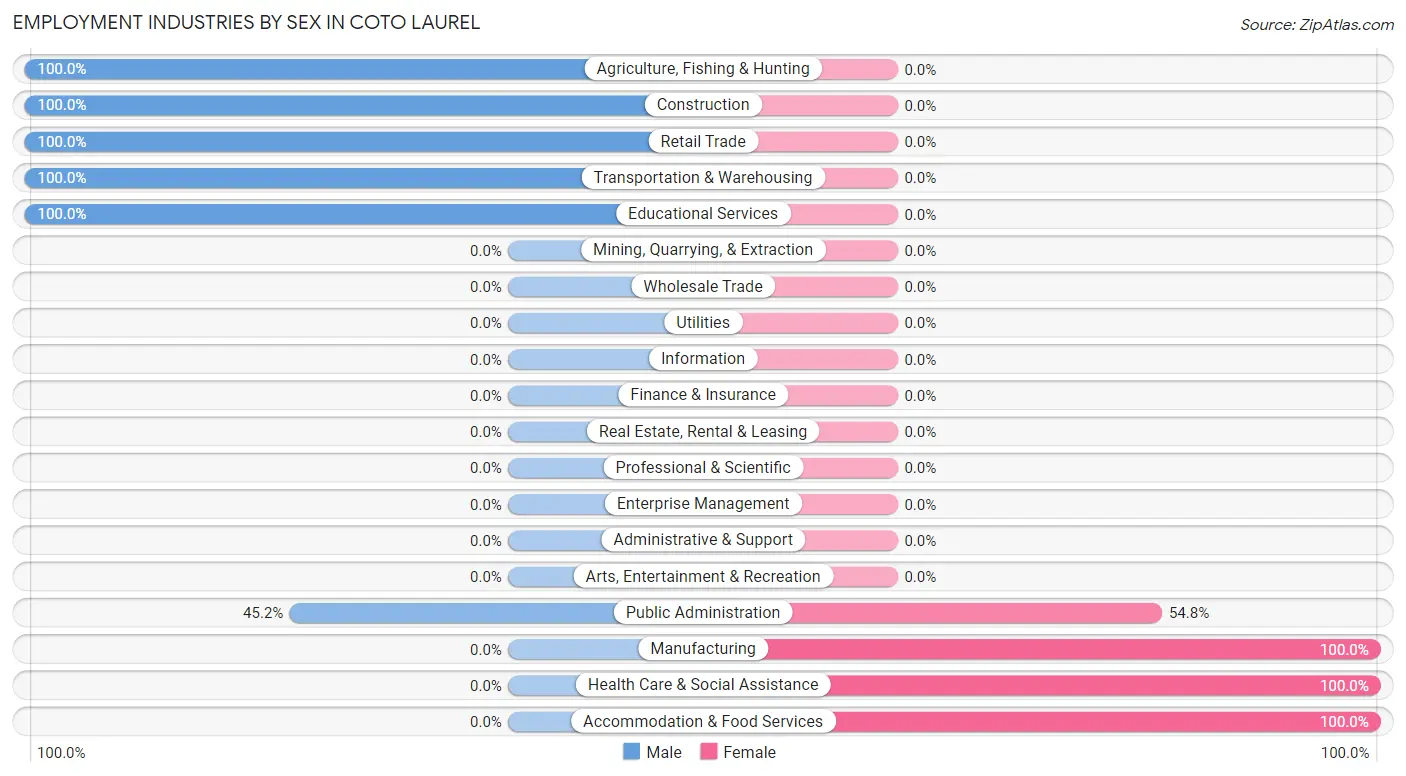
| Industry | Male | Female |
| Agriculture, Fishing & Hunting | 40 (100.0%) | 0 (0.0%) |
| Mining, Quarrying, & Extraction | 0 (0.0%) | 0 (0.0%) |
| Construction | 19 (100.0%) | 0 (0.0%) |
| Manufacturing | 0 (0.0%) | 40 (100.0%) |
| Wholesale Trade | 0 (0.0%) | 0 (0.0%) |
| Retail Trade | 76 (100.0%) | 0 (0.0%) |
| Transportation & Warehousing | 48 (100.0%) | 0 (0.0%) |
| Utilities | 0 (0.0%) | 0 (0.0%) |
| Information | 0 (0.0%) | 0 (0.0%) |
| Finance & Insurance | 0 (0.0%) | 0 (0.0%) |
| Real Estate, Rental & Leasing | 0 (0.0%) | 0 (0.0%) |
| Professional & Scientific | 0 (0.0%) | 0 (0.0%) |
| Enterprise Management | 0 (0.0%) | 0 (0.0%) |
| Administrative & Support | 0 (0.0%) | 0 (0.0%) |
| Educational Services | 20 (100.0%) | 0 (0.0%) |
| Health Care & Social Assistance | 0 (0.0%) | 40 (100.0%) |
| Arts, Entertainment & Recreation | 0 (0.0%) | 0 (0.0%) |
| Accommodation & Food Services | 0 (0.0%) | 96 (100.0%) |
| Public Administration | 38 (45.2%) | 46 (54.8%) |
| Total | 241 (52.0%) | 222 (47.9%) |
Education in Coto Laurel
School Enrollment in Coto Laurel
The most common levels of schooling among the 380 students in Coto Laurel are college / undergraduate (128 | 33.7%), elementary school (86 | 22.6%), and high school (71 | 18.7%).
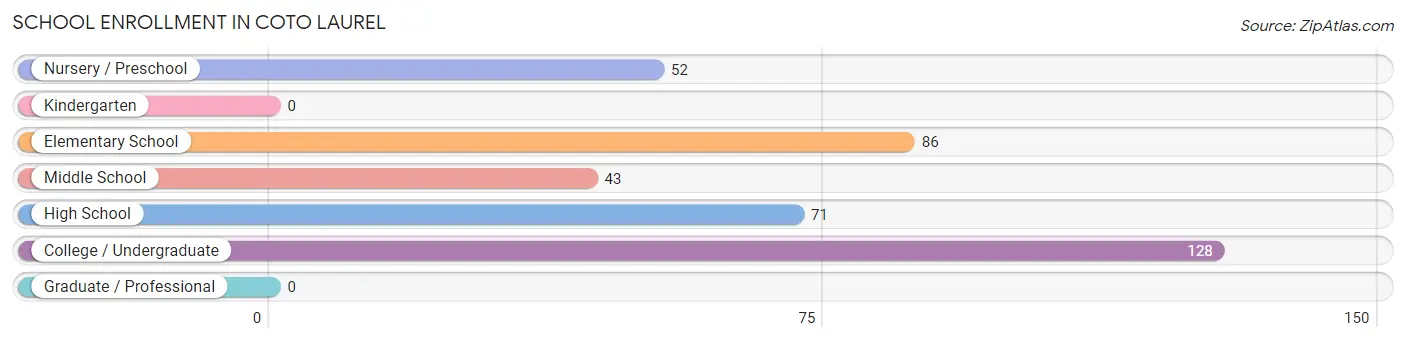
| School Level | # Students | % Students |
| Nursery / Preschool | 52 | 13.7% |
| Kindergarten | 0 | 0.0% |
| Elementary School | 86 | 22.6% |
| Middle School | 43 | 11.3% |
| High School | 71 | 18.7% |
| College / Undergraduate | 128 | 33.7% |
| Graduate / Professional | 0 | 0.0% |
| Total | 380 | 100.0% |
School Enrollment by Age by Funding Source in Coto Laurel
Out of a total of 380 students who are enrolled in schools in Coto Laurel, 173 (45.5%) attend a private institution, while the remaining 207 (54.5%) are enrolled in public schools. The age group of 5 to 9 year old has the highest likelihood of being enrolled in private schools, with 45 (100.0% in the age bracket) enrolled. Conversely, the age group of 3 to 4 year olds has the lowest likelihood of being enrolled in a private school, with 52 (100.0% in the age bracket) attending a public institution.
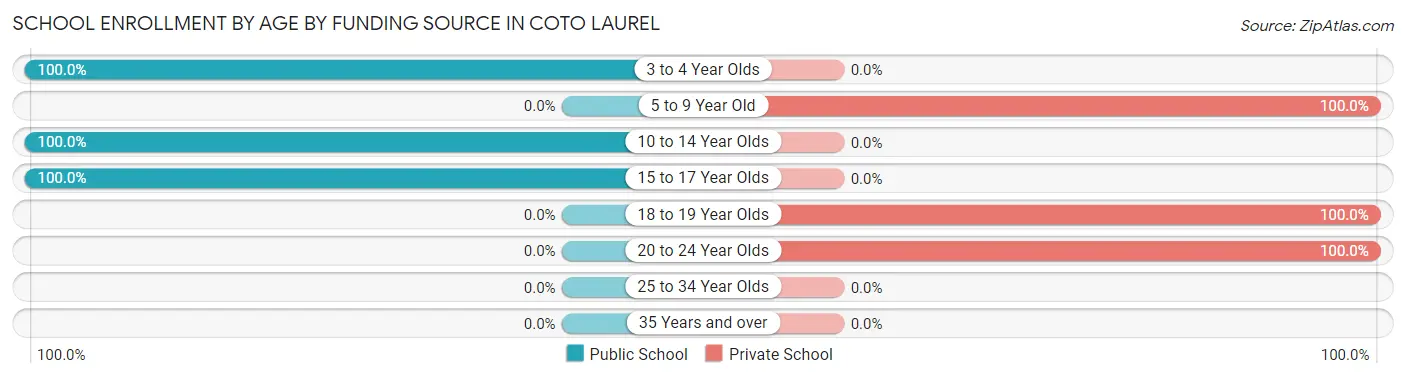
| Age Bracket | Public School | Private School |
| 3 to 4 Year Olds | 52 (100.0%) | 0 (0.0%) |
| 5 to 9 Year Old | 0 (0.0%) | 45 (100.0%) |
| 10 to 14 Year Olds | 124 (100.0%) | 0 (0.0%) |
| 15 to 17 Year Olds | 31 (100.0%) | 0 (0.0%) |
| 18 to 19 Year Olds | 0 (0.0%) | 52 (100.0%) |
| 20 to 24 Year Olds | 0 (0.0%) | 76 (100.0%) |
| 25 to 34 Year Olds | 0 (0.0%) | 0 (0.0%) |
| 35 Years and over | 0 (0.0%) | 0 (0.0%) |
| Total | 207 (54.5%) | 173 (45.5%) |
Educational Attainment by Field of Study in Coto Laurel
Business (128 | 60.1%), science & technology (53 | 24.9%), and education (32 | 15.0%) are the most common fields of study among 213 individuals in Coto Laurel who have obtained a bachelor's degree or higher.
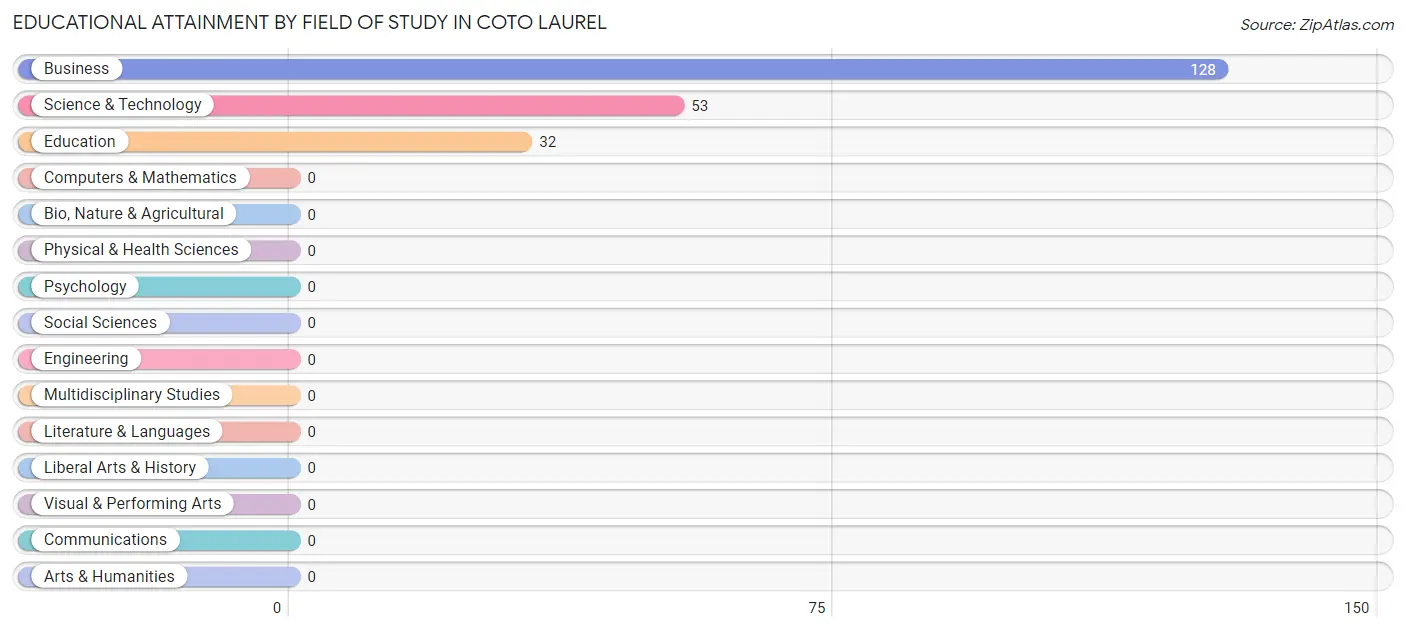
| Field of Study | # Graduates | % Graduates |
| Computers & Mathematics | 0 | 0.0% |
| Bio, Nature & Agricultural | 0 | 0.0% |
| Physical & Health Sciences | 0 | 0.0% |
| Psychology | 0 | 0.0% |
| Social Sciences | 0 | 0.0% |
| Engineering | 0 | 0.0% |
| Multidisciplinary Studies | 0 | 0.0% |
| Science & Technology | 53 | 24.9% |
| Business | 128 | 60.1% |
| Education | 32 | 15.0% |
| Literature & Languages | 0 | 0.0% |
| Liberal Arts & History | 0 | 0.0% |
| Visual & Performing Arts | 0 | 0.0% |
| Communications | 0 | 0.0% |
| Arts & Humanities | 0 | 0.0% |
| Total | 213 | 100.0% |
Transportation & Commute in Coto Laurel
Vehicle Availability by Sex in Coto Laurel
The most prevalent vehicle ownership categories in Coto Laurel are males with 3 vehicles (124, accounting for 55.9%) and females with 3 vehicles (86, making up 78.0%).
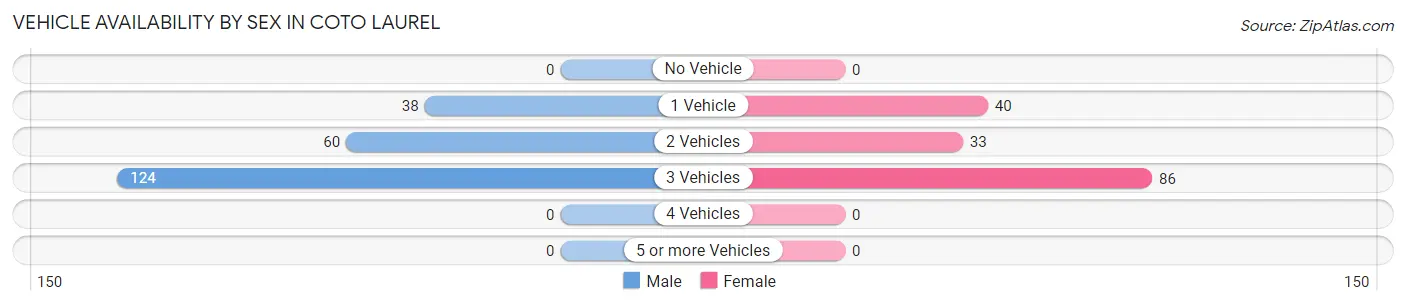
| Vehicles Available | Male | Female |
| No Vehicle | 0 (0.0%) | 0 (0.0%) |
| 1 Vehicle | 38 (17.1%) | 40 (25.2%) |
| 2 Vehicles | 60 (27.0%) | 33 (20.7%) |
| 3 Vehicles | 124 (55.9%) | 86 (54.1%) |
| 4 Vehicles | 0 (0.0%) | 0 (0.0%) |
| 5 or more Vehicles | 0 (0.0%) | 0 (0.0%) |
| Total | 222 (100.0%) | 159 (100.0%) |
Commute Time in Coto Laurel
The most frequently occuring commute durations in Coto Laurel are 10 to 14 minutes (94 commuters, 24.7%), 15 to 19 minutes (78 commuters, 20.5%), and 20 to 24 minutes (76 commuters, 20.0%).
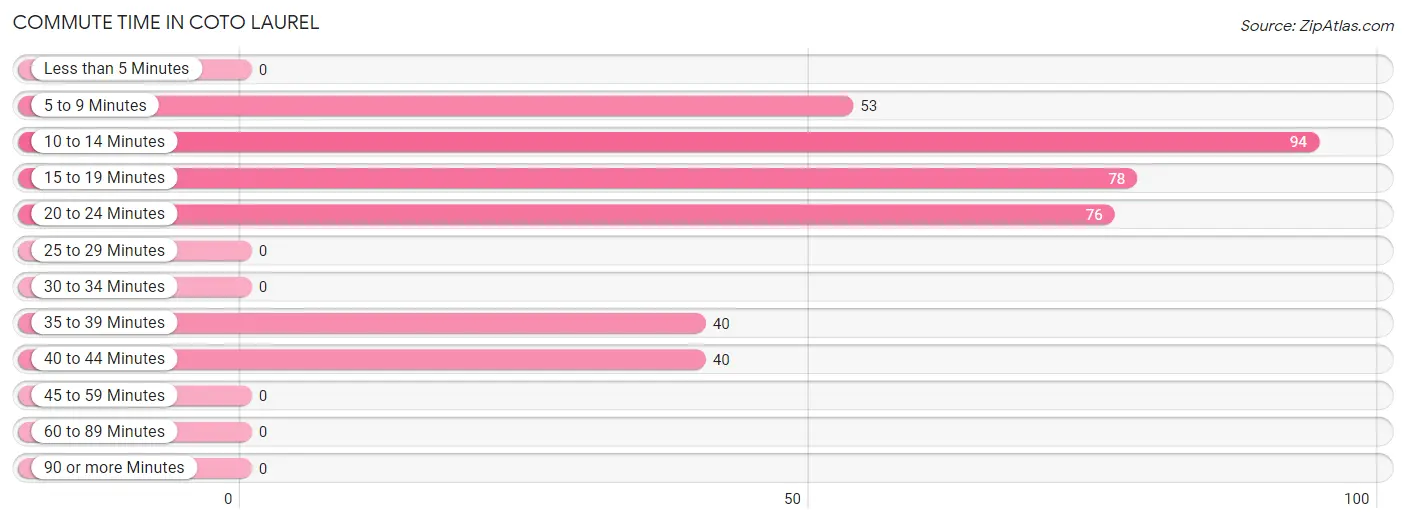
| Commute Time | # Commuters | % Commuters |
| Less than 5 Minutes | 0 | 0.0% |
| 5 to 9 Minutes | 53 | 13.9% |
| 10 to 14 Minutes | 94 | 24.7% |
| 15 to 19 Minutes | 78 | 20.5% |
| 20 to 24 Minutes | 76 | 20.0% |
| 25 to 29 Minutes | 0 | 0.0% |
| 30 to 34 Minutes | 0 | 0.0% |
| 35 to 39 Minutes | 40 | 10.5% |
| 40 to 44 Minutes | 40 | 10.5% |
| 45 to 59 Minutes | 0 | 0.0% |
| 60 to 89 Minutes | 0 | 0.0% |
| 90 or more Minutes | 0 | 0.0% |
Commute Time by Sex in Coto Laurel
The most common commute times in Coto Laurel are 20 to 24 minutes (76 commuters, 34.2%) for males and 10 to 14 minutes (46 commuters, 28.9%) for females.
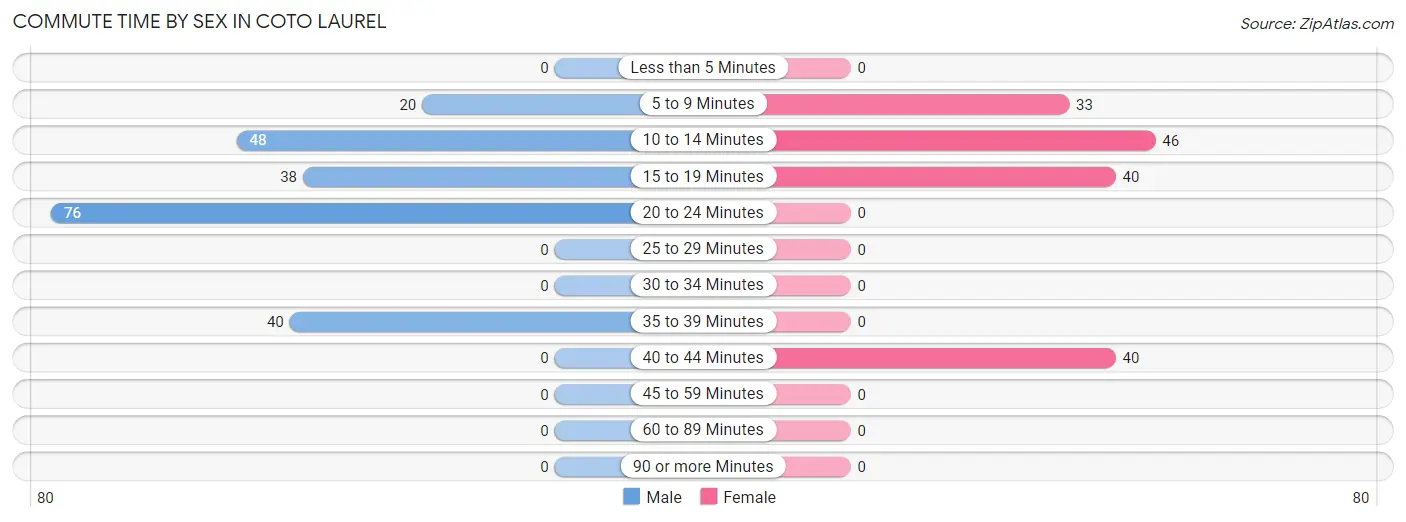
| Commute Time | Male | Female |
| Less than 5 Minutes | 0 (0.0%) | 0 (0.0%) |
| 5 to 9 Minutes | 20 (9.0%) | 33 (20.7%) |
| 10 to 14 Minutes | 48 (21.6%) | 46 (28.9%) |
| 15 to 19 Minutes | 38 (17.1%) | 40 (25.2%) |
| 20 to 24 Minutes | 76 (34.2%) | 0 (0.0%) |
| 25 to 29 Minutes | 0 (0.0%) | 0 (0.0%) |
| 30 to 34 Minutes | 0 (0.0%) | 0 (0.0%) |
| 35 to 39 Minutes | 40 (18.0%) | 0 (0.0%) |
| 40 to 44 Minutes | 0 (0.0%) | 40 (25.2%) |
| 45 to 59 Minutes | 0 (0.0%) | 0 (0.0%) |
| 60 to 89 Minutes | 0 (0.0%) | 0 (0.0%) |
| 90 or more Minutes | 0 (0.0%) | 0 (0.0%) |
Time of Departure to Work by Sex in Coto Laurel
The most frequent times of departure to work in Coto Laurel are 11:00 AM to 11:59 AM (76, 34.2%) for males and 9:00 AM to 9:59 AM (46, 28.9%) for females.
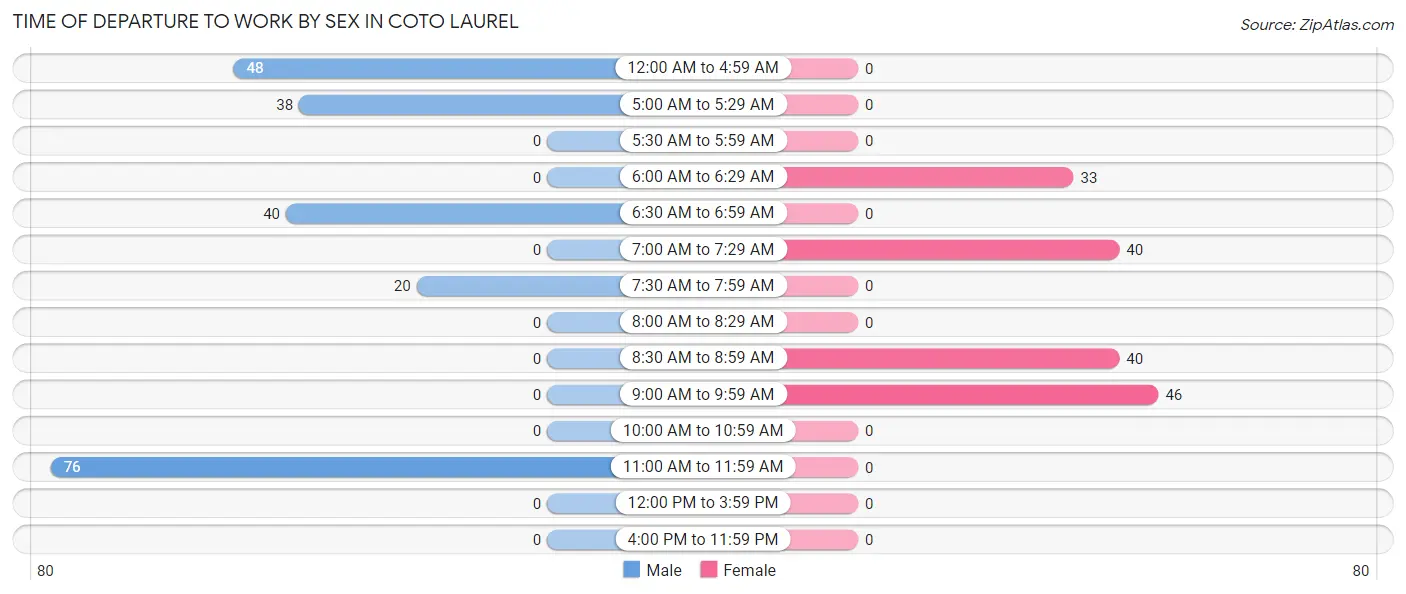
| Time of Departure | Male | Female |
| 12:00 AM to 4:59 AM | 48 (21.6%) | 0 (0.0%) |
| 5:00 AM to 5:29 AM | 38 (17.1%) | 0 (0.0%) |
| 5:30 AM to 5:59 AM | 0 (0.0%) | 0 (0.0%) |
| 6:00 AM to 6:29 AM | 0 (0.0%) | 33 (20.7%) |
| 6:30 AM to 6:59 AM | 40 (18.0%) | 0 (0.0%) |
| 7:00 AM to 7:29 AM | 0 (0.0%) | 40 (25.2%) |
| 7:30 AM to 7:59 AM | 20 (9.0%) | 0 (0.0%) |
| 8:00 AM to 8:29 AM | 0 (0.0%) | 0 (0.0%) |
| 8:30 AM to 8:59 AM | 0 (0.0%) | 40 (25.2%) |
| 9:00 AM to 9:59 AM | 0 (0.0%) | 46 (28.9%) |
| 10:00 AM to 10:59 AM | 0 (0.0%) | 0 (0.0%) |
| 11:00 AM to 11:59 AM | 76 (34.2%) | 0 (0.0%) |
| 12:00 PM to 3:59 PM | 0 (0.0%) | 0 (0.0%) |
| 4:00 PM to 11:59 PM | 0 (0.0%) | 0 (0.0%) |
| Total | 222 (100.0%) | 159 (100.0%) |
Housing Occupancy in Coto Laurel
Occupancy by Ownership in Coto Laurel
Of the total 1,010 dwellings in Coto Laurel, owner-occupied units account for 845 (83.7%), while renter-occupied units make up 165 (16.3%).
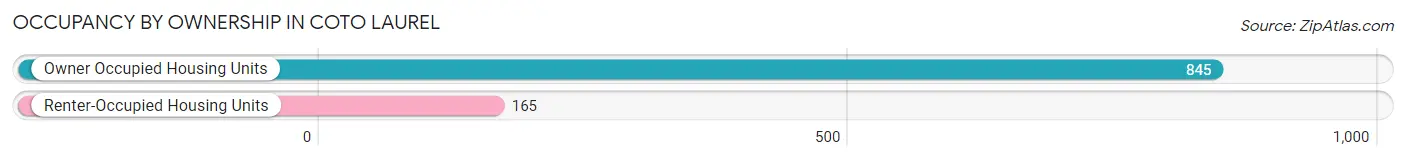
| Occupancy | # Housing Units | % Housing Units |
| Owner Occupied Housing Units | 845 | 83.7% |
| Renter-Occupied Housing Units | 165 | 16.3% |
| Total Occupied Housing Units | 1,010 | 100.0% |
Occupancy by Household Size in Coto Laurel
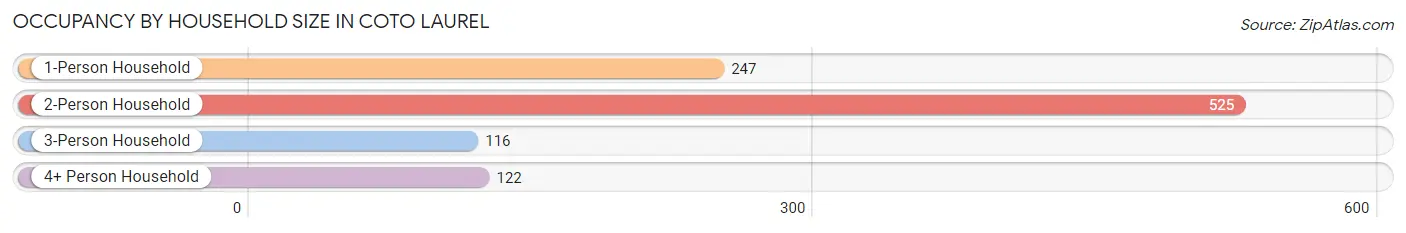
| Household Size | # Housing Units | % Housing Units |
| 1-Person Household | 247 | 24.5% |
| 2-Person Household | 525 | 52.0% |
| 3-Person Household | 116 | 11.5% |
| 4+ Person Household | 122 | 12.1% |
| Total Housing Units | 1,010 | 100.0% |
Occupancy by Ownership by Household Size in Coto Laurel
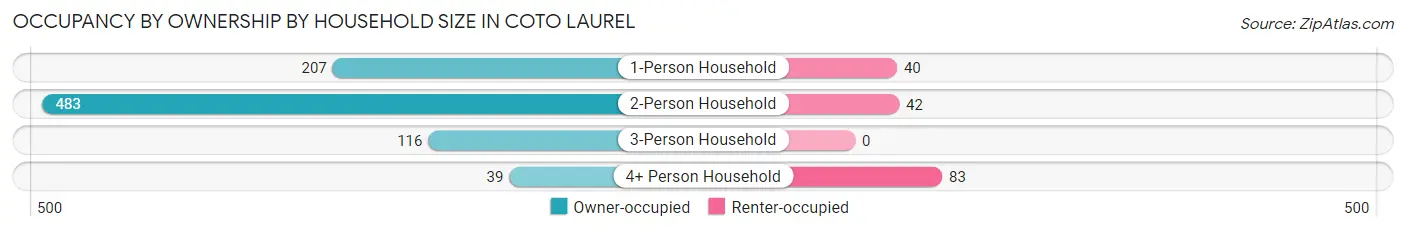
| Household Size | Owner-occupied | Renter-occupied |
| 1-Person Household | 207 (83.8%) | 40 (16.2%) |
| 2-Person Household | 483 (92.0%) | 42 (8.0%) |
| 3-Person Household | 116 (100.0%) | 0 (0.0%) |
| 4+ Person Household | 39 (32.0%) | 83 (68.0%) |
| Total Housing Units | 845 (83.7%) | 165 (16.3%) |
Occupancy by Educational Attainment in Coto Laurel
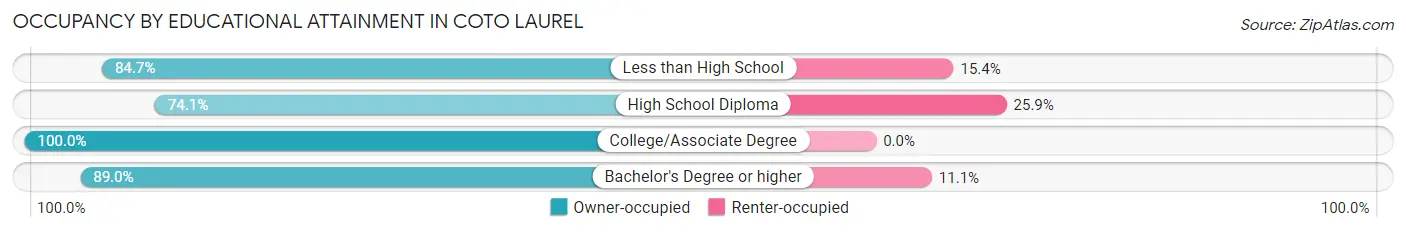
| Household Size | Owner-occupied | Renter-occupied |
| Less than High School | 342 (84.7%) | 62 (15.3%) |
| High School Diploma | 238 (74.1%) | 83 (25.9%) |
| College/Associate Degree | 104 (100.0%) | 0 (0.0%) |
| Bachelor's Degree or higher | 161 (88.9%) | 20 (11.1%) |
Occupancy by Age of Householder in Coto Laurel
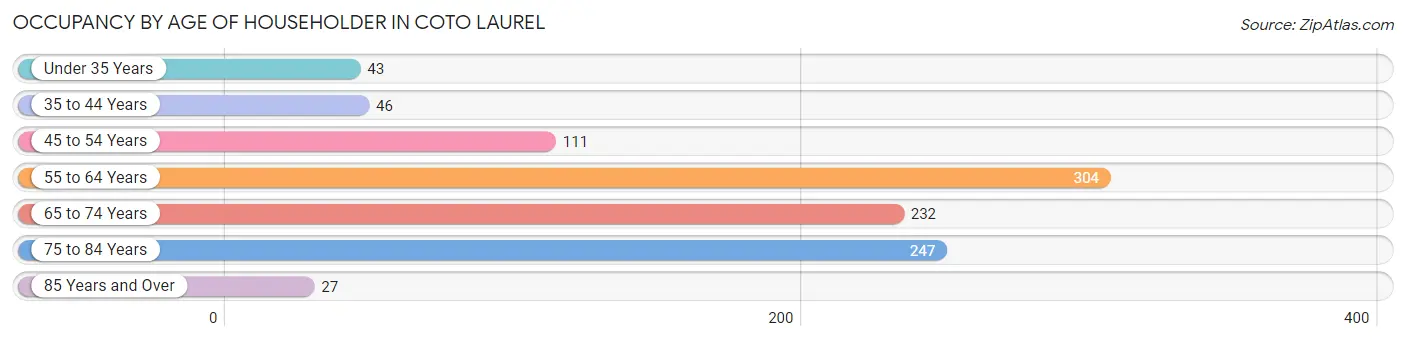
| Age Bracket | # Households | % Households |
| Under 35 Years | 43 | 4.3% |
| 35 to 44 Years | 46 | 4.5% |
| 45 to 54 Years | 111 | 11.0% |
| 55 to 64 Years | 304 | 30.1% |
| 65 to 74 Years | 232 | 23.0% |
| 75 to 84 Years | 247 | 24.5% |
| 85 Years and Over | 27 | 2.7% |
| Total | 1,010 | 100.0% |
Housing Finances in Coto Laurel
Median Income by Occupancy in Coto Laurel
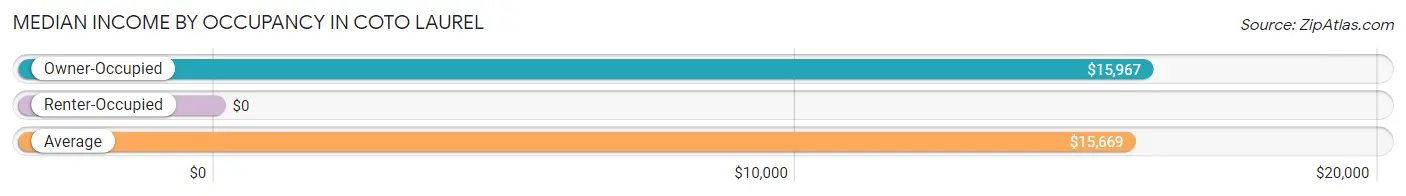
| Occupancy Type | # Households | Median Income |
| Owner-Occupied | 845 (83.7%) | $15,967 |
| Renter-Occupied | 165 (16.3%) | $0 |
| Average | 1,010 (100.0%) | $15,669 |
Occupancy by Householder Income Bracket in Coto Laurel
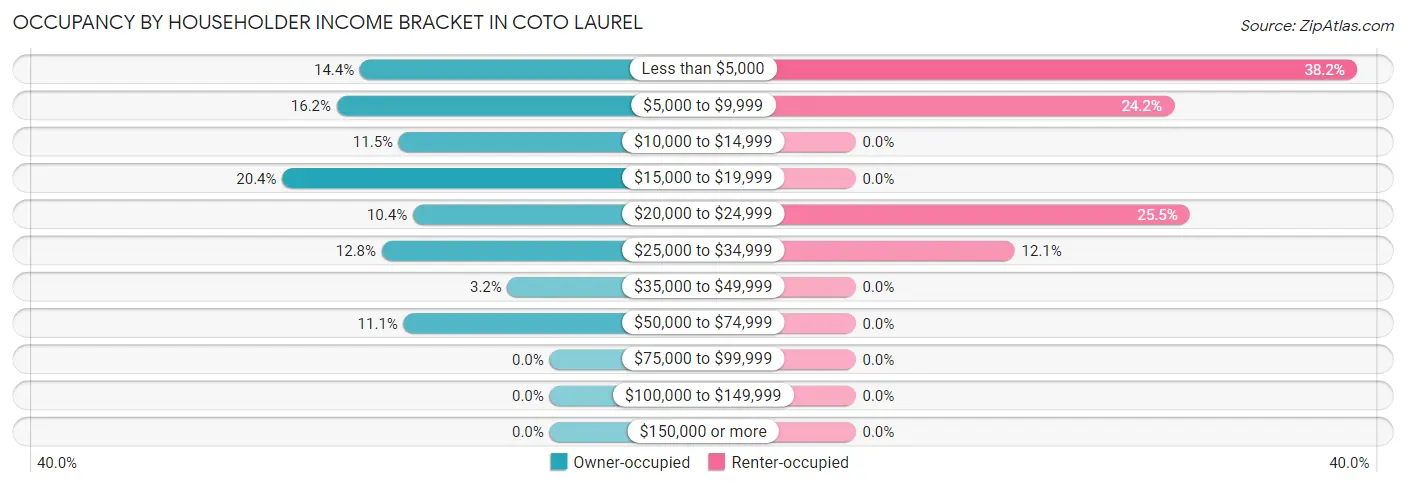
| Income Bracket | Owner-occupied | Renter-occupied |
| Less than $5,000 | 122 (14.4%) | 63 (38.2%) |
| $5,000 to $9,999 | 137 (16.2%) | 40 (24.2%) |
| $10,000 to $14,999 | 97 (11.5%) | 0 (0.0%) |
| $15,000 to $19,999 | 172 (20.4%) | 0 (0.0%) |
| $20,000 to $24,999 | 88 (10.4%) | 42 (25.5%) |
| $25,000 to $34,999 | 108 (12.8%) | 20 (12.1%) |
| $35,000 to $49,999 | 27 (3.2%) | 0 (0.0%) |
| $50,000 to $74,999 | 94 (11.1%) | 0 (0.0%) |
| $75,000 to $99,999 | 0 (0.0%) | 0 (0.0%) |
| $100,000 to $149,999 | 0 (0.0%) | 0 (0.0%) |
| $150,000 or more | 0 (0.0%) | 0 (0.0%) |
| Total | 845 (100.0%) | 165 (100.0%) |
Monthly Housing Cost Tiers in Coto Laurel
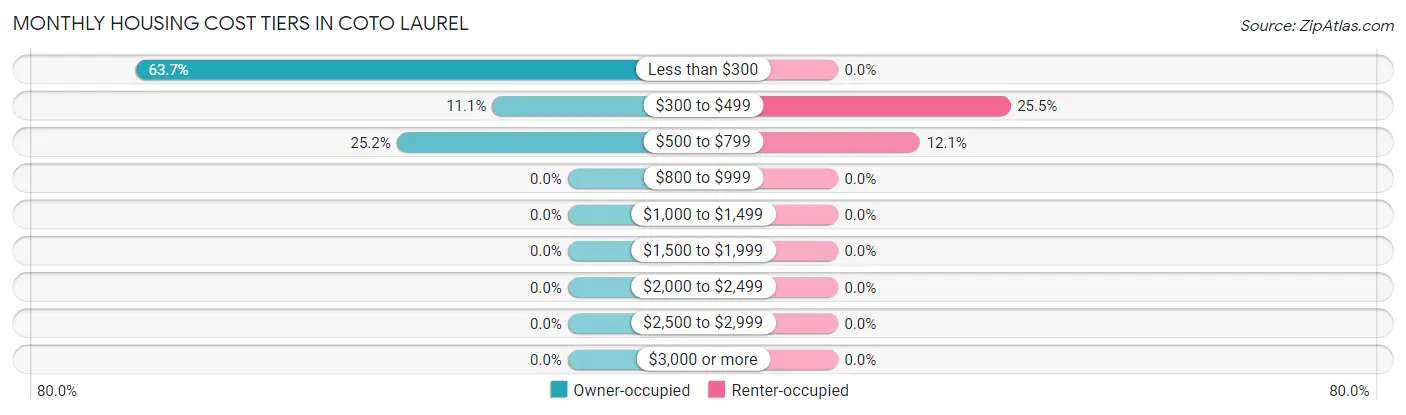
| Monthly Cost | Owner-occupied | Renter-occupied |
| Less than $300 | 538 (63.7%) | 0 (0.0%) |
| $300 to $499 | 94 (11.1%) | 42 (25.5%) |
| $500 to $799 | 213 (25.2%) | 20 (12.1%) |
| $800 to $999 | 0 (0.0%) | 0 (0.0%) |
| $1,000 to $1,499 | 0 (0.0%) | 0 (0.0%) |
| $1,500 to $1,999 | 0 (0.0%) | 0 (0.0%) |
| $2,000 to $2,499 | 0 (0.0%) | 0 (0.0%) |
| $2,500 to $2,999 | 0 (0.0%) | 0 (0.0%) |
| $3,000 or more | 0 (0.0%) | 0 (0.0%) |
| Total | 845 (100.0%) | 165 (100.0%) |
Physical Housing Characteristics in Coto Laurel
Housing Structures in Coto Laurel
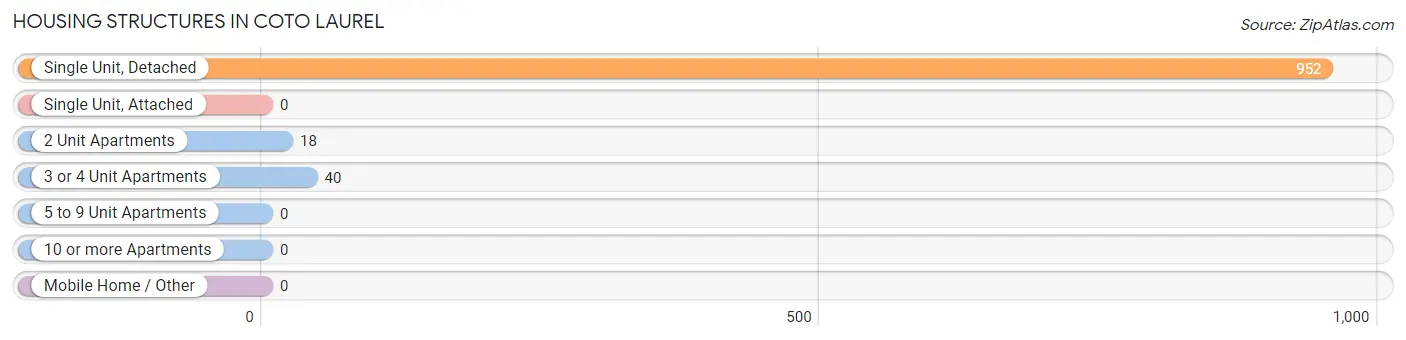
| Structure Type | # Housing Units | % Housing Units |
| Single Unit, Detached | 952 | 94.3% |
| Single Unit, Attached | 0 | 0.0% |
| 2 Unit Apartments | 18 | 1.8% |
| 3 or 4 Unit Apartments | 40 | 4.0% |
| 5 to 9 Unit Apartments | 0 | 0.0% |
| 10 or more Apartments | 0 | 0.0% |
| Mobile Home / Other | 0 | 0.0% |
| Total | 1,010 | 100.0% |
Housing Structures by Occupancy in Coto Laurel
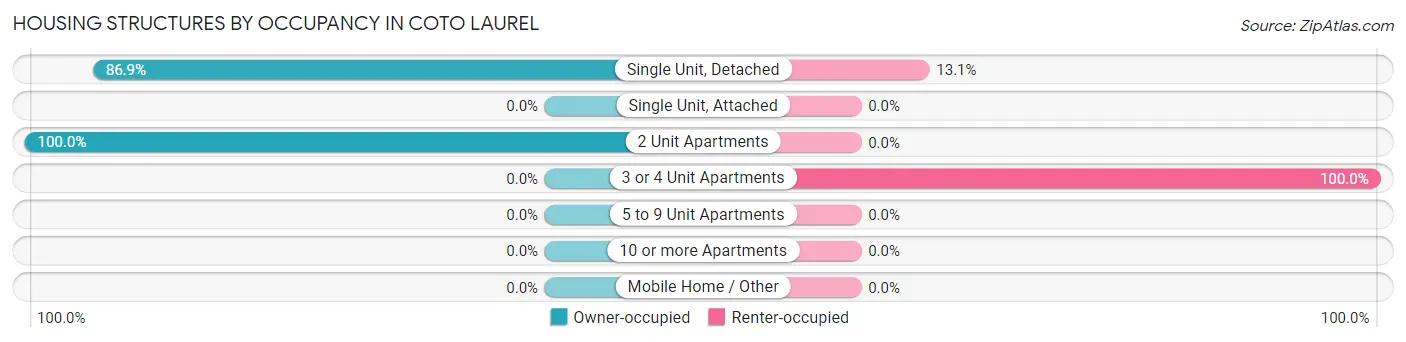
| Structure Type | Owner-occupied | Renter-occupied |
| Single Unit, Detached | 827 (86.9%) | 125 (13.1%) |
| Single Unit, Attached | 0 (0.0%) | 0 (0.0%) |
| 2 Unit Apartments | 18 (100.0%) | 0 (0.0%) |
| 3 or 4 Unit Apartments | 0 (0.0%) | 40 (100.0%) |
| 5 to 9 Unit Apartments | 0 (0.0%) | 0 (0.0%) |
| 10 or more Apartments | 0 (0.0%) | 0 (0.0%) |
| Mobile Home / Other | 0 (0.0%) | 0 (0.0%) |
| Total | 845 (83.7%) | 165 (16.3%) |
Housing Structures by Number of Rooms in Coto Laurel
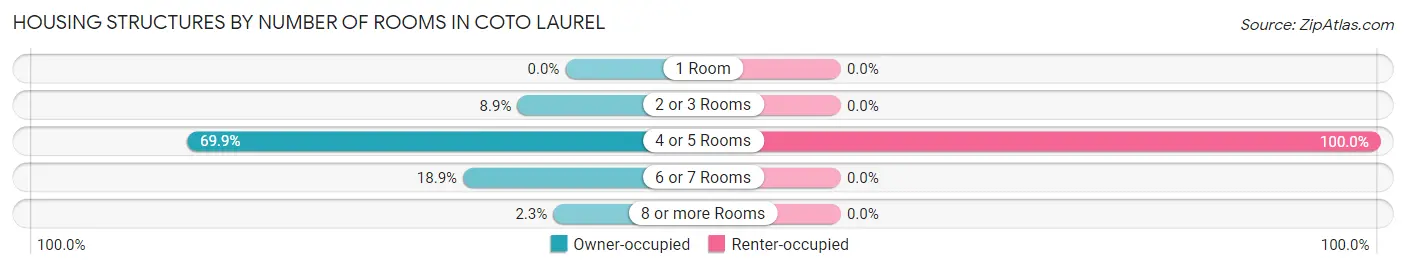
| Number of Rooms | Owner-occupied | Renter-occupied |
| 1 Room | 0 (0.0%) | 0 (0.0%) |
| 2 or 3 Rooms | 75 (8.9%) | 0 (0.0%) |
| 4 or 5 Rooms | 591 (69.9%) | 165 (100.0%) |
| 6 or 7 Rooms | 160 (18.9%) | 0 (0.0%) |
| 8 or more Rooms | 19 (2.2%) | 0 (0.0%) |
| Total | 845 (100.0%) | 165 (100.0%) |
Housing Structure by Heating Type in Coto Laurel
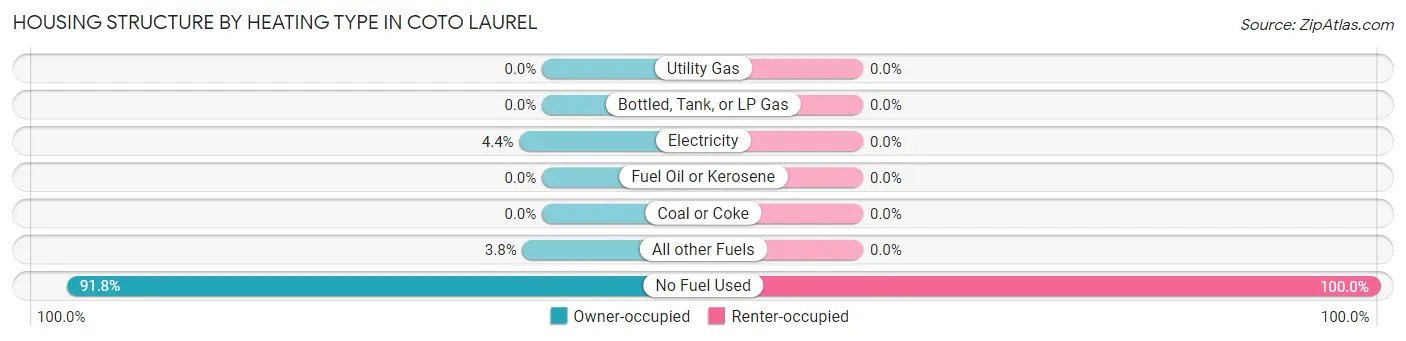
| Heating Type | Owner-occupied | Renter-occupied |
| Utility Gas | 0 (0.0%) | 0 (0.0%) |
| Bottled, Tank, or LP Gas | 0 (0.0%) | 0 (0.0%) |
| Electricity | 37 (4.4%) | 0 (0.0%) |
| Fuel Oil or Kerosene | 0 (0.0%) | 0 (0.0%) |
| Coal or Coke | 0 (0.0%) | 0 (0.0%) |
| All other Fuels | 32 (3.8%) | 0 (0.0%) |
| No Fuel Used | 776 (91.8%) | 165 (100.0%) |
| Total | 845 (100.0%) | 165 (100.0%) |
Household Vehicle Usage in Coto Laurel
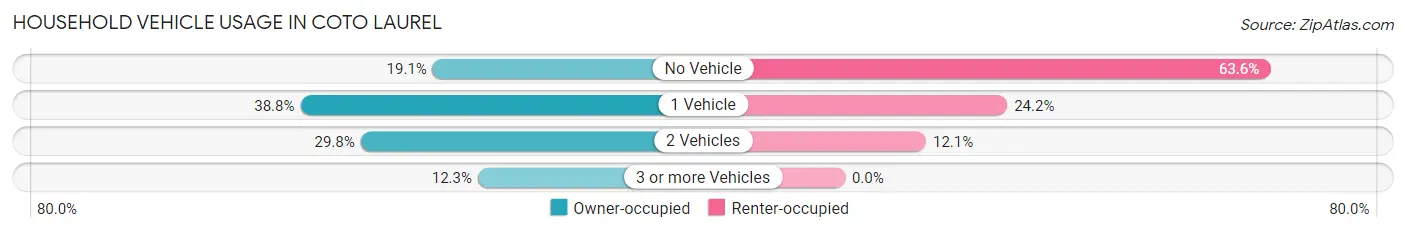
| Vehicles per Household | Owner-occupied | Renter-occupied |
| No Vehicle | 161 (19.1%) | 105 (63.6%) |
| 1 Vehicle | 328 (38.8%) | 40 (24.2%) |
| 2 Vehicles | 252 (29.8%) | 20 (12.1%) |
| 3 or more Vehicles | 104 (12.3%) | 0 (0.0%) |
| Total | 845 (100.0%) | 165 (100.0%) |
Real Estate & Mortgages in Coto Laurel
Real Estate and Mortgage Overview in Coto Laurel
| Characteristic | Without Mortgage | With Mortgage |
| Housing Units | 594 | 251 |
| Median Property Value | $74,100 | $115,400 |
| Median Household Income | $15,338 | $0 |
| Monthly Housing Costs | $164 | $0 |
| Real Estate Taxes | - | - |
Property Value by Mortgage Status in Coto Laurel
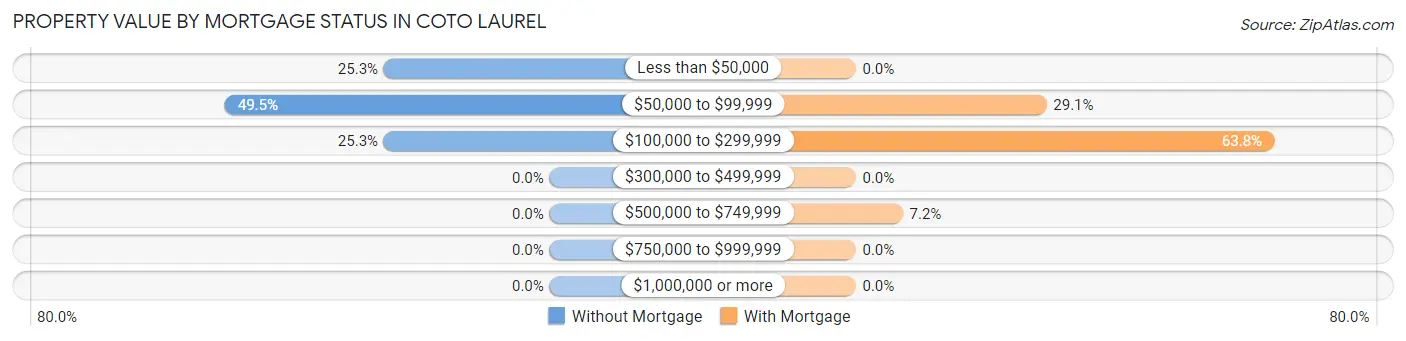
| Property Value | Without Mortgage | With Mortgage |
| Less than $50,000 | 150 (25.3%) | 0 (0.0%) |
| $50,000 to $99,999 | 294 (49.5%) | 73 (29.1%) |
| $100,000 to $299,999 | 150 (25.3%) | 160 (63.7%) |
| $300,000 to $499,999 | 0 (0.0%) | 0 (0.0%) |
| $500,000 to $749,999 | 0 (0.0%) | 18 (7.2%) |
| $750,000 to $999,999 | 0 (0.0%) | 0 (0.0%) |
| $1,000,000 or more | 0 (0.0%) | 0 (0.0%) |
| Total | 594 (100.0%) | 251 (100.0%) |
Household Income by Mortgage Status in Coto Laurel
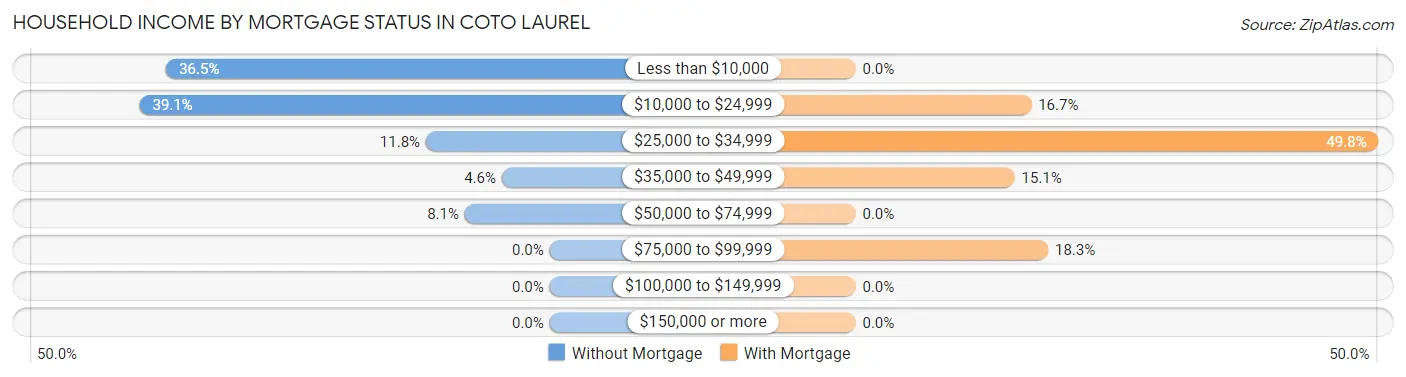
| Household Income | Without Mortgage | With Mortgage |
| Less than $10,000 | 217 (36.5%) | 0 (0.0%) |
| $10,000 to $24,999 | 232 (39.1%) | 42 (16.7%) |
| $25,000 to $34,999 | 70 (11.8%) | 125 (49.8%) |
| $35,000 to $49,999 | 27 (4.5%) | 38 (15.1%) |
| $50,000 to $74,999 | 48 (8.1%) | 0 (0.0%) |
| $75,000 to $99,999 | 0 (0.0%) | 46 (18.3%) |
| $100,000 to $149,999 | 0 (0.0%) | 0 (0.0%) |
| $150,000 or more | 0 (0.0%) | 0 (0.0%) |
| Total | 594 (100.0%) | 251 (100.0%) |
Property Value to Household Income Ratio in Coto Laurel
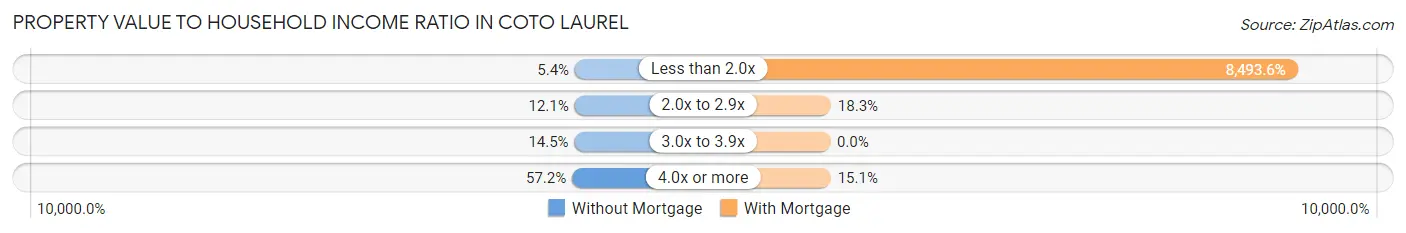
| Value-to-Income Ratio | Without Mortgage | With Mortgage |
| Less than 2.0x | 32 (5.4%) | 21,319 (8,493.6%) |
| 2.0x to 2.9x | 72 (12.1%) | 46 (18.3%) |
| 3.0x to 3.9x | 86 (14.5%) | 0 (0.0%) |
| 4.0x or more | 340 (57.2%) | 38 (15.1%) |
| Total | 594 (100.0%) | 251 (100.0%) |
Real Estate Taxes by Mortgage Status in Coto Laurel
| Property Taxes | Without Mortgage | With Mortgage |
| Less than $800 | 0 (0.0%) | 0 (0.0%) |
| $800 to $1,499 | 0 (0.0%) | 0 (0.0%) |
| $800 to $1,499 | 0 (0.0%) | 0 (0.0%) |
| Total | 594 (100.0%) | 251 (100.0%) |
Health & Disability in Coto Laurel
Health Insurance Coverage by Age in Coto Laurel
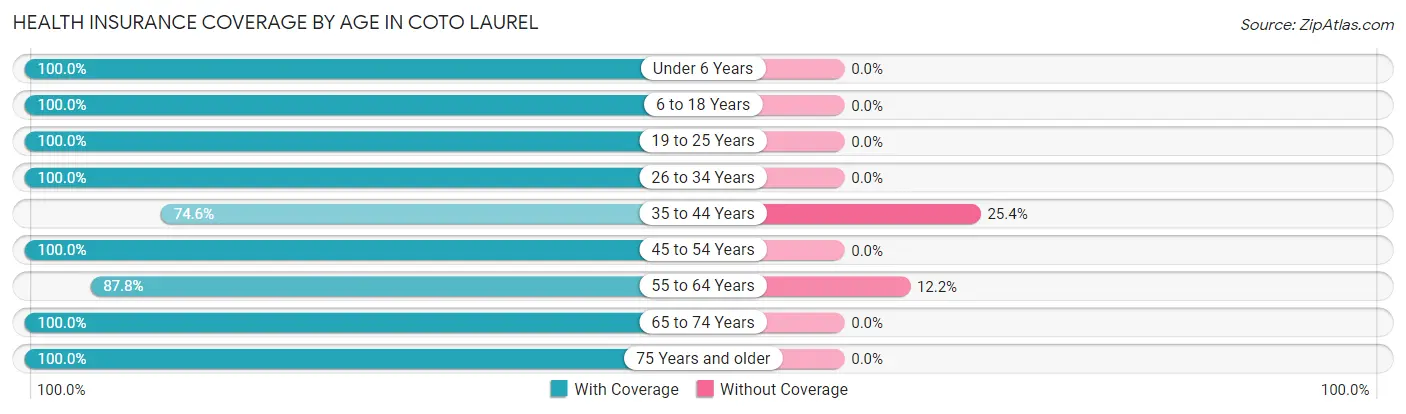
| Age Bracket | With Coverage | Without Coverage |
| Under 6 Years | 104 (100.0%) | 0 (0.0%) |
| 6 to 18 Years | 200 (100.0%) | 0 (0.0%) |
| 19 to 25 Years | 284 (100.0%) | 0 (0.0%) |
| 26 to 34 Years | 103 (100.0%) | 0 (0.0%) |
| 35 to 44 Years | 94 (74.6%) | 32 (25.4%) |
| 45 to 54 Years | 191 (100.0%) | 0 (0.0%) |
| 55 to 64 Years | 373 (87.8%) | 52 (12.2%) |
| 65 to 74 Years | 542 (100.0%) | 0 (0.0%) |
| 75 Years and older | 372 (100.0%) | 0 (0.0%) |
| Total | 2,263 (96.4%) | 84 (3.6%) |
Health Insurance Coverage by Citizenship Status in Coto Laurel
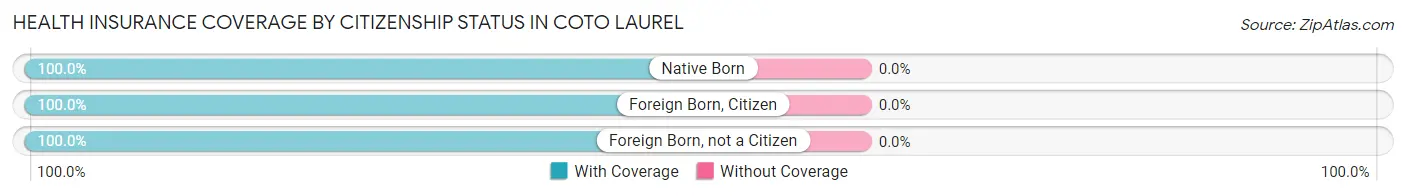
| Citizenship Status | With Coverage | Without Coverage |
| Native Born | 104 (100.0%) | 0 (0.0%) |
| Foreign Born, Citizen | 200 (100.0%) | 0 (0.0%) |
| Foreign Born, not a Citizen | 284 (100.0%) | 0 (0.0%) |
Health Insurance Coverage by Household Income in Coto Laurel
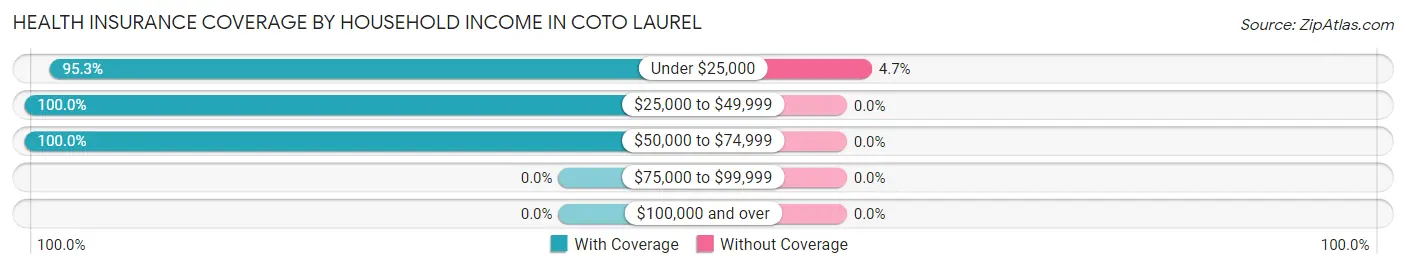
| Household Income | With Coverage | Without Coverage |
| Under $25,000 | 1,707 (95.3%) | 84 (4.7%) |
| $25,000 to $49,999 | 312 (100.0%) | 0 (0.0%) |
| $50,000 to $74,999 | 244 (100.0%) | 0 (0.0%) |
| $75,000 to $99,999 | 0 (0.0%) | 0 (0.0%) |
| $100,000 and over | 0 (0.0%) | 0 (0.0%) |
Public vs Private Health Insurance Coverage by Age in Coto Laurel
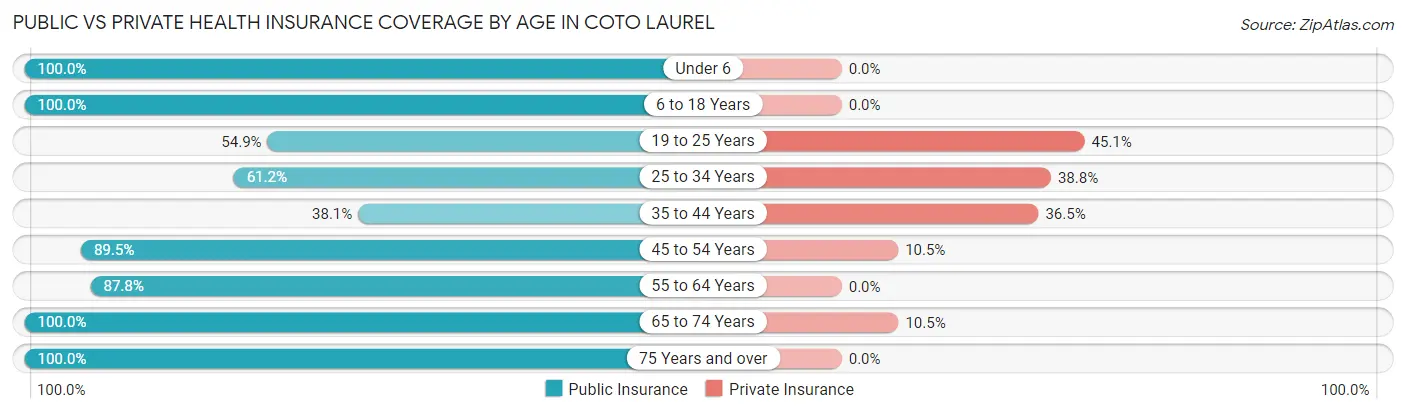
| Age Bracket | Public Insurance | Private Insurance |
| Under 6 | 104 (100.0%) | 0 (0.0%) |
| 6 to 18 Years | 200 (100.0%) | 0 (0.0%) |
| 19 to 25 Years | 156 (54.9%) | 128 (45.1%) |
| 25 to 34 Years | 63 (61.2%) | 40 (38.8%) |
| 35 to 44 Years | 48 (38.1%) | 46 (36.5%) |
| 45 to 54 Years | 171 (89.5%) | 20 (10.5%) |
| 55 to 64 Years | 373 (87.8%) | 0 (0.0%) |
| 65 to 74 Years | 542 (100.0%) | 57 (10.5%) |
| 75 Years and over | 372 (100.0%) | 0 (0.0%) |
| Total | 2,029 (86.5%) | 291 (12.4%) |
Disability Status by Sex by Age in Coto Laurel
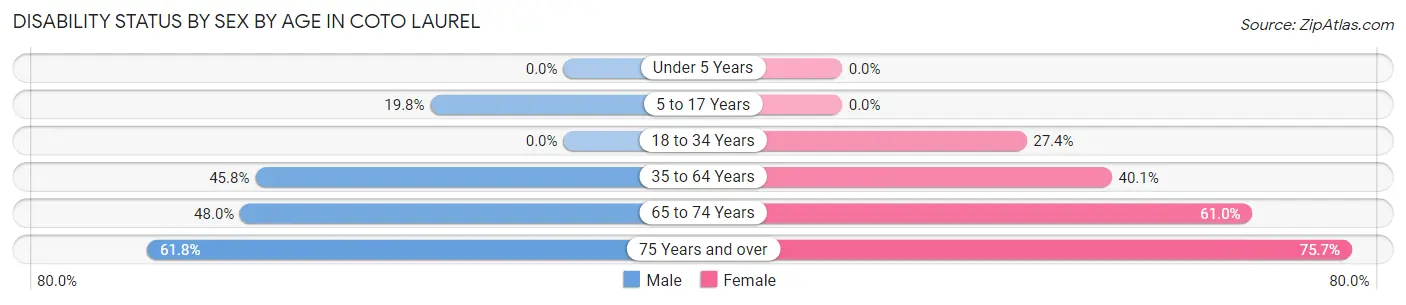
| Age Bracket | Male | Female |
| Under 5 Years | 0 (0.0%) | 0 (0.0%) |
| 5 to 17 Years | 31 (19.8%) | 0 (0.0%) |
| 18 to 34 Years | 0 (0.0%) | 40 (27.4%) |
| 35 to 64 Years | 183 (45.8%) | 137 (40.1%) |
| 65 to 74 Years | 131 (48.0%) | 164 (61.0%) |
| 75 Years and over | 123 (61.8%) | 131 (75.7%) |
Disability Class by Sex by Age in Coto Laurel
Disability Class: Hearing Difficulty
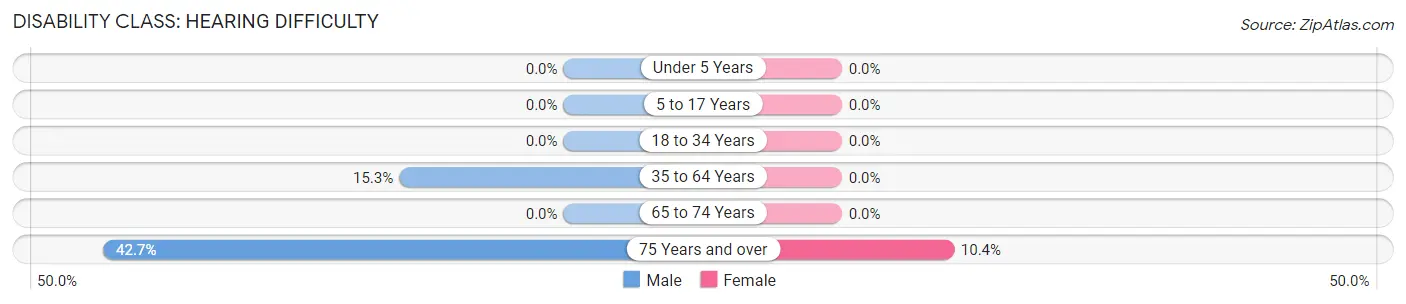
| Age Bracket | Male | Female |
| Under 5 Years | 0 (0.0%) | 0 (0.0%) |
| 5 to 17 Years | 0 (0.0%) | 0 (0.0%) |
| 18 to 34 Years | 0 (0.0%) | 0 (0.0%) |
| 35 to 64 Years | 61 (15.2%) | 0 (0.0%) |
| 65 to 74 Years | 0 (0.0%) | 0 (0.0%) |
| 75 Years and over | 85 (42.7%) | 18 (10.4%) |
Disability Class: Vision Difficulty
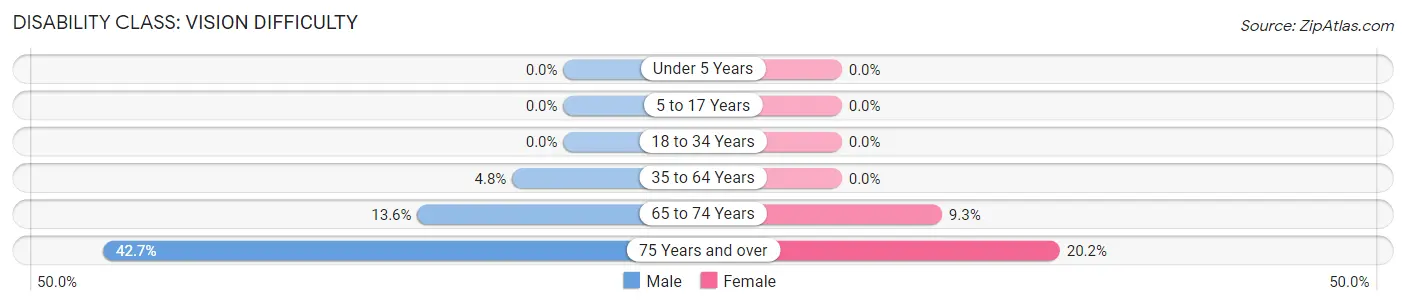
| Age Bracket | Male | Female |
| Under 5 Years | 0 (0.0%) | 0 (0.0%) |
| 5 to 17 Years | 0 (0.0%) | 0 (0.0%) |
| 18 to 34 Years | 0 (0.0%) | 0 (0.0%) |
| 35 to 64 Years | 19 (4.8%) | 0 (0.0%) |
| 65 to 74 Years | 37 (13.6%) | 25 (9.3%) |
| 75 Years and over | 85 (42.7%) | 35 (20.2%) |
Disability Class: Cognitive Difficulty
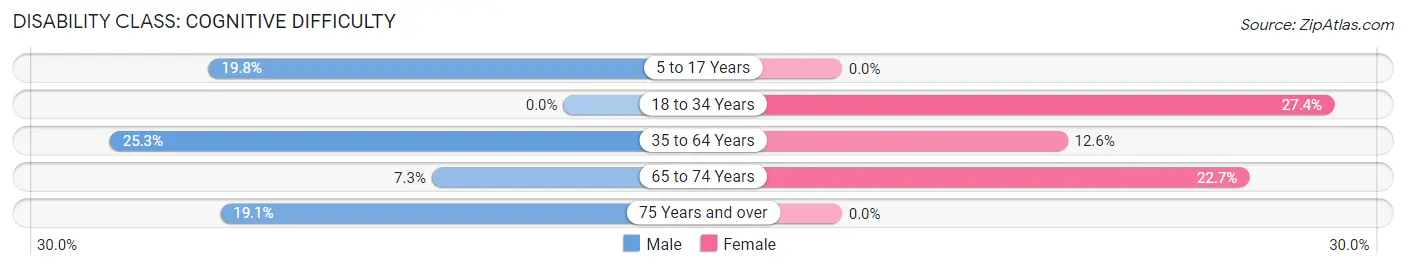
| Age Bracket | Male | Female |
| 5 to 17 Years | 31 (19.8%) | 0 (0.0%) |
| 18 to 34 Years | 0 (0.0%) | 40 (27.4%) |
| 35 to 64 Years | 101 (25.3%) | 43 (12.6%) |
| 65 to 74 Years | 20 (7.3%) | 61 (22.7%) |
| 75 Years and over | 38 (19.1%) | 0 (0.0%) |
Disability Class: Ambulatory Difficulty
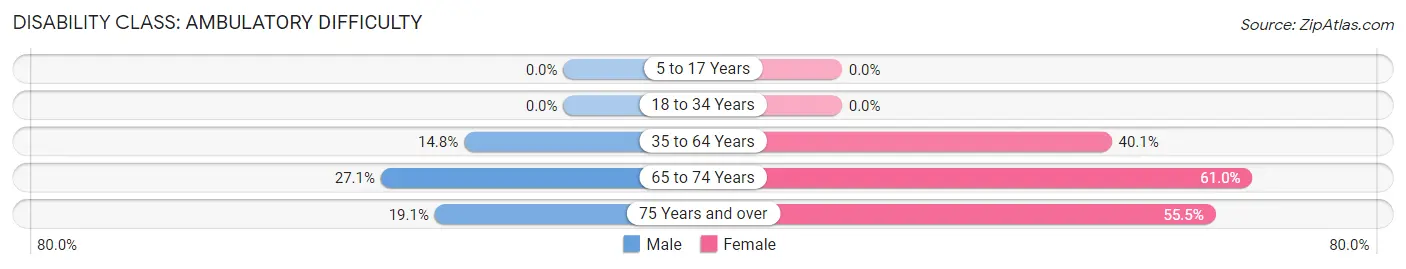
| Age Bracket | Male | Female |
| 5 to 17 Years | 0 (0.0%) | 0 (0.0%) |
| 18 to 34 Years | 0 (0.0%) | 0 (0.0%) |
| 35 to 64 Years | 59 (14.7%) | 137 (40.1%) |
| 65 to 74 Years | 74 (27.1%) | 164 (61.0%) |
| 75 Years and over | 38 (19.1%) | 96 (55.5%) |
Disability Class: Self-Care Difficulty
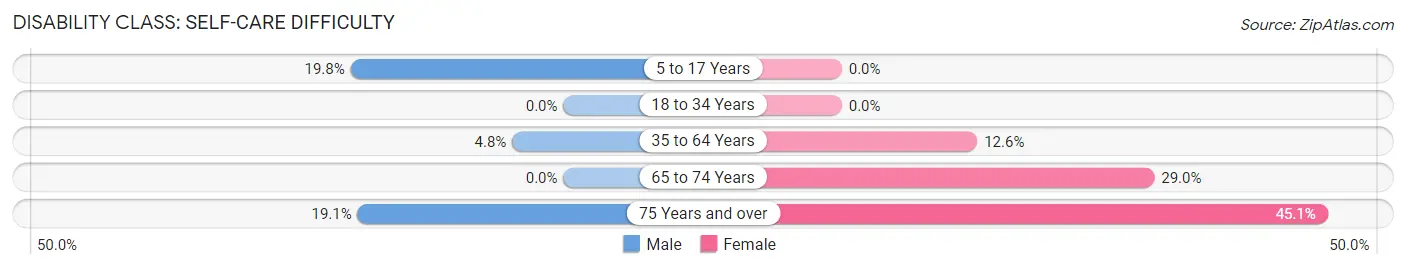
| Age Bracket | Male | Female |
| 5 to 17 Years | 31 (19.8%) | 0 (0.0%) |
| 18 to 34 Years | 0 (0.0%) | 0 (0.0%) |
| 35 to 64 Years | 19 (4.8%) | 43 (12.6%) |
| 65 to 74 Years | 0 (0.0%) | 78 (29.0%) |
| 75 Years and over | 38 (19.1%) | 78 (45.1%) |
Technology Access in Coto Laurel
Computing Device Access in Coto Laurel
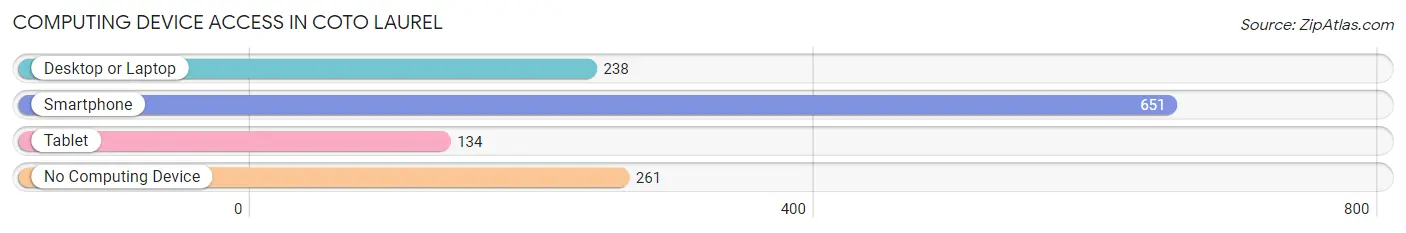
| Device Type | # Households | % Households |
| Desktop or Laptop | 238 | 23.6% |
| Smartphone | 651 | 64.5% |
| Tablet | 134 | 13.3% |
| No Computing Device | 261 | 25.8% |
| Total | 1,010 | 100.0% |
Internet Access in Coto Laurel
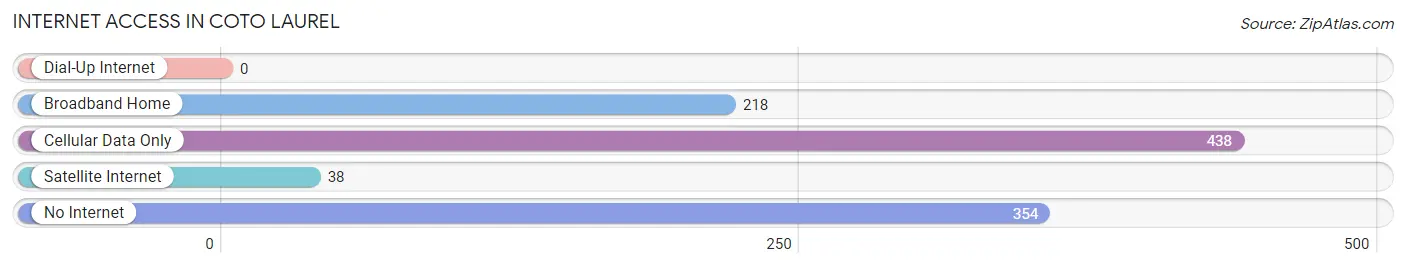
| Internet Type | # Households | % Households |
| Dial-Up Internet | 0 | 0.0% |
| Broadband Home | 218 | 21.6% |
| Cellular Data Only | 438 | 43.4% |
| Satellite Internet | 38 | 3.8% |
| No Internet | 354 | 35.0% |
| Total | 1,010 | 100.0% |
Coto Laurel Summary
Coto Laurel is a municipality located in the south-central region of Puerto Rico. It is part of the Ponce Metropolitan Statistical Area. As of the 2010 census, the population of Coto Laurel was 8,845.
Geography
Coto Laurel is located in the south-central region of Puerto Rico, in the Cordillera Central mountain range. It is bordered by the municipalities of Jayuya, Villalba, Coamo, and Juana Díaz. The municipality covers an area of approximately 24 square miles.
The terrain of Coto Laurel is mostly mountainous, with some flat areas in the lower elevations. The highest point in the municipality is Cerro de Punta, which has an elevation of 3,087 feet. The climate of Coto Laurel is tropical, with temperatures ranging from the mid-70s to the mid-80s Fahrenheit.
Economy
The economy of Coto Laurel is largely based on agriculture. The main crops grown in the municipality are coffee, plantains, and bananas. Other agricultural products include sugarcane, tobacco, and vegetables.
In addition to agriculture, Coto Laurel has a small manufacturing sector. The municipality is home to several small factories that produce clothing, furniture, and other goods.
Demographics
As of the 2010 census, the population of Coto Laurel was 8,845. The population is predominantly of Puerto Rican descent, with a small minority of African and European descent. The median age of the population is 38.
The majority of the population is Roman Catholic, with a small minority of other religious affiliations. The primary language spoken in Coto Laurel is Spanish, with a small minority of English speakers.
Education
Coto Laurel is served by the Puerto Rico Department of Education. The municipality has several public schools, including elementary, middle, and high schools. There are also several private schools in the area.
Conclusion
Coto Laurel is a municipality located in the south-central region of Puerto Rico. It is part of the Ponce Metropolitan Statistical Area. The economy of Coto Laurel is largely based on agriculture, with some manufacturing. The population of Coto Laurel is predominantly of Puerto Rican descent, with a small minority of African and European descent. The primary language spoken in Coto Laurel is Spanish, with a small minority of English speakers. The municipality is served by the Puerto Rico Department of Education, with several public and private schools in the area.
Common Questions
What is Per Capita Income in Coto Laurel?
Per Capita income in Coto Laurel is $8,446.
What is the Median Family Income in Coto Laurel?
Median Family Income in Coto Laurel is $16,771.
What is the Median Household income in Coto Laurel?
Median Household Income in Coto Laurel is $15,669.
What is Inequality or Gini Index in Coto Laurel?
Inequality or Gini Index in Coto Laurel is 0.46.
What is the Total Population of Coto Laurel?
Total Population of Coto Laurel is 2,347.
What is the Total Male Population of Coto Laurel?
Total Male Population of Coto Laurel is 1,374.
What is the Total Female Population of Coto Laurel?
Total Female Population of Coto Laurel is 973.
What is the Ratio of Males per 100 Females in Coto Laurel?
There are 141.21 Males per 100 Females in Coto Laurel.
What is the Ratio of Females per 100 Males in Coto Laurel?
There are 70.82 Females per 100 Males in Coto Laurel.
What is the Median Population Age in Coto Laurel?
Median Population Age in Coto Laurel is 58.2 Years.
What is the Average Family Size in Coto Laurel
Average Family Size in Coto Laurel is 2.8 People.
What is the Average Household Size in Coto Laurel
Average Household Size in Coto Laurel is 2.3 People.
How Large is the Labor Force in Coto Laurel?
There are 597 People in the Labor Forcein in Coto Laurel.
What is the Percentage of People in the Labor Force in Coto Laurel?
29.2% of People are in the Labor Force in Coto Laurel.
What is the Unemployment Rate in Coto Laurel?
Unemployment Rate in Coto Laurel is 22.3%.