Comerio, PR Map & Demographics
Comerio Overview
$10,046
PER CAPITA INCOME
$18,479
AVG FAMILY INCOME
$15,938
AVG HOUSEHOLD INCOME
16.3%
WAGE / INCOME GAP [ % ]
83.7¢/ $1
WAGE / INCOME GAP [ $ ]
$12,782
FAMILY INCOME DEFICIT
0.53
INEQUALITY / GINI INDEX
3,656
TOTAL POPULATION
1,603
MALE POPULATION
2,053
FEMALE POPULATION
78.08
MALES / 100 FEMALES
128.07
FEMALES / 100 MALES
40.3
MEDIAN AGE
4.7
AVG FAMILY SIZE
3.7
AVG HOUSEHOLD SIZE
1,283
LABOR FORCE [ PEOPLE ]
44.1%
PERCENT IN LABOR FORCE
19.6%
UNEMPLOYMENT RATE
Comerio Zip Codes
Comerio Area Codes
Income in Comerio
Income Overview in Comerio
Per Capita Income in Comerio is $10,046, while median incomes of families and households are $18,479 and $15,938 respectively.
| Characteristic | Number | Measure |
| Per Capita Income | 3,656 | $10,046 |
| Median Family Income | 691 | $18,479 |
| Mean Family Income | 691 | $26,303 |
| Median Household Income | 983 | $15,938 |
| Mean Household Income | 983 | $23,525 |
| Income Deficit | 691 | $12,782 |
| Wage / Income Gap (%) | 3,656 | 16.35% |
| Wage / Income Gap ($) | 3,656 | 83.65¢ per $1 |
| Gini / Inequality Index | 3,656 | 0.53 |
Earnings by Sex in Comerio
Average Earnings in Comerio are $19,200, $20,208 for men and $16,904 for women, a difference of 16.4%.
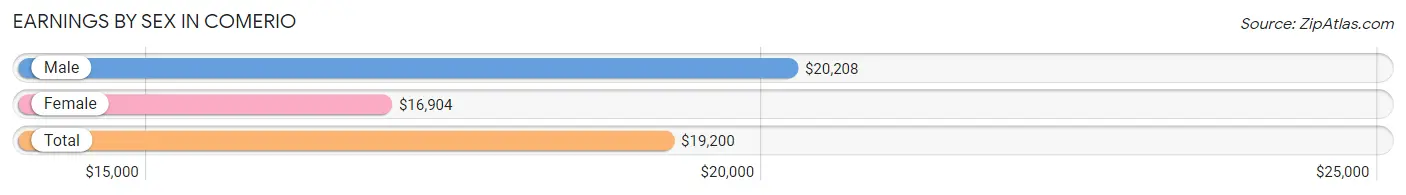
| Sex | Number | Average Earnings |
| Male | 551 (48.3%) | $20,208 |
| Female | 589 (51.7%) | $16,904 |
| Total | 1,140 (100.0%) | $19,200 |
Earnings by Sex by Income Bracket in Comerio
The most common earnings brackets in Comerio are $20,000 to $22,499 for men (114 | 20.7%) and $25,000 to $29,999 for women (137 | 23.3%).
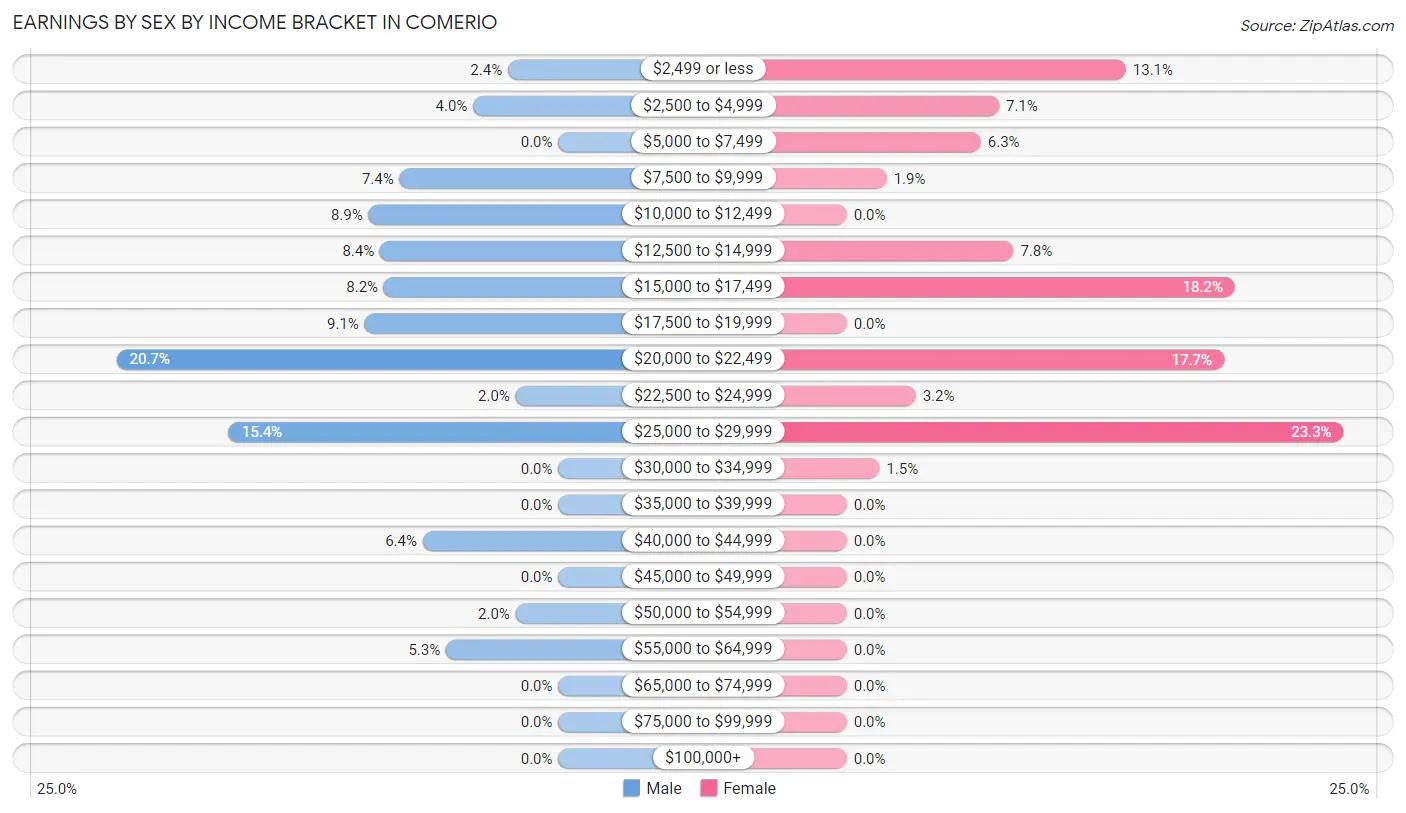
| Income | Male | Female |
| $2,499 or less | 13 (2.4%) | 77 (13.1%) |
| $2,500 to $4,999 | 22 (4.0%) | 42 (7.1%) |
| $5,000 to $7,499 | 0 (0.0%) | 37 (6.3%) |
| $7,500 to $9,999 | 41 (7.4%) | 11 (1.9%) |
| $10,000 to $12,499 | 49 (8.9%) | 0 (0.0%) |
| $12,500 to $14,999 | 46 (8.4%) | 46 (7.8%) |
| $15,000 to $17,499 | 45 (8.2%) | 107 (18.2%) |
| $17,500 to $19,999 | 50 (9.1%) | 0 (0.0%) |
| $20,000 to $22,499 | 114 (20.7%) | 104 (17.7%) |
| $22,500 to $24,999 | 11 (2.0%) | 19 (3.2%) |
| $25,000 to $29,999 | 85 (15.4%) | 137 (23.3%) |
| $30,000 to $34,999 | 0 (0.0%) | 9 (1.5%) |
| $35,000 to $39,999 | 0 (0.0%) | 0 (0.0%) |
| $40,000 to $44,999 | 35 (6.4%) | 0 (0.0%) |
| $45,000 to $49,999 | 0 (0.0%) | 0 (0.0%) |
| $50,000 to $54,999 | 11 (2.0%) | 0 (0.0%) |
| $55,000 to $64,999 | 29 (5.3%) | 0 (0.0%) |
| $65,000 to $74,999 | 0 (0.0%) | 0 (0.0%) |
| $75,000 to $99,999 | 0 (0.0%) | 0 (0.0%) |
| $100,000+ | 0 (0.0%) | 0 (0.0%) |
| Total | 551 (100.0%) | 589 (100.0%) |
Earnings by Sex by Educational Attainment in Comerio
Average earnings in Comerio are $20,526 for men and $17,196 for women, a difference of 16.2%. Men with an educational attainment of bachelor's degree enjoy the highest average annual earnings of $29,427, while those with less than high school education earn the least with $12,194. Women with an educational attainment of bachelor's degree earn the most with the average annual earnings of $28,769, while those with high school diploma education have the smallest earnings of $15,140.
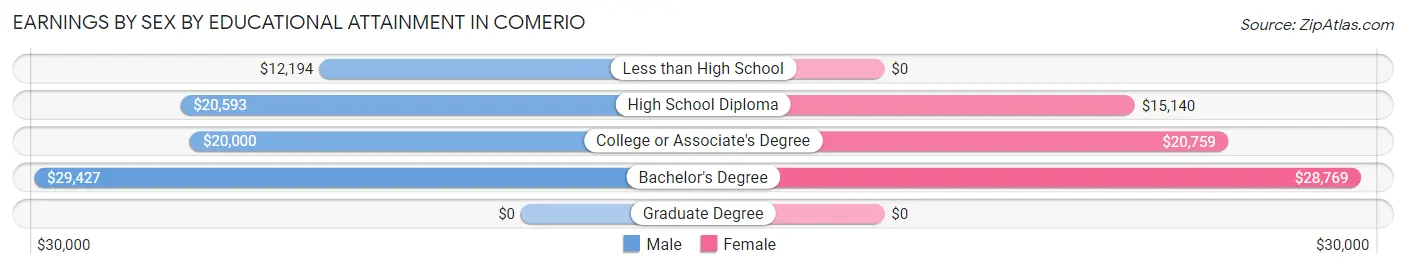
| Educational Attainment | Male Income | Female Income |
| Less than High School | $12,194 | $0 |
| High School Diploma | $20,593 | $15,140 |
| College or Associate's Degree | $20,000 | $20,759 |
| Bachelor's Degree | $29,427 | $28,769 |
| Graduate Degree | - | - |
| Total | $20,526 | $17,196 |
Family Income in Comerio
Family Income Brackets in Comerio
According to the Comerio family income data, there are 215 families falling into the less than $10,000 income range, which is the most common income bracket and makes up 31.1% of all families.
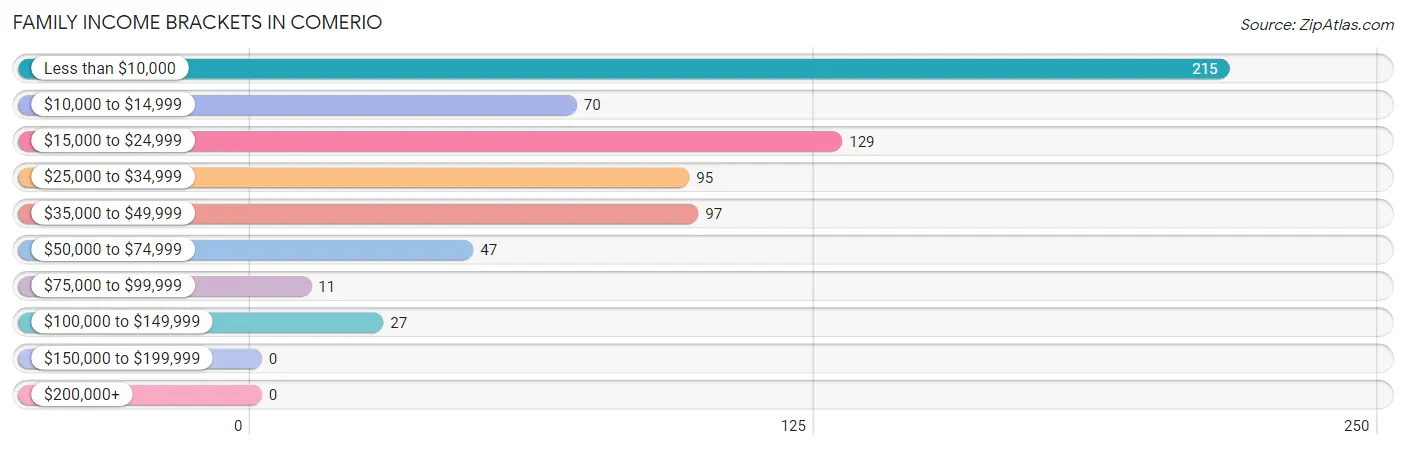
| Income Bracket | # Families | % Families |
| Less than $10,000 | 215 | 31.1% |
| $10,000 to $14,999 | 70 | 10.1% |
| $15,000 to $24,999 | 129 | 18.7% |
| $25,000 to $34,999 | 95 | 13.7% |
| $35,000 to $49,999 | 97 | 14.0% |
| $50,000 to $74,999 | 47 | 6.8% |
| $75,000 to $99,999 | 11 | 1.6% |
| $100,000 to $149,999 | 27 | 3.9% |
| $150,000 to $199,999 | 0 | 0.0% |
| $200,000+ | 0 | 0.0% |
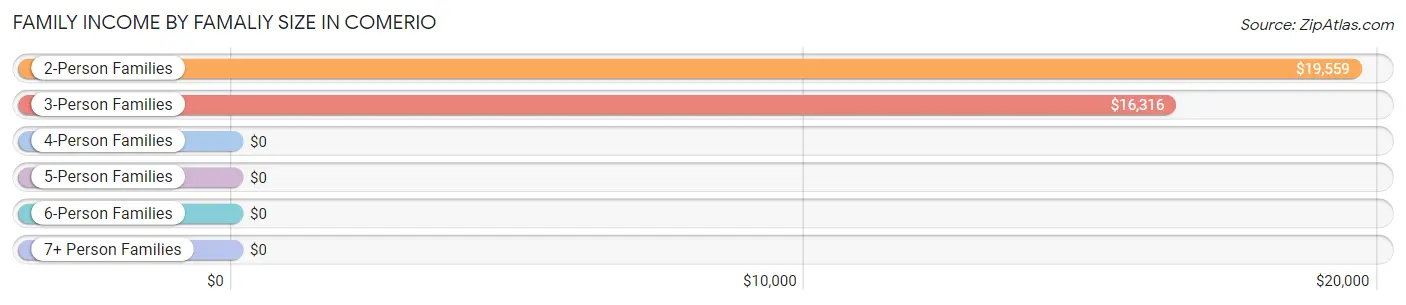
Family Income by Famaliy Size in Comerio
2-person families (384 | 55.6%) account for the highest median family income in Comerio with $19,559 per family, while 2-person families (384 | 55.6%) have the highest median income of $9,780 per family member.
| Income Bracket | # Families | Median Income |
| 2-Person Families | 384 (55.6%) | $19,559 |
| 3-Person Families | 230 (33.3%) | $16,316 |
| 4-Person Families | 39 (5.6%) | $0 |
| 5-Person Families | 38 (5.5%) | $0 |
| 6-Person Families | 0 (0.0%) | $0 |
| 7+ Person Families | 0 (0.0%) | $0 |
| Total | 691 (100.0%) | $18,479 |
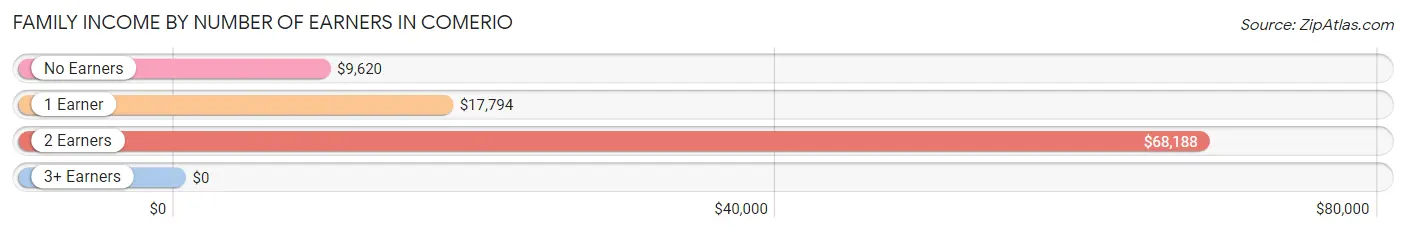
Family Income by Number of Earners in Comerio
| Number of Earners | # Families | Median Income |
| No Earners | 395 (57.2%) | $9,620 |
| 1 Earner | 166 (24.0%) | $17,794 |
| 2 Earners | 119 (17.2%) | $68,188 |
| 3+ Earners | 11 (1.6%) | $0 |
| Total | 691 (100.0%) | $18,479 |
Household Income in Comerio
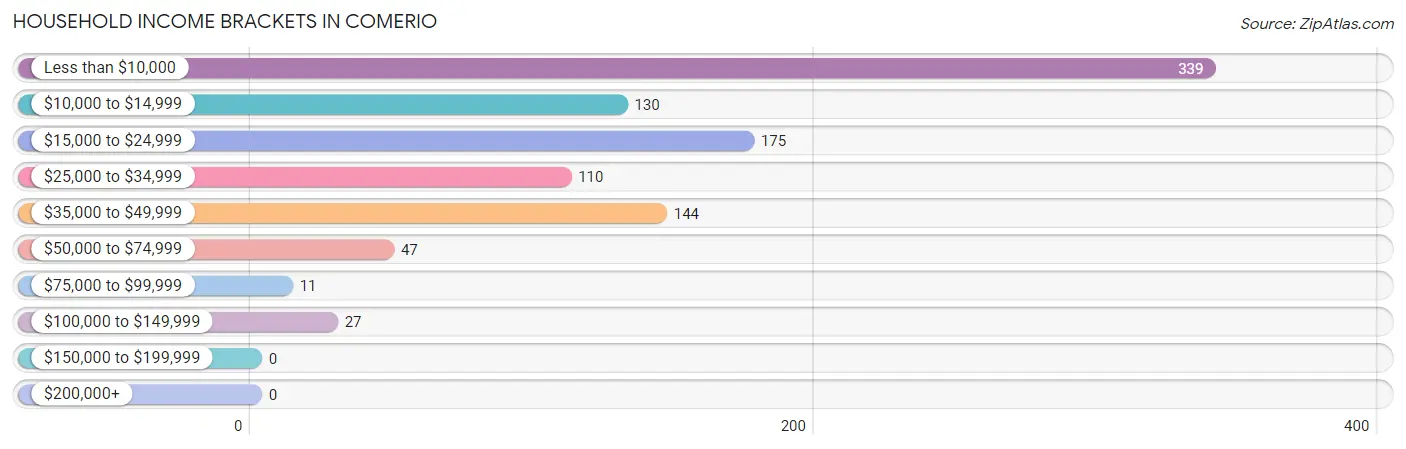
Household Income Brackets in Comerio
With 339 households falling in the category, the less than $10,000 income range is the most frequent in Comerio, accounting for 34.5% of all households.
| Income Bracket | # Households | % Households |
| Less than $10,000 | 339 | 34.5% |
| $10,000 to $14,999 | 130 | 13.2% |
| $15,000 to $24,999 | 175 | 17.8% |
| $25,000 to $34,999 | 110 | 11.2% |
| $35,000 to $49,999 | 144 | 14.6% |
| $50,000 to $74,999 | 47 | 4.8% |
| $75,000 to $99,999 | 11 | 1.1% |
| $100,000 to $149,999 | 27 | 2.7% |
| $150,000 to $199,999 | 0 | 0.0% |
| $200,000+ | 0 | 0.0% |
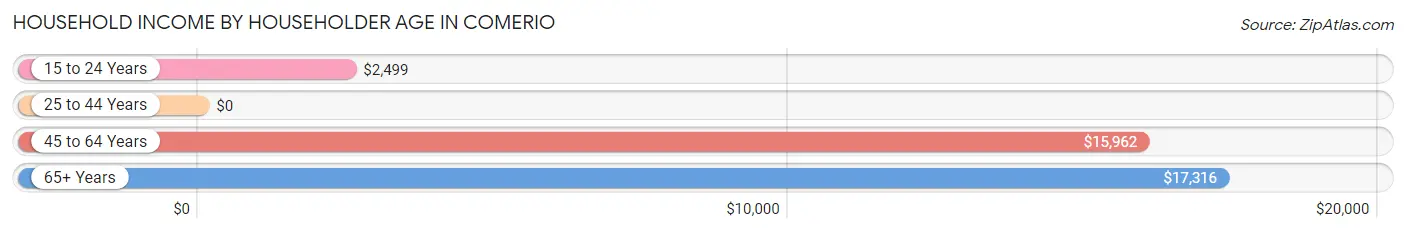
Household Income by Householder Age in Comerio
The median household income in Comerio is $15,938, with the highest median household income of $17,316 found in the 65+ years age bracket for the primary householder. A total of 439 households (44.7%) fall into this category. Meanwhile, the 25 to 44 years age bracket for the primary householder has the lowest median household income of $0, with 228 households (23.2%) in this group.
| Income Bracket | # Households | Median Income |
| 15 to 24 Years | 36 (3.7%) | $2,499 |
| 25 to 44 Years | 228 (23.2%) | $0 |
| 45 to 64 Years | 280 (28.5%) | $15,962 |
| 65+ Years | 439 (44.7%) | $17,316 |
| Total | 983 (100.0%) | $15,938 |
Poverty in Comerio
Income Below Poverty by Sex and Age in Comerio
With 56.0% poverty level for males and 64.9% for females among the residents of Comerio, 6 to 11 year old males and under 5 year old females are the most vulnerable to poverty, with 203 males (100.0%) and 55 females (100.0%) in their respective age groups living below the poverty level.
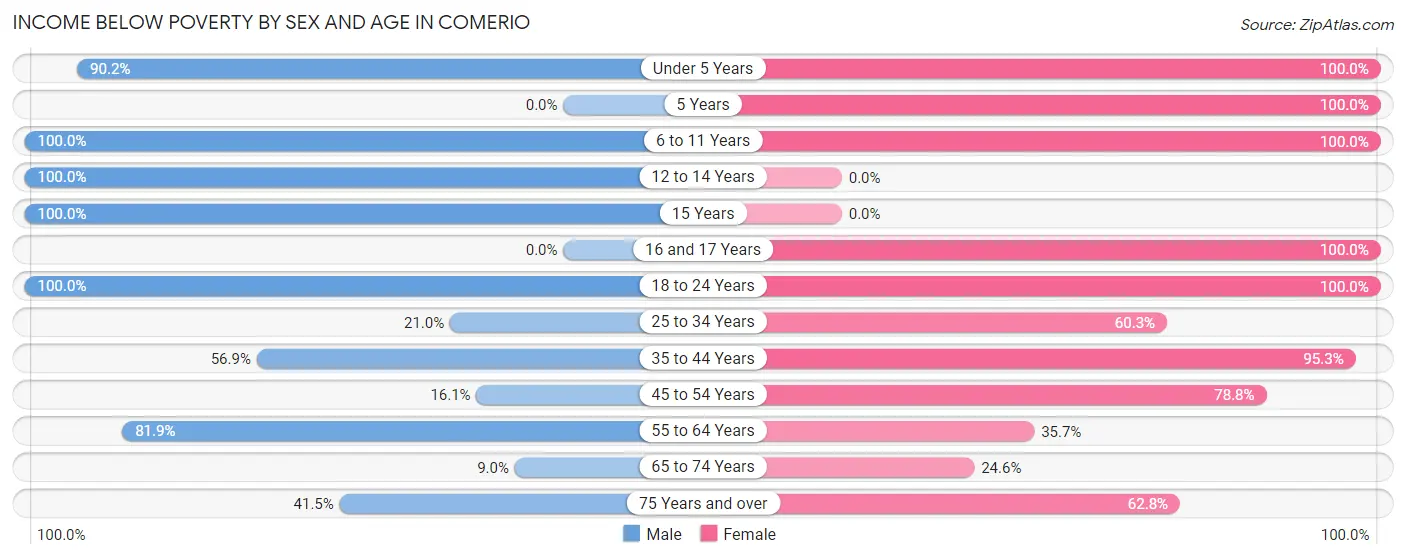
| Age Bracket | Male | Female |
| Under 5 Years | 148 (90.2%) | 55 (100.0%) |
| 5 Years | 0 (0.0%) | 64 (100.0%) |
| 6 to 11 Years | 203 (100.0%) | 168 (100.0%) |
| 12 to 14 Years | 62 (100.0%) | 0 (0.0%) |
| 15 Years | 30 (100.0%) | 0 (0.0%) |
| 16 and 17 Years | 0 (0.0%) | 40 (100.0%) |
| 18 to 24 Years | 92 (100.0%) | 61 (100.0%) |
| 25 to 34 Years | 41 (21.0%) | 283 (60.3%) |
| 35 to 44 Years | 70 (56.9%) | 184 (95.3%) |
| 45 to 54 Years | 25 (16.1%) | 145 (78.8%) |
| 55 to 64 Years | 131 (81.9%) | 120 (35.7%) |
| 65 to 74 Years | 20 (9.0%) | 58 (24.6%) |
| 75 Years and over | 76 (41.5%) | 155 (62.7%) |
| Total | 898 (56.0%) | 1,333 (64.9%) |
Income Above Poverty by Sex and Age in Comerio
According to the poverty statistics in Comerio, males aged 16 and 17 years and females aged 65 to 74 years are the age groups that are most secure financially, with 100.0% of males and 75.4% of females in these age groups living above the poverty line.
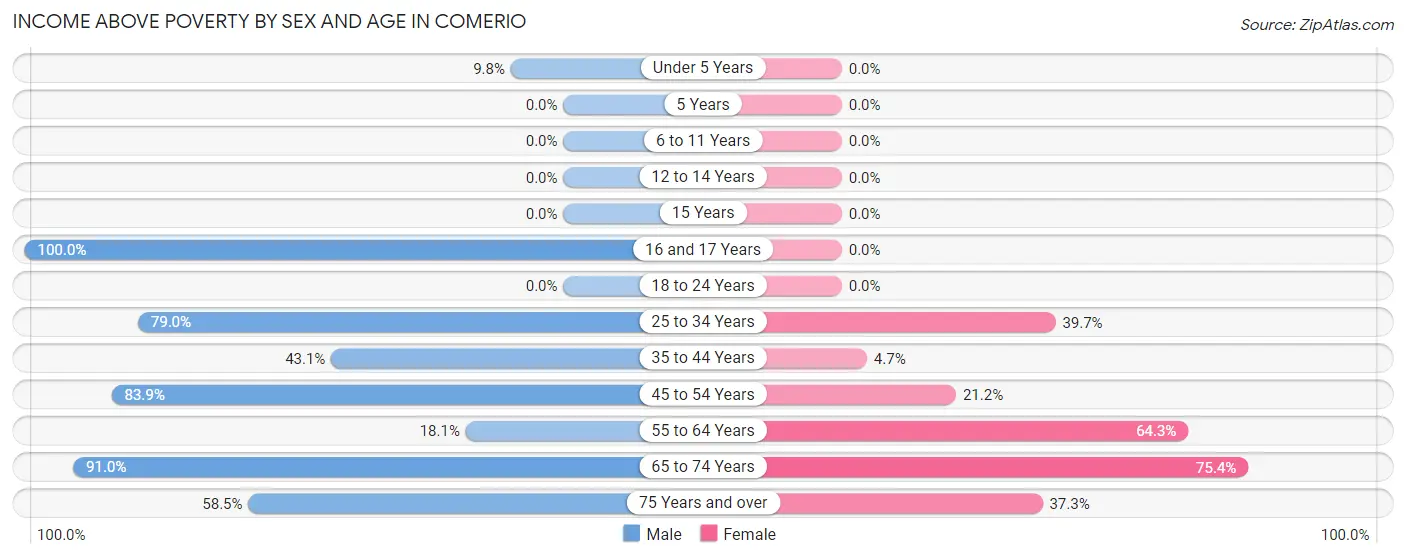
| Age Bracket | Male | Female |
| Under 5 Years | 16 (9.8%) | 0 (0.0%) |
| 5 Years | 0 (0.0%) | 0 (0.0%) |
| 6 to 11 Years | 0 (0.0%) | 0 (0.0%) |
| 12 to 14 Years | 0 (0.0%) | 0 (0.0%) |
| 15 Years | 0 (0.0%) | 0 (0.0%) |
| 16 and 17 Years | 14 (100.0%) | 0 (0.0%) |
| 18 to 24 Years | 0 (0.0%) | 0 (0.0%) |
| 25 to 34 Years | 154 (79.0%) | 186 (39.7%) |
| 35 to 44 Years | 53 (43.1%) | 9 (4.7%) |
| 45 to 54 Years | 130 (83.9%) | 39 (21.2%) |
| 55 to 64 Years | 29 (18.1%) | 216 (64.3%) |
| 65 to 74 Years | 202 (91.0%) | 178 (75.4%) |
| 75 Years and over | 107 (58.5%) | 92 (37.2%) |
| Total | 705 (44.0%) | 720 (35.1%) |
Income Below Poverty Among Married-Couple Families in Comerio
The poverty statistics for married-couple families in Comerio show that 29.0% or 80 of the total 276 families live below the poverty line. Families with 1 or 2 children have the highest poverty rate of 55.3%, comprising of 26 families. On the other hand, families with no children have the lowest poverty rate of 23.6%, which includes 54 families.
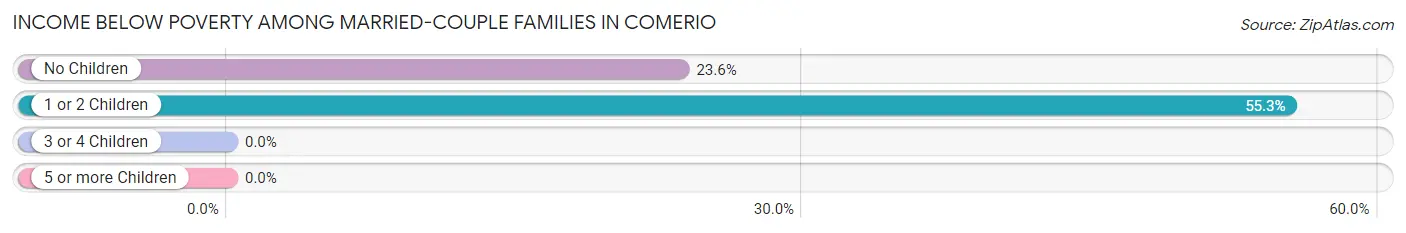
| Children | Above Poverty | Below Poverty |
| No Children | 175 (76.4%) | 54 (23.6%) |
| 1 or 2 Children | 21 (44.7%) | 26 (55.3%) |
| 3 or 4 Children | 0 (0.0%) | 0 (0.0%) |
| 5 or more Children | 0 (0.0%) | 0 (0.0%) |
| Total | 196 (71.0%) | 80 (29.0%) |
Income Below Poverty Among Single-Parent Households in Comerio
According to the poverty data in Comerio, 64.1% or 75 single-father households and 77.8% or 232 single-mother households are living below the poverty line. Among single-father households, those with 1 or 2 children have the highest poverty rate, with 38 households (100.0%) experiencing poverty. Likewise, among single-mother households, those with 1 or 2 children have the highest poverty rate, with 179 households (100.0%) falling below the poverty line.
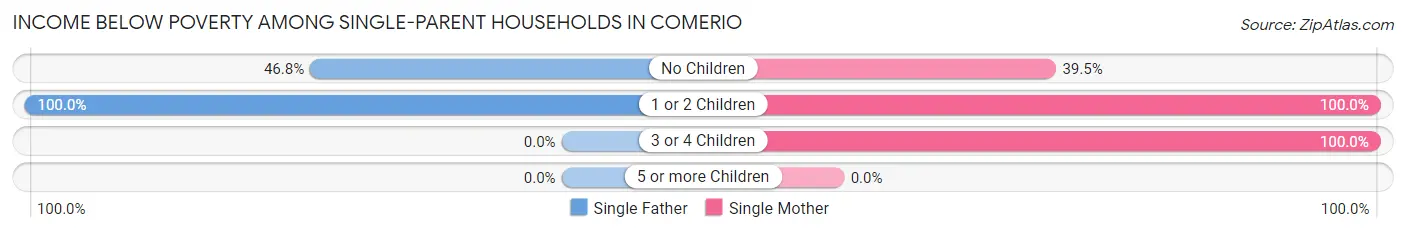
| Children | Single Father | Single Mother |
| No Children | 37 (46.8%) | 43 (39.5%) |
| 1 or 2 Children | 38 (100.0%) | 179 (100.0%) |
| 3 or 4 Children | 0 (0.0%) | 10 (100.0%) |
| 5 or more Children | 0 (0.0%) | 0 (0.0%) |
| Total | 75 (64.1%) | 232 (77.8%) |
Income Below Poverty Among Married-Couple vs Single-Parent Households in Comerio
The poverty data for Comerio shows that 80 of the married-couple family households (29.0%) and 307 of the single-parent households (74.0%) are living below the poverty level. Within the married-couple family households, those with 1 or 2 children have the highest poverty rate, with 26 households (55.3%) falling below the poverty line. Among the single-parent households, those with 1 or 2 children have the highest poverty rate, with 217 household (100.0%) living below poverty.
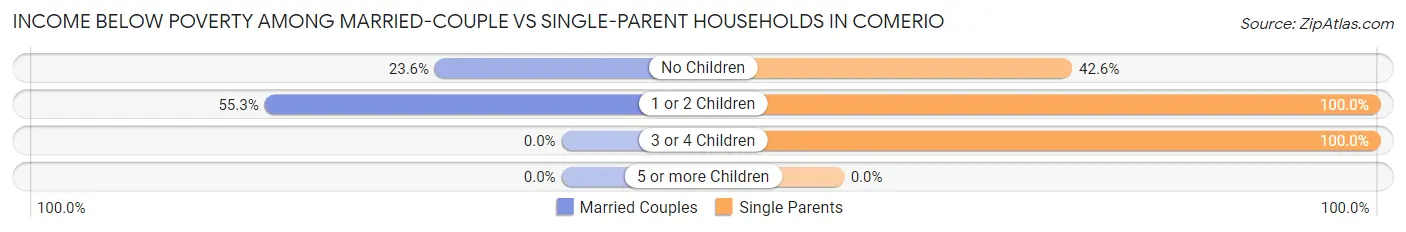
| Children | Married-Couple Families | Single-Parent Households |
| No Children | 54 (23.6%) | 80 (42.5%) |
| 1 or 2 Children | 26 (55.3%) | 217 (100.0%) |
| 3 or 4 Children | 0 (0.0%) | 10 (100.0%) |
| 5 or more Children | 0 (0.0%) | 0 (0.0%) |
| Total | 80 (29.0%) | 307 (74.0%) |
Race in Comerio
The most populous races in Comerio are Hispanic or Latino (3,656 | 100.0%), White / Caucasian (2,175 | 59.5%), and Two or more Races (1,177 | 32.2%).
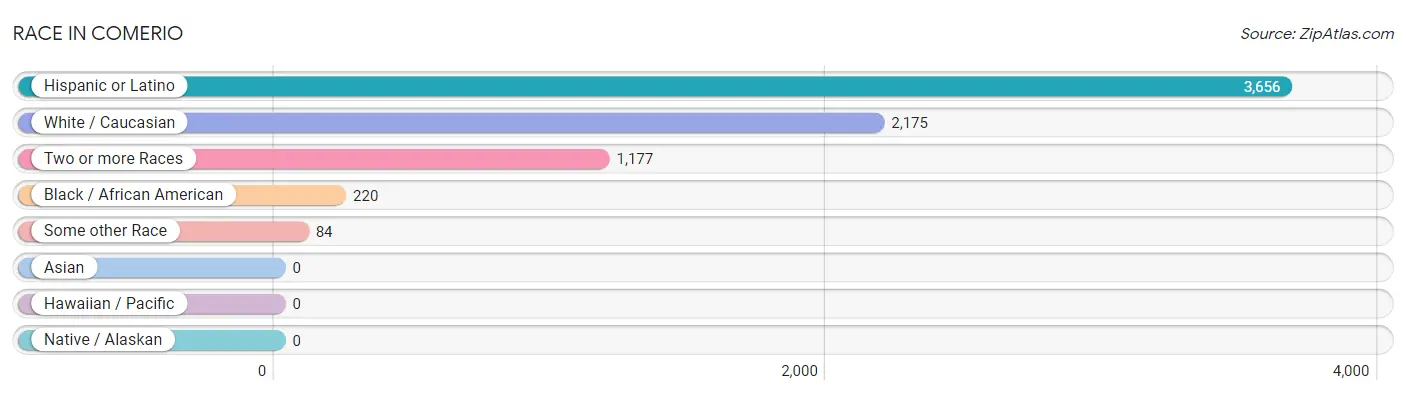
| Race | # Population | % Population |
| Asian | 0 | 0.0% |
| Black / African American | 220 | 6.0% |
| Hawaiian / Pacific | 0 | 0.0% |
| Hispanic or Latino | 3,656 | 100.0% |
| Native / Alaskan | 0 | 0.0% |
| White / Caucasian | 2,175 | 59.5% |
| Two or more Races | 1,177 | 32.2% |
| Some other Race | 84 | 2.3% |
| Total | 3,656 | 100.0% |
Ancestry in Comerio
The most populous ancestries reported in Comerio are Puerto Rican (3,656 | 100.0%), and American (19 | 0.5%), together accounting for 100.5% of all Comerio residents.
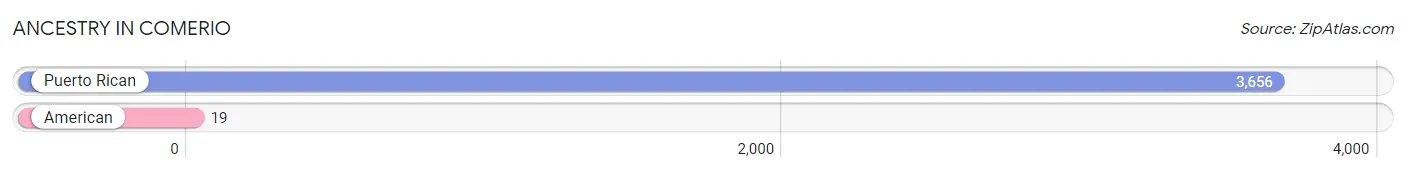
| Ancestry | # Population | % Population |
| American | 19 | 0.5% |
| Puerto Rican | 3,656 | 100.0% | View All 2 Rows |
Immigrants in Comerio

| Immigration Origin | # Population | % Population | View All 0 Rows |
Sex and Age in Comerio
Sex and Age in Comerio
The most populous age groups in Comerio are 65 to 69 Years (180 | 11.2%) for men and 25 to 29 Years (251 | 12.2%) for women.
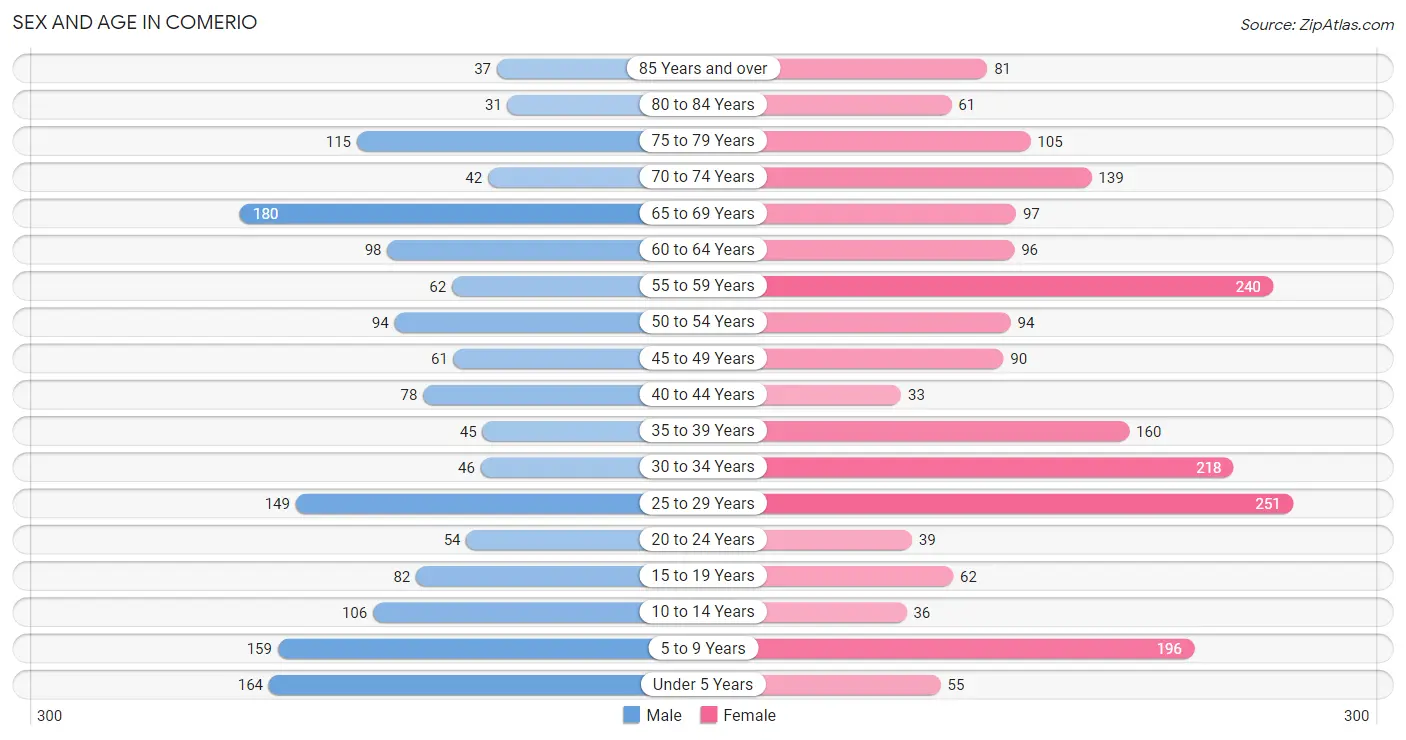
| Age Bracket | Male | Female |
| Under 5 Years | 164 (10.2%) | 55 (2.7%) |
| 5 to 9 Years | 159 (9.9%) | 196 (9.6%) |
| 10 to 14 Years | 106 (6.6%) | 36 (1.8%) |
| 15 to 19 Years | 82 (5.1%) | 62 (3.0%) |
| 20 to 24 Years | 54 (3.4%) | 39 (1.9%) |
| 25 to 29 Years | 149 (9.3%) | 251 (12.2%) |
| 30 to 34 Years | 46 (2.9%) | 218 (10.6%) |
| 35 to 39 Years | 45 (2.8%) | 160 (7.8%) |
| 40 to 44 Years | 78 (4.9%) | 33 (1.6%) |
| 45 to 49 Years | 61 (3.8%) | 90 (4.4%) |
| 50 to 54 Years | 94 (5.9%) | 94 (4.6%) |
| 55 to 59 Years | 62 (3.9%) | 240 (11.7%) |
| 60 to 64 Years | 98 (6.1%) | 96 (4.7%) |
| 65 to 69 Years | 180 (11.2%) | 97 (4.7%) |
| 70 to 74 Years | 42 (2.6%) | 139 (6.8%) |
| 75 to 79 Years | 115 (7.2%) | 105 (5.1%) |
| 80 to 84 Years | 31 (1.9%) | 61 (3.0%) |
| 85 Years and over | 37 (2.3%) | 81 (4.0%) |
| Total | 1,603 (100.0%) | 2,053 (100.0%) |
Families and Households in Comerio
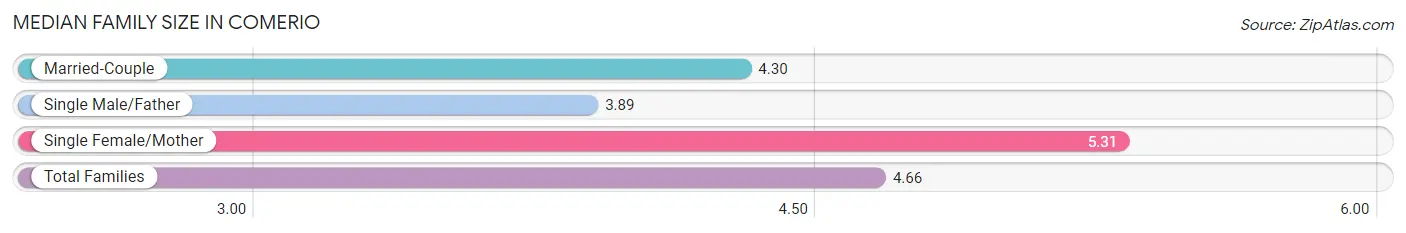
Median Family Size in Comerio
The median family size in Comerio is 4.66 persons per family, with single female/mother families (298 | 43.1%) accounting for the largest median family size of 5.31 persons per family. On the other hand, single male/father families (117 | 16.9%) represent the smallest median family size with 3.89 persons per family.
| Family Type | # Families | Family Size |
| Married-Couple | 276 (39.9%) | 4.30 |
| Single Male/Father | 117 (16.9%) | 3.89 |
| Single Female/Mother | 298 (43.1%) | 5.31 |
| Total Families | 691 (100.0%) | 4.66 |
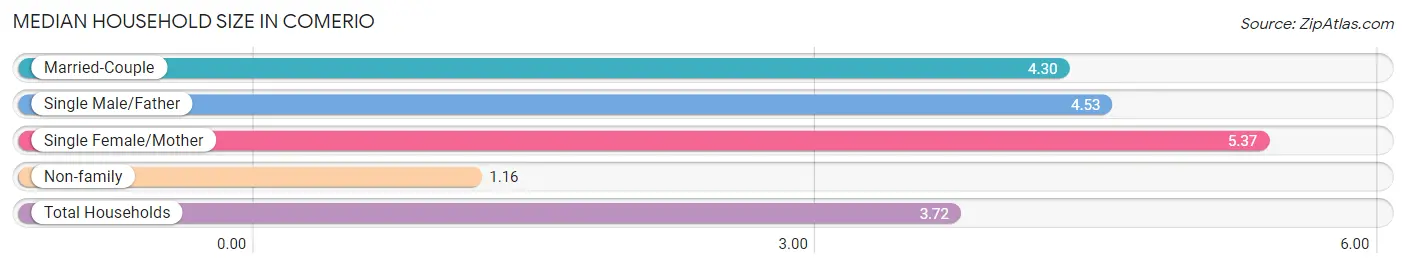
Median Household Size in Comerio
The median household size in Comerio is 3.72 persons per household, with single female/mother households (298 | 30.3%) accounting for the largest median household size of 5.37 persons per household. non-family households (292 | 29.7%) represent the smallest median household size with 1.16 persons per household.
| Household Type | # Households | Household Size |
| Married-Couple | 276 (28.1%) | 4.30 |
| Single Male/Father | 117 (11.9%) | 4.53 |
| Single Female/Mother | 298 (30.3%) | 5.37 |
| Non-family | 292 (29.7%) | 1.16 |
| Total Households | 983 (100.0%) | 3.72 |
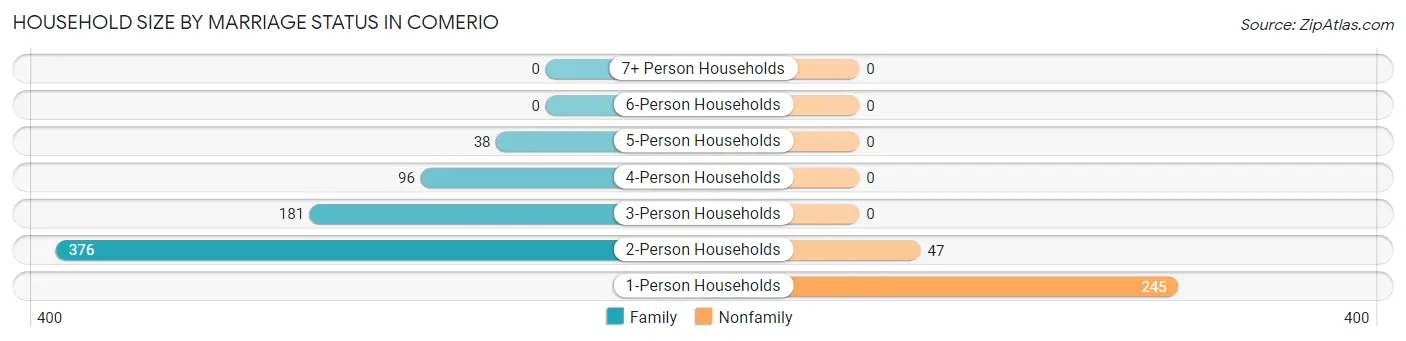
Household Size by Marriage Status in Comerio
Out of a total of 983 households in Comerio, 691 (70.3%) are family households, while 292 (29.7%) are nonfamily households. The most numerous type of family households are 2-person households, comprising 376, and the most common type of nonfamily households are 1-person households, comprising 245.
| Household Size | Family Households | Nonfamily Households |
| 1-Person Households | - | 245 (24.9%) |
| 2-Person Households | 376 (38.3%) | 47 (4.8%) |
| 3-Person Households | 181 (18.4%) | 0 (0.0%) |
| 4-Person Households | 96 (9.8%) | 0 (0.0%) |
| 5-Person Households | 38 (3.9%) | 0 (0.0%) |
| 6-Person Households | 0 (0.0%) | 0 (0.0%) |
| 7+ Person Households | 0 (0.0%) | 0 (0.0%) |
| Total | 691 (70.3%) | 292 (29.7%) |
Female Fertility in Comerio
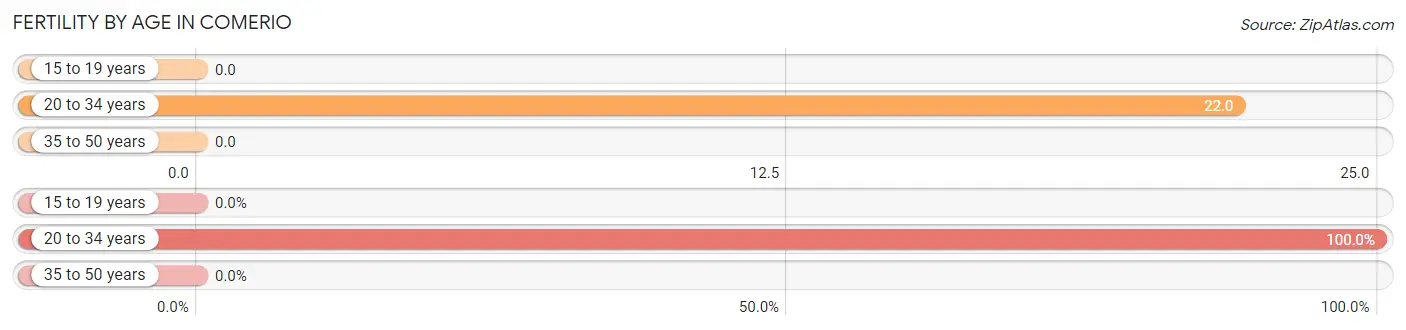
Fertility by Age in Comerio
Average fertility rate in Comerio is 13.0 births per 1,000 women. Women in the age bracket of 20 to 34 years have the highest fertility rate with 22.0 births per 1,000 women. Women in the age bracket of 20 to 34 years acount for 100.0% of all women with births.
| Age Bracket | Women with Births | Births / 1,000 Women |
| 15 to 19 years | 0 (0.0%) | 0.0 |
| 20 to 34 years | 11 (100.0%) | 22.0 |
| 35 to 50 years | 0 (0.0%) | 0.0 |
| Total | 11 (100.0%) | 13.0 |
Fertility by Age by Marriage Status in Comerio
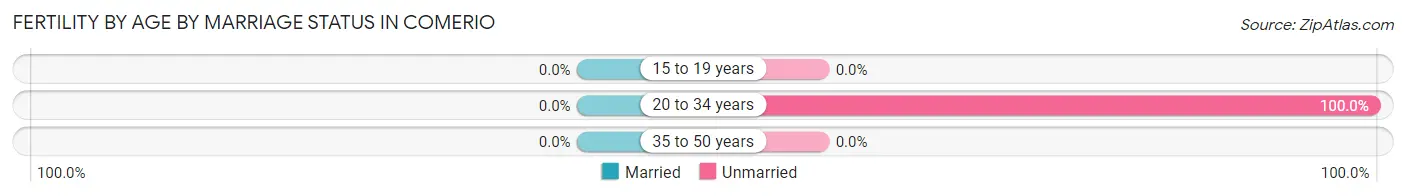
| Age Bracket | Married | Unmarried |
| 15 to 19 years | 0 (0.0%) | 0 (0.0%) |
| 20 to 34 years | 0 (0.0%) | 11 (100.0%) |
| 35 to 50 years | 0 (0.0%) | 0 (0.0%) |
| Total | 0 (0.0%) | 11 (100.0%) |
Fertility by Education in Comerio
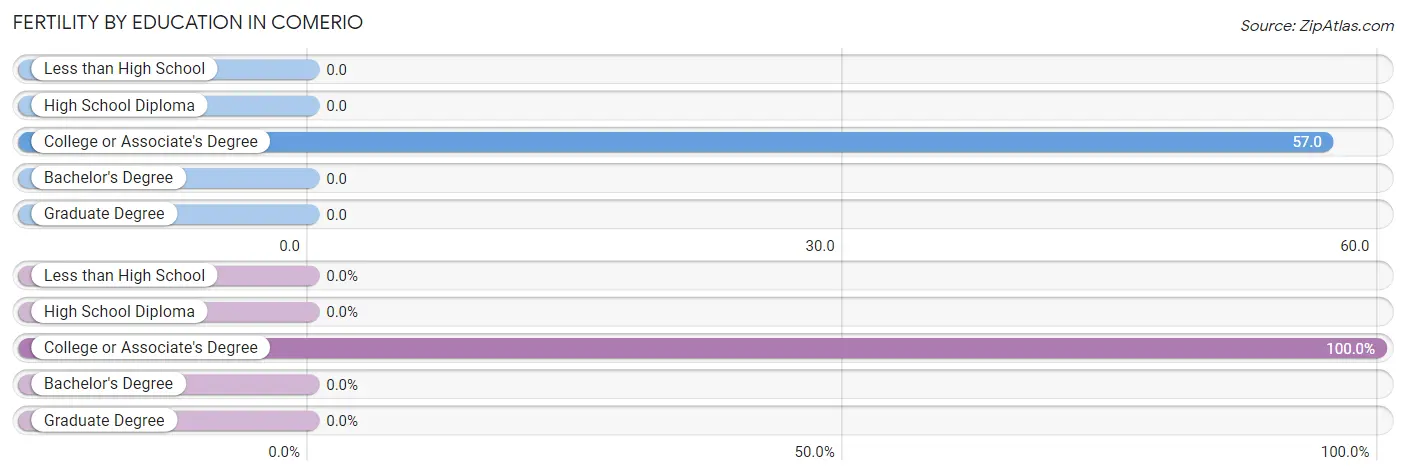
| Educational Attainment | Women with Births | Births / 1,000 Women |
| Less than High School | 0 (0.0%) | 0.0 |
| High School Diploma | 0 (0.0%) | 0.0 |
| College or Associate's Degree | 11 (100.0%) | 57.0 |
| Bachelor's Degree | 0 (0.0%) | 0.0 |
| Graduate Degree | 0 (0.0%) | 0.0 |
| Total | 11 (100.0%) | 13.0 |
Fertility by Education by Marriage Status in Comerio
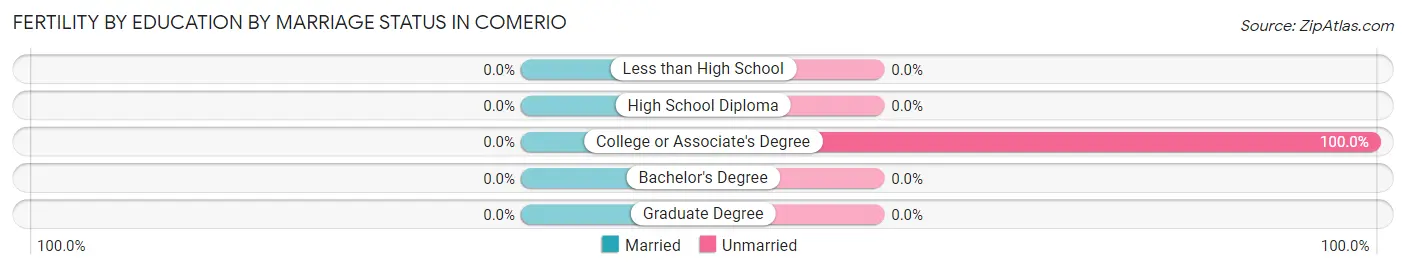
| Educational Attainment | Married | Unmarried |
| Less than High School | 0 (0.0%) | 0 (0.0%) |
| High School Diploma | 0 (0.0%) | 0 (0.0%) |
| College or Associate's Degree | 0 (0.0%) | 11 (100.0%) |
| Bachelor's Degree | 0 (0.0%) | 0 (0.0%) |
| Graduate Degree | 0 (0.0%) | 0 (0.0%) |
| Total | 0 (0.0%) | 11 (100.0%) |
Employment Characteristics in Comerio
Employment by Class of Employer in Comerio
Among the 1,033 employed individuals in Comerio, private company employees (628 | 60.8%), state government employees (134 | 13.0%), and federal government employees (108 | 10.4%) make up the most common classes of employment.
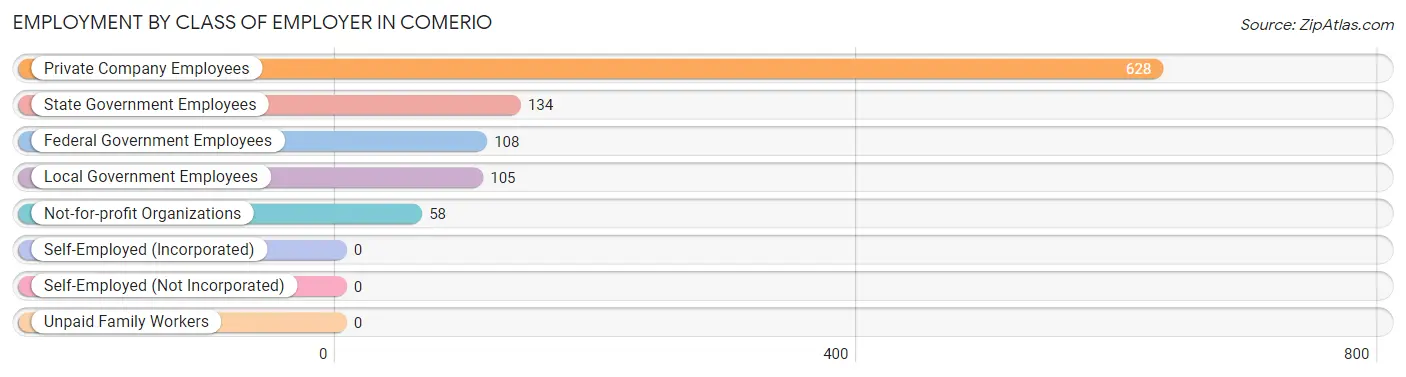
| Employer Class | # Employees | % Employees |
| Private Company Employees | 628 | 60.8% |
| Self-Employed (Incorporated) | 0 | 0.0% |
| Self-Employed (Not Incorporated) | 0 | 0.0% |
| Not-for-profit Organizations | 58 | 5.6% |
| Local Government Employees | 105 | 10.2% |
| State Government Employees | 134 | 13.0% |
| Federal Government Employees | 108 | 10.4% |
| Unpaid Family Workers | 0 | 0.0% |
| Total | 1,033 | 100.0% |
Employment Status by Age in Comerio
According to the labor force statistics for Comerio, out of the total population over 16 years of age (2,910), 44.1% or 1,283 individuals are in the labor force, with 19.6% or 251 of them unemployed. The age group with the highest labor force participation rate is 25 to 29 years, with 94.5% or 378 individuals in the labor force. Within the labor force, the 20 to 24 years age range has the highest percentage of unemployed individuals, with 100.0% or 36 of them being unemployed.
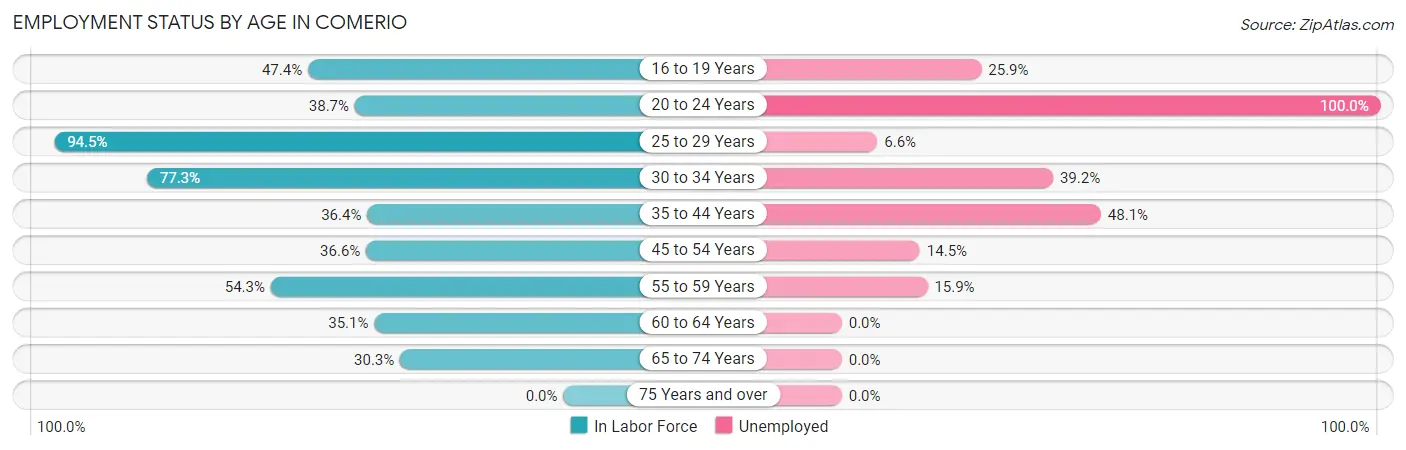
| Age Bracket | In Labor Force | Unemployed |
| 16 to 19 Years | 54 (47.4%) | 14 (25.9%) |
| 20 to 24 Years | 36 (38.7%) | 36 (100.0%) |
| 25 to 29 Years | 378 (94.5%) | 25 (6.6%) |
| 30 to 34 Years | 204 (77.3%) | 80 (39.2%) |
| 35 to 44 Years | 115 (36.4%) | 55 (48.1%) |
| 45 to 54 Years | 124 (36.6%) | 18 (14.5%) |
| 55 to 59 Years | 164 (54.3%) | 26 (15.9%) |
| 60 to 64 Years | 68 (35.1%) | 0 (0.0%) |
| 65 to 74 Years | 139 (30.3%) | 0 (0.0%) |
| 75 Years and over | 0 (0.0%) | 0 (0.0%) |
| Total | 1,283 (44.1%) | 251 (19.6%) |
Employment Status by Educational Attainment in Comerio
According to labor force statistics for Comerio, 58.0% of individuals (1,053) out of the total population between 25 and 64 years of age (1,815) are in the labor force, with 19.1% or 201 of them being unemployed. The group with the highest labor force participation rate are those with the educational attainment of college / associate degree, with 80.3% or 334 individuals in the labor force. Within the labor force, individuals with less than high school education have the highest percentage of unemployment, with 54.0% or 101 of them being unemployed.
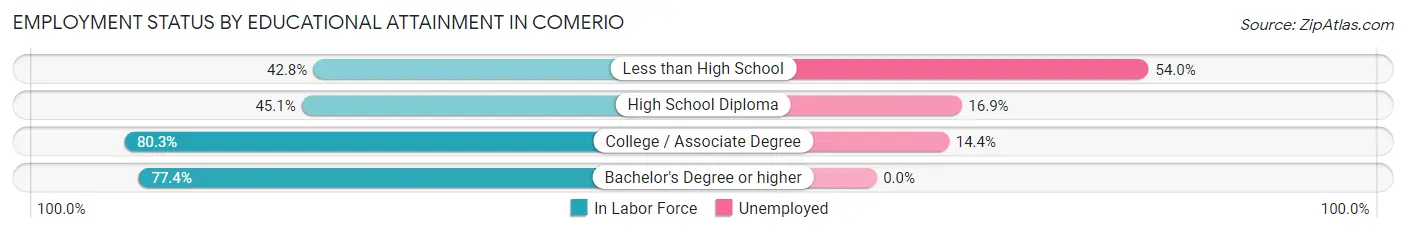
| Educational Attainment | In Labor Force | Unemployed |
| Less than High School | 187 (42.8%) | 236 (54.0%) |
| High School Diploma | 296 (45.1%) | 111 (16.9%) |
| College / Associate Degree | 334 (80.3%) | 60 (14.4%) |
| Bachelor's Degree or higher | 236 (77.4%) | 0 (0.0%) |
| Total | 1,053 (58.0%) | 347 (19.1%) |
Employment Occupations by Sex in Comerio
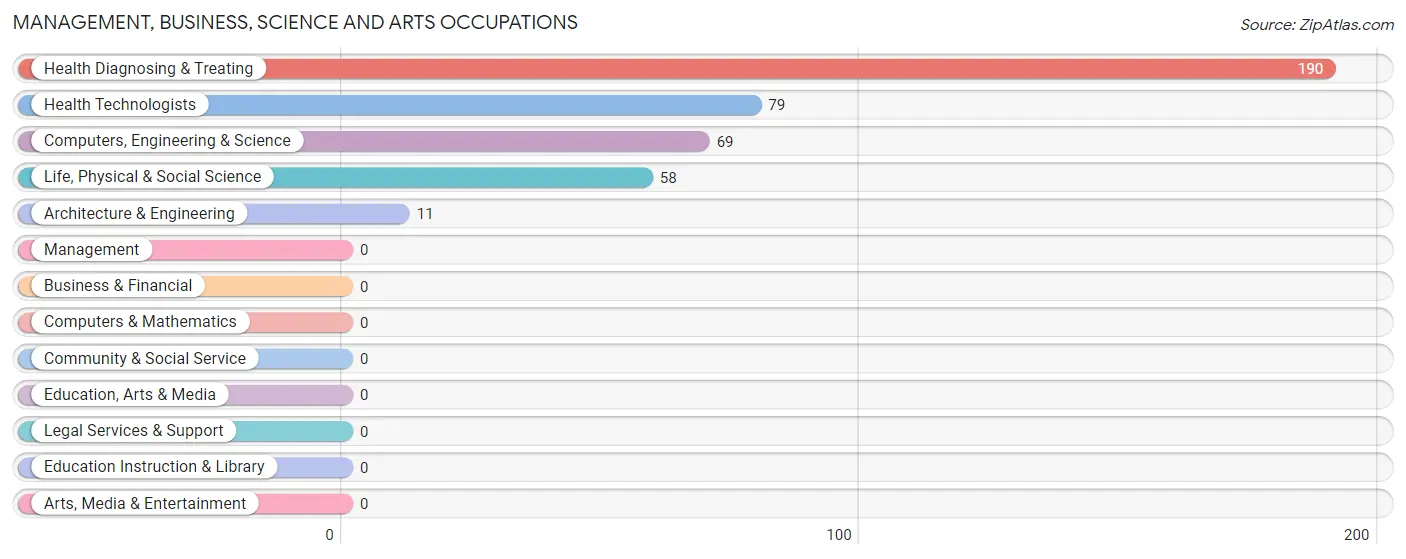
Management, Business, Science and Arts Occupations
The most common Management, Business, Science and Arts occupations in Comerio are Health Diagnosing & Treating (190 | 18.6%), Health Technologists (79 | 7.7%), Computers, Engineering & Science (69 | 6.8%), Life, Physical & Social Science (58 | 5.7%), and Architecture & Engineering (11 | 1.1%).
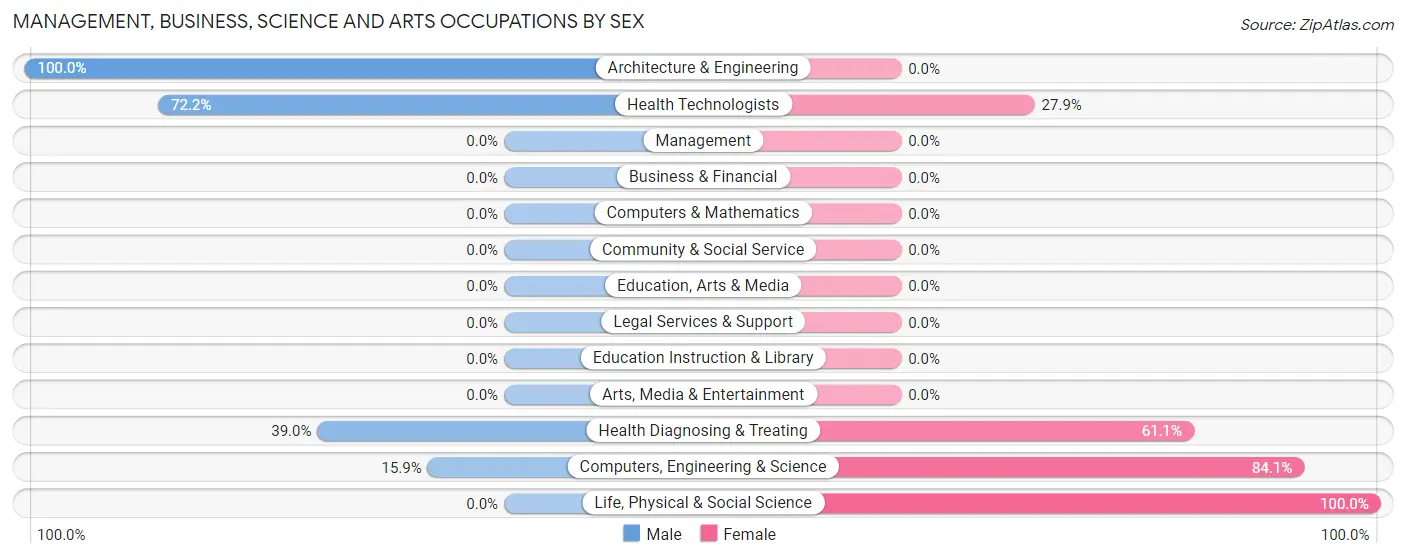
Management, Business, Science and Arts Occupations by Sex
Within the Management, Business, Science and Arts occupations in Comerio, the most male-oriented occupations are Architecture & Engineering (100.0%), Health Technologists (72.2%), and Health Diagnosing & Treating (39.0%), while the most female-oriented occupations are Life, Physical & Social Science (100.0%), Computers, Engineering & Science (84.1%), and Health Diagnosing & Treating (61.1%).
| Occupation | Male | Female |
| Management | 0 (0.0%) | 0 (0.0%) |
| Business & Financial | 0 (0.0%) | 0 (0.0%) |
| Computers, Engineering & Science | 11 (15.9%) | 58 (84.1%) |
| Computers & Mathematics | 0 (0.0%) | 0 (0.0%) |
| Architecture & Engineering | 11 (100.0%) | 0 (0.0%) |
| Life, Physical & Social Science | 0 (0.0%) | 58 (100.0%) |
| Community & Social Service | 0 (0.0%) | 0 (0.0%) |
| Education, Arts & Media | 0 (0.0%) | 0 (0.0%) |
| Legal Services & Support | 0 (0.0%) | 0 (0.0%) |
| Education Instruction & Library | 0 (0.0%) | 0 (0.0%) |
| Arts, Media & Entertainment | 0 (0.0%) | 0 (0.0%) |
| Health Diagnosing & Treating | 74 (39.0%) | 116 (61.1%) |
| Health Technologists | 57 (72.2%) | 22 (27.9%) |
| Total (Category) | 85 (32.8%) | 174 (67.2%) |
| Total (Overall) | 518 (50.7%) | 504 (49.3%) |
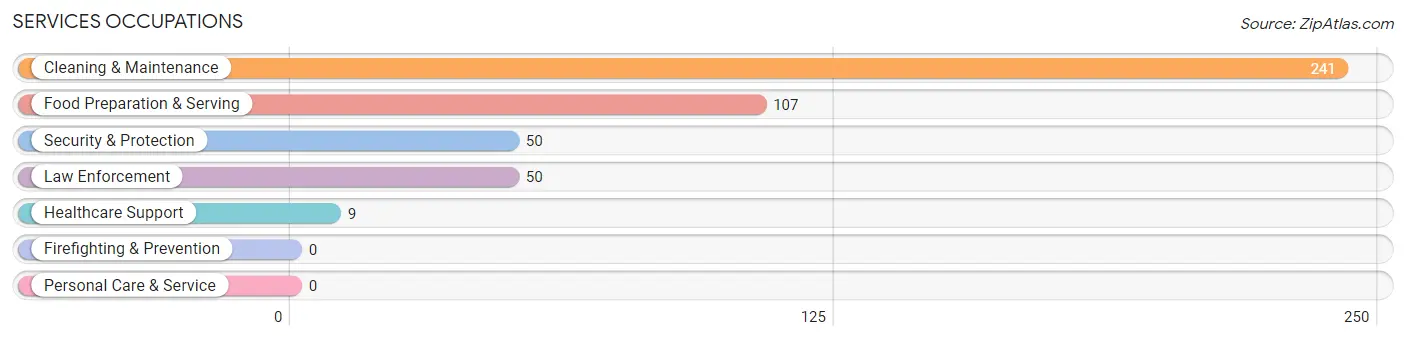
Services Occupations
The most common Services occupations in Comerio are Cleaning & Maintenance (241 | 23.6%), Food Preparation & Serving (107 | 10.5%), Security & Protection (50 | 4.9%), Law Enforcement (50 | 4.9%), and Healthcare Support (9 | 0.9%).
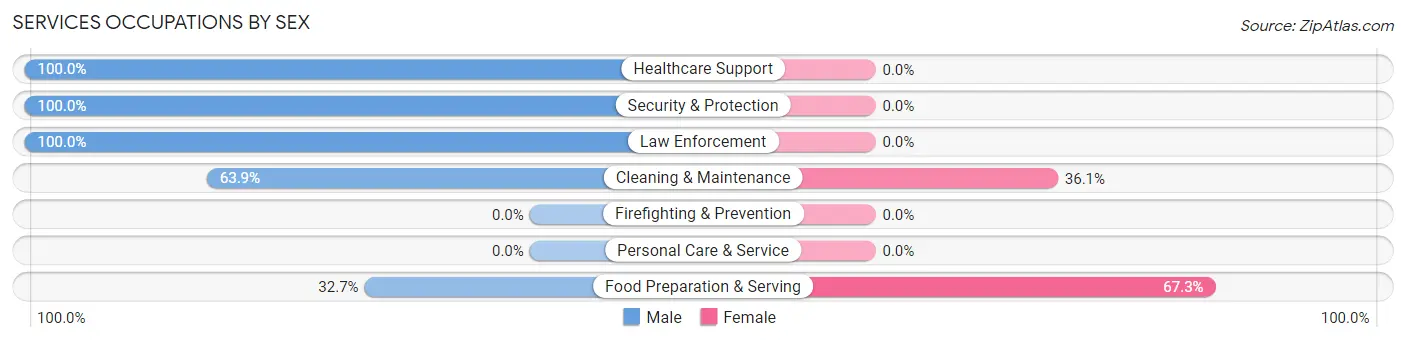
Services Occupations by Sex
Within the Services occupations in Comerio, the most male-oriented occupations are Healthcare Support (100.0%), Security & Protection (100.0%), and Law Enforcement (100.0%), while the most female-oriented occupations are Food Preparation & Serving (67.3%), and Cleaning & Maintenance (36.1%).
| Occupation | Male | Female |
| Healthcare Support | 9 (100.0%) | 0 (0.0%) |
| Security & Protection | 50 (100.0%) | 0 (0.0%) |
| Firefighting & Prevention | 0 (0.0%) | 0 (0.0%) |
| Law Enforcement | 50 (100.0%) | 0 (0.0%) |
| Food Preparation & Serving | 35 (32.7%) | 72 (67.3%) |
| Cleaning & Maintenance | 154 (63.9%) | 87 (36.1%) |
| Personal Care & Service | 0 (0.0%) | 0 (0.0%) |
| Total (Category) | 248 (60.9%) | 159 (39.1%) |
| Total (Overall) | 518 (50.7%) | 504 (49.3%) |
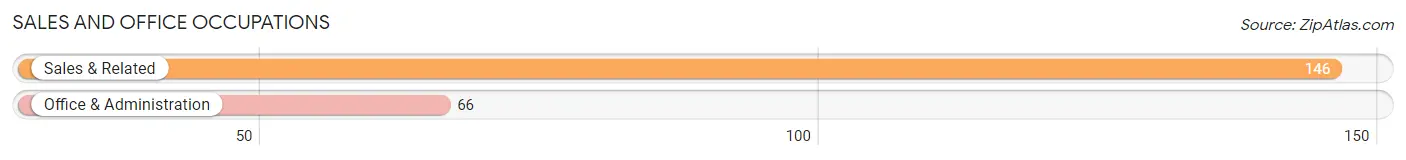
Sales and Office Occupations
The most common Sales and Office occupations in Comerio are Sales & Related (146 | 14.3%), and Office & Administration (66 | 6.5%).
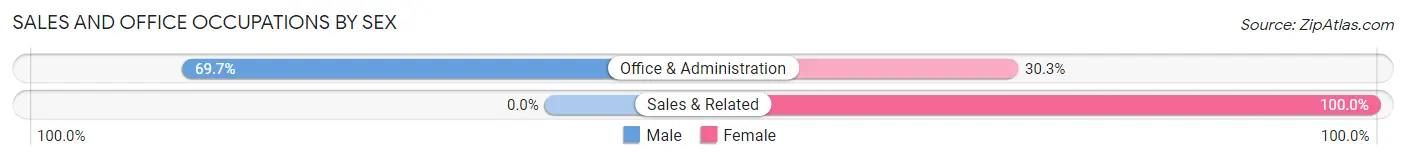
Sales and Office Occupations by Sex
| Occupation | Male | Female |
| Sales & Related | 0 (0.0%) | 146 (100.0%) |
| Office & Administration | 46 (69.7%) | 20 (30.3%) |
| Total (Category) | 46 (21.7%) | 166 (78.3%) |
| Total (Overall) | 518 (50.7%) | 504 (49.3%) |
Natural Resources, Construction and Maintenance Occupations
The most common Natural Resources, Construction and Maintenance occupations in Comerio are , and Construction & Extraction (10 | 1.0%).
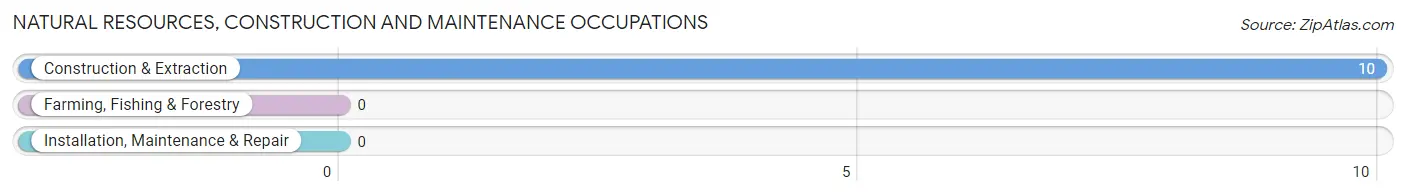
Natural Resources, Construction and Maintenance Occupations by Sex
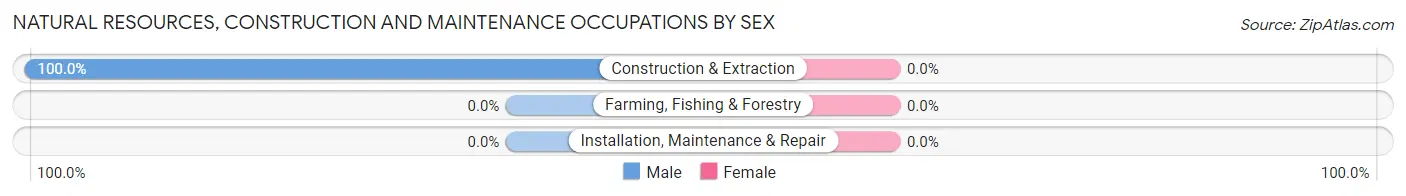
| Occupation | Male | Female |
| Farming, Fishing & Forestry | 0 (0.0%) | 0 (0.0%) |
| Construction & Extraction | 10 (100.0%) | 0 (0.0%) |
| Installation, Maintenance & Repair | 0 (0.0%) | 0 (0.0%) |
| Total (Category) | 10 (100.0%) | 0 (0.0%) |
| Total (Overall) | 518 (50.7%) | 504 (49.3%) |
Production, Transportation and Moving Occupations
The most common Production, Transportation and Moving occupations in Comerio are Material Moving (70 | 6.9%), Transportation (46 | 4.5%), and Production (18 | 1.8%).
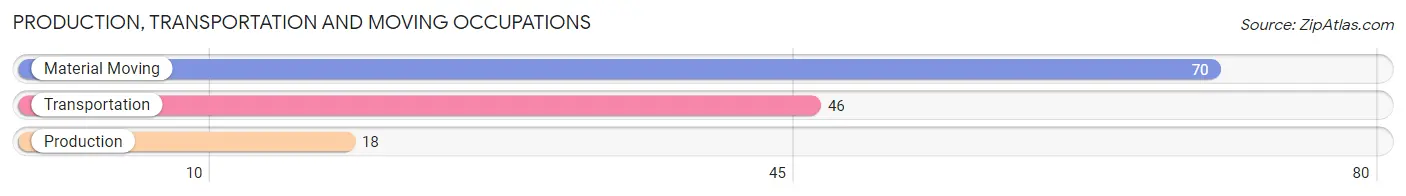
Production, Transportation and Moving Occupations by Sex
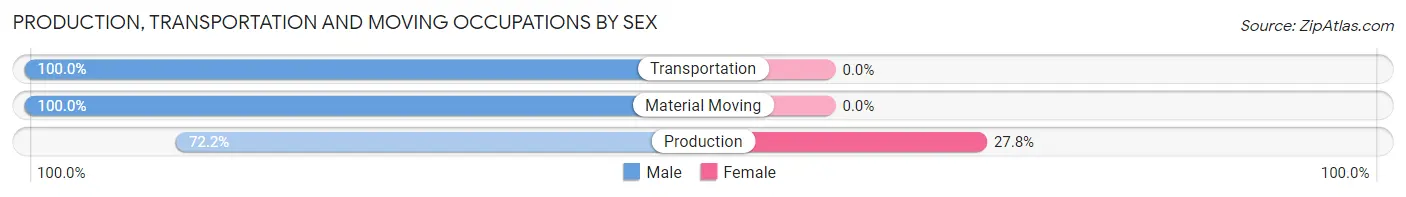
| Occupation | Male | Female |
| Production | 13 (72.2%) | 5 (27.8%) |
| Transportation | 46 (100.0%) | 0 (0.0%) |
| Material Moving | 70 (100.0%) | 0 (0.0%) |
| Total (Category) | 129 (96.3%) | 5 (3.7%) |
| Total (Overall) | 518 (50.7%) | 504 (49.3%) |
Employment Industries by Sex in Comerio
Employment Industries in Comerio
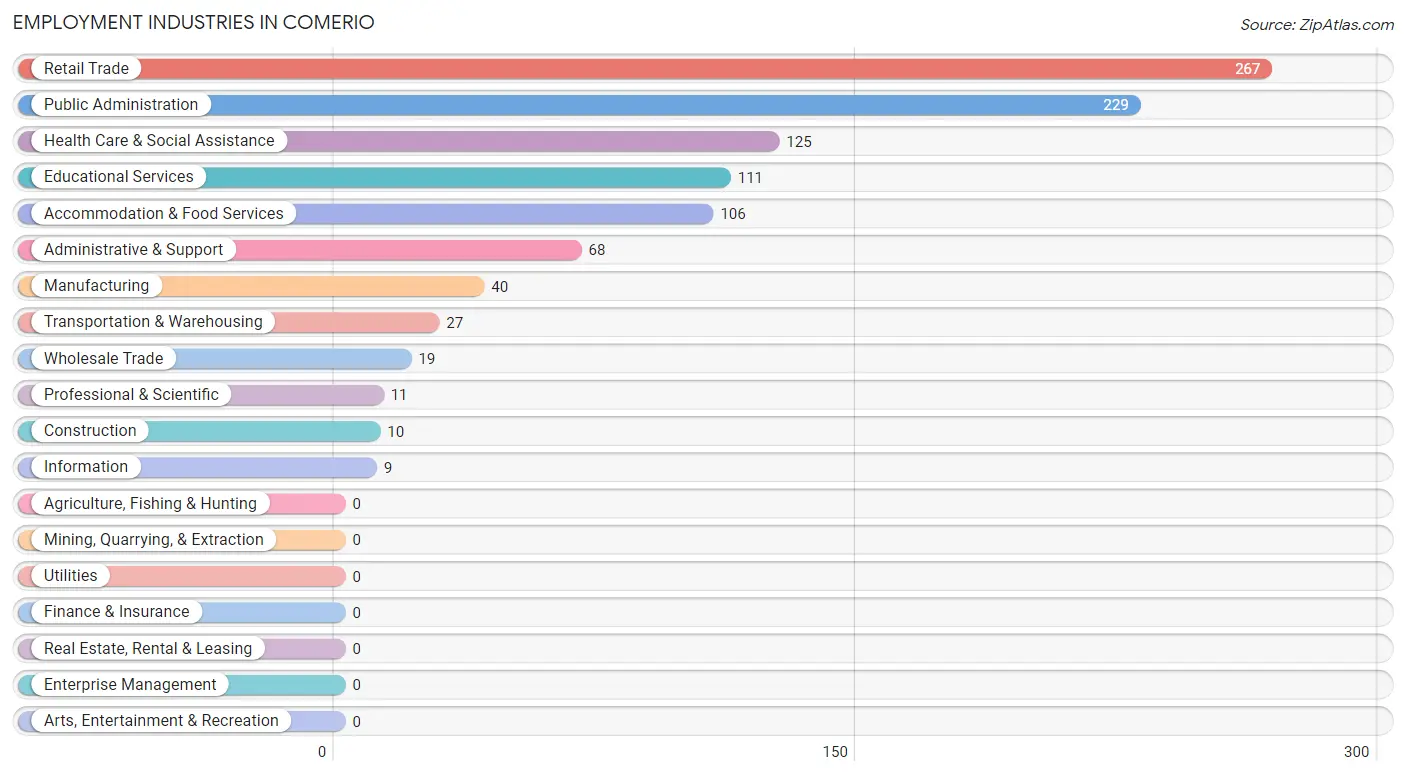
The major employment industries in Comerio include Retail Trade (267 | 26.1%), Public Administration (229 | 22.4%), Health Care & Social Assistance (125 | 12.2%), Educational Services (111 | 10.9%), and Accommodation & Food Services (106 | 10.4%).
Employment Industries by Sex in Comerio
The Comerio industries that see more men than women are Construction (100.0%), Wholesale Trade (100.0%), and Transportation & Warehousing (100.0%), whereas the industries that tend to have a higher number of women are Information (100.0%), Educational Services (87.4%), and Retail Trade (77.1%).
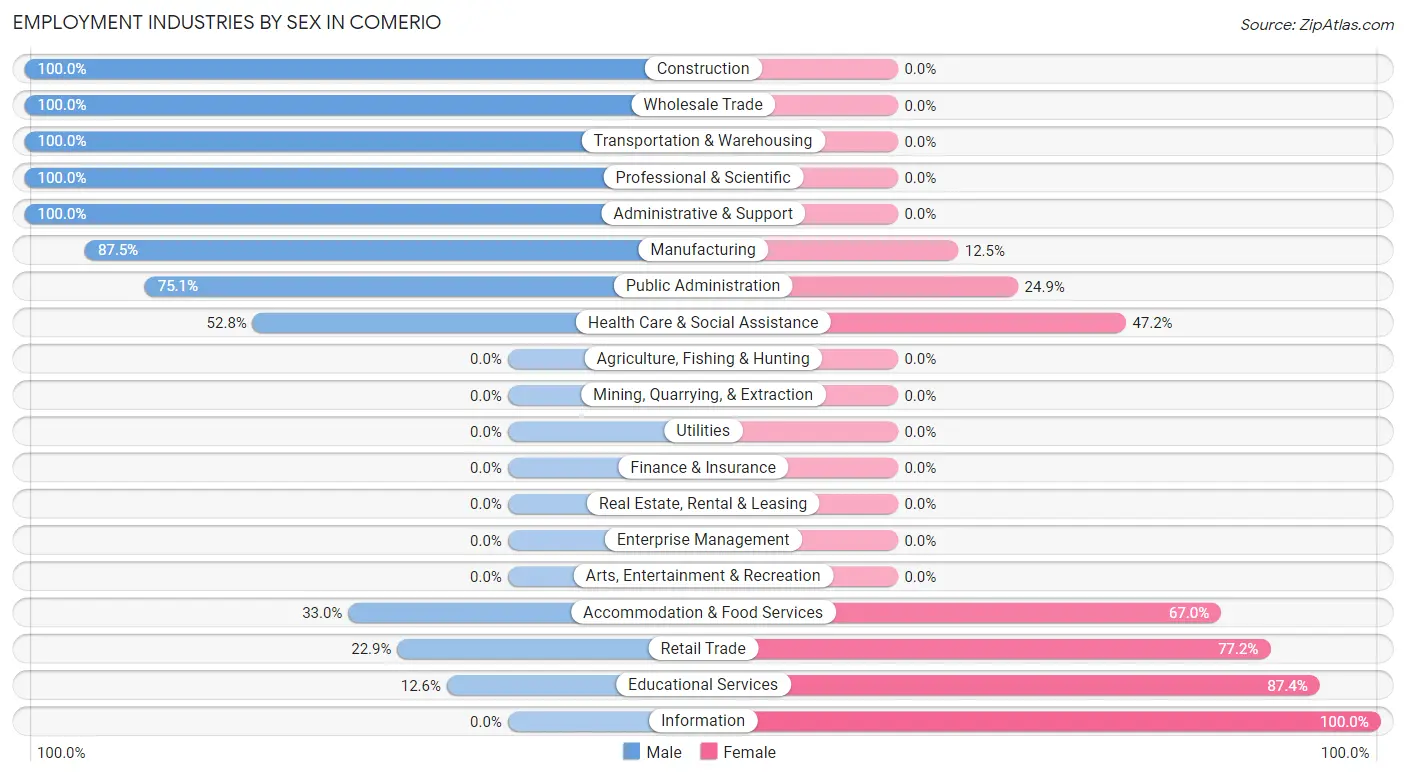
| Industry | Male | Female |
| Agriculture, Fishing & Hunting | 0 (0.0%) | 0 (0.0%) |
| Mining, Quarrying, & Extraction | 0 (0.0%) | 0 (0.0%) |
| Construction | 10 (100.0%) | 0 (0.0%) |
| Manufacturing | 35 (87.5%) | 5 (12.5%) |
| Wholesale Trade | 19 (100.0%) | 0 (0.0%) |
| Retail Trade | 61 (22.9%) | 206 (77.1%) |
| Transportation & Warehousing | 27 (100.0%) | 0 (0.0%) |
| Utilities | 0 (0.0%) | 0 (0.0%) |
| Information | 0 (0.0%) | 9 (100.0%) |
| Finance & Insurance | 0 (0.0%) | 0 (0.0%) |
| Real Estate, Rental & Leasing | 0 (0.0%) | 0 (0.0%) |
| Professional & Scientific | 11 (100.0%) | 0 (0.0%) |
| Enterprise Management | 0 (0.0%) | 0 (0.0%) |
| Administrative & Support | 68 (100.0%) | 0 (0.0%) |
| Educational Services | 14 (12.6%) | 97 (87.4%) |
| Health Care & Social Assistance | 66 (52.8%) | 59 (47.2%) |
| Arts, Entertainment & Recreation | 0 (0.0%) | 0 (0.0%) |
| Accommodation & Food Services | 35 (33.0%) | 71 (67.0%) |
| Public Administration | 172 (75.1%) | 57 (24.9%) |
| Total | 518 (50.7%) | 504 (49.3%) |
Education in Comerio
School Enrollment in Comerio
The most common levels of schooling among the 832 students in Comerio are elementary school (247 | 29.7%), middle school (157 | 18.9%), and college / undergraduate (153 | 18.4%).
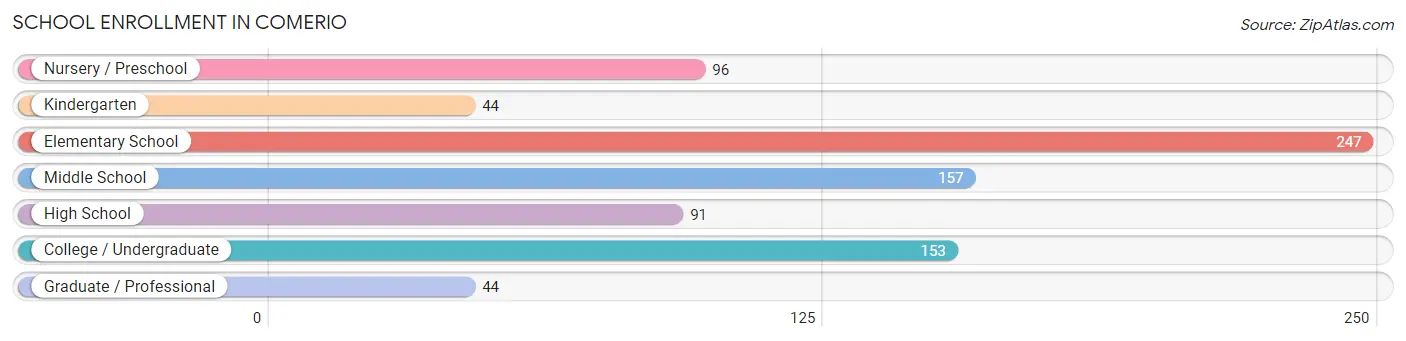
| School Level | # Students | % Students |
| Nursery / Preschool | 96 | 11.5% |
| Kindergarten | 44 | 5.3% |
| Elementary School | 247 | 29.7% |
| Middle School | 157 | 18.9% |
| High School | 91 | 10.9% |
| College / Undergraduate | 153 | 18.4% |
| Graduate / Professional | 44 | 5.3% |
| Total | 832 | 100.0% |
School Enrollment by Age by Funding Source in Comerio
Out of a total of 832 students who are enrolled in schools in Comerio, 153 (18.4%) attend a private institution, while the remaining 679 (81.6%) are enrolled in public schools. The age group of 25 to 34 year olds has the highest likelihood of being enrolled in private schools, with 111 (100.0% in the age bracket) enrolled. Conversely, the age group of 5 to 9 year old has the lowest likelihood of being enrolled in a private school, with 326 (100.0% in the age bracket) attending a public institution.
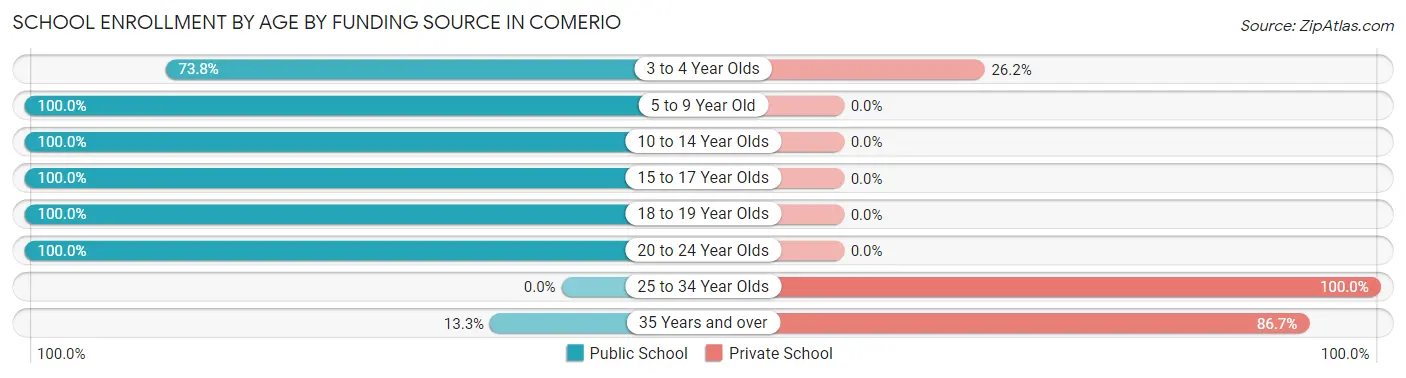
| Age Bracket | Public School | Private School |
| 3 to 4 Year Olds | 45 (73.8%) | 16 (26.2%) |
| 5 to 9 Year Old | 326 (100.0%) | 0 (0.0%) |
| 10 to 14 Year Olds | 142 (100.0%) | 0 (0.0%) |
| 15 to 17 Year Olds | 84 (100.0%) | 0 (0.0%) |
| 18 to 19 Year Olds | 45 (100.0%) | 0 (0.0%) |
| 20 to 24 Year Olds | 33 (100.0%) | 0 (0.0%) |
| 25 to 34 Year Olds | 0 (0.0%) | 111 (100.0%) |
| 35 Years and over | 4 (13.3%) | 26 (86.7%) |
| Total | 679 (81.6%) | 153 (18.4%) |
Educational Attainment by Field of Study in Comerio
Business (106 | 22.6%), education (97 | 20.7%), science & technology (96 | 20.5%), arts & humanities (72 | 15.3%), and psychology (35 | 7.5%) are the most common fields of study among 469 individuals in Comerio who have obtained a bachelor's degree or higher.
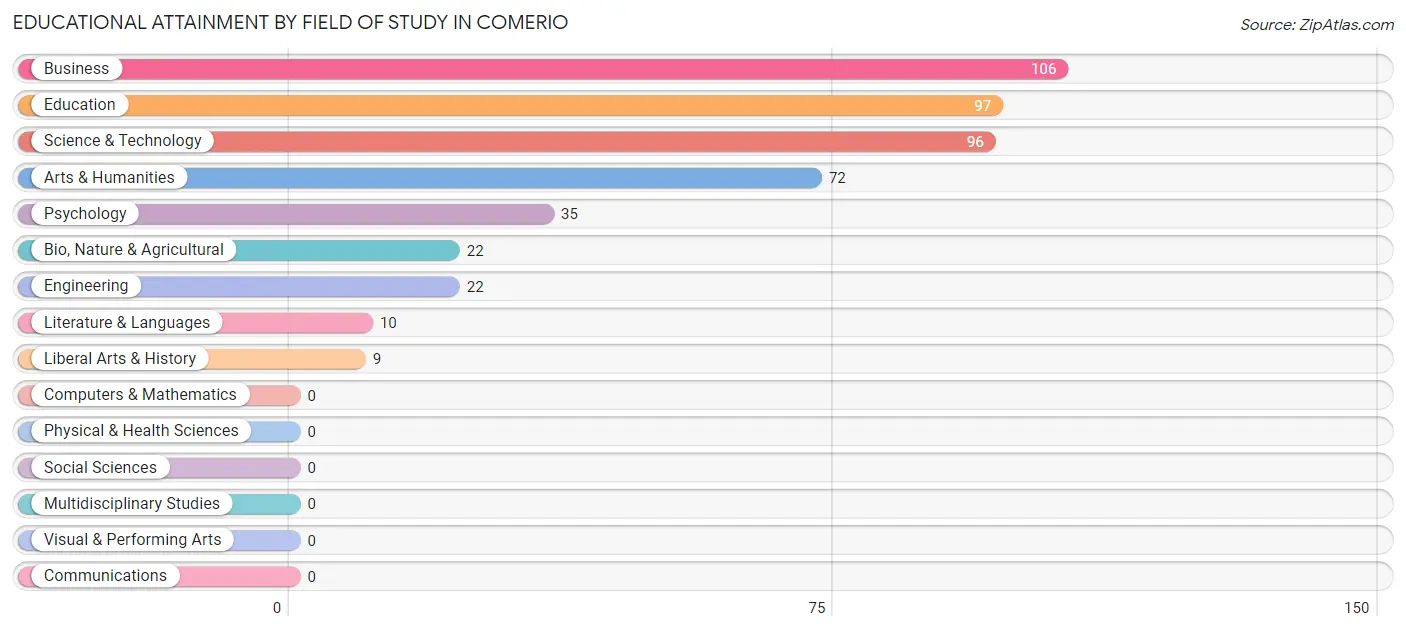
| Field of Study | # Graduates | % Graduates |
| Computers & Mathematics | 0 | 0.0% |
| Bio, Nature & Agricultural | 22 | 4.7% |
| Physical & Health Sciences | 0 | 0.0% |
| Psychology | 35 | 7.5% |
| Social Sciences | 0 | 0.0% |
| Engineering | 22 | 4.7% |
| Multidisciplinary Studies | 0 | 0.0% |
| Science & Technology | 96 | 20.5% |
| Business | 106 | 22.6% |
| Education | 97 | 20.7% |
| Literature & Languages | 10 | 2.1% |
| Liberal Arts & History | 9 | 1.9% |
| Visual & Performing Arts | 0 | 0.0% |
| Communications | 0 | 0.0% |
| Arts & Humanities | 72 | 15.3% |
| Total | 469 | 100.0% |
Transportation & Commute in Comerio
Vehicle Availability by Sex in Comerio
The most prevalent vehicle ownership categories in Comerio are males with 1 vehicle (258, accounting for 48.8%) and females with 1 vehicle (140, making up 51.2%).
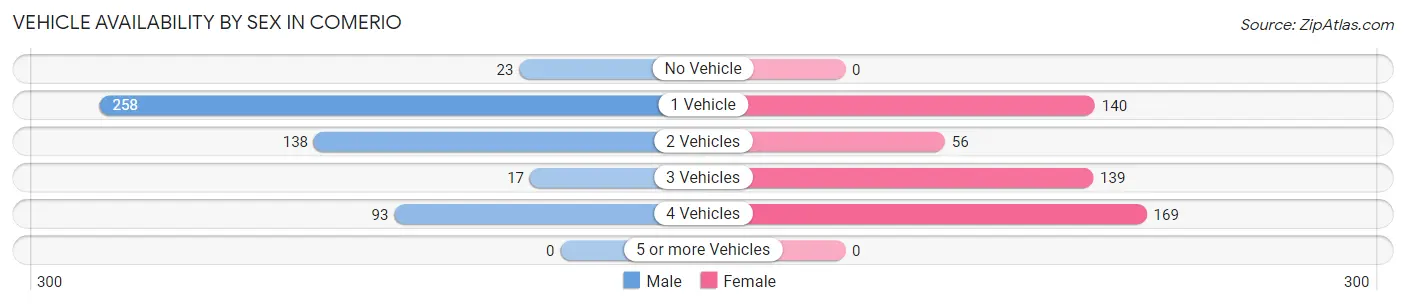
| Vehicles Available | Male | Female |
| No Vehicle | 23 (4.3%) | 0 (0.0%) |
| 1 Vehicle | 258 (48.8%) | 140 (27.8%) |
| 2 Vehicles | 138 (26.1%) | 56 (11.1%) |
| 3 Vehicles | 17 (3.2%) | 139 (27.6%) |
| 4 Vehicles | 93 (17.6%) | 169 (33.5%) |
| 5 or more Vehicles | 0 (0.0%) | 0 (0.0%) |
| Total | 529 (100.0%) | 504 (100.0%) |
Commute Time in Comerio
The most frequently occuring commute durations in Comerio are 45 to 59 minutes (377 commuters, 36.5%), 60 to 89 minutes (192 commuters, 18.6%), and 10 to 14 minutes (148 commuters, 14.3%).
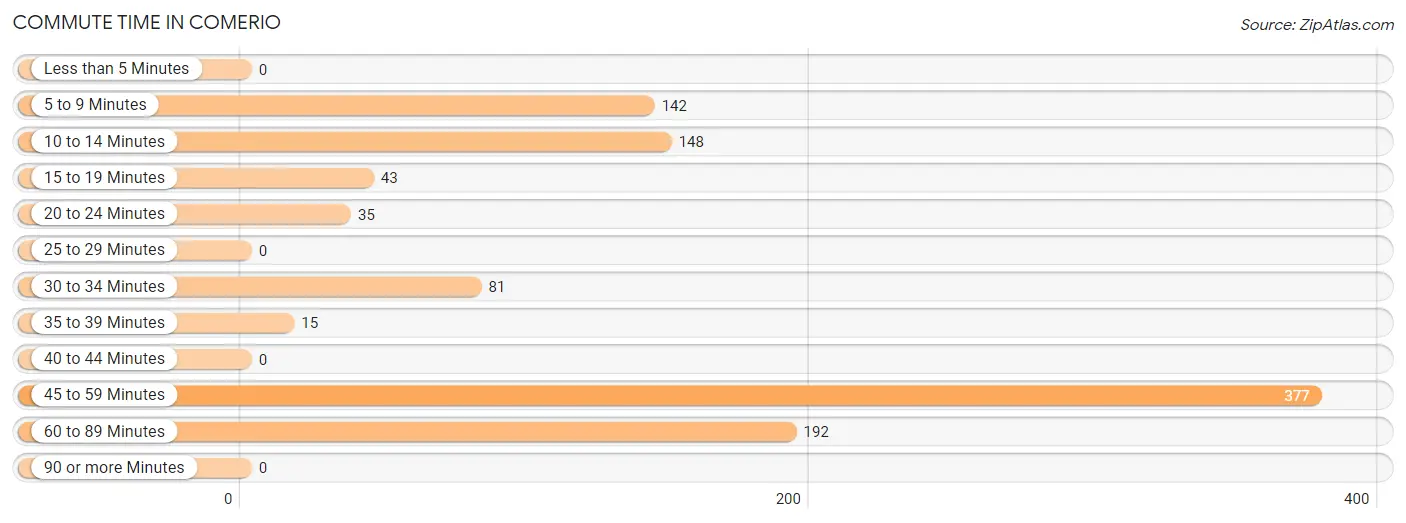
| Commute Time | # Commuters | % Commuters |
| Less than 5 Minutes | 0 | 0.0% |
| 5 to 9 Minutes | 142 | 13.8% |
| 10 to 14 Minutes | 148 | 14.3% |
| 15 to 19 Minutes | 43 | 4.2% |
| 20 to 24 Minutes | 35 | 3.4% |
| 25 to 29 Minutes | 0 | 0.0% |
| 30 to 34 Minutes | 81 | 7.8% |
| 35 to 39 Minutes | 15 | 1.5% |
| 40 to 44 Minutes | 0 | 0.0% |
| 45 to 59 Minutes | 377 | 36.5% |
| 60 to 89 Minutes | 192 | 18.6% |
| 90 or more Minutes | 0 | 0.0% |
Commute Time by Sex in Comerio
The most common commute times in Comerio are 45 to 59 minutes (203 commuters, 38.4%) for males and 45 to 59 minutes (174 commuters, 34.5%) for females.
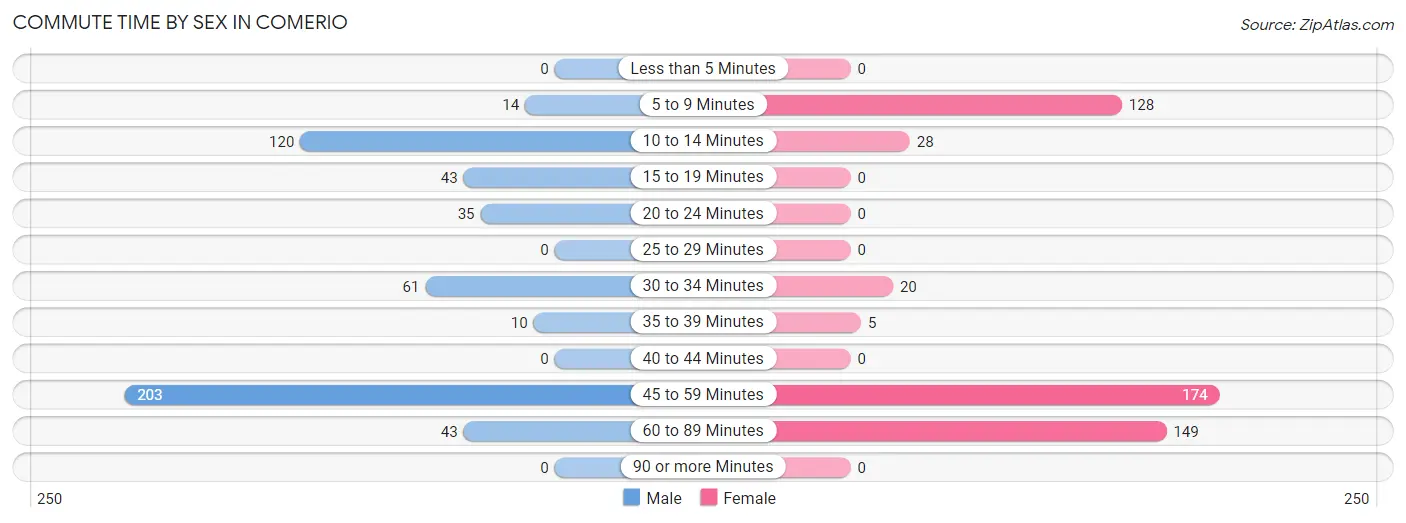
| Commute Time | Male | Female |
| Less than 5 Minutes | 0 (0.0%) | 0 (0.0%) |
| 5 to 9 Minutes | 14 (2.6%) | 128 (25.4%) |
| 10 to 14 Minutes | 120 (22.7%) | 28 (5.6%) |
| 15 to 19 Minutes | 43 (8.1%) | 0 (0.0%) |
| 20 to 24 Minutes | 35 (6.6%) | 0 (0.0%) |
| 25 to 29 Minutes | 0 (0.0%) | 0 (0.0%) |
| 30 to 34 Minutes | 61 (11.5%) | 20 (4.0%) |
| 35 to 39 Minutes | 10 (1.9%) | 5 (1.0%) |
| 40 to 44 Minutes | 0 (0.0%) | 0 (0.0%) |
| 45 to 59 Minutes | 203 (38.4%) | 174 (34.5%) |
| 60 to 89 Minutes | 43 (8.1%) | 149 (29.6%) |
| 90 or more Minutes | 0 (0.0%) | 0 (0.0%) |
Time of Departure to Work by Sex in Comerio
The most frequent times of departure to work in Comerio are 6:00 AM to 6:29 AM (207, 39.1%) for males and 6:00 AM to 6:29 AM (289, 57.3%) for females.
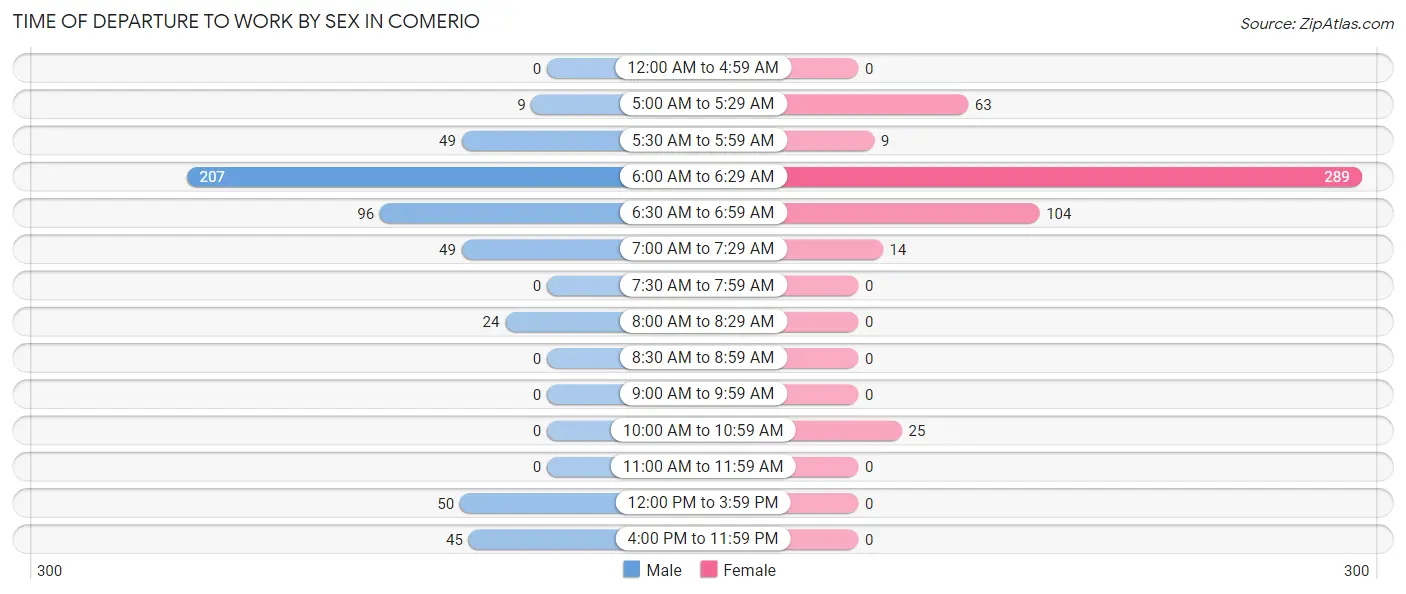
| Time of Departure | Male | Female |
| 12:00 AM to 4:59 AM | 0 (0.0%) | 0 (0.0%) |
| 5:00 AM to 5:29 AM | 9 (1.7%) | 63 (12.5%) |
| 5:30 AM to 5:59 AM | 49 (9.3%) | 9 (1.8%) |
| 6:00 AM to 6:29 AM | 207 (39.1%) | 289 (57.3%) |
| 6:30 AM to 6:59 AM | 96 (18.1%) | 104 (20.6%) |
| 7:00 AM to 7:29 AM | 49 (9.3%) | 14 (2.8%) |
| 7:30 AM to 7:59 AM | 0 (0.0%) | 0 (0.0%) |
| 8:00 AM to 8:29 AM | 24 (4.5%) | 0 (0.0%) |
| 8:30 AM to 8:59 AM | 0 (0.0%) | 0 (0.0%) |
| 9:00 AM to 9:59 AM | 0 (0.0%) | 0 (0.0%) |
| 10:00 AM to 10:59 AM | 0 (0.0%) | 25 (5.0%) |
| 11:00 AM to 11:59 AM | 0 (0.0%) | 0 (0.0%) |
| 12:00 PM to 3:59 PM | 50 (9.5%) | 0 (0.0%) |
| 4:00 PM to 11:59 PM | 45 (8.5%) | 0 (0.0%) |
| Total | 529 (100.0%) | 504 (100.0%) |
Housing Occupancy in Comerio
Occupancy by Ownership in Comerio
Of the total 983 dwellings in Comerio, owner-occupied units account for 368 (37.4%), while renter-occupied units make up 615 (62.6%).
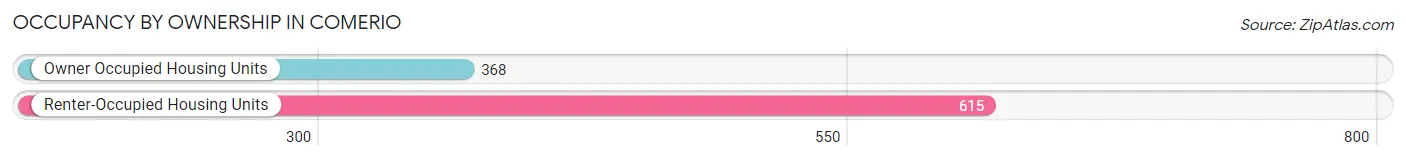
| Occupancy | # Housing Units | % Housing Units |
| Owner Occupied Housing Units | 368 | 37.4% |
| Renter-Occupied Housing Units | 615 | 62.6% |
| Total Occupied Housing Units | 983 | 100.0% |
Occupancy by Household Size in Comerio
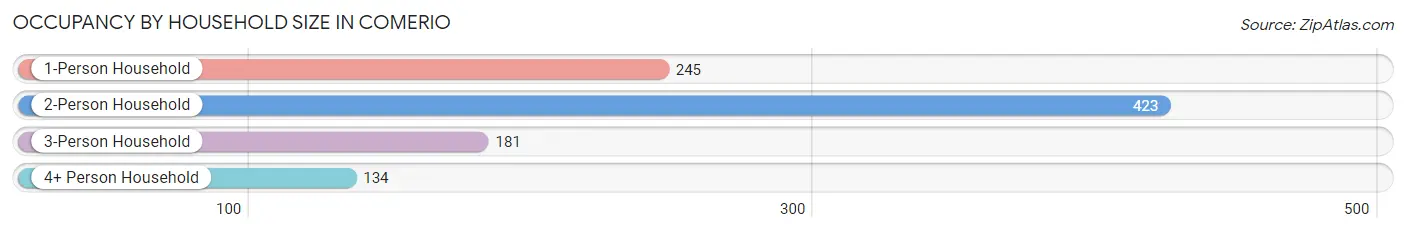
| Household Size | # Housing Units | % Housing Units |
| 1-Person Household | 245 | 24.9% |
| 2-Person Household | 423 | 43.0% |
| 3-Person Household | 181 | 18.4% |
| 4+ Person Household | 134 | 13.6% |
| Total Housing Units | 983 | 100.0% |
Occupancy by Ownership by Household Size in Comerio
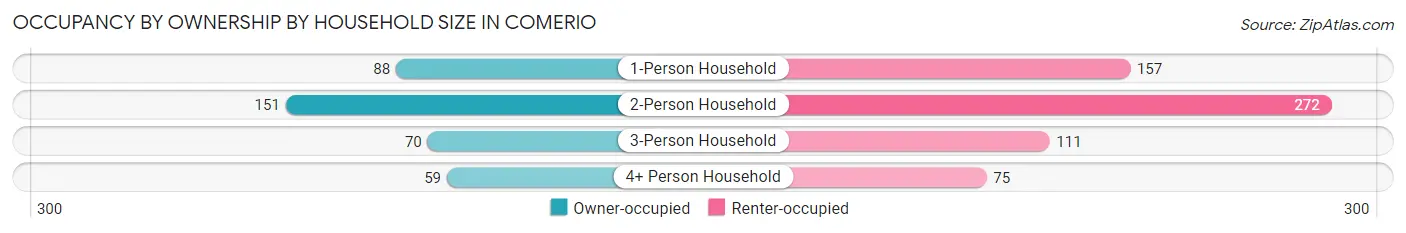
| Household Size | Owner-occupied | Renter-occupied |
| 1-Person Household | 88 (35.9%) | 157 (64.1%) |
| 2-Person Household | 151 (35.7%) | 272 (64.3%) |
| 3-Person Household | 70 (38.7%) | 111 (61.3%) |
| 4+ Person Household | 59 (44.0%) | 75 (56.0%) |
| Total Housing Units | 368 (37.4%) | 615 (62.6%) |
Occupancy by Educational Attainment in Comerio
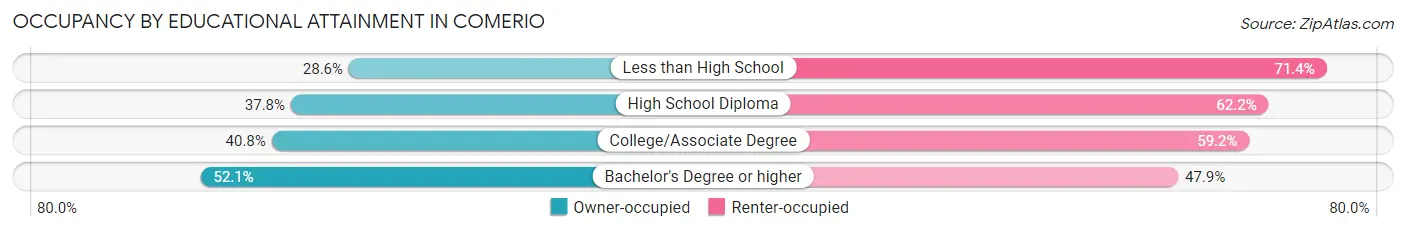
| Household Size | Owner-occupied | Renter-occupied |
| Less than High School | 92 (28.6%) | 230 (71.4%) |
| High School Diploma | 122 (37.8%) | 201 (62.2%) |
| College/Associate Degree | 80 (40.8%) | 116 (59.2%) |
| Bachelor's Degree or higher | 74 (52.1%) | 68 (47.9%) |
Occupancy by Age of Householder in Comerio
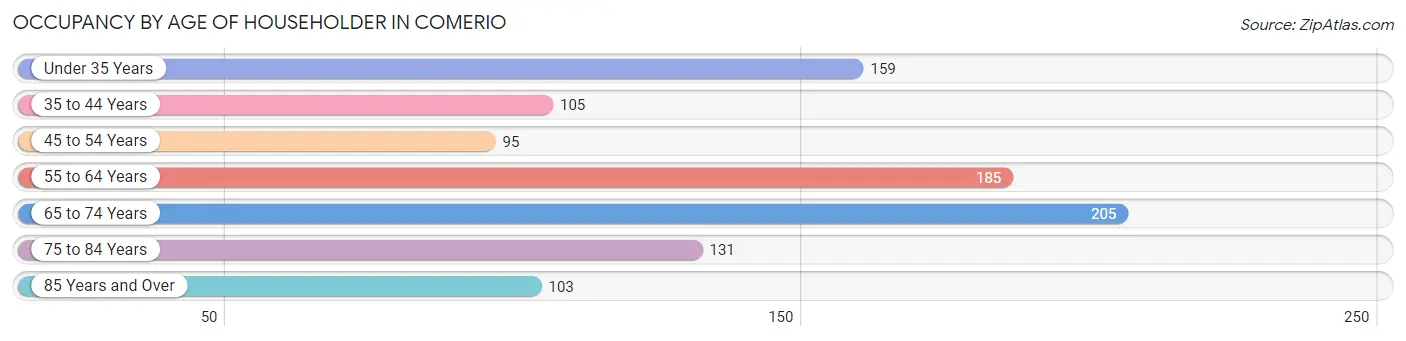
| Age Bracket | # Households | % Households |
| Under 35 Years | 159 | 16.2% |
| 35 to 44 Years | 105 | 10.7% |
| 45 to 54 Years | 95 | 9.7% |
| 55 to 64 Years | 185 | 18.8% |
| 65 to 74 Years | 205 | 20.8% |
| 75 to 84 Years | 131 | 13.3% |
| 85 Years and Over | 103 | 10.5% |
| Total | 983 | 100.0% |
Housing Finances in Comerio
Median Income by Occupancy in Comerio
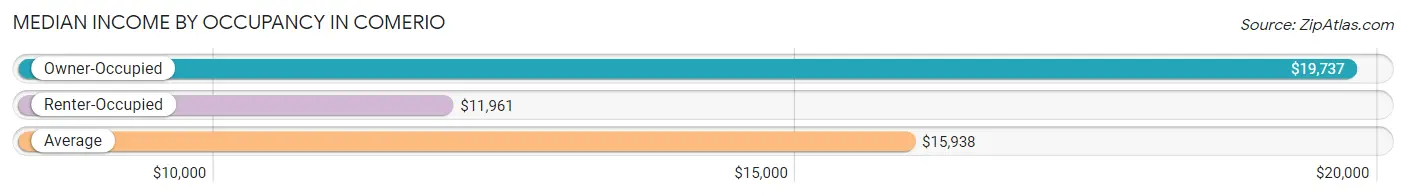
| Occupancy Type | # Households | Median Income |
| Owner-Occupied | 368 (37.4%) | $19,737 |
| Renter-Occupied | 615 (62.6%) | $11,961 |
| Average | 983 (100.0%) | $15,938 |
Occupancy by Householder Income Bracket in Comerio
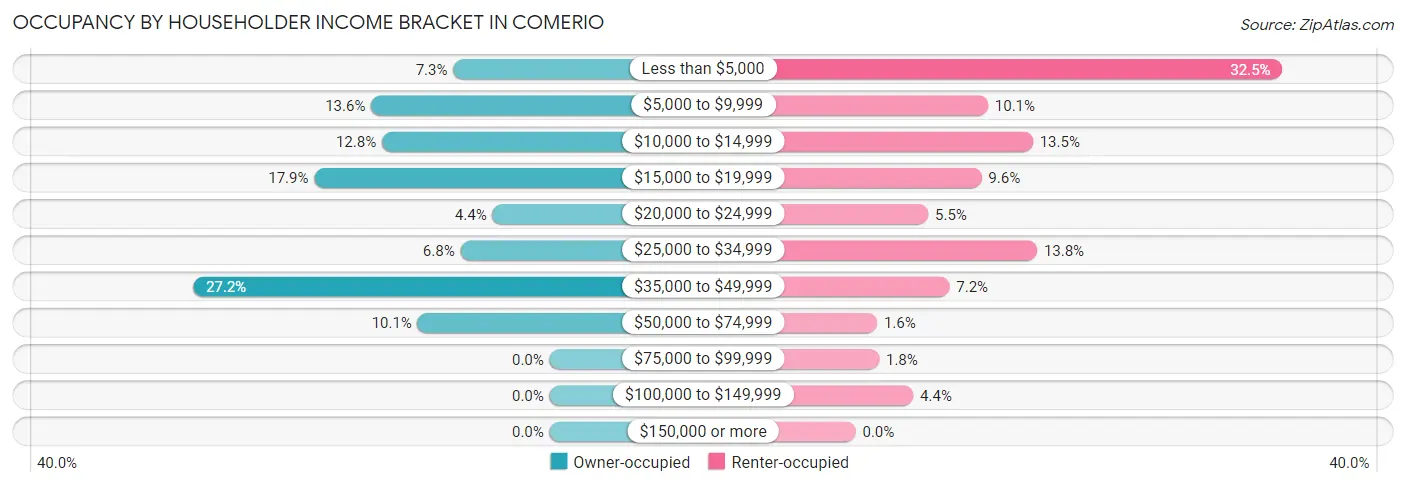
| Income Bracket | Owner-occupied | Renter-occupied |
| Less than $5,000 | 27 (7.3%) | 200 (32.5%) |
| $5,000 to $9,999 | 50 (13.6%) | 62 (10.1%) |
| $10,000 to $14,999 | 47 (12.8%) | 83 (13.5%) |
| $15,000 to $19,999 | 66 (17.9%) | 59 (9.6%) |
| $20,000 to $24,999 | 16 (4.3%) | 34 (5.5%) |
| $25,000 to $34,999 | 25 (6.8%) | 85 (13.8%) |
| $35,000 to $49,999 | 100 (27.2%) | 44 (7.1%) |
| $50,000 to $74,999 | 37 (10.1%) | 10 (1.6%) |
| $75,000 to $99,999 | 0 (0.0%) | 11 (1.8%) |
| $100,000 to $149,999 | 0 (0.0%) | 27 (4.4%) |
| $150,000 or more | 0 (0.0%) | 0 (0.0%) |
| Total | 368 (100.0%) | 615 (100.0%) |
Monthly Housing Cost Tiers in Comerio
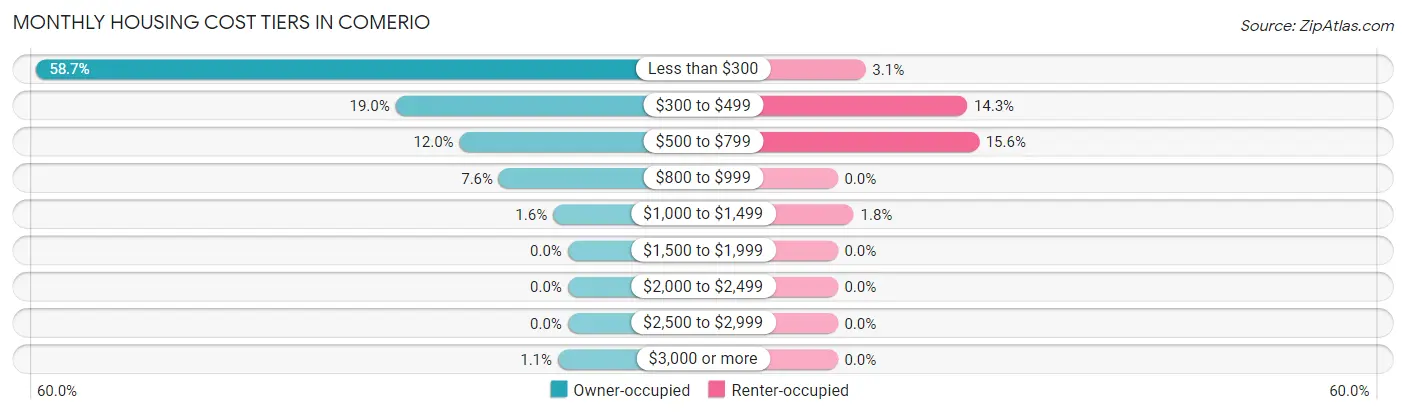
| Monthly Cost | Owner-occupied | Renter-occupied |
| Less than $300 | 216 (58.7%) | 19 (3.1%) |
| $300 to $499 | 70 (19.0%) | 88 (14.3%) |
| $500 to $799 | 44 (12.0%) | 96 (15.6%) |
| $800 to $999 | 28 (7.6%) | 0 (0.0%) |
| $1,000 to $1,499 | 6 (1.6%) | 11 (1.8%) |
| $1,500 to $1,999 | 0 (0.0%) | 0 (0.0%) |
| $2,000 to $2,499 | 0 (0.0%) | 0 (0.0%) |
| $2,500 to $2,999 | 0 (0.0%) | 0 (0.0%) |
| $3,000 or more | 4 (1.1%) | 0 (0.0%) |
| Total | 368 (100.0%) | 615 (100.0%) |
Physical Housing Characteristics in Comerio
Housing Structures in Comerio
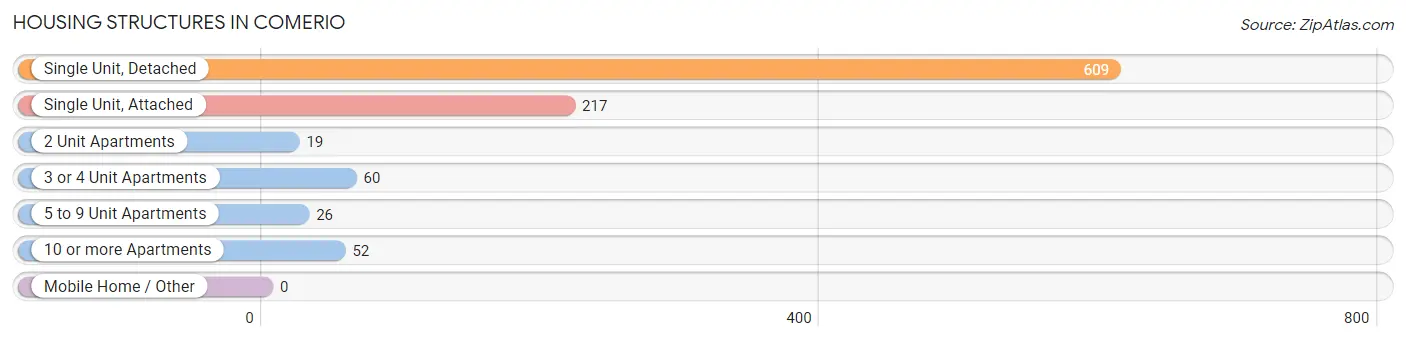
| Structure Type | # Housing Units | % Housing Units |
| Single Unit, Detached | 609 | 62.0% |
| Single Unit, Attached | 217 | 22.1% |
| 2 Unit Apartments | 19 | 1.9% |
| 3 or 4 Unit Apartments | 60 | 6.1% |
| 5 to 9 Unit Apartments | 26 | 2.6% |
| 10 or more Apartments | 52 | 5.3% |
| Mobile Home / Other | 0 | 0.0% |
| Total | 983 | 100.0% |
Housing Structures by Occupancy in Comerio
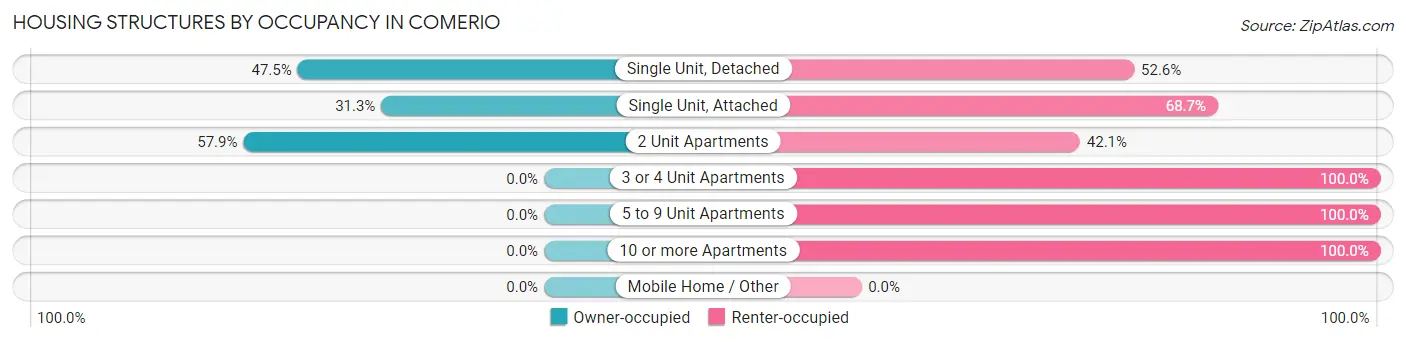
| Structure Type | Owner-occupied | Renter-occupied |
| Single Unit, Detached | 289 (47.4%) | 320 (52.5%) |
| Single Unit, Attached | 68 (31.3%) | 149 (68.7%) |
| 2 Unit Apartments | 11 (57.9%) | 8 (42.1%) |
| 3 or 4 Unit Apartments | 0 (0.0%) | 60 (100.0%) |
| 5 to 9 Unit Apartments | 0 (0.0%) | 26 (100.0%) |
| 10 or more Apartments | 0 (0.0%) | 52 (100.0%) |
| Mobile Home / Other | 0 (0.0%) | 0 (0.0%) |
| Total | 368 (37.4%) | 615 (62.6%) |
Housing Structures by Number of Rooms in Comerio
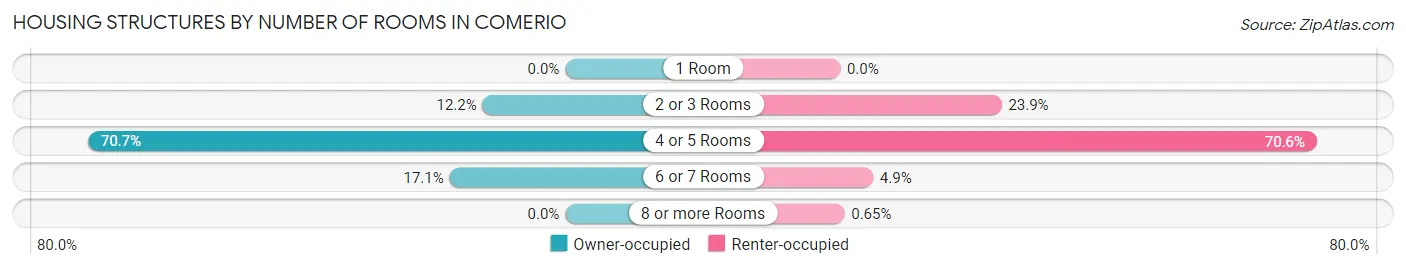
| Number of Rooms | Owner-occupied | Renter-occupied |
| 1 Room | 0 (0.0%) | 0 (0.0%) |
| 2 or 3 Rooms | 45 (12.2%) | 147 (23.9%) |
| 4 or 5 Rooms | 260 (70.7%) | 434 (70.6%) |
| 6 or 7 Rooms | 63 (17.1%) | 30 (4.9%) |
| 8 or more Rooms | 0 (0.0%) | 4 (0.6%) |
| Total | 368 (100.0%) | 615 (100.0%) |
Housing Structure by Heating Type in Comerio
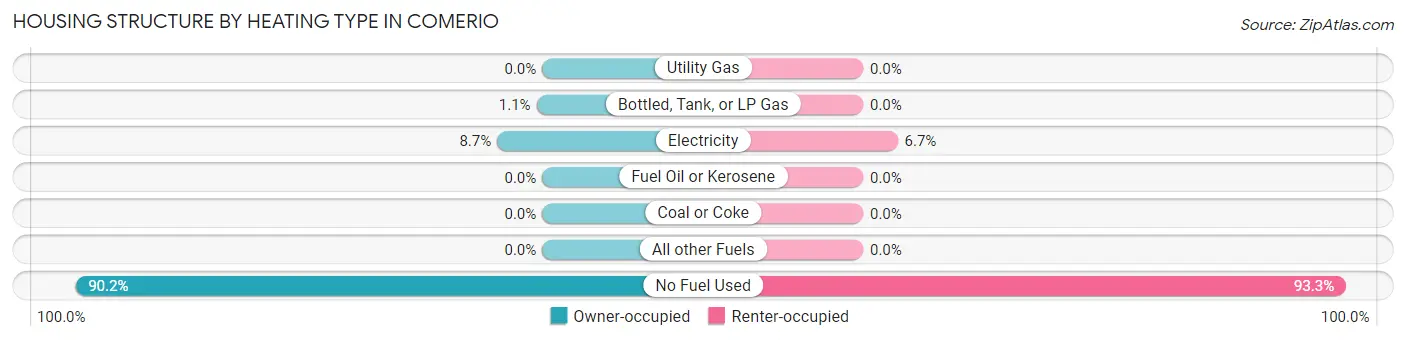
| Heating Type | Owner-occupied | Renter-occupied |
| Utility Gas | 0 (0.0%) | 0 (0.0%) |
| Bottled, Tank, or LP Gas | 4 (1.1%) | 0 (0.0%) |
| Electricity | 32 (8.7%) | 41 (6.7%) |
| Fuel Oil or Kerosene | 0 (0.0%) | 0 (0.0%) |
| Coal or Coke | 0 (0.0%) | 0 (0.0%) |
| All other Fuels | 0 (0.0%) | 0 (0.0%) |
| No Fuel Used | 332 (90.2%) | 574 (93.3%) |
| Total | 368 (100.0%) | 615 (100.0%) |
Household Vehicle Usage in Comerio
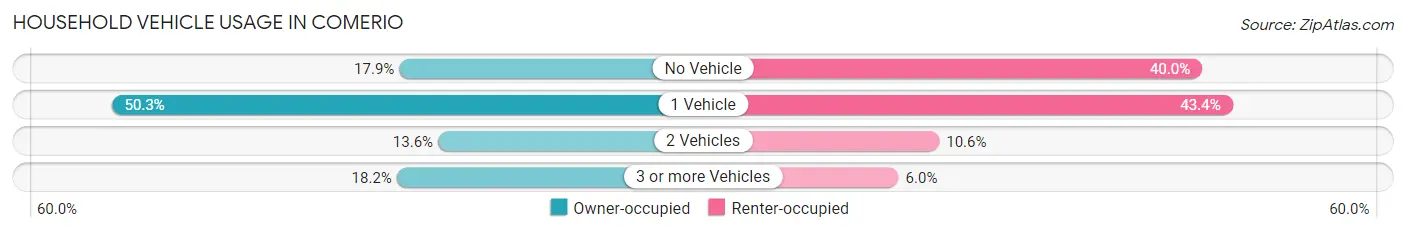
| Vehicles per Household | Owner-occupied | Renter-occupied |
| No Vehicle | 66 (17.9%) | 246 (40.0%) |
| 1 Vehicle | 185 (50.3%) | 267 (43.4%) |
| 2 Vehicles | 50 (13.6%) | 65 (10.6%) |
| 3 or more Vehicles | 67 (18.2%) | 37 (6.0%) |
| Total | 368 (100.0%) | 615 (100.0%) |
Real Estate & Mortgages in Comerio
Real Estate and Mortgage Overview in Comerio
| Characteristic | Without Mortgage | With Mortgage |
| Housing Units | 266 | 102 |
| Median Property Value | $87,000 | $152,400 |
| Median Household Income | $18,430 | $0 |
| Monthly Housing Costs | $172 | $4 |
| Real Estate Taxes | - | - |
Property Value by Mortgage Status in Comerio
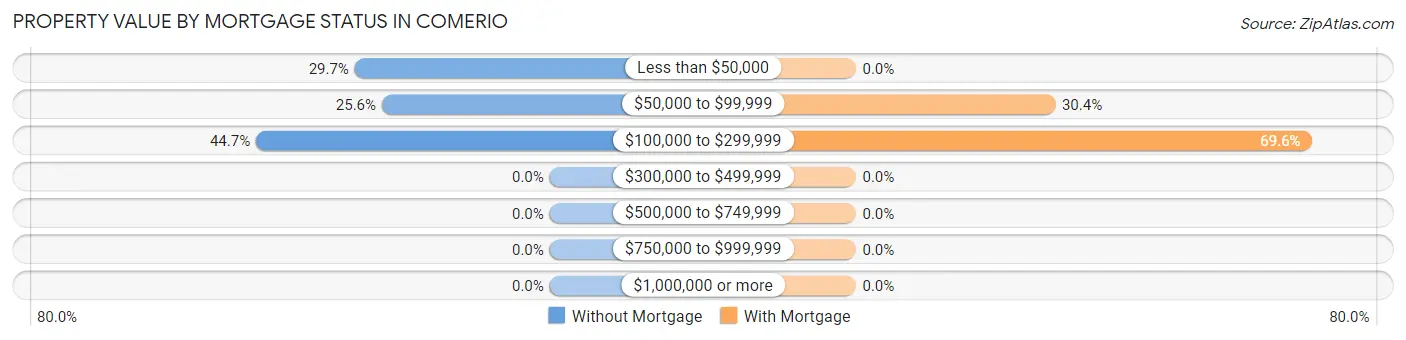
| Property Value | Without Mortgage | With Mortgage |
| Less than $50,000 | 79 (29.7%) | 0 (0.0%) |
| $50,000 to $99,999 | 68 (25.6%) | 31 (30.4%) |
| $100,000 to $299,999 | 119 (44.7%) | 71 (69.6%) |
| $300,000 to $499,999 | 0 (0.0%) | 0 (0.0%) |
| $500,000 to $749,999 | 0 (0.0%) | 0 (0.0%) |
| $750,000 to $999,999 | 0 (0.0%) | 0 (0.0%) |
| $1,000,000 or more | 0 (0.0%) | 0 (0.0%) |
| Total | 266 (100.0%) | 102 (100.0%) |
Household Income by Mortgage Status in Comerio
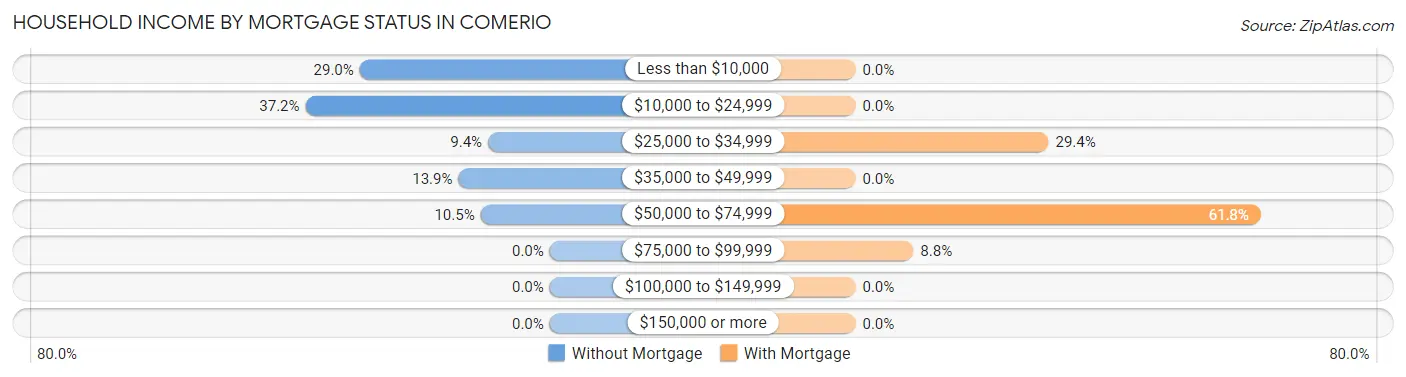
| Household Income | Without Mortgage | With Mortgage |
| Less than $10,000 | 77 (28.9%) | 0 (0.0%) |
| $10,000 to $24,999 | 99 (37.2%) | 0 (0.0%) |
| $25,000 to $34,999 | 25 (9.4%) | 30 (29.4%) |
| $35,000 to $49,999 | 37 (13.9%) | 0 (0.0%) |
| $50,000 to $74,999 | 28 (10.5%) | 63 (61.8%) |
| $75,000 to $99,999 | 0 (0.0%) | 9 (8.8%) |
| $100,000 to $149,999 | 0 (0.0%) | 0 (0.0%) |
| $150,000 or more | 0 (0.0%) | 0 (0.0%) |
| Total | 266 (100.0%) | 102 (100.0%) |
Property Value to Household Income Ratio in Comerio
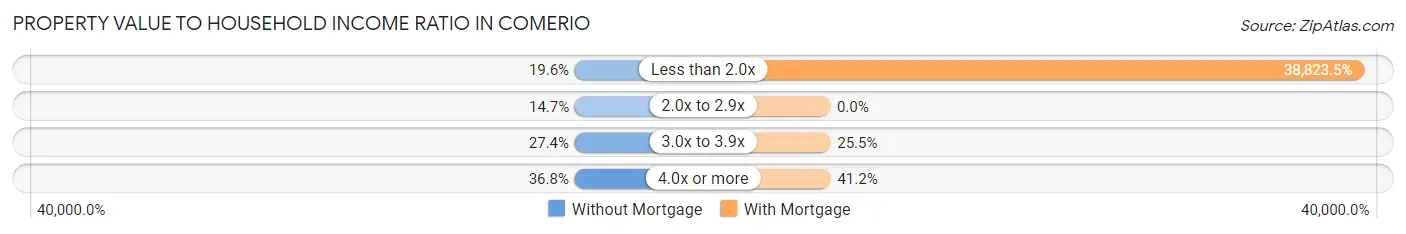
| Value-to-Income Ratio | Without Mortgage | With Mortgage |
| Less than 2.0x | 52 (19.6%) | 39,600 (38,823.5%) |
| 2.0x to 2.9x | 39 (14.7%) | 0 (0.0%) |
| 3.0x to 3.9x | 73 (27.4%) | 26 (25.5%) |
| 4.0x or more | 98 (36.8%) | 42 (41.2%) |
| Total | 266 (100.0%) | 102 (100.0%) |
Real Estate Taxes by Mortgage Status in Comerio
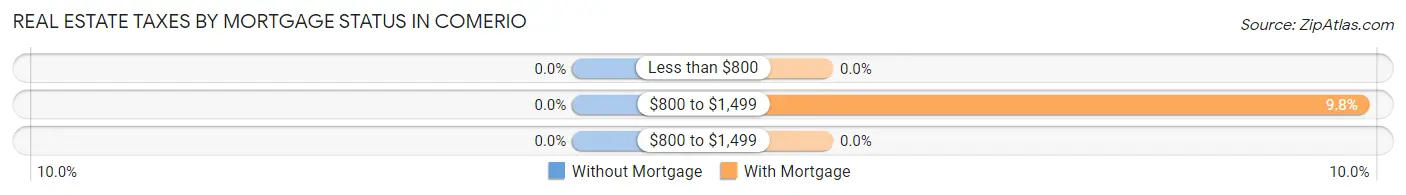
| Property Taxes | Without Mortgage | With Mortgage |
| Less than $800 | 0 (0.0%) | 0 (0.0%) |
| $800 to $1,499 | 0 (0.0%) | 10 (9.8%) |
| $800 to $1,499 | 0 (0.0%) | 0 (0.0%) |
| Total | 266 (100.0%) | 102 (100.0%) |
Health & Disability in Comerio
Health Insurance Coverage by Age in Comerio
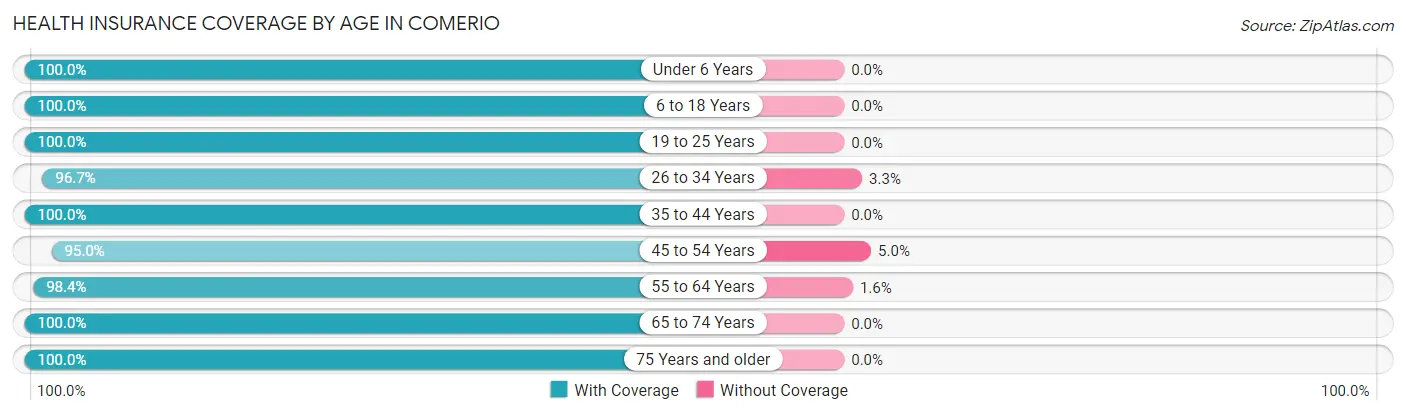
| Age Bracket | With Coverage | Without Coverage |
| Under 6 Years | 283 (100.0%) | 0 (0.0%) |
| 6 to 18 Years | 562 (100.0%) | 0 (0.0%) |
| 19 to 25 Years | 201 (100.0%) | 0 (0.0%) |
| 26 to 34 Years | 552 (96.7%) | 19 (3.3%) |
| 35 to 44 Years | 305 (100.0%) | 0 (0.0%) |
| 45 to 54 Years | 322 (95.0%) | 17 (5.0%) |
| 55 to 64 Years | 488 (98.4%) | 8 (1.6%) |
| 65 to 74 Years | 458 (100.0%) | 0 (0.0%) |
| 75 Years and older | 430 (100.0%) | 0 (0.0%) |
| Total | 3,601 (98.8%) | 44 (1.2%) |
Health Insurance Coverage by Citizenship Status in Comerio
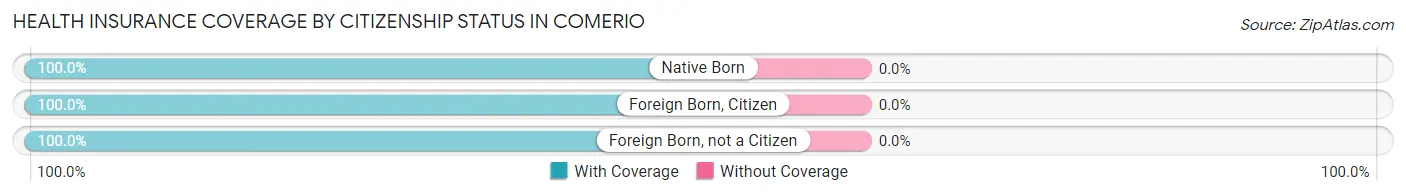
| Citizenship Status | With Coverage | Without Coverage |
| Native Born | 283 (100.0%) | 0 (0.0%) |
| Foreign Born, Citizen | 562 (100.0%) | 0 (0.0%) |
| Foreign Born, not a Citizen | 201 (100.0%) | 0 (0.0%) |
Health Insurance Coverage by Household Income in Comerio
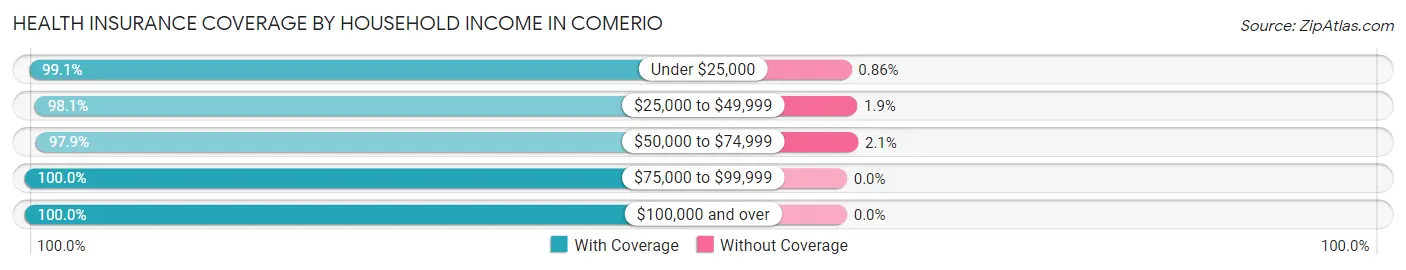
| Household Income | With Coverage | Without Coverage |
| Under $25,000 | 2,202 (99.1%) | 19 (0.9%) |
| $25,000 to $49,999 | 864 (98.1%) | 17 (1.9%) |
| $50,000 to $74,999 | 372 (97.9%) | 8 (2.1%) |
| $75,000 to $99,999 | 23 (100.0%) | 0 (0.0%) |
| $100,000 and over | 140 (100.0%) | 0 (0.0%) |
Public vs Private Health Insurance Coverage by Age in Comerio
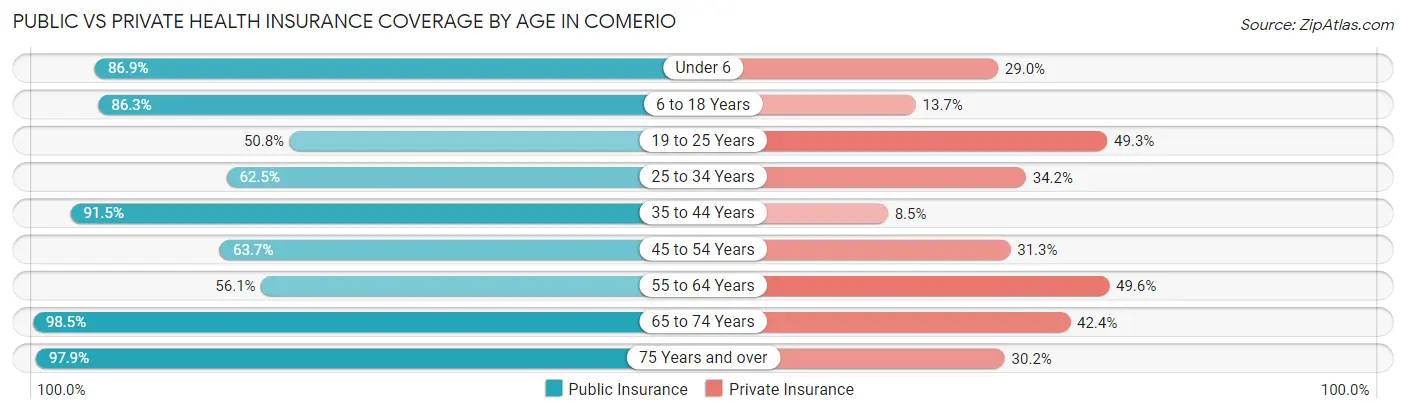
| Age Bracket | Public Insurance | Private Insurance |
| Under 6 | 246 (86.9%) | 82 (29.0%) |
| 6 to 18 Years | 485 (86.3%) | 77 (13.7%) |
| 19 to 25 Years | 102 (50.7%) | 99 (49.2%) |
| 25 to 34 Years | 357 (62.5%) | 195 (34.2%) |
| 35 to 44 Years | 279 (91.5%) | 26 (8.5%) |
| 45 to 54 Years | 216 (63.7%) | 106 (31.3%) |
| 55 to 64 Years | 278 (56.0%) | 246 (49.6%) |
| 65 to 74 Years | 451 (98.5%) | 194 (42.4%) |
| 75 Years and over | 421 (97.9%) | 130 (30.2%) |
| Total | 2,835 (77.8%) | 1,155 (31.7%) |
Disability Status by Sex by Age in Comerio
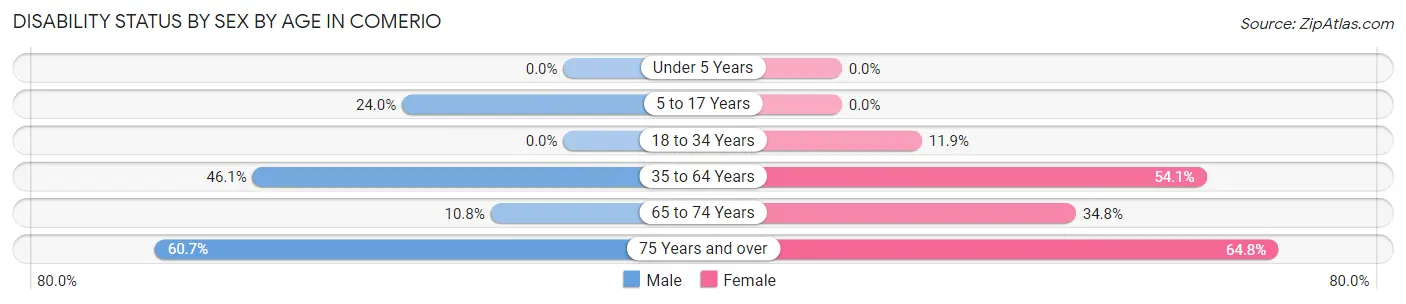
| Age Bracket | Male | Female |
| Under 5 Years | 0 (0.0%) | 0 (0.0%) |
| 5 to 17 Years | 74 (23.9%) | 0 (0.0%) |
| 18 to 34 Years | 0 (0.0%) | 63 (11.9%) |
| 35 to 64 Years | 197 (46.1%) | 386 (54.1%) |
| 65 to 74 Years | 24 (10.8%) | 82 (34.7%) |
| 75 Years and over | 111 (60.7%) | 160 (64.8%) |
Disability Class by Sex by Age in Comerio
Disability Class: Hearing Difficulty
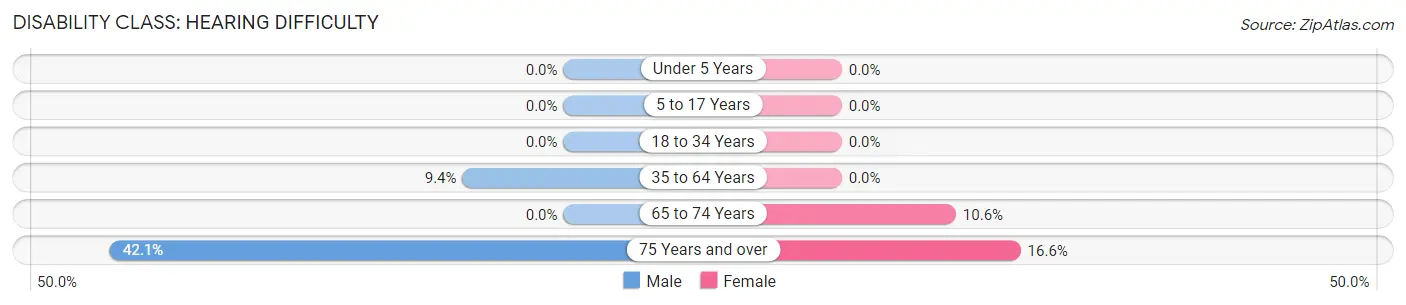
| Age Bracket | Male | Female |
| Under 5 Years | 0 (0.0%) | 0 (0.0%) |
| 5 to 17 Years | 0 (0.0%) | 0 (0.0%) |
| 18 to 34 Years | 0 (0.0%) | 0 (0.0%) |
| 35 to 64 Years | 40 (9.4%) | 0 (0.0%) |
| 65 to 74 Years | 0 (0.0%) | 25 (10.6%) |
| 75 Years and over | 77 (42.1%) | 41 (16.6%) |
Disability Class: Vision Difficulty
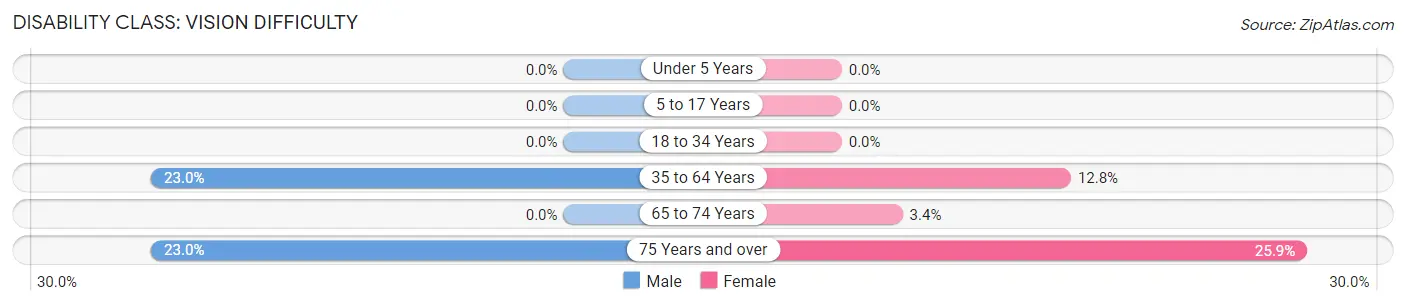
| Age Bracket | Male | Female |
| Under 5 Years | 0 (0.0%) | 0 (0.0%) |
| 5 to 17 Years | 0 (0.0%) | 0 (0.0%) |
| 18 to 34 Years | 0 (0.0%) | 0 (0.0%) |
| 35 to 64 Years | 98 (23.0%) | 91 (12.8%) |
| 65 to 74 Years | 0 (0.0%) | 8 (3.4%) |
| 75 Years and over | 42 (23.0%) | 64 (25.9%) |
Disability Class: Cognitive Difficulty
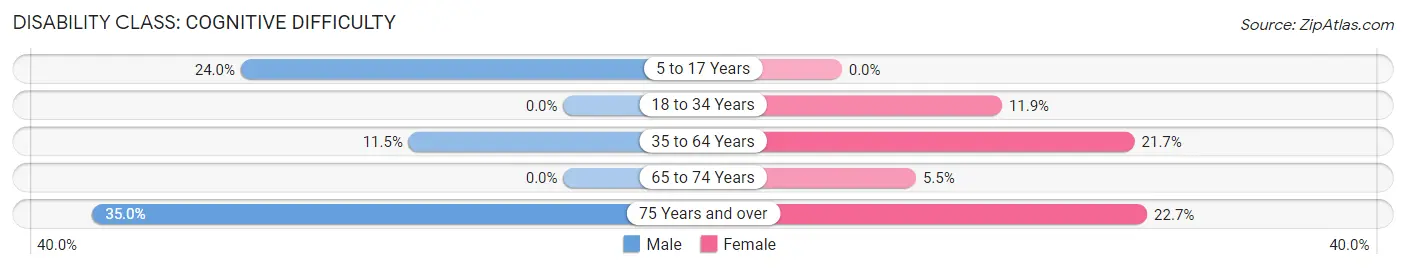
| Age Bracket | Male | Female |
| 5 to 17 Years | 74 (23.9%) | 0 (0.0%) |
| 18 to 34 Years | 0 (0.0%) | 63 (11.9%) |
| 35 to 64 Years | 49 (11.5%) | 155 (21.7%) |
| 65 to 74 Years | 0 (0.0%) | 13 (5.5%) |
| 75 Years and over | 64 (35.0%) | 56 (22.7%) |
Disability Class: Ambulatory Difficulty
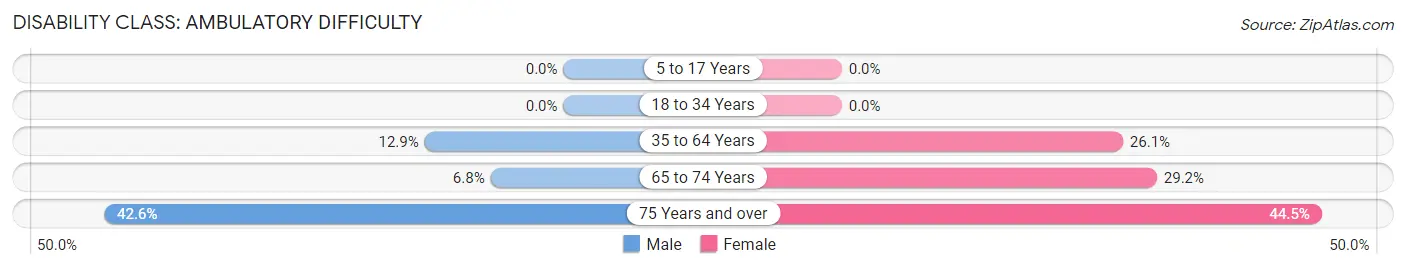
| Age Bracket | Male | Female |
| 5 to 17 Years | 0 (0.0%) | 0 (0.0%) |
| 18 to 34 Years | 0 (0.0%) | 0 (0.0%) |
| 35 to 64 Years | 55 (12.9%) | 186 (26.1%) |
| 65 to 74 Years | 15 (6.8%) | 69 (29.2%) |
| 75 Years and over | 78 (42.6%) | 110 (44.5%) |
Disability Class: Self-Care Difficulty
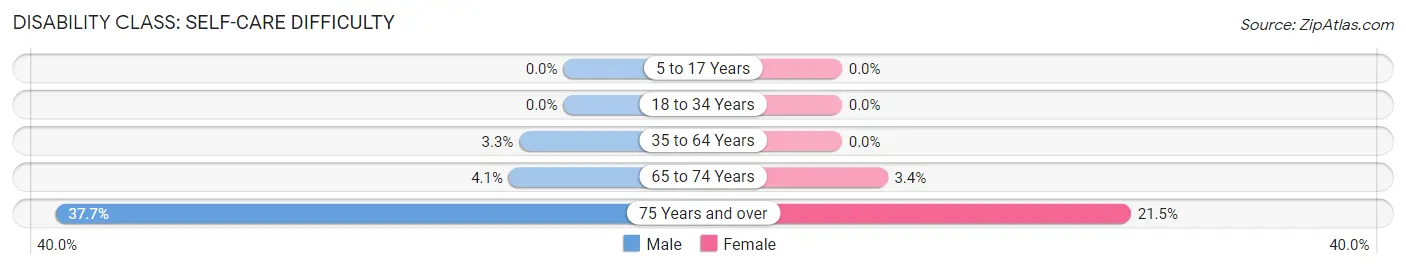
| Age Bracket | Male | Female |
| 5 to 17 Years | 0 (0.0%) | 0 (0.0%) |
| 18 to 34 Years | 0 (0.0%) | 0 (0.0%) |
| 35 to 64 Years | 14 (3.3%) | 0 (0.0%) |
| 65 to 74 Years | 9 (4.1%) | 8 (3.4%) |
| 75 Years and over | 69 (37.7%) | 53 (21.5%) |
Technology Access in Comerio
Computing Device Access in Comerio
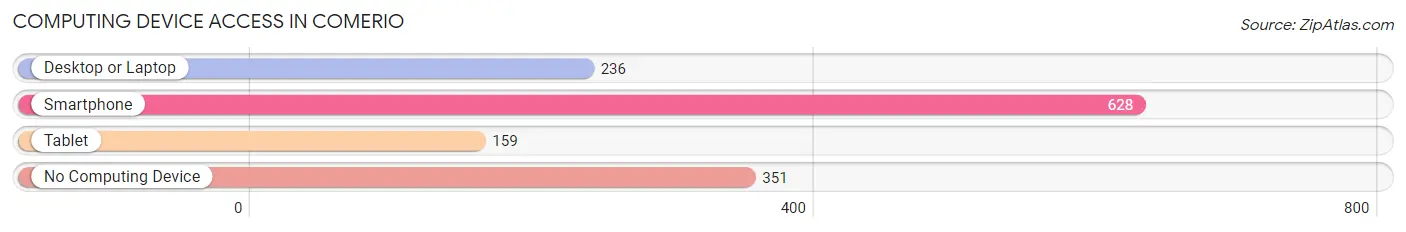
| Device Type | # Households | % Households |
| Desktop or Laptop | 236 | 24.0% |
| Smartphone | 628 | 63.9% |
| Tablet | 159 | 16.2% |
| No Computing Device | 351 | 35.7% |
| Total | 983 | 100.0% |
Internet Access in Comerio
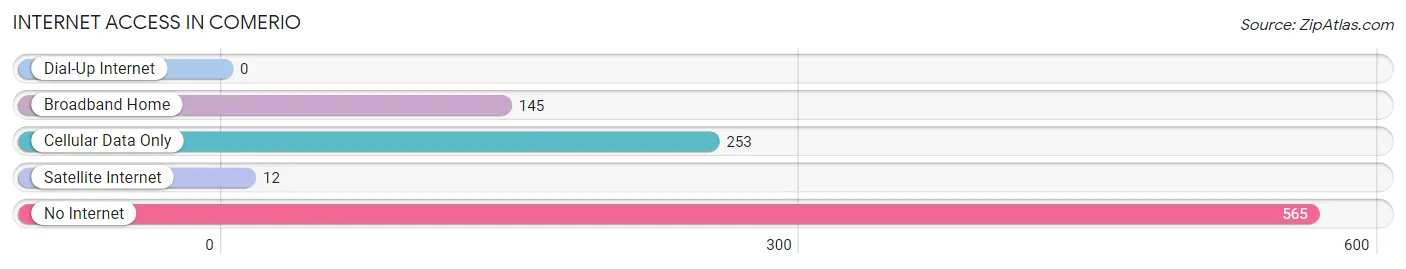
| Internet Type | # Households | % Households |
| Dial-Up Internet | 0 | 0.0% |
| Broadband Home | 145 | 14.7% |
| Cellular Data Only | 253 | 25.7% |
| Satellite Internet | 12 | 1.2% |
| No Internet | 565 | 57.5% |
| Total | 983 | 100.0% |
Comerio Summary
Comerio is a municipality located in the central region of Puerto Rico. It is part of the San Juan-Caguas-Guaynabo Metropolitan Statistical Area. As of the 2010 census, the population of Comerio was 24,818.
History
Comerio was founded in 1815 by Don Juan de la Cruz. The name of the town is derived from the Taino word “Komeryo”, which means “place of the wild boar”. The town was originally part of the municipality of Bayamon, but it was established as an independent municipality in 1825.
During the 19th century, Comerio was an important agricultural center, producing coffee, sugar cane, and tobacco. The town was also known for its production of hats, which were made from the straw of the local sugar cane fields.
Geography
Comerio is located in the central region of Puerto Rico, about 20 miles west of San Juan. It is bordered by the municipalities of Naranjito to the north, Bayamon to the east, and Toa Alta to the south. The town covers an area of approximately 24 square miles.
The terrain of Comerio is mostly flat, with some hills in the northern part of the municipality. The highest point in the town is Cerro de la Cruz, which has an elevation of 1,065 feet.
Climate
Comerio has a tropical climate, with temperatures ranging from the mid-70s to the mid-80s throughout the year. The town receives an average of about 60 inches of rain per year.
Economy
Comerio’s economy is largely based on agriculture. The town is known for its production of coffee, sugar cane, and tobacco. Other crops grown in the area include bananas, plantains, and yams.
The town also has a small manufacturing sector which produces clothing furniture and other goods
Demographics
As of the 2010 census, the population of Comerio was 24,818. The population is mostly of Puerto Rican descent, with a small percentage of African and European ancestry. The median household income in the town is $17,845, and the poverty rate is 44.3%.
The majority of the population is Roman Catholic, with a small percentage of Protestants. Spanish is the primary language spoken in Comerio, although English is also spoken by some of the residents.
Common Questions
What is Per Capita Income in Comerio?
Per Capita income in Comerio is $10,046.
What is the Median Family Income in Comerio?
Median Family Income in Comerio is $18,479.
What is the Median Household income in Comerio?
Median Household Income in Comerio is $15,938.
What is Income or Wage Gap in Comerio?
Income or Wage Gap in Comerio is 16.3%.
Women in Comerio earn 83.7 cents for every dollar earned by a man.
What is Family Income Deficit in Comerio?
Family Income Deficit in Comerio is $12,782.
Families that are below poverty line in Comerio earn $12,782 less on average than the poverty threshold level.
What is Inequality or Gini Index in Comerio?
Inequality or Gini Index in Comerio is 0.53.
What is the Total Population of Comerio?
Total Population of Comerio is 3,656.
What is the Total Male Population of Comerio?
Total Male Population of Comerio is 1,603.
What is the Total Female Population of Comerio?
Total Female Population of Comerio is 2,053.
What is the Ratio of Males per 100 Females in Comerio?
There are 78.08 Males per 100 Females in Comerio.
What is the Ratio of Females per 100 Males in Comerio?
There are 128.07 Females per 100 Males in Comerio.
What is the Median Population Age in Comerio?
Median Population Age in Comerio is 40.3 Years.
What is the Average Family Size in Comerio
Average Family Size in Comerio is 4.7 People.
What is the Average Household Size in Comerio
Average Household Size in Comerio is 3.7 People.
How Large is the Labor Force in Comerio?
There are 1,283 People in the Labor Forcein in Comerio.
What is the Percentage of People in the Labor Force in Comerio?
44.1% of People are in the Labor Force in Comerio.
What is the Unemployment Rate in Comerio?
Unemployment Rate in Comerio is 19.6%.