Coco, PR Map & Demographics
Coco Map
Coco Overview
$9,328
PER CAPITA INCOME
$22,737
AVG FAMILY INCOME
$14,974
AVG HOUSEHOLD INCOME
1.8%
WAGE / INCOME GAP [ % ]
98.2¢/ $1
WAGE / INCOME GAP [ $ ]
$10,786
FAMILY INCOME DEFICIT
0.46
INEQUALITY / GINI INDEX
5,006
TOTAL POPULATION
2,416
MALE POPULATION
2,590
FEMALE POPULATION
93.28
MALES / 100 FEMALES
107.20
FEMALES / 100 MALES
43.5
MEDIAN AGE
3.4
AVG FAMILY SIZE
2.6
AVG HOUSEHOLD SIZE
1,797
LABOR FORCE [ PEOPLE ]
42.4%
PERCENT IN LABOR FORCE
14.8%
UNEMPLOYMENT RATE
Income in Coco
Income Overview in Coco
Per Capita Income in Coco is $9,328, while median incomes of families and households are $22,737 and $14,974 respectively.
| Characteristic | Number | Measure |
| Per Capita Income | 5,006 | $9,328 |
| Median Family Income | 1,117 | $22,737 |
| Mean Family Income | 1,117 | $25,854 |
| Median Household Income | 1,937 | $14,974 |
| Mean Household Income | 1,937 | $22,407 |
| Income Deficit | 1,117 | $10,786 |
| Wage / Income Gap (%) | 5,006 | 1.80% |
| Wage / Income Gap ($) | 5,006 | 98.20¢ per $1 |
| Gini / Inequality Index | 5,006 | 0.46 |
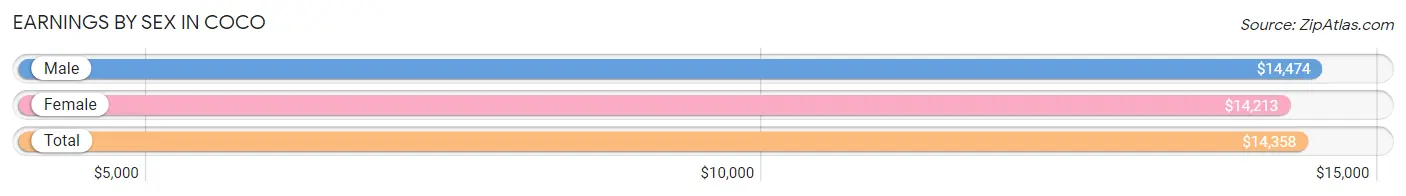
Earnings by Sex in Coco
Average Earnings in Coco are $14,358, $14,474 for men and $14,213 for women, a difference of 1.8%.
| Sex | Number | Average Earnings |
| Male | 867 (51.6%) | $14,474 |
| Female | 812 (48.4%) | $14,213 |
| Total | 1,679 (100.0%) | $14,358 |
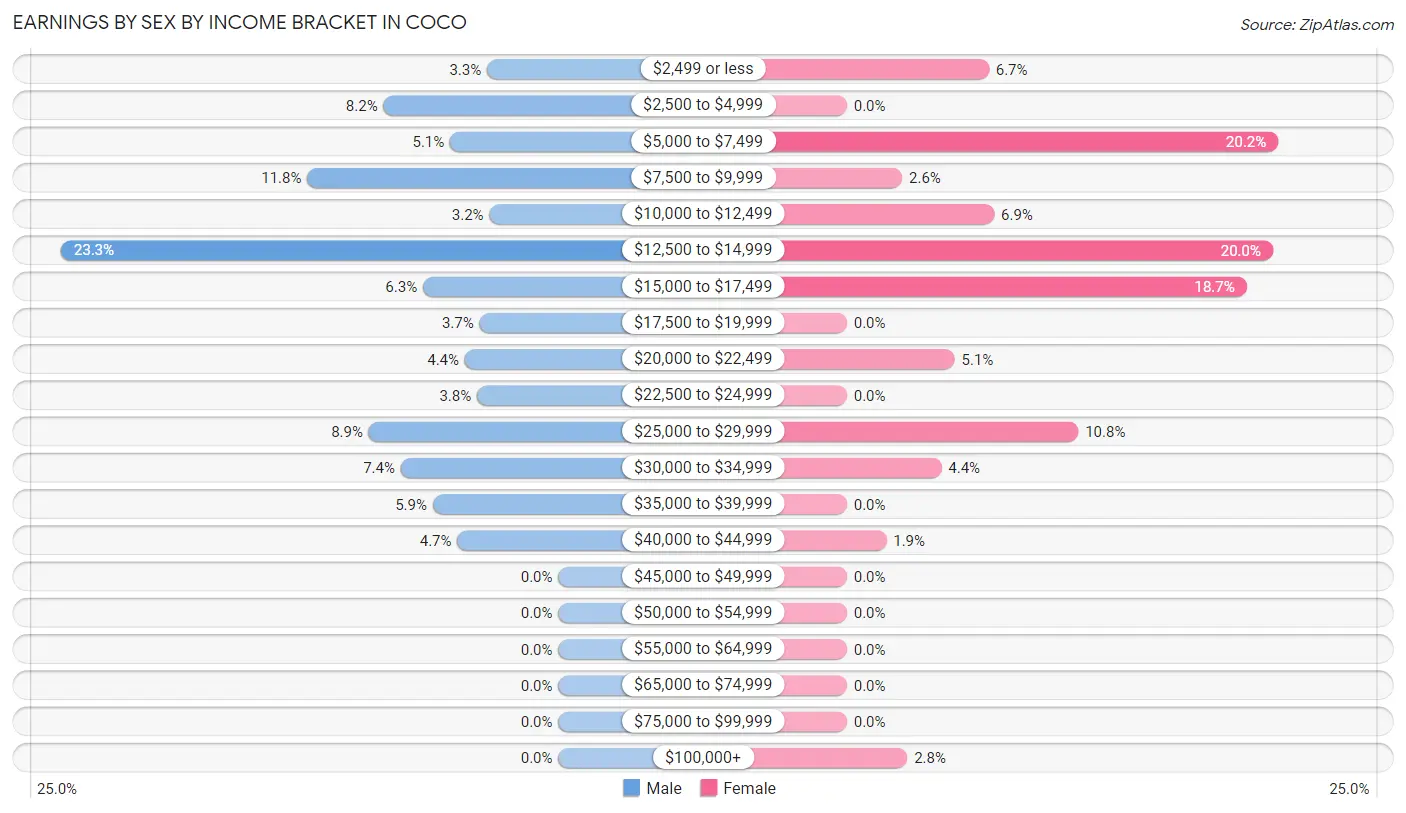
Earnings by Sex by Income Bracket in Coco
The most common earnings brackets in Coco are $12,500 to $14,999 for men (202 | 23.3%) and $5,000 to $7,499 for women (164 | 20.2%).
| Income | Male | Female |
| $2,499 or less | 29 (3.3%) | 54 (6.7%) |
| $2,500 to $4,999 | 71 (8.2%) | 0 (0.0%) |
| $5,000 to $7,499 | 44 (5.1%) | 164 (20.2%) |
| $7,500 to $9,999 | 102 (11.8%) | 21 (2.6%) |
| $10,000 to $12,499 | 28 (3.2%) | 56 (6.9%) |
| $12,500 to $14,999 | 202 (23.3%) | 162 (20.0%) |
| $15,000 to $17,499 | 55 (6.3%) | 152 (18.7%) |
| $17,500 to $19,999 | 32 (3.7%) | 0 (0.0%) |
| $20,000 to $22,499 | 38 (4.4%) | 41 (5.1%) |
| $22,500 to $24,999 | 33 (3.8%) | 0 (0.0%) |
| $25,000 to $29,999 | 77 (8.9%) | 88 (10.8%) |
| $30,000 to $34,999 | 64 (7.4%) | 36 (4.4%) |
| $35,000 to $39,999 | 51 (5.9%) | 0 (0.0%) |
| $40,000 to $44,999 | 41 (4.7%) | 15 (1.8%) |
| $45,000 to $49,999 | 0 (0.0%) | 0 (0.0%) |
| $50,000 to $54,999 | 0 (0.0%) | 0 (0.0%) |
| $55,000 to $64,999 | 0 (0.0%) | 0 (0.0%) |
| $65,000 to $74,999 | 0 (0.0%) | 0 (0.0%) |
| $75,000 to $99,999 | 0 (0.0%) | 0 (0.0%) |
| $100,000+ | 0 (0.0%) | 23 (2.8%) |
| Total | 867 (100.0%) | 812 (100.0%) |
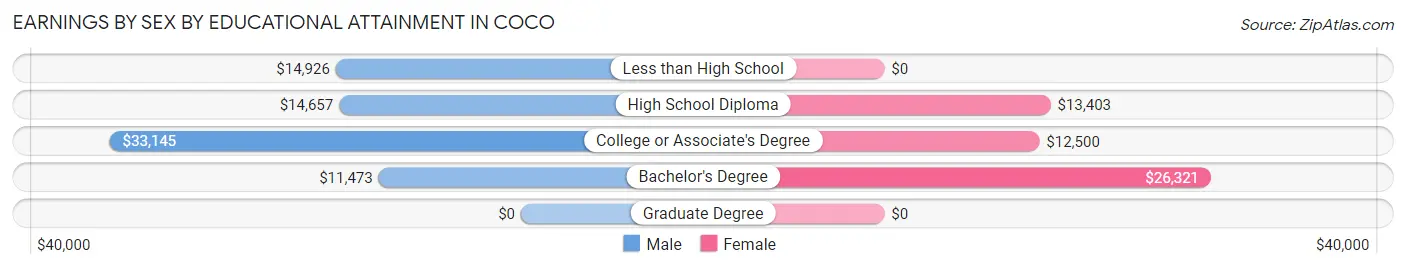
Earnings by Sex by Educational Attainment in Coco
Average earnings in Coco are $14,783 for men and $14,213 for women, a difference of 3.9%. Men with an educational attainment of college or associate's degree enjoy the highest average annual earnings of $33,145, while those with bachelor's degree education earn the least with $11,473. Women with an educational attainment of bachelor's degree earn the most with the average annual earnings of $26,321, while those with college or associate's degree education have the smallest earnings of $12,500.
| Educational Attainment | Male Income | Female Income |
| Less than High School | $14,926 | $0 |
| High School Diploma | $14,657 | $13,403 |
| College or Associate's Degree | $33,145 | $12,500 |
| Bachelor's Degree | $11,473 | $26,321 |
| Graduate Degree | - | - |
| Total | $14,783 | $14,213 |
Family Income in Coco
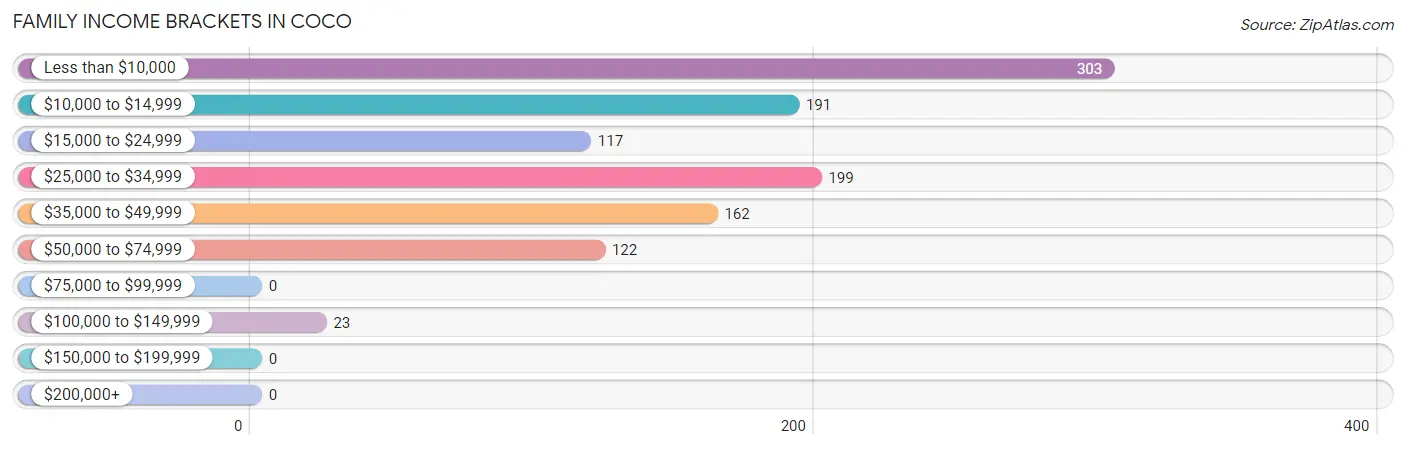
Family Income Brackets in Coco
According to the Coco family income data, there are 303 families falling into the less than $10,000 income range, which is the most common income bracket and makes up 27.1% of all families.
| Income Bracket | # Families | % Families |
| Less than $10,000 | 303 | 27.1% |
| $10,000 to $14,999 | 191 | 17.1% |
| $15,000 to $24,999 | 117 | 10.5% |
| $25,000 to $34,999 | 199 | 17.8% |
| $35,000 to $49,999 | 162 | 14.5% |
| $50,000 to $74,999 | 122 | 10.9% |
| $75,000 to $99,999 | 0 | 0.0% |
| $100,000 to $149,999 | 23 | 2.1% |
| $150,000 to $199,999 | 0 | 0.0% |
| $200,000+ | 0 | 0.0% |
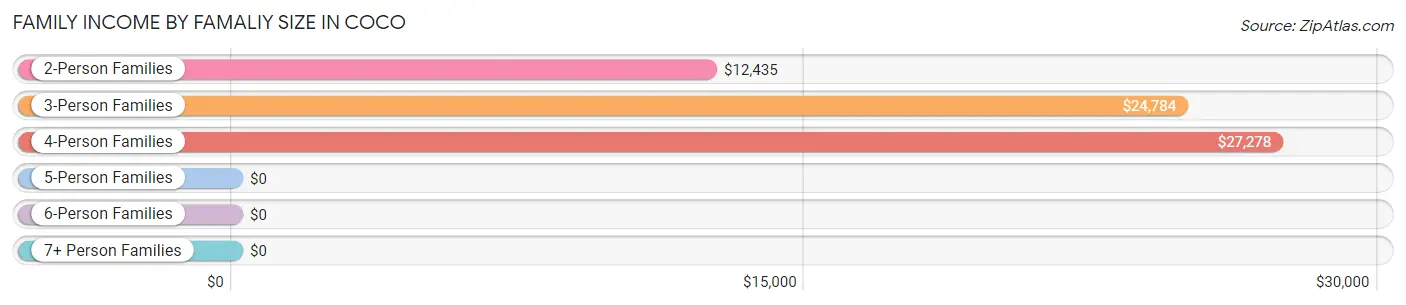
Family Income by Famaliy Size in Coco
4-person families (116 | 10.4%) account for the highest median family income in Coco with $27,278 per family, while 3-person families (244 | 21.8%) have the highest median income of $8,261 per family member.
| Income Bracket | # Families | Median Income |
| 2-Person Families | 611 (54.7%) | $12,435 |
| 3-Person Families | 244 (21.8%) | $24,784 |
| 4-Person Families | 116 (10.4%) | $27,278 |
| 5-Person Families | 132 (11.8%) | $0 |
| 6-Person Families | 0 (0.0%) | $0 |
| 7+ Person Families | 14 (1.3%) | $0 |
| Total | 1,117 (100.0%) | $22,737 |
Family Income by Number of Earners in Coco
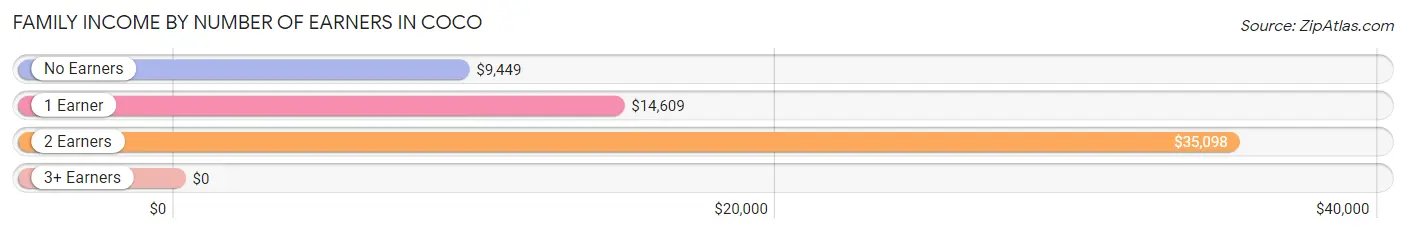
| Number of Earners | # Families | Median Income |
| No Earners | 412 (36.9%) | $9,449 |
| 1 Earner | 365 (32.7%) | $14,609 |
| 2 Earners | 326 (29.2%) | $35,098 |
| 3+ Earners | 14 (1.3%) | $0 |
| Total | 1,117 (100.0%) | $22,737 |
Household Income in Coco
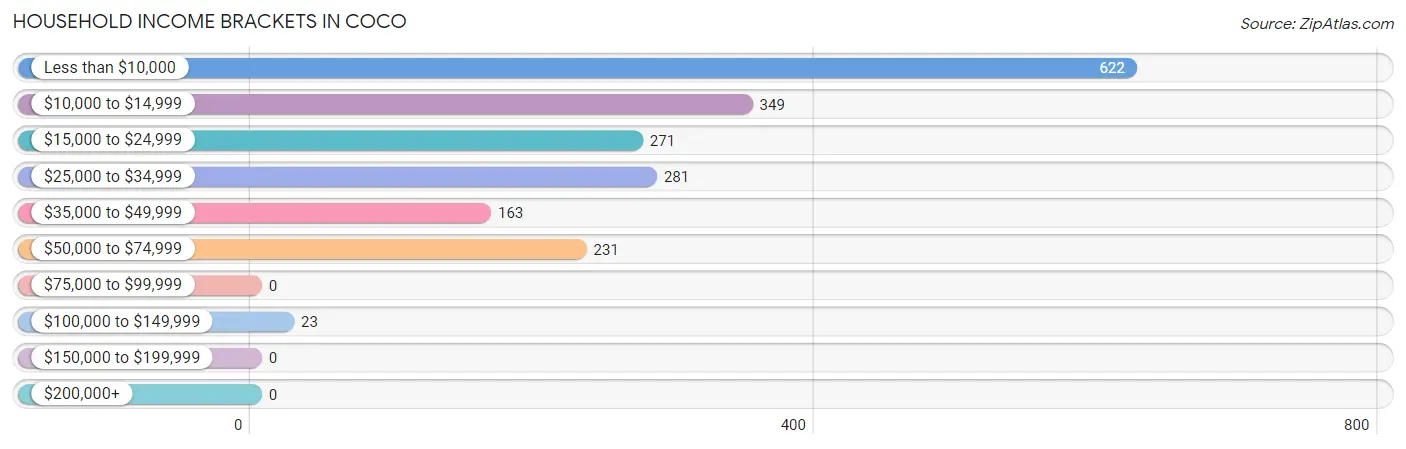
Household Income Brackets in Coco
With 622 households falling in the category, the less than $10,000 income range is the most frequent in Coco, accounting for 32.1% of all households.
| Income Bracket | # Households | % Households |
| Less than $10,000 | 622 | 32.1% |
| $10,000 to $14,999 | 349 | 18.0% |
| $15,000 to $24,999 | 271 | 14.0% |
| $25,000 to $34,999 | 281 | 14.5% |
| $35,000 to $49,999 | 163 | 8.4% |
| $50,000 to $74,999 | 231 | 11.9% |
| $75,000 to $99,999 | 0 | 0.0% |
| $100,000 to $149,999 | 23 | 1.2% |
| $150,000 to $199,999 | 0 | 0.0% |
| $200,000+ | 0 | 0.0% |
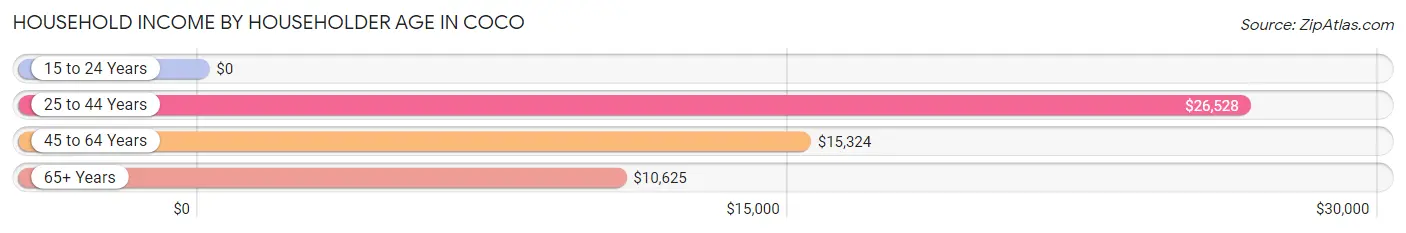
Household Income by Householder Age in Coco
The median household income in Coco is $14,974, with the highest median household income of $26,528 found in the 25 to 44 years age bracket for the primary householder. A total of 487 households (25.1%) fall into this category. Meanwhile, the 15 to 24 years age bracket for the primary householder has the lowest median household income of $0, with 17 households (0.9%) in this group.
| Income Bracket | # Households | Median Income |
| 15 to 24 Years | 17 (0.9%) | $0 |
| 25 to 44 Years | 487 (25.1%) | $26,528 |
| 45 to 64 Years | 841 (43.4%) | $15,324 |
| 65+ Years | 592 (30.6%) | $10,625 |
| Total | 1,937 (100.0%) | $14,974 |
Poverty in Coco
Income Below Poverty by Sex and Age in Coco
With 55.1% poverty level for males and 63.0% for females among the residents of Coco, 6 to 11 year old males and under 5 year old females are the most vulnerable to poverty, with 143 males (81.7%) and 24 females (100.0%) in their respective age groups living below the poverty level.
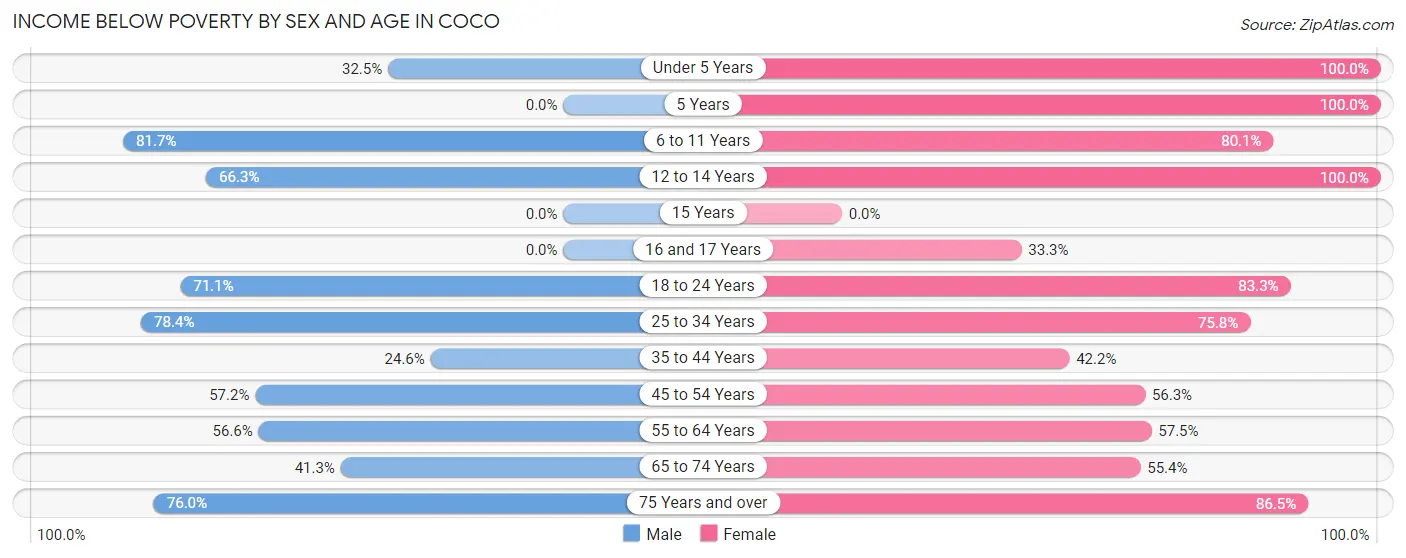
| Age Bracket | Male | Female |
| Under 5 Years | 41 (32.5%) | 24 (100.0%) |
| 5 Years | 0 (0.0%) | 42 (100.0%) |
| 6 to 11 Years | 143 (81.7%) | 201 (80.1%) |
| 12 to 14 Years | 63 (66.3%) | 54 (100.0%) |
| 15 Years | 0 (0.0%) | 0 (0.0%) |
| 16 and 17 Years | 0 (0.0%) | 46 (33.3%) |
| 18 to 24 Years | 123 (71.1%) | 189 (83.3%) |
| 25 to 34 Years | 163 (78.4%) | 219 (75.8%) |
| 35 to 44 Years | 68 (24.6%) | 179 (42.2%) |
| 45 to 54 Years | 179 (57.2%) | 202 (56.3%) |
| 55 to 64 Years | 250 (56.6%) | 262 (57.5%) |
| 65 to 74 Years | 112 (41.3%) | 123 (55.4%) |
| 75 Years and over | 190 (76.0%) | 90 (86.5%) |
| Total | 1,332 (55.1%) | 1,631 (63.0%) |
Income Above Poverty by Sex and Age in Coco
According to the poverty statistics in Coco, males aged 16 and 17 years and females aged 16 and 17 years are the age groups that are most secure financially, with 100.0% of males and 66.7% of females in these age groups living above the poverty line.
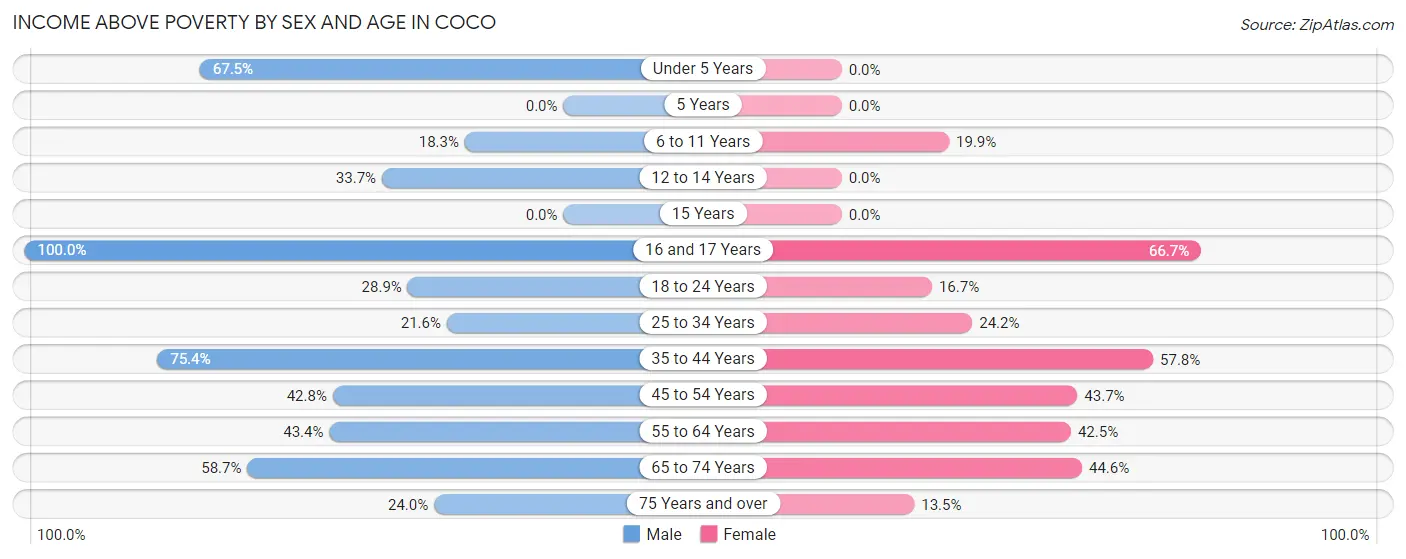
| Age Bracket | Male | Female |
| Under 5 Years | 85 (67.5%) | 0 (0.0%) |
| 5 Years | 0 (0.0%) | 0 (0.0%) |
| 6 to 11 Years | 32 (18.3%) | 50 (19.9%) |
| 12 to 14 Years | 32 (33.7%) | 0 (0.0%) |
| 15 Years | 0 (0.0%) | 0 (0.0%) |
| 16 and 17 Years | 87 (100.0%) | 92 (66.7%) |
| 18 to 24 Years | 50 (28.9%) | 38 (16.7%) |
| 25 to 34 Years | 45 (21.6%) | 70 (24.2%) |
| 35 to 44 Years | 208 (75.4%) | 245 (57.8%) |
| 45 to 54 Years | 134 (42.8%) | 157 (43.7%) |
| 55 to 64 Years | 192 (43.4%) | 194 (42.5%) |
| 65 to 74 Years | 159 (58.7%) | 99 (44.6%) |
| 75 Years and over | 60 (24.0%) | 14 (13.5%) |
| Total | 1,084 (44.9%) | 959 (37.0%) |
Income Below Poverty Among Married-Couple Families in Coco
The poverty statistics for married-couple families in Coco show that 42.3% or 260 of the total 614 families live below the poverty line. Families with 3 or 4 children have the highest poverty rate of 60.7%, comprising of 37 families. On the other hand, families with no children have the lowest poverty rate of 36.5%, which includes 144 families.
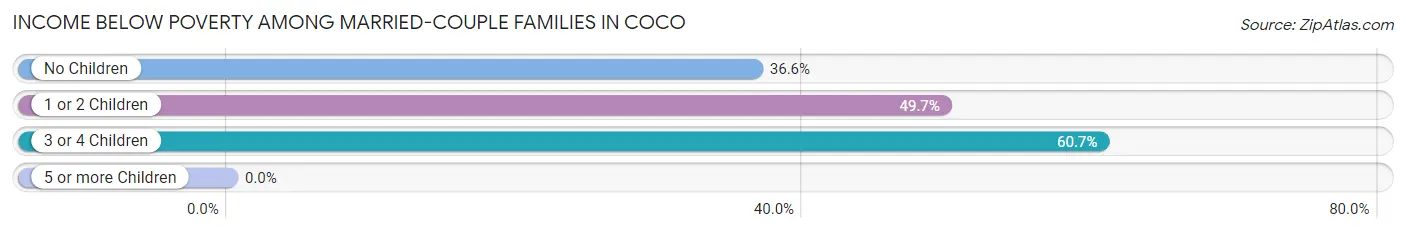
| Children | Above Poverty | Below Poverty |
| No Children | 250 (63.4%) | 144 (36.5%) |
| 1 or 2 Children | 80 (50.3%) | 79 (49.7%) |
| 3 or 4 Children | 24 (39.3%) | 37 (60.7%) |
| 5 or more Children | 0 (0.0%) | 0 (0.0%) |
| Total | 354 (57.7%) | 260 (42.3%) |
Income Below Poverty Among Single-Parent Households in Coco
According to the poverty data in Coco, 67.4% or 157 single-father households and 78.1% or 211 single-mother households are living below the poverty line. Among single-father households, those with no children have the highest poverty rate, with 39 households (100.0%) experiencing poverty. Likewise, among single-mother households, those with 3 or 4 children have the highest poverty rate, with 17 households (100.0%) falling below the poverty line.
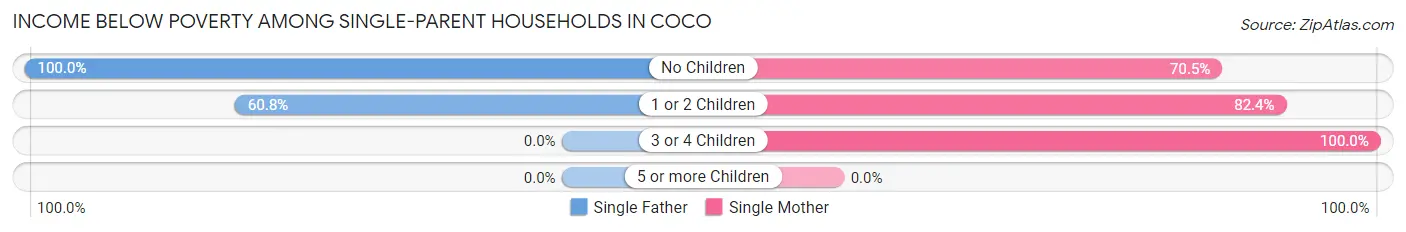
| Children | Single Father | Single Mother |
| No Children | 39 (100.0%) | 86 (70.5%) |
| 1 or 2 Children | 118 (60.8%) | 108 (82.4%) |
| 3 or 4 Children | 0 (0.0%) | 17 (100.0%) |
| 5 or more Children | 0 (0.0%) | 0 (0.0%) |
| Total | 157 (67.4%) | 211 (78.1%) |
Income Below Poverty Among Married-Couple vs Single-Parent Households in Coco
The poverty data for Coco shows that 260 of the married-couple family households (42.3%) and 368 of the single-parent households (73.2%) are living below the poverty level. Within the married-couple family households, those with 3 or 4 children have the highest poverty rate, with 37 households (60.7%) falling below the poverty line. Among the single-parent households, those with 3 or 4 children have the highest poverty rate, with 17 household (100.0%) living below poverty.
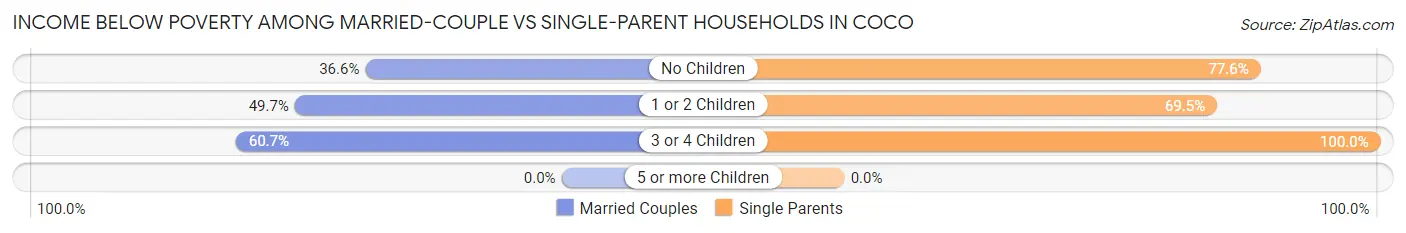
| Children | Married-Couple Families | Single-Parent Households |
| No Children | 144 (36.5%) | 125 (77.6%) |
| 1 or 2 Children | 79 (49.7%) | 226 (69.5%) |
| 3 or 4 Children | 37 (60.7%) | 17 (100.0%) |
| 5 or more Children | 0 (0.0%) | 0 (0.0%) |
| Total | 260 (42.3%) | 368 (73.2%) |
Race in Coco
The most populous races in Coco are Hispanic or Latino (5,006 | 100.0%), Two or more Races (2,554 | 51.0%), and White / Caucasian (1,348 | 26.9%).
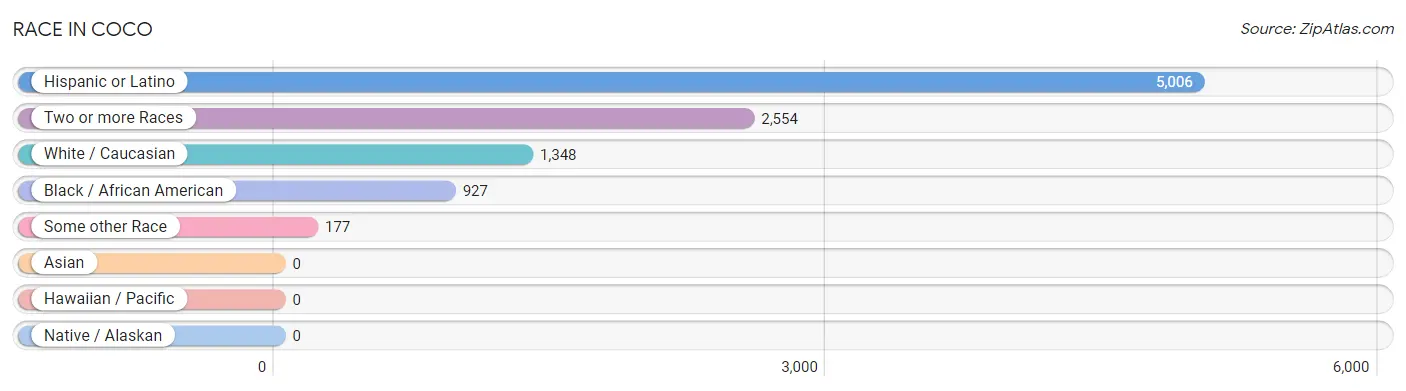
| Race | # Population | % Population |
| Asian | 0 | 0.0% |
| Black / African American | 927 | 18.5% |
| Hawaiian / Pacific | 0 | 0.0% |
| Hispanic or Latino | 5,006 | 100.0% |
| Native / Alaskan | 0 | 0.0% |
| White / Caucasian | 1,348 | 26.9% |
| Two or more Races | 2,554 | 51.0% |
| Some other Race | 177 | 3.5% |
| Total | 5,006 | 100.0% |
Ancestry in Coco
The most populous ancestries reported in Coco are Puerto Rican (4,992 | 99.7%), American (14 | 0.3%), and Dominican (14 | 0.3%), together accounting for 100.3% of all Coco residents.
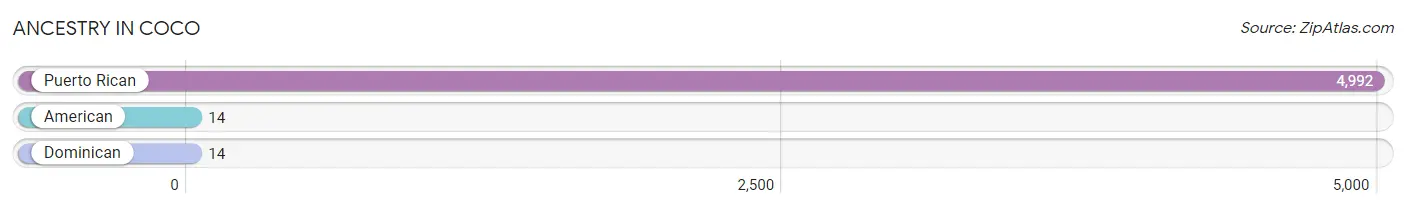
| Ancestry | # Population | % Population |
| American | 14 | 0.3% |
| Dominican | 14 | 0.3% |
| Puerto Rican | 4,992 | 99.7% | View All 3 Rows |
Immigrants in Coco

| Immigration Origin | # Population | % Population | View All 0 Rows |
Sex and Age in Coco
Sex and Age in Coco
The most populous age groups in Coco are 60 to 64 Years (265 | 11.0%) for men and 55 to 59 Years (338 | 13.1%) for women.
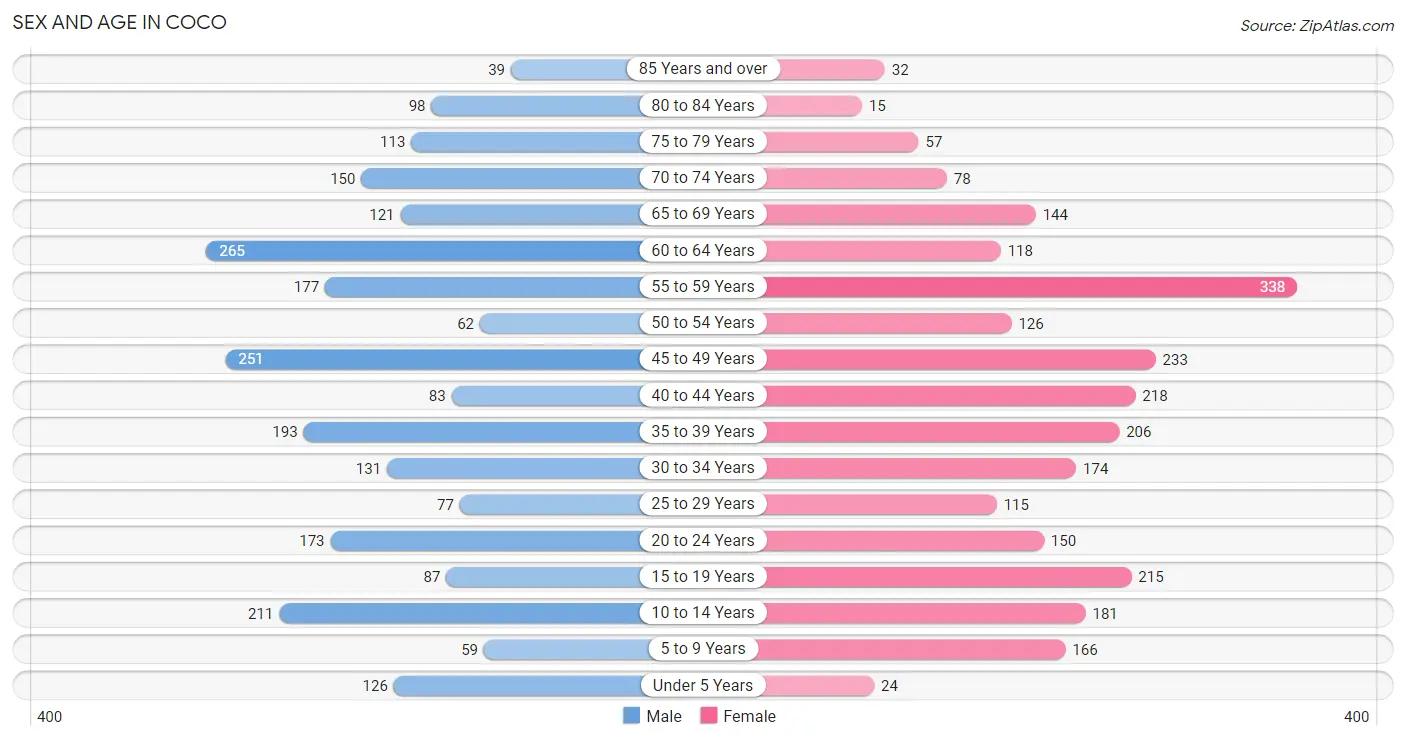
| Age Bracket | Male | Female |
| Under 5 Years | 126 (5.2%) | 24 (0.9%) |
| 5 to 9 Years | 59 (2.4%) | 166 (6.4%) |
| 10 to 14 Years | 211 (8.7%) | 181 (7.0%) |
| 15 to 19 Years | 87 (3.6%) | 215 (8.3%) |
| 20 to 24 Years | 173 (7.2%) | 150 (5.8%) |
| 25 to 29 Years | 77 (3.2%) | 115 (4.4%) |
| 30 to 34 Years | 131 (5.4%) | 174 (6.7%) |
| 35 to 39 Years | 193 (8.0%) | 206 (8.0%) |
| 40 to 44 Years | 83 (3.4%) | 218 (8.4%) |
| 45 to 49 Years | 251 (10.4%) | 233 (9.0%) |
| 50 to 54 Years | 62 (2.6%) | 126 (4.9%) |
| 55 to 59 Years | 177 (7.3%) | 338 (13.1%) |
| 60 to 64 Years | 265 (11.0%) | 118 (4.6%) |
| 65 to 69 Years | 121 (5.0%) | 144 (5.6%) |
| 70 to 74 Years | 150 (6.2%) | 78 (3.0%) |
| 75 to 79 Years | 113 (4.7%) | 57 (2.2%) |
| 80 to 84 Years | 98 (4.1%) | 15 (0.6%) |
| 85 Years and over | 39 (1.6%) | 32 (1.2%) |
| Total | 2,416 (100.0%) | 2,590 (100.0%) |
Families and Households in Coco
Median Family Size in Coco
The median family size in Coco is 3.41 persons per family, with single female/mother families (270 | 24.2%) accounting for the largest median family size of 4.12 persons per family. On the other hand, single male/father families (233 | 20.9%) represent the smallest median family size with 2.67 persons per family.
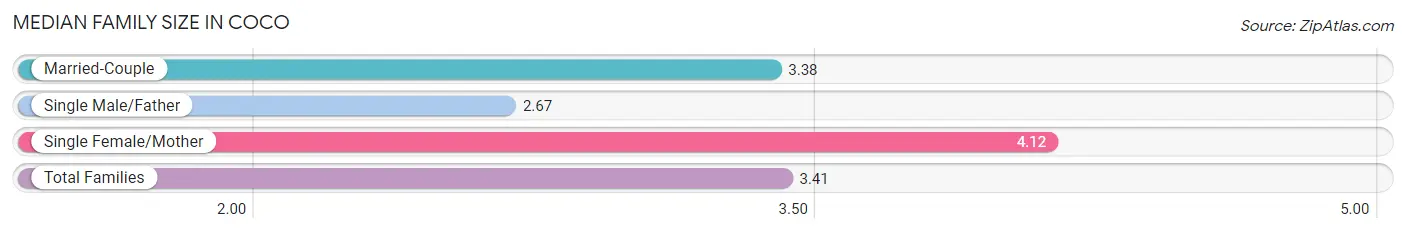
| Family Type | # Families | Family Size |
| Married-Couple | 614 (55.0%) | 3.38 |
| Single Male/Father | 233 (20.9%) | 2.67 |
| Single Female/Mother | 270 (24.2%) | 4.12 |
| Total Families | 1,117 (100.0%) | 3.41 |
Median Household Size in Coco
The median household size in Coco is 2.58 persons per household, with single female/mother households (270 | 13.9%) accounting for the largest median household size of 4.4 persons per household. non-family households (820 | 42.3%) represent the smallest median household size with 1.14 persons per household.
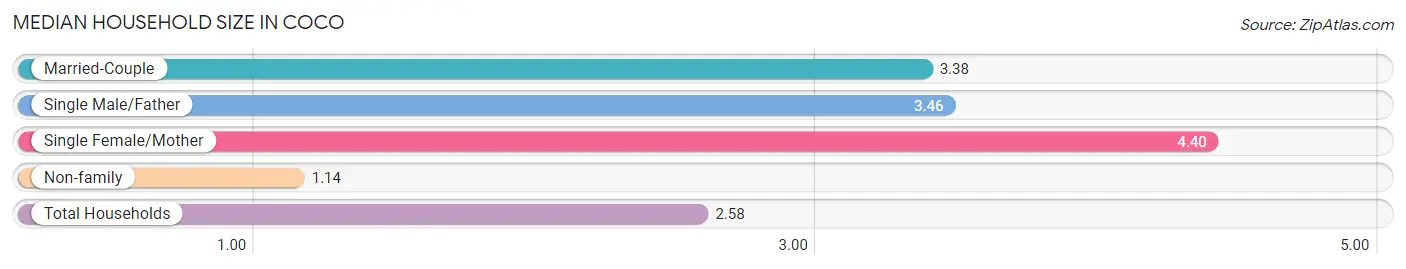
| Household Type | # Households | Household Size |
| Married-Couple | 614 (31.7%) | 3.38 |
| Single Male/Father | 233 (12.0%) | 3.46 |
| Single Female/Mother | 270 (13.9%) | 4.40 |
| Non-family | 820 (42.3%) | 1.14 |
| Total Households | 1,937 (100.0%) | 2.58 |
Household Size by Marriage Status in Coco
Out of a total of 1,937 households in Coco, 1,117 (57.7%) are family households, while 820 (42.3%) are nonfamily households. The most numerous type of family households are 2-person households, comprising 475, and the most common type of nonfamily households are 1-person households, comprising 712.
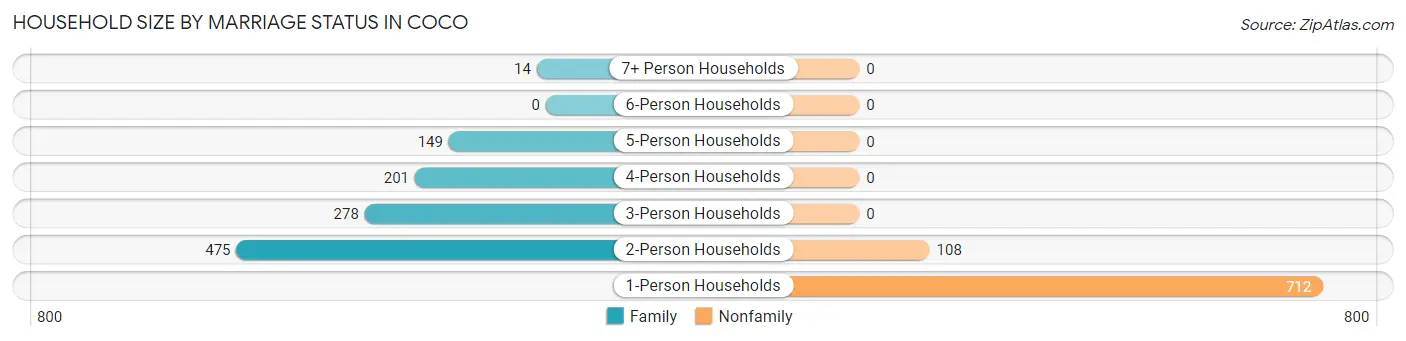
| Household Size | Family Households | Nonfamily Households |
| 1-Person Households | - | 712 (36.8%) |
| 2-Person Households | 475 (24.5%) | 108 (5.6%) |
| 3-Person Households | 278 (14.3%) | 0 (0.0%) |
| 4-Person Households | 201 (10.4%) | 0 (0.0%) |
| 5-Person Households | 149 (7.7%) | 0 (0.0%) |
| 6-Person Households | 0 (0.0%) | 0 (0.0%) |
| 7+ Person Households | 14 (0.7%) | 0 (0.0%) |
| Total | 1,117 (57.7%) | 820 (42.3%) |
Female Fertility in Coco
Fertility by Age in Coco
Average fertility rate in Coco is 13.0 births per 1,000 women. Women in the age bracket of 20 to 34 years have the highest fertility rate with 39.0 births per 1,000 women. Women in the age bracket of 20 to 34 years acount for 100.0% of all women with births.
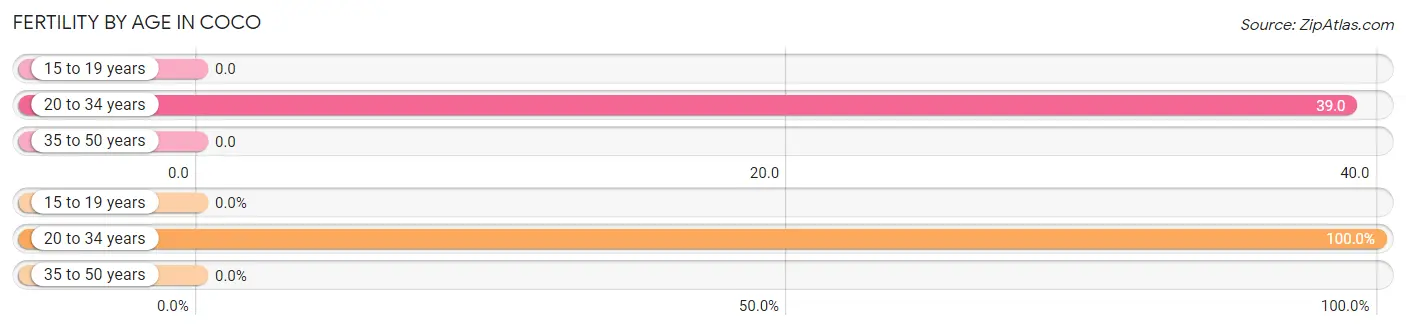
| Age Bracket | Women with Births | Births / 1,000 Women |
| 15 to 19 years | 0 (0.0%) | 0.0 |
| 20 to 34 years | 17 (100.0%) | 39.0 |
| 35 to 50 years | 0 (0.0%) | 0.0 |
| Total | 17 (100.0%) | 13.0 |
Fertility by Age by Marriage Status in Coco
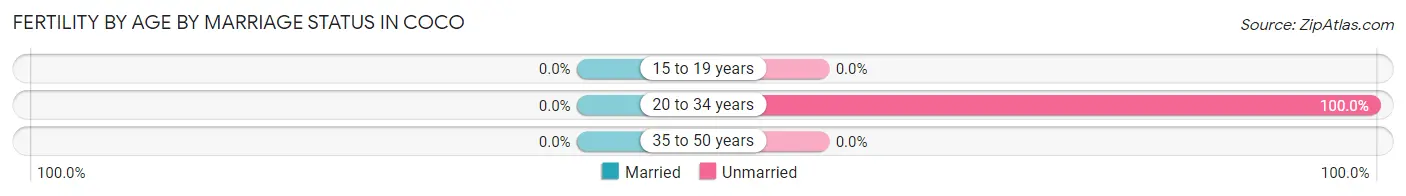
| Age Bracket | Married | Unmarried |
| 15 to 19 years | 0 (0.0%) | 0 (0.0%) |
| 20 to 34 years | 0 (0.0%) | 17 (100.0%) |
| 35 to 50 years | 0 (0.0%) | 0 (0.0%) |
| Total | 0 (0.0%) | 17 (100.0%) |
Fertility by Education in Coco
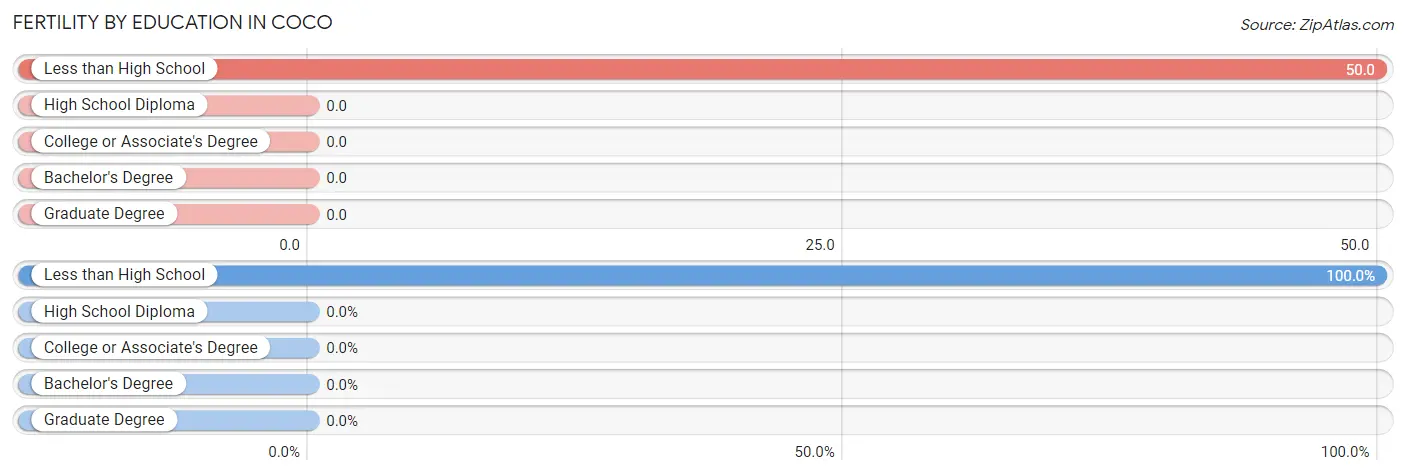
| Educational Attainment | Women with Births | Births / 1,000 Women |
| Less than High School | 17 (100.0%) | 50.0 |
| High School Diploma | 0 (0.0%) | 0.0 |
| College or Associate's Degree | 0 (0.0%) | 0.0 |
| Bachelor's Degree | 0 (0.0%) | 0.0 |
| Graduate Degree | 0 (0.0%) | 0.0 |
| Total | 17 (100.0%) | 13.0 |
Fertility by Education by Marriage Status in Coco
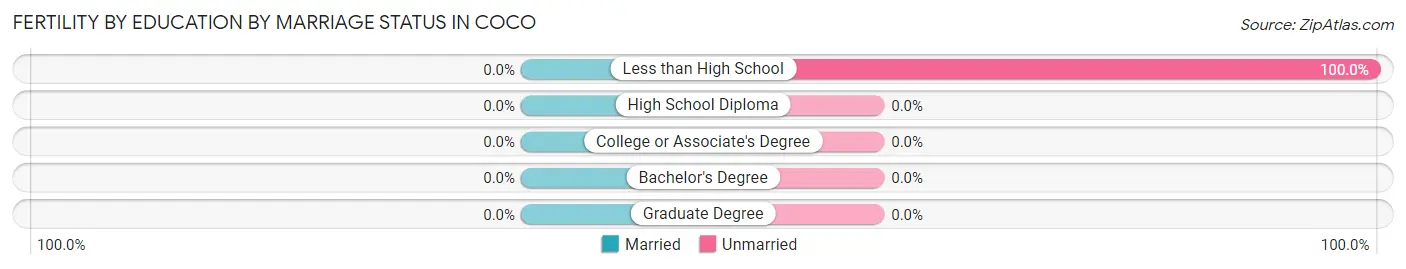
| Educational Attainment | Married | Unmarried |
| Less than High School | 0 (0.0%) | 17 (100.0%) |
| High School Diploma | 0 (0.0%) | 0 (0.0%) |
| College or Associate's Degree | 0 (0.0%) | 0 (0.0%) |
| Bachelor's Degree | 0 (0.0%) | 0 (0.0%) |
| Graduate Degree | 0 (0.0%) | 0 (0.0%) |
| Total | 0 (0.0%) | 17 (100.0%) |
Employment Characteristics in Coco
Employment by Class of Employer in Coco
Among the 1,478 employed individuals in Coco, private company employees (885 | 59.9%), self-employed (not incorporated) (256 | 17.3%), and state government employees (150 | 10.2%) make up the most common classes of employment.
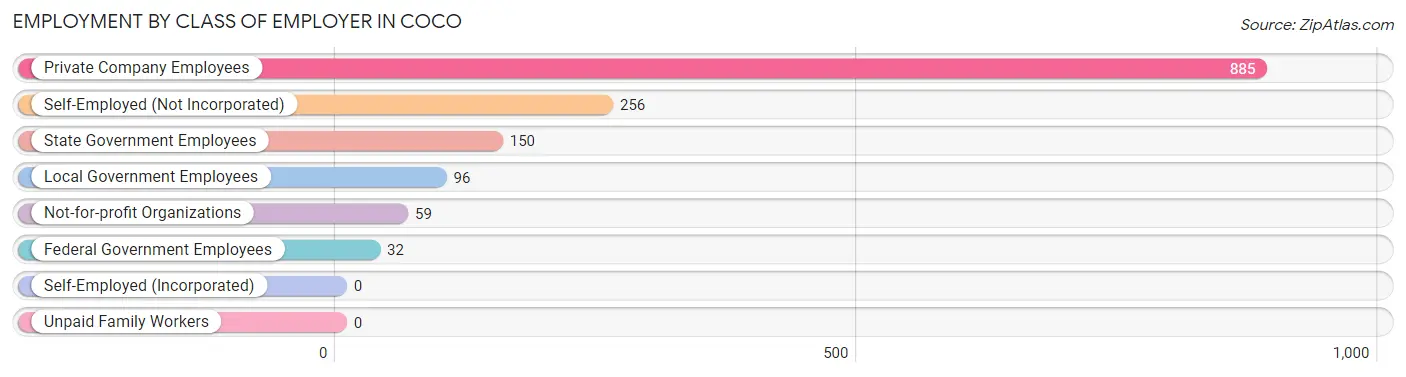
| Employer Class | # Employees | % Employees |
| Private Company Employees | 885 | 59.9% |
| Self-Employed (Incorporated) | 0 | 0.0% |
| Self-Employed (Not Incorporated) | 256 | 17.3% |
| Not-for-profit Organizations | 59 | 4.0% |
| Local Government Employees | 96 | 6.5% |
| State Government Employees | 150 | 10.2% |
| Federal Government Employees | 32 | 2.2% |
| Unpaid Family Workers | 0 | 0.0% |
| Total | 1,478 | 100.0% |
Employment Status by Age in Coco
According to the labor force statistics for Coco, out of the total population over 16 years of age (4,239), 42.4% or 1,797 individuals are in the labor force, with 14.8% or 266 of them unemployed. The age group with the highest labor force participation rate is 25 to 29 years, with 76.6% or 147 individuals in the labor force. Within the labor force, the 20 to 24 years age range has the highest percentage of unemployed individuals, with 60.3% or 76 of them being unemployed.
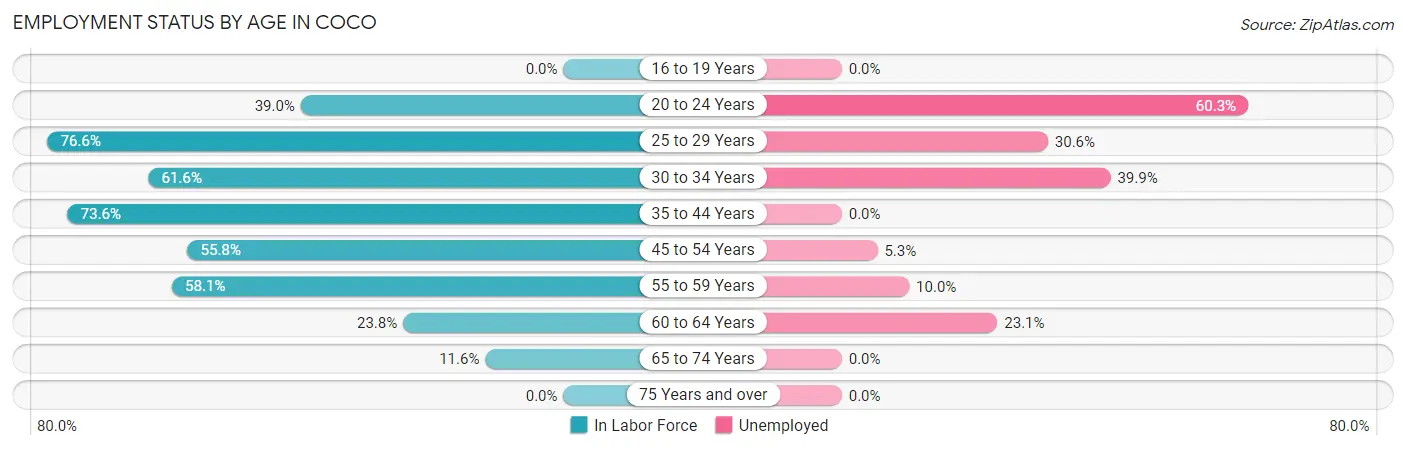
| Age Bracket | In Labor Force | Unemployed |
| 16 to 19 Years | 0 (0.0%) | 0 (0.0%) |
| 20 to 24 Years | 126 (39.0%) | 76 (60.3%) |
| 25 to 29 Years | 147 (76.6%) | 45 (30.6%) |
| 30 to 34 Years | 188 (61.6%) | 75 (39.9%) |
| 35 to 44 Years | 515 (73.6%) | 0 (0.0%) |
| 45 to 54 Years | 375 (55.8%) | 20 (5.3%) |
| 55 to 59 Years | 299 (58.1%) | 30 (10.0%) |
| 60 to 64 Years | 91 (23.8%) | 21 (23.1%) |
| 65 to 74 Years | 57 (11.6%) | 0 (0.0%) |
| 75 Years and over | 0 (0.0%) | 0 (0.0%) |
| Total | 1,797 (42.4%) | 266 (14.8%) |
Employment Status by Educational Attainment in Coco
According to labor force statistics for Coco, 58.4% of individuals (1,616) out of the total population between 25 and 64 years of age (2,767) are in the labor force, with 11.8% or 191 of them being unemployed. The group with the highest labor force participation rate are those with the educational attainment of college / associate degree, with 66.2% or 429 individuals in the labor force. Within the labor force, individuals with high school diploma education have the highest percentage of unemployment, with 16.8% or 141 of them being unemployed.
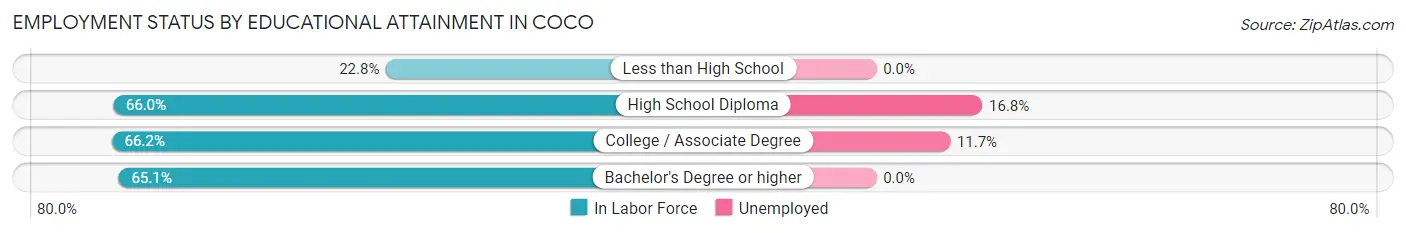
| Educational Attainment | In Labor Force | Unemployed |
| Less than High School | 111 (22.8%) | 0 (0.0%) |
| High School Diploma | 840 (66.0%) | 214 (16.8%) |
| College / Associate Degree | 429 (66.2%) | 76 (11.7%) |
| Bachelor's Degree or higher | 235 (65.1%) | 0 (0.0%) |
| Total | 1,616 (58.4%) | 327 (11.8%) |
Employment Occupations by Sex in Coco
Management, Business, Science and Arts Occupations
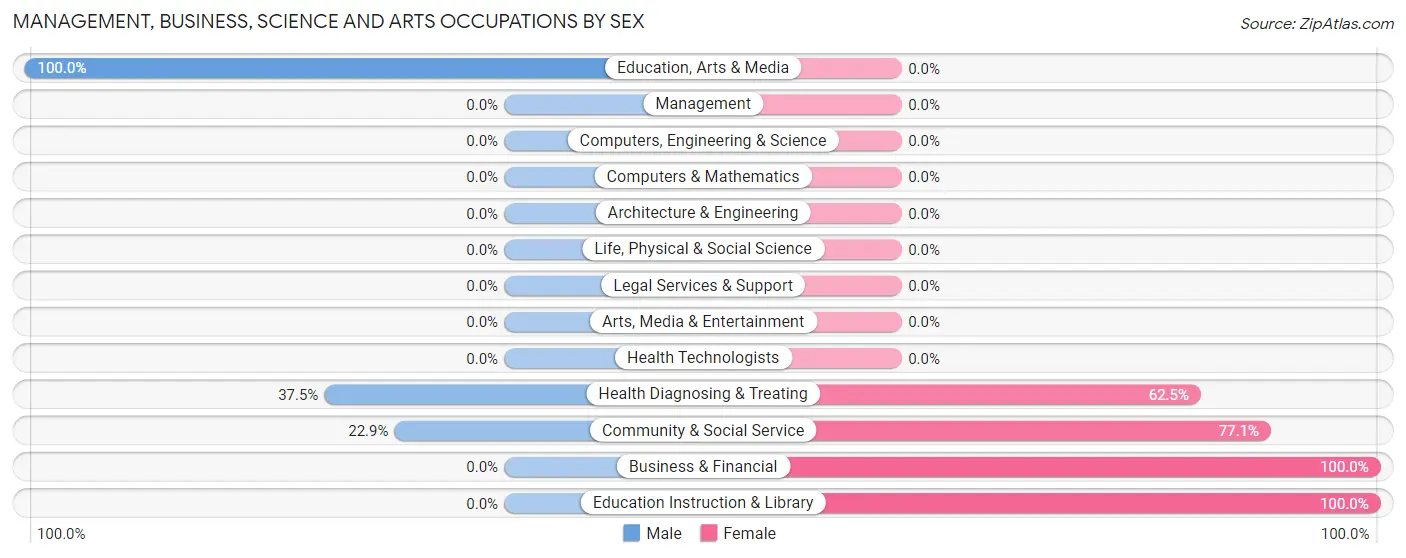
The most common Management, Business, Science and Arts occupations in Coco are Community & Social Service (118 | 7.7%), Education Instruction & Library (91 | 5.9%), Health Diagnosing & Treating (88 | 5.8%), Business & Financial (30 | 2.0%), and Education, Arts & Media (27 | 1.8%).
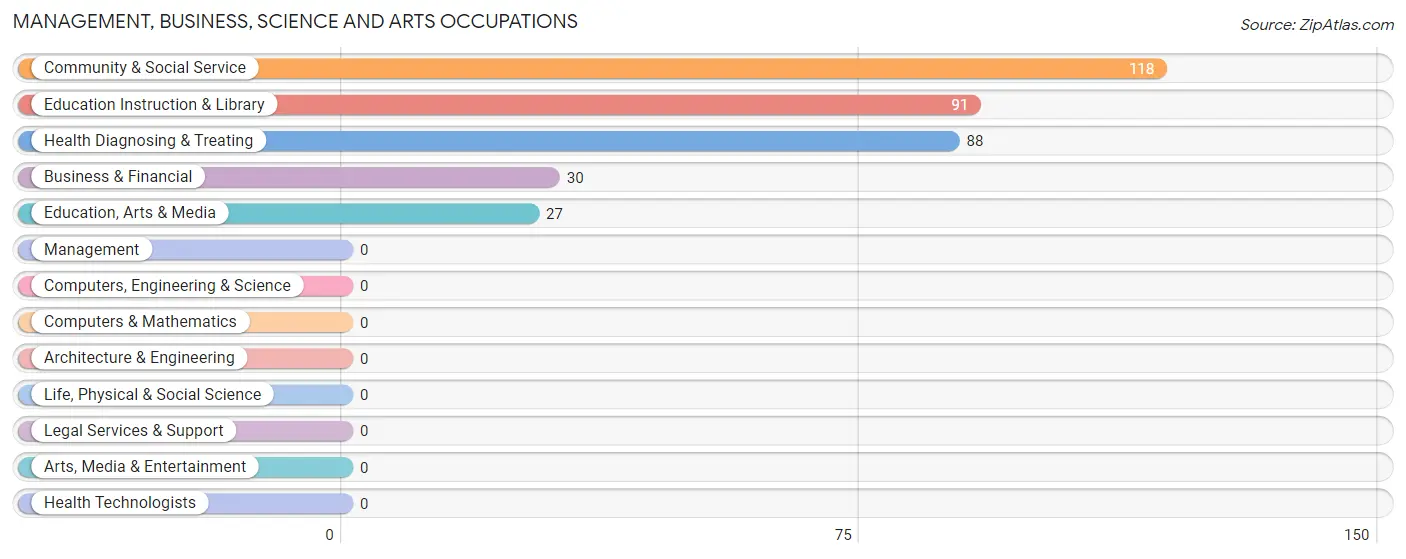
Management, Business, Science and Arts Occupations by Sex
Within the Management, Business, Science and Arts occupations in Coco, the most male-oriented occupations are Education, Arts & Media (100.0%), Health Diagnosing & Treating (37.5%), and Community & Social Service (22.9%), while the most female-oriented occupations are Business & Financial (100.0%), Education Instruction & Library (100.0%), and Community & Social Service (77.1%).
| Occupation | Male | Female |
| Management | 0 (0.0%) | 0 (0.0%) |
| Business & Financial | 0 (0.0%) | 30 (100.0%) |
| Computers, Engineering & Science | 0 (0.0%) | 0 (0.0%) |
| Computers & Mathematics | 0 (0.0%) | 0 (0.0%) |
| Architecture & Engineering | 0 (0.0%) | 0 (0.0%) |
| Life, Physical & Social Science | 0 (0.0%) | 0 (0.0%) |
| Community & Social Service | 27 (22.9%) | 91 (77.1%) |
| Education, Arts & Media | 27 (100.0%) | 0 (0.0%) |
| Legal Services & Support | 0 (0.0%) | 0 (0.0%) |
| Education Instruction & Library | 0 (0.0%) | 91 (100.0%) |
| Arts, Media & Entertainment | 0 (0.0%) | 0 (0.0%) |
| Health Diagnosing & Treating | 33 (37.5%) | 55 (62.5%) |
| Health Technologists | 0 (0.0%) | 0 (0.0%) |
| Total (Category) | 60 (25.4%) | 176 (74.6%) |
| Total (Overall) | 765 (50.0%) | 766 (50.0%) |
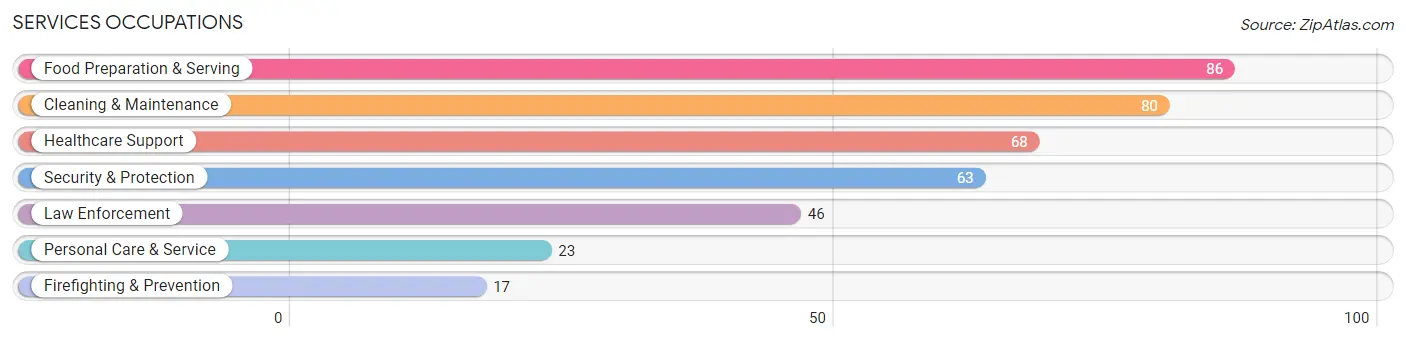
Services Occupations
The most common Services occupations in Coco are Food Preparation & Serving (86 | 5.6%), Cleaning & Maintenance (80 | 5.2%), Healthcare Support (68 | 4.4%), Security & Protection (63 | 4.1%), and Law Enforcement (46 | 3.0%).
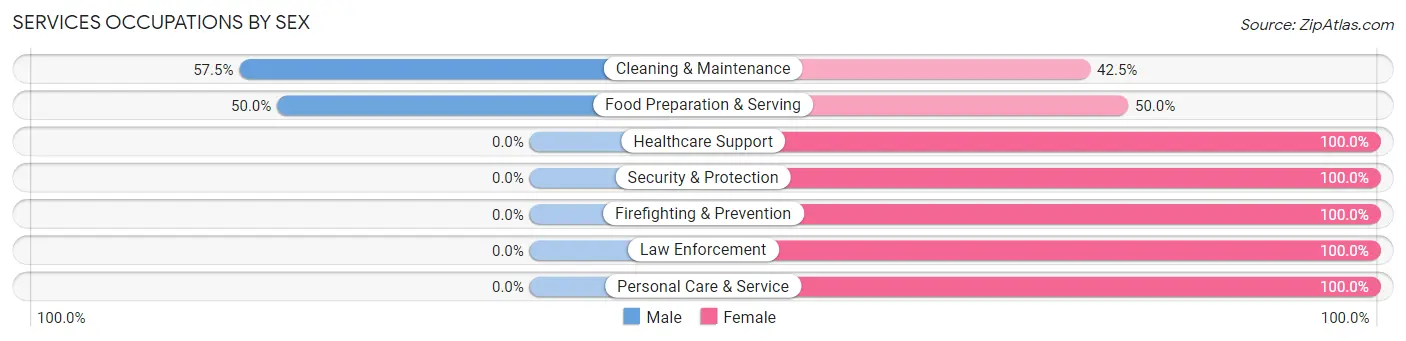
Services Occupations by Sex
Within the Services occupations in Coco, the most male-oriented occupations are Cleaning & Maintenance (57.5%), and Food Preparation & Serving (50.0%), while the most female-oriented occupations are Healthcare Support (100.0%), Security & Protection (100.0%), and Firefighting & Prevention (100.0%).
| Occupation | Male | Female |
| Healthcare Support | 0 (0.0%) | 68 (100.0%) |
| Security & Protection | 0 (0.0%) | 63 (100.0%) |
| Firefighting & Prevention | 0 (0.0%) | 17 (100.0%) |
| Law Enforcement | 0 (0.0%) | 46 (100.0%) |
| Food Preparation & Serving | 43 (50.0%) | 43 (50.0%) |
| Cleaning & Maintenance | 46 (57.5%) | 34 (42.5%) |
| Personal Care & Service | 0 (0.0%) | 23 (100.0%) |
| Total (Category) | 89 (27.8%) | 231 (72.2%) |
| Total (Overall) | 765 (50.0%) | 766 (50.0%) |
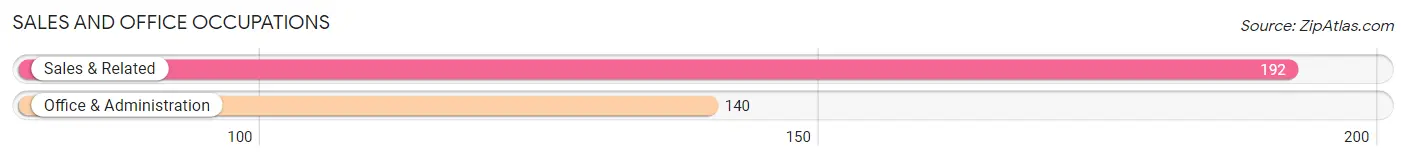
Sales and Office Occupations
The most common Sales and Office occupations in Coco are Sales & Related (192 | 12.5%), and Office & Administration (140 | 9.1%).
Sales and Office Occupations by Sex
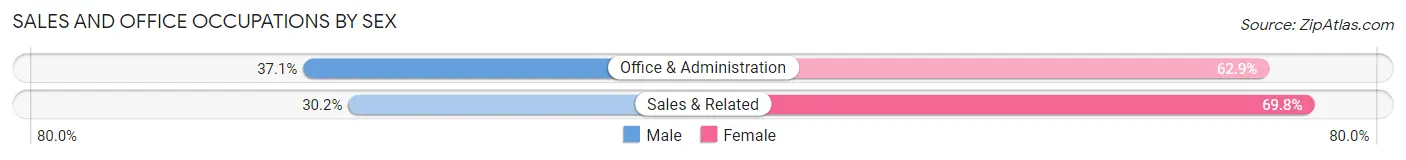
| Occupation | Male | Female |
| Sales & Related | 58 (30.2%) | 134 (69.8%) |
| Office & Administration | 52 (37.1%) | 88 (62.9%) |
| Total (Category) | 110 (33.1%) | 222 (66.9%) |
| Total (Overall) | 765 (50.0%) | 766 (50.0%) |
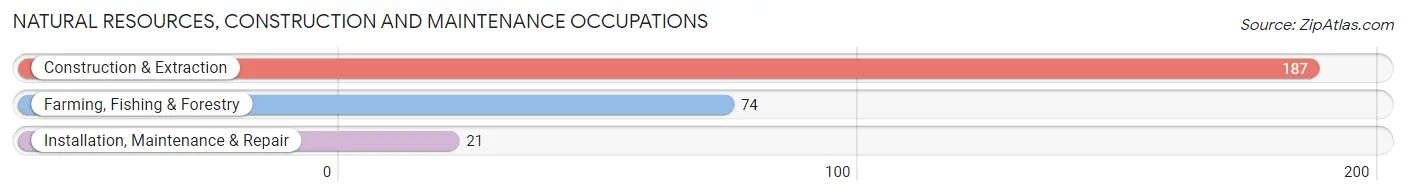
Natural Resources, Construction and Maintenance Occupations
The most common Natural Resources, Construction and Maintenance occupations in Coco are Construction & Extraction (187 | 12.2%), Farming, Fishing & Forestry (74 | 4.8%), and Installation, Maintenance & Repair (21 | 1.4%).
Natural Resources, Construction and Maintenance Occupations by Sex
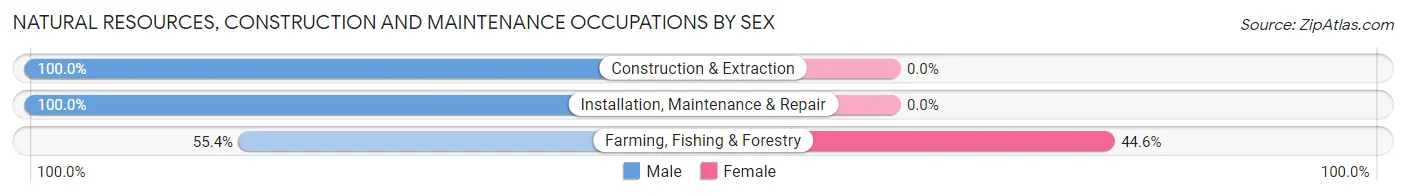
| Occupation | Male | Female |
| Farming, Fishing & Forestry | 41 (55.4%) | 33 (44.6%) |
| Construction & Extraction | 187 (100.0%) | 0 (0.0%) |
| Installation, Maintenance & Repair | 21 (100.0%) | 0 (0.0%) |
| Total (Category) | 249 (88.3%) | 33 (11.7%) |
| Total (Overall) | 765 (50.0%) | 766 (50.0%) |
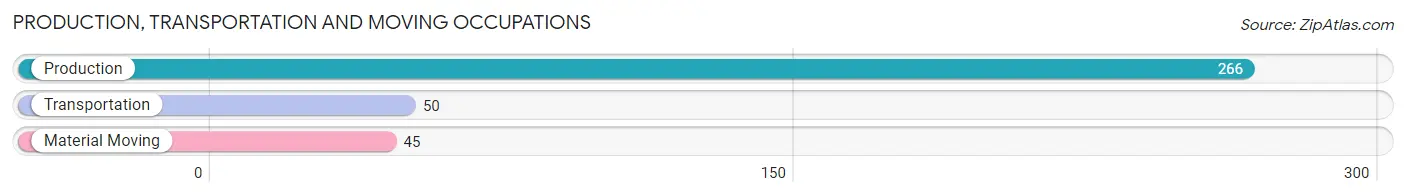
Production, Transportation and Moving Occupations
The most common Production, Transportation and Moving occupations in Coco are Production (266 | 17.4%), Transportation (50 | 3.3%), and Material Moving (45 | 2.9%).
Production, Transportation and Moving Occupations by Sex
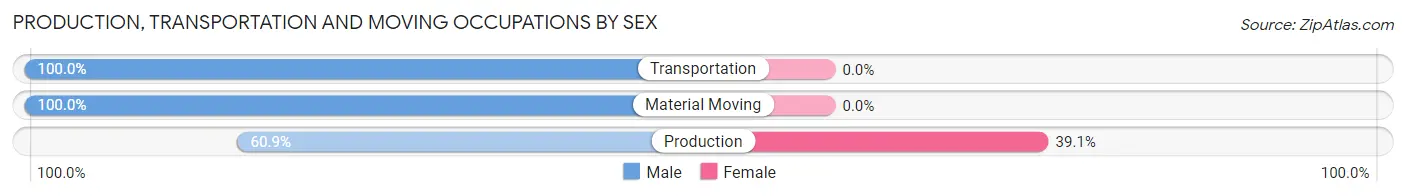
| Occupation | Male | Female |
| Production | 162 (60.9%) | 104 (39.1%) |
| Transportation | 50 (100.0%) | 0 (0.0%) |
| Material Moving | 45 (100.0%) | 0 (0.0%) |
| Total (Category) | 257 (71.2%) | 104 (28.8%) |
| Total (Overall) | 765 (50.0%) | 766 (50.0%) |
Employment Industries by Sex in Coco
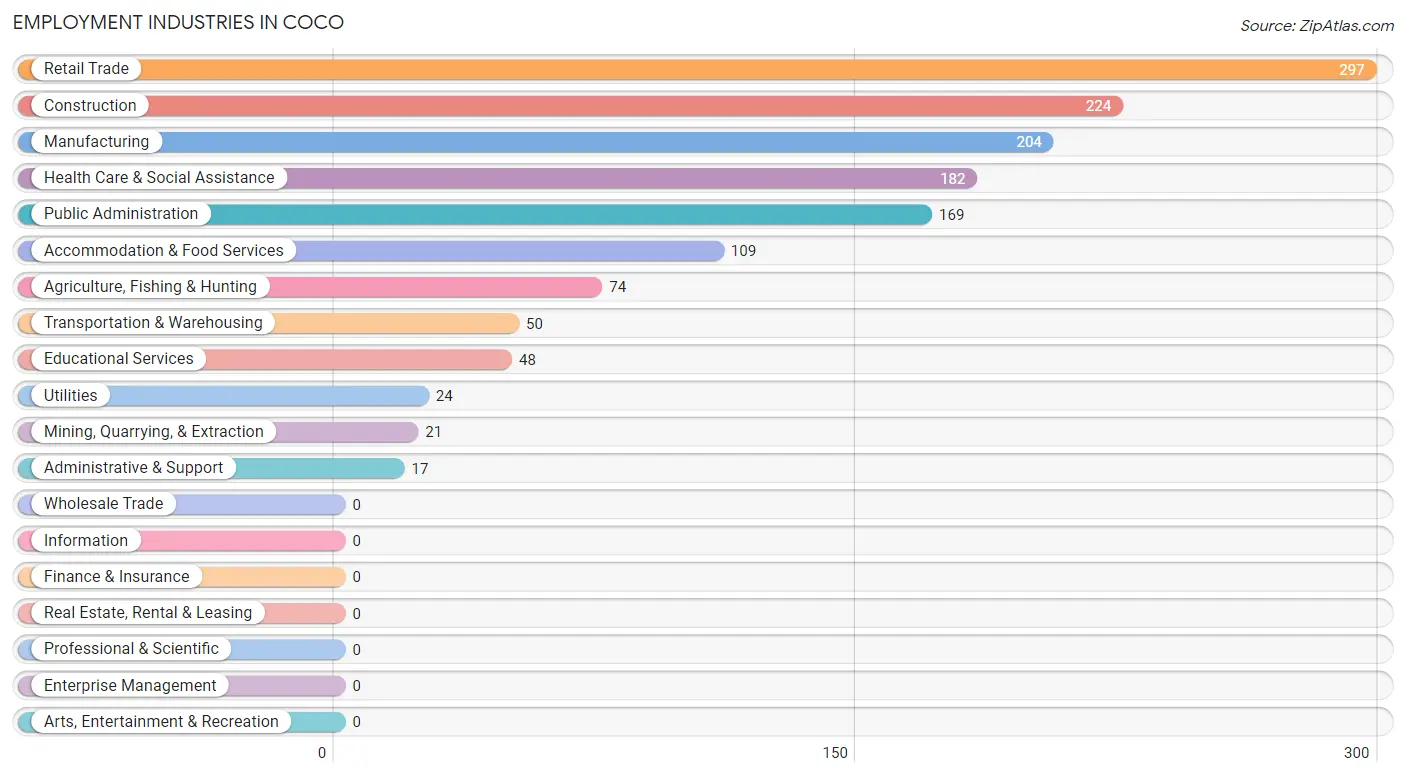
Employment Industries in Coco
The major employment industries in Coco include Retail Trade (297 | 19.4%), Construction (224 | 14.6%), Manufacturing (204 | 13.3%), Health Care & Social Assistance (182 | 11.9%), and Public Administration (169 | 11.0%).
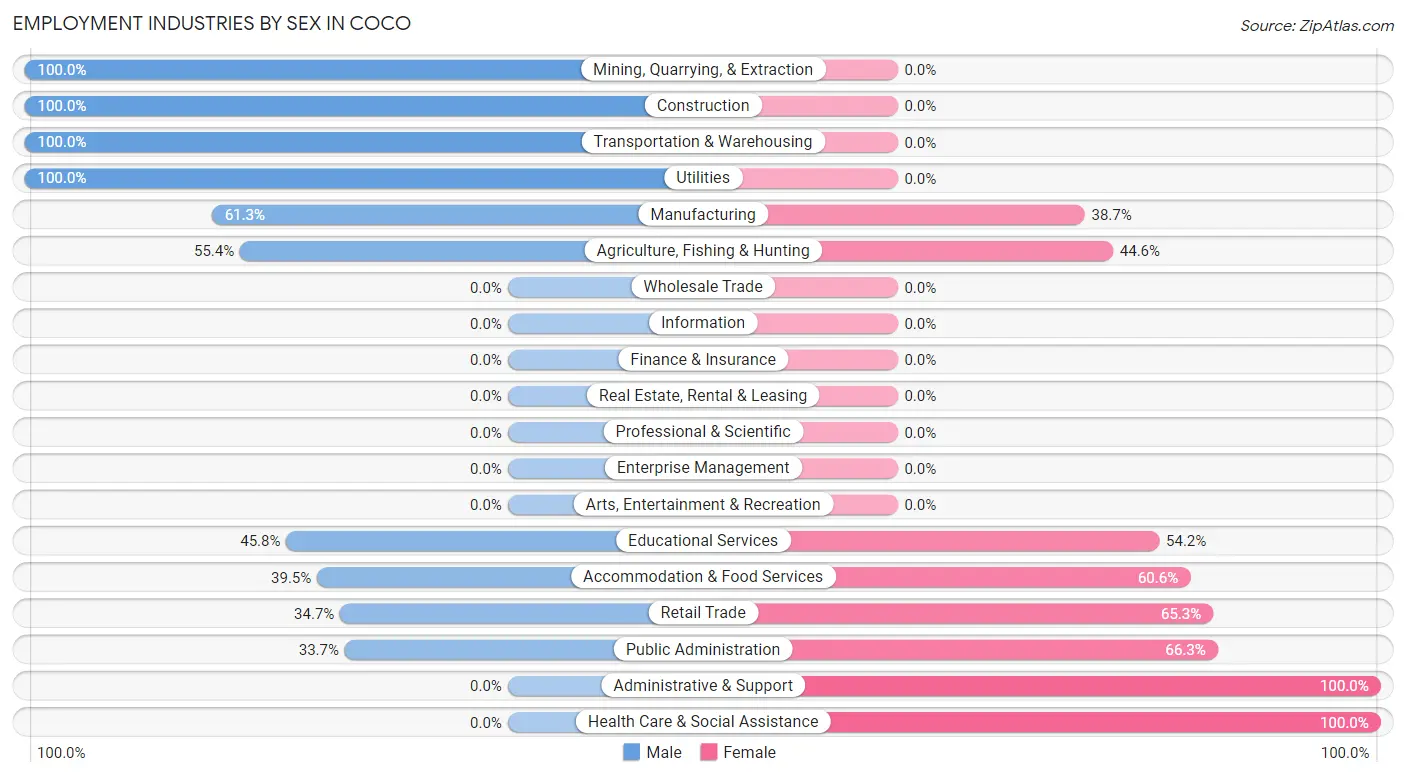
Employment Industries by Sex in Coco
The Coco industries that see more men than women are Mining, Quarrying, & Extraction (100.0%), Construction (100.0%), and Transportation & Warehousing (100.0%), whereas the industries that tend to have a higher number of women are Administrative & Support (100.0%), Health Care & Social Assistance (100.0%), and Public Administration (66.3%).
| Industry | Male | Female |
| Agriculture, Fishing & Hunting | 41 (55.4%) | 33 (44.6%) |
| Mining, Quarrying, & Extraction | 21 (100.0%) | 0 (0.0%) |
| Construction | 224 (100.0%) | 0 (0.0%) |
| Manufacturing | 125 (61.3%) | 79 (38.7%) |
| Wholesale Trade | 0 (0.0%) | 0 (0.0%) |
| Retail Trade | 103 (34.7%) | 194 (65.3%) |
| Transportation & Warehousing | 50 (100.0%) | 0 (0.0%) |
| Utilities | 24 (100.0%) | 0 (0.0%) |
| Information | 0 (0.0%) | 0 (0.0%) |
| Finance & Insurance | 0 (0.0%) | 0 (0.0%) |
| Real Estate, Rental & Leasing | 0 (0.0%) | 0 (0.0%) |
| Professional & Scientific | 0 (0.0%) | 0 (0.0%) |
| Enterprise Management | 0 (0.0%) | 0 (0.0%) |
| Administrative & Support | 0 (0.0%) | 17 (100.0%) |
| Educational Services | 22 (45.8%) | 26 (54.2%) |
| Health Care & Social Assistance | 0 (0.0%) | 182 (100.0%) |
| Arts, Entertainment & Recreation | 0 (0.0%) | 0 (0.0%) |
| Accommodation & Food Services | 43 (39.5%) | 66 (60.6%) |
| Public Administration | 57 (33.7%) | 112 (66.3%) |
| Total | 765 (50.0%) | 766 (50.0%) |
Education in Coco
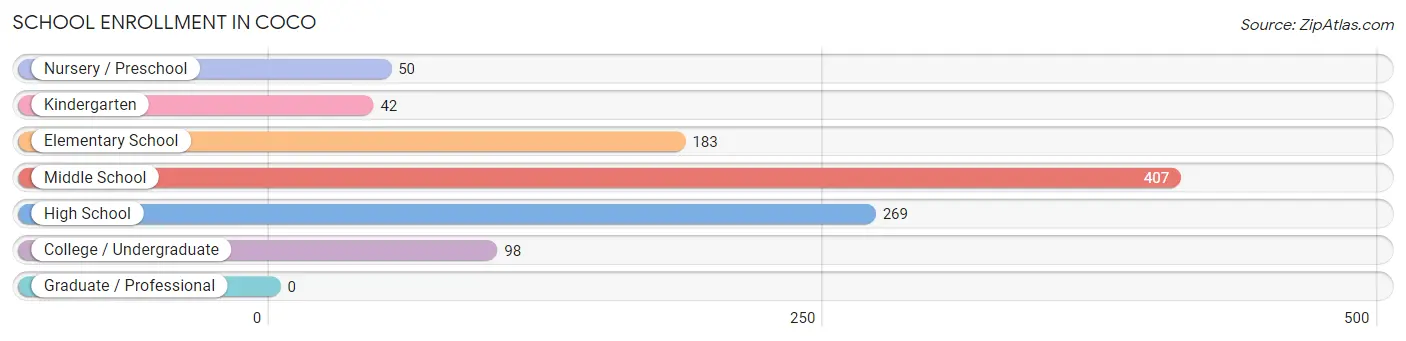
School Enrollment in Coco
The most common levels of schooling among the 1,049 students in Coco are middle school (407 | 38.8%), high school (269 | 25.6%), and elementary school (183 | 17.4%).
| School Level | # Students | % Students |
| Nursery / Preschool | 50 | 4.8% |
| Kindergarten | 42 | 4.0% |
| Elementary School | 183 | 17.4% |
| Middle School | 407 | 38.8% |
| High School | 269 | 25.6% |
| College / Undergraduate | 98 | 9.3% |
| Graduate / Professional | 0 | 0.0% |
| Total | 1,049 | 100.0% |
School Enrollment by Age by Funding Source in Coco
Out of a total of 1,049 students who are enrolled in schools in Coco, 61 (5.8%) attend a private institution, while the remaining 988 (94.2%) are enrolled in public schools. The age group of 20 to 24 year olds has the highest likelihood of being enrolled in private schools, with 17 (100.0% in the age bracket) enrolled. Conversely, the age group of 3 to 4 year olds has the lowest likelihood of being enrolled in a private school, with 50 (100.0% in the age bracket) attending a public institution.
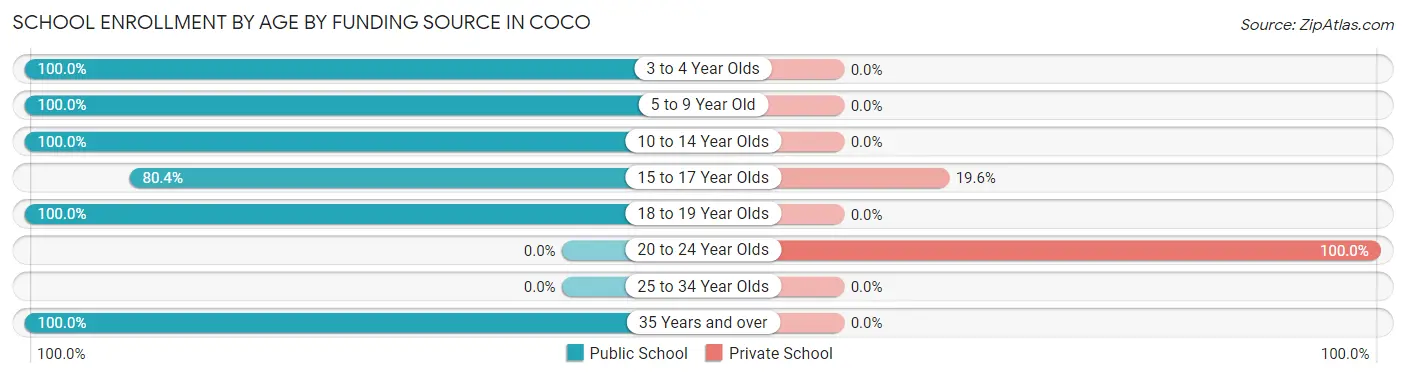
| Age Bracket | Public School | Private School |
| 3 to 4 Year Olds | 50 (100.0%) | 0 (0.0%) |
| 5 to 9 Year Old | 225 (100.0%) | 0 (0.0%) |
| 10 to 14 Year Olds | 392 (100.0%) | 0 (0.0%) |
| 15 to 17 Year Olds | 181 (80.4%) | 44 (19.6%) |
| 18 to 19 Year Olds | 77 (100.0%) | 0 (0.0%) |
| 20 to 24 Year Olds | 0 (0.0%) | 17 (100.0%) |
| 25 to 34 Year Olds | 0 (0.0%) | 0 (0.0%) |
| 35 Years and over | 63 (100.0%) | 0 (0.0%) |
| Total | 988 (94.2%) | 61 (5.8%) |
Educational Attainment by Field of Study in Coco
Education (180 | 34.9%), social sciences (113 | 21.9%), business (112 | 21.7%), computers & mathematics (33 | 6.4%), and physical & health sciences (27 | 5.2%) are the most common fields of study among 516 individuals in Coco who have obtained a bachelor's degree or higher.
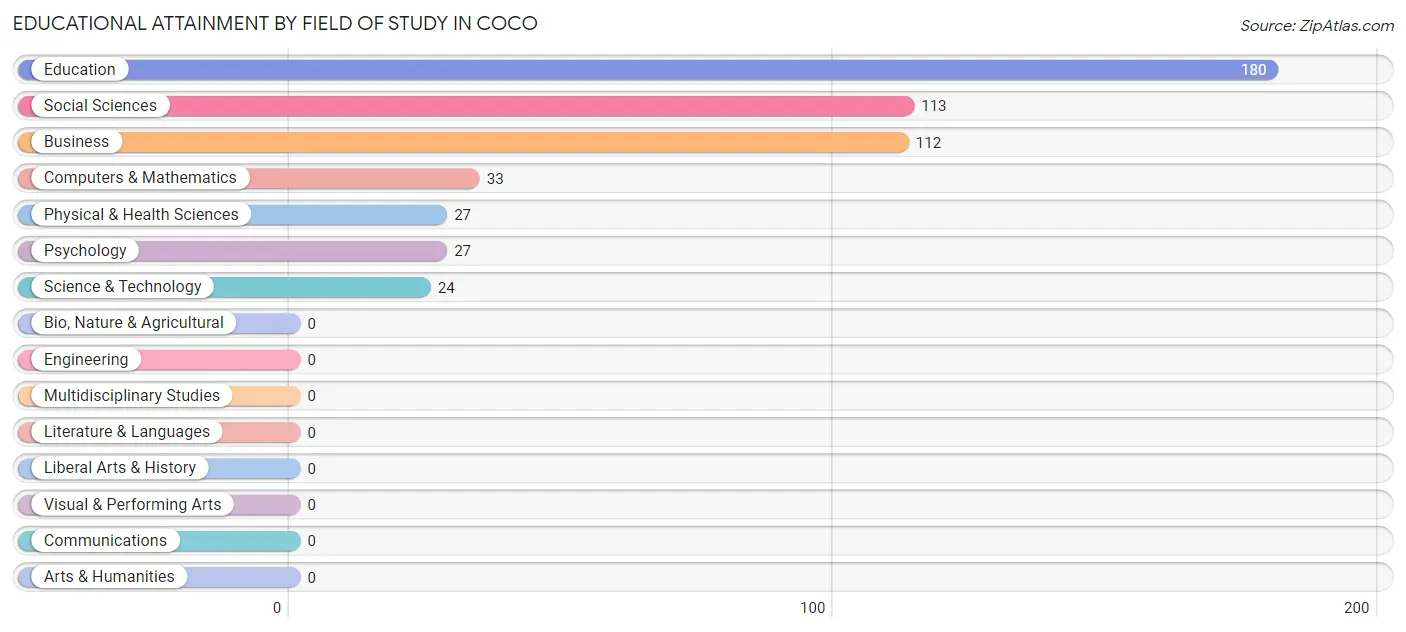
| Field of Study | # Graduates | % Graduates |
| Computers & Mathematics | 33 | 6.4% |
| Bio, Nature & Agricultural | 0 | 0.0% |
| Physical & Health Sciences | 27 | 5.2% |
| Psychology | 27 | 5.2% |
| Social Sciences | 113 | 21.9% |
| Engineering | 0 | 0.0% |
| Multidisciplinary Studies | 0 | 0.0% |
| Science & Technology | 24 | 4.6% |
| Business | 112 | 21.7% |
| Education | 180 | 34.9% |
| Literature & Languages | 0 | 0.0% |
| Liberal Arts & History | 0 | 0.0% |
| Visual & Performing Arts | 0 | 0.0% |
| Communications | 0 | 0.0% |
| Arts & Humanities | 0 | 0.0% |
| Total | 516 | 100.0% |
Transportation & Commute in Coco
Vehicle Availability by Sex in Coco
The most prevalent vehicle ownership categories in Coco are males with 2 vehicles (333, accounting for 43.5%) and females with 2 vehicles (291, making up 46.7%).
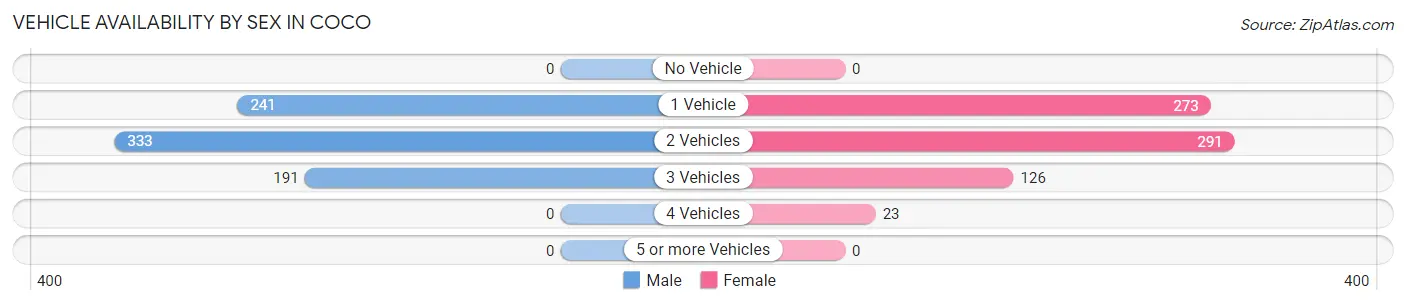
| Vehicles Available | Male | Female |
| No Vehicle | 0 (0.0%) | 0 (0.0%) |
| 1 Vehicle | 241 (31.5%) | 273 (38.3%) |
| 2 Vehicles | 333 (43.5%) | 291 (40.8%) |
| 3 Vehicles | 191 (25.0%) | 126 (17.7%) |
| 4 Vehicles | 0 (0.0%) | 23 (3.2%) |
| 5 or more Vehicles | 0 (0.0%) | 0 (0.0%) |
| Total | 765 (100.0%) | 713 (100.0%) |
Commute Time in Coco
The most frequently occuring commute durations in Coco are 30 to 34 minutes (292 commuters, 20.7%), 10 to 14 minutes (250 commuters, 17.7%), and 60 to 89 minutes (149 commuters, 10.6%).
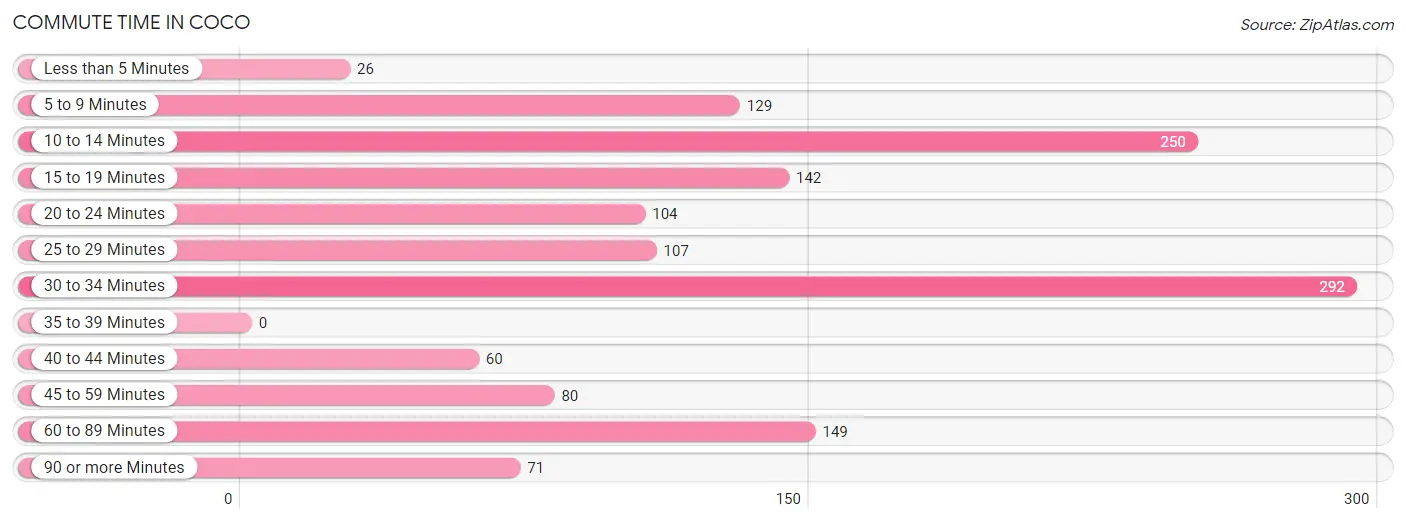
| Commute Time | # Commuters | % Commuters |
| Less than 5 Minutes | 26 | 1.8% |
| 5 to 9 Minutes | 129 | 9.1% |
| 10 to 14 Minutes | 250 | 17.7% |
| 15 to 19 Minutes | 142 | 10.1% |
| 20 to 24 Minutes | 104 | 7.4% |
| 25 to 29 Minutes | 107 | 7.6% |
| 30 to 34 Minutes | 292 | 20.7% |
| 35 to 39 Minutes | 0 | 0.0% |
| 40 to 44 Minutes | 60 | 4.3% |
| 45 to 59 Minutes | 80 | 5.7% |
| 60 to 89 Minutes | 149 | 10.6% |
| 90 or more Minutes | 71 | 5.0% |
Commute Time by Sex in Coco
The most common commute times in Coco are 60 to 89 minutes (126 commuters, 16.5%) for males and 30 to 34 minutes (181 commuters, 28.1%) for females.
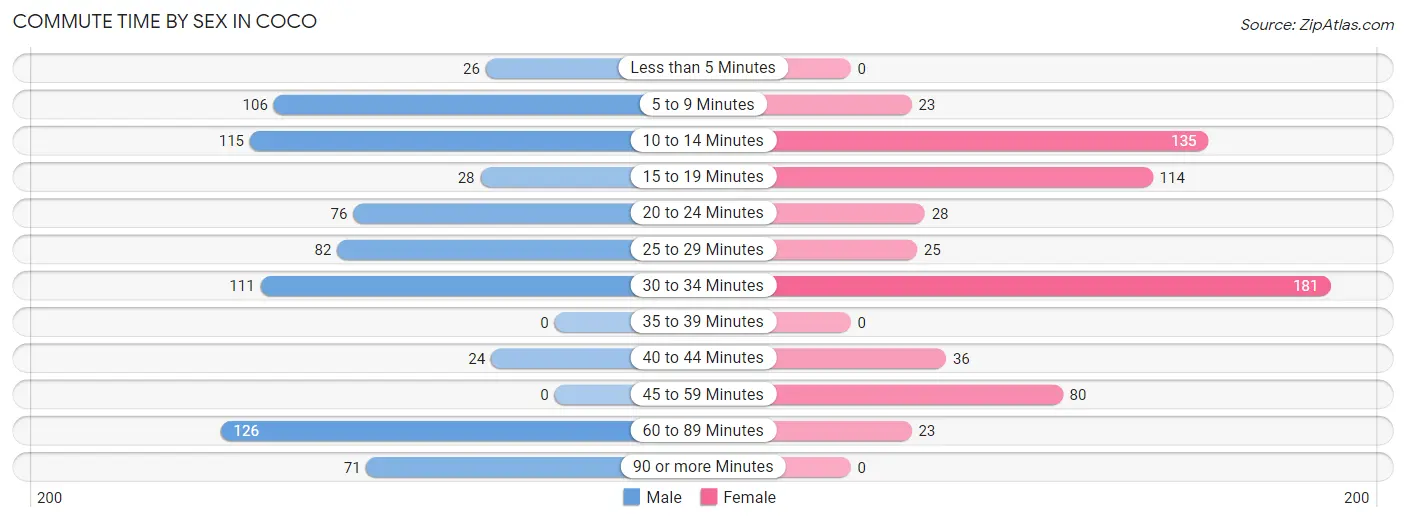
| Commute Time | Male | Female |
| Less than 5 Minutes | 26 (3.4%) | 0 (0.0%) |
| 5 to 9 Minutes | 106 (13.9%) | 23 (3.6%) |
| 10 to 14 Minutes | 115 (15.0%) | 135 (20.9%) |
| 15 to 19 Minutes | 28 (3.7%) | 114 (17.7%) |
| 20 to 24 Minutes | 76 (9.9%) | 28 (4.3%) |
| 25 to 29 Minutes | 82 (10.7%) | 25 (3.9%) |
| 30 to 34 Minutes | 111 (14.5%) | 181 (28.1%) |
| 35 to 39 Minutes | 0 (0.0%) | 0 (0.0%) |
| 40 to 44 Minutes | 24 (3.1%) | 36 (5.6%) |
| 45 to 59 Minutes | 0 (0.0%) | 80 (12.4%) |
| 60 to 89 Minutes | 126 (16.5%) | 23 (3.6%) |
| 90 or more Minutes | 71 (9.3%) | 0 (0.0%) |
Time of Departure to Work by Sex in Coco
The most frequent times of departure to work in Coco are 5:00 AM to 5:29 AM (277, 36.2%) for males and 7:00 AM to 7:29 AM (111, 17.2%) for females.
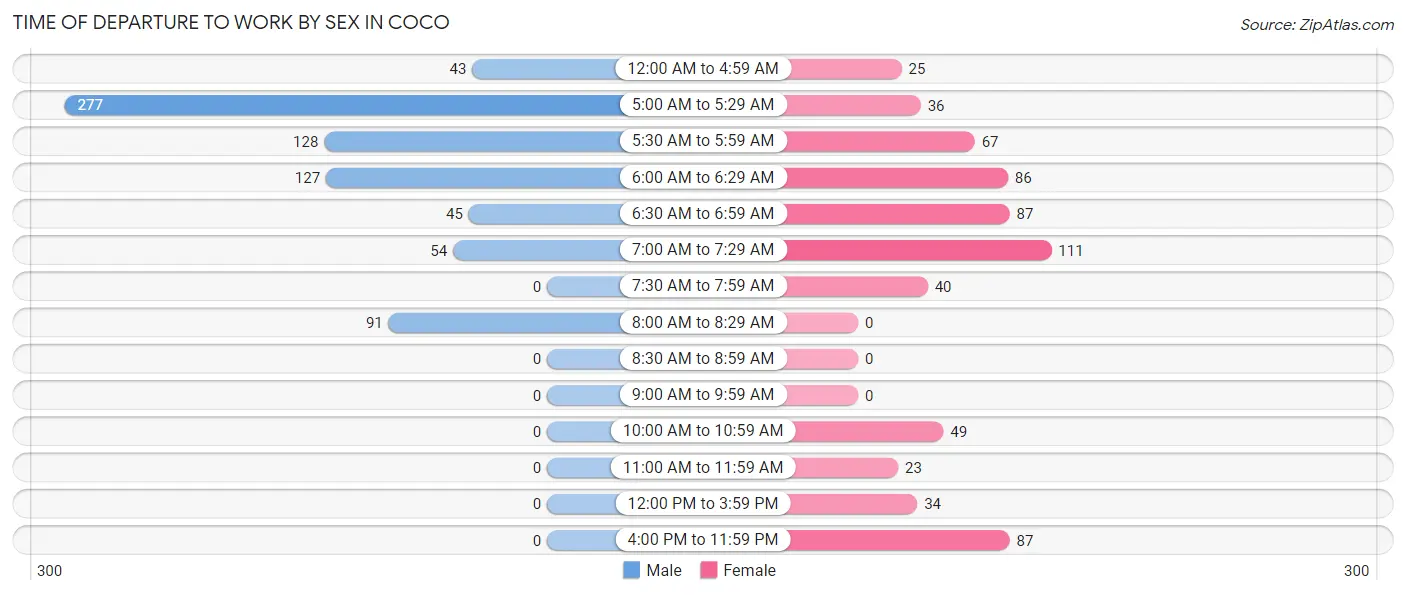
| Time of Departure | Male | Female |
| 12:00 AM to 4:59 AM | 43 (5.6%) | 25 (3.9%) |
| 5:00 AM to 5:29 AM | 277 (36.2%) | 36 (5.6%) |
| 5:30 AM to 5:59 AM | 128 (16.7%) | 67 (10.4%) |
| 6:00 AM to 6:29 AM | 127 (16.6%) | 86 (13.3%) |
| 6:30 AM to 6:59 AM | 45 (5.9%) | 87 (13.5%) |
| 7:00 AM to 7:29 AM | 54 (7.1%) | 111 (17.2%) |
| 7:30 AM to 7:59 AM | 0 (0.0%) | 40 (6.2%) |
| 8:00 AM to 8:29 AM | 91 (11.9%) | 0 (0.0%) |
| 8:30 AM to 8:59 AM | 0 (0.0%) | 0 (0.0%) |
| 9:00 AM to 9:59 AM | 0 (0.0%) | 0 (0.0%) |
| 10:00 AM to 10:59 AM | 0 (0.0%) | 49 (7.6%) |
| 11:00 AM to 11:59 AM | 0 (0.0%) | 23 (3.6%) |
| 12:00 PM to 3:59 PM | 0 (0.0%) | 34 (5.3%) |
| 4:00 PM to 11:59 PM | 0 (0.0%) | 87 (13.5%) |
| Total | 765 (100.0%) | 645 (100.0%) |
Housing Occupancy in Coco
Occupancy by Ownership in Coco
Of the total 1,937 dwellings in Coco, owner-occupied units account for 1,307 (67.5%), while renter-occupied units make up 630 (32.5%).
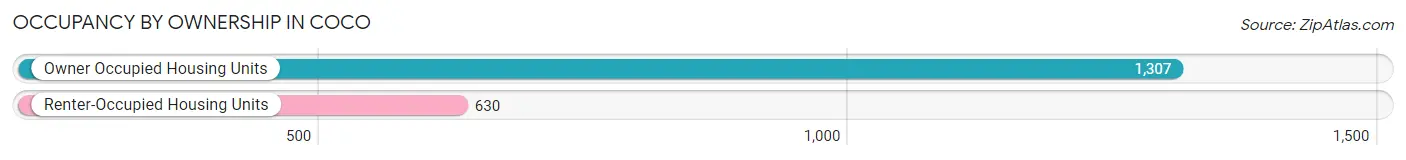
| Occupancy | # Housing Units | % Housing Units |
| Owner Occupied Housing Units | 1,307 | 67.5% |
| Renter-Occupied Housing Units | 630 | 32.5% |
| Total Occupied Housing Units | 1,937 | 100.0% |
Occupancy by Household Size in Coco
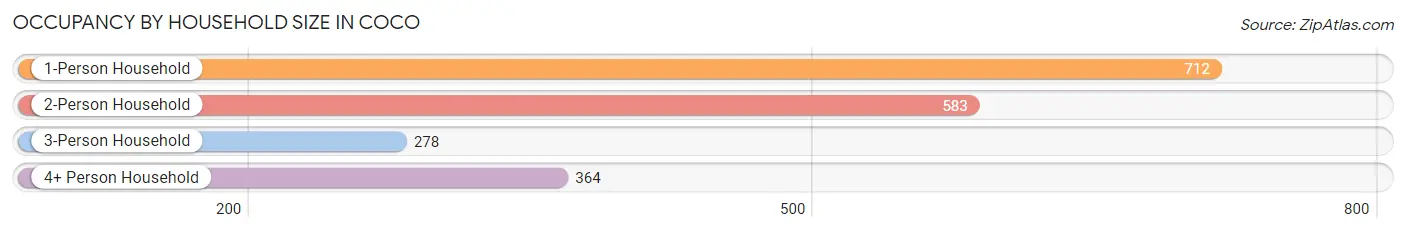
| Household Size | # Housing Units | % Housing Units |
| 1-Person Household | 712 | 36.8% |
| 2-Person Household | 583 | 30.1% |
| 3-Person Household | 278 | 14.3% |
| 4+ Person Household | 364 | 18.8% |
| Total Housing Units | 1,937 | 100.0% |
Occupancy by Ownership by Household Size in Coco
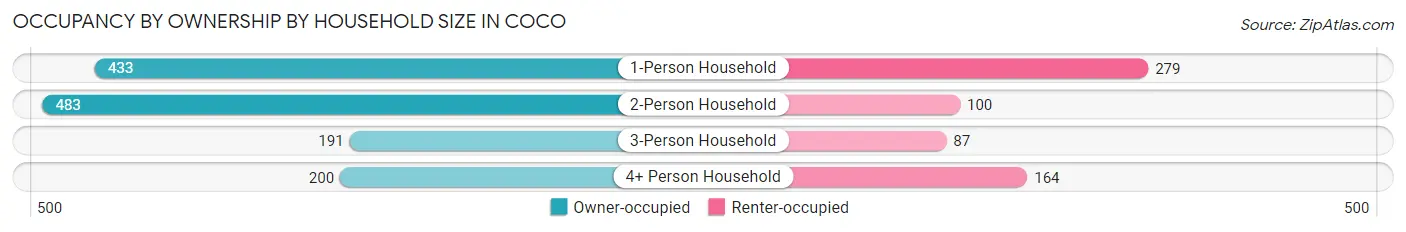
| Household Size | Owner-occupied | Renter-occupied |
| 1-Person Household | 433 (60.8%) | 279 (39.2%) |
| 2-Person Household | 483 (82.9%) | 100 (17.2%) |
| 3-Person Household | 191 (68.7%) | 87 (31.3%) |
| 4+ Person Household | 200 (54.9%) | 164 (45.1%) |
| Total Housing Units | 1,307 (67.5%) | 630 (32.5%) |
Occupancy by Educational Attainment in Coco
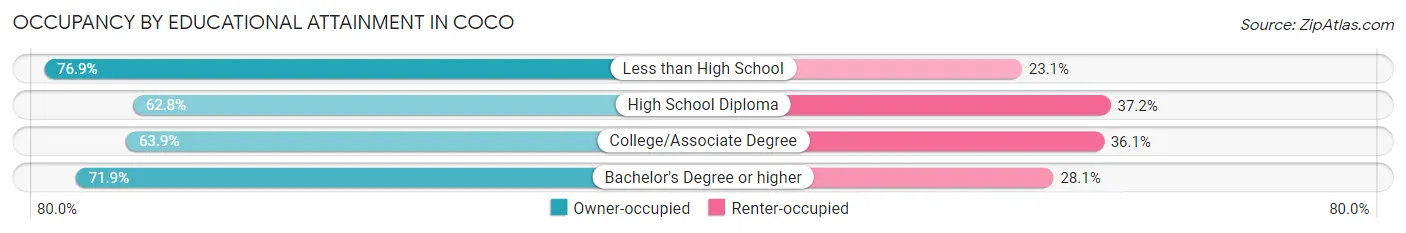
| Household Size | Owner-occupied | Renter-occupied |
| Less than High School | 316 (76.9%) | 95 (23.1%) |
| High School Diploma | 534 (62.8%) | 316 (37.2%) |
| College/Associate Degree | 232 (63.9%) | 131 (36.1%) |
| Bachelor's Degree or higher | 225 (71.9%) | 88 (28.1%) |
Occupancy by Age of Householder in Coco
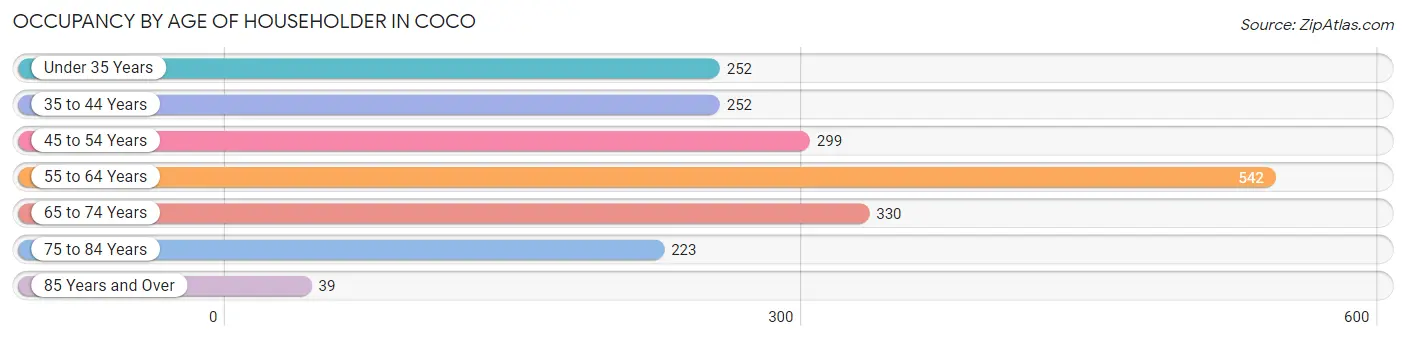
| Age Bracket | # Households | % Households |
| Under 35 Years | 252 | 13.0% |
| 35 to 44 Years | 252 | 13.0% |
| 45 to 54 Years | 299 | 15.4% |
| 55 to 64 Years | 542 | 28.0% |
| 65 to 74 Years | 330 | 17.0% |
| 75 to 84 Years | 223 | 11.5% |
| 85 Years and Over | 39 | 2.0% |
| Total | 1,937 | 100.0% |
Housing Finances in Coco
Median Income by Occupancy in Coco
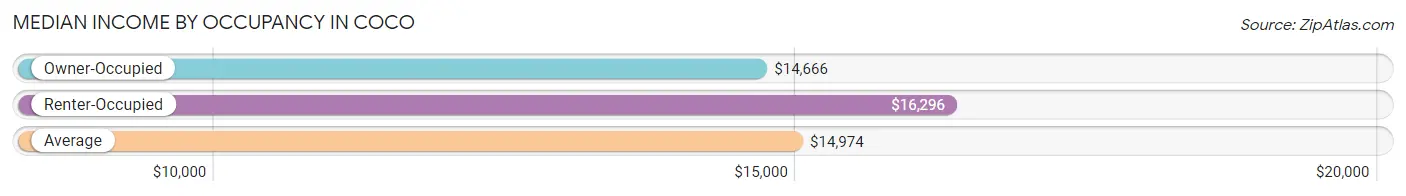
| Occupancy Type | # Households | Median Income |
| Owner-Occupied | 1,307 (67.5%) | $14,666 |
| Renter-Occupied | 630 (32.5%) | $16,296 |
| Average | 1,937 (100.0%) | $14,974 |
Occupancy by Householder Income Bracket in Coco
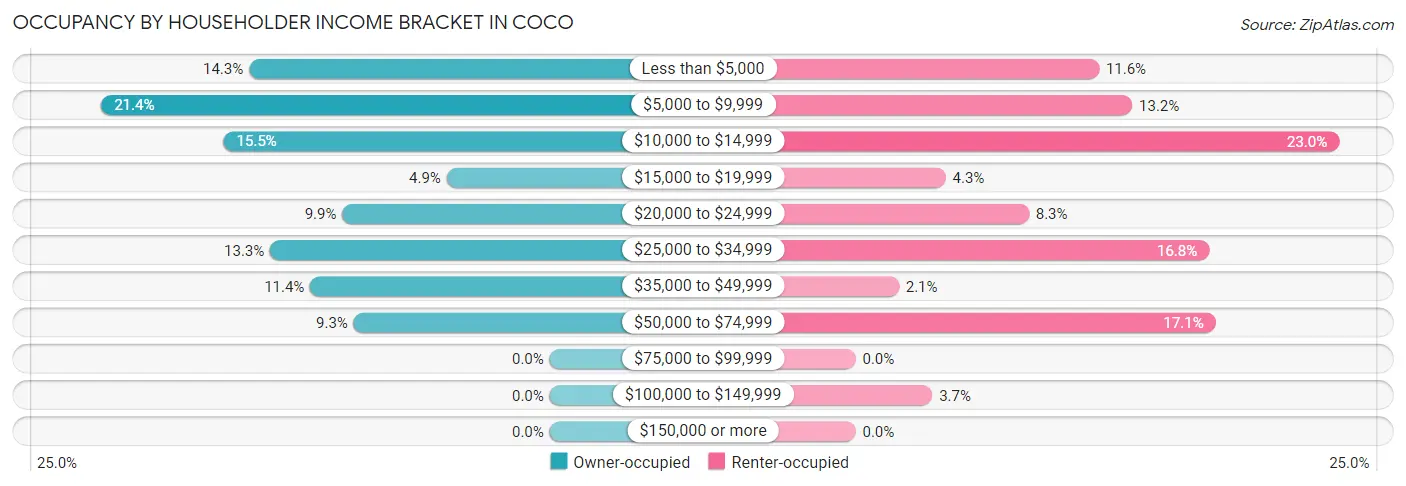
| Income Bracket | Owner-occupied | Renter-occupied |
| Less than $5,000 | 187 (14.3%) | 73 (11.6%) |
| $5,000 to $9,999 | 279 (21.3%) | 83 (13.2%) |
| $10,000 to $14,999 | 203 (15.5%) | 145 (23.0%) |
| $15,000 to $19,999 | 64 (4.9%) | 27 (4.3%) |
| $20,000 to $24,999 | 129 (9.9%) | 52 (8.3%) |
| $25,000 to $34,999 | 174 (13.3%) | 106 (16.8%) |
| $35,000 to $49,999 | 149 (11.4%) | 13 (2.1%) |
| $50,000 to $74,999 | 122 (9.3%) | 108 (17.1%) |
| $75,000 to $99,999 | 0 (0.0%) | 0 (0.0%) |
| $100,000 to $149,999 | 0 (0.0%) | 23 (3.6%) |
| $150,000 or more | 0 (0.0%) | 0 (0.0%) |
| Total | 1,307 (100.0%) | 630 (100.0%) |
Monthly Housing Cost Tiers in Coco
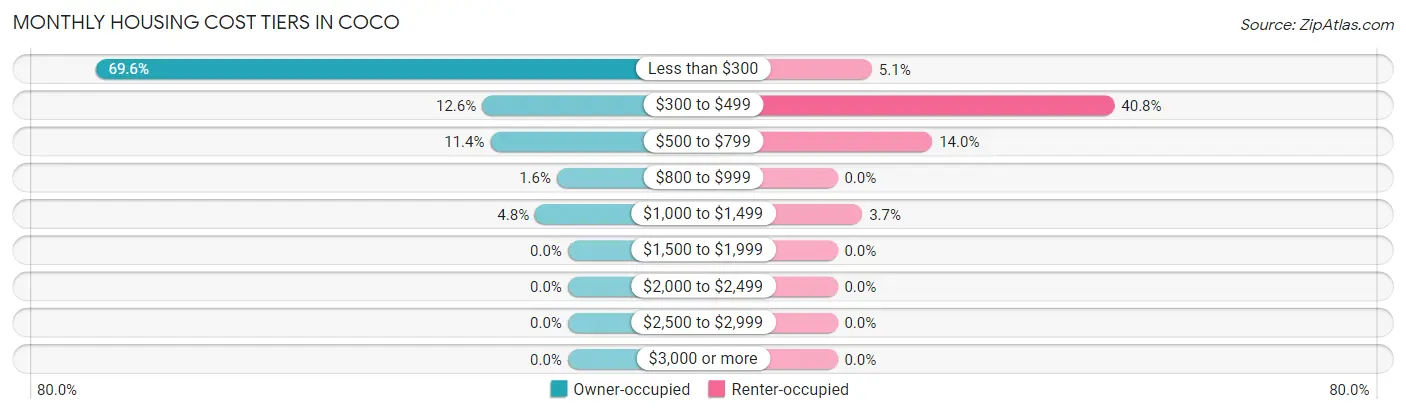
| Monthly Cost | Owner-occupied | Renter-occupied |
| Less than $300 | 909 (69.6%) | 32 (5.1%) |
| $300 to $499 | 165 (12.6%) | 257 (40.8%) |
| $500 to $799 | 149 (11.4%) | 88 (14.0%) |
| $800 to $999 | 21 (1.6%) | 0 (0.0%) |
| $1,000 to $1,499 | 63 (4.8%) | 23 (3.6%) |
| $1,500 to $1,999 | 0 (0.0%) | 0 (0.0%) |
| $2,000 to $2,499 | 0 (0.0%) | 0 (0.0%) |
| $2,500 to $2,999 | 0 (0.0%) | 0 (0.0%) |
| $3,000 or more | 0 (0.0%) | 0 (0.0%) |
| Total | 1,307 (100.0%) | 630 (100.0%) |
Physical Housing Characteristics in Coco
Housing Structures in Coco
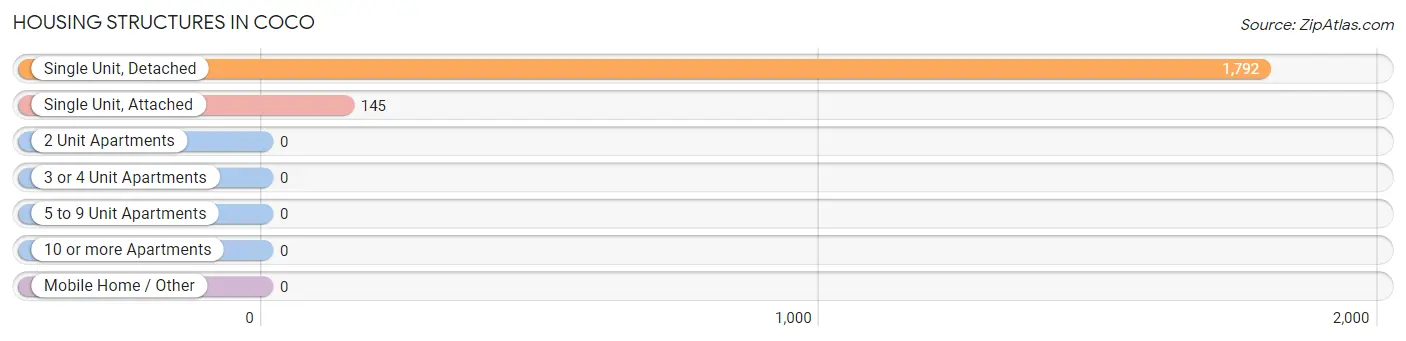
| Structure Type | # Housing Units | % Housing Units |
| Single Unit, Detached | 1,792 | 92.5% |
| Single Unit, Attached | 145 | 7.5% |
| 2 Unit Apartments | 0 | 0.0% |
| 3 or 4 Unit Apartments | 0 | 0.0% |
| 5 to 9 Unit Apartments | 0 | 0.0% |
| 10 or more Apartments | 0 | 0.0% |
| Mobile Home / Other | 0 | 0.0% |
| Total | 1,937 | 100.0% |
Housing Structures by Occupancy in Coco
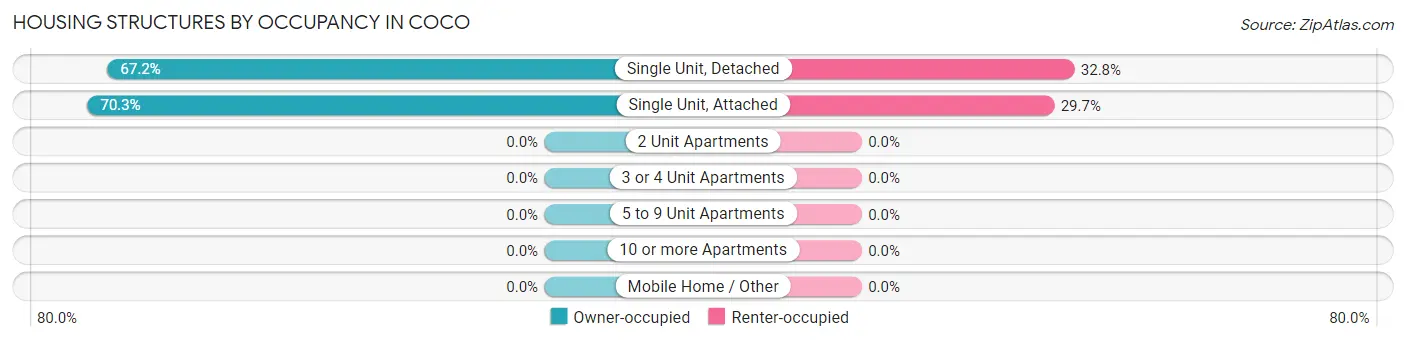
| Structure Type | Owner-occupied | Renter-occupied |
| Single Unit, Detached | 1,205 (67.2%) | 587 (32.8%) |
| Single Unit, Attached | 102 (70.3%) | 43 (29.7%) |
| 2 Unit Apartments | 0 (0.0%) | 0 (0.0%) |
| 3 or 4 Unit Apartments | 0 (0.0%) | 0 (0.0%) |
| 5 to 9 Unit Apartments | 0 (0.0%) | 0 (0.0%) |
| 10 or more Apartments | 0 (0.0%) | 0 (0.0%) |
| Mobile Home / Other | 0 (0.0%) | 0 (0.0%) |
| Total | 1,307 (67.5%) | 630 (32.5%) |
Housing Structures by Number of Rooms in Coco
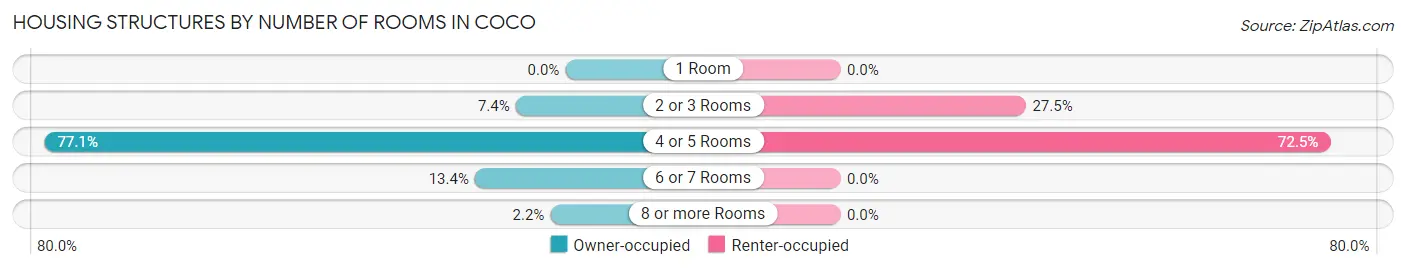
| Number of Rooms | Owner-occupied | Renter-occupied |
| 1 Room | 0 (0.0%) | 0 (0.0%) |
| 2 or 3 Rooms | 96 (7.3%) | 173 (27.5%) |
| 4 or 5 Rooms | 1,007 (77.0%) | 457 (72.5%) |
| 6 or 7 Rooms | 175 (13.4%) | 0 (0.0%) |
| 8 or more Rooms | 29 (2.2%) | 0 (0.0%) |
| Total | 1,307 (100.0%) | 630 (100.0%) |
Housing Structure by Heating Type in Coco
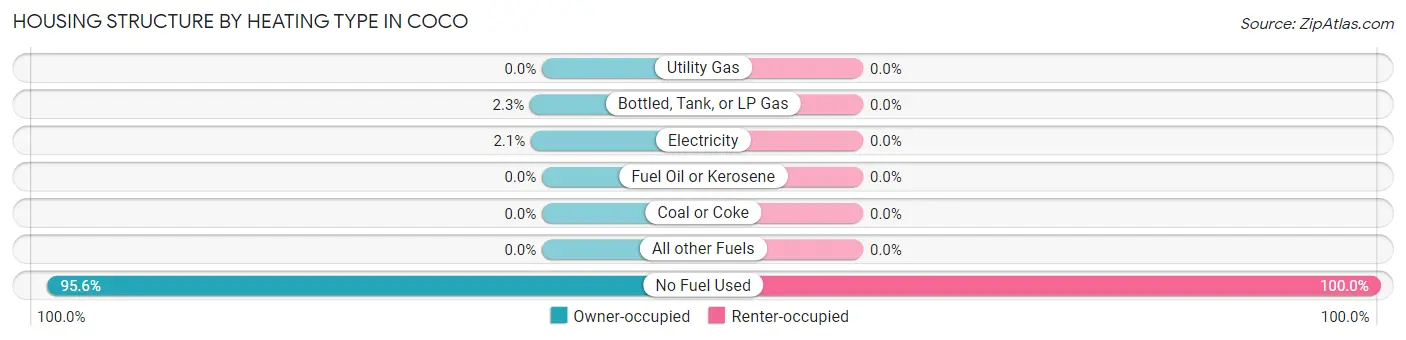
| Heating Type | Owner-occupied | Renter-occupied |
| Utility Gas | 0 (0.0%) | 0 (0.0%) |
| Bottled, Tank, or LP Gas | 30 (2.3%) | 0 (0.0%) |
| Electricity | 28 (2.1%) | 0 (0.0%) |
| Fuel Oil or Kerosene | 0 (0.0%) | 0 (0.0%) |
| Coal or Coke | 0 (0.0%) | 0 (0.0%) |
| All other Fuels | 0 (0.0%) | 0 (0.0%) |
| No Fuel Used | 1,249 (95.6%) | 630 (100.0%) |
| Total | 1,307 (100.0%) | 630 (100.0%) |
Household Vehicle Usage in Coco
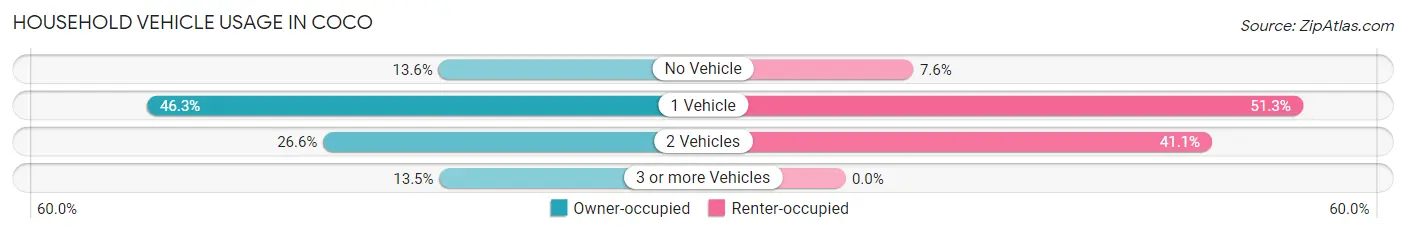
| Vehicles per Household | Owner-occupied | Renter-occupied |
| No Vehicle | 178 (13.6%) | 48 (7.6%) |
| 1 Vehicle | 605 (46.3%) | 323 (51.3%) |
| 2 Vehicles | 347 (26.6%) | 259 (41.1%) |
| 3 or more Vehicles | 177 (13.5%) | 0 (0.0%) |
| Total | 1,307 (100.0%) | 630 (100.0%) |
Real Estate & Mortgages in Coco
Real Estate and Mortgage Overview in Coco
| Characteristic | Without Mortgage | With Mortgage |
| Housing Units | 1,085 | 222 |
| Median Property Value | $66,300 | $104,300 |
| Median Household Income | $13,940 | $0 |
| Monthly Housing Costs | $173 | $0 |
| Real Estate Taxes | - | - |
Property Value by Mortgage Status in Coco
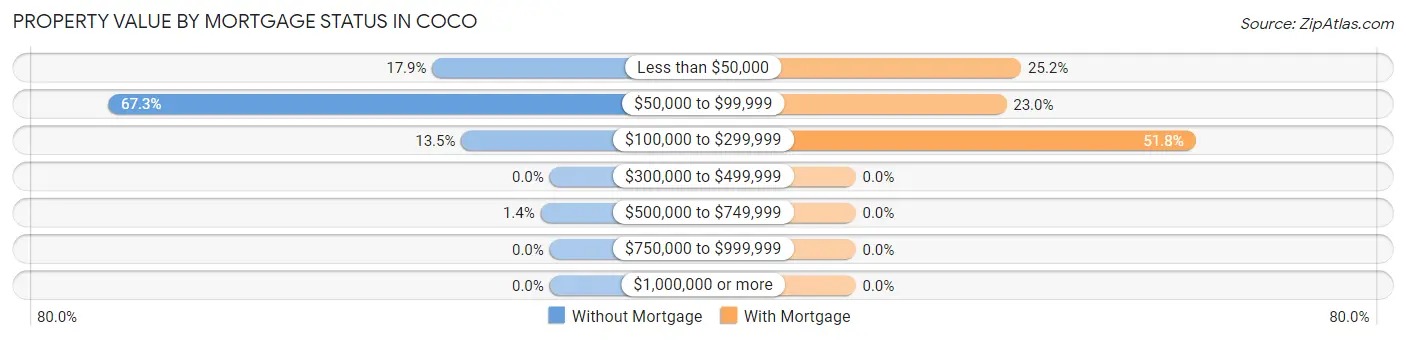
| Property Value | Without Mortgage | With Mortgage |
| Less than $50,000 | 194 (17.9%) | 56 (25.2%) |
| $50,000 to $99,999 | 730 (67.3%) | 51 (23.0%) |
| $100,000 to $299,999 | 146 (13.5%) | 115 (51.8%) |
| $300,000 to $499,999 | 0 (0.0%) | 0 (0.0%) |
| $500,000 to $749,999 | 15 (1.4%) | 0 (0.0%) |
| $750,000 to $999,999 | 0 (0.0%) | 0 (0.0%) |
| $1,000,000 or more | 0 (0.0%) | 0 (0.0%) |
| Total | 1,085 (100.0%) | 222 (100.0%) |
Household Income by Mortgage Status in Coco
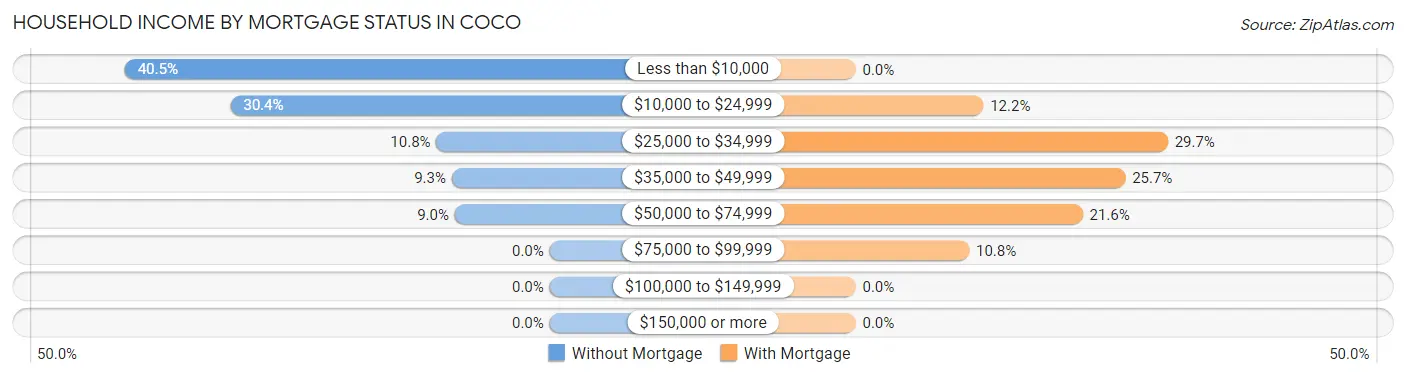
| Household Income | Without Mortgage | With Mortgage |
| Less than $10,000 | 439 (40.5%) | 0 (0.0%) |
| $10,000 to $24,999 | 330 (30.4%) | 27 (12.2%) |
| $25,000 to $34,999 | 117 (10.8%) | 66 (29.7%) |
| $35,000 to $49,999 | 101 (9.3%) | 57 (25.7%) |
| $50,000 to $74,999 | 98 (9.0%) | 48 (21.6%) |
| $75,000 to $99,999 | 0 (0.0%) | 24 (10.8%) |
| $100,000 to $149,999 | 0 (0.0%) | 0 (0.0%) |
| $150,000 or more | 0 (0.0%) | 0 (0.0%) |
| Total | 1,085 (100.0%) | 222 (100.0%) |
Property Value to Household Income Ratio in Coco
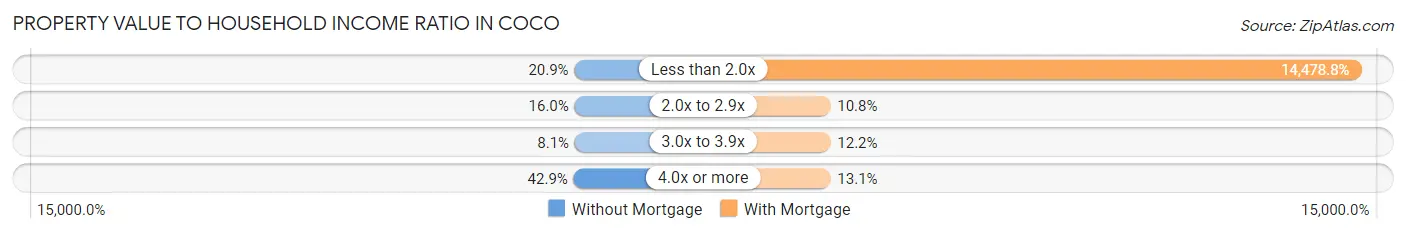
| Value-to-Income Ratio | Without Mortgage | With Mortgage |
| Less than 2.0x | 227 (20.9%) | 32,143 (14,478.8%) |
| 2.0x to 2.9x | 174 (16.0%) | 24 (10.8%) |
| 3.0x to 3.9x | 88 (8.1%) | 27 (12.2%) |
| 4.0x or more | 465 (42.9%) | 29 (13.1%) |
| Total | 1,085 (100.0%) | 222 (100.0%) |
Real Estate Taxes by Mortgage Status in Coco
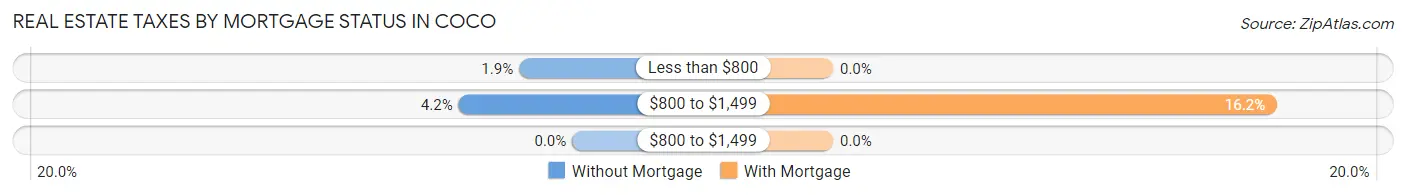
| Property Taxes | Without Mortgage | With Mortgage |
| Less than $800 | 21 (1.9%) | 0 (0.0%) |
| $800 to $1,499 | 45 (4.2%) | 36 (16.2%) |
| $800 to $1,499 | 0 (0.0%) | 0 (0.0%) |
| Total | 1,085 (100.0%) | 222 (100.0%) |
Health & Disability in Coco
Health Insurance Coverage by Age in Coco
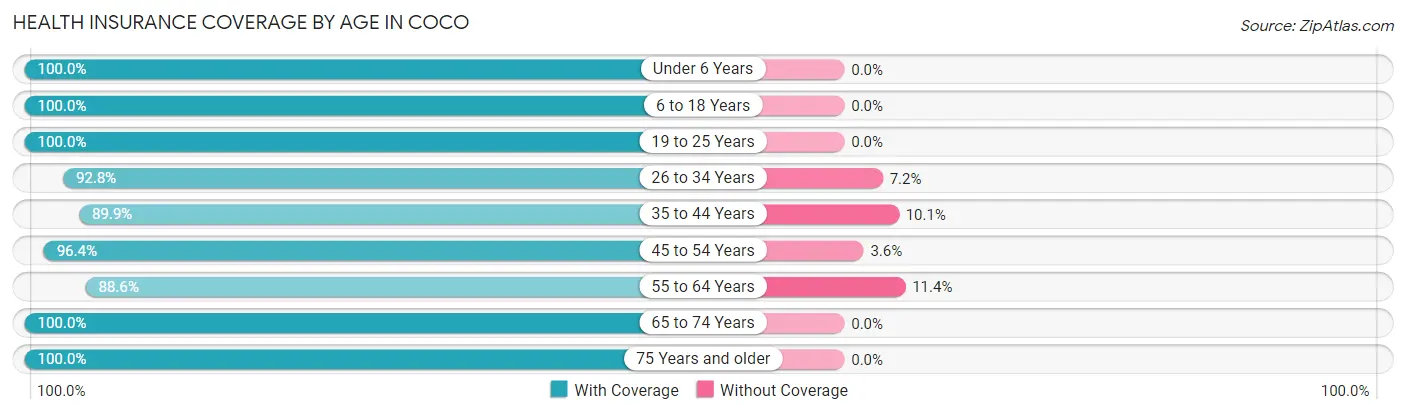
| Age Bracket | With Coverage | Without Coverage |
| Under 6 Years | 192 (100.0%) | 0 (0.0%) |
| 6 to 18 Years | 839 (100.0%) | 0 (0.0%) |
| 19 to 25 Years | 481 (100.0%) | 0 (0.0%) |
| 26 to 34 Years | 350 (92.8%) | 27 (7.2%) |
| 35 to 44 Years | 629 (89.9%) | 71 (10.1%) |
| 45 to 54 Years | 648 (96.4%) | 24 (3.6%) |
| 55 to 64 Years | 796 (88.6%) | 102 (11.4%) |
| 65 to 74 Years | 493 (100.0%) | 0 (0.0%) |
| 75 Years and older | 354 (100.0%) | 0 (0.0%) |
| Total | 4,782 (95.5%) | 224 (4.5%) |
Health Insurance Coverage by Citizenship Status in Coco
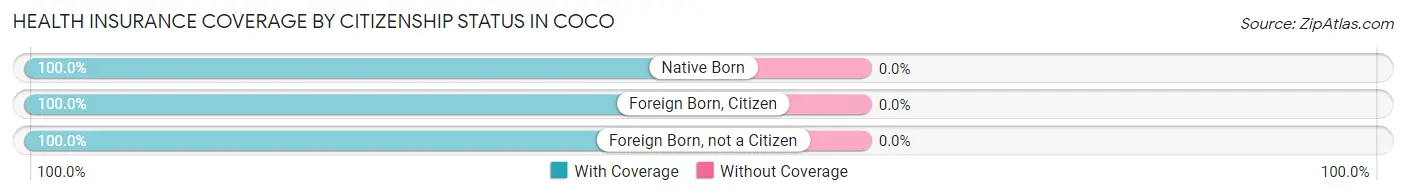
| Citizenship Status | With Coverage | Without Coverage |
| Native Born | 192 (100.0%) | 0 (0.0%) |
| Foreign Born, Citizen | 839 (100.0%) | 0 (0.0%) |
| Foreign Born, not a Citizen | 481 (100.0%) | 0 (0.0%) |
Health Insurance Coverage by Household Income in Coco
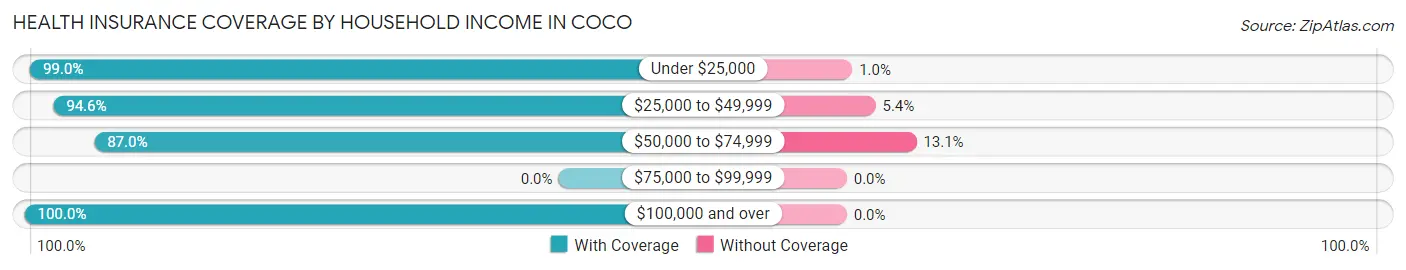
| Household Income | With Coverage | Without Coverage |
| Under $25,000 | 2,651 (99.0%) | 27 (1.0%) |
| $25,000 to $49,999 | 1,177 (94.6%) | 67 (5.4%) |
| $50,000 to $74,999 | 866 (87.0%) | 130 (13.1%) |
| $75,000 to $99,999 | 0 (0.0%) | 0 (0.0%) |
| $100,000 and over | 88 (100.0%) | 0 (0.0%) |
Public vs Private Health Insurance Coverage by Age in Coco
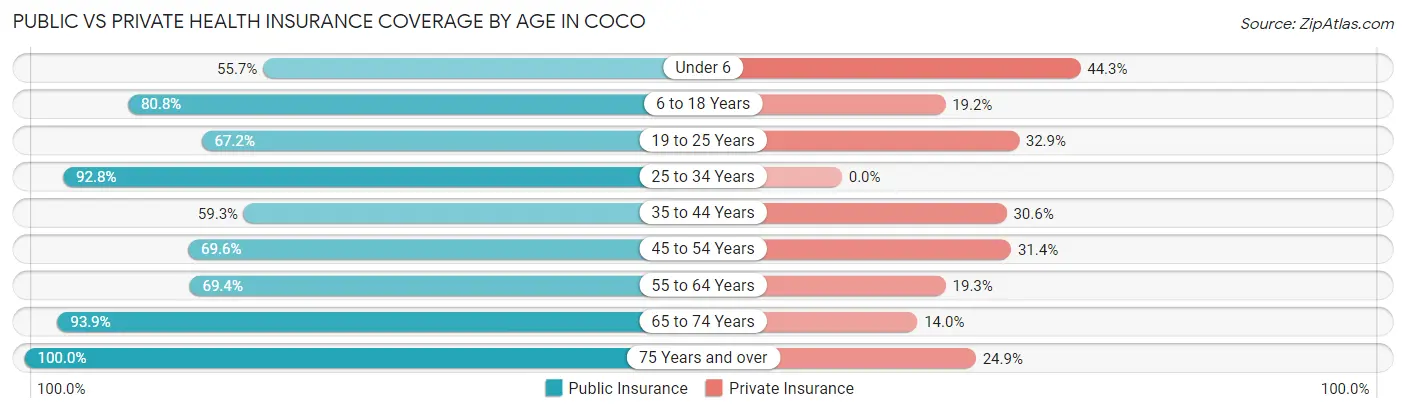
| Age Bracket | Public Insurance | Private Insurance |
| Under 6 | 107 (55.7%) | 85 (44.3%) |
| 6 to 18 Years | 678 (80.8%) | 161 (19.2%) |
| 19 to 25 Years | 323 (67.1%) | 158 (32.9%) |
| 25 to 34 Years | 350 (92.8%) | 0 (0.0%) |
| 35 to 44 Years | 415 (59.3%) | 214 (30.6%) |
| 45 to 54 Years | 468 (69.6%) | 211 (31.4%) |
| 55 to 64 Years | 623 (69.4%) | 173 (19.3%) |
| 65 to 74 Years | 463 (93.9%) | 69 (14.0%) |
| 75 Years and over | 354 (100.0%) | 88 (24.9%) |
| Total | 3,781 (75.5%) | 1,159 (23.2%) |
Disability Status by Sex by Age in Coco
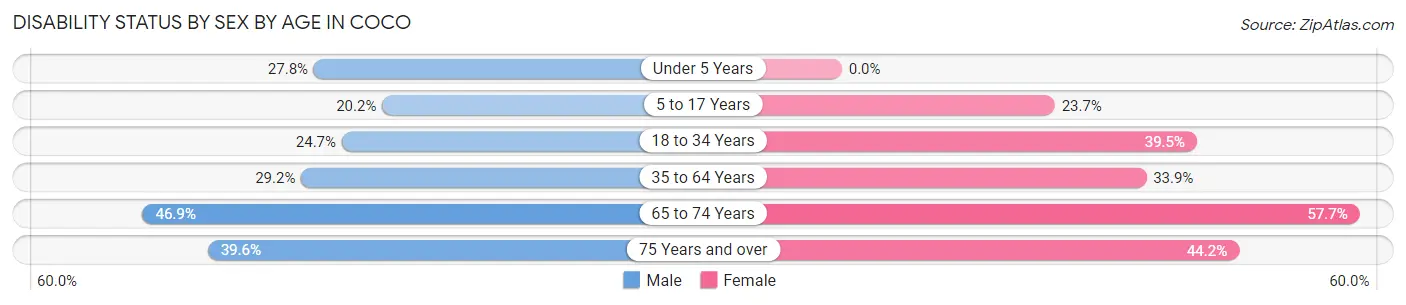
| Age Bracket | Male | Female |
| Under 5 Years | 35 (27.8%) | 0 (0.0%) |
| 5 to 17 Years | 72 (20.2%) | 115 (23.7%) |
| 18 to 34 Years | 94 (24.7%) | 204 (39.5%) |
| 35 to 64 Years | 301 (29.2%) | 420 (33.9%) |
| 65 to 74 Years | 127 (46.9%) | 128 (57.7%) |
| 75 Years and over | 99 (39.6%) | 46 (44.2%) |
Disability Class by Sex by Age in Coco
Disability Class: Hearing Difficulty
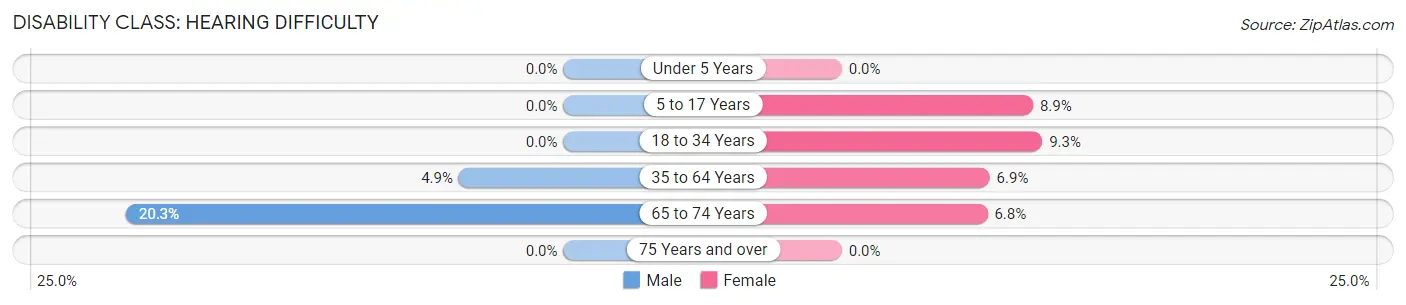
| Age Bracket | Male | Female |
| Under 5 Years | 0 (0.0%) | 0 (0.0%) |
| 5 to 17 Years | 0 (0.0%) | 43 (8.9%) |
| 18 to 34 Years | 0 (0.0%) | 48 (9.3%) |
| 35 to 64 Years | 50 (4.9%) | 85 (6.9%) |
| 65 to 74 Years | 55 (20.3%) | 15 (6.8%) |
| 75 Years and over | 0 (0.0%) | 0 (0.0%) |
Disability Class: Vision Difficulty
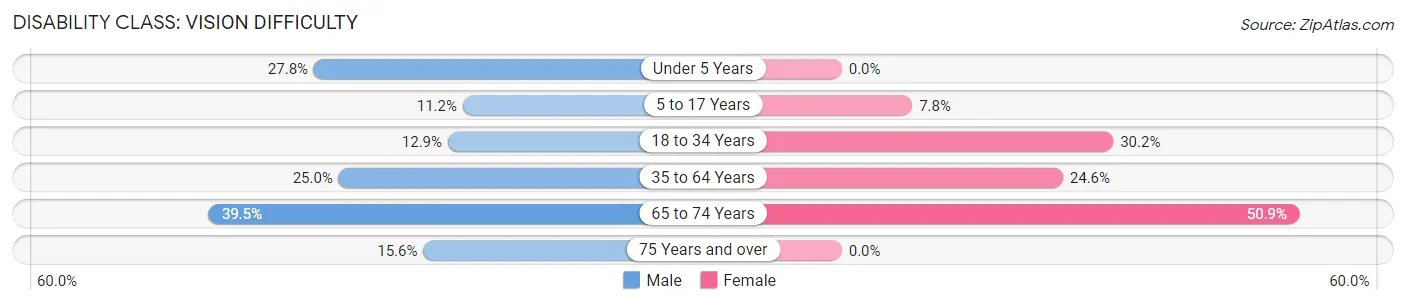
| Age Bracket | Male | Female |
| Under 5 Years | 35 (27.8%) | 0 (0.0%) |
| 5 to 17 Years | 40 (11.2%) | 38 (7.8%) |
| 18 to 34 Years | 49 (12.9%) | 156 (30.2%) |
| 35 to 64 Years | 258 (25.0%) | 305 (24.6%) |
| 65 to 74 Years | 107 (39.5%) | 113 (50.9%) |
| 75 Years and over | 39 (15.6%) | 0 (0.0%) |
Disability Class: Cognitive Difficulty
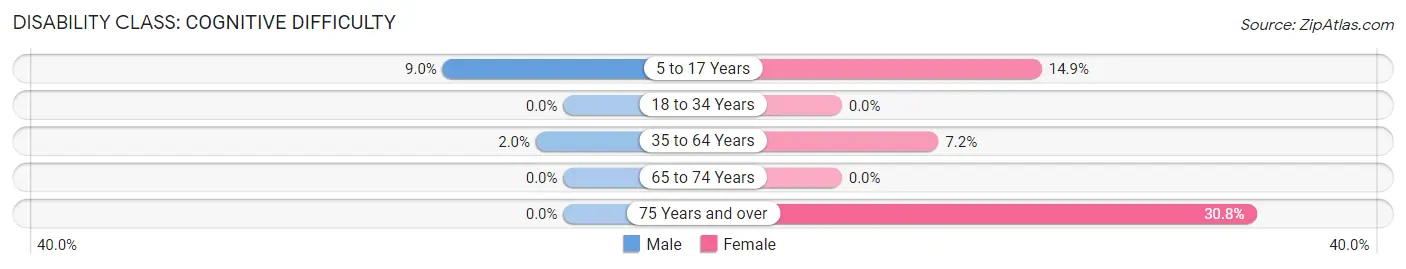
| Age Bracket | Male | Female |
| 5 to 17 Years | 32 (9.0%) | 72 (14.8%) |
| 18 to 34 Years | 0 (0.0%) | 0 (0.0%) |
| 35 to 64 Years | 21 (2.0%) | 89 (7.2%) |
| 65 to 74 Years | 0 (0.0%) | 0 (0.0%) |
| 75 Years and over | 0 (0.0%) | 32 (30.8%) |
Disability Class: Ambulatory Difficulty
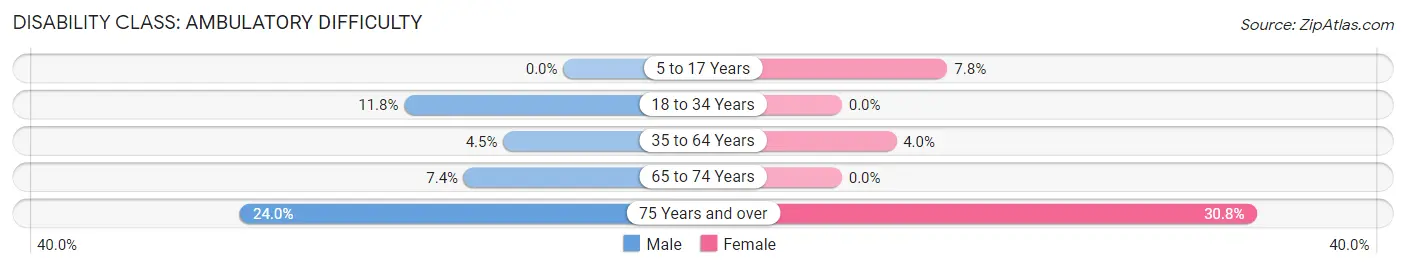
| Age Bracket | Male | Female |
| 5 to 17 Years | 0 (0.0%) | 38 (7.8%) |
| 18 to 34 Years | 45 (11.8%) | 0 (0.0%) |
| 35 to 64 Years | 46 (4.5%) | 50 (4.0%) |
| 65 to 74 Years | 20 (7.4%) | 0 (0.0%) |
| 75 Years and over | 60 (24.0%) | 32 (30.8%) |
Disability Class: Self-Care Difficulty
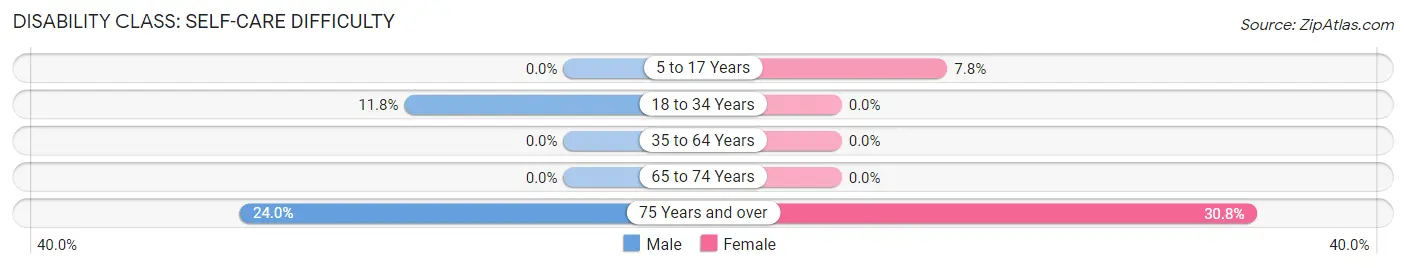
| Age Bracket | Male | Female |
| 5 to 17 Years | 0 (0.0%) | 38 (7.8%) |
| 18 to 34 Years | 45 (11.8%) | 0 (0.0%) |
| 35 to 64 Years | 0 (0.0%) | 0 (0.0%) |
| 65 to 74 Years | 0 (0.0%) | 0 (0.0%) |
| 75 Years and over | 60 (24.0%) | 32 (30.8%) |
Technology Access in Coco
Computing Device Access in Coco
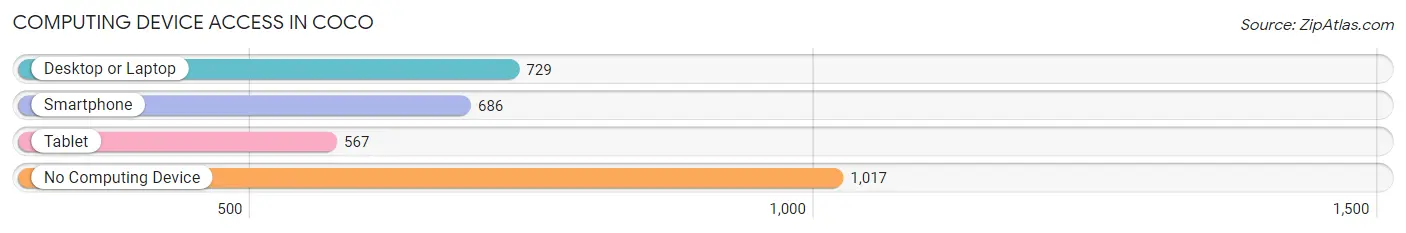
| Device Type | # Households | % Households |
| Desktop or Laptop | 729 | 37.6% |
| Smartphone | 686 | 35.4% |
| Tablet | 567 | 29.3% |
| No Computing Device | 1,017 | 52.5% |
| Total | 1,937 | 100.0% |
Internet Access in Coco
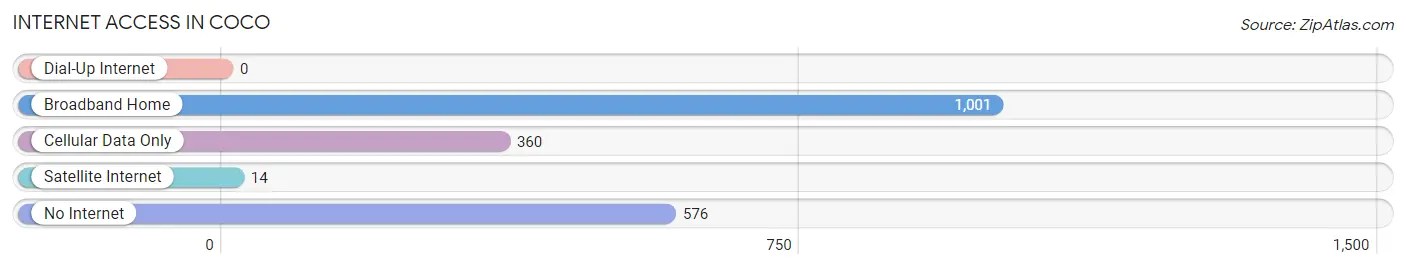
| Internet Type | # Households | % Households |
| Dial-Up Internet | 0 | 0.0% |
| Broadband Home | 1,001 | 51.7% |
| Cellular Data Only | 360 | 18.6% |
| Satellite Internet | 14 | 0.7% |
| No Internet | 576 | 29.7% |
| Total | 1,937 | 100.0% |
Coco Summary
Coco, Puerto Rico is a small island located in the Caribbean Sea, just off the coast of the Dominican Republic. It is part of the United States Commonwealth of Puerto Rico and is home to a population of approximately 3.2 million people. The island is known for its beautiful beaches, lush tropical forests, and vibrant culture.
History
The history of Coco, Puerto Rico dates back to the early 16th century when it was first discovered by Spanish explorer Christopher Columbus. The island was originally inhabited by the Taíno people, who were the indigenous people of the Caribbean. The Taíno people were eventually displaced by the Spanish, who colonized the island and established a settlement in 1511. The Spanish brought with them their language, religion, and culture, which still remain today.
In 1898, the Spanish-American War resulted in the United States gaining control of Puerto Rico. The island became a U.S. territory and was granted self-government in 1952. Coco, Puerto Rico is now a self-governing commonwealth of the United States.
Geography
Coco, Puerto Rico is located in the Caribbean Sea, just off the coast of the Dominican Republic. The island is approximately 100 miles long and 35 miles wide, making it the smallest of the Greater Antilles. It is surrounded by the Atlantic Ocean to the north, the Caribbean Sea to the south, and the Mona Passage to the east.
The island is divided into 78 municipalities, with Coco being one of them. Coco is located in the northern part of the island and is home to a population of approximately 10,000 people. The municipality is known for its beautiful beaches, lush tropical forests, and vibrant culture.
Economy
The economy of Coco, Puerto Rico is largely based on tourism and agriculture. The island is home to a number of resorts and hotels, which attract tourists from all over the world. Agriculture is also an important part of the economy, with the main crops being sugarcane, coffee, and tobacco.
In addition to tourism and agriculture, Coco is also home to a number of manufacturing and industrial companies. These companies produce a variety of products, including electronics, pharmaceuticals, and medical supplies.
Demographics
As of 2020, the population of Coco, Puerto Rico was estimated to be 10,000. The majority of the population is of Hispanic or Latino descent, with the majority being of Puerto Rican descent. The island is also home to a small number of African Americans, Asians, and other ethnicities.
The official language of Coco is Spanish, although English is also widely spoken. The majority of the population is Roman Catholic, although there are also a number of other religious denominations represented on the island.
Conclusion
Coco, Puerto Rico is a small island located in the Caribbean Sea, just off the coast of the Dominican Republic. It is part of the United States Commonwealth of Puerto Rico and is home to a population of approximately 3.2 million people. The island is known for its beautiful beaches, lush tropical forests, and vibrant culture. The economy of Coco is largely based on tourism and agriculture, with the main crops being sugarcane, coffee, and tobacco. The majority of the population is of Hispanic or Latino descent, with the majority being of Puerto Rican descent. The official language of Coco is Spanish, although English is also widely spoken.
Common Questions
What is Per Capita Income in Coco?
Per Capita income in Coco is $9,328.
What is the Median Family Income in Coco?
Median Family Income in Coco is $22,737.
What is the Median Household income in Coco?
Median Household Income in Coco is $14,974.
What is Income or Wage Gap in Coco?
Income or Wage Gap in Coco is 1.8%.
Women in Coco earn 98.2 cents for every dollar earned by a man.
What is Family Income Deficit in Coco?
Family Income Deficit in Coco is $10,786.
Families that are below poverty line in Coco earn $10,786 less on average than the poverty threshold level.
What is Inequality or Gini Index in Coco?
Inequality or Gini Index in Coco is 0.46.
What is the Total Population of Coco?
Total Population of Coco is 5,006.
What is the Total Male Population of Coco?
Total Male Population of Coco is 2,416.
What is the Total Female Population of Coco?
Total Female Population of Coco is 2,590.
What is the Ratio of Males per 100 Females in Coco?
There are 93.28 Males per 100 Females in Coco.
What is the Ratio of Females per 100 Males in Coco?
There are 107.20 Females per 100 Males in Coco.
What is the Median Population Age in Coco?
Median Population Age in Coco is 43.5 Years.
What is the Average Family Size in Coco
Average Family Size in Coco is 3.4 People.
What is the Average Household Size in Coco
Average Household Size in Coco is 2.6 People.
How Large is the Labor Force in Coco?
There are 1,797 People in the Labor Forcein in Coco.
What is the Percentage of People in the Labor Force in Coco?
42.4% of People are in the Labor Force in Coco.
What is the Unemployment Rate in Coco?
Unemployment Rate in Coco is 14.8%.